Embed Size (px)
Citation preview

Working paper No. 22
February 2016
ISSN 2385-2275
Working papers of the
Department of Economics
University of Perugia (IT)
Competitiveness and
performance related pay in
family firms: the case of Italy
Mirella Damiani
Fabrizio Pompei
Andrea Ricci

1
Competitiveness and performance related pay in family firms:
the case of Italy
Mirella Damiani*, Fabrizio Pompei*, Andrea Ricci**
Abstract
Despite the rich literature on top executives’ compensations in family and non-
family firms, differences in the compensation structure of employees in these
enterprises have received much less attention. Furthermore, not enough
attention has been paid to the specific role of the compensation structure of
employees on labour productivity and competitiveness of family business.
We analyze the compensation structure of Italian firms focusing on
performance related pays (PRP) offered to employees to verify if these
contingent rewards play a differential role on wages, labour productivity and
competitiveness (i.e. the ratio of productivity and wages) in family-influenced
firms with respect to their non family counterparts.
The empirical evidence is provided by a national sample of firms of the non-
agricultural private sector of the Italian economy. A fixed effects quantile
regression is used to explore heterogeneous effects of PRP along productivity
and wages distributions. Our results show that PRP has a greater enhancing
role on labour productivity in family businesses, coupled with a more moderate
influence on wages with respect to their non family counterparts. Thus PRP
may be a governance device that helps to gain competitiveness and may
contribute at endurance of family firms.
JEL Classifications: G32, J33, D24.
Keywords: Family firms, performance related pays, labour productivity
*Department of Economics, University of Perugia; ** ISFOL, Rome.

2
1. Introduction
The presence of family-influenced firms is a common trait in many economies and
their role on enterprise performance animates an ongoing debate (Chrisman et al
2010)1.
However, previous studies have mainly focused on their financial performance
whereas limited evidence is available on their competitiveness, that is strictly
conditioned by their compensation strategies and productivity results.
The role of family ownership on employee salaries has been largely neglected and
incentive wage contracts have been examined in the principal-agent perspective only
with respect to executives, with only few exceptions (Carrasco-Hernandez and
Sánchez-Marín, 2007) although employee compensation represents the larger
component of firms’ operational costs (Gomez et al. 2006).
Likewise, the role of family ownership on labour productivity has been limited
researched so far (see, among the few, Barbera and Moores, 2013; Damiani, Pompei
and Ricci, 2016) and even much less is the available literature focusing on both issues.
However, a comprehensive perspective on labour compensation and productivity may
lead to ascertain the impact of family capitalism on its real degree of competitiveness.
Our contribution intends to fill this gap and offers one of the few investigations that
explore the theme of non managerial pay and productivity performances of family
firms. We verify if the adoption of wage incentive strategies, such as performance
related pays (PRP), usually designed to align the interest of principals (owners) with
those of their agents (employees and not only executives), is associated with family
involvement and give rise to different wage increases and productivity gains in family
and non family firms. Furthermore, we also estimate the role of PRP schemes on the
productivity- wage gap. This strategy permits to ascertain if these schemes lead to
employee salaries fully compensated or not by productivity improvements and thus
represent efficacious devices to gain competitiveness in the two different groups of
firms (family and non family firms).
Our analysis is carried out at national scale for the Italian economy. Looking at
evidence for Italy is interesting because in this country family firms represent the
largest share of total firms, accounting for a large proportion of national employment.
1 Chrisman et al (2010) examine 25 articles that have been particularly influential in research on family
businesses, identify common themes among those studies, and indicate directions for future research in
the field.

3
Thus, as world-wide, where more than two out of every three businesses are family
business (Westhead and Howorth, 2006), also in this country family firms are the
prevalent type of organization and its experience may offer useful insights.
From a unique data set covering several firm-level information for two years (2007,
2010), we have access to information of about 4000 Italian firms. The data we use
covers all non-agricultural sectors and enterprises of all sizes, as well as containing a
wealth of information on firm ownership and management, employment composition,
personnel organization, industrial relations and other workplace characteristics. Using
this dataset, we investigate the role that PRP plays on productivity and wage costs, by
performing separate estimates for family and non family firms. The quantile
regressions enable us going beyond a mere conditional mean model and testing the
presence or not of a substantial heterogeneity in the role of PRP. Furthermore, since
part of the differences we found could be due to unobserved factors, we make a further
step (with quantile fixed effects estimates) to disentangle the differences that are
actually attributable to the different role of PRP, from other sources of firm
unobserved heterogeneity. Our analysis and the results we found give a support to the
importance of productivity heterogeneity (Syverson, 2011) but also add other pieces of
evidence on wage heterogeneity.
The paper is organised as follows: section 1 briefly reviews the related literature;
section 2 presents the data used and descriptive statistics; section 3 illustrates the
econometric framework employed and section 4 shows our estimation results;
eventually section 5 concludes.
2. Discussion
The compensation design has been usually analysed in the agency theory perspective
but only with a focus on executive compensation, whereas “little is known about the
determinants of employee compensation contracts from an agency perspective”
(Carrasco-Hernandez and Sánchez-Marín, 2007, p. 215). However, along the entire
hierarchy that characterizes the firm organization, several levels of agency relations
coexist, not only among owners and top executive officers, but also among managers,
supervisor and employees. In this scenario of multiple principal-agent relations, wage
bonuses represent an important strategy in mitigating agency problems. However,
family and non family firms may influence differently agency problems and solutions
for the rest of the entire organization, as shown by Carrasco-Hernandez and Sánchez-

4
Marín (2007). Indeed, family firms are qualitatively different from non-family firms
because do not have agency costs due to separation between ownership and control
(Jensen & Meckling, 1976; Fama & Jensen, 1983). But other sources of agency costs
and other conflicts of interests may plague their organisation, as widely discussed by
Schulze et al. (2001) and Chrisman et al. (2004).
Three main factors might be considered, following Schulze et al. (2001). First, family
firms, often characterised by private ownership, are not exposed to the discipline
imposed by the market for corporate control and, as shown by Jensen (1993), failures in
the market for corporate control allow inside owners to advance their personal interests at the
expense of outside owners. Furthermore, family firms bear the agency threat posed by self-
control that creates "agency problems with oneself” (Jensen 1998, p. 48). Indeed, other
impairments are suffered not only for owners’ selfish and opportunistic behaviour, but
also for inefficiencies and near rational responses to external shocks. Systematic
tendencies to overpay for transactions and acquisitions, inertial behaviour in adapting
to changes in the competitive environment are only few but typical examples of
counterproductive, non rational responses (Jensen, 1994). These failures, in non
family-public corporations are corrected by the threat of outsiders’ takeovers, whereas
family firms, often featuring private ownership, are less exposed to this threat,
rendering valuable and essential the adoption of alternative governance devices.
Second, family firms may incur adverse selection problems due to the inefficiency of
their labour markets. This is because family owners, that usually prefer do not dilute
their enterprise’ s control and decide their firms not be public, do not offer stock
options to prospective and talented applicants. These and related problems are
particularly severe when management positions are chosen according to dynastic
criteria rather than effective merits (Bloom and Van Reenen, 2010; Caselli and
Gennaioli, 2013), with the consequence that family-influenced firms do not use
promotional opportunities as a device to select and retain qualified executives and,
along the ladder of the firm organization, qualified employees.
Finally, a related argument is that “altruism alters the incentive structure of family-
managed firms” (Schulze et al., p. 100). Indeed, family firms manifest an ‘asymmetric
altruism’ problem, as that featuring biased parental perception of a child’s
performance (Schulze et al. 2001), because family members tend to be altruistic
toward each other. In these firms, one observes an excessive generosity in terms of
perquisite consumption to family agents, free riding of family members (Bruce and

5
Waldman, 1990), entrenchment of ineffective family managers (Morck et al., 1988)
and misperceptions of performance of family CEOs that make it more difficult to
punish their mismanagement and are conducive to predatory managers (Morck and
Yeung, 2003). All these traits originate agency problems that are unique to family
firms and call for their solution the use of pay incentives as well as other control
mechanisms (Schulze et al., 2001). Indeed, because altruism makes it “difficult for
family agents to take actions that might harm another family member's welfare”, it
may be convenient to link a part of the family agent's wage to results that can be
objectively assessed, like firm performance (Schulze et al. 2001, p.103). Thus, it is
expected that pay incentives, such as profit sharing and performance related pay (PRP)
schemes are conveniently offered in family firms to mitigate agency threats and might
be a significant component of wage setting for the entire organization. It also entails,
as suggested by Werner et al. (2005, p. 378), that “the role of ownership structure may
be a determinant of the firm’s overall pay–performance relations” because “the impact
of ownership structure on pay–performance relations cascades to lower rungs of the
organizational ladder” (Werner et al., 2005, p. 378).
Other related aspects focussed in our paper concern labour productivity and the
efficiency enhancing role of PRP; such as profit sharing and payment by results, in
family managed firms. As known, the vast related literature on PRP has shown that
these contingent rewards generate beneficial effects in the form of higher effort and
work quality, higher commitment and incentives to firm-specific human capital, better
teamwork, greater workforce cooperation in facing new technology and organizational
changes, lower labour turnover and longer average tenure (see among others the
contributions of Svejnar, 1982; Estrin, Grout and Wadhwani, 1987; Prendergast,
1999). However, PRP are not immune from malfunctioning. For instance, collective
PRP bonuses may induce employees to free-ride on the efforts of others and thus cut
productivity. Peer effects and positive productivity spillovers in the workplace are
relevant because peer pressure discourages free-riding, especially when workers
expect that many future interactions with the same peers will occur (Mas and Moretti,
2009). Also, a plausible solution to the problem of free-riding attitudes is the
promotion of team culture and employee participation in decision-making, a policy
which contributes, like financial participation, to increasing commitment (Kruse et al.
2010). Furthermore, social ties across workers are important, as shown by Bandiera et
al. (2010). This study finds positive spillover effects where social ties exist, as a given

6
worker’s productivity is significantly higher when that person works in an environment of
friendly relationships. Along these lines, it may be argued that in family business, the
climate of industrial relations encouraging cooperative attitudes, self control and
fairness, may mitigate the various drawbacks of incentive schemes.
This perspective is in accordance with the stewardship view that posits that family
businesses are “uniquely nurtured by the stewardship of devoted family owners who pursue
social and self-actualization goals to the benefit of all stakeholders” (Le Breton‐Miller, and
Miller, 2009, p. 1169). A number of factors explain why, as overviewed by Dodd and
Dyck (2015). First, in family firms interpersonal relationships are characterized by
stability and a shared social network (Nahapiet & Ghoshal, 1998). Furthermore, family
businesses feature socio-emotional value and more identity than non kinship firms
(Gómez-Mejía et al., 2007). In addition, owners who have a longer term commitment
to their firm, have a greater concern for their personal reputation that can be supported
by stewardship activities with respect to owners of non kinship firms. Also, family
business more likely feature a “shared identification of their members with core
cultural values” (Dodd and Frank, p. 314). For instance, Blodgett et al. (2011) show
that family business expresses a higher frequency of ethical values than its
nonfamily corporate counterpart, and identifying such values may help family
business to detect what behavior will result in strategic global strategies for
governance and performance (p. 36). In sum, all these characteristics, especially in
workplaces characterised by incomplete contracts, provide important enforcement
mechanisms that allow family firms to mitigate malfunctioning of incentive devices
such as PRP .
Furthermore, innovation propensity may be higher in family managed firms because
the work climate encourages a spontaneous engagement of employees’ innovative
work .For instance, employees, “on their own initiative, generate and suggest
innovative ideas concerning exploitative elements, such as better ways of performing
work tasks, novel approaches to solve problems or bottlenecks, and new ways to
improve quality and reliability…” (Bammens et al. 2015, p. 125). Thus, in these firms
employees “use their intimate knowledge of internal procedures and work methods to
initiate incremental or process-oriented improvements along familiar trajectories”
(Bammens et al. 2015, p.125). Thus family businesses, especially when show a high
level of concern for their employees’ well-being and when offer payments of

7
collective bonuses, might outperform other organizational forms because promote
important internal informal sources of innovation.
It has been posited that a comparative advantage of family firms is associated with
their long term horizons (Habbershon, 1999) and that their lengthy tenure, also to
assuring the transmission of the value of the firm to future generations and family
heirs, may reveal a credible commitment that favour implicit contracts (Anderson and
Reeb 2003). These contracts must be self-enforcing and are typical of family firms
who may win the trust of the employees with the tacit but plausible promise not to
breach labour relationships. These enterprises, even in bad times, may persuade their
employees to accept wage moderation with the insurance of retaining them. By doing
so, as shown by Sraer and Thesmar (2006), Bassanini et al. (2013) and Ellul et al.
(2014), family firms offer a compensation package that involves lower pay and might
make affordable a positive gap between productivity gains and wage increases.
Summing up, this short discussion suggests the plausibility of three main hypotheses.
First, family firms may experience specific agency costs that may lead to the adoption
of performance payments. These incentives are not only fixed at the top of firm
hierarchies, but also diffused (through a cascade effect) as one moves toward the lower
levels of the entire organization, with the consequence that PRP may play some role in
explaining wage determination also in family firms. Second, the involvement of
families in implementing incentive designs represents a strategic commitment to
employees that assures larger productivity gains. It means that the adoption of PRP (to
both family and nonfamily agents) mitigates agency threats to firm performance and
may represent a channel through which family firms decrease the efficiency gap with
respect to their non-family competitors. Thirdly, the long term relationships featuring
family firms enable them to offer compensation packages more favourable to their
competitiveness: implicit contracts of stable labour relations may conducive to a
potential positive gap (between productive gains and wage increases) activated by the
adoption of PRP. These three hypotheses will be tested below.
3. Data and Descriptive Statistics
3.1 Data
The Employer and Employee Surveys (RIL) conducted by ISFOL provide a unique set
of variables for estimating the role of PRP and testing their potential different effects

8
between family and non-family firms. The data we use are obtained by merging
information from this source and balance-sheet data from the Bureau Van Dijk AIDA
archive for Italian firm.
The RIL surveys offer information for a nationally representative sample of non-
agricultural private sector of partnerships and limited liability firms for 2007 and
2010. The surveys collect a rich set of information about personnel organization,
employment composition, industrial relations and other workplace characteristics2. For
2010, the survey also includes information on ownerships/control and management
structure of firms3. This information permit to distinguish two group of enterprises i)
family firms (FF), those owned and managed by a family and ii) non-family firms
(NFF), all firms not owned by a family.4 Thus, we created a dummy variable that
equals one if a firm is owned and managed by a family (Family firms, FF) and 0
otherwise (Non-family firms, NFF).
With respect to our key explanatory variable, in the RIL questionnaire, each firm was
asked whether a performance related pay scheme agreement (PRP) has been adopted.
Thus, we created a dummy variable that indicates the existence or not of a PRP
scheme for each year under study. Notice that in the Italian two-tiered bargaining
regime, under positive demand shocks firms may distribute PRP wage premiums
linked to firm results, at the second level of bargaining. This wage component is added
to the base wage, set in the first (industrial) level, and could be zero when firms do not
gain positive results. Thus, also risk-averse employees may accept these agreements,
because employees do not take any extra-risks. Firms, on their part, would be more
willing to adopt PRP schemes as a strategy to obtain higher employee performance
and successful outcomes, also to compensate employment flexibility.
2 The RIL Survey sample of firms is stratified by size, sector, geographic area and legal form.
Inclusion depends on firm size, measured by the total number of employees. This choice has
required the construction of a ‘direct estimator’ to take into account differing probabilities of
inclusion of firms belonging to specific strata. In particular, the direct estimator is defined for
each sample unit (firm) as the inverse of the probability of inclusion in the sample. Using this
estimator, the RIL sample reproduces all active firms for each stratum and, simultaneously,
the total number of employees in a given stratum (size, sector and other characteristics). 3 We assumed that the same information holds for 2007. Therefore, both the FF and FM
variables are time-invariant. 4 From the ISFOL-RIL questionnaire, it is possible to distinguish three groups of firms: i)
firms owned and managed by a family member; ii) firms owned by a family but not managed
by a family member (hired professional management); iii) all other firms (firms not owned by
a family). In our sample, only a small number of firms belong to the second group, and to
save space we do not present the estimates for this subsample. These estimates are available
on request.

9
In addition, we have information on the occupational composition of the labour force
within the firm (executives, blue-collar workers and white-collar workers, percentage
of trained workers), gender, type of contract (long-term/short-term), new hirings and
other firm strategies (innovation and export). We also control for the sectors and
regions (NUTS 1) in which firms are located.
The longitudinal RIL-AIDA merged sample was restricted to those companies that
disclose detailed accounts in accordance with the scheme of the 4th
Directive CEE. We
also excluded firms with less than five employees. It allows us to eliminate self-
employees as well as all small firms without an organizational structure that makes
sense to test the role of PRP to reduce agency problems. These selection criterion is
consistent with those adopted in comparable studies (as Chrisman et al. 2004).
Furthermore, we excluded firms with missing data for the key variables. Therefore, the
sample that we use is an unbalanced panel of approximately 4200 firms for 2007 and
2010.
Detailed definitions of variables are reported in Table A1.
3.2 Descriptive statistics
Table 1 allows a comparison between family and non family firms (FF and NFF,
respectively), while Table 2 enables us to visualise, within each group, the main
disparities among enterprises who adopt or not PRP.
Over the period 2007-2010, a meaningful divide has been found between FF and NFF.
Concerning our key variable, PRP, we observe that a smaller fraction of FF adopt
payments by results (9%) with respect to NFF (27%). Also, FF were less successful in
terms of per capita value added (10.75 vs 11.02), paid lower wages (10.39 vs 10.60)
and their competitiveness indicator (Ln(LP)-Ln(W)) resulted more unfavourable to
these firms (0.36 vs 0.41)5. In addition, the Table 1 shows that FF employed less
executives (3% vs 9% of total employees) and white collars (36% vs 48%), made less
use of training (22% of trained workers vs 31%), were less active than non family
enterprises in process innovation (51% of firms vs 54%) as well as in product
innovation (42% vs 44%).
5 All these variables are in natural logarithms.

10
However our major interest is enlightening the different disparities among firms that
adopt or not contingent rewards and verify how these disparities diverge according to
their different ownership structure. On these aspects, summary statistics reveal
expected but also unexpected results.
As found for other countries, the incidence of PRP was greatest among large-sized
firms, confirming that incentive schemes are mainly adopted to mitigate agency costs
which mostly affect large enterprises. Indeed, the share of large FF (with more than
250 employees) was higher in the group of PRP firms (9%), whereas the share of large
firms without PRP was only around 1%. A parallel significant differential was found
for NF (the share of large firms with PRP was 23% and those without PRP was 3%).
Other expected results concern capital intensity. PRP family and non family firms had
on average a higher value of the physical capital per employee with respect to the
group of No-PRP firms: the differential (in log, 0.41) was exactly the same for FF and
NF firms). Other summary statistics, which distinguish firms with and without PRP
show that the former were more present in international markets and, as regards their
workforce, had a higher proportions of men and trained employees and a lower
percentage of fixed-term contracts. These different traits are confirmed for FF and
NFF.
Interestingly, also less expected results are obtained. Family firms that adopt PRP
reveal a larger advantage, in terms of labour productivity, with respect to their
competitors that do not adopt PRP (the differential in log was + 0.20); this advantage
is also present for the group of NF but has a minor magnitude (+0.03).
Data on wages also confirm major involvement of family firms in exploiting
opportunities that emerge when they offer higher premiums to their workers. The
differential of wages of PRP firms with respect to No-PRP firms was 0.22 for family
firms and only 0.08 for non family firms.
A related result is that the differential of log values of labour productivity and wages
(Ln(LP)-Ln(W)), achieved by firms that adopt PRP, is almost the same within the
group of family firms (0.35 vs 0.36), whereas it is slightly lower in NFF adopting PRP
with respect to NFF not adopting this contingent pay (0.39 vs 0.43).
Going beyond these descriptive statistics, what it is left to be discovered is the
combined role of governance structure (ownership and management) and of
governance devices (PRP and non PRP) to obtain a comprehensive representation of
efficiency and competitiveness of Italian firms. In the next sections we will verify

11
whether family firms are more able to exploit beneficial effects of payments by results,
offered to all employees, thus mitigating the specific agency problems featuring their
entire organization.
4. Econometric strategy
4. 1 Methods
The relationship between labour productivity and PRP may be formalized by a
production function augmented by a dummy variable capturing the incidence of PRP
and inserting a set of other controls for firm characteristics and workforce
composition. The following equation was estimated:
(1)
where
is the (log of) valued added per employee, is the (log of)
physical capital per employee, PRP represents a dummy variable indicating the
presence of PRP. The vector Fit denotes controls for workforce composition (shares of
executives, white collars, blue collars, temporary contracts, women, trained workers
and new hirings) and for firm characteristics, such as process and product innovations,
and export propensity (for more details see table A.1 in the appendix). The parameter
s denotes sector specific fixed effects, j regional (NUTS1_level) fixed effects for
macro-areas, represents year fixed effects and is the error term capturing the
idiosyncratic component of labour productivity.
The wage equation parallels the productivity equation (1). Thus, we estimate the
following equation:
(2)
where the dependent variable represents the (log of) the average annual wages (W) per
employee (L), while the explanatory variables are the same included in equation (1).
We also apply a similar approach to estimate a model in which the gap between labour
productivity and wages is regressed on the same set of explanatory variables of
equations (1) and (2). This permits to obtain a coefficient for PRP that directly
itL
K
ln
t
it
12
measures the size and significance of the productivity wage gap (P/W). We estimate
thus equation (3):
(3)
We started with a pooled cross section analysis of equations (1), (2) and (3),
controlling for time fixed effects. We also use the quantile regression (QR) technique
that allows us to estimate differing effects on different parts of the productivity and
wage distributions. For example, workforce composition and firm characteristics being
equal, if the impact of PRP on productivity differs along quantiles, it means that those
management practices represented by incentive payments could be particularly good
(or bad) for firms at the bottom of the productivity distribution (first decile), whit
respect to the other bad performers (located at the first decile) that did not implement
the PRP.
We used the classical Koenker and Basset (1978) estimator:
(4)
(5)
(6)
where , and are the coefficients of interest, , are vectors of coefficients
for all control variables that now are included in the vector , is the quantile 0.1;
0.25, 0.5; 0.75; 0.9, is the asymmetric loss function
.
However all these estimates may be biased because they do not take into account the
problems of sorting of firms that will typically arise if more productive firms (and
firms that are more generous in terms of pays) more likely adopt PRP agreements.
Indeed, part of the differences imputed to PRP could be due to unobserved factors. To
circumvent this problem and having time variation in our data, we adopt the quantile
fixed effect estimator that permits to disentangle, for both the subsamples of family
and non family firms, the differences that are actually attributable to the different role
of PRP, from other sources of unobserved heterogeneity at firm level. Therefore, we

13
perform quantile fixed effects estimates, where the unobserved individual
heterogeneity is proxied by individual fixed effects that capture time-invariant firm
characteristics and apply the technique elaborated by Canay (2011).
5. Results
5.1 OLS and QR estimates
We briefly present the pooled estimates (OLS and QR, see Tables 3-5), before
focusing on the main results obtained with the fixed effect quantile estimation that
corrects for unobserved heterogeneity. Pooled estimates are obtained by including
time, sector and regional (NUTS) dummies to control for time-, sector- and
geographical factors which likely influence the dependent variables and cannot be
captured by other controls included in our analysis.
[Insert Table 3-5]
The OLS estimates for the whole sample show the significant positive association of
PRP with labour productivity and wages (Table 3, last column of Panel A and Panel B,
respectively). Notice that these results are mainly driven by the family firm sub-
sample (Table 4, last column of Panel A and B), and only the coefficient associated
with PRP in the productivity-wage gap OLS is not significant for this subsample. On
the contrary, for the group of non-family enterprises, the OLS coefficients of PRP for
all three dependent variables are not significant (Panels A-C of Table 5, last column).
This means that only in family firms adopting PRP fosters, on average, both labour
productivity and wages. As said above, we have not looked exclusively at a
conditional mean model, but explore patterns of heterogeneity in productivity and
wage distribution. The standard QR estimates, shown in the first five columns of
Tables 3-5, enable us to verify differences in the impact of PRP along the dependent
variables’ distributions. Our findings confirm for the whole sample and for family
firms that the coefficient associated to our key explanatory variable PRP is positive
and significant (at the 1% level of significance) in labour productivity and wages
estimates at all quantiles (the only exception being the non significant coefficient in
labour productivity estimates for the top decile, =0.90). These positive coefficients
are larger for low deciles ( =0.10 and =0.25, Tables 3-4, panels A and B) and
indicate, at least at this preliminary stage, that PRP especially favours firms located at

14
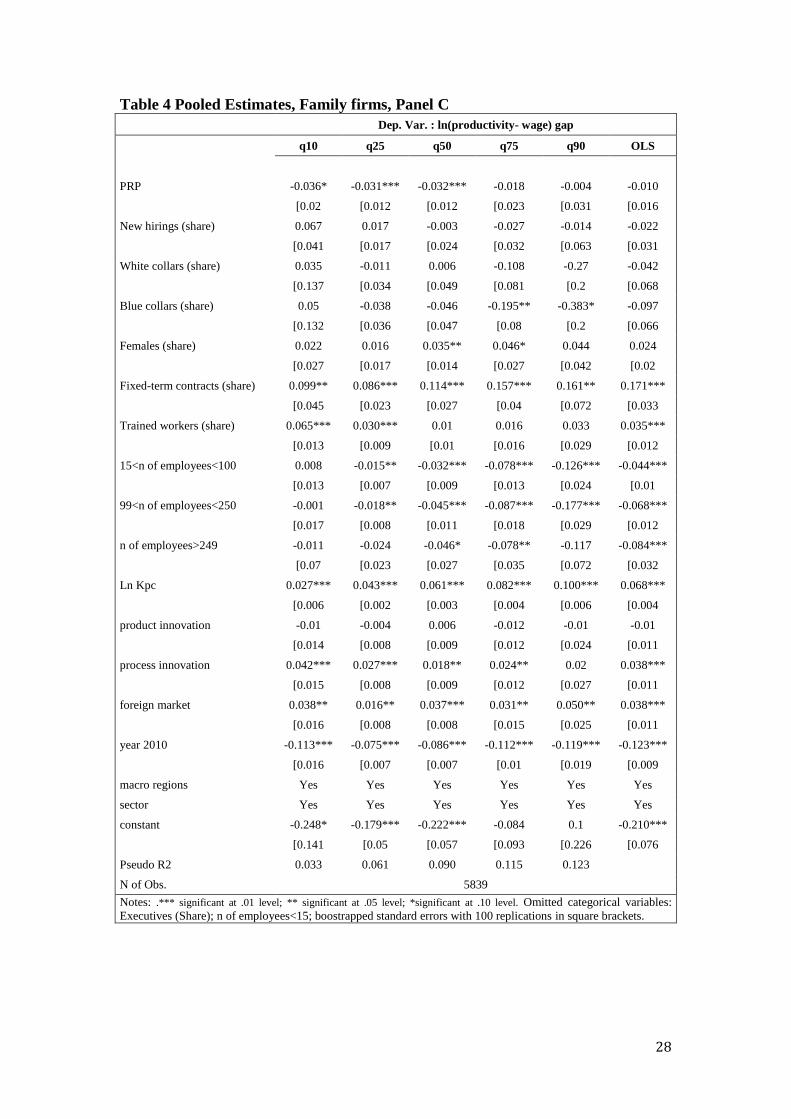
the bottom of the productivity and wage distributions. In addition, the productivity-
wage gap (Tables 3 and 4, Panels C) is significantly and negatively associated with
PRP at the median values ( , and for low deciles ( =0.10 and =0.25),
suggesting that PRP boosts wages more than productivity. Notice, however, that these
results do not take into account unobserved factors that could bias the impact of PRP.
Especially for wages, it is likely that different degrees of abilities and informal skills
of workers, for which we do not control, could be responsible for endogeneity
problems and overestimation of the PRP coefficient.
For non-family firms we obtain different results. Firstly, the non significant estimates
of PRP on labour productivity suggest that these wage schemes do not present any
association with efficiency enhancement (Table 5, Panel A). Instead, it seems that for
these firms PRP schemes represent only an occasion to offer wage premiums, given
that the associated coefficients are significant and positive, with the only exception for
the = 0.25 decile (see Table 5, Panel B). Again, for the dependent variable (Ln(LP)-
Ln(W)), we obtain negative and significant effects of PRP (Table 5, Panel C) only for
two deciles out of five (Table 4, Panel C). Therefore, also the results for non-family
firms confirm that the link of PRP with wages dominates the one with productivity
(that in non-family firms, differently from the family firms, resulted completely non
significant).
To sum up, these preliminary estimates suggest that the main difference between
family and non-family firms concerns the positive and significant association of PRP
with labour productivity found in the former group. Despite that, it is remarkable for
both groups the dominant link of PRP with wages, that appears to be detrimental for
the firms’ competitiveness (negative link of PRP with the productivity-wage gap).
However, the possible unobserved heterogeneity of Italian enterprises deserves further
attention, as we will see below.
5.2 Unobserved Heterogeneity: the Quantile Fixed Effects Estimates
Some of the differences or similarities we found with previous estimates could be due
to unobserved factors, i.e. to different characteristics across firms but not strictly
attributable to their adoption of PRP. As discussed above, we attempted to taking into
account this issue with fixed effect estimates for both conditional mean and

15
conditional quantile methods. The results obtained by using these different estimators
are shown in Tables 6-8. More precisely, as for quantile fixed effect (FE) regression
methods (Canay, 2011), the estimates for the whole RIL-AIDA sample are reported in
Table 6, those relative to the subsample of family firms are displayed in Table 7 while
the FE quantile regression results for non-family firms are in Table 8. The last
columns in Tables 6-8 report the standard fixed-effects (within) estimator used in the
conditional mean methods.
[Insert Table 6-8]
On the whole, previous results concerning labour productivity and wages, separately
taken, continue to hold, even though the fixed-effect estimators do their work in
correcting the upward bias of the PRP coefficients. Overall, the latter appear slightly
downsized in Tables 6 and 7 (Panels A and B), but still positive and significant.
For family firms the significance of the coefficient of PRP in labour productivity
estimates is confirmed for all quantiles and only for the first quantile the coefficient is
noticeably reduced (Table, 7, Panel A). The adoption of PRP is on average associated
with a 5.1% rise in value added per employees (see the q50 and FE columns), and with
a lower value of 3.3% for low performer family firms.
As for wages (Table, 7, Panel B), instead, the fixed effect coefficients of PRP are
remarkably reduced compared to the previous pooled estimates and, in some cases
(=0.75 and =0.90) the coefficients we obtain are even no longer statistically
different from zero. This evidence suggests that the association of PRP with wages for
the highest quantiles was driven by unobserved characteristics of family firms, since
in the pooled analysis the impact was significant along the entire wage distribution.
Noticeably, when we pass to the third dependent variable (i.e. the difference between
labour productivity and wages), we obtain that for family firms PRP is now associated
with a competitiveness enhancing role, quite uniform along the distribution (Table, 7
Panel C) 6
, whereas in the pooled estimates we found a detrimental effect (Table, 4,
Panel C). As conjectured in the previous section, the upward bias of the PRP
coefficients in the wage regression resulted far higher than that on labour productivity,
6 A Wald test on the equality of these coefficients cannot be rejected for most of the quantiles. The only
exception is the PRP coefficient on the 25th
quantile, that resulted significantly lower than the
remainders. All Wald tests on coefficients are available upon request s.

16
to such an extent that the fixed-effect correction led the productivity effect to be
dominant and the competitiveness enhancement to emerge. Thus, with the quantile
fixed-effects, on average (and in the middle of the distribution) PRP schemes are
associated with increases in firm competitiveness of family firms by 4.1% , with minor
variations along the firm distribution.
If we compare all these results with estimates for non family firms we have a totally
different scenario and an additional confirmation that ownership structure matters. We
obtain, again, that the role of PRP on labour productivity is broadly non significant
(with the only exception of the median value that even shows a negative and
significant sign), whereas the PRP coefficients for wages remain positive and
significant at all quantiles. Finally, for the role of PRP on competitiveness ((Ln(LP)-
Ln(W)), we obtain a negative significant role at all quantiles. From these estimates, we
infer that in non-family firms PRP fosters employees’ rewards, but not productivity
increases. Therefore, the efficiency enhancement role of PRP is absent in these firms
and dominant only for family firms, for which it is rather uniform at all quantiles.
Conclusions
In this article we have provided evidence that family firms may take advantage from
adoption of incentive schemes, such as PRP, and use these contingent rewards to
encourage commitment and motivation from their employees. Furthermore, the
efficiency enhancing role of PRP, coupled with a moderate influence of these schemes
on wage premiums, enable them to regain competitiveness. These results obtained for
the Italian case, in conformity with other international evidence (Ellul et al 2014),
seem coherent with the hypothesis of implicit contracts featuring family firms. These
enterprises, also for their long-term horizons, may provide more employment
protection than non family firms. This protection is compensated by a more moderate
wage policy.
All results are obtained taking into account an ample set of covariates, related to firm
strategies and workforce composition, and are confirmed controlling for the firm-level
fixed effects. Our evidence thus signals that incentive schemes could be a strategic
tool to face the specific agency costs that affect family firms and suggest that these
schemes enable family firms to reduce the competitiveness gap with their (non-family)
competitors.

17
On the contrary, widely held firms and firms run by professional management seem to
offer wage incentives that ‘do not have incentive effects’. For these firms, wage
premiums more than compensate the (non significant) benefits in terms of labour
productivity, with a final negative balance on their degree of competitiveness. These
results are in line with other evidence showing that professional managers prefer to
pay workers higher wages, but these pays do not translate into greater labour
efficiency. This is because generous wage payments may allow management not born
the costs associated to monitoring activities or to the enforcement of collaborative
relations with their workforce. Wage premiums may be simply offered by
management because permit them ‘enjoying the quiet life’ (Bertrand and
Mullainathan, 2003).
Our study offers a contribution to find closer links between labour economics and
corporate governance literature, along the lines of a few number of studies (Werner et
al. 2005, Carrasco et al. 2007). With respect to these previous studies that mainly
observe how the pay strategies change according to the agency relationship between
owners and managers, we make a further step by investigating how the impacts of
these strategies vary according to the firm ownership structure, but on these issues
future research remains to be done.
References
Anderson, R.C. and D.M. Reeb (2003). ‘Founding-family ownership and firm
performance: evidence from the S&P500’, Journal of Finance , Vol. 58(3), 1301–
1328.
Bammens, Y.Notelaers, G. and Van Gils, A. (2015), ‘Employment for Employees’
Innovative Work Involvement’, Family Business Review, Vol. 28(2) 123–144.
Bandiera, O., Barankay, I. and Rasul, I. (2010), " Social incentives in the workplace. ., The
Review of Economic Studies, Vol. 77 No. 2, pp. 417-458.
Barbera, F., and K. Moores (2013). ‘Firm Ownership and Productivity: A Study of
Family and Non Family SMEs,’ Small Business Economics, 40(4), 953–976.
Bassanini, A.et al. "Working in family firms: Paid less but more secure? Evidence
from French matched employer-employee data." Industrial & Labor Relations
Review 66.2 (2013): 433-466.

18
Bertrand, Marianne, and Sendhil Mullainathan. "Enjoying the quiet life? Corporate
governance and managerial preferences." Journal of political Economy 111.5 (2003):
1043-1075.
Blodgett, M., Dumas, C., & Zanzi, A. (2011). Emerging trends in global ethics: A
comparative study of U.S. and international family business values. Journal of
Business Ethics, 99, 29-38.
Bloom, N. and Van Reenen, J. (2010), “Why do firms Do Management Practices
Differ across Firms and Countries?”, Journal of Economic Perspectives, 24, 1, 203–
224.
Bloom, N., Sadun R. and J. Van Reenen (2010), Recent advances in the empirics of
organizational economics”, Annual Review of Economics, 2, 105-137.
Bruce, N. and Waldman, M. (1991) "Transfers in Kind: Why They Can Be Efficient
and Non paternalistic," American Economic Review, vol. 81(5), pages 1345-51.
Caselli, F. and N. Gennaioli (2013). ‘Dynastic Management,’ Economic Inquiry,
51(1), 971–996
Carrasco-Hernandez and Sánchez-Marín, (2007), "The determinants of employee
compensation in family firms: empirical evidence." Family business review 20.3
(2007): 215-228.
Canay, I. (2011), “A Simple Approach to Quantile Regression for Panel Data”, The
Econometrics Journal, 14 (3): 368-386.
Chrisman, J.J. et al. (2010). ‘Intellectual Foundations of Current Research in Family
Business: An Identification and Review of 25 Influential Articles, Family Business
Review, 23(1) 9–26.
Damiani, M, Pompei, F, Ricci, A. (2016), “Performance Related Pay, productivity and
wages in Italy: a quantile regression approach”, International Journal of Manpower,
Special issue on “(Mis)Alignment of productivity and wages: Firm-level evidence”
(eds. J. Konings, F. Rycx and V. Vandenberghe), Vol.37, n.3, forthcoming
Dodd, S. D, and Dyck, B.. (2015), "Agency, Stewardship, and the Universal-Family
Firm A Qualitative Historical Analysis," Family Business Review , vol. 28, n..4, 312-
331.
Ellul, Andrew, Marco Pagano, and Fabiano Schivardi (2014). "Employment and wage
insurance within firms: Worldwide evidence." Kelley School of Business Research
Paper 2014-23.
Estrin, S., Grout, P. and Wadhwani, S. (1987), ‘Profit-sharing and employee share
ownership’, Economic Policy, A European Forum, Vol. 2, NO. 1, pp.13-62.
19
Fama E.F., Jensen M.C. (1983), “Agency Problems and Residual Claims”, Journal of
Law and Economics, vol. 26, n. 2, pp. 327-349.
Gómez-Mejía et al., (2007),. "Socioemotional wealth and business risks in family-
controlled firms: Evidence from Spanish olive oil mills." Administrative science
quarterly 52.1 (2007): 106-137.,
Jensen, M. C. (1993); “The modem industrial revolution, exit, and the failure of
internal control systems”, The Journal of Finance 48(3) 831-880.
Jensen, M. C.. (1994). Self-interest, altruism, incentives, and agency. J. Appl.
Corporate Finance. 7(2).
Jensen, M. C.. (1998). Self-interest, altruism, incentives, and agency. Foundations of
Organizational Strategy. Harvard University Press, Cambridge,MA
Le Breton Miller, L. and Miller, D. (2009), ‘Agency vs. stewardship in public family
firms: A social embeddedness reconciliation.’ Entrepreneurship Theory and Practice,
33(6), 1169-1191.
Morck, R. , Shleifer, A. and Vishny, R.W (1988), “Management Ownership And
Market Valuation”, Journal Of Financial Economics , 20 293-315.
Morck, R. and Yeung B. (2003), “Agency Problems in Large Family Business
Groups, Entrepreneurship Theory and Practice, Vol.27, n 4, 367–382.
Nahapiet, Janine, and Sumantra Ghoshal. "Social capital, intellectual capital, and the
organizational advantage." Academy of management review 23.2 (1998): 242-266.
Pagano, Patrizio, and Fabiano Schivardi (2003), "Firm Size Distribution and
Growth*."The Scandinavian Journal of Economics 105.2 (2003): 255-274.
Prendergast, C. (1999), “The Provision of Incentives in Firms”, Journal of Economic
Literature, Vol. 37 No 3, pp. 7-63.
Schulze, W. S., Lubatkin, M.H., Dino, R. N. and Buchholtz, A. K. (2001), “Agency
Relationships in Family Firms: Theory and Evidence”, Organization Science, vol. 12,
No. 2, 99-116.
Sraer, David, and David Thesmar (2007), "Performance and behavior of family firms:
Evidence from the French stock market." Journal of the european economic
Association 5.4 (2007): 709-751.
Syverson, Chad. 2011. "What Determines Productivity?" Journal of Economic
Literature, 49(2): 326-65.
Svejnar, J. (1982), “On the theory of a participatory firm”, Journal of Economic
Theory, Vol. 27, n. 2, pp. 313-330.

20
Werner,1 S, . Henry L. Tosi, H. L. And Luis Gomez-Mejia, L. (2005),
“Organizational Governance and Employee Pay: How Ownership Structure Affects
The Firm’s Compensation Strategy”, Strategic Management Journal, vol. 26: 377–
384 (2005).
Westhead, P., & Howorth, C. (2006). “Ownership and management issues associated
with family firm performance and company objectives”, Family Business Review,
19(4), 301-316.

21
Table 1 Descriptive Statistics: Family and Non-Family Firms
FAMILY FIRMS NON-FAMILY FIRMS
Variables N mean sd N mean sd
Ln(LP) 6302 10.75 0.51 1599 11.02 0.61
Ln(W) 6337 10.39 0.37 1612 10.60 0.38
Ln(LP)-Ln(W) 6302 0.36 0.35 1599 0.41 0.46
PRP 6766 0.09 0.28 1868 0.27 0.44
New hirings (share) 6591 0.11 0.16 1839 0.11 0.14
Executives (share) 6864 0.03 0.080 1896 0.09 0.133
White collars (share) 6864 0.36 0.29 1896 0.48 0.30
Blue collars (share) 6864 0.61 0.31 1896 0.43 0.35
Females (share) 6874 0.34 0.28 1901 0.37 0.26
Fixed-term contracts (share) 6874 0.09 0.15 1901 0.08 0.13
Trained workers (share) 6796 0.22 0.35 1851 0.31 0.37
5<n of employees<16 6864 0.46 0.50 1896 0.25 0.43
15<n of employees<100 6864 0.37 0.48 1896 0.37 0.48
99<n of employees<250 6864 0.16 0.37 1896 0.30 0.46
n of employees>249 6864 0.02 0.13 1896 0.09 0.28
Ln Kpc 6328 10.00 1.57 1604 10.10 1.83
product innovation 6802 0.51 0.50 1872 0.54 0.50
process innovation 6789 0.42 0.49 1870 0.44 0.50
foreign market 6870 0.27 0.45 1901 0.26 0.44
year 2010 6874 0.49 0.50 1901 0.48 0.50
Textile, Wearing Apparel, Food Industry 6874 0.15 0.35 1901 0.10 0.30
Other Manufacturing, Mining, Utilities 6874 0.34 0.47 1901 0.31 0.46
Constructions 6874 0.13 0.33 1901 0.05 0.21
Trade, hotels, restaurants 6874 0.14 0.34 1901 0.12 0.33
Transportation and communications 6874 0.04 0.20 1901 0.11 0.31
Intermediation and other business service 6874 0.09 0.29 1901 0.17 0.38
Education, health and private social services 6874 0.11 0.32 1901 0.14 0.35
North- West 6874 0.32 0.47 1901 0.38 0.49
North-East 6874 0.26 0.44 1901 0.29 0.45
Centre 6874 0.21 0.40 1901 0.20 0.40
South 6874 0.21 0.40 1901 0.13 0.34
Source: RIL-AIDA data. Note: All statistics refer to the pooled sample (2007 and 2010).

22
Table 2 Descriptive Statistics: Family and Non-Family Firms and PRP
FAMILY FIRMS NON - FAMILY FIRMS
N mean sd N mean sd
PRP 6766 0.09 0.28 1868 0.27 0.44
PRP No-PRP PRP No-PRP
N mean sd N mean sd N mean sd N mean sd
Ln(LP) 536 10.93 0.48 5669 10.73 0.51 390 11.04 0.49 1182 11.01 0.65
Ln(W) 541 10.59 0.33 5699 10.37 0.37 391 10.66 0.27 1193 10.58 0.41
Ln(LP)-Ln(W) 536 0.35 0.33 5669 0.36 0.35 390 0.39 0.36 1182 0.43 0.49
New hirings (share) 557 0.08 0.12 5945 0.12 0.16 494 0.10 0.13 1318 0.11 0.15
Executives (share) 586 0.05 0.08 6172 0.04 0.08 506 0.10 0.12 1360 0.08 0.14
White collars (share) 586 0.30 0.22 6172 0.36 0.30 506 0.42 0.27 1360 0.50 0.31
Blue collars (share) 586 0.65 0.25 6172 0.60 0.31 506 0.48 0.34 1360 0.42 0.35
Females (share) 586 0.28 0.22 6180 0.34 0.28 506 0.32 0.22 1362 0.38 0.27
Fixed-term contracts (share) 586 0.07 0.12 6180 0.09 0.15 506 0.07 0.10 1362 0.08 0.14
Trained workers (share) 579 0.29 0.35 6110 0.22 0.35 488 0.41 0.37 1330 0.28 0.36
5<n of employees<16 586 0.11 0.32 6172 0.49 0.50 506 0.05 0.22 1360 0.32 0.47
15<n of employees<100 586 0.38 0.49 6172 0.37 0.48 506 0.23 0.42 1360 0.41 0.49
99<n of employees<250 586 0.42 0.49 6172 0.14 0.34 506 0.49 0.50 1360 0.23 0.42
n of employees>249 586 0.09 0.28 6172 0.01 0.10 506 0.23 0.42 1360 0.03 0.18
Ln Kpc 540 10.38 1.39 5691 9.97 1.58 389 10.41 1.56 1187 10.00 1.90
product innovation 579 0.61 0.49 6132 0.50 0.50 501 0.66 0.48 1344 0.50 0.50
process innovation 578 0.58 0.49 6121 0.41 0.49 498 0.58 0.49 1343 0.39 0.49
foreign market 585 0.47 0.50 6177 0.26 0.44 506 0.36 0.48 1362 0.22 0.42
year 2010 586 0.54 0.50 6180 0.49 0.50 506 0.51 0.50 1362 0.48 0.50
Textile, Wearing Apparel,
Food Industry 586 0.19 0.39 6180 0.14 0.35 506 0.16 0.37 1362 0.08 0.27
Other Manufacturing, Mining,
Utilities 586 0.49 0.50 6180 0.33 0.47 506 0.38 0.49 1362 0.28 0.45
Constructions 586 0.07 0.26 6180 0.13 0.34 506 0.02 0.13 1362 0.06 0.24
Trade, hotels, restaurants 586 0.09 0.28 6180 0.14 0.35 506 0.08 0.27 1362 0.14 0.35
Transportation and
communication 586 0.05 0.22 6180 0.04 0.20 506 0.14 0.34 1362 0.10 0.30
Intermediation and other
business service 586 0.06 0.24 6180 0.10 0.30 506 0.15 0.36 1362 0.18 0.38
Education, health and private
social services 586 0.05 0.23 6180 0.12 0.32 506 0.08 0.26 1362 0.16 0.37
North- West 586 0.39 0.49 6180 0.32 0.47 506 0.39 0.49 1362 0.37 0.48
North-East 586 0.36 0.48 6180 0.26 0.44 506 0.34 0.47 1362 0.27 0.44
Centre 586 0.16 0.37 6180 0.21 0.41 506 0.17 0.37 1362 0.21 0.41
South 586 0.09 0.28 6180 0.22 0.41 506 0.10 0.30 1362 0.14 0.35
Source: RIL-AIDA data. Note: All statistics refer to the pooled sample (2007 and 2010).

23
Table 3: Pooled quantile estimates, whole sample, Panel A
Dep. Var. : Labour productivity
q10 q25 q50 q75 q90 OLS
PRP 0.054*** 0.064*** 0.047*** 0.050*** 0.047 0.066***
[0.02] [0.018] [0.017] [0.019] [0.032] [0.017]
New hirings (share) -0.051 -0.004 0.085** 0.100*** 0.001 0.021
[0.077] [0.045] [0.04] [0.038] [0.067] [0.041]
White collars (share) 0.067 -0.203 -0.757*** -1.076*** -1.303*** -0.644***
[0.112] [0.126] [0.105] [0.105] [0.189] [0.105]
Blue collars (share) -0.305*** -0.609*** -1.232*** -1.612*** -1.995*** -1.138***
[0.11] [0.122] [0.096] [0.101] [0.176] [0.101]
Females (share) -0.470*** -0.451*** -0.421*** -0.378*** -0.385*** -0.412***
[0.037] [0.023] [0.026] [0.031] [0.042] [0.026]
Fixed-term contracts (share) -0.332*** -0.334*** -0.359*** -0.310*** -0.107 -0.293***
[0.075] [0.049] [0.046] [0.056] [0.097] [0.053]
Trained workers (share) 0.101*** 0.091*** 0.087*** 0.062*** 0.066** 0.073***
[0.022] [0.017] [0.016] [0.019] [0.032] [0.016]
15<n of employees<100 0.090*** 0.052*** 0.022** -0.003 -0.055*** 0.02
[0.019] [0.014] [0.011] [0.014] [0.02] [0.013]
99<n of employees<250 0.162*** 0.112*** 0.081*** 0.034* -0.053* 0.069***
[0.026] [0.018] [0.016] [0.019] [0.029] [0.015]
n of employees>249 0.003 0.062** 0.017 -0.023 -0.068 -0.048
[0.076] [0.026] [0.036] [0.037] [0.056] [0.043]
Ln Kpc 0.080*** 0.096*** 0.104*** 0.119*** 0.139*** 0.115***
[0.006] [0.005] [0.004] [0.005] [0.007] [0.004]
produc innovation 0.036* -0.004 -0.008 -0.012 -0.043* -0.017
[0.019] [0.013] [0.01] [0.015] [0.024] [0.013]
process innovation 0.036* 0.014 0.000 -0.007 -0.009 0.013
[0.019] [0.014] [0.01] [0.017] [0.024] [0.013]
foreign market 0.065*** 0.073*** 0.040*** 0.057*** 0.072*** 0.055***
[0.018] [0.015] [0.013] [0.013] [0.028] [0.013]
year 2010 -0.097*** -0.063*** -0.060*** -0.066*** -0.086*** -0.092***
[0.014] [0.012] [0.011] [0.012] [0.022] [0.011]
macro regions Yes Yes Yes Yes Yes Yes
sector Yes Yes Yes Yes Yes Yes
constant 9.570*** 10.012*** 10.756*** 11.206*** 11.623*** 10.546***
[0.129] [0.132] [0.117] [0.116] [0.206] [0.112]
Pseudo R2 0.164 0.171 0.183 0.192 0.200 0.287
N of Obs 7538
Notes: .*** significant at .01 level; ** significant at .05 level; *significant at .10 level. Omitted categorical variables:
Executives (Share); n of employees<15; boostrapped standard errors with 100 replications in square brackets.

24
Table 3 Pooled quantile estimates, whole sample, Panel B
Dep. Var. : Ln Wages
q10 q25 q50 q75 q90 OLS
PRP 0.096*** 0.088*** 0.066*** 0.051*** 0.033*** 0.086***
[0.017] [0.009] [0.008] [0.008] [0.012] [0.011]
New hirings (share) -0.04 -0.012 0.045 0.055** 0.068* 0.009
[0.053 [0.038 [0.028 [0.028 [0.036 [0.031
White collars (share) 0.231** -0.196** -0.802*** -1.107*** -1.331*** -0.590***
[0.111 [0.078 [0.085 [0.076 [0.125 [0.082
Blue collars (share) -0.132 -0.575*** -1.164*** -1.470*** -1.717*** -0.978***
[0.111 [0.077 [0.08 [0.07 [0.113 [0.078
Females (share) -0.460*** -0.479*** -0.428*** -0.418*** -0.420*** -0.441***
[0.025 [0.02 [0.016 [0.016 [0.023 [0.02
Fixed-term contracts (share) -0.559*** -0.513*** -0.420*** -0.388*** -0.295*** -0.461***
[0.07 [0.039 [0.034 [0.039 [0.052 [0.046
Trained workers (share) 0.050*** 0.046*** 0.047*** 0.036*** 0.024* 0.040***
[0.015 [0.011 [0.009 [0.01 [0.014 [0.01
15<n of employees<100 0.099*** 0.084*** 0.058*** 0.041*** 0.028*** 0.060***
[0.014 [0.011 [0.007 [0.008 [0.01 [0.008
99<n of employees<250 0.193*** 0.169*** 0.116*** 0.079*** 0.060*** 0.121***
[0.018 [0.011 [0.008 [0.009 [0.014 [0.01
n of employees>249 0.161*** 0.137*** 0.092*** 0.064*** 0.036* 0.027
[0.05 [0.021 [0.021 [0.019 [0.02 [0.041
Ln Kpc 0.051*** 0.037*** 0.035*** 0.032*** 0.028*** 0.043***
[0.005 [0.003 [0.002 [0.003 [0.003 [0.003
product innovation 0.001 -0.005 -0.007 -0.015 -0.018 -0.006
[0.015 [0.009 [0.008 [0.011 [0.012 [0.008
process innovation 0.009 -0.003 -0.019** -0.019** -0.029** -0.015*
[0.014 [0.009 [0.008 [0.009 [0.012 [0.008
foreign market 0.048*** 0.031*** 0.016** 0.016* 0.005 0.035***
[0.014 [0.008 [0.007 [0.009 [0.01 [0.008
year 2010 0.020* 0.035*** 0.039*** 0.042*** 0.049*** 0.025***
[0.012 [0.008 [0.007 [0.007 [0.01 [0.007
macro regions Yes Yes Yes Yes Yes Yes
sector Yes Yes Yes Yes Yes Yes
constant 9.471*** 10.261*** 11.036*** 11.541*** 11.984*** 10.741***
[0.127 [0.092 [0.085 [0.08 [0.124 [0.087
Pseudo R2 0.250 0.250 0.250 0.247 0.249 0.358
N of obs 7586
Notes: .*** significant at .01 level; ** significant at .05 level; *significant at .10 level. Omitted categorical variables:
Executives (Share); n of employees<15; boostrapped standard errors with 100 replications in square brackets.

25
Table 3 Pooled quantile estimates, whole sample, Panel C
Dep. Var. : Labour productivity-wage gap
q10 q25 q50 q75 q90 OLS
PRP -0.050*** -0.020** -0.022* -0.025 -0.02 -0.015
[0.016 [0.01 [0.011 [0.018 [0.026 [0.014
New hirings (share) 0.076*** 0.036* 0.02 0.004 0.035 0.014
[0.029 [0.019 [0.023 [0.034 [0.065 [0.03
White collars (share) -0.013 -0.035 -0.024 -0.152* -0.366** -0.094
[0.085 [0.031 [0.047 [0.081 [0.159 [0.06
Blue collars (share) -0.011 -0.075*** -0.085* -0.257*** -0.595*** -0.198***
[0.077 [0.029 [0.047 [0.08 [0.148 [0.058
Females (share) 0.008 0.002 0.026* 0.053** 0.073* 0.033*
[0.023 [0.013 [0.015 [0.024 [0.042 [0.02
Fixed-term contracts (share) 0.080* 0.083*** 0.103*** 0.129*** 0.172** 0.169***
[0.042 [0.023 [0.023 [0.041 [0.079 [0.032
Trained workers (share) 0.053*** 0.027*** 0.013 0.027** 0.034 0.033***
[0.015 [0.008 [0.008 [0.014 [0.027 [0.012
15<n of employees<100 0.016 -0.012* -0.028*** -0.068*** -0.119*** -0.039***
[0.013 [0.007 [0.007 [0.012 [0.021 [0.01
99<n of employees<250 0.027 -0.007 -0.040*** -0.088*** -0.174*** -0.055***
[0.017 [0.01 [0.009 [0.014 [0.024 [0.012
n of employees>249 0.015 -0.006 -0.049** -0.083*** -0.141*** -0.080***
[0.03 [0.015 [0.019 [0.027 [0.046 [0.029
Ln Kpc 0.025*** 0.041*** 0.063*** 0.088*** 0.112*** 0.073***
[0.004 [0.002 [0.002 [0.003 [0.005 [0.003
produc innovation -0.006 -0.002 0.002 -0.023** -0.023 -0.012
[0.013 [0.008 [0.008 [0.011 [0.025 [0.01
process innovation 0.041*** 0.027*** 0.021*** 0.025** 0.018 0.030***
[0.014 [0.008 [0.008 [0.01 [0.023 [0.01
foreign market 0.019 0.014* 0.028*** 0.024* 0.044* 0.020*
[0.016 [0.008 [0.009 [0.014 [0.025 [0.011
year 2010 -0.103*** -0.070*** -0.083*** -0.108*** -0.119*** -0.120***
[0.014 [0.007 [0.006 [0.009 [0.018 [0.009
macro regions Yes Yes Yes Yes Yes Yes
sector Yes Yes Yes Yes Yes Yes
constant -0.186** -0.137*** -0.190*** -0.082 0.17 -0.169**
[0.089] [0.037] [0.053] [0.091] [0.168] [0.066]
Pseudo R2 0.032 0.057 0.090 0.118 0.132 0.126
N of Obs. 7538
Notes: .*** significant at .01 level; ** significant at .05 level; *significant at .10 level. Omitted categorical variables:
Executives (Share); n of employees<15; boostrapped standard errors with 100 replications in square brackets.

26
Table 4 Pooled Estimates, Family firms, Panel A
Dep. Var. : Ln (labour productivity)
q10 q25 q50 q75 q90 OLS
PRP 0.085*** 0.050** 0.043** 0.048* 0.047 0.073***
[0.026 [0.021 [0.02 [0.025 [0.043 [0.021
New hirings (share) -0.166** -0.065 0.045 0.056 -0.083 -0.039
[0.079 [0.042 [0.041 [0.043 [0.07 [0.044
White collars (share) 0.315** 0.098 -0.239** -0.609*** -0.739*** -0.222**
[0.137 [0.102 [0.12 [0.149 [0.202 [0.107
Blue collars (share) -0.001 -0.283*** -0.699*** -1.090*** -1.290*** -0.631***
[0.138 [0.093 [0.114 [0.142 [0.192 [0.103
Females (share) -0.439*** -0.429*** -0.421*** -0.382*** -0.338*** -0.397***
[0.039 [0.029 [0.027 [0.036 [0.049 [0.027
Fixed-term contracts
(share) -0.284*** -0.295*** -0.309*** -0.261*** -0.049 -0.266***
[0.093 [0.062 [0.054 [0.054 [0.094 [0.055
Trained workers
(share) 0.111*** 0.091*** 0.083*** 0.059*** 0.043 0.081***
[0.026 [0.02 [0.016 [0.019 [0.027 [0.017
15<n of
employees<100 0.069*** 0.038*** 0.015 -0.026 -0.076*** 0.005
[0.021 [0.014 [0.012 [0.016 [0.023 [0.013
99<n of
employees<250 0.147*** 0.099*** 0.072*** 0.023 -0.072** 0.047***
[0.024 [0.016 [0.017 [0.019 [0.028 [0.017
n of employees>249 -0.207* 0.029 -0.009 -0.011 -0.066 -0.121*
[0.124 [0.063 [0.051 [0.068 [0.079 [0.073
Ln Kpc 0.081*** 0.100*** 0.106*** 0.118*** 0.140*** 0.116***
[0.007 [0.005 [0.005 [0.005 [0.007 [0.005
produc innov 0.045** -0.011 -0.005 -0.016 -0.017 -0.007
[0.022 [0.017 [0.014 [0.016 [0.024 [0.013
process innov 0.049** 0.025 0.015 0.003 -0.009 0.032**
[0.023 [0.019 [0.015 [0.017 [0.028 [0.014
foreign market 0.067*** 0.080*** 0.049*** 0.067*** 0.082*** 0.074***
[0.02 [0.012 [0.014 [0.016 [0.024 [0.014
year 2010 -0.096*** -0.068*** -0.051*** -0.062*** -0.082*** -0.094***
[0.019 [0.014 [0.013 [0.017 [0.02 [0.012
macro regions Yes Yes Yes Yes Yes Yes
sector Yes Yes Yes Yes Yes Yes
constant 9.272*** 9.650*** 10.185*** 10.693*** 10.881*** 10.021***
[0.148 [0.1 [0.116 [0.16 [0.212 [0.115
Pseudo R2 0.1771 0.1764 0.1798 0.1834 0.1848
N of Obs 5839
Notes: .*** significant at .01 level; ** significant at .05 level; *significant at .10 level. Omitted categorical variables:
Executives (Share); n of employees<15; boostrapped standard errors with 100 replications in square brackets.

27
Table 4 Pooled Estimates, Family firms, Panel B
Dep. Var. : ln (wages)
q10 q25 q50 q75 q90 OLS
PRP 0.082*** 0.071*** 0.066*** 0.042*** 0.055*** 0.091***
[0.02 [0.013 [0.01 [0.013 [0.02 [0.014
New hirings (share) -0.069 -0.026 0.021 0.042 0.058 -0.011
[0.056 [0.035 [0.028 [0.031 [0.036 [0.035
White collars (share) 0.481*** 0.084 -0.383*** -0.863*** -1.062*** -0.240***
[0.12 [0.087 [0.093 [0.104 [0.126 [0.087
Blue collars (share) 0.127 -0.276*** -0.736*** -1.228*** -1.440*** -0.596***
[0.113 [0.084 [0.088 [0.096 [0.12 [0.083
Females (share) -0.461*** -0.455*** -0.419*** -0.401*** -0.395*** -0.422***
[0.032 [0.025 [0.02 [0.02 [0.028 [0.022
Fixed-term contracts
(share) -0.558*** -0.468*** -0.402*** -0.352*** -0.238*** -0.439***
[0.064 [0.039 [0.04 [0.039 [0.054 [0.049
Trained workers (share) 0.032* 0.039*** 0.049*** 0.046*** 0.043*** 0.045***
[0.019 [0.012 [0.011 [0.012 [0.015 [0.012
15<n of employees<100 0.090*** 0.081*** 0.055*** 0.034*** 0.022** 0.051***
[0.014 [0.01 [0.009 [0.009 [0.011 [0.009
99<n of employees<250 0.189*** 0.169*** 0.121*** 0.082*** 0.059*** 0.116***
[0.017 [0.011 [0.009 [0.011 [0.013 [0.011
n of employees>249 0.091 0.127*** 0.074*** 0.032 -0.029 -0.042
[0.109 [0.042 [0.024 [0.026 [0.034 [0.074
Ln Kpc 0.053*** 0.040*** 0.038*** 0.036*** 0.030*** 0.048***
[0.005 [0.003 [0.002 [0.003 [0.004 [0.003
produc innov 0.008 -0.003 -0.001 -0.015 -0.019* 0
[0.015 [0.01 [0.009 [0.01 [0.011 [0.009
process innov 0.014 0.002 -0.011 -0.007 -0.024** -0.005
[0.015 [0.01 [0.01 [0.01 [0.011 [0.009
foreign market 0.051*** 0.038*** 0.015* 0.01 0.008 0.036***
[0.014 [0.01 [0.008 [0.01 [0.012 [0.009
year 2010 0.02 0.036*** 0.037*** 0.044*** 0.050*** 0.028***
[0.012 [0.009 [0.007 [0.008 [0.01 [0.008
macro regions Yes Yes Yes Yes Yes Yes
sector Yes Yes Yes Yes Yes Yes
constant 9.184*** 9.903*** 10.545*** 11.215*** 11.638*** 10.287***
[0.118 [0.092 [0.091 [0.101 [0.139 [0.093
Pseudo R2 0.255 0.245 0.235 0.221 0.218 0.349
N of Obs 5872
Notes: .*** significant at .01 level; ** significant at .05 level; *significant at .10 level. Omitted categorical variables:
Executives (Share); n of employees<15; boostrapped standard errors with 100 replications in square brackets.
28
Table 4 Pooled Estimates, Family firms, Panel C
Dep. Var. : ln(productivity- wage) gap
q10 q25 q50 q75 q90 OLS
PRP -0.036* -0.031*** -0.032*** -0.018 -0.004 -0.010
[0.02 [0.012 [0.012 [0.023 [0.031 [0.016
New hirings (share) 0.067 0.017 -0.003 -0.027 -0.014 -0.022
[0.041 [0.017 [0.024 [0.032 [0.063 [0.031
White collars (share) 0.035 -0.011 0.006 -0.108 -0.27 -0.042
[0.137 [0.034 [0.049 [0.081 [0.2 [0.068
Blue collars (share) 0.05 -0.038 -0.046 -0.195** -0.383* -0.097
[0.132 [0.036 [0.047 [0.08 [0.2 [0.066
Females (share) 0.022 0.016 0.035** 0.046* 0.044 0.024
[0.027 [0.017 [0.014 [0.027 [0.042 [0.02
Fixed-term contracts (share) 0.099** 0.086*** 0.114*** 0.157*** 0.161** 0.171***
[0.045 [0.023 [0.027 [0.04 [0.072 [0.033
Trained workers (share) 0.065*** 0.030*** 0.01 0.016 0.033 0.035***
[0.013 [0.009 [0.01 [0.016 [0.029 [0.012
15<n of employees<100 0.008 -0.015** -0.032*** -0.078*** -0.126*** -0.044***
[0.013 [0.007 [0.009 [0.013 [0.024 [0.01
99<n of employees<250 -0.001 -0.018** -0.045*** -0.087*** -0.177*** -0.068***
[0.017 [0.008 [0.011 [0.018 [0.029 [0.012
n of employees>249 -0.011 -0.024 -0.046* -0.078** -0.117 -0.084***
[0.07 [0.023 [0.027 [0.035 [0.072 [0.032
Ln Kpc 0.027*** 0.043*** 0.061*** 0.082*** 0.100*** 0.068***
[0.006 [0.002 [0.003 [0.004 [0.006 [0.004
product innovation -0.01 -0.004 0.006 -0.012 -0.01 -0.01
[0.014 [0.008 [0.009 [0.012 [0.024 [0.011
process innovation 0.042*** 0.027*** 0.018** 0.024** 0.02 0.038***
[0.015 [0.008 [0.009 [0.012 [0.027 [0.011
foreign market 0.038** 0.016** 0.037*** 0.031** 0.050** 0.038***
[0.016 [0.008 [0.008 [0.015 [0.025 [0.011
year 2010 -0.113*** -0.075*** -0.086*** -0.112*** -0.119*** -0.123***
[0.016 [0.007 [0.007 [0.01 [0.019 [0.009
macro regions Yes Yes Yes Yes Yes Yes
sector Yes Yes Yes Yes Yes Yes
constant -0.248* -0.179*** -0.222*** -0.084 0.1 -0.210***
[0.141 [0.05 [0.057 [0.093 [0.226 [0.076
Pseudo R2 0.033 0.061 0.090 0.115 0.123
N of Obs. 5839
Notes: .*** significant at .01 level; ** significant at .05 level; *significant at .10 level. Omitted categorical variables:
Executives (Share); n of employees<15; boostrapped standard errors with 100 replications in square brackets.

29
Table 5 Pooled Estimates, Non Family firms, Panel A
Dep. Var. : Ln (Labour productivity)
q10 q25 q50 q75 q90 OLS
PRP 0.001 0.014 -0.002 0.007 -0.087 0.001
[0.059 [0.036 [0.035 [0.036 [0.055 [0.032
New hirings (share) 0.291** 0.112 0.190* 0.343** 0.156 0.172
[0.118 [0.096 [0.112 [0.136 [0.249 [0.109
White collars (share) -1.258*** -1.358*** -1.549*** -1.583*** -2.065*** -1.632***
[0.38 [0.189 [0.204 [0.286 [0.589 [0.214
Blue collars (share) -1.659*** -1.671*** -1.965*** -2.213*** -2.852*** -2.219***
[0.327 [0.165 [0.183 [0.25 [0.525 [0.207
Females (share) -0.531*** -0.529*** -0.459*** -0.411*** -0.241 -0.417***
[0.096 [0.063 [0.076 [0.079 [0.147 [0.075
Fixed-term contracts (share) -0.631*** -0.651*** -0.623*** -0.536*** -0.197 -0.379**
[0.225 [0.145 [0.129 [0.166 [0.542 [0.17
Trained workers (share) 0.090* 0.026 0.105*** 0.075* 0.042 0.036
[0.054 [0.041 [0.038 [0.042 [0.071 [0.041
15<n of employees<100 0.165*** 0.068* -0.025 -0.144*** -0.268*** -0.028
[0.064 [0.036 [0.039 [0.054 [0.087 [0.041
99<n of employees<250 0.247*** 0.129*** -0.043 -0.176*** -0.300*** -0.019
[0.07 [0.037 [0.045 [0.062 [0.096 [0.046
n of employees>249 0.142 0.048 -0.076 -0.274*** -0.309** -0.105
[0.106 [0.066 [0.061 [0.077 [0.123 [0.068
Ln Kpc 0.047*** 0.069*** 0.097*** 0.126*** 0.145*** 0.107***
[0.013 [0.011 [0.009 [0.011 [0.016 [0.01
product innovation -0.072 -0.024 -0.015 -0.036 -0.03 -0.053*
[0.051 [0.034 [0.034 [0.034 [0.06 [0.032
process innovation 0.04 0.013 -0.014 -0.015 -0.087 -0.027
[0.051 [0.037 [0.041 [0.042 [0.068 [0.033
foreign market -0.024 0.02 0.066** 0.120*** 0.067 0.019
[0.054 [0.034 [0.032 [0.037 [0.056 [0.037
year 2010 -0.048 -0.021 -0.032 -0.094*** -0.122* -0.058**
[0.045 [0.029 [0.027 [0.031 [0.062 [0.028
macro regions Yes Yes Yes Yes Yes Yes
sector Yes Yes Yes Yes Yes Yes
constant 11.333*** 11.522*** 11.865*** 12.093*** 12.981*** 11.980***
[0.347 [0.144 [0.204 [0.321 [0.592 [0.223
Pseudo R2 0.132 0.167 0.184 0.215 0.262
N of Obs 1453
Notes: .*** significant at .01 level; ** significant at .05 level; *significant at .10 level. Omitted categorical variables: Executives
(Share); n of employees<15; boostrapped standard errors with 100 replications in square brackets.

30
Table 5 Pooled Estimates, Non Family firms, Panel B
Dep. Var. : ln (Wages)
q10 q25 q50 q75 q90 OLS
PRP 0.047** 0.047 0.045*** 0.029* 0.040** -0.005
[0.019 [0.029 [0.017 [0.016 [0.016 [0.024
New hirings (share) 0.03 -0.005 0.077 0.079 0.064 0.132
[0.069 [0.108 [0.065 [0.05 [0.071 [0.123
White collars (share) -1.359*** -0.815*** -1.055*** -1.307*** -1.478*** -1.660***
[0.154 [0.256 [0.138 [0.105 [0.157 [0.237
Blue collars (share) -1.692*** -1.091*** -1.349*** -1.620*** -1.786*** -2.018***
[0.147 [0.222 [0.128 [0.103 [0.146 [0.228
Females (share) -0.448*** -0.517*** -0.462*** -0.509*** -0.416*** -0.466***
[0.05 [0.063 [0.03 [0.032 [0.036 [0.057
Fixed-term contracts (share) -0.533*** -0.683*** -0.603*** -0.523*** -0.578*** -0.625***
[0.126 [0.178 [0.091 [0.072 [0.079 [0.164
Trained workers (share) 0.018 0.095*** 0.043*** 0.015 -0.003 -0.019
[0.021 [0.033 [0.016 [0.018 [0.022 [0.032
15<n of employees<100 0.01 0.052 0.050*** 0.033* 0.003 -0.043
[0.022 [0.035 [0.019 [0.018 [0.024 [0.032
99<n of employees<250 0.028 0.106*** 0.084*** 0.066*** 0.001 -0.028
[0.027 [0.036 [0.02 [0.018 [0.021 [0.039
n of employees>249 -0.022 0.05 0.052* 0.061** -0.011 -0.06
[0.046 [0.075 [0.03 [0.03 [0.028 [0.039
Ln Kpc 0.023*** 0.015** 0.022*** 0.024*** 0.020*** 0.012*
[0.006 [0.007 [0.004 [0.004 [0.006 [0.007
produc innov -0.021 -0.037 -0.005 0 -0.001 -0.001
[0.019 [0.029 [0.015 [0.015 [0.02 [0.026
process innov -0.038** 0.003 -0.034** -0.032* -0.03 -0.037
[0.018 [0.025 [0.016 [0.018 [0.024 [0.027
foreign market 0.045** 0.003 0.025 0.019 0.022 0.047*
[0.018 [0.028 [0.018 [0.018 [0.017 [0.025
year 2010 0.034** 0.029 0.052*** 0.052*** 0.044** 0.038*
[0.016 [0.028 [0.016 [0.015 [0.017 [0.02
macro regions Yes Yes Yes Yes Yes Yes
sector Yes Yes Yes Yes Yes Yes
constant 11.897*** 11.134*** 11.399*** 11.826*** 12.196*** 12.645***
[0.154 [0.248 [0.147 [0.117 [0.177 [0.272
Pseudo R2 0.2338 0.2695 0.2805 0.292 0.291
n of obs. 1465
Notes: .*** significant at .01 level; ** significant at .05 level; *significant at .10 level. Omitted categorical variables: Executives
(Share); n of employees<15; boostrapped standard errors with 100 replications in square brackets.

31
Table 5 Pooled Estimates, Non Family firms, Panel C
Dep. Var. : ln(Productivity- wage) gap
q10 q25 q50 q75 q90 OLS
PRP -0.054 -0.025 -0.01 -0.067** -0.104** -0.04
[0.045] [0.022] [0.022] [0.03] [0.045] [0.028]
New hirings (share) 0.192*** 0.063 0.037 0.127 0.446* 0.132
[0.068] [0.05] [0.06] [0.106] [0.228] [0.085]
White collars (share) -0.254** -0.179*** -0.178** -0.254* -0.028 -0.276**
[0.102] [0.062] [0.085] [0.146] [0.396] [0.136]
Blue collars (share) -0.277*** -0.241*** -0.313*** -0.501*** -0.477 -0.520***
[0.096] [0.061] [0.086] [0.143] [0.343] [0.134
Females (share) 0.031 -0.054 -0.047 0.061 0.078 0.05
[0.057 [0.037 [0.046 [0.071 [0.106 [0.059
Fixed-term contracts (share) -0.004 0.08 0.084 0.057 0.118 0.16
[0.136 [0.076 [0.089 [0.125 [0.233 [0.112
Trained workers (share) 0.016 0.034 0.038 0.062 0.033 0.025
[0.038 [0.023 [0.028 [0.038 [0.061 [0.034
15<n of employees<100 0.052 0.017 -0.003 -0.112*** -0.282*** -0.042
[0.039 [0.026 [0.028 [0.04 [0.084 [0.035
99<n of employees<250 0.103** 0.035 -0.046 -0.176*** -0.393*** -0.059
[0.043 [0.029 [0.029 [0.047 [0.091 [0.038
n of employees>249 0.114* 0.028 -0.091*** -0.210*** -0.352*** -0.093
[0.068 [0.039 [0.035 [0.072 [0.113 [0.066
Ln Kpc 0.017** 0.038*** 0.068*** 0.110*** 0.128*** 0.086***
[0.008 [0.005 [0.007 [0.009 [0.011 [0.008
product innovation -0.009 -0.007 -0.005 -0.026 -0.059 -0.023
[0.033 [0.019 [0.022 [0.03 [0.061 [0.026
process innovation 0.063* 0.041** 0.028 0.033 -0.013 0.009
[0.036 [0.02 [0.024 [0.033 [0.066 [0.028
foreign market -0.013 0.009 0 0.017 0.038 -0.022
[0.039 [0.022 [0.023 [0.038 [0.058 [0.032
year 2010 -0.058** -0.056*** -0.065*** -0.142*** -0.101** -0.099***
[0.028 [0.016 [0.021 [0.032 [0.046 [0.024
macro regions Yes Yes Yes Yes Yes Yes
sector Yes Yes Yes Yes Yes Yes
constant -0.03 0.01 0.014 0.058 0.25 0.044
[0.145 [0.081 [0.101 [0.179 [0.391 [0.15
Pseudo R2 0.050 0.063 0.109 0.149 0.213 0.159
N of obs 1453
Notes: .*** significant at .01 level; ** significant at .05 level; *significant at .10 level. Omitted categorical variables: Executives
(Share); n of employees<15; boostrapped standard errors with 100 replications in square brackets.

32
Table 6: Quantile fixed effects, whole sample, Panel A
Dep. Var. : Ln (Labour productivity)
q10 q25 q50 q75 q90 FE
PRP 0.026* 0.042*** 0.042*** 0.029*** 0.056*** 0.042*
[0.015] [0.008] [0.001] [0.008] [0.016] [0.023]
New hirings (share) 0.096*** 0.129*** 0.108*** 0.083*** 0.117*** 0.108***
[0.022 [0.013 [0.001 [0.018 [0.022 [0.041
White collars (share) 0.476*** 0.417*** 0.376*** 0.339*** 0.301*** 0.376***
[0.079 [0.033 [0.002 [0.026 [0.072 [0.084
Blue collars (share) 0.531*** 0.441*** 0.384*** 0.336*** 0.277*** 0.384***
[0.075 [0.032 [0.002 [0.025 [0.068 [0.087
Females (share) 0.141*** 0.142*** 0.134*** 0.128*** 0.131*** 0.134*
[0.014 [0.009 [0.001 [0.012 [0.021 [0.07
Fixed-term contracts (share) -0.195*** -0.207*** -0.198*** -0.216*** -0.187*** -0.198***
[0.035 [0.021 [0.001 [0.021 [0.037 [0.052
Trained workers (share) 0.011 0.004 -0.005*** -0.003 -0.01 -0.005
[0.012 [0.006 [0.001 [0.007 [0.011 [0.017
15<n of employees<100 -0.116*** -0.127*** -0.142*** -0.158*** -0.166*** -0.142***
[0.01 [0.006 [0.000] [0.006 [0.009 [0.022
99<n of employees<250 -0.137*** -0.164*** -0.190*** -0.213*** -0.246*** -0.190***
[0.011 [0.006 [0.000] [0.007 [0.012 [0.041
n of employees>249 -0.141*** -0.161*** -0.188*** -0.225*** -0.245*** -0.188**
[0.026 [0.015 [0.001 [0.011 [0.023 [0.082
Ln Kpc 0.052*** 0.059*** 0.064*** 0.066*** 0.075*** 0.064***
[0.003 [0.002 [0.000] [0.002 [0.003 [0.008
product innovation 0.004 -0.008 -0.007*** -0.002 -0.014 -0.007
[0.011 [0.007 [0.000] [0.006 [0.01 [0.013
process innovation 0.003 0.007 -0.002*** -0.005 -0.013 -0.002
[0.01 [0.006 [0.000] [0.006 [0.011 [0.013
foreign market -0.014 -0.019*** -0.019*** -0.017*** -0.011 -0.019
[0.01 [0.006 [0.000] [0.005 [0.01 [0.013
year 2010 -0.039*** -0.020*** -0.044*** -0.032*** -0.056*** -0.044***
[0.009 [0.006 [0.001 [0.004 [0.008 [0.008
macro regions yes yes yes yes yes yes
sector yes yes yes yes yes yes
_cons 9.510*** 9.649*** 9.750*** 9.849*** 9.963*** 9.750***
[0.084 [0.036 [0.002 [0.03 [0.074 [0.194
Pseudo R2 0.3179 0.4033 0.4461 0.3881 0.3248
N of firms (panels) 4222
N of obs 7538
Notes: .*** significant at .01 level; ** significant at .05 level; *significant at .10 level. Omitted categorical variables:
Executives (Share); n of employees<15; boostrapped standard errors with 100 replications in square brackets.

33
Table 6: Quantile fixed effects, whole sample, Panel B
Dep. Var. : ln (Wages)
q10 q25 q50 q75 q90 FE
PRP 0.031*** 0.025*** 0.024*** 0.015*** 0.009* 0.024*
[0.007] [0.004] [0.000] [0.004] [0.005] [0.013]
New hirings (share) 0.080*** 0.082*** 0.096*** 0.097*** 0.125*** 0.096***
[0.016] [0.01] [0.000] [0.011] [0.017] [0.024]
White collars (share) 0.311*** 0.215*** 0.200*** 0.157*** 0.149*** 0.200***
[0.037] [0.022] [0.001] [0.02] [0.037] [0.049]
Blue collars (share) 0.293*** 0.205*** 0.188*** 0.145*** 0.132*** 0.188***
[0.035] [0.02] [0.001] [0.02] [0.033] [0.051]
Females (share) -0.002 0.007 0.009*** 0.006 0.016 0.009
[0.01] [0.006] [0.000] [0.006] [0.011] [0.041]
Fixed-term contracts (share) -0.420*** -0.345*** -0.365*** -0.335*** -0.304*** -0.365***
[0.023 [0.014 [0.001 [0.014 [0.019 [0.03
Trained workers (share) -0.005 -0.005 -0.008*** -0.009** -0.008 -0.008
[0.007 [0.004 [0.000] [0.003 [0.006 [0.01
15<n of employees<100 -0.101*** -0.109*** -0.123*** -0.134*** -0.142*** -0.123***
[0.005 [0.004 [0.000] [0.003 [0.005 [0.013
99<n of employees<250 -0.191*** -0.206*** -0.229*** -0.244*** -0.261*** -0.229***
[0.006 [0.004 [0.000] [0.004 [0.006 [0.024
n of employees>249 -0.212*** -0.224*** -0.245*** -0.266*** -0.275*** -0.245***
[0.013 [0.008 [0.000] [0.009 [0.019 [0.047
Ln kpc 0.042*** 0.040*** 0.041*** 0.039*** 0.039*** 0.041***
[0.001 [0.001 [0.000] [0.001] [0.001] [0.005]
product innovation 0.000 0.000 0.003*** 0.003 0.001 0.003
[0.004] [0.004] [0.000] [0.003] [0.004] [0.008]
process innovation 0.003 -0.004 -0.005*** -0.009*** -0.004 -0.005
[0.005 [0.004 [0.000] [0.003 [0.004 [0.008
foreign market 0.001 0.003 0.001*** -0.004 0.000 0.001
[0.005 [0.003 [0.000] [0.004 [0.006 [0.008
year 2010 0.052*** 0.058*** 0.053*** 0.058*** 0.048*** 0.053***
[0.004 [0.003 [0.000] [0.003 [0.005 [0.005
macro regions yes yes yes yes yes yes
sector yes yes yes yes yes yes
constant 9.618*** 9.797*** 9.853*** 9.970*** 10.042*** 9.853***
[0.041 [0.024 [0.001 [0.025 [0.042 [0.114
Pseudo R2 0.4479 0.5116 0.5555 0.5152 0.451
N. of firms (panels) 4231
N of obs 7586
Notes: .*** significant at .01 level; ** significant at .05 level; *significant at .10 level. Omitted categorical variables:
Executives (Share); n of employees<15; boostrapped standard errors with 100 replications in square brackets.

34
Table 6:Quantile fixed effects, whole sample, Panel C
Dep. Var. : Ln (Labour productivity wage) gap
q10 q25 q50 q75 q90 FE
PRP 0.006 0.009 0.015*** 0.018*** 0.008 0.015
[0.013] [0.006] [0.001] [0.005] [0.013] [0.02]
New hirings (share) 0.027 0.02 0.010*** 0.002 -0.005 0.01
[0.019] [0.014] [0.002] [0.011] [0.027] [0.036]
White collars (share) 0.235*** 0.199*** 0.174*** 0.139*** 0.142*** 0.174**
[0.051] [0.033] [0.006] [0.02] [0.05] [0.073]
Blue collars (share) 0.293*** 0.220*** 0.185*** 0.135*** 0.105** 0.185**
[0.046] [0.031] [0.006] [0.019] [0.049] [0.075]
Females (share) 0.103*** 0.116*** 0.111*** 0.104*** 0.124*** 0.111*
[0.012] [0.007] [0.001] [0.007] [0.016] [0.061]
Fixed-term contracts (share) 0.154*** 0.167*** 0.167*** 0.148*** 0.134*** 0.167***
[0.025 [0.017 [0.001 [0.012 [0.024 [0.045
Trained workers (share) 0.012 0.008 0.004*** 0.003 -0.008 0.004
[0.01 [0.005 [0.001 [0.005 [0.009 [0.015
15<n of employees<100 0.019** 0.000 -0.011*** -0.025*** -0.039*** -0.011
[0.008 [0.004 [0.000] [0.005 [0.009 [0.019
99<n of employees<250 0.073*** 0.049*** 0.030*** 0.012** -0.005 0.03
[0.01 [0.006 [0.001 [0.005 [0.01 [0.035
n of employees>249 0.105*** 0.067*** 0.045*** 0.021** -0.004 0.045
[0.017 [0.009 [0.001 [0.01 [0.021 [0.071
Ln Kpc 0.011*** 0.021*** 0.026*** 0.030*** 0.038*** 0.026***
[0.002 [0.001 [0.000] [0.001 [0.002 [0.007
produc innovation -0.006 -0.012*** -0.011*** -0.009** -0.015* -0.011
[0.008 [0.004 [0.001 [0.004 [0.009 [0.011
process innovation 0.018** 0.012*** 0.005*** 0.000 -0.004 0.005
[0.008 [0.004 [0.000] [0.005 [0.008 [0.011
foreign market -0.023*** -0.016*** -0.020*** -0.024*** -0.025*** -0.020*
[0.008 [0.005 [0.001 [0.004 [0.009 [0.011
year 2010 -0.080*** -0.077*** -0.101*** -0.082*** -0.102*** -0.101***
[0.007 [0.004 [0.001 [0.003 [0.008 [0.007
macro regions yes yes yes yes yes yes
sector yes yes yes yes yes yes
constant -0.232*** -0.152*** -0.104*** -0.048** 0.011 -0.104
[0.049 [0.035 [0.006 [0.023 [0.051 [0.168
Pseudo R2 0.1968 0.2758 0.3306 0.2734 0.2017
N. of firms (panels) 4222
N of obs. 7538
Notes: .*** significant at .01 level; ** significant at .05 level; *significant at .10 level. Omitted categorical variables: Executives
(Share); n of employees<15; boostrapped standard errors with 100 replications in square brackets.

35
Table 7: Quantile fixed effects, family firms, Panel A
Dep. Var. : Ln (Labour productivity)
q10 q25 q50 q75 q90 fe
PRP 0.033* 0.053*** 0.051*** 0.042*** 0.050** 0.051*
[0.018] [0.01] [0.000] [0.008] [0.023] [0.028]
New hirings (share) 0.070** 0.117*** 0.079*** 0.064*** 0.097*** 0.079*
[0.033] [0.018] [0.000] [0.019] [0.029] [0.044]
White collars (share) 0.569*** 0.505*** 0.461*** 0.409*** 0.448*** 0.461***
[0.095 [0.051 [0.000] [0.031 [0.063 [0.092
Blue collars (share) 0.630*** 0.533*** 0.483*** 0.418*** 0.438*** 0.483***
[0.091 [0.05 [0.000] [0.029 [0.059 [0.092
Females (share) 0.047** 0.067*** 0.060*** 0.049*** 0.079*** 0.06
[0.021 [0.012 [0.000] [0.012 [0.018 [0.078
Fixed-term contracts
(share) -0.225*** -0.252*** -0.240*** -0.255*** -0.251*** -0.240***
[0.035 [0.023 [0.000] [0.025 [0.037 [0.056
Trained workers (share) 0.007 0.009 -0.005*** -0.001 -0.018 -0.005
[0.013 [0.008 [0.000] [0.008 [0.013 [0.018
15<n of employees<100 -0.097*** -0.116*** -0.134*** -0.154*** -0.169*** -0.134***
[0.01 [0.007 [0.000] [0.006 [0.009 [0.024
99<n of employees<250 -0.131*** -0.157*** -0.185*** -0.206*** -0.231*** -0.185***
[0.013 [0.008 [0.000] [0.007 [0.011 [0.046
n of employees>249 -0.125*** -0.153*** -0.147*** -0.181*** -0.163** -0.147
[0.041 [0.031 [0.005 [0.024 [0.066 [0.116
Ln Kpc 0.048*** 0.053*** 0.057*** 0.060*** 0.065*** 0.057***
[0.003 [0.002 [0.000] [0.002 [0.003 [0.009
product innovation 0.002 -0.008 -0.009*** -0.007 -0.017 -0.009
[0.011 [0.007 [0.000] [0.007 [0.01 [0.014
process innovation 0.007 0.005 0.007*** 0.006 -0.006 0.007
[0.011 [0.007 [0.000] [0.007 [0.011 [0.014
foreign market -0.011 -0.018** -0.015*** -0.011** -0.015 -0.015
[0.012 [0.007 [0.000] [0.006 [0.01 [0.014
year 2010 -0.039*** -0.023*** -0.043*** -0.031*** -0.049*** -0.043***
[0.009] [0.006] [0.000] [0.005] [0.009] [0.009]
macro regions yes yes yes yes yes yes
sector yes yes yes yes yes yes
constant 8.982*** 9.147*** 9.239*** 9.347*** 9.414*** 9.239***
[0.103 [0.058 [0.001 [0.04 [0.067 [0.304
Pseudo R2 0.635 0.729 0.766 0.707 0.616
N. of firms (panels) 3314
N of obs 5839
Notes: .*** significant at .01 level; ** significant at .05 level; *significant at .10 level. Omitted categorical
variables: Executives (Share); n of employees<15; boostrapped standard errors with 100 replications in
square brackets.

36
Table 7: Quantile fixed effects, family firms, Panel B
Dep. Var. : ln (wages)
q10 q25 q50 q75 q90 FE
PRP 0.022*** 0.012*** 0.006*** 0.003 -0.008 0.006
[0.007] [0.004] [0.000] [0.004] [0.008] [0.016]
New hirings (share) 0.090*** 0.079*** 0.099*** 0.103*** 0.123*** 0.099***
[0.022] [0.012] [0.000] [0.013] [0.023] [0.026]
White collars (share) 0.430*** 0.300*** 0.294*** 0.231*** 0.229*** 0.294***
[0.044] [0.029] [0.001] [0.023] [0.034] [0.054]
Blue collars (share) 0.407*** 0.296*** 0.289*** 0.230*** 0.230*** 0.289***
[0.044] [0.029] [0.001] [0.022] [0.033] [0.055]
Females (share) 0.006 0.015** 0.018*** 0.012* 0.025** 0.018
[0.012 [0.006 [0.000] [0.007 [0.012 [0.046
Fixed-term contracts (share) -0.417*** -0.342*** -0.364*** -0.340*** -0.302*** -0.364***
[0.029 [0.014 [0.000] [0.016 [0.021 [0.033
Trained workers (share) -0.003 [0.000] -0.004*** -0.003 0.003 -0.004
[0.007 [0.004 [0.000] [0.005 [0.007 [0.011
15<n of employees<100 -0.113*** -0.123*** -0.138*** -0.150*** -0.162*** -0.138***
[0.006 [0.004 [0.000] [0.004 [0.006 [0.014
99<n of employees<250 -0.160*** -0.180*** -0.201*** -0.220*** -0.242*** -0.201***
[0.007 [0.005 [0.000] [0.004] [0.006] [0.027]
n of employees>249 -0.221*** -0.206*** -0.231*** -0.258*** -0.248*** -0.231***
[0.025 [0.013 [0.000] [0.011 [0.033 [0.067
Ln Kpc 0.038*** 0.037*** 0.038*** 0.036*** 0.036*** 0.038***
[0.001] [0.001 [0.000] [0.001] [0.001] [0.005]
produc innov 0.000 0.003 0.002*** 0.002 -0.002 0.002
[0.006 [0.004 [0.000] [0.004 [0.006 [0.008
process innov 0.004 -0.007* -0.007*** -0.013*** -0.01 -0.007
[0.006 [0.004 [0.000] [0.004 [0.006 [0.008
foreign market 0.001 0.004 -0.003*** -0.006 -0.001 -0.003
[0.006 [0.003 [0.000] [0.004 [0.007 [0.008
year 2010 0.057*** 0.059*** 0.057*** 0.061*** 0.052*** 0.057***
[0.004 [0.003 [0.000] [0.003 [0.005 [0.005
macro regions yes yes yes yes yes yes
sector yes yes yes yes yes yes
constant 9.386*** 9.594*** 9.635*** 9.768*** 9.837*** 9.635***
[0.046] [0.029] [0.001] [0.023] [0.038] [0.18]
Pseudo R2 0.5043 0.5389 0.5584 0.5025 0.4318
N. of firms (panels) 3319
N of Obs 5872
Notes: .*** significant at .01 level; ** significant at .05 level; *significant at .10 level. Omitted categorical variables:
Executives (Share); n of employees<15; boostrapped standard errors with 100 replications in square brackets.

37
Table 7: Quantile fixed effects, family firms, Panel C
Dep. Var. : Ln(productivity wage) gap
q10 q25 q50 q75 q90 FE
PRP 0.035** 0.028*** 0.041*** 0.046*** 0.031* 0.041*
[0.017] [0.006] [0.001] [0.007] [0.016] [0.023]
New hirings (share) 0.018 0.001 -0.018*** -0.024* -0.02 -0.018
[0.028] [0.013] [0.001] [0.013] [0.029] [0.037]
White collars (share) 0.220*** 0.184*** 0.168*** 0.124*** 0.167*** 0.168**
[0.064 [0.044 [0.006 [0.027 [0.051 [0.077
Blue collars (share) 0.286*** 0.215*** 0.190*** 0.134*** 0.146*** 0.190**
[0.061 [0.043 [0.006 [0.026 [0.05 [0.078
Females (share) 0.016 0.041*** 0.031*** 0.030*** 0.048*** 0.031
[0.017] [0.009] [0.001] [0.009] [0.017] [0.066]
Fixed-term contracts (share) 0.106*** 0.130*** 0.124*** 0.105*** 0.099*** 0.124***
[0.024 [0.015 [0.001 [0.012 [0.026 [0.047
Trained workers (share) 0.003 0.004 -0.002*** -0.002 -0.017* -0.002
[0.011 [0.006 [0.001 [0.006 [0.009 [0.016
15<n of employees<100 0.045*** 0.021*** 0.011*** -0.008* -0.025*** 0.011
[0.008 [0.004 [0.000] [0.004 [0.007 [0.02
99<n of employees<250 0.062*** 0.044*** 0.028*** 0.010* -0.009 0.028
[0.011 [0.005 [0.001 [0.006 [0.01 [0.039
n of employees>249 0.104*** 0.107*** 0.103*** 0.095*** 0.089*** 0.103
[0.026 [0.013 [0.001 [0.02 [0.033 [0.098
Ln Kpc 0.007*** 0.016*** 0.019*** 0.023*** 0.030*** 0.019***
[0.002 [0.001 [0.000] [0.001 [0.003 [0.007
produc innov -0.011 -0.012** -0.014*** -0.012*** -0.013 -0.014
[0.01 [0.005 [0.000] [0.005 [0.008 [0.012
process innov 0.024*** 0.016*** 0.014*** 0.007 0.008 0.014
[0.009 [0.004 [0.001 [0.005 [0.009 [0.012
foreign market -0.016* -0.011** -0.013*** -0.013** -0.014 -0.013
[0.01 [0.005 [0.000] [0.005 [0.01 [0.012
year 2010 -0.091*** -0.080*** -0.102*** -0.085*** -0.105*** -0.102***
[0.008 [0.005 [0.001 [0.004 [0.008 [0.007
macro regions yes yes yes yes yes yes
sector yes yes yes yes yes yes
constant -0.492*** -0.410*** -0.360*** -0.297*** -0.270*** -0.36
[0.071 [0.046 [0.006 [0.029 [0.059 [0.257
Pseudo R2 0.6238 0.7274 0.7693 0.7081 0.5987
N. of firms (panels) 3314
N of Obs 5839
Notes: .*** significant at .01 level; ** significant at .05 level; *significant at .10 level. Omitted categorical variables:
Executives (Share); n of employees<15; boostrapped standard errors with 100 replications in square brackets.

38
Table 8 :Quantile fixed effects, non family firms, Panel A
Dep. Var. : Ln (labour productivity)
q10 q25 q50 q75 q90 FE
PRP -0.026 -0.001 -0.004*** -0.014 0.021 -0.004
[0.029] [0.013] [0.001] [0.013] [0.025] [0.047]
New hirings (share) 0.208*** 0.202*** 0.170*** 0.103** 0.136* 0.17
[0.074] [0.046] [0.006] [0.046] [0.072] [0.117]
White collars (share) 0.039 -0.015 -0.069*** -0.073 -0.109 -0.069
[0.129 [0.072 [0.007 [0.068 [0.151 [0.265
Blue collars (share) -0.009 -0.064 -0.133*** -0.136** -0.188 -0.133
[0.127 [0.069 [0.006 [0.067 [0.135 [0.28
Females (share) 0.313*** 0.313*** 0.295*** 0.288*** 0.256*** 0.295
[0.044 [0.025 [0.003 [0.028 [0.055 [0.189
Fixed-term contracts (share) -0.313*** -0.216*** -0.185*** -0.169*** -0.15 -0.185
[0.111 [0.056 [0.007 [0.047 [0.137 [0.158
Trained workers (share) 0.011 -0.002 -0.001 0.001 0.002 -0.001
[0.028 [0.015 [0.001 [0.018 [0.033 [0.043
15<n of employees<100 -0.073** -0.093*** -0.102*** -0.116*** -0.130*** -0.102
[0.035 [0.018 [0.002 [0.016 [0.037 [0.063
99<n of employees<250 -0.02 -0.077*** -0.118*** -0.160*** -0.240*** -0.118
[0.033 [0.017 [0.002 [0.014 [0.038 [0.101
n of employees>249 -0.034 -0.097*** -0.138*** -0.189*** -0.289*** -0.138
[0.046 [0.024 [0.002 [0.017 [0.047 [0.166
Ln Kpc 0.072*** 0.089*** 0.092*** 0.094*** 0.112*** 0.092***
[0.008] [0.004] [0.000] [0.003] [0.007] [0.022]
produc innov -0.001 -0.005 -0.006*** 0.004 -0.002 -0.006
[0.025 [0.015 [0.001 [0.012 [0.023 [0.035
process innov -0.004 -0.012 -0.040*** -0.041*** -0.054*** -0.04
[0.024 [0.013 [0.001 [0.013 [0.019 [0.035
foreign market -0.072** -0.033** -0.052*** -0.053*** -0.024 -0.052
[0.029 [0.015 [0.001 [0.012 [0.024 [0.036
year 2010 -0.005 -0.012 -0.018*** 0.008 -0.031 -0.018
[0.025 [0.01 [0.001 [0.012 [0.02 [0.021
macro regions yes yes yes yes yes yes
sector yes yes yes yes yes yes
constant 9.850*** 9.886*** 10.037*** 10.097*** 10.169*** 10.037***
[0.136 [0.085 [0.009 [0.086 [0.164 [0.39
Pseudo R2 0.3923 0.4983 0.5801 0.5402 0.4627
N. of firms (panels) 856
N of Obs 1453
Notes: .*** significant at .01 level; ** significant at .05 level; *significant at .10 level. Omitted categorical variables: Executives
(Share); n of employees<15; boostrapped standard errors with 100 replications in square brackets.

39
Table 8 :Quantile fixed effects, non family firms, Panel B
Dep. Var. : ln (wages)
q10 q25 q50 q75 q90 FE
PRP 0.043*** 0.040*** 0.049*** 0.030*** 0.042*** 0.049*
[0.01] [0.006] [0.002] [0.006] [0.01] [0.029]
New hirings (share) 0.118*** 0.106*** 0.111*** 0.101*** 0.090*** 0.111
[0.043] [0.024] [0.007] [0.014] [0.033] [0.071]
White collars (share) -0.136*** -0.113*** -0.127*** -0.145*** -0.141** -0.127
[0.051] [0.036] [0.01] [0.037] [0.055] [0.161]
Blue collars (share) -0.186*** -0.166*** -0.191*** -0.211*** -0.192*** -0.191
[0.049 [0.033 [0.008 [0.033 [0.055 [0.17
Females (share) 0.102*** 0.116*** 0.109*** 0.104*** 0.133*** 0.109
[0.021 [0.014 [0.003 [0.012 [0.023 [0.114
Fixed-term contracts (share) -0.533*** -0.484*** -0.513*** -0.466*** -0.466*** -0.513***
[0.055 [0.03 [0.006 [0.034 [0.047 [0.097
Trained workers (share) 0.003 -0.001 -0.008*** -0.01 -0.019* -0.008
[0.012 [0.008 [0.002 [0.007 [0.012 [0.026
15<n of employees<100 -0.073*** -0.083*** -0.088*** -0.090*** -0.087*** -0.088**
[0.013 [0.008 [0.002 [0.007 [0.012 [0.038
99<n of employees<250 -0.241*** -0.258*** -0.280*** -0.279*** -0.300*** -0.280***
[0.012 [0.009 [0.002 [0.008 [0.013 [0.061
n of employees>249 -0.217*** -0.236*** -0.262*** -0.264*** -0.280*** -0.262***
[0.02 [0.012 [0.003 [0.012 [0.02 [0.098
Ln Kpc 0.058*** 0.058*** 0.060*** 0.058*** 0.057*** 0.060***
[0.003 [0.002 [0.000] [0.002 [0.003 [0.013
product innovation -0.002 0.004 0.010*** 0.002 0.004 0.01
[0.011 [0.006 [0.002 [0.006 [0.011 [0.021
process innovation -0.014 -0.005 -0.007*** -0.01 0.005 -0.007
[0.011 [0.008 [0.002 [0.007 [0.01 [0.021
foreign market 0.019 0.021*** 0.024*** 0.013** 0.017* 0.024
[0.012 [0.007 [0.002 [0.005 [0.01 [0.022
year 2010 0.038*** 0.050*** 0.045*** 0.056*** 0.040*** 0.045***
[0.01 [0.006 [0.002 [0.005 [0.01 [0.013
macro regions yes yes yes yes yes yes
sector yes yes yes yes yes yes
constant 9.962*** 9.975*** 10.027*** 10.106*** 10.150*** 10.027***
[0.053 [0.039 [0.01 [0.038 [0.068 [0.237
Pseudo R2 0.5996 0.6797 0.7384 0.7177 0.6541
N. of firms (panels) 860
N of Obs
1465
Notes: .*** significant at .01 level; ** significant at .05 level; *significant at .10 level. Omitted categorical variables:
Executives (Share); n of employees<15; boostrapped standard errors with 100 replications in square brackets.

40
Table 8 :Quantile fixed effects, non family firms, Panel C
Dep. Var. : Ln(productivity-wage) gap
q10 q25 q50 q75 q90 FE
PRP -0.039* -0.042*** -0.051*** -0.047*** -0.055*** -0.051
[0.02] [0.01] [0.002] [0.009] [0.019] [0.041]
New hirings (share) 0.066 0.04 0.040*** 0.015 0.028 0.04
[0.06] [0.036] [0.005] [0.033] [0.069] [0.103]
White collars (share) 0.164 0.074 0.073*** 0.057 0.062 0.073
[0.114 [0.055 [0.009 [0.047 [0.092 [0.233
Blue collars (share) 0.141 0.03 0.022*** 0.009 -0.031 0.022
[0.107 [0.054 [0.007 [0.044 [0.092 [0.246
Females (share) 0.179*** 0.199*** 0.178*** 0.163*** 0.148*** 0.178
[0.039] [0.019] [0.003] [0.019] [0.04] [0.166]
Fixed-term contracts (share) 0.289*** 0.263*** 0.305*** 0.290*** 0.225*** 0.305**
[0.068] [0.044] [0.008] [0.035] [0.078] [0.139]
Trained workers (share) 0.012 0.01 0.012*** 0.009 -0.002 0.012
[0.019] [0.011] [0.002]] [0.012] [0.025] [0.038]
15<n of employees<100 0.03 0.014 0.002 -0.021 -0.002 0.002
[0.034 [0.016 [0.002 [0.013 [0.028 [0.055
99<n of employees<250 0.160*** 0.117*** 0.095*** 0.057*** 0.035 0.095
[0.035 [0.015 [0.002 [0.013 [0.025 [0.089
n of employees>249 0.127*** 0.077*** 0.052*** 0.008 -0.016 0.052
[0.038 [0.017 [0.003 [0.016 [0.028 [0.145
Ln Kpc 0.041*** 0.048*** 0.053*** 0.058*** 0.071*** 0.053***
[0.005 [0.003 [0.000] [0.003 [0.006 [0.019
produc innov -0.01 -0.016 -0.011*** -0.008 -0.019 -0.011
[0.022 [0.011 [0.001 [0.009 [0.019 [0.031
process innov 0.012 -0.002 -0.023*** -0.023** -0.025 -0.023
[0.02 [0.011 [0.002 [0.009 [0.018 [0.031
foreign market -0.072*** -0.065*** -0.076*** -0.079*** -0.067*** -0.076**
[0.023 [0.01 [0.001 [0.012 [0.023 [0.032
year 2010 -0.059*** -0.066*** -0.073*** -0.051*** -0.055*** -0.073***
[0.017] [0.008] [0.002] [0.01] [0.017] [0.018]
macro regions Yes Yes Yes Yes Yes Yes
sector Yes Yes Yes Yes Yes Yes
constant -0.370*** -0.215*** -0.182*** -0.147*** -0.127 -0.182
[0.124] [0.062] [0.008] [0.05] [0.126] [0.343]
Pseudo R2 0.2241 0.2903 0.3713 0.3207 0.2651
N. of firms (panels) 856
N of Obs 1453
Notes: .*** significant at .01 level; ** significant at .05 level; *significant at .10 level. Omitted categorical variables:
Executives (Share); n of employees<15; boostrapped standard errors with 100 replications in square brackets.

41
APPENDIX
Table A.1 Description of the Variables
Variable Definition
PRP Dummy variable that equals 1 if the firm adopts a PRP
scheme, 0 otherwise.
FF A dummy variable that equals 1 if the firm is owned and or
controlled by a family (FF) and 0 otherwise (NFF)
FM
A dummy variable that equals 1 if the family firm is
managed by family management (FM) and 0 otherwise
(NFM)
Ln (LP) Log of value-added per employee (source AIDA) deflated by
the value added deflator (source ISTAT)
Ln (W)
Log of wage bill per employee (source AIDA) deflated by
the consumer price index for blue and white collar workers
(source ISTAT)
Ln (LP) - Ln (W) Proxy of competitiveness of the firms
Ln (KPC) Log of capital stock per employee (source AIDA) deflated
by the investment deflator (source ISTAT)
Executives (share) Percentage of managers and supervisors
White collars (share) Percentage of white collar workers
Blue collars (share) Percentage of manual workers
Females (share) Percentage of women among total workers
Fixed-term contracts (share) Percentage of fixed-term workers
New hirings (share) Number of hired workers
Trained workers (share) Percentage of trained workers
Process Innovation Dummy variable that equals 1 if the firm adopted process
innovations in the last three years, 0 otherwise
Product Innovation Dummy variable that equals 1 if the firm originated new
products in the last three years, 0 otherwise
Foreign market Dummy variable that equals 1 if the firm exported in the last
three years, 0 otherwise
North- West Dummy variable that equals 1 if the firm is localised in
North-Western regions, 0 otherwise
North-East Dummy variable that equals 1 if the firm is localised in
North-Eastern regions, 0 otherwise
Centre Dummy variable that equals 1 if the firm is localised in
Central regions, 0 otherwise
South Dummy variable that equals 1 if the firm is localised in
Southern regions, 0 otherwise
Sectors Dummy variable that equals 1 if the firm is localised in
sector shown in table1, 0 otherwise