Embed Size (px)
Citation preview

HCEO WORKING PAPER SERIES
Working Paper
The University of Chicago1126 E. 59th Street Box 107
Chicago IL 60637
www.hceconomics.org
The Impact of a Conditional Cash Transfer Programon Households’ Well-Being∗
Daniela Del Boca† Chiara Pronzato‡ Giuseppe Sorrenti§
December 13, 2018
Abstract
We evaluate the impact of a conditional cash transfer (CCT) program thatwe designed on family well-being among low-income families with young chil-dren. Although most CCTs have been implemented in low-income countries,our research is in the context of a high-income country, Italy, where the recenteconomic crises have worsened the conditions of families with children, especiallyamong immigrants. Our objective is to evaluate the introduction of conditionality(attendance of courses) into a pre-existing unconditional cash transfer program.Using a randomized controlled trial, we find that CCT families search more ac-tively for work, and they work more hours and more regularity than the cashtransfer and control groups. CCT families also are able to save more money andeat healthier foods. The CCT intervention appears to be more effective thancash transfer alone in changing households’ behavior in several dimensions ofwell-being. Our findings add to the accumulating evidence on the impact of con-ditional cash transfers versus unconditional ones and to the literature concerningmultidimensional incentive programs.
JEL Classification: I10, I20, J24, I31,Keywords: cash transfers, poverty, use of money, labor supply, parenting
∗We would like to thank seminar participants at the seminars at the University of San Diego,the University of Munich, New York University, Keio University, Hitotsubashi University, the Uni-versity of Turin, and the Collegio Carlo Alberto. We thank Ainhoa Aparicio, Larry Aber, MauricioAvendano, Christopher Flinn, Imran Rasul, James Riccio and Orla Doyle for helpful comments andsuggestions.The research is partly supported by the Compagnia di San Paolo, Collegio Carlo Alberto.†University of Turin, CHILD, Collegio Carlo Alberto, IZA,CEPR and CESIFO.‡University of Turin, CHILD, Collegio Carlo Alberto, and IZA.§University of Zurich, CHILD, Collegio Carlo Alberto
1
1 Introduction
The majority of programs targeted to reduce poverty in the last few decades have
taken the form of unconditional cash transfers (UCTs). These programs do not specify
any behavioral conditions for receiving payments and thus act only through an income
effect. Although these programs have helped reduce poverty in low-income families in
the short-term, their long-term results are more mixed (Elango et al., 2015; Fernald,
2013; Gertler et al., 2013).
Recent literature has shown that a more effective way to reduce the intergener-
ational persistence of poverty is to link economic support to “productive” behaviors
such as investments in human and physical capital. Productive behavior might be
incentived by conditional cash transfers (CCTs). In other words, the receipt of CCTs
are “conditional” on the beneficiary’s completion of desirable actions (e.g. related to
education, work, or health) that are more likely to produce long-lasting effects.
The main argument in favor of CCT programs is that poverty constraints may often
cause disadvantaged households to underinvestment in human and physical capital.
Families from disadvantaged backgrounds are not only limited by financial constraints
that reduce their ability to save money or invest in education and health, but they
are also often uninformed of the returns of these investments (Cunha et al., 2013;
Mullainathan and Shafir 2013; Doyle, 2013). Because lower-income parents may be
unaware of these limitations and not seek for more information, CCT programs could
become important to improving behavior and decision making.
In this paper, we evaluate the impact of Opportunity Zero-Six, a CCT program
that we designed and that has been run in the municipality of Turin by a non-profit
organization since 2016. The intervention targeted families with a dependent child aged
0–6 living in poverty. Opportunity Zero-Six expanded the existing income support
program Accoglienza Orientamento Supporto (AOS). While AOS is a typical UCT,
Opportunity Zero-Six conditions the provision of the income transfer on recipient’s
attending courses on job-seeking, reconciliation between work and family tasks, use of
money, and parenting. The cash transfer was around e2,500–e3,500, which is close to
75 percent of the family yearly labor income in our sample.
The particular design, which was based on the expansion of an existing UCT pro-
gram, allows us to compare two treatment groups, namely a group of families receiving
only an unconditional cash transfer and a group of families receiving the cash transfer
conditional on the attendance of mentoring courses. We compare the performance of
2
these two groups with the performance of a control group excluded from both the cash
transfer and the courses.
The CCT group was entitled to receive the cash transfer conditional on attendance
at two courses. Courses provide information potentially important to improving fami-
lies’ choices. The courses cover topics related to job-seeking practices, the preparation
of a curriculum vitae, the importance of keeping track of expenses, healthy nutrition
habits, parenting etc. Each course consisted of five two-hour meetings. Assignment to
the two courses was based on an algorithm, so it was in no way dependent on family
preferences.
Through a randomization process, we assigned around 1,500 families to one of
the three groups (UCT, CCT, and control group).1 Families received cash transfers
in three installments. The first installment (e500) was paid upon admission to the
program. The second installment (e1,000–e1,500) was paid after attendance at the
first course for the CCT group and contemporaneously to the UCT group. The third
installment (e1,000–e1,500) was paid after attendance at the second course and con-
temporaneously to the UCT group. One year after the intervention we administered a
comprehensive survey on family well-being and economic conditions to each family in
the sample. The mother of the youngest child in the household was interviewed.
The program that linked cash transfer to course attendance shows a significant
impact on many dimensions of family well being. While the CCT marginally impacts
labor outcomes of women in our sample, the labor market outcomes of respondents’
partners (e.g. the men in the household) improve considerably. In particular, partners
in the CCT group increase by around one-half day per week (3.5 hours) compared to
the control group their labor supply. There is no effect for the UCT group.2 Families
in the CCT group also appear less likely than both the control and the UCT groups
to experience problems with utility bills, they are less financially dependent on others,
and they save more money. Additionally, outcomes related to nutrition improve more
for the CCT group than for the UCT group. CCT families are more likely to consume
fish, meat, fruit, or desserts on a weekly basis. Although the intervention also targeted
parenting practices and topics related to the child-parent relationship, no significant
effects are detected in parenting practices (e.g. reading activities, outdoor playing).
1Our experimental design leaves the number of cash transfer beneficiaries unaltered as comparedto previous years.
2In the near future, we plan to merge our survey data with administrative data, e.g. on laborsupply, to further verify the reliability of our findings.
3
The literature analyzing the impacts of CCTs on family well-being and outcomes
has increased substantially in the last few decades. One of the largest CCT programs
ever implemented, Progresa, began in Mexico in 1997 and continued with follow-up
programs, Opportunidades, and now Prospera. Since the late nineties, CCT pro-
grams have been established also in other lower- and middle-income countries, includ-
ing Colombia, Nicaragua, Honduras, Brazil, Argentina, Ecuador, and Turkey. In these
contexts, the “conditions” potentially benefit the children in the household and usu-
ally involve education (enrolling in and attending school) and health services (making
regular preventive-care visits to health centers or receiving immunizations) (Attanasio
et al., 2012; Attanasio et al., 2015; Behrman et al., 2011; Behrman et al., 2012).
Fiszbein and Schady (2009), Baird et al. (2011), and Baird et al. (2014) provide
extensive reviews of these programs focusing on the impacts of CCT programs on
schooling outcomes in low- and middle-income countries. Their results show that the
effectiveness of a particular CCT depends on several characteristics of the program
design and the target groups. CCT programs appear more effective in contexts in
which school enrollment and health center attendance requirements are relatively low
and where services are easily available and of higher quality (Saavedra and Garcia,
2017). CCT programs appear to have longer-term effects on educational and health
outcomes than UCTs (Baez and Camacho, 2011; Barham et al., 2017).
Only very recently have CCTs been implemented in high-income countries where
the economic situation of families with children, especially minorities and immigrants,
has worsened since the 2007 economic crisis. In these contexts, where the large major-
ity of families already use educational and health services, CCT programs are designed
to provide more-accessible information concerning education and health services and
their impacts on child outcomes to incentivize a better use of resources. Family Re-
wards in New York City was the first CCT program to be implemented and evaluated
in the United States. The program was designed by the Center for Economic Oppor-
tunity within the Mayor’s Office for Economic Opportunity and MDRC, a nonprofit
social policy evaluation firm. Family Rewards offered cash rewards from late 2007 to
late 2010 to low-income families with children in elementary, middle, and high school
for meeting a variety of age-appropriate activities and outcomes related to children’s
educational efforts and achievement, family preventive health care practices, and par-
ents’ employment (Aber and Rawlings, 2011; Miller et al., 2015). Using a randomized
controlled trial, they found that the program substantially reduced poverty and mate-
4

rial hardship during the three years in which the rewards were offered. The program
also had some effects in each of the areas of education, health, and work, although the
effects were not statistically significant.
While the literature is quite extensive, there is still limited research on the design
and functioning of CCTs for poor families in high-income countries and little evidence
on the relative effects of CCTs versus UCTs (except for Baird et al., 2011). Recently,
Del Boca et al. (2016) uses a policy simulation of a theoretical model of parental choices
to show that conditional cash transfers are more efficient than unconditional ones or
restricted transfers on household well-being.
Our present study evaluates the introduction of conditionality into a pre-existing
unconditional cash transfer program. Our research provides important evidence on the
question of whether a CCT approach is more effective than a UCT approach in reduc-
ing poverty and improving family well-being. The conditionality is input-based and
involves parents’ attending courses that are designed ad hoc. An important component
of our research is its focus on how information improves the decisions and assimila-
tion of poorer and recent-immigrant households. The assumption that information
improves decisions is consistent with research indicating that parents from low socio-
economic backgrounds may engage in “nonoptimal” behaviors in several dimensions
(Mullainathan and Shafir, 2013), which can be attributed to the stress that poverty
places on decision making (Cunha et al., 2013).
We contribute to the existing literature on cash transfers in several ways. First,
our research evaluates a CCT program conducted in an developed country, in contrast
to most studies that analyze programs in developing countries. Our sample involves a
population of poor families, among which are a large proportion of recent immigrants
from Africa and the Middle East. Given the recent large migrations to Europe, it is
important to study the impact of these programs also on immigrants. Our focus on the
way information improves decision making and integrates new and diverse immigrants
is important for future policy making. Evaluations such as ours are particularly rare,
and we believe that our study helps illustrate their feasibility and value while providing
evidence on the effectiveness of different social policies.
Second, the program we evaluate, unlike others, is multidimensional. It not only
aims to address issues of education and health, as do most programs, but it also seeks to
improve recipients’ knowledge of money, work, savings, nutrition, and childcare. Third,
we evaluate impact of both CCT and UCT programs, which helps determine which
5

approach is more effective in reducing poverty and material hardship and produces
better family outcomes.
We hypothesize that UCTs will have a pure income effect and will increase house-
hold expenditures on normal goods, while CCT transfers conditional on acquiring in-
formation will both increase expenditures on normal goods and will induce a positive
change in household production technology.
The remainder of the paper is structured as follows. In Section 2, we describe the
intervention and the experimental design of the study, the courses offered and assigned
to families, and the content of the endline survey. Section 3 provides details on the
data. Section 4, discusses the empirical model and the results. We first report the
estimates of the impacts of the intervention for the CCT and UCT groups with respect
to the control group for the whole sample. Then, we replicate the analysis to isolate
the effects induced by the specific courses attended by CCT families. In Section 5, we
discuss issues related to positive response bias. Section 6 concludes.
2 Intervention and Experimental Design
In this section, we describe the intervention and our experimental design. We start
by introducing the existing income support program, AOS Then, we more generally
introduce the conditional cash transfer intervention we designed (OpportunityZero-
Six) and the main differences from the pre-existing AOS income support program.
We detail the practical implementation of the intervention. Finally, we discuss the
structure of the endline survey and information collected therein twelve months after
program admission.
2.1 The AOS Income Support Program
The AOS program has supported a large number of families in poverty since 2008. It
was implemented in the municipality of Turin, which is one of the largest cities in Italy.
In Turin, as in the rest of Italy, the economic crisis has strongly affected household
income. Although in years past, older households were at a higher risk of poverty,
recently, the poverty risk has increased for younger households with children (ISTAT,
2017).
In fact, since 2012, the AOS program has been focused on families with at least
one child younger than age six. The program is financed and managed by Ufficio Pio,
6
a philanthropic institution based in Turin. The main objective of the program is to
combat poverty by supporting families’ economic and financial opportunities. AOS
represents a typical unconditional cash transfer program: the cash transfer depends
only on admission to the program no (desirable) behavior is required of recipients.
Admission to the program is based on two eligibility criteria. The first is family
income. Each family must have family income below e7,000 as measured by the
Indicator of the Equivalent Economic Situation (ISEE). An ISEE of around e900,
the average in our sample, corresponds to a family consisting of two parents and two
children, with a monthly rent of e200, and yearly labor earnings of e4,700. The
second eligibility criterion requires the family to have a child under the age of six.
Applications are accepted on a rolling basis, meaning that families can at any time.
Every two weeks, the Ufficio Pio collects the applications, determines whether eligibility
criteria have been met, and then prioritizes which families will receive the cash transfer.
Eligible families that do not receive the cash transfer are put on a waiting list that is
valid until December of the application year. If the family does not receive any cash
transfer by the end of the year, it must submit a new application.
Since its inception, around 1,300 families have been admitted to the AOS program
and have received the cash transfer each year. The yearly cash transfer is about e2,500–
e3,500 and is a sizable income shock for AOS families.3 As we will show below, for the
average family that received AOS cash transfers in 2016—the year of the intervention—
the transfer covered up to 75 percent of the average family yearly labor income in our
sample.
2.2 The OpportunityZero-Six Intervention
OpportunityZero-Six was introduced in April 2016 to offer new opportunities for fam-
ilies living in poverty with a dependent child aged 0–6. The program revised the
AOS with the goal of combating family poverty in the long run. Significantly, the re-
vised AOS introduced cash transfers that were conditional on exposure to information
regarding important dimensions of family behavior. Specifically, to receive the cash
transfer, recipients had to attend two courses that provided information and train-
ing on job-seeking, reconciliation between work and family tasks, use of money, and
3The amount of the transfer varies according to the number of dependent children in the household.
7

parenting.4
The experiment design randomized 1,500 eligible families across three different
groups.5 The first group, consisting of 500 families, received the conditional cash trans-
fer in three installments upon attendance of two of the four courses on job-seeking, rec-
onciliation between work and family tasks, use of money, and parenting.6 The second
group, consisting of another 500 randomly selected families, received an unconditional
cash transfer. Families within this group, the UCT group hereinafter, received the
same amount of money as the conditional cash transfer group, but they did not have
to attend any course to obtain the money. The UCT group received their transfers in
three installments at the same time as the conditional cash transfer group. Finally, a
third group of 500 families constituted the control group. This group, although eligible
to receive the treatment, did not receive any cash transfer for the entire period covered
by our analysis (CG).
Figure 1: The Timeline of the Intervention
Notes: This figure shows the timeline of the intervention for representative families that applied inMarch 2016 and who were admitted to the program in April 2016. The same schedule (with a relativeshift in months) applied to all families who applied for benefits from April through November 2016.CCT, UCT, and CG stand for conditional cash transfer group, unconditional cash transfer group andcontrol group, respectively.
Figure 1 summarizes the timeline of the intervention. Applications were received
and evaluated on a rolling basis. To obtain a potential total population of around 1,500
families, our experiment covered those admitted to the program during the 9-month
period from April to December 2016. For simplicity, in the figure, we illustrate the
case of families that applied in March 2016 for admission to the program in April 2016.
4The content of the courses, the assignment rules, and other details about the intervention will bediscussed below.
5For the sake of simplicity, we use here illustrative groups sizes that are close to the ones obtainedin the final setting described below. It is important to mention that the experiment did not in anyway alter the acceptance rate into the AOS program. The number of cash transfers provided, around1,300 per year, was unchanged as a result of our experiment.
6The assignment to courses was completely out of families’ control and based on an algorithmdiscussed below.
8

This example can be easily adapted (by shifting the month of each single stage) to
families applying in the following months.
Applicants submitted several documents concerning family composition and in-
come. After the formal applications were received, they were submitted to the Ufficio
Pio. Every two weeks the Ufficio Pio analyzed the N applications received and selected
the n families (n ≤ N) that were eligible to receive the cash transfer. The number of
eligible families was usually close to 90 units every two weeks (n ' 90).7 Once selected,
we randomly assigned each of the n families to one of the three groups (CCT, UCT,
or CG). Contemporaneously, families assigned to the CCT or the UCT group received
the first installment of the cash transfer (e500).
After three months of program admission, families in the CCT group were required
to attend the first assigned course. The course consisted of five two-hour meetings.
Once the Ufficio Pio verified that a family member attended at least 75 percent of the
scheduled meetings, the second installment of the cash transfer (e1,000–e1,500) was
paid to the family. At the same time, the UCT group received its first cash transfer
installment.
Participants received the second installment of the cash transfer six months after
admission to the program. Again, CCT families received the transfer upon verification
of attendance at a minimum of 75 percent of the second course. The installment of
e1,000–e1,500 was paid to the UCT group at the same time.
Twelve months after admission to the program, a final survey was administered that
covered the main areas of household behavior that had the potential to be affected by
the intervention. We discuss the content of the survey below.
2.3 The Courses
To receive the cash transfer, the CCT group was required to attend two courses on
topics such as job-seeking, reconciliation between work and family tasks, use of money,
and parenting. Each course consisted of five two-hour meetings. Families had to attend
at least 75 percent of the course. The take-up rate was very high (85 percent) relative
to other programs. The conditions for this program were rather weak relative to the
conditions of other programs, and the cash transfers were very high relative to the
households’ average income.
7We show below that the three groups are extremely balanced in terms of a wide set of observablecharacteristics.
9

Each family was assigned to the two courses of the basis of an algorithm that
aimed to match specific family characteristics to appropriate courses. The assignment
did not consider family preferences and families could not change courses. Only one
family member was required to participate in the meetings. The course instructors
have translators to assisting individuals who needed help understanding the Italian
language. We describe the content of each course described below.
Job-Seeking (JSC) This course sought to improve individual job-seeking skills
in several ways. The course focused on the importance of recognizing and evaluating
individual skills. Based on individual skills and professional development, participants
were taught strategies for job searching. For example, individuals were taught the
importance of preparing a detailed and precise personal profile or resume. Each of
them received practical guidance on how to write an effective curriculum vitae (CV).
Finally, the course taught how to search for jobs and other opportunities such as
internships, training support, etc.
Reconciliation work and family (RC) It is important for families with young
children to understand how to reconcile work life and family life. This course provided
useful information to families on how to reconciliation these different aspects of their
lives. Part of the course centered on the job-search process, and, in particular, how to
find flexible or atypical job opportunities. Instructors covered topics such as parental
leave and the availability of part-time or occasional jobs. Families were also informed
about formal childcare opportunities available and their application procedures.
Use of money (MC) The course taught families how to manage the family budget
and how to use money to improve family living conditions and opportunities. Instruc-
tors discussed the dynamics that usually lead to debt. The course also addressed the
importance of using tools such as financial diaries to keep track of expenses and the
stressed the importance of savings.
Parenting (PC) The course covered the parent-child relationship as well as more
general topics about child development. The course emphasized the development of
skills (cognitive and socio-emotional) and healthy habits for the all family. The courses
were led in part by psychologists and in part by doctors. The psychologists provided
parents with useful information on how to deal with parental tasks. Similar to the
reconciliation course, the course widely covered the topic of formal childcare. The
psychologists informed parents about the available childcare options and the poten-
10

tial importance of formal childcare on their children’s cognitive and socio-emotional
development and for immigrant families’ integration. The doctors discussed healthy
nutrition and its implications for child health.
2.4 The Endline Survey
An endline survey was administered twelve months after the family was admitted to
AOS (or was assigned to the CG). The families in each of the CCT, the UCT, and
the control groups were asked to fill out the same survey, which took approximately
40 minutes to complete. In order to prevent logistic problems, families completed the
survey at home or at a public place of their choice. Students in economics and statistics
master’s programs at the University of Turin conducted the interviews. Translators
assisted migrant families or other families with a limited knowledge of the Italian
language. The mother of the youngest child in the household was interviewed.8 Families
in the control group were offered a e100 food voucher as an incentive to fill out the
questionnaire.
The survey covered all the areas potentially affected by the the cash transfer and
by the information included in the courses. The questionnaire was broad as the inter-
vention sought to affect many different areas related to family well-being.
A main section of the survey centered on labor market outcomes: current employ-
ment status, type of employment, number of days or hours per day usually worked, and
wages. Moreover, we collected detailed information about job-seeking activities such
as attendance at professional courses or trainings. We also focused on acquired skills,
i.e., language knowledge or computer proficiency. All this information was collected
for both the respondent and, if present, her partner.
Another section of the questionnaire concerned households’ economic conditions
and information relative to how family members used money. We gathered informa-
tion about problems paying and arrears in utility bills and concern about household
economic conditions. Moreover, to investigate the impact of the intervention on eco-
nomic constraints and income availability, we also asked about savings in the last year
and the use of saving practices such as budget diaries, etc. As one of the requirements of
the income support program was to have at least a dependent child, the questionnaire
asked about children’s educational and socio-emotional development.
8Single mothers constitute around 30 percent of our sample. Therefore, we made this choice toensure the same respondent across families.
11

3 Data, Randomization, and Attrition
Table 1 describes the characteristics of the initial sample. Which consists of 1,587
families. As determined in the application process, around 65 percent of the families
are two-parent families. Moreover, 72 percent of all families are immigrants. The
average age of the participants is 35, and the average age of partners is 41. The typical
household in the sample includes two children, with the youngest child being three
years old. Around 60 percent of the participants reported satisfactory health status,
but only 45 percent of their partners had good health.9
As Table 1 shows that only 40 percent of parents in the sample have a secondary
education. More than half of the couples are both unemployed, while only three percent
of couples both work. The average family income—as measured by the ISEE—is around
e900. This ISEE level corresponds to a family of two parents and two children, with
a monthly rent of e200, and yearly labor earnings of e4,700.
Table 2 reports how families were randomly assigned to one of the three groups of in-
terest for this study (the CCT, the UCT, and the CG). All the observed characteristics—
e.g. household composition and demographics, family members’ employment status,
family income, etc.—collected during the application process were balanced across
groups. Any difference appears as statistically non significant.
After the randomization process is validated, we must test for possible attrition
in the final sample. To do so, we compare observable characteristics across the three
groups that took the survey twelve months after the start of the intervention. In our
specific framework, attrition can result from families that: (i) are untraceable after the
intervention; (ii) dropped out during the intervention; and (iii) refused to take the final
survey. These families constituted a small fraction of the initial sample and, as a result,
the total survey response rate was 73 percent of the initial sample. The distribution
of the response rate is similar across the three groups: 71 percent for the CCT group
and 74 percent for the UCT and CG groups.
The descriptive analysis in Table 3 suggests the absence of selection based on ob-
servables. All the household characteristics remain balanced when compared across
groups. Any statistically significant difference is detected through this comparison.
In Table 4, we more formally test the absence of selection based on observables to
9For the sake of simplicity, from now on we label accepted participants and survey respondentsand their partners as parents. However, while the survey respondent is the mother of the youngestchild in the household, the partner is not necessary the father of the same child.
12
verify whether some of the observable characteristics of the applicants are predictive
of future attrition. To do so, we estimate a logistic regression model in which the
dependent variable is an indicator for attrition taking the value of one if the family did
not take the final survey for one of the above-mentioned reasons. As control variables,
we use all the characteristics that are available for all households in the sample.10
Characteristics such as household composition, family members’ employment sta-
tus, and family income do not play any role in affecting the probability that families
did not complete the final survey. Only the variable for the Italian citizenship seems to
play a (statistically) significant role in shaping the probability of completing the final
survey. Specifically, immigrant families were more likely to complete the final surveys
than Italian families.11
In sum, the analysis of sample characteristics both pre- and post-attrition confirms
the validity of the implemented randomization process and that selective participation
based on observable characteristics does not represent a threat to the experimental
setting of this study.
4 Empirical Strategy and Results
In this section, we present the main analysis of the study. First, we describe the
empirical model. Then, we present the main results of the intervention by considering
the whole sample of treated families. After presenting results for the whole sample,
we will focus on the impact of the specific treatment effects induced by the different
courses taken by families in the CCT group.
4.1 The Empirical Model
Equation (1) constitutes the baseline empirical specification:
yi =3∑
j=1
βjχ[i ∈ Groupj] + x′iβ4 + α0,i + εi , (1)
10As around 35 percent of survey respondents are single, we do not include partner’s characteris-tics in this model. However, the analysis of the sample is of couples; therefore including partner’scharacteristics displays a similar pattern.
11Although only the variable for Italian citizenship appears as statistically significant in shapingthe probability of attrition, we will include the variable for Italian citizenship and a set of additionalfamily characteristics as control variables in our regression models. More details about the empiricalmodel will be discussed in Section 4.
13

where i denotes the family. yi is a set of outcomes (e.g. respondent’s labor supply)
measured twelve months after family admission to the program. Groupj is made up of
three indicator variables for the three experimental groups: the control group (j = 1),
the group receiving the conditional cash transfer (j = 2), and the group receiving
the unconditional cash transfer (j = 3). The vector xi contains information at the
family level such as family income (ISEE), number of household members, number
of household members under age 18, age of the youngest household member, and
citizenship. To account for the possible effect induced by each randomization, we
always include randomization group fixed effects in the model (α0,i). εi is the error
term of the model. All the models will be estimated as linear probability models.
4.2 Baseline Results: The Whole Sample
We start by analyzing the whole sample. In this section, we only look at the effect of
the intervention for the CCT and UCT groups as compared to the control group. In
the next section, we explore the possible effects induced by the information provided
in the specific courses attended by CCT families.12
Cash transfers potentially affect labor market opportunities, especially when the
income support is provided along with information and mentoring aimed at improving
job-seeking skills. On the one hand positive income shocks make it more affordable
for individuals to take training programs or to attend courses to improve individual
skills. On the other hand, courses such as the ones attended by the CCT group poten-
tially improve individuals’ information about job-seeking practices and simultaneously
contribute to the development of an individual’s network. Networks and social relation-
ships are crucial for enhancing labor market opportunities, especially for individuals
at risk of marginalization.
Tables 5 and 6 display the analysis of labor market outcomes of respondents and
their partners, respectively. We start with the analysis of activities related to job-
seeking and training by focusing on the following outcomes: having a written CV
(column 1), attending of an Italian course in the last year (column 2), attending a
computer course in the last year (column 3), and attending a professional course in the
last year (column 4). Then we consider actual labor supply by looking at the individual
labor supply in the previous week (at least one hour worked, column 5), the number
of days (column 6), and hours (column 7), and the corresponding wage (column 8).
12The analysis of the effect by course is the scope of the next subsection.
14

Finally, we collect information about working with a regular contract (column 9) and
being actively looking for a job in the previous two weeks (column 10).13 All the
outcomes except days worked, hours worked, and wage are indicator variables.
We analyze survey respondents, namely the mother of the youngest child in the
household. Although a very high share of the control group (90 percent) reports to have
a written CV, the CCT intervention increased the likelihood having a CV with respect
to the control group by six percentage points The effect is statistically insignificant
but larger in magnitude with respect to the one observed for the UCT group (+1
percentage point).14 Any relevant effects arise for the cases of Italian language and
professional courses. Individuals in the CCT groups are significantly more likely than
the control group (+4 percentage points) to enroll in computer courses.
With respect to actual labor market outcomes, the effect of the intervention on
hours worked in the previous week is statistically indistinguishable from zero for both
the CCT and the UCT groups. Respondents in our sample did not react to the inter-
vention in terms of individual labor supply. Similarly, days or hours worked and wage
do not display any significant pattern. Interestingly, the CCT group appears as nine
percentage points (statistically insignificant) less likely to have a regular employment
contract. Finally, despite a zero-effect on employment status, the last column of the
table shows a sizable and significant effect induced by the intervention on job-seeking
activities. Survey respondents who were in the CCT group increased job-seeking ac-
tivities by 22 percentage points compared to the control group (mean = 53 percent).
The analysis of partners, namely the male figure in the household, in Table 6
conveys a different message. While the effect on having a CV is similar to the one
for respondents, partners in the CCT group are significantly more likely to engage in
Italian courses (6 percentage points) or computer courses (5 percentage points). The
effects turns statistically insignificant for professional courses.15
In terms of labor market outcomes, the CCT group outperforms both the UCT
group and the CG. Individuals in the CCT group are nine percentage points more
likely to have worked at least one hour in the previous week than individuals in the
control group. Moreover, they worked on average half day more than the CG, while the
13We only analyze active job-searching activities for respondents with a partner working less than20 hours per week. We make this choice to consider only the group of respondents from householdscharacterized by low levels of family members’ labor supply.
14The p-value for the difference between the two treated groups is 0.20.15It is important to note that the UCT group’s performance for these outcomes is never different
from the CCT group’s performance in a statistical sense.
15
coefficient for the UCT group is 0.15. This result is similar to the one for hours worked:
the CCT group worked on average 3.5 additional hours with respect to the CG (mean
= 22.75 hours) in the week preceding the survey. For both days and hours worked,
the effect for the CCT group is statistically different from the effect for the UCT
group, with a p-value of six percent. Hourly wage seems marginally affected by the
intervention as both the CCT and the UCT groups report an increase in hourly wage.
However, measurement error in the wage data does not allow for conclusive analysis.
Finally, no remarkable effect is detected for the probability of having a regular job or
being involved in active job-seeking.
One of the aims of the intervention was to improve households’ economic conditions.
Because households in our sample face serious economic constraints, the implementa-
tion of policies to tackle poverty is crucially important. We now analyze a set of
outcomes related to family financial and economic conditions. In Table 7, we estimate
the impact of the intervention on: problems in the last year with the payment of utility
bills (column 1), the need for financial help from people outside the household (col-
umn 2), the probability of collecting some savings during the last year (column 3),
the knowledge and use of expenditures diaries (columns 4 and 5), the use of shopping
lists (column 6), problems in the last twelve months in affording expenses related to
medicine (column 7), and having home internet (column 8). All the outcomes are
constructed as indicator variables.
The analysis of problems paying utility bills highlights the financial and economic
constraints experienced by families in our sample. Within the control group, around
90 percent of families experienced problems paying their utility bills in the last twelve
months. The CCT intervention seems effective in mitigating these problems: fami-
lies in this group report a statistically significant 7-percentage-point decrease in the
probability of experiencing problems paying utility bills. The UCT group registers a
statistically insignificant 4-percentage-point drop in problems paying utility bills com-
pared to the control group. A similar result emerges when we analyze the need for
financial help from others. On average, the CCT intervention negatively affects the
probability (-7 percentage points compared to the control group) of having been de-
pendent on financial help from individuals outside the household during the previous
year. Families in the CCT group perform significantly better than families in both the
control and the UCT groups (p-value = 0.00). The results on savings continue the pat-
tern: the CCT group outperforms—in terms of statistical significance for the difference
16
among coefficients—both the UCT (p-value = 0.03) and the control (p-value = 0.00)
groups. CCT families are 8 percentage points more likely to have saved money in the
previous year. The UCT group displays a statistically insignificant 3-percentage-point
increase in the probability of savings compared to the control group.
Regarding for expenditure diaries, the CCT group is more likely to be familiar
with an expenditure diary and how it can help in managing family resources. The
result is hardly surprising given that the that courses attended by a group of CCT
families covered the topic of expenditure diaries. However, knowledge of expenditure
diaries does not necessarily result in their use. The three groups also display similar
performance when it comes to using shopping lists and being able to afford of expenses
related to medicine. On the contrary, families in the CCT group are significantly more
likely to have internet at home than families in both the control and the UCT groups.16
Our intervention also sought to affect other areas such as nutrition and, more
generally, parenting practices. Food quality and quantity depend on family economic
resources. The income effect induced by the cash transfer, as well as the information
provided during the courses, may generate changes in family consumption of goods
such as food. Eating habits are important proxies for family well-being. Correct,
complete, and diversified nutrition is extremely important both for the health of both
adults and children. This is particularly true for very young children such as the ones
treated in our sample. Poor nutrition may arise as a consequence of (at least) two
different factors: economic constraints and lack of information about the importance
of healthy eating habits. Our intervention increased family economic resources and
provided, through the parenting course, mentoring and extra information about the
importance of healthy eating habits. We report food consumption patterns in Table
8, columns (1) to (6), specifically, consumption of fish (column 1), meat (column 2),
vegetables (column 3), fruit (whole family or children only, columns 4 and 5), and
desserts (column 6). All consumption is expressed in meals per week.
The results show that the CCT group significantly increased consumption of both
meat and fish by around 0.3 meals per week. The pure income effect due to the
cash transfer also appears with the increase in food consumption for the UCT group.
However, the coefficient for the UCT group is never statistically significant as compared
to the coefficient for the control group. There is no significant pattern for vegetable
consumption, but we observe a significant increase in fruit consumption (+0.5 meals per
16For home internet, the UCT families display a positive but statistically insignificant effect of +3percentage points compared to the control group.
17

week) for families in the CCT group and a statistically insignificant effect (+0.14 meals
per week) for the UCT group. For desserts, we only detect a change in consumption
for the CCT group: the intervention produces an increase by 0.3 meals per week.
The estimates on eating habits indicate the importance of the income shock com-
bined with information in shaping food consumption. Except for vegetable consump-
tion (column 3), the CCT group shows a significant increase in weekly consumption of
all other food items compared to the control group. We will further discuss this point
in the next section with respect to the analysis regarding course attendance.
Our intervention also focused on parenting practices by analyzing possible im-
provements in the parent-child relationship through the parent’s ability to interpret
children’s needs (column 7), the parent’s reading with the child (column 8), outdoor
playing (column 9), visits to museums (column 10), and extra activities potentially
fostering children’s development and social interactions (column 11).
Unlike the results regarding nutrition practices, the intervention effect on parenting
practices is negligible. Except for a statistically insignificant increase for both the CCT
and UCT groups in the probability of visiting museums, no remarkable effect appears
for parenting practices. In general, the intervention was ineffective, at least in the
whole sample, in changing the parenting practices we considered. One interpretation
is that it takes longer to change habits related to family attitudes. Moreover, most
parents in our sample are immigrants from countries with strong differences in their
approach to early childhood education and care.
In sum, we analyzed the whole sample to study the intervention effect, independent
of assignment to a specific course, on a wide set of outcomes. In general, the pure
income effect induced by the UCT seems to have barely affected outcomes for the
dimensions we considered. However, the cash transfer combined with a set of courses
(income plus information shock) appears effective in incentivizing the labor supply of
the male partners in the household, although the effects on the mothers were negligible.
The combined intervention also reduces financial problems and improves the quality
and quantity of food consumption.
4.3 Estimates on Participants in Specific Courses
Up to now, we have considered the CCT group as a whole. However, in our experimen-
tal design, each family in the CCT group was assigned to two specific courses that they
had to attend to receive the cash transfer. Participation in the specific courses has the
18

potentially to affect different outcomes. In this section, we verify this hypothesis by
replicating the analysis on the subsamples of families assigned to a specific course.
Instead of the whole CCT sample, we will only consider those families assigned to
a specific course. As the control and the UCT groups were not assigned to any course,
we replicate the algorithm used by the Ufficio Pio to simulate course assignment for
families in those groups. Then, in the analysis by courses, we will only consider families
in the UCT and control groups that would have attended the same courses as families
in the CCT group.
Moreover, in order to show the specific-course effect, we will also show the effects
(on the same outcomes) for individuals assigned to different courses that covered dif-
ferent topics. This analysis is particularly important as it allows us to understand
whether the intervention effects are particular to the topics covered by the specific
courses or are induced by general effects related to course attendance such as social
inclusion, networking, or exposure to general information.17
Job-seeking (JSC) and reconciliation work and family (RC) We start with
the analysis of the effect of the courses attended by the majority of families, namely
the job-seeking (JSC) and the reconciliation (RC) courses. As the topics covered by
these two courses are similar, we consider them together. These courses were assigned
to 93 percent of the sample.18 We find that all the main insights obtained with the
whole sample analysis are remarkably similar to those of the course-specific analysis.
We report respondents’ outcomes in Table 9. Assignment to the job-seeking and
reconciliation courses positively affects the probability of having a written CV and of
attending computer courses; no effect is detected for attendance at Italian language
and professional courses. The effect is never statistically significant for the UCT group
when compared to the control group.
Labor market outcomes pinpoint an interesting pattern. While the effect on the
labor supply of the male figure in the household is sizable both in the whole sample
and in the subsample of course takers (below), no significant effect arises for women’s
17For the courses dealing with job-seeking activities and work and family reconciliation (JSC andRC), we will not show the analysis for individuals assigned to courses other than those two courses.This choice is driven by the high share of families assigned to these two courses (93 percent) thatmakes sample sizes for families in the other courses too small to allow for a credible econometricanalysis.
18Out of 1,157 families who took the final survey, 1,071 attended (or would have been assigned forthe case of the UCT and the control groups) one of these two courses.
19

labor supply either in the CCT group or the UCT group. Additionally, the analysis
of job regularity and job-seeking activities highlights that women in the CCT group
are more likely to be active in the job-search process (+22 percentage points compared
to the control group) and to end up in informal jobs (+7 percentage points, which is
statistically insignificant).
The latter results, especially when we consider that the UCT group does not display
any pattern when we consider regular jobs, , suggest an intriguing effect of the courses
undertaken by women in the CCT group. These courses, by fostering skills, recognizing
the importance of working, and improving individual information sets and networks,
are likely to push women to enter the labor force. However, it appears that the labor
market faced by these women fails to offer good job opportunities.19 The analysis shoes
that these difficulties translate into a higher share of women opting for informal jobs.
We analyze partners’ results in Table 10. Attendance at the job-seeking and rec-
onciliation courses induces a 6-percentage-point (statistically insignificant) increase
compared to the control group in partners’ probability of having a written CV. At-
tendance at those courses amounts to a three percentage point increase for the UCT
group. Partners in the CCT group are significantly more likely to enroll in courses
(e.g. Italian, computer, etc.) that could increase their labor market opportunities.20
In terms of actual labor market outcomes, partners in the CCT group are more
likely to work as compared to the other experiment groups. On average, they are eight
percentage points more likely than the control group to have worked in the previous
week, and they worked half day more (around 3.5 extra hours) in the week preced-
ing the survey. Estimates for labor supply are significantly larger than the estimates
for the pure income effect observed in the UCT group. We only find significant im-
pacts in the probability of having a regular contract or in terms of job-seeking activities.
Use of money (MC) In Table 11, we analyze the effect of the use of money course.
The analysis in panel (a) compares the CCT individuals assigned to the money use
course with those in the UCT and control groups that would have been assigned (by
the algorithm) to this course if they had been part of the CCT group. In panel (b),
19Remember, that the majority of these women have little education and lack Italian citizenship.These background characteristics considerably restrict labor market options, especially for womenwith limited knowledge of the Italian language.
20It is important to note that, although different in size, the comparison between the outcomes ofthe CCT and the UCT groups does not display any statistically significant difference between the twogroups.
20

we replicate the analysis for individuals assigned to other courses.
Improvements in problems with paying utility bills highlights the existence of a pure
income effect, but the effect related to this specific course seems negligible. Indeed,
during the intervention period, both the CCT and the UCT groups experienced a
decrease by around seven percentage points in problems paying bills when compared
to the control group. The effect is the same (8 percentage points) for the group of
families attending other courses. On the contrary, the course about money use was
effective with respect to external financial help and savings. The CCT group decreased
the need for financial help from others by seven percentage points, while the UCT group
reported a value similar to that of the control group.21 In terms of savings, the income
effect on the probability of reporting some savings in the previous year amounts to a
5-percentage-point increase for the control group. The combination of the income effect
and attendance at the money-use course doubles this effect by reaching total increase of
ten percentage points. The CCT-effect for families assigned to other courses amounts
to only six percentage points.
Families in the CCT group are also relatively more likely than those in the other
groups to know how to use an expenditure diary (column 4), an important tool for
managing and monitoring economic and financial resources. Families assigned to other
courses do not display any effect. However, simple knowledge of this tool does not
necessarily imply its use. Finally, the analysis of the use of shopping lists suggests
an interesting underlying pattern: individuals in the UCT group, because of the posi-
tive income shock induced by the cash transfer, are less prone to using shopping lists
(-6 percentage points compared to the control group). In contrast, the CCT group,
who was exposed to the same income shock along with mentoring and information,
experiences a statistically insignificant increase of three percentage points in the use
of shopping lists compared to the control group. We detect a negative impact of the
intervention on the use of shopping lists for families assigned to other courses.
Parenting (PC) Table 12 shows the results for parenting practices and food con-
sumption. Results about eating habits pinpoint the importance of the income shock in
combination with information. Except for vegetable consumption (column 3), partic-
ipation in the CCT group explains a significant increase in weekly consumption of all
21Notice that the effect for the CCT group is statistically indistinguishable when compared to thecontrol group, although it is statistically different when compared to the effect for the UCT group(p-value = 0.07).
21

investigated food items compared to the control group. For example, families in the
control group increase fruit consumption by 0.65 meals per week when compared to the
control group.22 The eating habits analysis also suggests the existence of pure income
effects. The UCT group tends to increase meat and desserts consumption in response
to the income shock. These results call highlight the importance of information and
mentoring. While food consumption also increases in families unexposed to new infor-
mation (the UCT group), this increase is only visible for relatively less-healthy food
(meat and desserts). On the contrary, any detectable effect for the UCT group arises
for other analyzed food items (fish, vegetables, and fruit).
The importance of providing information is also evidenced when we analyze fam-
ilies’ attendance at other courses. Indeed, while effects similar to those for families
attending the parenting course are found for fish and meat consumption in this sub-
sample, vegetable and fruit consumption are unaffected by attendance at courses not
specifically dealing with healthy eating habits. This evidence highlights the importance
(at least in certain realms) of the combination of cash transfers and mentoring.
The effect of the intervention on parenting practices is similar to the one observed
for the whole sample. In general, the material covered during the course seems to
only marginally change parental behavior. In particular, although all coefficients are
statistically insignificant, families attending the parenting course as part of the CCT
intervention seem to have improved their relationship with their child and to have
increased activities such as outdoor playing or museum visits. On the contrary, no
sizable effects stem for families assigned to other courses within the CCT intervention.
Estimates precision and effect-sizes only allow for an interpretation of results about
parenting practices as suggestive of possible underlying patterns. Further research on
this point would provide more conclusive insights.
5 Positive Response Bias
Families selected to receive treatments such as cash transfers and mentoring courses
may have incentives to misreport socially desirable behaviors. This threat is par-
ticularly real for individuals assigned to the CCT group who attended courses that
mentored them about good practices and habits. In our survey, we asked families a set
of questions about highly desirable social behaviors that were related to the material
22Fruit is consumed by the control group, on average, at four meals per week.
22

covered by the courses. We exploit some of these questions as a subset of outcomes to
test the reliability of our findings.
In column (1), we study families’ participation in public events and initiatives orga-
nized by Turin. In column (2), we measure interest in news (watching television news or
reading newspapers on a frequent basis), while in columns (3) and (4), we analyze chil-
dren friends’ visits at home and children’s visits to friends’ homes. Finally, in column
(5), we focus on recent visits to the pediatrician. All these outcomes may be defined as
highly socially desirable as they relate to family involvement in the surrounding social
environment and to attempts to provide children with the best opportunities for their
future social development and health. None of the selected outcomes is affected by the
intervention. Neither the CCT group nor the UCT group display any significant or siz-
able effects on outcome variables. This result suggests the absence of positive response
bias as these outcomes (e.g. the importance of periodic visits to the pediatrician) were
extensively covered during the courses. Although these variables are selected based on
their high level of social desirability, there is no detectable impact of the intervention.
6 Conclusions
The objective of this study is to evaluate the introduction of conditionality into a pre-
existing unconditional cash transfer program. Our research contributes to the literature
in several ways. It evaluates a CCT program conducted in a developed country in
contrast to most studies, which have analyzed programs in developing countries.
Second, our program is multidimensional. It not only aims to address issues of edu-
cation and health like most programs but also seeks to increase households’ knowledge
about the use of money, job searching, reconciliation of work and family, nutrition,
and childcare. Third, different from other experiments, we implement and evaluate
both the impact of CCT and UCT, which allows us to analyze which approach is more
effective in reducing poverty and material hardship and in producing better family
outcomes.
Using a randomized controlled trial, we find that the conditional cash transfer inter-
vention appears to be significantly more effective than cash transfer alone in changing
households’ behavior in several dimensions, including fostering integration and social
inclusion. CCT families search more actively for labor market opportunities and work
more and with more regularity than the UCT and the control groups. They also save
23
more money and have healthier eating habits.
To consider the specific-course effect, we also show the impacts of the intervention
(on the same outcomes) for individuals assigned to different courses that cover different
topics. We find that the effects for the CCT group are stronger than the effects for the
UCT and the control groups.
Our empirical results show that the provision of the unconditional cash transfer has
only a weak income effect and marginally increases household expenditures on normal
goods, while CCT transfers conditional on acquiring information increase expenditures
on normal goods and induce a significant change in households’ well-being. These
results tend to confirm the assumptions that families from disadvantaged backgrounds
are not only limited by financial constraints that reduce their ability to save or invest
in education and health, but they also lack information regarding the returns to these
investments, which may produce an underinvestment in productive outcomes.
References
[1] Aber, L. and L. B. Rawlings, 2011. “North-South Knowledge Sharing on Incentive-
Based Conditional Cash Transfer Programs,” Social Protection and Jobs Discus-
sion Papers 11101, Washington, DC: World Bank.
[2] Attanasio O., E. Battistin and A. Mesnard, 2012. “Food and Cash Transfers:
Evidence from Colombia,” Economic Journal 122 (559), 92–124.
[3] Attanasio O., V. Oppedisano and M. Vera-Hernandez, 2015. “Should Cash Trans-
fers Be Conditional? Conditionality, Preventive Care, and Health Outcomes,”
American Economic Journal: Applied Economics 7 (2), 35–52.
[4] Baez, J. E. and A. Camacho, 2011. “Assessing the Long-Term Effects of Con-
ditional Cash Transfers on Human Capital: Evidence From Colombia,” Policy
Research working paper 5681. Washington, DC: World Bank.
[5] Baird, S., F.H.G. Ferreira, B. Ozler and M. Woolcock, 2014. “Conditional, Un-
conditional and Everything in Between: A Systematic Review of the Effects of
Cash Transfer Programmes on Schooling Outcomes,” Journal of Development Ef-
fectiveness 6 (1), 1–43.
24
[6] Baird S., C. McIntosh, and B. Ozler, 2011. “Cash or Condition? Evidence From a
Cash Transfer Experiment,” Quarterly Journal of Economics 126 (4), 1709–1753.
[7] Barham T., K. Macours and J. Maluccio, 2017. “Are Conditional Cash Transfers
Fulfilling Their Promise? Schooling, Learning, and Earnings After 10 Years,”
CEPR Discussion Papers 11937.
[8] Behrman J. R., J. Gallardo-Garcıa, S.W. Parker, P. E. Todd, and V. Velez-
Grajales, 2012. “Are Conditional Cash Transfers Effective in Urban Areas? Evi-
dence From Mexico,” Education Economics 20 (3), 233–259.
[9] Behrman J., S. W. Parker and P. E. Todd, 2011. “Do Conditional Cash Trans-
fers for Schooling Generate Lasting Benefits? A Five-Year Follow-Up of PRO-
GRESA/Oportunidades,” Journal of Human Resources 46(1), 93–122.
[10] Cunha F., I. Elo and J. Culhane, 2013. “Eliciting Maternal Expectations About
the Technology of Cognitive Skill Formation” NBER Working Paper 19144.
[11] Del Boca D., C. Flinn and M. Wiswall, 2016. “Transfers to Households with
Children and Child Development,” Economic Journal 126 (596), F136–F183.
[12] Doyle O., 2013. “Breaking the Cycle of Deprivation: An Experimental Evaluation
of an Early Childhood Intervention,” Journal of the Statistical and Social Inquiry
XLI, 92–111.
[13] Elango S., J. L. Garcıa, J. J. Heckman and A. Hojman, 2015. “Early Childhood
Education,” NBER Working Paper 21766.
[14] Fernald L. C., 2013. “Promise, and Risks, of Conditional Cash Transfer Pro-
grammes,” Lancet 382, 7–9.
[15] Fiszbein A., and N. Schady, 2009. “Conditional Cash Transfers: Reducing Present
and Future Poverty,” Washington, DC: World Bank.
[16] Gertler P., J. J. Heckman, R. Pinto, A. Zanolini, C. Vermeersch, S. Walker, S.
M. Chang and S. Grantham-McGregor, 2013. “Labor Market Returns to Early
Childhood Stimulation: A 20-Year Follow-Up to an Experimental Intervention in
Jamaica,” NBER Working Paper 19185.
[17] ISTAT, 2017. “La Poverta in Italia.”
25

[18] Miller C., J. Riccio, N. Verma, S. Nunez, N. Dechausay and E. Yang, 2015. “Test-
ing a Conditional Cash Transfer Program in the U.S.: The Effects of the Family
Rewards Program in New York City,” IZA Journal of Labor Policy 4 (11).
[19] Morris P., L. Aber, S. Wolf and J. Berg, 2012. “Using Incentives to Change How
Teenagers Spend Their Time: The Effect of New York Conditional Cash Transfer,”
New York MDRC.
[20] Mullainathan S. and E. Shafir, 2013. “Scarcity: Why Having Too Little Means So
Much,” Henry Holt and Company, Penguin UK.
[21] Paxson C. and N. Schady, 2010. “Does Money Matter? The Effects of Cash
Transfers on Child Development in Rural Ecuador,” Economic Development and
Cultural Change 59, 187–229.
[22] Riccio J., Dechausay N., Miller C., Nunez C., Verma N. and E. Yang, 2013. “Condi-
tional Cash Transfers in New York City The Continuing Story of the Opportunity
NYC-Family Rewards Demonstration,” MDRC NYC.
[23] Saavedra S. and J. Garcia, 2017. “Educational Impacts and Cost-Effectiveness of
Conditional Cash Transfer Programs in Developing Countries: A Meta-Analysis,”
Review of Educational Research 87 (5), 921–965.
[24] Schady N. and M. C. Araujo, 2008. “Cash Transfers, Conditions, and School
Enrollment in Ecuador,” Economıa: Journal of the Latin American and Caribbean
Economic Association 8 (2), 43–77.
[25] Wolpin K. and P. E. Todd, 2006. “Assessing the Impact of a School Subsidy
Program in Mexico: Using a Social Experiment to Validate a Dynamic Behavioral
Model of Child Schooling and Fertility,” American Economic Review 96(5), 1384–
1417.
26

Table 1: Summary Statistics
Mean St. Dev.(1) (2)
In a couple 0.65 0.47Age respondent 35.0 6.775Age partner 41.4 7.78No Italian citizenship 0.72 0.45Number of children 2.09 1.10Age youngest child 2.96 2.49
Secondary education respondent 0.39 0.49Education in Italy respondent 0.36 0.48Secondary education partner 0.41 0.49Education in Italy partner 0.28 0.45Respondent in good health 0.58 0.49Partner in good health 0.45 0.50
In a couple, both work 0.03 0.17In a couple, one works 0.46 0.50In a couple, no one works 0.51 0.50Single parent works 0.27 0.45
Family income (ISEE, in e) 919 1,210
Observations 1,587
Notes: This table shows the summary statistics of the initialsample.
27

Table 2: Balancing Tests Across Treatment Groups
CCT UCT CG(1) (2) (3)
In a couple 0.67 0.64 0.64Age respondent 34.9 35.0 35.2Age partner 41.6 41.5 41.2No Italian citizenship 0.71 0.73 0.70Number of children 2.09 2.12 2.06Age youngest child 2.94 2.98 2.96
Secondary education respondent 0.40 0.38 0.38Education in Italy respondent 0.35 0.37 0.34Secondary education partner 0.42 0.41 0.39Education in Italy partner 0.26 0.30 0.29Respondent in good health 0.58 0.56 0.59Partner in good health 0.45 0.45 0.45
In a couple, both work 0.02 0.03 0.03In a couple, one works 0.47 0.44 0.45In a couple, no one works 0.50 0.52 0.52Single parent works 0.26 0.24 0.31
Family income (ISEE, in e) 893 907 956
Observations 533 533 521
Notes: This table shows the summary statistics of the initial sam-ple by treatment groups. CCT stands for conditional cash transfergroup, UCT stands for unconditional cash transfer group, and CGstands for control group. *, **, *** indicate statistical signifi-cance for difference in average values with respect to the CG atthe 10%, 5%, and 1% levels, respectively. [∗], [∗∗], [∗∗∗] indicatestatistical significance for difference in average values between theCCT group and the UCT group at the 10%, 5%, and 1% levels,respectively.
28
Table 3: Balancing Tests Across Treatment Groups After Participation
CCT UCT CG(1) (2) (3)
In a couple 0.66 0.65 0.63Age respondent 35.3 34.9 35.4Age partner 41.7 41.1 41.3No Italian citizenship 0.75 0.75 0.71Number of children 2.02 2.09 2.06Age youngest child 2.91 3.11 2.93
Secondary education respondent 0.41 0.39 0.37Education in Italy respondent 0.36 0.37 0.34Secondary education partner 0.41 0.40 0.39Education in Italy partner 0.24 0.30 0.30Respondent in good health 0.62 0.56 0.61Partner in good health 0.40 0.43 0.42
In a couple, both work 0.03 0.03 0.03In a couple, one works 0.47 0.47 0.44In a couple, no one works 0.50 0.49 0.53Single parent works 0.31 0.25 0.31
Family income (ISEE, in e) 850 910 957
Observations 376 396 383
Notes: This table shows the summary statistics of the sample tak-ing the final interview by treatment groups. CCT stands for con-ditional cash transfer group, UCT stands for unconditional cashtransfer group, and CG stays for control group. *, **, *** indicatestatistical significance for difference in average values with respectto the CG at the 10%, 5%, and 1% levels, respectively. [∗], [∗∗],[∗∗∗] indicate statistical significance for difference in average valuesbetween the CCT group and the UCT group at the 10%, 5%, and1% levels, respectively.
29
Table 4: The Determinants of Attrition
Dep. var.:Pr(Attrition)
Logit(1)
In a couple 0.038(0.154)
Someone works -0.156(0.130)
Number of children 0.064(0.057)
Age youngest child -0.028(0.018)
Respondent in good health -0.136(0.134)
No Italian citizenship -0.530***(0.136)
Family income (in e1,000) 0.041(0.051)
Observations 1,518
Notes: This table shows the estimates for the possibledeterminants of attrition in our final sample. Dependentvariable: Probability of attrition. Column (1) reportsthe estimates of a logistic regression model. Income ismeasured in e1,000. Standard errors are reported inparentheses. *, **, *** indicate statistical significanceat the 10%, 5%, and 1% levels, respectively.
30

Tab
le5:
Job
-See
kin
gan
dW
ork:
Res
pon
den
t,W
hol
eSam
ple
Ital
ian
Com
pute
rP
rof.
Wor
kD
ays
Hou
rsH
ourl
yR
egula
rL
ook
for
CV
cours
eco
urs
eco
urs
eon
ehou
rw
ork
wor
kw
age
job
job
(1)
(2)
(3)
(4)
(5)
(6)
(7)
(8)
(9)
(10)
CC
T0.
060.
030.
04**
0.01
-0.0
2-0
.10
-0.4
6-0
.34
-0.0
90.
22**
*(0
.03)
(0.0
3)(0
.02)
(0.0
3)(0
.03)
(0.1
5)(0
.80)
(0.4
2)(0
.06)
(0.0
8)U
CT
0.01
-0.0
00.
02-0
.02
-0.0
5-0
.25*
-0.6
5-0
.14
-0.0
30.
11(0
.03)
(0.0
3)(0
.02)
(0.0
2)(0
.03)
(0.1
4)(0
.77)
(0.5
4)(0
.06)
(0.0
8)
Mea
nC
G0.
900.
090.
010.
130.
612.
3710
.70
3.64
0.48
0.53
P-v
al.(
CC
T-U
CT
)0.
200.
320.
190.
290.
420.
290.
810.
720.
350.
21
Sam
ple
Whol
eW
hol
eW
hol
eW
hol
eW
hol
eW
hol
eW
hol
eW
hol
eW
hol
eW
hol
eO
bse
rvat
ions
1,13
11,
132
1,13
01,
130
1,13
41,
135
1,13
51,
030
367
255
Not
es:
Th
ista
ble
show
sth
ees
tim
ates
for
the
effec
tof
the
CC
Tan
dth
eU
CT
(wit
hre
spec
tto
the
contr
ol
gro
up
).D
epen
den
tva
riab
les
(all
vari
able
sre
fer
toth
ere
spon
den
t):
wri
tten
CV
(in
dic
ato
r,co
l.1),
att
end
an
ceat
an
Itali
an
cou
rse
inth
ela
st12
month
s(i
nd
icato
r,co
l.2)
,at
ten
dan
ceat
aco
mp
ute
rco
urs
ein
the
last
12
month
s(i
nd
icato
r,co
l.3),
att
end
an
ceat
ap
rofe
ssio
nal
cou
rse
inth
ela
st12
month
s(i
nd
icat
or,
col.
4),
wor
ked
atle
ast
one
hou
rin
the
pre
vio
us
wee
k(i
nd
icato
r,co
l.5),
nu
mb
erof
day
sw
ork
edin
the
pre
vio
us
wee
k(c
ol.
6),
nu
mb
erof
hou
rsw
orke
din
the
pre
vio
us
wee
k(c
ol.
7),
hou
rly
wage
(col.
8),
emp
loye
dw
ith
are
gu
lar
contr
act
(in
dic
ato
r,co
l.9),
job
-sea
rch
acti
vit
ies
inth
ela
sttw
ow
eeks
(in
dic
ator
,co
l.10).
Colu
mn
(10)
on
lyin
clu
des
resp
on
den
tsw
ith
part
ner
sw
ho
work
edle
ssth
an
20
hou
rsin
the
pre
vio
us
wee
k.
All
the
spec
ifica
tion
sare
lin
ear
pro
bab
ilit
ym
od
els.
All
mod
els
incl
ud
eco
ntr
ols
for
hou
seh
old
inco
me,
nu
mb
erof
hou
seh
old
mem
ber
s,num
ber
ofh
ouse
hol
dm
emb
ers
un
der
age
18,
age
of
the
you
nges
th
ouse
hold
mem
ber
,an
dci
tize
nsh
ip.
All
mod
els
als
oin
clu
de
ran
dom
izat
ion
grou
pfi
xed
effec
ts.
Sta
nd
ard
erro
rsare
rob
ust
toh
eter
osk
edast
icit
yre
port
edin
pare
nth
eses
.*,
**,
***
ind
icate
stat
isti
cal
sign
ifica
nce
atth
e10
%,
5%,
and
1%
leve
ls,
resp
ecti
vely
.
31
Tab
le6:
Job
-See
kin
gan
dW
ork:
Par
tner
,W
hol
eSam
ple
Ital
ian
Com
pute
rP
rof.
Wor
kD
ays
Hou
rsH
ourl
yR
egula
rL
ook
for
CV
cours
eco
urs
eco
urs
eon
ehou
rw
ork
wor
kw
age
job
job
(1)
(2)
(3)
(4)
(5)
(6)
(7)
(8)
(9)
(10)
CC
T0.
050.
06*
0.05
**0.
050.
09**
0.52
***
3.54
*0.
770.
00-0
.01
(0.0
4)(0
.03)
(0.0
2)(0
.03)
(0.0
4)(0
.20)
(1.8
4)(0
.73)
(0.0
5)(0
.08)
UC
T0.
020.
040.
020.
020.
030.
150.
350.
530.
02-0
.03
(0.0
4)(0
.03)
(0.0
2)(0
.03)
(0.0
4)(0
.20)
(1.7
5)(0
.72)
(0.0
5)(0
.07)
Mea
nC
G0.
670.
10-0
.03
0.15
0.63
2.22
22.7
53.
190.
330.
76
P-v
al.(
CC
T-U
CT
)0.
430.
600.
330.
300.
110.
060.
060.
740.
770.
73
Sam
ple
Whol
eW
hol
eW
hol
eW
hol
eW
hol
eW
hol
eW
hol
eW
hol
eW
hol
eW
hol
eO
bse
rvat
ions
911
891
884
881
907
910
530
649
524
255
Not
es:
Th
ista
ble
show
sth
ees
tim
ates
for
the
effec
tof
the
CC
Tan
dth
eU
CT
(wit
hre
spec
tto
the
contr
ol
gro
up
).D
epen
den
tva
riab
les
(all
vari
able
sre
fer
toth
ep
artn
er):
wri
tten
CV
(in
dic
ato
r,co
l.1),
att
end
an
ceat
an
Itali
an
cou
rse
inth
ela
st12
month
s(i
nd
icato
r,co
l.2),
atte
nd
ance
ata
com
pu
ter
cou
rse
inth
ela
st12
month
s(i
nd
icato
r,co
l.3),
att
end
an
ceat
ap
rofe
ssio
nalco
urs
ein
the
last
12
month
s(i
nd
icato
r,co
l.4)
,w
orke
dat
leas
ton
eh
our
inth
ep
revio
us
wee
k(i
nd
icato
r,co
l.5),
nu
mb
erof
day
sw
ork
edin
the
pre
vio
us
wee
k(c
ol.
6),
nu
mb
erof
hou
rsw
orke
din
the
pre
vio
us
wee
k(c
ol.
7),
hou
rly
wage
(col.
8),
emp
loye
dw
ith
are
gu
lar
contr
act
(in
dic
ato
r,co
l.9),
job
-sea
rch
act
ivit
ies
inth
ela
sttw
ow
eeks
(in
dic
ator
,co
l.10
).C
olu
mn
s(1
0)
on
lyin
clu
de
part
ner
sw
ho
work
edle
ssth
an
20
hou
rsin
the
pre
vio
us
wee
k.
All
the
spec
ifica
tion
sar
eli
nea
rp
rob
abil
ity
mod
els.
All
mod
els
incl
ud
eco
ntr
ols
for
hou
seh
old
inco
me,
nu
mb
erof
hou
seh
old
mem
ber
s,nu
mb
erof
hou
seh
old
mem
ber
su
nd
erag
e18
,ag
eof
the
you
nges
th
ou
seh
old
mem
ber
,an
dci
tize
nsh
ip.
All
model
sals
oin
clu
de
ran
dom
izati
on
gro
up
fixed
effec
ts.
Sta
nd
ard
erro
rsar
ero
bu
stto
het
erosk
edast
icit
yre
port
edin
pare
nth
eses
.*,
**,
***
ind
icate
stati
stic
al
sign
ifica
nce
at
the
10%
,5%
,an
d1%
leve
ls,
resp
ecti
vel
y.
32
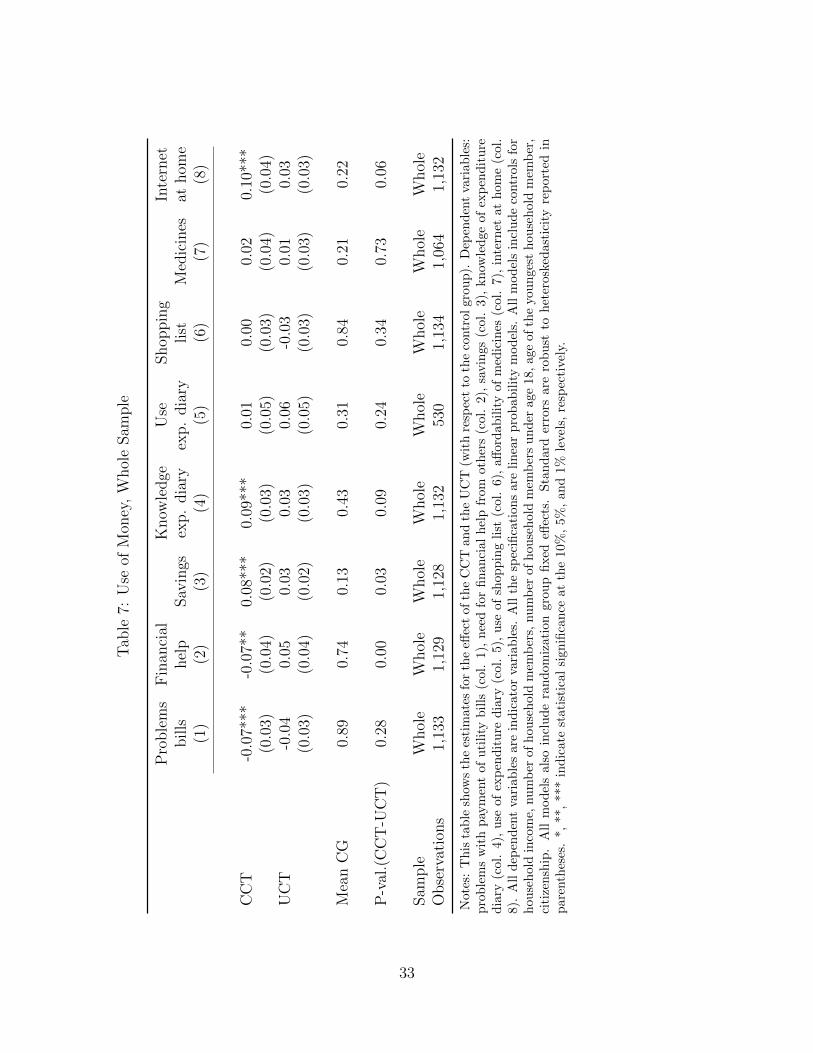
Tab
le7:
Use
ofM
oney
,W
hol
eSam
ple
Pro
ble
ms
Fin
anci
alK
now
ledge
Use
Shop
pin
gIn
tern
etbills
hel
pSav
ings
exp.
dia
ryex
p.
dia
rylist
Med
icin
esat
hom
e(1
)(2
)(3
)(4
)(5
)(6
)(7
)(8
)
CC
T-0
.07*
**-0
.07*
*0.
08**
*0.
09**
*0.
010.
000.
020.
10**
*(0
.03)
(0.0
4)(0
.02)
(0.0
3)(0
.05)
(0.0
3)(0
.04)
(0.0
4)U
CT
-0.0
40.
050.
030.
030.
06-0
.03
0.01
0.03
(0.0
3)(0
.04)
(0.0
2)(0
.03)
(0.0
5)(0
.03)
(0.0
3)(0
.03)
Mea
nC
G0.
890.
740.
130.
430.
310.
840.
210.
22
P-v
al.(
CC
T-U
CT
)0.
280.
000.
030.
090.
240.
340.
730.
06
Sam
ple
Whol
eW
hol
eW
hol
eW
hol
eW
hol
eW
hol
eW
hol
eW
hol
eO
bse
rvat
ions
1,13
31,
129
1,12
81,
132
530
1,13
41,
064
1,13
2
Not
es:
Th
ista
ble
show
sth
ees
tim
ates
for
the
effec
tof
the
CC
Tan
dth
eU
CT
(wit
hre
spec
tto
the
contr
olgro
up
).D
epen
den
tva
riab
les:
pro
ble
ms
wit
hp
aym
ent
ofu
tili
tyb
ills
(col.
1),
nee
dfo
rfi
nanci
al
hel
pfr
om
oth
ers
(col.
2),
savin
gs
(col.
3),
kn
owle
dge
of
exp
end
itu
red
iary
(col
.4)
,u
seof
exp
end
itu
red
iary
(col.
5),
use
of
shop
pin
gli
st(c
ol.
6),
aff
ord
ab
ilit
yof
med
icin
es(c
ol.
7),
inte
rnet
at
hom
e(c
ol.
8).
All
dep
end
ent
vari
able
sar
ein
dic
ator
vari
ab
les.
All
the
spec
ifica
tion
sare
linea
rp
rob
abil
ity
mod
els.
All
model
sin
clu
de
contr
ols
for
hou
seh
old
inco
me,
nu
mb
erof
hou
seh
old
mem
ber
s,nu
mb
erof
hou
seh
old
mem
ber
su
nd
erage
18,
age
of
the
you
nges
th
ou
seh
old
mem
ber
,ci
tize
nsh
ip.
All
mod
els
also
incl
ud
era
nd
om
izati
on
gro
up
fixed
effec
ts.
Sta
nd
ard
erro
rsare
rob
ust
toh
eter
osk
edast
icit
yre
port
edin
par
enth
eses
.*,
**,
***
ind
icat
est
atis
tica
lsi
gn
ifica
nce
at
the
10%
,5%
,an
d1%
leve
ls,
resp
ecti
vely
.
33
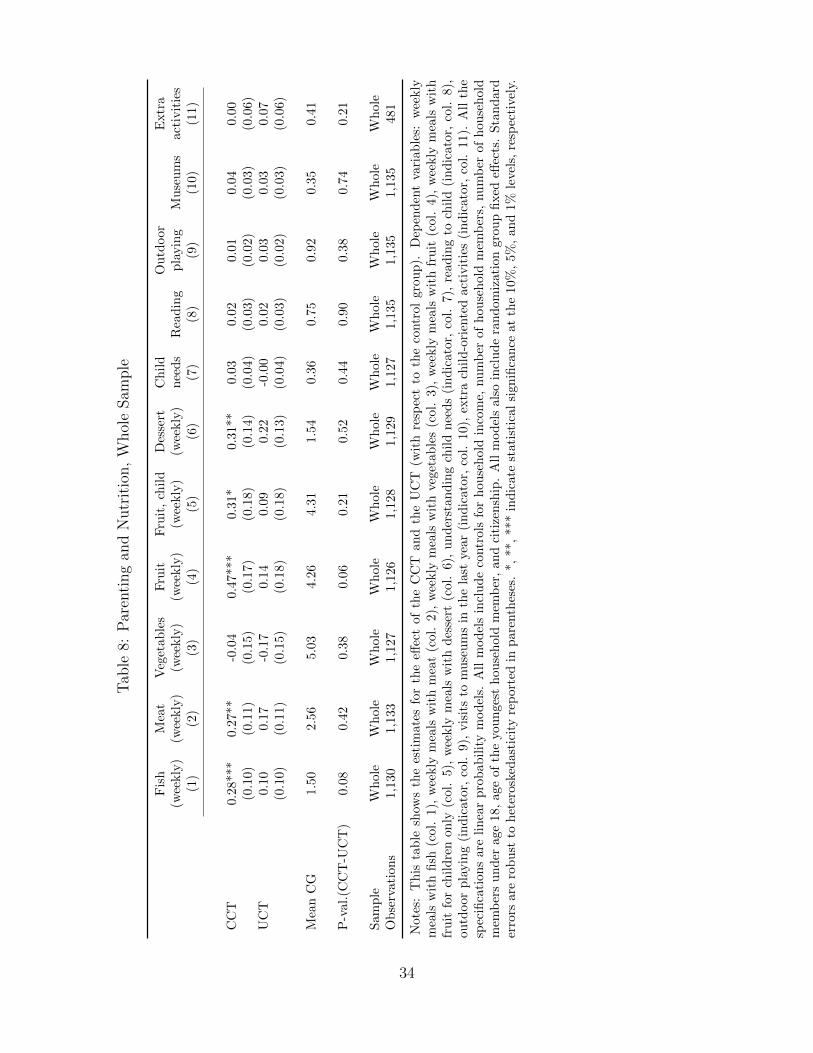
Tab
le8:
Par
enti
ng
and
Nutr
itio
n,
Whol
eSam
ple
Fis
hM
eat
Veg
etab
les
Fru
itF
ruit
,ch
ild
Des
sert
Ch
ild
Ou
tdoor
Extr
a(w
eekly
)(w
eekly
)(w
eekly
)(w
eekly
)(w
eekly
)(w
eekly
)n
eed
sR
ead
ing
pla
yin
gM
use
um
sact
ivit
ies
(1)
(2)
(3)
(4)
(5)
(6)
(7)
(8)
(9)
(10)
(11)
CC
T0.
28**
*0.
27**
-0.0
40.4
7***
0.3
1*
0.3
1**
0.0
30.0
20.0
10.0
40.0
0(0
.10)
(0.1
1)(0
.15)
(0.1
7)
(0.1
8)
(0.1
4)
(0.0
4)
(0.0
3)
(0.0
2)
(0.0
3)
(0.0
6)
UC
T0.
100.
17-0
.17
0.1
40.0
90.2
2-0
.00
0.0
20.0
30.0
30.0
7(0
.10)
(0.1
1)(0
.15)
(0.1
8)
(0.1
8)
(0.1
3)
(0.0
4)
(0.0
3)
(0.0
2)
(0.0
3)
(0.0
6)
Mea
nC
G1.
502.
565.0
34.2
64.3
11.5
40.3
60.7
50.9
20.3
50.4
1
P-v
al.(
CC
T-U
CT
)0.
080.
420.3
80.0
60.2
10.5
20.4
40.9
00.3
80.7
40.2
1
Sam
ple
Wh
ole
Whol
eW
hole
Wh
ole
Wh
ole
Wh
ole
Wh
ole
Wh
ole
Wh
ole
Wh
ole
Wh
ole
Ob
serv
atio
ns
1,13
01,
133
1,1
27
1,1
26
1,1
28
1,1
29
1,1
27
1,1
35
1,1
35
1,1
35
481
Not
es:
Th
ista
ble
show
sth
ees
tim
ates
for
the
effec
tof
the
CC
Tan
dth
eU
CT
(wit
hre
spec
tto
the
contr
ol
gro
up
).D
epen
den
tva
riab
les:
wee
kly
mea
lsw
ith
fish
(col
.1)
,w
eekly
mea
lsw
ith
mea
t(c
ol.
2),
wee
kly
mea
lsw
ith
veget
ab
les
(col.
3),
wee
kly
mea
lsw
ith
fru
it(c
ol.
4),
wee
kly
mea
lsw
ith
fru
itfo
rch
ild
ren
only
(col
.5)
,w
eekly
mea
lsw
ith
des
sert
(col.
6),
un
der
stan
din
gch
ild
nee
ds
(in
dic
ato
r,co
l.7),
read
ing
toch
ild
(in
dic
ato
r,co
l.8),
outd
oor
pla
yin
g(i
nd
icat
or,
col.
9),
vis
its
tom
use
um
sin
the
last
year
(in
dic
ato
r,co
l.10),
extr
ach
ild
-ori
ente
dact
ivit
ies
(in
dic
ato
r,co
l.11).
All
the
spec
ifica
tion
sar
eli
nea
rp
rob
abil
ity
model
s.A
llm
od
els
incl
ud
eco
ntr
ols
for
hou
seh
old
inco
me,
nu
mb
erof
hou
seh
old
mem
ber
s,nu
mb
erof
hou
seh
old
mem
ber
su
nder
age
18,
age
ofth
eyo
un
gest
hou
seh
old
mem
ber
,an
dci
tize
nsh
ip.
All
mod
els
als
oin
clu
de
ran
dom
izati
on
gro
up
fixed
effec
ts.
Sta
nd
ard
erro
rsar
ero
bu
stto
het
eros
ked
asti
city
rep
orte
din
pare
nth
eses
.*,
**,
***
ind
icate
stati
stic
al
sign
ifica
nce
at
the
10%
,5%
,an
d1%
leve
ls,
resp
ecti
vely
.
34
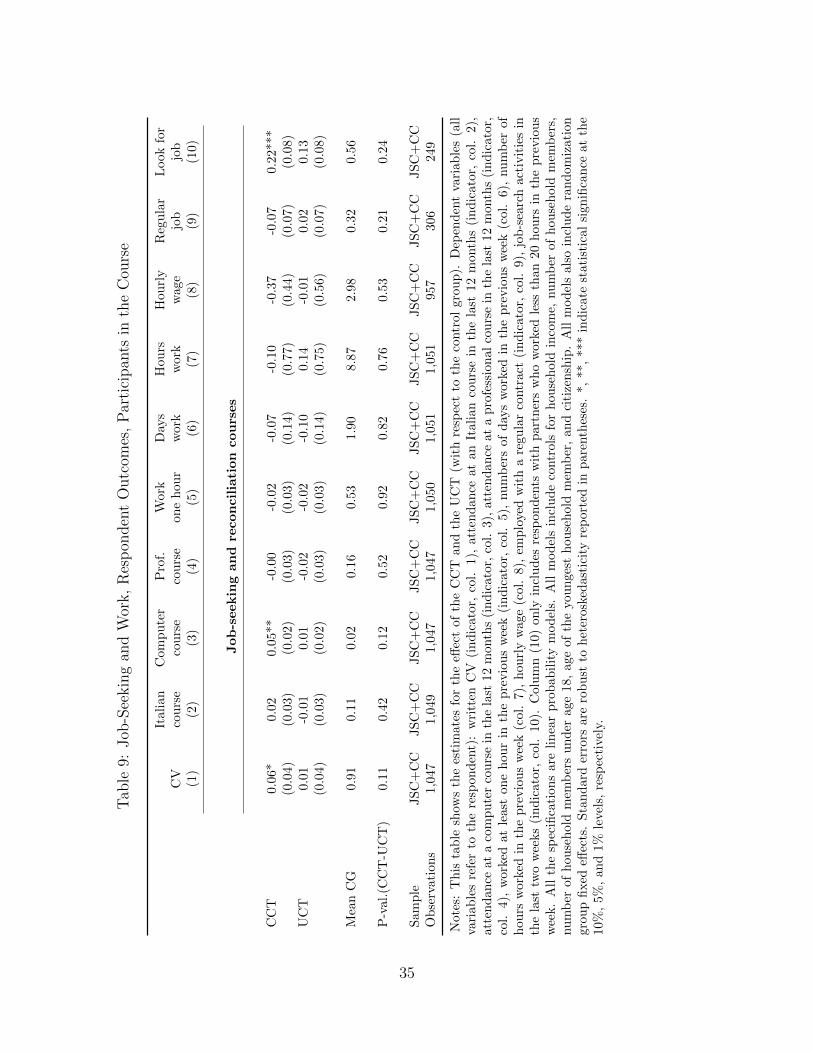
Tab
le9:
Job
-See
kin
gan
dW
ork,
Res
pon
den
tO
utc
omes
,P
arti
cipan
tsin
the
Cou
rse
Ital
ian
Com
pu
ter
Pro
f.W
ork
Day
sH
ou
rsH
ou
rly
Reg
ula
rL
ook
for
CV
cou
rse
cou
rse
cou
rse
on
eh
ou
rw
ork
work
wage
job
job
(1)
(2)
(3)
(4)
(5)
(6)
(7)
(8)
(9)
(10)
Job-seekingand
reconciliation
courses
CC
T0.
06*
0.02
0.0
5**
-0.0
0-0
.02
-0.0
7-0
.10
-0.3
7-0
.07
0.2
2***
(0.0
4)(0
.03)
(0.0
2)
(0.0
3)
(0.0
3)
(0.1
4)
(0.7
7)
(0.4
4)
(0.0
7)
(0.0
8)
UC
T0.
01-0
.01
0.0
1-0
.02
-0.0
2-0
.10
0.1
4-0
.01
0.0
20.1
3(0
.04)
(0.0
3)(0
.02)
(0.0
3)
(0.0
3)
(0.1
4)
(0.7
5)
(0.5
6)
(0.0
7)
(0.0
8)
Mea
nC
G0.
910.
110.0
20.1
60.5
31.9
08.8
72.9
80.3
20.5
6
P-v
al.(
CC
T-U
CT
)0.
110.
420.1
20.5
20.9
20.8
20.7
60.5
30.2
10.2
4
Sam
ple
JS
C+
CC
JS
C+
CC
JS
C+
CC
JS
C+
CC
JS
C+
CC
JS
C+
CC
JS
C+
CC
JS
C+
CC
JS
C+
CC
JS
C+
CC
Ob
serv
atio
ns
1,04
71,
049
1,0
47
1,0
47
1,0
50
1,0
51
1,051
957
306
249
Not
es:
Th
ista
ble
show
sth
ees
tim
ates
for
the
effec
tof
the
CC
Tan
dth
eU
CT
(wit
hre
spec
tto
the
contr
ol
gro
up
).D
epen
den
tva
riab
les
(all
vari
able
sre
fer
toth
ere
spon
den
t):
wri
tten
CV
(in
dic
ato
r,co
l.1),
att
endan
ceat
an
Itali
an
cou
rse
inth
ela
st12
month
s(i
nd
icato
r,co
l.2),
atte
nd
ance
ata
com
pu
ter
cou
rse
inth
ela
st12
month
s(i
nd
icato
r,co
l.3),
att
end
an
ceat
ap
rofe
ssio
nal
cou
rse
inth
ela
st12
month
s(i
nd
icato
r,co
l.4)
,w
orke
dat
leas
ton
eh
our
inth
ep
revio
us
wee
k(i
nd
icato
r,co
l.5),
nu
mb
ers
of
day
sw
ork
edin
the
pre
vio
us
wee
k(c
ol.
6),
nu
mb
erof
hou
rsw
orke
din
the
pre
vio
us
wee
k(c
ol.
7),
hou
rly
wage
(col.
8),
emp
loye
dw
ith
are
gu
lar
contr
act
(in
dic
ato
r,co
l.9),
job
-sea
rch
act
ivit
ies
inth
ela
sttw
ow
eeks
(in
dic
ator
,co
l.10
).C
olu
mn
(10)
on
lyin
clu
des
resp
on
den
tsw
ith
part
ner
sw
ho
work
edle
ssth
an
20
hou
rsin
the
pre
vio
us
wee
k.
All
the
spec
ifica
tion
sar
eli
nea
rp
rob
ab
ilit
ym
od
els.
All
mod
els
incl
ud
eco
ntr
ols
for
hou
seh
old
inco
me,
nu
mb
erof
hou
seh
old
mem
ber
s,nu
mb
erof
hou
seh
old
mem
ber
su
nd
erag
e18
,age
of
the
you
nges
th
ou
seh
old
mem
ber
,an
dci
tize
nsh
ip.
All
mod
els
als
oin
clu
de
ran
dom
izati
on
grou
pfi
xed
effec
ts.
Sta
nd
ard
erro
rsar
ero
bu
stto
het
erosk
edast
icit
yre
port
edin
pare
nth
eses
.*,
**,
***
ind
icate
stati
stic
al
signifi
can
ceat
the
10%
,5%
,an
d1%
level
s,re
spec
tive
ly.
35
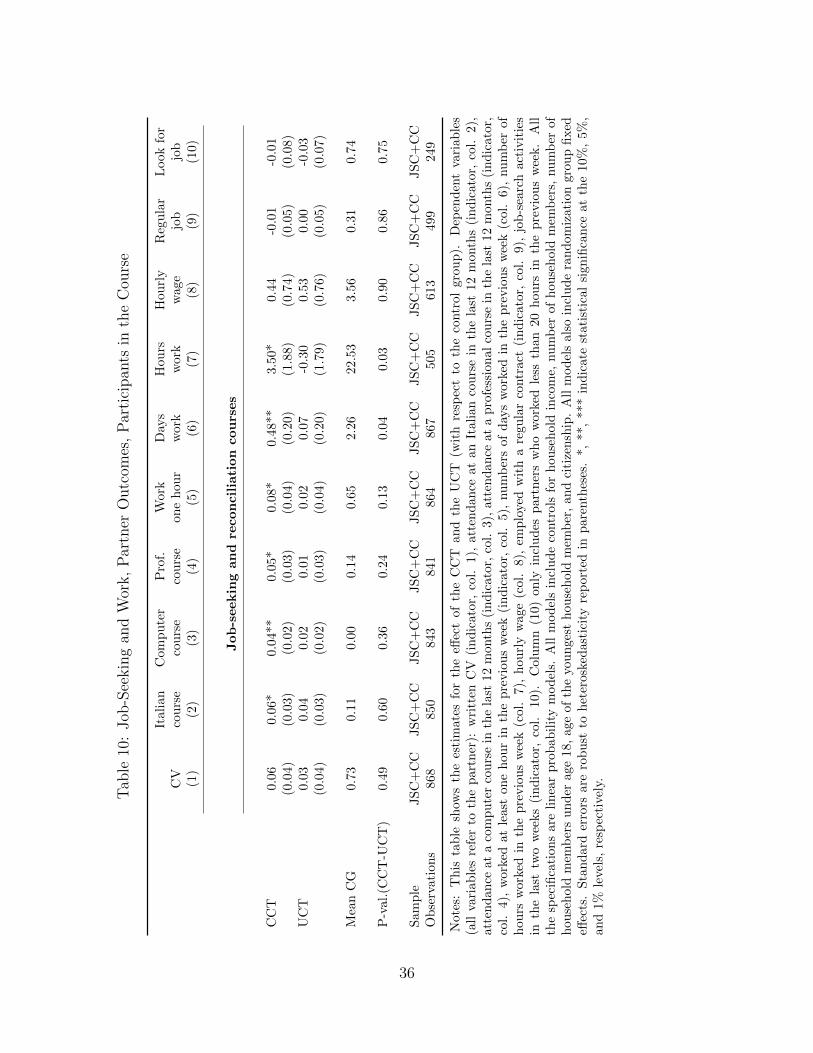
Tab
le10
:Job
-See
kin
gan
dW
ork,
Par
tner
Outc
omes
,P
arti
cipan
tsin
the
Cou
rse
Ital
ian
Com
pu
ter
Pro
f.W
ork
Day
sH
ou
rsH
ou
rly
Reg
ula
rL
ook
for
CV
cou
rse
cou
rse
cou
rse
on
eh
ou
rw
ork
work
wage
job
job
(1)
(2)
(3)
(4)
(5)
(6)
(7)
(8)
(9)
(10)
Job-seekingand
reconciliation
courses
CC
T0.
060.
06*
0.0
4**
0.0
5*
0.0
8*
0.4
8**
3.50*
0.4
4-0
.01
-0.0
1(0
.04)
(0.0
3)(0
.02)
(0.0
3)
(0.0
4)
(0.2
0)
(1.8
8)
(0.7
4)
(0.0
5)
(0.0
8)
UC
T0.
030.
040.0
20.0
10.0
20.0
7-0
.30
0.5
30.0
0-0
.03
(0.0
4)(0
.03)
(0.0
2)
(0.0
3)
(0.0
4)
(0.2
0)
(1.7
9)
(0.7
6)
(0.0
5)
(0.0
7)
Mea
nC
G0.
730.
110.0
00.1
40.6
52.2
622.5
33.5
60.3
10.7
4
P-v
al.(
CC
T-U
CT
)0.
490.
600.3
60.2
40.1
30.0
40.0
30.9
00.8
60.7
5
Sam
ple
JS
C+
CC
JS
C+
CC
JS
C+
CC
JS
C+
CC
JS
C+
CC
JS
C+
CC
JS
C+
CC
JS
C+
CC
JS
C+
CC
JS
C+
CC
Ob
serv
atio
ns
868
850
843
841
864
867
505
613
499
249
Not
es:
Th
ista
ble
show
sth
ees
tim
ates
for
the
effec
tof
the
CC
Tan
dth
eU
CT
(wit
hre
spec
tto
the
contr
ol
gro
up
).D
epen
den
tva
riable
s(a
llva
riab
les
refe
rto
the
par
tner
):w
ritt
enC
V(i
nd
icato
r,co
l.1),
att
end
an
ceat
an
Itali
an
cou
rse
inth
ela
st12
month
s(i
nd
icato
r,co
l.2),
atte
nd
ance
ata
com
pu
ter
cou
rse
inth
ela
st12
month
s(i
nd
icato
r,co
l.3),
att
end
an
ceat
ap
rofe
ssio
nal
cou
rse
inth
ela
st12
month
s(i
nd
icato
r,co
l.4)
,w
orke
dat
leas
ton
eh
our
inth
ep
revio
us
wee
k(i
nd
icato
r,co
l.5),
nu
mb
ers
of
day
sw
ork
edin
the
pre
vio
us
wee
k(c
ol.
6),
nu
mb
erof
hou
rsw
orke
din
the
pre
vio
us
wee
k(c
ol.
7),
hou
rly
wage
(col.
8),
emp
loye
dw
ith
are
gu
lar
contr
act
(in
dic
ato
r,co
l.9),
job
-sea
rch
act
ivit
ies
inth
ela
sttw
ow
eeks
(in
dic
ator
,co
l.10
).C
olu
mn
(10)
on
lyin
clu
des
part
ner
sw
ho
work
edle
ssth
an
20
hou
rsin
the
pre
vio
us
wee
k.
All
the
spec
ifica
tion
sar
eli
nea
rp
rob
abil
ity
mod
els.
All
mod
els
incl
ud
eco
ntr
ols
for
hou
seh
old
inco
me,
nu
mb
erof
hou
seh
old
mem
ber
s,nu
mb
erof
hou
seh
old
mem
ber
su
nd
erag
e18
,ag
eof
the
you
nges
th
ou
seh
old
mem
ber
,an
dci
tize
nsh
ip.
All
mod
els
als
oin
clu
de
ran
dom
izati
on
gro
up
fixed
effec
ts.
Sta
nd
ard
erro
rsar
ero
bu
stto
het
eros
ked
ast
icit
yre
port
edin
pare
nth
eses
.*,
**,
***
ind
icate
stati
stic
al
sign
ifica
nce
at
the
10%
,5%
,an
d1%
leve
ls,
resp
ecti
vely
.
36
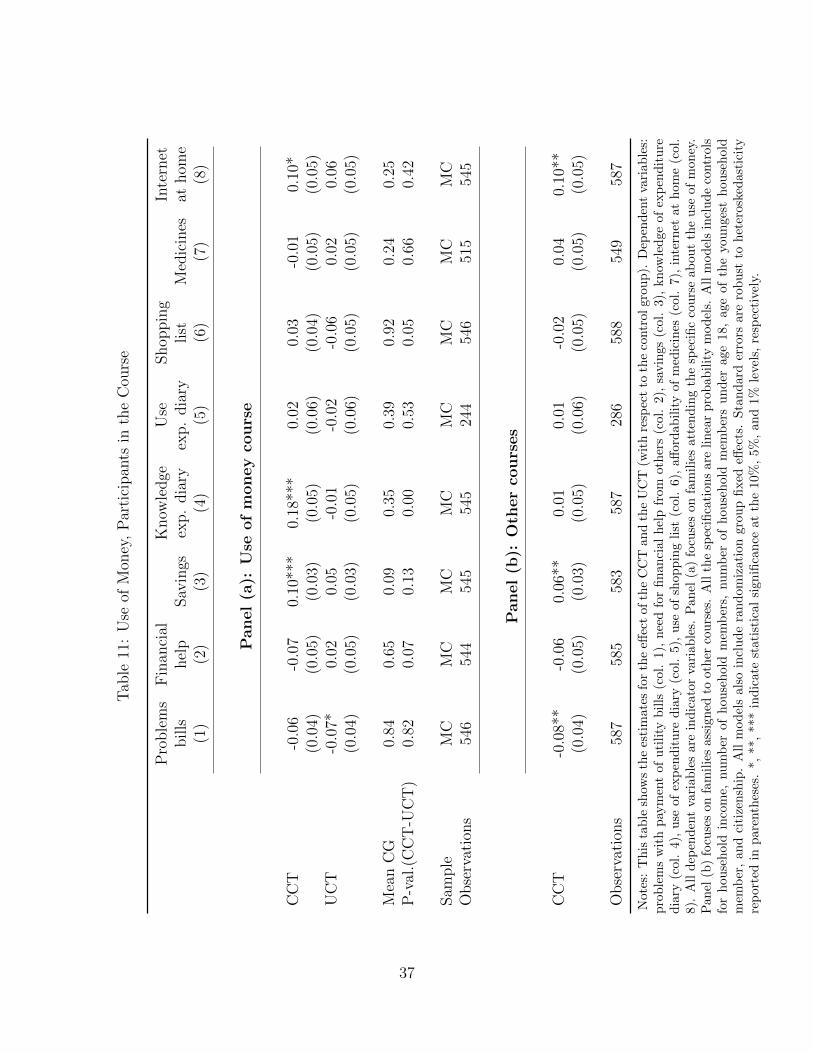
Tab
le11
:U
seof
Mon
ey,
Par
tici
pan
tsin
the
Cou
rse
Pro
ble
ms
Fin
anci
alK
now
ledge
Use
Shop
pin
gIn
tern
etbills
hel
pSav
ings
exp.
dia
ryex
p.
dia
rylist
Med
icin
esat
hom
e(1
)(2
)(3
)(4
)(5
)(6
)(7
)(8
)
Panel
(a):
Use
of
money
cours
e
CC
T-0
.06
-0.0
70.
10**
*0.
18**
*0.
020.
03-0
.01
0.10
*(0
.04)
(0.0
5)(0
.03)
(0.0
5)(0
.06)
(0.0
4)(0
.05)
(0.0
5)U
CT
-0.0
7*0.
020.
05-0
.01
-0.0
2-0
.06
0.02
0.06
(0.0
4)(0
.05)
(0.0
3)(0
.05)
(0.0
6)(0
.05)
(0.0
5)(0
.05)
Mea
nC
G0.
840.
650.
090.
350.
390.
920.
240.
25P
-val
.(C
CT
-UC
T)
0.82
0.07
0.13
0.00
0.53
0.05
0.66
0.42
Sam
ple
MC
MC
MC
MC
MC
MC
MC
MC
Obse
rvat
ions
546
544
545
545
244
546
515
545
Panel
(b):
Oth
er
cours
es
CC
T-0
.08*
*-0
.06
0.06
**0.
010.
01-0
.02
0.04
0.10
**(0
.04)
(0.0
5)(0
.03)
(0.0
5)(0
.06)
(0.0
5)(0
.05)
(0.0
5)
Obse
rvat
ions
587
585
583
587
286
588
549
587
Not
es:
Th
ista
ble
show
sth
ees
tim
ates
for
the
effec
tof
the
CC
Tan
dth
eU
CT
(wit
hre
spec
tto
the
contr
olgro
up
).D
epen
den
tva
riab
les:
pro
ble
ms
wit
hp
aym
ent
ofu
tili
tyb
ills
(col.
1),
nee
dfo
rfi
nanci
al
hel
pfr
om
oth
ers
(col.
2),
savin
gs
(col.
3),
kn
owle
dge
of
exp
end
itu
red
iary
(col
.4)
,u
seof
exp
end
itu
red
iary
(col.
5),
use
of
shop
pin
gli
st(c
ol.
6),
aff
ord
ab
ilit
yof
med
icin
es(c
ol.
7),
inte
rnet
at
hom
e(c
ol.
8).
All
dep
end
ent
vari
able
sar
ein
dic
ator
vari
able
s.P
an
el(a
)fo
cuse
son
fam
ilie
satt
end
ing
the
spec
ific
cou
rse
ab
ou
tth
eu
seof
mon
ey.
Pan
el(b
)fo
cuse
son
fam
ilie
sas
sign
edto
oth
erco
urs
es.
All
the
spec
ifica
tion
sare
lin
ear
pro
bab
ilit
ym
od
els.
All
mod
els
incl
ud
eco
ntr
ols
for
hou
sehol
din
com
e,nu
mb
erof
hou
seh
old
mem
ber
s,num
ber
of
hou
sehold
mem
ber
su
nd
erage
18,
age
of
the
you
nges
th
ou
seh
old
mem
ber
,an
dci
tize
nsh
ip.
All
mod
els
also
incl
ud
era
nd
om
izati
on
gro
up
fixed
effec
ts.
Sta
nd
ard
erro
rsare
rob
ust
toh
eter
osk
edast
icit
yre
por
ted
inp
aren
thes
es.
*,**
,**
*in
dic
ate
stati
stic
al
sign
ifica
nce
at
the
10%
,5%
,an
d1%
leve
ls,
resp
ecti
vely
.
37
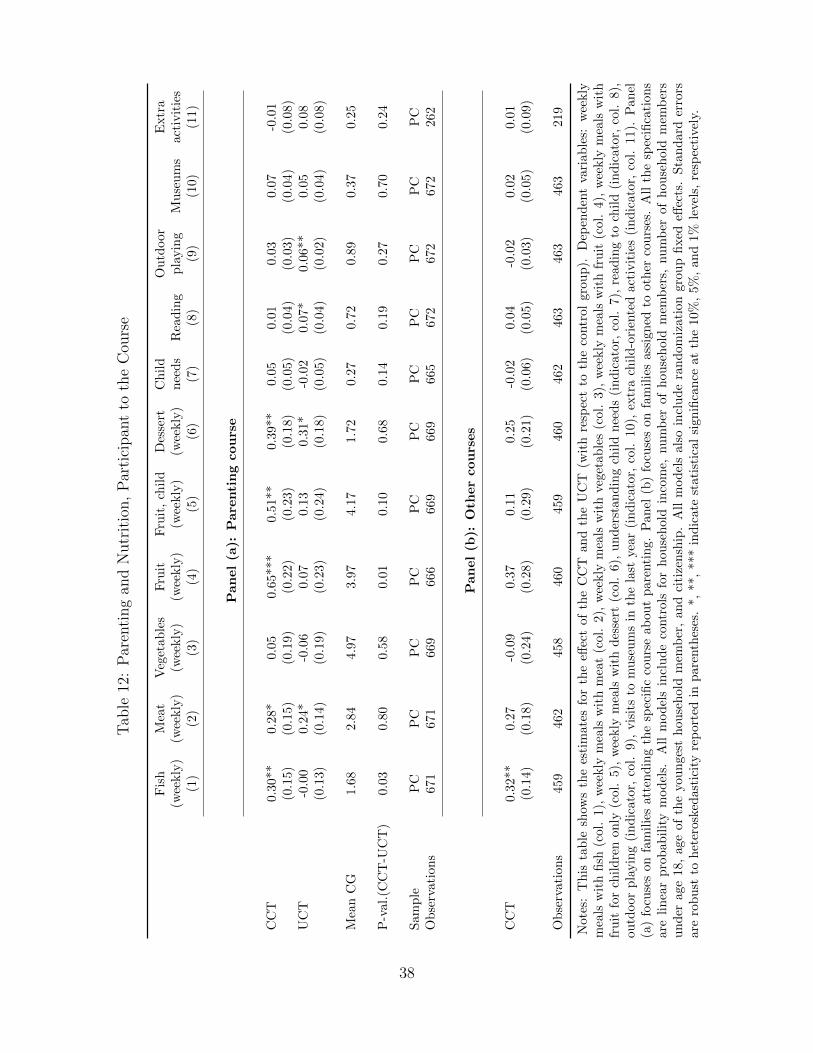
Tab
le12
:P
aren
ting
and
Nutr
itio
n,
Par
tici
pan
tto
the
Cou
rse
Fis
hM
eat
Veg
etab
les
Fru
itF
ruit
,ch
ild
Des
sert
Ch
ild
Ou
tdoor
Extr
a(w
eekly
)(w
eekly
)(w
eekly
)(w
eekly
)(w
eekly
)(w
eekly
)n
eed
sR
ead
ing
pla
yin
gM
use
um
sact
ivit
ies
(1)
(2)
(3)
(4)
(5)
(6)
(7)
(8)
(9)
(10)
(11)
Panel(a
):Pare
ntingcourse
CC
T0.
30**
0.28
*0.0
50.6
5***
0.5
1**
0.3
9**
0.0
50.0
10.0
30.0
7-0
.01
(0.1
5)(0
.15)
(0.1
9)
(0.2
2)
(0.2
3)
(0.1
8)
(0.0
5)
(0.0
4)
(0.0
3)
(0.0
4)
(0.0
8)
UC
T-0
.00
0.24
*-0
.06
0.0
70.1
30.3
1*
-0.0
20.0
7*
0.0
6**
0.0
50.0
8(0
.13)
(0.1
4)(0
.19)
(0.2
3)
(0.2
4)
(0.1
8)
(0.0
5)
(0.0
4)
(0.0
2)
(0.0
4)
(0.0
8)
Mea
nC
G1.
682.
844.9
73.9
74.1
71.7
20.2
70.7
20.8
90.3
70.2
5
P-v
al.(
CC
T-U
CT
)0.
030.
800.5
80.0
10.1
00.6
80.1
40.1
90.2
70.7
00.2
4
Sam
ple
PC
PC
PC
PC
PC
PC
PC
PC
PC
PC
PC
Ob
serv
atio
ns
671
671
669
666
669
669
665
672
672
672
262
Panel(b
):Oth
ercourses
CC
T0.
32**
0.27
-0.0
90.3
70.1
10.2
5-0
.02
0.0
4-0
.02
0.0
20.0
1(0
.14)
(0.1
8)(0
.24)
(0.2
8)
(0.2
9)
(0.2
1)
(0.0
6)
(0.0
5)
(0.0
3)
(0.0
5)
(0.0
9)
Ob
serv
atio
ns
459
462
458
460
459
460
462
463
463
463
219
Not
es:
Th
ista
ble
show
sth
ees
tim
ates
for
the
effec
tof
the
CC
Tan
dth
eU
CT
(wit
hre
spec
tto
the
contr
ol
gro
up
).D
epen
den
tva
riab
les:
wee
kly
mea
lsw
ith
fish
(col
.1)
,w
eekly
mea
lsw
ith
mea
t(c
ol.
2),
wee
kly
mea
lsw
ith
veget
ab
les
(col.
3),
wee
kly
mea
lsw
ith
fru
it(c
ol.
4),
wee
kly
mea
lsw
ith
fru
itfo
rch
ild
ren
only
(col
.5)
,w
eekly
mea
lsw
ith
des
sert
(col.
6),
un
der
stan
din
gch
ild
nee
ds
(in
dic
ato
r,co
l.7),
read
ing
toch
ild
(in
dic
ato
r,co
l.8),
outd
oor
pla
yin
g(i
nd
icat
or,
col.
9),
vis
its
tom
use
um
sin
the
last
year
(in
dic
ato
r,co
l.10),
extr
ach
ild-o
rien
ted
act
ivit
ies
(in
dic
ato
r,co
l.11).
Pan
el(a
)fo
cuse
son
fam
ilie
sat
ten
din
gth
esp
ecifi
cco
urs
eab
ou
tp
are
nti
ng.
Pan
el(b
)fo
cuse
son
fam
ilie
sass
ign
edto
oth
erco
urs
es.
All
the
spec
ifica
tion
sar
eli
nea
rp
rob
abil
ity
mod
els.
All
mod
els
incl
ud
eco
ntr
ols
for
hou
seh
old
inco
me,
nu
mb
erof
hou
seh
old
mem
ber
s,nu
mb
erof
hou
seh
old
mem
ber
su
nd
erag
e18
,ag
eof
the
you
nge
sth
ouse
hol
dm
emb
er,
an
dci
tize
nsh
ip.
All
mod
els
als
oin
clu
de
ran
dom
izati
on
gro
up
fixed
effec
ts.
Sta
nd
ard
erro
rsar
ero
bu
stto
het
eros
ked
asti
city
rep
orte
din
pare
nth
eses
.*,
**,
***
ind
icate
stati
stic
al
sign
ifica
nce
at
the
10%
,5%
,an
d1%
leve
ls,
resp
ecti
vel
y.
38

Table 13: Self-Report and Positive Response Bias
Child’s Child atMunicipal friends friends’ Visits
Events News at home homes pediatrician(1) (2) (3) (4) (5)
CCT 0.03 0.02 -0.04 0.04 -0.01(0.03) (0.03) (0.04) (0.04) (0.02)
UCT 0.01 -0.00 -0.05 0.01 -0.02(0.03) (0.03) (0.04) (0.04) (0.02)
Mean CG 0.27 0.31 0.30 0.50 0.87
P-val.(CCT-UCT) 0.45 0.38 0.75 0.48 0.54
Sample Whole Whole Whole Whole WholeObservations 1,124 1,132 982 898 1,123
Notes: This table shows the estimates for the effect of the CCT and the UCT (with respect tothe CG). Dependent variables: participation at municipal events (col. 1), reading or watchingnews (col. 2), child’s friends visits at home (col. 3), child’s visits to friends’ homes (col.4), visits to the pediatrician (col. 5). All dependent variables are indicator variables. Allthe specifications are linear probability models. All models include controls for householdincome, number of household members, number of household members under age 18, ageof the youngest household member, and citizenship. All models also include randomizationgroup fixed effects. JSC, CC, MC, and PC stand for job-seeking, reconciliation, use of money,and parenting course, respectively. Standard errors are robust to heteroskedasticity reportedin parentheses. *, **, *** indicate statistical significance at the 10%, 5%, and 1% level,respectively.
39