Embed Size (px)
Citation preview

LEMLEMWORKING PAPER SERIES
Innovation Strategies and Firm Growth
Stefano Bianchini *
Gabriele Pellegrino °Federico Tamagni §
* BETA, University of Strasbourg, France° World Intellectual Property Organization, Geneva, Switzerland, and Ecole
Polytechnique Federale de Lausanne, Switzerland§ Institute of Economics, Scuola Superiore Sant'Anna, Pisa, Italy
2016/03 February 2016
ISSN(ONLINE) 2284-0400

Innovation Strategies and Firm Growth∗
Stefano Bianchinia, Gabriele Pellegrinob, and Federico Tamagni†c
aBETA, University of Strasbourg, FrancebWIPO - World Intellectual Property Organization, Geneva, Switzerland, and EPFL - Ecole Polytechnique Federale de
Lausanne, SwitzerlandcInstitute of Economics, Scuola Superiore Sant’Anna, Pisa, Italy
Abstract
In this work, we explore the relations between sales growth and a set of innovation indicators that
capture the different sources, modes and results of the innovative activity undertaken within firms.
We exploit a rich panel on innovation activity of Spanish manufacturing firms, reporting detailed
CIS-type information continuously over the period 2004-2011. Standard GMM-panel estimates of
the average effect of innovation activities reveal significant and positive effect for internal R&D,
while no effect is found for external sourcing of knowledge (external R&D, acquisition of embodied
and disembodied technologies) as well as for output of innovation (process and product innovation).
However, fixed-effects quantile regressions reveal that innovation activities, apart from process
innovation and disembodied technical change, display a positive effect on high-growth performance.
Finally, we find evidence of super-modularity of the growth function, revealing complementarities
of internal R&D with product innovation, and between product and process innovation.
JEL codes: C21, D22, O31, O32
Keywords: firm growth, product and process innovation, internal and external R&D, embodied
and disembodied technical change, fixed-effects quantile regressions, complementarity
∗We wish to thank Zoltan Acs, Alex Coad, Timothy Folta, Marco Grazzi, Werner Holzl, Francesco Lissoni, PierreMohnen, and Marco Vivarelli for insightful comments to earlier drafts. We are also grateful for discussions with andcomments from participants to the 2014 “GCW-Governance of a Complex World” Workshop (Turin, Italy), the “Ex-plaining economic change” Workshop (Rome-La Sapienza, Italy), the 2015 CONCORDi Conference (IPTS-JCR Seville,Spain), the 2015 DRUID Annual Conference (LUISS, Rome, Italy), the XXX Jornadas de Economıa Industrial (Alicante,Spain), the 2015 EMAEE Conference (Maastricht, The Netherlands). The usual disclaimers apply. This project hasreceived funding from the European Union Horizon 2020 research and innovation programme under grant agreementNo.649186–ISIGrowth.
†Corresponding author : Federico Tamagni, Scuola Superiore San’Anna, Pisa, Italy. Postal address: c/o Institute ofEconomics, Scuola Superiore Sant’Anna, Piazza Martiri 33, 56127, Pisa, Italy, E-mail [email protected], Tel +39-050-883343.
1

1 Introduction
The relation between innovation and firm growth is a classical, yet still puzzling topic. The general
intuition is obviously that innovation is among the key determinants of comparative advantages over
competitors, thus contributing to the ability of firms to grow and gain market shares. Against this
simplistic prediction, however, play the ample degrees of complexity, uncertainty and idiosyncrasy that
are well known to characterize the innovation process. Innovation is the search for, and the discovery,
development, improvement, adoption and commercialization of, new processes, new products and new
organizational structures and procedures. It involves indeed uncertainty, risk taking, probing and
re-probing, experimenting and testing. Thus the process of innovation itself, and its ensuing effects
on various aspects of firm performance, can be extremely heterogeneous and difficult to predict.
Within the vast literature, this paper contributes to the studies that seek to identify the links
between innovation and success on the market in terms of sales growth. In spite of the increasing
availability of firm level data over the last 10-15 years, especially following the attempt undertaken by
the EU to provide regular surveys of innovation across members states (the CIS-Community Innovation
Survey exercise), this literature is still underdeveloped under several respects, in turn motivating the
contributions that we want to pursue in this study.
First, our major contribution is to provide a broad picture of the relation between growth and
innovation, by looking at a wide set of innovation indicators that capture different sources, modes and
output of the innovative efforts undertaken by firms. Indeed, while extant empirical studies on growth
and innovation mostly focus on traditional proxies such as R&D and patents, the multifaceted nature
of innovation as well as the great variety of innovation strategies undertaken by firms calls for a multi-
dimensional approach to assess the actual contribution of innovation on corporate growth (Audretsch
et al., 2014). Exploiting a rich dataset on Spanish firms, we can use a set of innovation indicators
including internal vs. external R&D, process vs. product innovation, also distinguishing between
products new-to-the-firm vs. new-to-the-market, investment in innovative machineries, and purchase
of licenses or know-how from other firms. This allows us cover the usual dichotomy between innova-
tive inputs vs. innovative outputs, but also to investigate the role of internal vs. external sourcing of
knowledge. The existing literature does not provide conclusive evidence on their relation with sales
growth. In this respect our paper is closely related to the recent work by Holzl (2009) focusing on
high-growth firms. The cross-sectional nature of that study, however, represents a limitation we want
to improve upon.
Indeed, our second contribution stems from the possibility to work with a panel of firms observed
over several years. A common limitation to studies exploiting CIS-like data is that such surveys are
run in waves every 3-4 years, often on rotating samples of firms. Thus, previous studies can typically
exploit a single cross section, or they can follow just a few firms over time, in turn failing to control
for unobserved heterogeneity. This point is not merely a technical econometric drawback, given the
inherently idiosyncratic nature of the process and outcomes of innovation. The dataset of Spanish firms
available to us is a CIS-type dataset in terms of the rich and detailed information about innovative
activity, but it is longitudinal in nature, since a consistent data collection methodology ensures to
have information on the same set of firms over time.
Third, and relatedly, we also contribute to the recent literature (Coad and Rao, 2008; Falk, 2012;
Segarra and Teruel, 2014) that adopts quantile regressions to show that while innovation can have
2

mixed or nil effect on the average growth rate in a cross section of firms, innovation is indeed more
beneficial for fast-growing, firms. Besides mostly focusing only on patents or R&D, these studies apply
basic quantile regression techniques, with few exceptions (Coad et al., 2016; Mazzucato and Parris,
2015). Exploiting the longitudinal dimension of our data, we can instead apply up-to-date quantile
regression techniques designed to account for firm fixed effects.
Finally, we provide an empirical assessment of the complementarities existing between the different
innovation activities in favoring sales growth. Recent studies exploit the notion of modularity of the
innovation function to investigate the complementarity of innovation inputs or knowledge sources in
successful generation of innovation output. We apply the same conceptual and statistical framework
to ask whether different combinations of basic innovation activities (internal and external R&D, pro-
cess and product innovation, embodied and disembodied technical change) help improving growth
performance, above and beyond the contribution of each single activity alone.
Our results point to a good deal of heterogeneity in the way different innovation activities contribute
to expanding sales. Indeed, among the innovation indicators we account for, internal R&D turns out as
the main driver of sales growth, on average. Other innovation activities, with exception of disembodied
technical change and process innovation, have a positive association with growth only for high-growth
firms in the top quantiles of the firms’ growth rates distribution. We also document a complementarity
effect between internal R&D and product innovation, and between product and process innovation.
This evidence emphasizes the complexity underlying the growth-innovation relation and provides a
potential explanation for the inconclusive results of previous studies which adopted a unidimensional
approach.
2 Background literature and research questions
The starting point of our analysis rests in the failure of the existing literature to provide a com-
prehensive account of the multifaceted nature of the innovation process. As Audretsch et al. (2014)
put it in an up-to-date review of the literature “...the complexity of R&D activities, together with the
diversity of innovation strategies and the multiplicity of growth modes, requires a multidimensional
approach to examine the contribution of innovations on firm growth.” Indeed, different innovation
activities are usually undertaken and combined within the innovative efforts of heterogeneous firms,
with differentiated impact on their ability to sustain competition and ultimately gain or loose market
shares.
Whilst theoretical models from different traditions acknowledge the importance of innovation as a
major driver of firm growth and success on the market (from the Schumpeterian-evolutionary tradition
related to Nelson and Winter (1982), to new-growth theories and more recent neo-classical or neo-
Schumpeterian models as in Aghion and Howitt (1992) and Aghion et al. (2005), among others), the
empirical literature does not fully support the theoretical expectations. This is in particular the case
when one looks at the effect of innovation on the growth rate of the “average firm”, through standard
regression estimates, while some more recent analyses partly reconcile theory and evidence showing
that innovation tends indeed to support the growth of high-growth firms.
In this Section we discuss the reference literature on the relations between innovation activities
and firm growth, as a background that motivates the research hypotheses that we tackle in this paper.
3

We refer to studies investigating sales growth, which are more directly related to our analysis.1
2.1 Innovative inputs, innovative outputs and their relation with average growth
Empirical studies traditionally apply standard regression techniques to estimate the impact of
innovation on average sales growth. Internal R&D and patents represent the two traditional proxies
of innovative activities, respectively capturing the input and the output side of the innovation process.
A fair reading of a vast literature, impossible to summarise here, is that it has been difficult to find
a strong support for a positive effect of innovation on sales growth. The early papers did document
a positive effect, especially for R&D (Mansfield, 1962; Mowery, 1983), and many subsequent papers
corroborates that innovating firms grow faster, highlighting the sometimes transitory nature of success
in the market(Geroski and Machin, 1992), the role of size and age ( with smaller and younger innovators
achieving a more rapid growth, see e.g. Storey, 1994), and the differentiated results across low vs. high
tech sectors (Stam and Wennberg, 2009). By contrast, however, a large number of studies do not find
any significant effect of R&D or patenting activity on sales growth (see, among the many, Geroski
et al., 1997; Geroski and Mazzucato, 2002; Bottazzi et al., 2001), also in this case highlighting the
interplay of innovation with size, age and other firm or sectoral characteristics (see Audretsch et al.,
2014, for a review).
While this lack of a robust relation echoes the more general issue about the unpredictability of
growth (Geroski, 2002), the complexity and the uncertain nature of the firms’ innovative process as
well as criticisms to the adopted proxies of innovation, have been advanced as specific explanations,
in turn motivating efforts to measure innovation more accurately. A more recent literature therefore
takes advantage of more detailed data that allow to take into account different proxies of both inputs
and outputs of innovation, drawing especially from surveys like the European CIS and similar data
around the world.
Concerning the output side of innovation, many studies highlight the merits of innovation surveys
in providing direct proxies for product and process innovations (see Griffith et al. 2006; Parisi et al.
2006; Hall et al. 2008, 2009), beyond traditional focus on patents. However, as a matter of fact, only
few works consider the relation between sales growth and proxies of innovative output alternative to
patents.
On the one hand, there is practically no evidence about the direct impact of process innovation
on sales growth, as indeed most studies focus on the relation between new processes and productivity
(see Griffith et al. 2006; Hall et al. 2009; Mairesse and Robin 2009). A notable exception is in Goedhuys
and Veugelers (2012), who find that process innovation has no effect on sales growth on a sample of
Brazilian manufacturing firms. The interpretation is that of a mediating role of productivity, such
that process innovation has direct effect on cost efficient production, while it may show its beneficial
effects on sales in later stages, after an initial period of process restructuring.
On the other hand, concerning product innovation, theory would predict a positive link between
the introduction of new products and sales growth, as indeed efforts directed to creation and com-
mercialization of new products represent the primer strategy for expansion and growth (Hay and
1There also exists a huge literature on the effects of different types of innovation on growth of employment, where themain focus is on the lost-lasting debate on the labour-saving vs. labour augmenting effect of innovation (see Vivarelli,2014, for an exhaustive survey). We do not discuss this literature here, as we are more interested in a measure of growthcapturing success on the market.
4

Kamshad, 1994). But the evidence is mixed. For instance, Cucculelli and Ermini (2012) find that
product innovation (measured as a dummy for introduction of new products) does not affect sales
growth, and one has to control for the tenure from last product introduction to recover some positive
effect. Other studies suggest that product characteristics matter beyond the mere ability to introduce
new products in the market. In this respect, the literature focuses on two measures of product innova-
tion that we also use, that is distinguishing between products-new-to-the-firm vs. products-new-to-the
market, again with mixed results. The cross-country evidence in Holzl (2009) lends support to the
intuition that products-new-to-the-market, capturing more original and potentially more disruptive
innovation are those that really matters for competing and gaining market shares, as compared to more
imitative efforts related to products new-only-to-the-firm. Conversely, however, Corsino and Gabriele
(2011) find on Italian data that sales growth is positively affected also by more incremental product
innovations introduced in the recent past, even if the latter are related to less valuable innovations
or to imitative efforts. The specificity of the country may play a role, of course, allowing even less
valuable innovation to support market shares.
Moving to the relation between sales growth and innovation inputs, the literature has been sort
of resilient to in-house formal R&D. Innovation surveys, much like indeed our dataset, provide rich
information also about external sourcing of knowledge, such as purchases of external R&D and acqui-
sition of innovative technology, both embodied (investment in innovative machinery and equipment)
and disembodied (acquisition of patents, know-how, licenses). Theoretically, the acquisition of new
knowledge or new techniques from outside the boundaries of the firm has uncertain effects. On the
one hand, external sourcing can help improving the knowledge base and, thus, the overall innovative
capabilities of firms. And this can be sometimes the only viable strategy to pursue, especially for
smaller or more traditional firms that do not have internal capabilities to support formalized internal
research. On the other hand, however, the actual exploitation of external sourcing can be hampered by
lacking absorptive capacities, by complexity and coordination issues arising within the user-producer
interactions, and by the non-trivial challenges related to the adaptation of the outsourced innovative
inputs to the specific characteristics, competences and needs of each firm. And the overall effect on
growth also depends from the type of outsourced knowledge, as a key decision is about externaliz-
ing “core activities”, more likely to be related to new products’ development and growth, vs. more
“marginal activities”, that are less likely to impact on sales and market shares.
The evidence from innovation studies supports a positive impact of external innovation on both
product and process innovation (Santamaria et al., 2009; Pellegrino et al., 2012; Goedhuys and Veugel-
ers, 2012; Conte and Vivarelli, 2014). However, we lack systematic evidence about the effect of external
sourcing of knowledge and innovation on sales growth. An exception is in Segarra and Teruel (2014),
who document that external R&D has a significantly smaller impact than in-house R&D.
Overall, from a joint reading of the literature, we can sketch a set of predictions concerning the
effect on average sales growth of the different proxies of innovative activity considered in this work.
First, we expect internal R&D to be positively associated with sales growth, although the uncer-
tainty and complexity of the processes leading from search to actual market exploitation of innovation
is likely to entail heterogenous effects across different firms.
Second, concerning the direct measures of product innovation, we expect in general that the ability
of introducing new products should favor sales growth, although products new-to-the-firm and prod-
5

ucts new-to-the-market, respectively capturing more incremental vs. more substantial innovations,
can be more or less beneficial depending on the sector and market characteristics.
Third, we can predict a relatively minor role of process innovation, whose effect on sales is mediated
by the relevance of cost and efficiency factors as drivers of competition for market shares.
Fourth, concerning measures of external inputs of new knowledge and innovation, a number of
theoretical reasons undermine the potential of these activities in fostering sales growth. We expect
sales growth to more likely benefit from purchases of external R&D insofar as the latter is more
directly linked to core activities, for which absorptive capacity and user-producer interactions should
be less critical. Acquisitions of embodied technology (innovative machineries) are expected to support
sales growth in so far as they are generally undertaken as a way to improve quality of products and
processes. But also in this case there might be issues about a smooth incorporation of innovative
capital within the firm. Similarly, the extent to which acquisitions of disembodied technology can
contribute to sales growth largely depends from whether the firm enjoys the required capabilities to
master and exploit the acquired stock of external knowledge.
Some of these hypotheses have received attention in previous studies in different datasets covering
different countries and time periods. A key contribution will hopefully come from investigating all of
them jointly on the same dataset.
2.2 Asymmetric effects of innovation across growth quantiles
One of the major robust stylised fact emerging from industrial economics is that the firm growth
rates distribution is characterised by wide heterogeneity and a tent shape, whatever the level of sectoral
aggregation considered (Stanley et al., 1996; Bottazzi and Secchi, 2006; Coad, 2009; Dosi, 2007). In
this respect, due to its inherent nature, the processes leading from innovative input to innovative
output may show different effects according to the different positioning of a firm in the growth rates
distribution, beyond the effect on growth of the “average firm”.
Motivated by these considerations, a recent literature applies quantile regression techniques to
disentangle the effect of innovation proxies along the spectrum of the distribution of growth rates (Freel,
2000; Coad and Rao, 2008; Holzl, 2009; Falk, 2012; Nunes et al., 2012; Colombelli et al., 2013). The
general conclusion is that innovation, proxied by different innovation measures, is positively related
with sales growth of high growth firms in the top quantiles of the growth rates distribution (see Coad
et al., 2014, for a recent review).
While quantile regressions has allowed to, at least partially, reconcile the evidence with the theo-
retical expectation of a positive influence of innovation on firm growth, the literature still suffers from
several limitations. First, most studies use R&D and patents as the only proxy of innovation, and there
are only few attempts to expand along different innovation activities. The above-mentioned Segarra
and Teruel (2014) show that external R&D does not matter for high-growth, while Holzl (2009) exploit
several measures much in the same line as we do here, although within a single cross-section. Second,
existing evidence mostly originates from standard quantile regression methods, which do not control
for unobserved idiosyncratic factors. Notable exceptions are in Coad et al. (2016) and Mazzucato
and Parris (2015), who apply the same Canay (2011) fixed-effects quantile regression method that we
exploit in this study, although taking traditional proxies of innovation.
Overall, we lack a solid guidance from theory and previous analysis about the relevance for fast
6

vs. slow growing firms of all the different innovation dimensions considered in this study. At a general
level, all the theoretical considerations pertaining to the effect of innovation activities on average
growth remain valid also when considering the effect along the growth distribution quantiles. Our
main working hypothesis is that high-growth firms should benefit more from innovation, no matter
the innovation proxy considered, as compared to slow-growing or shrinking firms. Indeed, high-growth
firms are expected to be more capable to deliver new and more valuable products, to better manage
process innovation, and to more effectively solve the challenges related to external sourcing of new
knowledge and technical change. We thus foresee a stronger and generally positive relation between
sales growth and innovation variables in the top quantiles of the growth rates distribution.
2.3 Innovation complementarities and firm growth
Beyond investigating whether different innovation activities correlate with sales growth, a natural
step forward is to ask whether it is the combination of different innovative activities, rather than each
single activity per se, that matters for sales growth. In reality, indeed, firms can differently combine
different inputs and outputs (Karlsson and Tavassoli, 2016). The effect that innovation has on sales
growth can be different depending on the complexity of the strategy pursued, in terms of the number
and the type of innovation activities performed at the same time. Each different combination may
entail specific costs and challenging coordination issues, while also increasing the ability to create and
capture growth opportunities.
An established empirical framework to reconstruct the interactions among different innovation
activities and the ensuing impact on firm performance is via the CDM model (Crepon et al., 1998).
Within a huge literature, studies mostly focus on the sources of productivity growth, and most often
consider only one input (R&D in particular) and one output of innovation (see Mairesse and Mohnen,
2010, for a review). To our knowledge, the already mentioned Goedhuys and Veugelers (2012) rep-
resents the only attempt to assess the relevance of internal vs. external inputs for the generation of
product and process innovation, and then to estimate the ensuing impact of successful new processes
or products on stimulating sales growth.
We provide a different contribution by exploring the pairwise complementarities between inter-
nal R&D, product innovation, process innovation and external sourcing of knowledge. Among the
different empirical methods to assess complementarities (Topkis, 1998), we exploit the notion of
super-modularity, following a well established tradition in innovation studies that look at whether
different innovation inputs or obstacles to innovation are complements in the generation of innovation
output (Leiponen, 2005; Mohnen and Roller, 2005; Cassiman and Veugelers, 2006; Catozzella and
Vivarelli, 2014). We apply the same framework to assess complementarities of innovation activities in
the sales growth function.
Since this is the first attempt along this direction it is thus difficult to provide sharp predictions.
From the above discussion on the potential benefits and constraints characterizing the innovation-
growth relations along the different proxies of innovation, we outline the following working hypotheses.
First, to the extent that R&D captures the internal stock of knowledge and overall firms’ efforts to
build innovative capabilities, we expect R&D to display complementarities with all the other innovation
activities in sustaining sales growth. Indeed, on the output side, R&D is likely to ease the introduction
and the quality of new products, and to improve the ability to master new processes. On the input
7

side, R&D should help building the absorptive capacity required to tackle the challenges from external
sourcing of knowledge.
Second, and relatedly, we expect external sourcing of innovation to have uncertain complementarity
with both product and process innovation. Indeed, whether the additional complexity and challenges
related to managing external sources of new knowledge are smoothly combined with new products
and processes is not trivial a priori.
Third, we do not expect process innovation to exhibit, in general, any strong complementarity
with other innovation variables, since its primer impact is typically on efficiency, and only indirectly
on growth. However, a virtuous combination of new processes and new products can provide a sound
mix of cost and product competitive advantages that may eventually results into increased ability to
compete on sales. Thus, if process innovation has any effect, then we expect process innovation to be
complement to product innovation.
Our results will hopefully provide new evidence to inform subsequent theoretical developments
which rest outside the aims of this article.
3 The data
In this Section we present the sample and the main variables that we use in the empirical analysis.
3.1 Data and sample
We exploit a firm-level dataset drawn from the Spanish Technological Innovation Panel (henceforth
PITEC), jointly developed by the Spanish National Statistic Institute (INE), the Spanish Foundation
for Science and Technology (FECYT), and the Foundation for Technical Innovation (COTEC). The
data are collected following the Oslo Manual guidelines (OECD, 1997) and, as such, they can be
considered a Community Innovation Survey (CIS)-type dataset. Thus, PITEC includes a rich set
of variables that measure firms’ engagement in innovation activity, economic and non-economic mea-
sures of the effects of innovation, self-reported evaluations of factors hampering or fostering innovation,
participation in cooperative innovation activities, access to public funding, use of patents and other
means of appropriability, and some complementary innovation activities such as organizational inno-
vation and marketing. The main limitation, common to other CIS-type surveys, lies in the relatively
limited information about more structural and industrial characteristics of firms, which essentially
cover only annual sales and employment, industry affiliation, founding year, export status, industrial
group, and few others.
The key feature that distinguishes PITEC from the majority of European CIS-type datasets is its
longitudinal nature. Indeed, since 2003 systematic data collection ensures a consistent representative-
ness of the population of Spanish manufacturing and service firms over time, allowing to follow the
same firms over a considerable number of years. This allows to control for unobserved factors that
could have an impact on the relation between innovation variables and patterns of sales growth.
We select our working sample from an initial dataset of 100,016 firm-year observations over the
period 2004-2011. We focus on manufacturing firms, and we look at “organic growth”, hence discarding
all firms involved in M&A events. The resulting sample is an unbalanced panel of 26,386 firm-year
observations for which the variables used in our empirical exercise are non-missing. Table 1 shows
8

Table 1: Composition of the panel
Time obs. #Firms % %Cum #Obs.
3 140 2.76 2.76 1404 230 4.54 7.31 4605 250 4.94 12.24 7506 328 6.48 18.72 1,3127 972 19.19 37.91 4,8608 3,144 62.09 100 18,864
Total 5,064 100 26,386
Note: “Time obs.” indicate the minimum number of yearsover which firms are observed: T=3 refers to firms thatare observed for at least three periods: T=4 correspondsto firms that are observed for at least four periods, and soon.
that the large majority of firms (62.09 %) is observed over the entire sample period, whereas another
19.19% persists in the data for 7 years, and only a negligible percentage (7,31%) for less than 5 years.
3.2 Main variables
Our dependent variable is firm growth measured in terms of sales. This is defined as the log-
difference:
Git = sit − si,t−1 , (1)
where
sit = log(Sit)−1
N
∑
i
log(Sit) , (2)
and Sit is sales (annual turnover) of firm i in year t, and the sum is computed over the N firms
populating the same (2-digit) sector. In this way firm sizes and, thus, the growth rates are normalized
by their annual sectoral average. The normalization implicitly removes common trends, such as
inflation and business cycles effects in sectoral demand.
In our attempt to provide a multidimensional view about innovation activity of firms, we employ
the following innovation indicators, available for each firm in each year:
1. Internal R&D (intensity): Intramural R&D expenditures, normalized by total turnover.
2. External R&D (intensity): Extramural R&D expenditures, normalized by total turnover.
3. Prod New-to-the-firm: Share of firm’s total sales due to sale of new or significantly improved
products, which are new only for the firm.
4. Prod New-to-the-market : Share in firm’s total sales due to sales of new or significantly improved
products, which are new to both the firm and the market.
5. Process Innov : Binary indicator equal to 1 if the firm introduces new or significantly improved
processes, and 0 otherwise.
9

Table 2: Innovation variables - Descriptives
Mean Std.Dev. Median Min Max
Internal R&D 0.031 0.161 0.004 0 7.986
External R&D 0.006 0.055 0 0 3.353
Prod. New-to-firm 0.248 0.352 0.056 0 1
Prod. New-to-MKT 0.099 0.225 0 0 1
Proc. Innov 0.633 0.482 1 0 1
Emb.Tech.Change 0.006 0.047 0 0 3.441
Disemb.Tech.Change 0.000 0.005 0 0 0.555
Notes: Figures computed pooling over the working sample - 26,386 observa-tions.
6. Embodied technological change (intensity): Investment in innovative machinery and equipment,
normalized by total turnover.
7. Disembodied technological change (intensity): Acquisition of external knowledge and technology
(patents, know-how, etc., from other enterprises or organizations), normalized by total turnover.
The definitions of these proxies from PITEC are equivalent to their counterpart in innovation
surveys from other countries. The interpretation is in most cases well accepted. R&D indicators just
measure expenditures in different R&D activities, and we also follow the usual approach to take the
ratio to total turnover instead of absolute figures. Concerning product innovation, the introduction of
products perceived as new-to-the-market connects with the ability to perform more relevant innovation,
resulting in more valuable products, while products new-to-the-firm are usually considered as a proxy of
more “incremental” and less valuable innovation. The dummy for process innovation has the standard
interpretation as capturing reorganization of production or implementation of new processes, and we
also follow the common practice to interpret acquisition of new machineries and of external knowledge
as proxies for, respectively, acquisition of embodied and disembodied technical change.
In Table 2 we report descriptive statistics for the innovation indicators. Notice, first, that all the
indicators display highly skewed distributions, suggesting considerable heterogeneity in the innova-
tive behavior. Second, firms in our sample appear more prone to undertake internal generation of
knowledge rather than searching for external sources. Indeed, on average, intramural formalized R&D
amounts to 3.1% of annual sales, while we observe an average 0.6% share in sales for both extramural
R&D and for acquisition of innovative machineries and equipment, and such share is close to zero in
the case of acquisition of disembodied knowledge. Further, from the indicators of innovative output,
we see that a relatively large fraction of firms perform process innovation (around 63% of the obser-
vations). On the other hand, concerning product innovation, the share in total sales due to products
new-to-the-market is on average smaller than the share of sales from products new-to-the-firms (9.9%
vs. 24.8%). This hints that “truly” innovative products are more difficult to achieve and more rare
than incremental innovation, and thus may contribute less to sales.
10

Table 3: Sales growth by innovation status - Descriptive statistics for
Mean Median Min Max #Obs
Internal R&D NO -0.040 -0.016 -4.813 3.853 11,225
YES 0.009 0.006 -3.821 4.674 15,161
External R&D NO -0.025 -0.008 -4.813 3.853 18,999
YES 0.022 0.012 -3.821 4.674 7,387
Prod.New-to-firm NO -0.021 -0.007 -4.813 4.674 17,200
YES 0.005 0.006 -3.603 3.57 9,186
Prod.New-to-MKT NO -0.027 -0.011 -4.813 4.674 10,237
YES -0.002 0.002 -3.958 3.57 16,149
Proc. Innov. NO -0.032 -0.016 -4.813 4.674 10,290
YES 0.001 0.006 -3.958 3.57 16,096
Embod.Tech.Change NO -0.018 -0.006 -4.813 4.674 21,780
YES 0.018 0.011 -2.839 3.253 4,606
Dis.Tech.Change NO -0.013 -0.003 -4.813 4.674 25,826
YES 0.016 0.001 -2.759 2.615 560
Notes: descriptive statistics of Gt by “innovators” vs. “non-innovators” defined as firmsthat do (YES) or do not (NO) engage in innovation, according to the different innovationvariables. Figures computed pooling over the working sample - 26,386 observations.
4 Descriptive evidence
As a first assessment of the relation between sales growth and innovation, we compare the growth
rates across “innovators” and “non-innovators”, that is splitting the sample between firms that do or
do not undertake each specific innovative activity.2
In Table 3 we show basic descriptives of sales growth across the different subgroups. We see that
“innovators” tend to display larger mean and median growth rates than “non-innovators”, regardless
the innovation variable. The median, in particular, is positive for “innovators” and negative for
“non-innovators” for all the proxies.
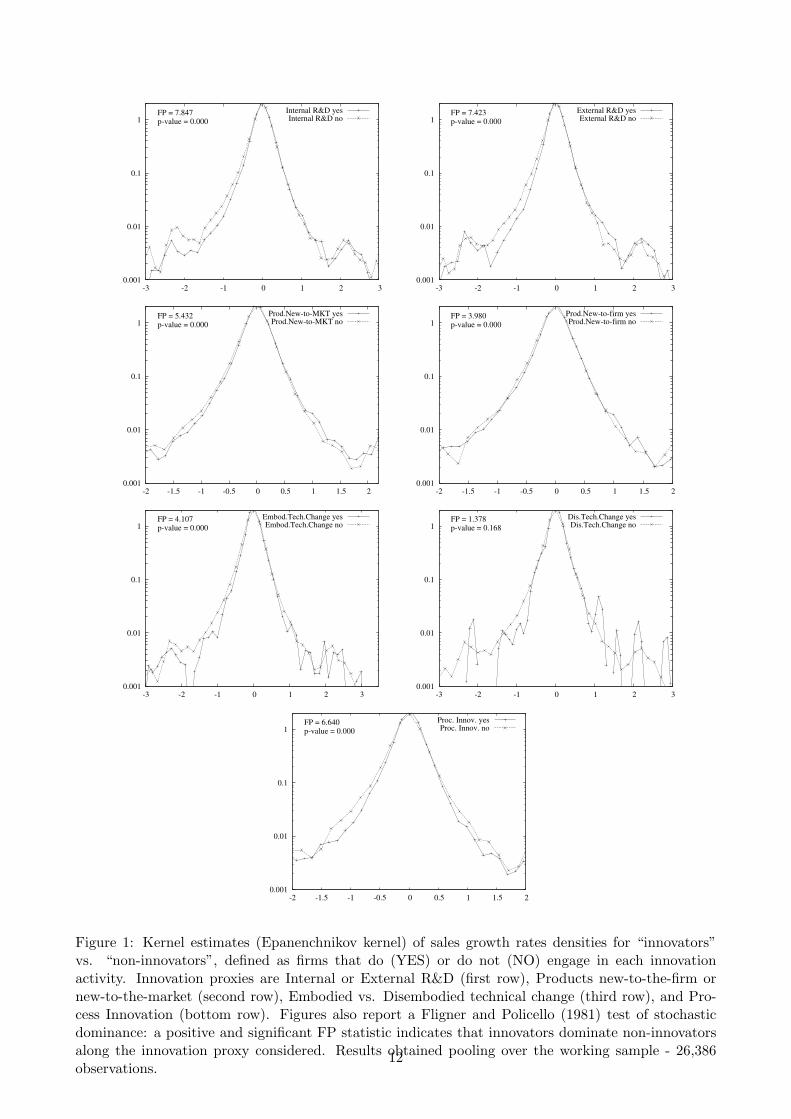
In Figure 1 we report kernel estimates of the unconditional distribution of sales growth rates, again
across “innovators” and “non-innovators”. “Non-innovators” are generally more concentrated in the
left part of the support, and these asymmetries are particularly pronounced for the two R&D indica-
tors. Differences across the two groups are less clear-cut in the right tails, with the two distributions
substantially overlapping, irrespective of the innovation variable considered. The visual inspection is
complemented by a Fligner and Policello (1981) test of distributional equality (reported on the plots
as FP), allowing to assess which of the two distributions stochastically dominates the other along each
innovation variable considered. The null hypothesis of stochastic equality is always rejected (except
for technological acquisition) and the positive FP statistics imply that “innovators” present a larger
probability to experience superior growth performance than “non-innovators”.
2Of course, non-innovators according to one variable may still be innovative firms, in the sense that they may beengaged in other types of innovative activity.
11
0.001
0.01
0.1
1
-3 -2 -1 0 1 2 3
FP = 7.847p-value = 0.000
Internal R&D yesInternal R&D no
0.001
0.01
0.1
1
-3 -2 -1 0 1 2 3
FP = 7.423p-value = 0.000
External R&D yesExternal R&D no
0.001
0.01
0.1
1
-2 -1.5 -1 -0.5 0 0.5 1 1.5 2
FP = 5.432p-value = 0.000
Prod.New-to-MKT yesProd.New-to-MKT no
0.001
0.01
0.1
1
-2 -1.5 -1 -0.5 0 0.5 1 1.5 2
FP = 3.980p-value = 0.000
Prod.New-to-firm yesProd.New-to-firm no
0.001
0.01
0.1
1
-3 -2 -1 0 1 2 3
FP = 4.107p-value = 0.000
Embod.Tech.Change yesEmbod.Tech.Change no
0.001
0.01
0.1
1
-3 -2 -1 0 1 2 3
FP = 1.378p-value = 0.168
Dis.Tech.Change yesDis.Tech.Change no
0.001
0.01
0.1
1
-2 -1.5 -1 -0.5 0 0.5 1 1.5 2
FP = 6.640p-value = 0.000
Proc. Innov. yesProc. Innov. no
Figure 1: Kernel estimates (Epanenchnikov kernel) of sales growth rates densities for “innovators”vs. “non-innovators”, defined as firms that do (YES) or do not (NO) engage in each innovationactivity. Innovation proxies are Internal or External R&D (first row), Products new-to-the-firm ornew-to-the-market (second row), Embodied vs. Disembodied technical change (third row), and Pro-cess Innovation (bottom row). Figures also report a Fligner and Policello (1981) test of stochasticdominance: a positive and significant FP statistic indicates that innovators dominate non-innovatorsalong the innovation proxy considered. Results obtained pooling over the working sample - 26,386observations.
12

Table 4: Descriptive statistics for the control variables
Mean Std.Dev. Median Min Max
Gt−1 0.026 0.376 0.027 -4.813 4.739
lnEmplt−1 4.088 1.309 3.932 0 9.234
lnAget−1 3.223 0.598 3.258 0 5.088
Exportt−1 0.796 0.403 1 0 1
PubFundt−1 0.354 0.478 0 0 1
Groupt−1 0.378 0.485 0 0 1
Notes: Figures computed pooling over the working sample - 26,386 ob-servations.
Overall, the distributional analysis suggests that innovators tend to be more able to avoid below-
average growth rates, rather than to stably reach a positive and high-growth performance. Of course
all these findings just provide an unconditional picture.
5 Regression analysis
In this Section we turn to regression analysis. The empirical strategy is to separately investigate
the effect of each innovation activity, conditional on a set of controls. We first look at the effects on
average growth, through standard panel techniques, and then exploit fixed-effects quantile regressions
to explore the asymmetries in the innovation-growth relation across growing and shrinking firms.
The baseline empirical model is a panel regression equation
Gi,t = α INNOVi,t−1 + β × Zi,t−1 + ui + ǫi,t , (3)
where INNOV stands alternatively for one of the different innovation variables, Z is a set of firm-level
control variables, ui is a firm fixed-effect, and ǫi,t a standard error term.
Both INNOV and the controls enter with a 1-year lag, at least partially controlling for potential
simultaneity.3 The set of controls includes the lagged dependent variable (Gt−1), a proxy for size
in terms of number of employees (in logs, lnEmpl), firm age computed by year of foundation (in
logs, lnAge) and three dummy variables, respectively taking value 1 if firm i is exporting (Export),
or receiving public financial support to innovation (PubFund), or belonging to an industrial group
(Group) in year t − 1, and zero otherwise.4 All the specifications also include a full set of industry
(2-digit) and year dummies. Table 4 reports basic descriptive statistics for the controls.
The coefficient of primer interest is of course α, capturing the effect of each specific innovation
activity on sales growth. The inclusion of firm fixed-effects implies that identification works through
3Since one might argue that it takes time for innovation to be “translated” into sales growth, we also checked modelsincluding a full lag structure for the innovation variables. The baseline model with 1-year lag distance between INNOV
and growth was chosen through sequential rejection of the statistical significance of more distant lags.4The PubFund dummy records any kind of public financial support for innovation activities from Spanish local or
government authorities and from the EU bodies, including tax credits or deductions, grants, subsidized loans, and loanguarantees. It excludes research and other innovation activities entirely conducted for the public sector under a specificcontract.
13

within-firm changes of INNOV proxies over time. This helps mitigating standard omitted variable
bias, which in our case can provide a relatively severe source of incorrect estimation, due to the limited
number of firm-level controls available in PITEC (as common also to other innovation surveys). In
particular, we do not have data to compute a reliable measure of productivity, which is theoretically
a crucial determinant of both growth and innovation, especially for its mediating role between input
and output of innovation suggested by innovation studies. Firm fixed-effects absorb at least the time-
invariant component of efficiency, while the time varying component remains unobserved and thus
it is possibly interacting with other controls like age, size and export status. A similar reasoning
applies to other unmeasured firm attributes that may jointly influence growth and innovation, such
as financial constraints, managerial and organizational characteristics, or input quality. We however
control for such sources of endogeneity via standard panel-GMM estimators. Conversely, quantile
regression approaches jointly controlling for fixed effects and endogenous covariates are still under
development.5
5.1 Panel estimates
We start presenting standard panel analysis of Equation (3). As a reference, we first show the
results obtained with the Fixed Effects-Within (FE) estimator, although this might be severely biased
due to endogeneity of regressors and the presence of the lagged dependent variable. Secondly, we apply
the GMM-DIFF estimator (Arellano and Bond, 1991), that mitigates endogeneity via exploiting lags of
the regressors as instruments after differencing the estimation equation.6 The instruments included in
the GMM procedure vary depending on the estimated equation. We always use lnAge, Group and year
dummies as exogenous variables, while different lags of G, INNOV , lnEmpl, Export and PubFund
are included, based on the standard Arellano-Bond tests for serial correlation and on Sargan/Hansen
tests for overidentifying restrictions. We mainly comment on the GMM results, since these are in
principle more reliable.
In Table 5 we show the models including the two measures of R&D intensity as innovation proxy.
The FE results reveal a positive and strongly significant relation between sales growth and internal
R&D intensity, whereas a much less significant association (at 10% level only) is detected with extra-
mural R&D activity. The GMM estimates corroborate the results, and external R&D in this case looses
statistical significance. The point estimates across the two estimation methods differ in magnitude,
but cannot be considered as statistically different within 1-standard error confidence band. These
findings confirm the central role of R&D as a driver of corporate growth and success on the market.
At the same time, however, they suggest that it is internally developed research that pays off, while
outsourced R&D does not support sales growth, on average at least.
Concerning the control variables, the estimated coefficients display robust patterns, irrespective
of the innovation proxy considered. We comment on GMM results which tackles the good deal of
endogeneity potentially affecting the analysis. First, we do not find any significant autocorrelation of
sales growth over time. This is in line with the vast literature on size-growth relations and Gibrat’s
5 Harding and Lamarche (2009) and Harding and Lamarche (2014) are, to our knowledge, the only works tacklingboth fixed-effects and endogeneity at the same time. There are difficulties in implementing the methods, however, sinceone does not have an equivalent to panel-GMM allowing for internal instruments.
6We prefer this estimator over the alternative GMM-SYS estimator (Blundell and Bond, 1998) since firm growth isknown to display weak persistence over time, and thus time-differences of growth are poor instruments for growth levels.
14

Table 5: Panel estimates - R&D intensity
Innovation Proxy:
Internal R&D External R&D
FE GMM FE GMM
Dep.Var. is Gt (1) (2) (3) (4)
INNOVt−1 0.2156*** 0.3837*** 0.4912* 0.5049
(0.078) (0.063) (0.289) (0.511)
Gt−1 -0.3087*** -0.2225 -0.3122*** -0.0534
(0.013) (0.178) (0.012) (0.155)
lnEmplt−1 -0.1605*** -0.1752 -0.1615*** -0.2010
(0.022) (0.229) (0.022) (0.199)
lnAget -0.1718*** -0.1888** -0.1952*** -0.1933**
(0.053) (0.038) (0.055) (0.097)
Exportt−1 0.0037 -0.0801** 0.0034 -0.0779**
(0.015) (0.038) (0.015) (0.038)
PubFundt−1 0.0014 -0.0076 0.0032 -0.0085
(0.007) (0.021) (0.007) (0.021)
Groupt−1 -0.0205 -0.0229 -0.0201 -0.0285
(0.020) (0.030) (0.020) (0.034)
Obs 26,386 21,291 26,386 21,291
AR(1) 0.016 0.001
AR(2) 0.600 0.518
Sargan 0.118 0.371
Hansen 0.333 0.370
Notes: Fixed Effects-Within (FE) and GMM-DIFF estimates ofEquation (3). Regressions include a full set of year and sector dum-mies. Robust standard errors in parenthesis, clustered at firm-level:***, ** and * indicate significance at 1%, 5% and 10% level, re-spectively. We also report p-values of Arellano-Bond test for firstand second order serial correlation, AR(1) and AR(2), together withp-values of usual Sargan and Hansen tests for overidentifying restric-tions.
law, where attempts to quantify growth rates autocorrelation provides quite mixed results, supporting
the notion that growth follows a quite erratic and difficult to predict pattern. Second, and confirming
one of the implications of Gibrat’s Law, the coefficient on lagged size (in terms of employment) is not
statistically different from zero. Third, age is always negatively correlated with firm growth, at strong
significance level, confirming the intuition that younger firms are typically growing more rapidly than
more mature firms. Fourth, export status has a negative and significant coefficient. This may be
unexpected, since the literature on micro-empirics of exports suggest that exporters typically reach
superior performance than non-exporters. Recall however that here the coefficient captures the effect
of within-firm changes of export status over time, so that the result says that becoming exporters
is associated to a reduction in sales growth. Finally, we observe a common pattern for the dummy
variables identifying public support to innovation and group membership: both do not exert any
statistically significant relation with sales growth.
Next, in Table 6, we present the estimates obtained with the indicators of product innovation,
looking at shares of sales of products new-to-the firm and of products new-to-the-market. Both
15

Table 6: Panel estimates - Product Innovation
Innovation Proxy:
Prod.New-to-firm Prod.New-to-MKT
FE GMM FE GMM
Dep.Var. is Gt (1) (2) (3) (4)
INNOVt−1 -0.0046 0.0771 0.0148 0.0464
(0.009) (0.048) (0.014) (0.030)
Gt−1 -0.3143*** -0.3129** -0.3144*** -0.1112
(0.012) (0.156) (0.012) (0.157)
lnEmplt−1 -0.1620*** -0.4146** -0.1620*** -0.2557
(0.022) (0.211) (0.022) (0.199)
lnAget -0.2079*** -0.3170*** -0.2083*** -0.2794***
(0.057) (0.082) (0.057) (0.074)
Exportt−1 0.0040 -0.1058*** 0.0040 -0.0909**
(0.015) (0.039) (0.015) (0.038)
PubFundt−1 0.0049 -0.0043 0.0045 0.0007
(0.007) (0.019) (0.007) (0.019)
Groupt−1 -0.0201 -0.0240 -0.0202 -0.0274
(0.020) (0.029) (0.020) (0.032)
Obs 26,386 21,291 26,386 21,291
AR(1) 0.021 0.002
AR(2) 0.377 0.761
Sargan 0.086 0.317
Hansen 0.336 0.261
Notes: Fixed Effects-Within (FE) and GMM-DIFF estimates ofEquation (3). Regressions include a full set of year and sector dum-mies. Robust standard errors in parenthesis, clustered at firm-level:***, ** and * indicate significance at 1%, 5% and 10% level, respec-tively. We also report p-values of Arellano-Bond test for first and sec-ond order serial correlation, AR(1) and AR(2), together with p-valuesof usual Sargan and Hansen tests for overidentifying restrictions.
variables turn out as not significant. The result is striking at first, since one expects the simple selling
of new products should spur growth. But, what we measure here is whether the effect of an increase
in the share of sales due to new products “translates” into an increase of overall sales. The result may
suggest that this share is overall small and that only few new products have a deep impact on sales,
so that in the end the contribution of product innovation vanishes, on average.
The results on the control variables (once again focusing on GMM estimates) are generally in
agreement with the patterns emerged above in the models including internal and external R&D.
The main difference is that in the specification with products new-to-the-firm, we find a negative
autocorrelation of sales growth, and a negative effect of lagged size on subsequent sales growth. Both
regressors loose their statistical significance in the model for share of sales due to products new-to-
the-market. For all the other controls, point estimates and patterns of significance are similar across
the two specifications . In line with the models including R&D variables, we confirm a negative and
significant effect of age and export status, while the dummy variables indicating public support and
group membership are confirmed to lack any statistically significant effect on sales growth.
Table 7 presents the estimates concerning the other innovation proxies. In columns 1-2 we exploit
16

Table 7: Panel estimates - Process Innov. and Embodied vs. Disembodied Tech. Change
Innovation Proxy:
Proc. Innov. Emb.Tech.Change Dis.Tech.Change
FE GMM FE GMM FE GMM
Dep.Var. is Gt (1) (2) (3) (4) (5) (6)
INNOVt−1 -0.0001 0.0058 0.3499*** -0.0004 0.9572 0.4413
(0.009) (0.162) (0.125) (0.002) (0.730) (1.139)
Gt−1 -0.3143*** -0.0710 -0.3134*** -0.0633 -0.3144*** 0.0497
(0.012) (0.199) (0.012) (0.050) (0.012) (0.092)
lnEmplt−1 -0.1621*** -0.1189 -0.1610*** -0.3686* -0.1620*** -0.4371
(0.022) (0.235) (0.022) (0.204) (0.022) (0.295)
lnAget -0.2077*** -0.2782*** -0.2031*** -0.2528*** -0.2045*** -0.1979**
(0.057) (0.085) (0.056) (0.068) (0.056) (0.078)
Exportt−1 0.0040 -0.0814** 0.0036 -0.0968** 0.0040 -0.2175**
(0.015) (0.038) (0.015) (0.038) (0.015) (0.100)
PubFundt−1 0.0048 0.0095 0.0032 -0.0091 0.0049 -0.0163
(0.007) (0.038) (0.007) (0.019) (0.007) (0.059)
Groupt−1 -0.0201 -0.0288 -0.0203 -0.0272 -0.0199 -0.0273
(0.020) (0.033) (0.020) (0.033) (0.020) (0.034)
Obs 26,386 21,291 26,386 21,291 26,386 21,291
AR(1) 0.006 0.000 0.000
AR(2) 0.678 0.115 0.048
Sargan 0.257 0.119 0.061
Hansen 0.164 0.271 0.353
Notes: Fixed Effects-Within (FE) and GMM-DIFF estimates of Equation (3). Regressionsinclude a full set of year and sector dummies. Robust standard errors in parenthesis, clusteredat firm-level: ***, ** and * indicate significance at 1%, 5% and 10% level, respectively. We alsoreport p-values of Arellano-Bond test for first and second order serial correlation, AR(1) andAR(2), together with p-values of usual Sargan and Hansen tests for overidentifying restrictions.
the binary indicator for process innovation. Both FE and GMM results reveal that process innovation
does not affect growth. The estimated coefficient are small and not significant. One explanation,
already suggested above, is that process impacts on firm efficiency, rather than directly affecting
sales growth. We thus observe here the result of a lacking relation between productivity and growth,
recently suggested in several studies documenting that markets do not work as efficient selectors in
redistributing market shares in favor of the more efficient firms (Bottazzi et al., 2008, 2010; Dosi et al.,
2015).
Next, we find no statistically significant effect in the GMM estimates for the two proxies of external
acquisition of embodied (columns 3-4) and disembodied technical change (columns 5-6). In line with
the interpretation put forward above about the effect of external R&D, an explanation for the result
calls for difficulties in managing the integration and the exploitation of knowledge and innovation
sources acquired outside the boundaries of the firm. Or, again making a parallel between external
R&D and acquisition of external knowledge, it may also be that firms tend to source from outside
only marginal “ingredients” of their overall innovation process, such that the effect on sales growth is
at best indirect and in the end nil.7
7Notice that in all the models of Table 7 the estimated coefficients on the control variables are broadly in line with
17

To sum up, the analyses deliver a negative result. The effect of innovation is, in general, quite
modest. Once controlling for firm fixed-effects and endogeneity, only investing in R&D carried out
internally stands out as a robust driver of subsequent sales growth. Of course, this conclusion only
applies to the effect on the average of the conditional distribution. In this sense, our findings are not
surprising, since they just extend to a large set of proxies of innovation the existing evidence that the
very contribution of innovative activity may be to spur extreme growth events, rather than an effect
on the average growth rate. The next Section explores exactly this issue via Fixed-Effects quantile
regressions.
Another interpretation is that, since we exploit within-firm variation, the contribution to sales
growth coming from innovation is related to the sticky components of innovation activities, washed
away with firm fixed-effects. Consider, for instance, the lacking effect we find for sales due to new
products. Our negative results would be explained by the fact that product innovators keep a relatively
persistent share of sales due to new products, while non-innovators hardly can manage to become
innovators over time. And a similar reasoning can be extended to the other innovation variables for
which we do not find significant results. However, our intuition is that this explanation can play a role
only in the case of the dummy indicator of process innovation, which is indeed fairly persistent, since
“process innovators” and “process non-innovators” tend to remain like that over the sample period.
All the other innovation proxies are instead continuous variables that change over time: for all of
them, although there is some persistence, we have verified that there is also considerable within-firm
variation.8 Recall, finally, that we tested longer lag structures, so that the lacking effect estimated for
most innovation variables cannot simply be explained by arguing that it takes more than one year for
innovation to affect growth.
5.2 Fixed-Effects quantile regressions
The distributional analysis presented in Section 4 recalls one of the major stylized facts of industrial
dynamics, stating that firm growth rates are characterized by a fat-tail distribution. This implies that
standard regression analysis, capturing the effect on the expected value of the dependent variable,
can only deliver a partial picture. Quantile regressions have become popular in recent years in the
literature on firm growth and innovation to uncover possible asymmetric effects of innovation across
the quantiles of the growth rates distribution.
We apply the fixed-effects quantile regression estimator developed in Canay (2011). The method
consists of a transformation of the response variable that allows to “wash out” the firm fixed effect.
First rewrite our baseline Equation (3) as
Gi,t = X ′
i,t−1β + ui + ǫi,t ,with E(ǫi,t|Xi, ui) = 0 (4)
where the dependent is sales growth as defined above, Xi,t contains the set of explanatory variables
the patterns observed above for the models using R&D and product innovation variables.8As a further check that the results are not driven by too little within-firm variation of the innovation proxies, we
also performed a Correlated Random Effects estimation, adding the within-firm time series averages of both innovationvariables and controls as further regressors. The coefficient estimates on the lagged innovation regressors are by definitionequivalent to the FE estimates reported above. The coefficient on the average components, capturing the time invariantpart of innovation activities, is positive and significant for all the innovation proxies but for external R&D and disembodiedtechnical change. Of course, Correlated Random Effects do not tackle endogeneity, however.
18

0.0
00
.50
1.0
01
.50
2.0
0
Inte
rna
l R
&D
(t−
1)
.1 .3 .5 .7 .9
Quantile
−2
.00
0.0
02
.00
4.0
06
.00
Exte
rna
l R
&D
(t−
1)
.1 .3 .5 .7 .9
Quantile
Figure 2: Fixed-Effects quantile regression estimates of coefficient α from Equation (3). Innovation proxies are Internal(left) and External (right) R&D intensity. The shaded areas represent 99% confidence band via bootstrapped standarderrors.
(each innovation indicator INNOV , alternatively, plus the controls), while ui and ǫi,t are the firm
fixed-effect and the standard disturbance term.
Next, the Canay (2011) estimator proceeds in two steps: (i) obtain an estimate of the individual
fixed effect through ui = ET [Gi,t −X ′
i,t−1β], where ET (.) = T−1∑T
t=1(.) and β is the standard Fixed-
Effects Within estimator of β; (ii) build a transformed response variable Gi,t = Gi,t − ui and then
obtain quantile regression coefficients through
β(τ) = argminβ∈B
EnT
[
ρτ
(
Gi,t −X ′
i,t−1β)]
, (5)
which is just a quantile regression as in Koenker and Bassett (1978) on the transformed dependent
variable. Notice that, since much like in standard regressions, fixed-effects might exacerbate the bias
due to the presence of the lagged dependent among the regressors, we estimate a static version of the
baseline model, without the autoregressive term Gt−1.
In line with the standard panel regression of the previous Section, we estimate our baseline model
separately for each innovation variable. In Figure 2, 3 and 4 we provide a graphical representation of
the results, plotting the coefficient associated to the different innovation variables across the quantiles
of the growth rates distribution.9 To evaluate statistical significance, we also show a 99% confidence
band, obtained from bootstrapped standard errors, as recommended in Koenker (2004) and Canay
(2011).
Figure 2 shows the results for internal and external R&D. We find evidence of clearcut hetero-
geneities in the effects of each indicator across the growth rates distribution. Two results are worth
noticing here, common across the two proxies. First, the coefficients are positive and significantly
different from zero for both variables in practically all the quantiles. The estimated coefficient on
external R&D is twice as larger, but so is the standard error. Second, the coefficient estimates are
smaller for shrinking firms or slow-growing firms, in the bottom quantiles, and then they steadily
moving towards the top quantiles. That is, R&D activities provide a stronger contribution to growth
performance of high-growth firms. These asymmetries are open to different interpretations. On the
9See the tables in Appendix for full set of coefficient estimates.
19

−0
.04
−0
.02
0.0
00
.02
0.0
4
Pro
d.N
ew
−to
−firm
(t−
1)
.1 .3 .5 .7 .9
Quantile
−0
.05
0.0
00
.05
0.1
0
Pro
d.N
ew
−to
−M
KT
(t−
1)
.1 .3 .5 .7 .9
Quantile
Figure 3: Fixed-Effects quantile regression estimates of coefficient α from Equation (3). Innovation proxies are % ofsales due to products new-to-the-firm (left) and % of sales due to products new-to-the-market (right). Shaded areasrepresent 99% confidence band via bootstrapped standard errors.
one hand, connecting to uncertainty of exploration and exploitation, our findings imply that shrinking
and “normal-growing” firms are more often engaged in R&D efforts that do not turn into success. On
the other hand, it may be that R&D brings successful outcomes even for these less-performing firms,
but then these firms are less able than high-growth firms to seize the returns to R&D in terms of
markets shares, due to, for instance, a generally weak competitiveness.
We comment on the effects of product innovation variables in Figure 3. Overall, sales due to
products new-to-the-market shows a statistically significant association with sales growth starting
from the median of the growth rate distribution, with the largest magnitude in the top quantiles. This
implies that product innovation is particularly relevant for high-growth. Conversely, the estimates of
the effect of sales due to products new-to-the-firm reveal do not show any statistical significance in
the right part of the growth rates distribution. Actually, there is a peculiar behavior in the left side
of the support, namely negative and strongly significant estimated coefficients across shrinking firms.
A tentative interpretation is that, despite such firms try and readjust their product range through
imitative and incremental innovations, the competitive pressure is however too strong and hampers
any recovery in sales market shares.
The results of regressions with embodied and disembodied technical change are reported in the
top plots of Figure 4. The estimated coefficients for embodied technical change tend to be small
or not even significant in the bottom quantiles, and then become positive and significant starting
from the median and through the upper quantiles. The pattern mimics what observed for R&D
and product innovation (new-to-the-market, in particular), thus confirming the generally more crucial
importance of innovation activities for high-growth firms. Conversely, disembodied technical change
does not show any significant coefficient across the entire spectrum of the growth rates distribution.
The already mentioned explanations related to lacking absorptive capacity and complex interactions
between external sourcing and growth certainly play a role here.
The same negative results applies to the relation between growth and process innovation, depicted
in the bottom plot of Figure 4, where we indeed do not observe any significant coefficient along the
growth rates quantiles. If anything, there is a mild negative effect among top-growing firms.
20

0.0
00
.50
1.0
01
.50
Em
bo
d.T
ech
.Ch
an
ge
(t−
1)
.1 .3 .5 .7 .9
Quantile
−4
.00
−2
.00
0.0
02
.00
4.0
06
.00
Dis
em
b.T
ech
.Ch
an
ge
(t−
1)
.1 .3 .5 .7 .9
Quantile
−0
.04
−0
.02
0.0
00
.02
0.0
4
Pro
c.
Inn
ov.
(t−
1)
.1 .3 .5 .7 .9
Quantile
Figure 4: Fixed-Effects quantile regression estimates of coefficient α from Equation (3). Innovation proxies are Embod-ied (top-left) vs. Disembodied (top-right) technical change, and Process Innovation (bottom). Shaded areas represent99% confidence band via bootstrapped standard errors.
Overall, fixed-effects quantile regressions allow for two major qualifications of the standard panel
analysis. First, the positive effect of internal R&D on growth is confirmed, but we discover that it
actually originates for the most part from growing and fast-growing firms. Second, we find that some of
the innovation variables which do not affect average growth do have, instead, a positive and significant
effect on sales growth of high-growth firms in the top quantiles. This is the case for external R&D,
for product innovation (new-to-the-market) and also for technical change embodied in the acquisition
of new machineries. We instead fully confirm the irrelevance of process innovation and disembodied
technical change in fostering growth.
6 Complementarities between innovation activities
Firms in reality often undertake different innovation activities at the same time. In this Section
we explore if sales growth originates from combinations of different innovation activities, rather than
from each single one.
Our key question is whether different innovation activities are complements in their effect on
growth. We explore this issue through the concept of super-modularity. In general terms, consider
a function f(X), where X is a vector of binary arguments, X={X1, X2, . . . , Xn}, with Xj = {0, 1}
21

depending whether a certain action j is undertaken or not. Action Xj and Xi are complements if f is
super-modular in Xj and Xi, that is
f(Xj ∨Xi) + f(Xj ∧Xi) ≥ f(Xcj ) + f(Xc
i ) , (6)
where Ac stands for “non-A”.
The idea is simply that the effect of choosing Xj on the objective function f is larger if also Xi
is chosen at the same time, as compared to other possible combinations where Xj appears, while Xi
is not chosen. We apply this framework to explore the super-modularity of the growth function with
respect to a set of innovation activities.
We proceed as follows. Firstly, we group our original seven innovation indicators into four cat-
egories, capturing the different types of innovation output (product or process) and the different
innovation inputs distinguishing between internal R&D and external sources. Accordingly, we define
the following dummy variables for each year:
• Internal innovation (INT) = 1 if the firm performs intra-mural R&D, and 0 otherwise.
• External innovation (EXT) = 1 if the firm performs extra-mural R&D or acquires embodied or
disembodied knowledge, and 0 otherwise.
• Product innovation (NEWP) = 1 if the firms introduces products new-to-the-market, and 0
otherwise.
• Process innovation (PROC) = 1 if the firms introduces new or significantly improved processes,
and 0 otherwise.
Of course, firms may engage in none, just one or more of these activities at the same time. The four
basic activities may be combined in 24 = 16 different possible combinations, that we label “innovation
strategies”. These are listed in Table 8. So, for instance, STR0 is a dummy that takes value 1 if a
firm does not engage in any of the four basic activities. This is also conventionally indicated as S0000.
STR1 is a strategy where a firm only engages in process innovation (S0001), and so on.
Next, we specify the growth function as a regression of sales growth against the set of alternative
strategies
G(S,Z) = f(S0001, S0010, ..., S1111,Z), (7)
where the dependent G is sales growth, Z is our set of lagged controls (including lagged growth,
size, age, export status, public finance and group membership) as in the main Equation (3), and we
normalize S0000 to zero. Notice that the strategy dummies are measured in t− 1 and can change over
time.
The definition of super-modularity of G with respect to the lattice S means that
G(S′ ∨ S′′,Z) +G(S′ ∧ S′′,Z) ≥ G(S′,Z) +G(S′′,Z) . (8)
The number of non trivial inequalities implied by this definition is 2(K−2)∑K−1
i=1 i, where K is the
number of basic categories for which one wants to assess pairwise complementarity (Topkis, 1998). In
our case, K = 4 and we thus have a total of 24 nontrivial inequality constraints, 4 for each pairwise
22

Table 8: Innovation strategies
Strategy INT EXT NEWP PROC Combination
STR0 0 0 0 0 No innoSTR1 0 0 0 1 PROCSTR2 0 0 1 0 NEWPSTR3 0 0 1 1 NEWP&PROCSTR4 0 1 0 0 EXTSTR5 0 1 0 1 EXT&PROCSTR6 0 1 1 0 EXT&NEWPSTR7 0 1 1 1 EXT&NEWP&PROCSTR8 1 0 0 0 INTSTR9 1 0 0 1 INT&PROCSTR10 1 0 1 0 INT&NEWPSTR11 1 0 1 1 INT&NEWP&PROCSTR12 1 1 0 0 INT&EXTSTR13 1 1 0 1 INT&EXT&PROCSTR14 1 1 1 0 INT&EXT&NEWPSTR15 1 1 1 1 INT&EXT&NEWP&PROC
combination of basic innovation activities. Labeling as bj the coefficient on the dummy STRj estimated
from Equation (7), the constraints can be compactly written as:
• Complementarity INT-EXT: b8+s + b4+s ≤ b0+s + b12+s with s = 0, 1, 2, 3
• Complementarity INT-NEWP: b8+s + b2+s ≤ b0+s + b10+s with s = 0, 1, 4, 5
• Complementarity INT-PROC: b8+s + b1+s ≤ b0+s + b9+s with s = 0, 2, 4, 6
• Complementarity EXT-NEWP: b4+s + b2+s ≤ b0+s + b6+s with s = 0, 1, 8, 9
• Complementarity EXT-PROC: b4+s + b1+s ≤ b0+s + b5+s with s = 0, 2, 8, 10
• Complementarity NEWP-PROC: b2+s + b1+s ≤ b0+s + b3+s with s = 0, 4, 8, 12
For each pair, the constraints must hold jointly. To implement the test, we exploit the Wald-type
statistic and the procedure derived in Kodde and Palm (1986). Let γ = (b0001, b0010, ..., b1111)′ be the
coefficients to be estimated from the growth function in (7). Then, the test statistic is given as
D = (Cγ − Cγ)′(C ′cov(γ)C)−1(Cγ − Cγ) (9)
with
γ = argminγ
(Cγ − Cγ)′(C ′cov(γ)C)−1(Cγ − Cγ) s.t. Cγ ≤ 0 (10)
where γ is the estimate of γ from the growth function in (7) and cov(γ) the associated covariance
matrix, while C is a matrix that maps the coefficients into the inequality constraints stated above. The
23

set of coefficient γ is obtained as the closest value to the estimates of γ under the restrictions imposed
by the matrix C, and it can be computed via quadratic minimization under inequality constraints.
The D statistic does not have an exact distribution, but Kodde and Palm (1986) provide lower and
upper bounds for different levels of significance. The null of complementarity is accepted for values
of D below the lower bound and it is rejected for values above the upper bound, whereas the test is
inconclusive if the estimated D falls in between the two bounds.
The main requirement for the procedure to work is that γ is a consistent estimate of γ. Thus, we
estimate the growth function via the GMM-DIFF estimator. This allows, once again, to control for
firm fixed-effects and endogeneity of innovation strategies and controls.
Results are presented in Table 9. In the left panel we show the estimates of the growth function.
The set of instruments includes lags of growth and controls, as well as lag-2 of the innovation strategies
in the set S. The coefficients on the strategies are all positive, but most of them are not significant,
except for STR4 (i.e., EXT alone), STR8 (INT alone), STR10 (combination of INT and NEWP), and
STR13 (INT+EXT+PROC). The coefficients as such convey little information, as they do not provide
a formal test of complementarity. The super-modularity tests are presented in the right panel. We
show the estimatedD statistic for the different pairwise combinations of the basic innovation activities.
We report in bold the combinations where the null of complementarity cannot be rejected at the 10%
level, which is the standard significance level in previous studies exploiting our methodology.
Results support complementarity only in two cases. First, we find evidence of complementarity
between INT and NEWP, implying that these two activities exerts a super-additive effect in terms of
sales growth. We therefore confirm the crucial role of internal R&D, but we can add that internal R&D
pays more in terms of growth when it is coupled with the introduction of new products. The other
side of the coin in reading of the result is that the introduction of new products (new-to-the-market)
per se impact less on growth when undertaken alone than when undertaken jointly with formal R&D
carried out internally.
Second, there is complementarity between process and product innovation. This result, on the one
hand, further highlights that product innovation is more beneficial when coupled with other activities,
as we just saw for its combination with internal R&D. On the other hand, we recover here a role for
process innovation. While in the panel and quantile analysis we concluded that process innovation
alone does not directly affect growth, we now find that restructuring of production processes is effective
if combined with product innovation (in products new-to-the-market). Conversely, process innovation
is not complement nor with internal R&D, neither with external innovation.
Indeed, we do not detect any complementarity of external sourcing of knowledge with none of the
other innovation activities. This finding once again recall the already emerged difficulties in integrating
knowledge and technologies produced outside the firm, due to, e.g., complex coordination with external
“providers” or to weak absorptive capacity. In this respect, the analysis of complementarity confirms
the conclusion emerging from the analysis of the separate role of external R&D and of embodied and
disembodied technical change.
24

Table 9: Estimation results & complementarity test
Estimation Complementarity testDep.Var. is Gt (1) Pair Wald statistic
STR1,t−1 0.0293 INT-EXT 5.3215(0.063) INT-NEWP 1.6045
STR2,t−1 0.0769 INT-PRO 4.8413(0.147) EXT-NEWP 3.0288
STR3,t−1 0.1986 EXT-PRO 6.0155(0.155) NEWP-PRO 1.6156
STR4,t−1 0.4623**(0.208)
STR5,t−1 0.0309(0.080)
STR6,t−1 -0.1448(0.454)
STR7,t−1 0.1330(0.140)
STR8,t−1 0.1798**(0.090)
STR9,t−1 0.0300(0.102)
STR10,t−1 0.1849*(0.105)
STR11,t−1 0.1464(0.114)
STR12,t−1 0.0886(0.123)
STR13,t−1 0.1888**(0.095)
STR14,t−1 0.2091(0.129)
STR15,t−1 0.1160(0.104)
Gt−1 -0.3042***(0.092)
lnEmplt−1 -0.1279(0.180)
lnAget -0.3182***(0.074)
Exportt−1 -0.2848**(0.120)
PubFundt−1 0.0324(0.069)
Groupt−1 -0.0323(0.031)
Obs 21,291AR(1) 0.000AR(2) 0.133Sargan 0.120Hansen 0.131
Notes: GMM-DIFF estimates of Equation (7). Regression includesa full set of year dummies. Robust standard errors in parenthesis,clustered at firm-level: ***, ** and * indicate significance at 1%,5% and 10% level, respectively. We also report p-values of Arellano-Bond test for first and second order serial correlation, AR(1) andAR(2), together with p-values of usual Sargan and Hansen tests foroveridentifying restrictions.Complementarity test: bold values indicate acceptance of comple-mentarity at 10% significance level (lower bound = 1.642, upperbound = 7.094).
25

7 Conclusions
The relation between innovation and firm growth has for long interested economists. While theory
tends to predict a strong positive link, the empirical literature provides mixed results. Moreover, de-
spite the multifaceted and complex nature of innovation is often recognized, there is a disproportionate
tendency to look at traditional measures of innovative activity such as R&D and patents.
This paper, by taking advantage of a rich panel on innovation activity of Spanish manufacturing
firms, provides new insights on the relations between success on the market, in terms of sales growth,
and a richer set of innovation dimensions, capturing innovation inputs and outputs as well as different
modes of sourcing new knowledge.
The overall picture emerging from the analysis suggests a good deal of heterogeneity in the capacity
of different innovation activities to support expansion of sales and market shares.
First, from standard panel regression analysis, controlling for firm fixed-effects and endogeneity,
we find that internal R&D is the only innovation indicator significantly (and positively) related with
sales growth. Conversely, we do not find any statistically significant relation between growth and
external R&D, process innovation, sales due to new products, as well as no effect is detected for ac-
quisitions of embodied or disembodied new technologies. This negative result is striking, at first, but
there are explanations for some of the findings. The lacking correlation between external sourcing of
new knowledge or new technologies (external R&D, purchases of disembodied and embodied technical
change) supports the view that valuable knowledge is inherently firm-specific. Firms may face difficul-
ties in establishing effective collaboration with external providers, or may lack of specific absorptive
capacities in integrating external knowledge and technologies within the firm. The equally lacking
effect of process innovation can be interpreted as a signal that new processes are primarily designed to
improve efficiency or to change production modes, and may affect sales growth only indirectly and in
later stages. And, finally, the weak role of product innovation may just reflect that the share of sales
due to new products is on average small. Overall, we confirm previous studies that highlight how the
effect of innovation activities on average growth may be difficult to detect.
Second, we recover a positive effect for most of the innovation variables when we look at their
association with growth along the quantiles of the growth rates distribution. Fixed-effects quantile
regressions show that most innovation variables, with the exception of process innovation and disem-
bodied technical change, have a positive and significant association with growth in the top quantiles,
that is for high-growth firms. This result adds to the emerging literature underlying the peculiarities
of high-growth firms, which has so far explored a more limited set of innovation indicators (R&D and
patents) as drivers of growth, and generally without controlling for unobserved heterogeneity.
Finally, the analysis of the complementarities between innovation activities adds further insights.
We confirm the importance of internal R&D as a driver of sales growth, but we also find that also
product and process innovation represent sources of relevant complementarities. Indeed, we find that
the beneficial effect of internal R&D on sales growth is stronger when coupled with product innovation,
and that process and product innovation have a stronger association with growth if carried out jointly
than alone. Therefore, a mix of R&D and product innovation, as well as a mix of process and product
innovation emerge as the two more valuable strategies, providing a stronger positioning that allow
firms to expand their market shares.
The research agenda is of course open to further developments, in particular to extend the analysis
26

on the interactions among different innovation activities we consider here. We foresee many possible
extensions. First, perhaps with richer datasets longer in time, one might identify the effect of sequen-
tial adoption of basic innovation strategies, exploring in more details whether, e.g., acquisition of new
machineries turns out to have a positive impact on growth only after a subsequent process innovation
related to that acquisition is implemented. Or, second, although our analysis of complementarities
already incorporates the idea that firms engage in a different number and in different types of basic
innovation activities, one can imagine to deepen the analysis of the relation between growth and the
degree of “complexity” of firm’s innovation strategies. For instance, one may think of taxonomies
seeking to characterize complexity in terms of some measure of the coherence among the different
innovation activities performed within each firm, and assess whether this translates into differential
patterns of growth. Our results, so far, suggest that a combination of internal R&D, process and prod-
uct innovation is the key candidate to provide the more effective mix of growth-enhancing strategies,
especially in view of their observed strong relation with high-growth episodes.
27

Appendix
For completeness, we present tables reporting all the coefficient estimates from fixed-effects quantile
regressions applied to our baseline model as Section 5.2. Graphical representation of the results
obtained for each innovation variable, and related comments, are presented in the main text.
Table 10: Quantile regressions – Internal R&D
Quantile (%)
10 25 50 75 90
Internal R&Dt−1 0.158*** 0.283*** 0.475*** 0.735*** 1.296***
(0.051) (0.061) (0.031) (0.105) (0.288)
lnEmplt−1 -0.193*** -0.209*** -0.222*** -0.235*** -0.250***
(0.003) (0.002) (0.001) (0.002) (0.003)
lnAget -0.071*** -0.088*** -0.101*** -0.113*** -0.129***
(0.005) (0.003) (0.002) (0.003) (0.005)
Exportt−1 0.047*** 0.022*** 0.009*** -0.002 -0.014
(0.009) (0.004) (0.003) (0.005) (0.009)
PubFundt−1 -0.000 -0.003 -0.008*** -0.004 -0.014*
(0.006) (0.003) (0.002) (0.003) (0.007)
Groupt−1 -0.045*** -0.029*** -0.019*** -0.008** 0.018**
(0.006) (0.004) (0.003) (0.004) (0.008)
Observations 26,386 26,386 26,386 26,386 26,386
Industry dummies Yes Yes Yes Yes Yes
Time dummies Yes Yes Yes Yes Yes
Notes: Fixed-effects quantile regression estimates of Equation (3). Bootstrapped standard errors inparenthesis. ***, ** and * indicate significance on a 1%, 5% and 10% level, respectively.
28

Table 11: Quantile regressions – External R&D
Quantile (%)
10 25 50 75 90
External R&Dt−1 0.258* 0.495*** 0.659*** 1.046*** 3.182**
(0.135) (0.147) (0.100) (0.276) (1.373)
lnEmplt−1 -0.194*** -0.212*** -0.225*** -0.238*** -0.256***
(0.003) (0.002) (0.001) (0.001) (0.003)
lnAget -0.102*** -0.121*** -0.136*** -0.148*** -0.167***
(0.005) (0.003) (0.002) (0.003) (0.005)
Exportt−1 0.049*** 0.021*** 0.009*** -0.001 -0.017*
(0.009) (0.004) (0.003) (0.005) (0.009)
PubFundt−1 -0.002 -0.002 -0.002 0.004 -0.002
(0.006) (0.003) (0.002) (0.003) (0.008)
Groupt−1 -0.046*** -0.029*** -0.020*** -0.009** 0.017**
(0.006) (0.004) (0.003) (0.004) (0.008)
Observations 26,386 26,386 26,386 26,386 26,386
Industry dummies Yes Yes Yes Yes Yes
Time dummies Yes Yes Yes Yes Yes
Notes: Fixed-effects quantile regression estimates of Equation (3). Bootstrapped standard errors inparenthesis. ***, ** and * indicate significance on a 1%, 5% and 10% level, respectively.
Table 12: Quantile regressions – Prod.New-to-firm
Quantile (%)
10 25 50 75 90
Prod.New-to-firmt−1 -0.026*** -0.011*** -0.002 0.003 0.009
(0.008) (0.004) (0.004) (0.005) (0.008)
lnEmplt−1 -0.193*** -0.212*** -0.225*** -0.240*** -0.258***
(0.003) (0.002) (0.001) (0.001) (0.003)
lnAget -0.114*** -0.135*** -0.150*** -0.163*** -0.183***
(0.005) (0.003) (0.002) (0.003) (0.005)
Exportt−1 0.049*** 0.022*** 0.009*** -0.000 -0.019**
(0.009) (0.004) (0.003) (0.004) (0.010)
PubFundt−1 -0.003 -0.001 -0.002 0.007*** 0.013**
(0.006) (0.003) (0.003) (0.003) (0.006)
Groupt−1 -0.048*** -0.030*** -0.019*** -0.008** 0.015*
(0.006) (0.004) (0.003) (0.004) (0.008)
Observations 26,386 26,386 26,386 26,386 26,386
Industry dummies Yes Yes Yes Yes Yes
Time dummies Yes Yes Yes Yes Yes
Notes: Fixed-effects quantile regression estimates of Equation (3). Bootstrapped standard errors in paren-thesis. ***, ** and * indicate significance on a 1%, 5% and 10% level, respectively.
29

Table 13: Quantile regressions – Prod.New-to-MKT
Quantile (%)
10 25 50 75 90
Prod.New-to-MKTt−1 -0.026** -0.012* 0.013** 0.027*** 0.057***
(0.013) (0.007) (0.006) (0.009) (0.013)
lnEmplt−1 -0.193*** -0.212*** -0.226*** -0.240*** -0.258***
(0.003) (0.002) (0.001) (0.001) (0.003)
lnAget -0.115*** -0.135*** -0.150*** -0.164*** -0.182***
(0.005) (0.003) (0.002) (0.003) (0.004)
Exportt−1 0.050*** 0.023*** 0.010*** -0.000 -0.019**
(0.009) (0.005) (0.003) (0.004) (0.009)
PubFundt−1 -0.003 -0.001 -0.002 0.007*** 0.011*
(0.006) (0.003) (0.002) (0.003) (0.006)
Groupt−1 -0.048*** -0.030*** -0.020*** -0.008** 0.015**
(0.006) (0.004) (0.003) (0.004) (0.007)
Observations 26,386 26,386 26,386 26,386 26,386
Industry dummies Yes Yes Yes Yes Yes
Time dummies Yes Yes Yes Yes Yes
Notes: Fixed-effects quantile regression estimates of Equation (3). Bootstrapped standard errors in parenthe-sis. ***, ** and * indicate significance on a 1%, 5% and 10% level, respectively.
Table 14: Quantile regressions – Process Innovation dummy
Quantile (%)
10 25 50 75 90
Proc. Innovt−1 0.009 0.009*** 0.001 -0.004 -0.018**
(0.007) (0.003) (0.002) (0.003) (0.007)
lnEmplt−1 -0.193*** -0.213*** -0.226*** -0.240*** -0.259***
(0.003) (0.002) (0.001) (0.001) (0.003)
lnAget -0.114*** -0.134*** -0.150*** -0.164*** -0.182***
(0.005) (0.003) (0.002) (0.003) (0.005)
Exportt−1 0.048*** 0.021*** 0.010*** 0.001 -0.011
(0.010) (0.005) (0.003) (0.005) (0.010)
PubFundt−1 -0.007 -0.002 -0.002 0.008*** 0.017***
(0.006) (0.003) (0.002) (0.003) (0.006)
Groupt−1 -0.048*** -0.030*** -0.019*** -0.008** 0.018**
(0.006) (0.004) (0.003) (0.004) (0.008)
Observations 26,386 26,386 26,386 26,386 26,386
Industry dummies Yes Yes Yes Yes Yes
Time dummies Yes Yes Yes Yes Yes
Notes: Fixed-effects quantile regression estimates of Equation (3). Bootstrapped standard errors inparenthesis. ***, ** and * indicate significance on a 1%, 5% and 10% level, respectively.
30

Table 15: Quantile regressions – Embod.Tech.Change
Quantile (%)
10 25 50 75 90
Emb.Tech.Changet−1 0.144 0.176** 0.271*** 0.479*** 0.806***
(0.090) (0.084) (0.066) (0.104) (0.301)
lnEmplt−1 -0.192*** -0.211*** -0.225*** -0.239*** -0.258***
(0.003) (0.002) (0.001) (0.001) (0.003)
lnAget -0.111*** -0.131*** -0.145*** -0.159*** -0.181***
(0.005) (0.003) (0.002) (0.003) (0.005)
Exportt−1 0.046*** 0.021*** 0.008** -0.001 -0.019**
(0.009) (0.005) (0.003) (0.005) (0.010)
PubFundt−1 -0.003 -0.002 -0.002 0.007** 0.010
(0.006) (0.003) (0.002) (0.003) (0.006)
Groupt−1 -0.047*** -0.029*** -0.019*** -0.007** 0.018**
(0.006) (0.004) (0.003) (0.004) (0.008)
Observations 26,386 26,386 26,386 26,386 26,386
Industry dummies Yes Yes Yes Yes Yes
Time dummies Yes Yes Yes Yes Yes
Notes: Fixed-effects quantile regression estimates of Equation (3). Bootstrapped standard errors in paren-thesis. ***, ** and * indicate significance on a 1%, 5% and 10% level, respectively.
Table 16: Quantile regressions – Disemb.Tech.Change
Quantile (%)
10 25 50 75 90
Dis.Tech.Changet−1 -0.395 -0.202 1.146* 1.006 2.184
(1.476) (0.907) (0.632) (1.006) (2.259)
lnEmplt−1 -0.194*** -0.212*** -0.226*** -0.240*** -0.259***
(0.003) (0.002) (0.001) (0.001) (0.003)
lnAget -0.112*** -0.132*** -0.147*** -0.161*** -0.181***
(0.005) (0.003) (0.002) (0.003) (0.005)
Exportt−1 0.046*** 0.022*** 0.009*** -0.000 -0.021**
(0.009) (0.004) (0.003) (0.005) (0.009)
PubFundt−1 -0.003 -0.002 -0.002 0.008*** 0.014**
(0.006) (0.003) (0.002) (0.003) (0.006)
Groupt−1 -0.046*** -0.029*** -0.019*** -0.008** 0.017**
(0.006) (0.004) (0.003) (0.004) (0.008)
Observations 26,386 26,386 26,386 26,386 26,386
Industry dummies Yes Yes Yes Yes Yes
Time dummies Yes Yes Yes Yes Yes
Notes: Fixed-effects quantile regression estimates of Equation (3). Bootstrapped standard errors in paren-thesis. ***, ** and * indicate significance on a 1%, 5% and 10% level, respectively.
31

References
Aghion, P., N. Bloom, R. Blundell, R. Griffith, and P. Howitt (2005): “Competition and
Innovation: an Inverted-U Relationship,” The Quarterly Journal of Economics, 120, 701–728.
Aghion, P. and P. Howitt (1992): “A Model of Growth through Creative Destruction,” Econo-
metrica, 60, 323–51.
Arellano, M. and S. Bond (1991): “Some tests of specification for panel data: Monte Carlo
evidence and an application to employment equations,” The Review of Economic Studies, 58, 277–
297.
Audretsch, D. B., A. Coad, and A. Segarra (2014): “Firm growth and innovation,” Small
Business Economics, 43, 743–749.
Blundell, R. and S. Bond (1998): “Initial conditions and moment restrictions in dynamic panel
data models,” Journal of econometrics, 87, 115–143.
Bottazzi, G., G. Dosi, N. Jacoby, A. Secchi, and F. Tamagni (2010): “Corporate performances
and market selection: some comparative evidence,” Industrial and Corporate Change, 19, 1953–1996.
Bottazzi, G., G. Dosi, M. Lippi, F. Pammolli, and M. Riccaboni (2001): “Innovation and
corporate growth in the evolution of the drug industry,” International Journal of Industrial Orga-
nization, 19, 1161–1187.
Bottazzi, G. and A. Secchi (2006): “Explaining the distribution of firm growth rates,” The RAND
Journal of Economics, 37, 235–256.
Bottazzi, G., A. Secchi, and F. Tamagni (2008): “Productivity, profitability and financial per-
formance,” Industrial and Corporate Change, 17, 711–751.
Canay, I. A. (2011): “A simple approach to quantile regression for panel data,” The Econometrics
Journal, 14, 368–386.
Cassiman, B. and R. Veugelers (2006): “In Search of Complementarity in Innovation Strategy:
Internal R&D and External Knowledge Acquisition,” Management Science, 52, 68–82.
Catozzella, A. and M. Vivarelli (2014): “The Catalysing Role of In-House R&D in Fostering
Complementarity Among Innovative Inputs,” Industry and Innovation, 21, 179–196.
Coad, A. (2009): The Growth of Firms: A Survey of Theories and Empirical Evidence, Cheltenham,
UK: Edward Elgar Publishing.
Coad, A., S.-O. Daunfeldt, W. Hlzl, D. Johansson, and P. Nightingale (2014): “High-
growth firms: introduction to the special section,” Industrial and Corporate Change, 23, 91–112.
Coad, A. and R. Rao (2008): “Innovation and firm growth in high-tech sectors: A quantile regres-
sion approach,” Research Policy, 37, 633–648.
32

Coad, A., A. Segarra, and M. Teruel (2016): “Innovation and Firm Growth: Does Age Play a
role?” Research Policy, forthcoming, 45, 387–400.
Colombelli, A., N. Haned, and C. Le Bas (2013): “On firm growth and innovation: Some new
empirical perspectives using French CIS (1992–2004),” Structural Change and Economic Dynamics,
26, 14–26.
Conte, A. and M. Vivarelli (2014): “Succeeding in innovation: key insights on the role of R&D
and technological acquisition drawn from company data,” Empirical Economics, forthcoming.
Corsino, M. and R. Gabriele (2011): “Product innovation and firm growth: evidence from the
integrated circuit industry,” Industrial and Corporate Change, 20, 29–56.
Crepon, B., E. Duguet, and J. Mairessec (1998): “Research, Innovation And Productivity:
An Econometric Analysis At The Firm Level,” Economics of Innovation and New Technology, 7,
115–158.
Cucculelli, M. and B. Ermini (2012): “New product introduction and product tenure: What
effects on firm growth?” Research Policy, 41, 808–821.
Dosi, G. (2007): “Statistical regularities in the evolution of industries: a guide through some evidence
and challenges for the theory,” in Perspectives on innovation, Cambridge, UK: Cambridge University
Press.
Dosi, G., D. Moschella, E. Pugliese, and F. Tamagni (2015): “Productivity, market selection,
and corporate growth: comparative evidence across US and Europe,” Small Business Economics,
45, 643–672.
Falk, M. (2012): “Quantile estimates of the impact of R&D intensity on firm performance,” Small
Business Economics, 39, 19–37.
Fligner, M. A. and G. E. Policello (1981): “Robust rank procedures for the Behrens-Fisher
problem,” Journal of the American Statistical Association, 76, 141–206.
Freel, M. S. (2000): “Do Small Innovating Firms Outperform Non-Innovators?” Small Business
Economics, 14, 195–210.
Geroski, P. and S. Machin (1992): “Do Innovating Firms Outperform Non-Innovators?” Business
Strategy Review, 3, 79–90.
Geroski, P. and M. Mazzucato (2002): “Learning and the sources of corporate growth,” Industrial
and Corporate Change, 11, 623–644.
Geroski, P. A. (2002): “The Growth of Firms in Theory and in Practice,” in Competence, Gov-
ernance, and Entrepreneurship - Advances in Economic Strategy Research, ed. by N. Foss and
V. Mahnke, Oxford University Press: Oxford and New York.
Geroski, P. A., J. Van Reenen, and C. F. Walters (1997): “How persistently do firms inno-
vate?” Research Policy, 26, 33–48.
33

Goedhuys, M. and R. Veugelers (2012): “Innovation strategies, process and product innovations
and growth: Firm-level evidence from Brazil,” Structural Change and Economic Dynamics, 23,
516–529.
Griffith, R., E. Huergo, J. Mairesse, and B. Peters (2006): “Innovation and Productivity
across Four European Countries,” Oxford Review of Economic Policy, 22, 483–498.
Hall, B. H., F. Lotti, and J. Mairesse (2008): “Employment, innovation, and productivity:
evidence from Italian microdata,” Industrial and Corporate Change, 17, 813–839.
——— (2009): “Innovation and Productivity in SMEs: Empirical Evidence for Italy,” Small Business
Economics, 33, 13–33.
Harding, M. and C. Lamarche (2009): “A quantile regression approach for estimating panel data
models using instrumental variables,” Economics Letters, 104, 133–135.
——— (2014): “Estimating and testing a quantile regression model with interactive effects,” Journal
of Econometrics, 178, 101–113.
Hay, M. and K. Kamshad (1994): “Small Firm Growth: Intentions, Implementation and Impedi-
ments,” Business Strategy Review, 5, 49–68.
Holzl, W. (2009): “Is the R&D behaviour of fast-growing SMEs different? Evidence from CIS III
data for 16 countries,” Small Business Economics, 33, 59–75.
Karlsson, C. and S. Tavassoli (2016): “Innovation strategies of firms: What strategies and why?”
The Journal of Technology Transfer, forthcoming.
Kodde, D. A. and F. C. Palm (1986): “Wald criteria for jointly testing equality and inequality
restrictions,” Econometrica: journal of the Econometric Society, 1243–1248.
Koenker, R. (2004): “Quantile regression for longitudinal data,” Journal of Multivariate Analysis,
91, 74–89.
Koenker, R. and J. Bassett, Gilbert (1978): “Regression Quantiles,” Econometrica, 46, 33–50.
Leiponen, A. (2005): “Skills and Innovation,” International Journal of Industrial Organization, 23,
303–323.
Mairesse, J. and P. Mohnen (2010): “Using Innovations Surveys for Econometric Analysis,”
NBER Working Papers 15857, National Bureau of Economic Research, Inc.
Mairesse, J. and S. Robin (2009): “Innovation and Productivity: a Firm-level Analysis for French
Manufacturing and Services Using CIS3 and CIS4 Data (19981700 and 20021704),” Mimeo.
Mansfield, E. (1962): “Entry, Gibrat’s Law, Innovation, and the Growth of Firms,” The American
Economic Review, 52, 1023–1051.
Mazzucato, M. and S. Parris (2015): “High-growth firms in changing competitive environments:
the US pharmaceutical industry (1963 to 2002),” Small Business Economics, 44, 145–170.
34

Mohnen, P. and L.-H. Roller (2005): “Complementarities in innovation policy,” European Eco-
nomic Review, 49, 1431–1450.
Mowery, D. C. (1983): “Economic Theory and Government Technology Policy,” Policy Sciences,
16, 27–43.
Nelson, R. R. and S. G. Winter (1982): An Evolutionary Theory of Economic Change, The
Belknap Press of Harvard University Press: Cambridge, MA.
Nunes, P. M., Z. Serrasqueiro, and J. Leito (2012): “Is there a linear relationship between
R&D intensity and growth? Empirical evidence of non-high-tech vs. high-tech SMEs,” Research
Policy, 41, 36–53.
Parisi, M. L., F. Schiantarelli, and A. Sembenelli (2006): “Productivity, innovation and R&D:
Micro evidence for Italy,” European Economic Review, 50, 2037–2061.
Pellegrino, G., M. Piva, and M. Vivarelli (2012): “Young Firms and Innovation: A Microe-
conometric Analysis,” Structural Change and Economic Dynamics, 23, 329–340.
Santamaria, L., M. J. Nieto, and A. Barge-Gil (2009): “Beyond Formal R&D: Taking Advan-
tage of Other Sources of Innovation in Low- and Medium-Technology Industries,” Research Policy,
38, 507–517.
Segarra, A. and M. Teruel (2014): “High-growth firms and innovation: an empirical analysis for
Spanish firms,” Small Business Economics, forthcoming.
Stam, E. and K. Wennberg (2009): “The roles of R&D in new firm growth,” Small Business
Economics, 33, 77–89.
Stanley, M. H. R., L. A. N. Amaral, S. V. Buldyrev, S. Havlin, H. Leschhorn, P. Maass,
M. A. Salinger, and H. E. Stanley (1996): “Scaling behaviour in the growth of companies,”
Nature, 379, 804–806.
Storey, D. J. (1994): Understanding the Small Business Sector, London: Cengage Learning EMEA.
Topkis, D. M. (1998): Supermodularity and complementarity, Princeton university press.
Vivarelli, M. (2014): “Innovation, Employment and Skills in Advanced and Developing Countries:
A Survey of Economic Literature,” Journal of Economic Issues, 48, 123–154.
35