Embed Size (px)
Citation preview

1
Working Paper
IIMK/WPS/198/EA/2016/09
May 2016
Historical Events and the Gold Price
Shubhasis Dey1
1 Associate Professor, Economics, Indian Institute of Management Kozhikode, IIMK Campus P.O, Kerala
673570, India, Email: [email protected], Phone Number (+91) 4952809115

2
Abstract
Gold prices are quick to respond to world events. However, some of these events stand out, in the sense that
they have had significant influence on the conditional mean and volatility of gold prices. In this paper, we have
taken 30 historical events ranging from the suspension of dollar’s convertibility into gold in August 1971 to the
end of the Quantitative Easing in the US in October 2014 and studied their impact on real gold prices. We find
that the US economy and the current dollar-based monetary system is still the main driver of real gold prices.
Our empirical exercise in this paper finds that the mean and variance of real gold prices have experienced
significant changes primarily when the historical events in question either reinforced or challenged the
economic dominance of the US and the role of dollar in the global monetary system.
Keywords: Gold prices; historical events; hedge; safe haven
JEL: E4; G1; C52; C58
3
1. Introduction
In the course of human history, one of the most important roles that gold has played is
that of money – a medium of exchange, a store of value and a unit of account. With the
advent of modern paper currencies, gold lost is role as a medium of exchange and a unit of
account; however, until the collapse of the Bretton Woods fixed exchange rate system, it
continued to play a role of a real anchor over which all other monies were valued. Beyond its
ornamental and industrial usage today, gold seems to have lost most of its monetary role,
only playing a role of a store of value – an investment. However, a careful analysis of the
dynamics of gold price points to the fact that, whenever the dominance of the major
currencies of the world has been challenged, either by way of geopolitical events, such as
wars, mayhem and political turmoil or by the devaluing effects of inflation and balance of
payment problems, we have seen a resurgence in the role of gold. In this paper, we have
taken 30 historical events from a period between April 1968 and December 2015 that we
believe have profoundly impacted the world gold market and tested their impact on the mean
and volatility of real gold prices. Our results indicate that the significant influences on real
gold prices came primarily from historical events that either reinforced or challenged the
economic dominance of the US and the role of dollar in the global monetary system.
For commodities that mainly act as intermediate inputs to production, such as crude
oil, conflicts that lead to or have potential to cause supply disruptions are expected to affect
prices. Noguera-Santaella (2016) contribute to the long literature exploring the effects of
geopolitical events on economic variables by way of extending this analysis to the oil market.
As surveyed by O’Connor et al. (2015), the economics of the gold market, however, is more
nuanced. The authors show that although gold has some industrial use, the overwhelming
majority of its demand originates from jewellery and investment demand.1 The industrial
demand for gold, which comes mainly from dentistry and electronics has been declining over
time. The sociocultural factors that sustain the jewellery demand in Asia, and mainly in China
and India, have also ensured a stable demand for physical gold in the world. The investment
demand for gold has, however, been increasing over time and quite dramatically so from
2002. The gold investment demand comes mainly from demand for gold bars and coins and
since 2003 the gold Exchange Traded Funds (ETFs) have also been a positive contributor.
1 See O’Connor et al. (2015) for a survey of the academic research on jewellery and industrial gold demand.
4
As opposed to other storable commodities, as pointed out by O’Connor et al. (2015),
the annual new gold supply is just 1% of its existing stock. This makes release of existing
gold stocks into the market to be more important drivers of gold prices than the new supply,
which comes from two main sources: mining and scrap. The academic literature supports this
hypothesis as the majority of authors surveyed by O’Connor et al. (2015) argue that gold
miners are price takers and not price makers. Moreover, Borenstein and Farrell (2007) by
searching through 28 years of Wall Street Journal find no mention of supply shocks having
an effect on gold price. The authors’ findings were also corroborated by the interviews they
held with mining executives.
O’Connor et al. (2015), however, find no significant academic research exploring the link
between the supply of scrap gold and gold price. However, if gold miners are found to be
price takers, we argue that gold scrap producers will also be the same. Feldstein (1980)
argues that central bank gold sales, which is the primary means by which existing gold stocks
are released into the market, must have a negative impact on world gold prices. In fact
O’Connor et al. (2015) argue that central bank gold sales has been a major contributor to the
gold bear market of the 1990’s.
A dominant motive behind investors’ demand for gold, as discussed in the literature, is its
apparent ability to be a hedge asset. Baur and Lucey (2010) define a hedge as “an asset that is
uncorrelated or negatively correlated with another asset or portfolio on average.” Sumner,
Johnson, and Soenen (2010) find almost no real return and volatility spillovers to gold from
US stocks and bonds. Chua, Sick, and Woodward (1990) also find gold to be a low Beta
asset. Another line of research try to find the optimal weight for gold in an investment
portfolio [see Jaffe (1989), Hillier, Draper, and Faff (2006), Lucey, Tully, and Poti (2006),
Bruno and Chincarini (2010), and Emmrich and McGroarty (2013).] Using various
methodologies, these authors find gold’s portfolio weight to vary from 0.1% to 12%.
Not only does gold exhibit hedging capabilities against stocks and bonds, the literature
finds that it also provides a hedge against other currencies, and in particular, against the US
dollar [see Capie, Mills, and Wood (2005), Joy (2011), Reboredo (2013), Lu and Hamori
(2013), and Reboredo and Rivera-Castro (2014)].
Just as appreciation and depreciation of a currency changes its valuation vis-à-vis other
currencies, inflation and disinflation (deflation) changes its valuation vis-à-vis real goods and
services. Therefore, there is an active literature investigating gold’s role as an inflation hedge.
5
Using data for different countries, observed in different frequencies and using a wide range of
methodologies, a large body of literature finds empirical support of gold as an effective
inflation hedge [see Fama and Schwert (1977), Levin et al. (1994), Taylor (1998), Adrangi et
al. (2003), Levin et al. (2006), Worthington and Pahlavani (2007), Beckmann and Czudaj
(2013), Batten et al. (2014), Dey (2014), and Bampinas and Panagiotidis (2015)].
Yet another attractiveness of gold as an asset is its apparent ability to act as a safe haven.
Baur and McDermott (2010) define a safe haven as “an asset that is negatively correlated
(uncorrelated) with another asset or portfolio in certain periods only, e.g. in times of falling
stock markets.” Baur and Lucey (2010) find gold to be a safe haven for US, UK and German
stocks but not bonds. By extending this analysis for a wider set of countries, Baur and
McDermott (2010) find gold to be a safe haven for major European stock markets and the US
but not for Australia, Canada, Japan and large emerging markets such as the BRIC countries.
Major world currencies such as US dollar, UK pound and Euro are often viewed by
investors as safe haven assets. It is interesting to note that the literature finds gold to provide
safety even when other traditional safe haven assets, in particular US dollar and UK pound,
are themselves facing downside risks [see Reboredo (2013), and Ciner, Gurdgiev, and Lucey
(2013).]
Finally, we review the relevant literature examining the volatility of gold prices.
Melvin and Sultan (1990) find that the conditional variance of gold spot prices is explained
by political unrest and oil prices changes. Batten, Ciner, and Lucey (2010) find stock market
returns, dividend yields, money supply and US CPI as important drivers of gold volatility.
Hammoudeh et al. (2010) also find evidence of monetary shocks having long run effects on
gold volatility.
In this paper, we identify historical events that has had major influences on the world
gold market by way of affecting the gold market structure and the rate of release (absorption)
of gold via official sector gold sales (purchases), along with events that affect the various
investment motives of gold demand: hedging and capital preservation in times of market
distress. We then test the effects of these historical events on the conditional mean and
variance of real gold prices for a period between April 1968 and December 2015.
2. Historical Events
As discussed above, we look for events in history that has had major impact on the gold
market. Table 1 in the Appendix chronologically lists those events along with their exact

6
dates. We club these events into four broad groups. The first group consist of events – both
temporary and permanent that affected the gold market structure. The second group of events
guided the rate of release or absorption of gold by a major player in the gold market – the
central banks and the IMF. The third group of events induced gold investment demand with a
motive to hedge against other assets, such as, equities, bonds and currency. The last group of
events, primarily temporary in nature, consists of events that prompted investors to seek
safety of gold investment under extreme market distress in other assets or under periods of
crisis. In the first group we start with August 1971, when President Richard Nixon suspended
the dollar’s convertibility into gold. Under the Bretton Woods fixed exchange rate system,
the values of all currencies were fixed in relation to dollar, which, in turn, was convertible to
gold at the rate of $35 per ounce. This system required the US to hold enough gold in order to
cover the volume of dollars in worldwide circulation. The suspension of dollar’s
convertibility into gold, at least temporarily, put this demand for gold into question. Next
comes the attempt to salvage the Bretton Woods system under the Smithsonian Agreement
signed in December 1971 at a devalued dollar convertibility into gold of $38 per ounce. The
Smithsonian Agreement lasted till January 1973. Then after one more round of devaluation of
dollar, the Bretton Woods system finally collapsed in March 1973 and made way for the
current system of floating exchange rates.
Since May 1933 US citizens were forbidden to privately own gold coins and gold bullion.
In December 1974, President Gerald Ford signed a bill to “permit United States citizens to
purchase, hold, sell, or otherwise deal with gold in the United States or abroad.” This date,
we believe, was another major event in the world gold market.
Gold market primarily trades in gold futures. New York Commodity Exchange
(COMEX) started forward trading in gold in February 1975 and this exchange became one of
most important centers of gold futures trading in the world. Hence, February 1975 was
another important date in the history of gold market. Then in 1980, the US Congress
established the US Gold Commission to evaluate the role of gold in the monetary system. The
Commission in March 1982 submitted its report rejecting a return to the gold standard.
Hence, March 1982 is considered to be an important date in the history of gold. Next
important date in this group is January 1987, when some of the leading gold mining
companies of the world came together and established the World Gold Council with an aim
to manage the world gold supply chain and stimulate world gold demand. We argue that
establishment of the World Gold Council was a major event in the history of gold market. We
7
then move forward to August 1997 when US Congress passed the Taxpayers Relief Act,
which allowed Individual Retirement Account holders to buy gold bullion of purity 99.5%
and above for their accounts. This again is presumed to be an important event for the world
gold market.
With the gradual shift in the demand for physical gold from West to East, October 2002
marked an important milestone in the development of world gold market in the form of
establishment of the Shanghai Gold Exchange, currently the world’s largest physical gold
exchange. The birth of the Shanghai Gold Exchange contributed to the price discovery,
liquidity, transparency and efficiency of the global gold market. Our final event in this first
group of historical events is the date when SPDR Gold Trust ETF, the largest gold ETF in the
world, was launched.
We begin the second group of events with the 5-year IMF gold sales program, under
which over the period spanning June 1976 and May 1980, the IMF sold 25 million ounces of
gold at a series of public auctions for the benefit of developing countries. Another 25 million
ounces of gold were distributed to its members, in proportion to their IMF quotas at the then
official rate of SDR 35 per ounce. We believe this release of gold by the IMF has had a major
impact in the world gold market and by January 1980 gold price reached its then all-time high
of $850 per ounce. However, by the late 1990’s there was widespread concern that
uncoordinated central bank gold sales had destabilized the gold market by sharply driving
down the prices. As a response to these concerns in September 1999, 15 European central
banks, accounting for 45 percent of global gold reserves, signed an agreement in Washington
DC to collectively limit their gold sales to 2000 tonnes over five years, or around 400 tonnes
a year. Various versions of the initial central bank agreement was subsequently signed in
every five year interval and we are currently in the middle of the fourth central agreement
that came into effect in September 2014. We consider the beginning of the central bank
agreements as a stabilizing force in the global gold market and hence as a historical event that
has the potential to change the dynamics of the world gold prices.
As part of the new income model agreed in April 2008, the IMF started its gold sales to
the market in February 2010, and by December 2010 when it concluded the gold sales
program, IMF sold 191.3 tonnes of gold in a series of public auctions. We consider February
to December 2010 to be a period of heightened activity for one of the major official sector
players of the gold market, the IMF, with potential to impact the gold price dynamics.

8
According to World Gold Council in 2010, the central banks became net buyers of gold
from the market. Between 1989 and 2007 central banks sold on average 400-500 tonnes of
gold per year to the market. In 2008, the central bank gold sales halved from its 18 year
annual average and by 2009 it was just 30 tonnes. In fact, between 2010 and 2015 net
purchases of central banks was 2926 tonnes, or around 488 tonnes per year. This was a stark
departure from the usual official sector behavior of a steady seller of gold into the market
post dismantling of the Bretton Woods system. We believe this period of net purchase by the
central banks was a major event for the world gold market.
The above behavior of the central banks post 2010 can of course be seen as central banks
trying to rebalance their foreign currency assets in favor of gold, which was providing a
hedge against all other depreciating currencies. This naturally brings us to the third group of
historical events that is envisaged to induce gold investment demand with a motive to hedge
against other assets, such as, equities, bonds and currency. The erstwhile USSR provided a
potentially viable political and economic alternative to the democratic market economies of
the West and especially to its most dominant representative, the US. With the fall of the
Berlin wall in November 1989, the momentum towards a more open form of political and
economic system within the USSR and Eastern Europe gathered pace. The eventual collapse
of the USSR began in August 1991 with an unsuccessful coup against President Mikhail
Gorbachev and the dissolution of the Central Committee. This process finally ended in
December 1991 with the creation of the Commonwealth of Independent States, resignation of
Mikhail Gorbachev as the President of USSR, replacement of the Soviet flag with the
Russian tricolor and elevation of Boris Yeltsin as the President of Russia. The fall of the
USSR left behind a situation where the US became the only superpower in the world. We
believe this event had the potential to have an impact on the value of gold, which is often
seen as a hedge against dollar.
The adoption of a single currency – the Euro – in January 1999 by eleven of the fifteen
countries of the European Union marked the beginning of a new Europe. The European
Monetary Union created an economic area comparable in size to that of the US and backed
by the European Central Bank, the Euro became a currency with the potential to be a rival of
the dollar. The birth of a rival currency to dollar is likely to have implications for the price of
gold as it becomes attractive as a hedge asset for investors in case the rival starts to challenge
the dominance of dollar and eventually unseats dollar from its preeminent position.
Although the Iraq war was short-lived, US troops remained in Iraq for almost eight long
years - from May 2003 to December 2011. The US troops in Iraq was stationed to control the

9
sectarian violence that broke out after the fall of the Saddam Hussein regime. During this
period of a long occupation in Iraq, the total US public debt as a percent GDP rose almost 1.6
times from 58.7 to 96.4. Moreover, the trade-weighted US dollar index depreciated almost
15% percent from a value of 118.0 in May 2003 to 100.4 in December 2011.
Next, we come to the Great Recession, which saw the US GDP contract by 4.2 percent
and employment fall by 5 percent. Between December 2007 and June 2009, S&P 500 index
fell by around 37 percent from 1479.2 to 926.1. Moreover, the US High Yield Total Return
index fell from 589.9 in December 2007 to 406.5 in December 2008 (a fall of around 31
percent) and then recovered to 559.8 by June 2009. With both bonds and equities generating
negative returns in the US, the hedging motive is expected to have made gold attractive for
global investors during the Great Recession. This is also evident from the fact that, gold price
during this period appreciated by almost 18 percent.
We now turn to the periods of Quantitative Easing and Operation Twist. The first episode
of Quantitative Easing started in November 2008 and ended in August 2010. This was
followed by the second episode which began in August 2010 and ended in June 2011. Then
came the period of Operation Twist between September 2011 and June 2012. Finally, the last
episode of Quantitative Easing lasted for almost two years from September 2012 and October
2014. These episodes saw some of the most dramatic increases of money stock in the recent
monetary history of the US. Just before the first episode of the Quantitative Easing began in
November 2008, the US M2 money stock as a percentage of nominal GDP was at 52.3
percent. By the time the periods of Quantitative Easing and Operation Twist ended in
October 2014, this percentage increased to 65.3 percent. During the same time, we saw
almost 3.2 percent depreciation of the trade-weighted US dollar index and 61.5 percent
appreciation in gold price.
We conclude this third group of historical events with the S&P downgrade of the US
sovereign credit rating from AAA to AA+ in August 2011. This downgrade was in response
to the failure of the US political system to reduce spending or raise revenue in order to reduce
the rate of increase of the US public debt.
Our final group consists of events, primarily temporary in nature, which prompted
investors to seek safety of gold investment. We start with the Iranian hostage crisis that began
with the storming of the US embassy in Tehran and taking of more than 60 Americans as
hostage in November 1979. The crisis ended with release of the hostages in January 1981.
The dollar depreciated by almost 12.6 percent against the British pound and gold price
appreciated by almost 42.5 percent during this crisis period. Next, we turn to the Black

10
Monday stock market crash of October 1987, when the Dow Jones Industrial Average
dropped 22.6 percent in a single trading session, the largest one-day stock market decline in
its history. Then we turn to the Gulf War episode from August 1990 to February 1991. Our
next two episodes include the September 11th
terrorist attack and the Afghan War, which
began in September 2001 and ended in December 2001. We then come to the Iraq War
between March and April 2003. Our final episode in this group is the 2006 Iran nuclear crisis
that began with the breaking of UN seals at the Natanz uranium enrichment plant in January
2006 and ended with the unanimous approval of the UN Security Council sanctions intended
to curb Iran’s nuclear program. The sanctions imposed a ban on import and export of
materials and technology used for uranium enrichment or reprocessing and for the production
of ballistic missiles. The dollar depreciated by almost 11 percent against the British pound
and 8.9 percent against the Euro and gold price appreciated by almost 14.6 percent during
this crisis period.
3. Empirical Model and Results
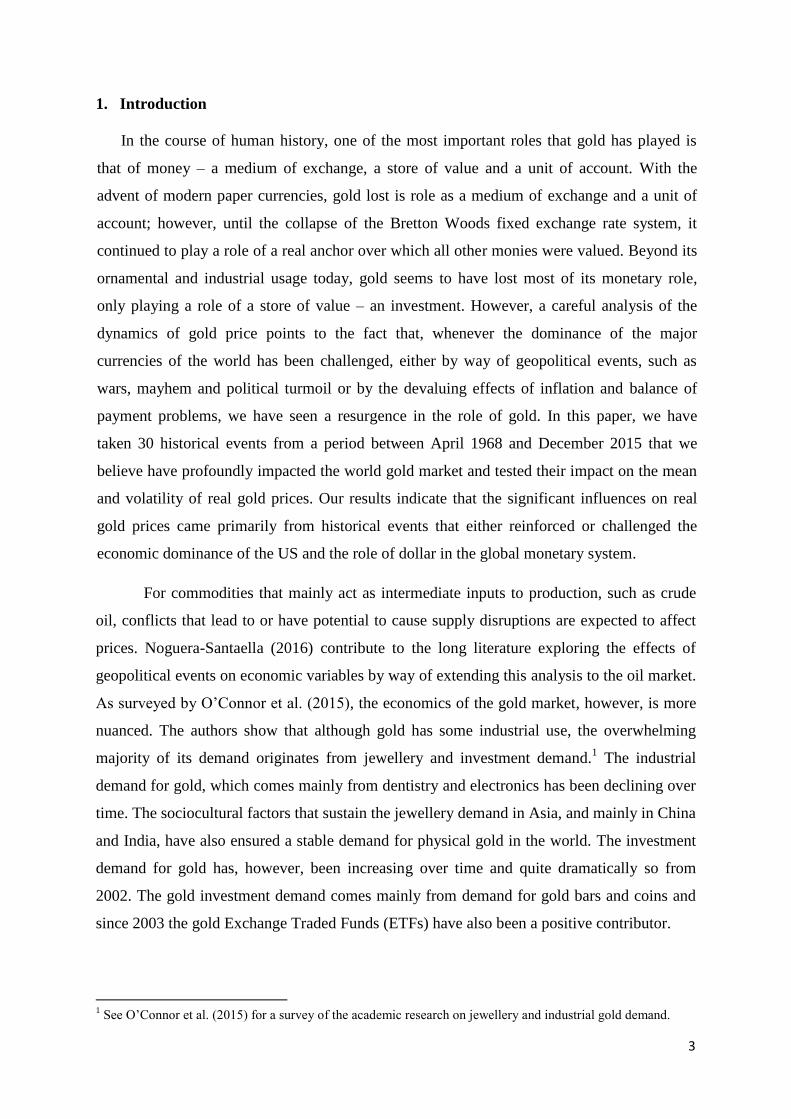
Our gold price measure is the Gold Fixing Price at 10:30 A.M. (London time) in London
Bullion Market, based in U.S. Dollars. We use monthly frequency gold price data from April
1968 to December 2015. The gold price data is then deflated by the monthly US Consumer
Price Index (CPI). Both the gold price and the CPI data is extracted from the FRED database.
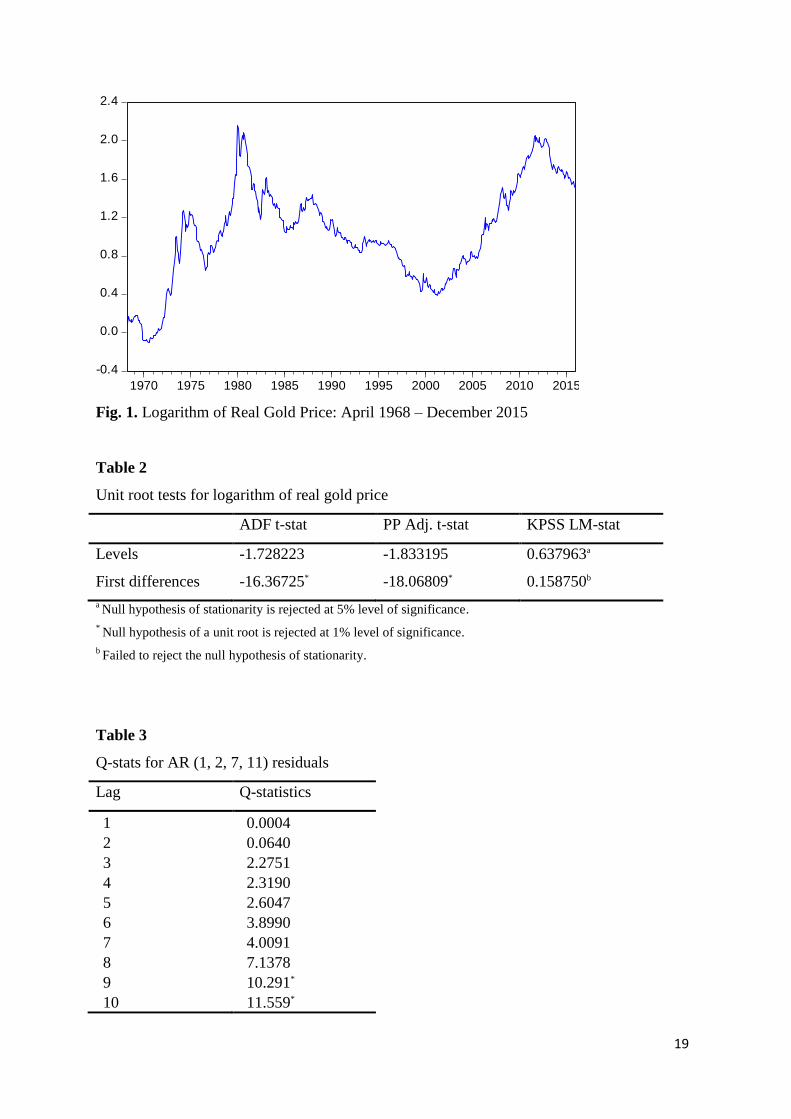
We transform the real gold price data to logarithms. Figure 1 shows the log real gold price
over our sample period. There is a general upward trend in the graph along with persistent
movements away from it. The graph also seems to suggest a non-stationary series. This
conjecture is supported by formal unit root tests shown in Table 2. ADF, Phillips-Perron and
KPSS tests point toward the presence of unit root in the log real gold price series; however,
the first difference of the series is found to be stationary by these tests. Hence, we use log-
difference of real gold price in our empirical exercise.
3.1 The baseline models
We experimented with various ARMA models to explain the log-difference of real gold
price, denoted by . The autocorrelation function (ACF) and the partial autocorrelation
function (PACF) suggested multiple lags. However, the baseline model for the conditional
mean of the log-difference of real gold price was chosen on the basis of simultaneous
11
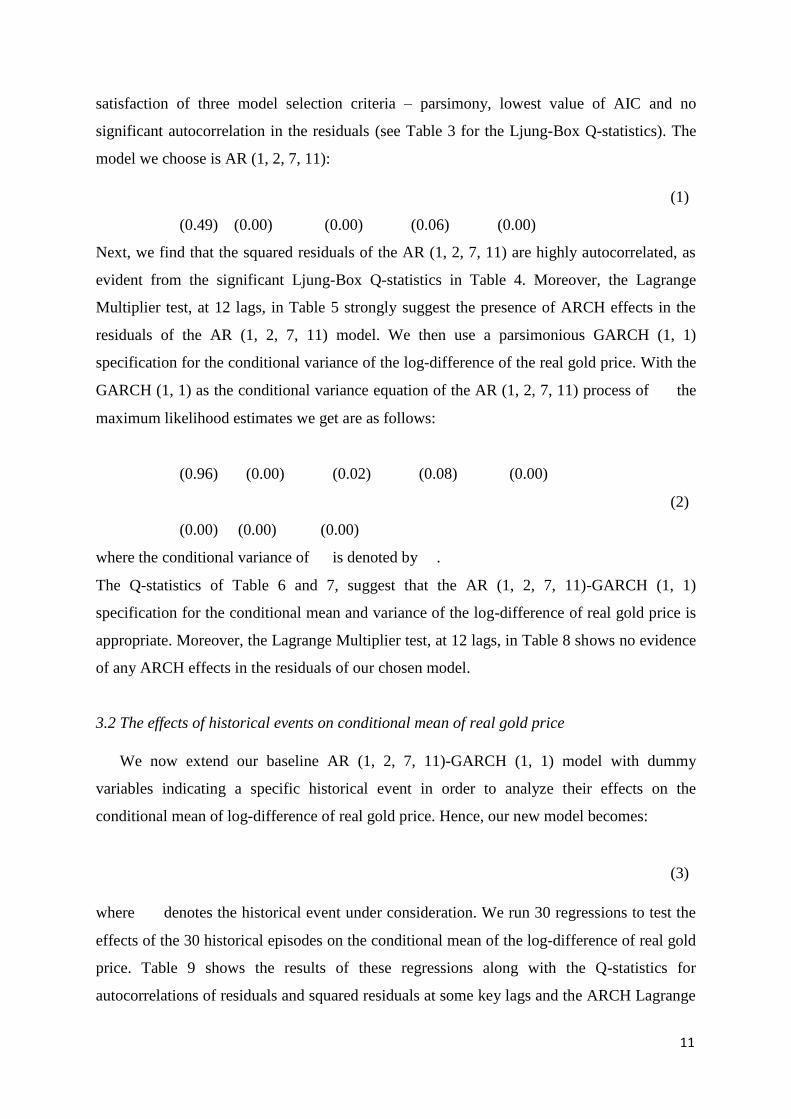
satisfaction of three model selection criteria – parsimony, lowest value of AIC and no
significant autocorrelation in the residuals (see Table 3 for the Ljung-Box Q-statistics). The
model we choose is AR (1, 2, 7, 11):
(1)
(0.49) (0.00) (0.00) (0.06) (0.00)
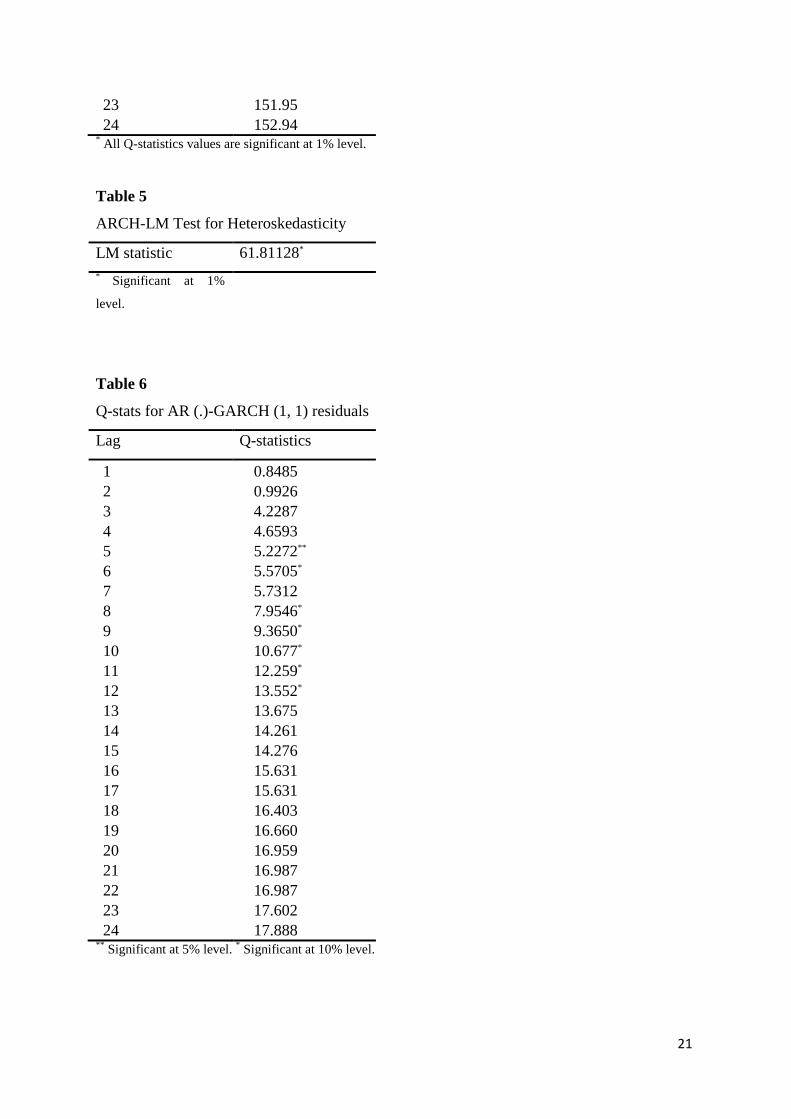
Next, we find that the squared residuals of the AR (1, 2, 7, 11) are highly autocorrelated, as
evident from the significant Ljung-Box Q-statistics in Table 4. Moreover, the Lagrange
Multiplier test, at 12 lags, in Table 5 strongly suggest the presence of ARCH effects in the
residuals of the AR (1, 2, 7, 11) model. We then use a parsimonious GARCH (1, 1)
specification for the conditional variance of the log-difference of the real gold price. With the
GARCH (1, 1) as the conditional variance equation of the AR (1, 2, 7, 11) process of the
maximum likelihood estimates we get are as follows:
(0.96) (0.00) (0.02) (0.08) (0.00)
(2)
(0.00) (0.00) (0.00)
where the conditional variance of is denoted by .
The Q-statistics of Table 6 and 7, suggest that the AR (1, 2, 7, 11)-GARCH (1, 1)
specification for the conditional mean and variance of the log-difference of real gold price is
appropriate. Moreover, the Lagrange Multiplier test, at 12 lags, in Table 8 shows no evidence
of any ARCH effects in the residuals of our chosen model.
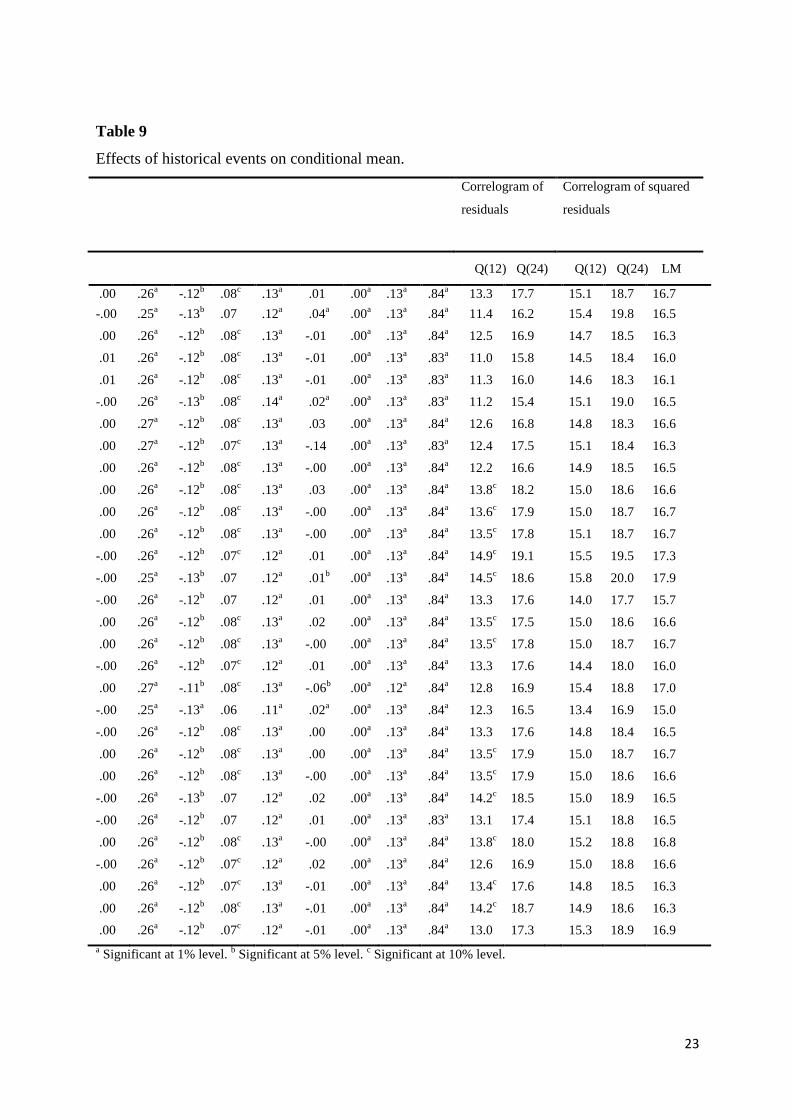
3.2 The effects of historical events on conditional mean of real gold price
We now extend our baseline AR (1, 2, 7, 11)-GARCH (1, 1) model with dummy
variables indicating a specific historical event in order to analyze their effects on the
conditional mean of log-difference of real gold price. Hence, our new model becomes:
(3)
where denotes the historical event under consideration. We run 30 regressions to test the
effects of the 30 historical episodes on the conditional mean of the log-difference of real gold
price. Table 9 shows the results of these regressions along with the Q-statistics for
autocorrelations of residuals and squared residuals at some key lags and the ARCH Lagrange
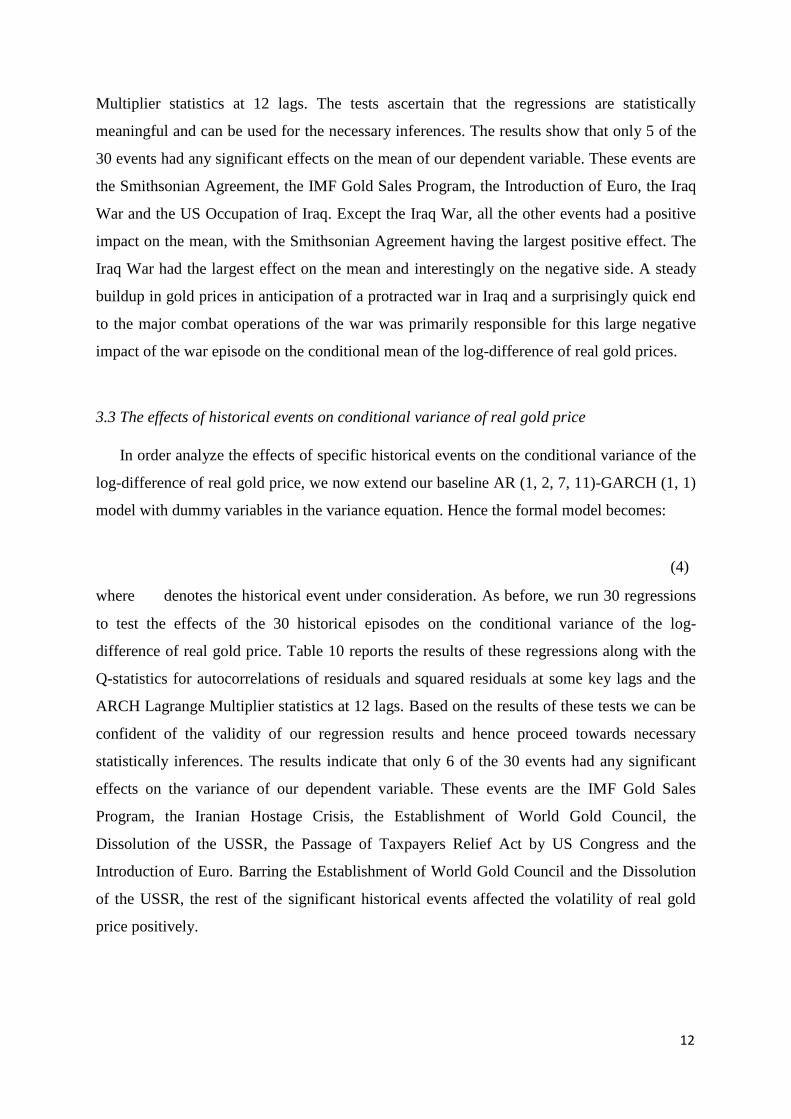
12
Multiplier statistics at 12 lags. The tests ascertain that the regressions are statistically
meaningful and can be used for the necessary inferences. The results show that only 5 of the
30 events had any significant effects on the mean of our dependent variable. These events are
the Smithsonian Agreement, the IMF Gold Sales Program, the Introduction of Euro, the Iraq
War and the US Occupation of Iraq. Except the Iraq War, all the other events had a positive
impact on the mean, with the Smithsonian Agreement having the largest positive effect. The
Iraq War had the largest effect on the mean and interestingly on the negative side. A steady
buildup in gold prices in anticipation of a protracted war in Iraq and a surprisingly quick end
to the major combat operations of the war was primarily responsible for this large negative
impact of the war episode on the conditional mean of the log-difference of real gold prices.
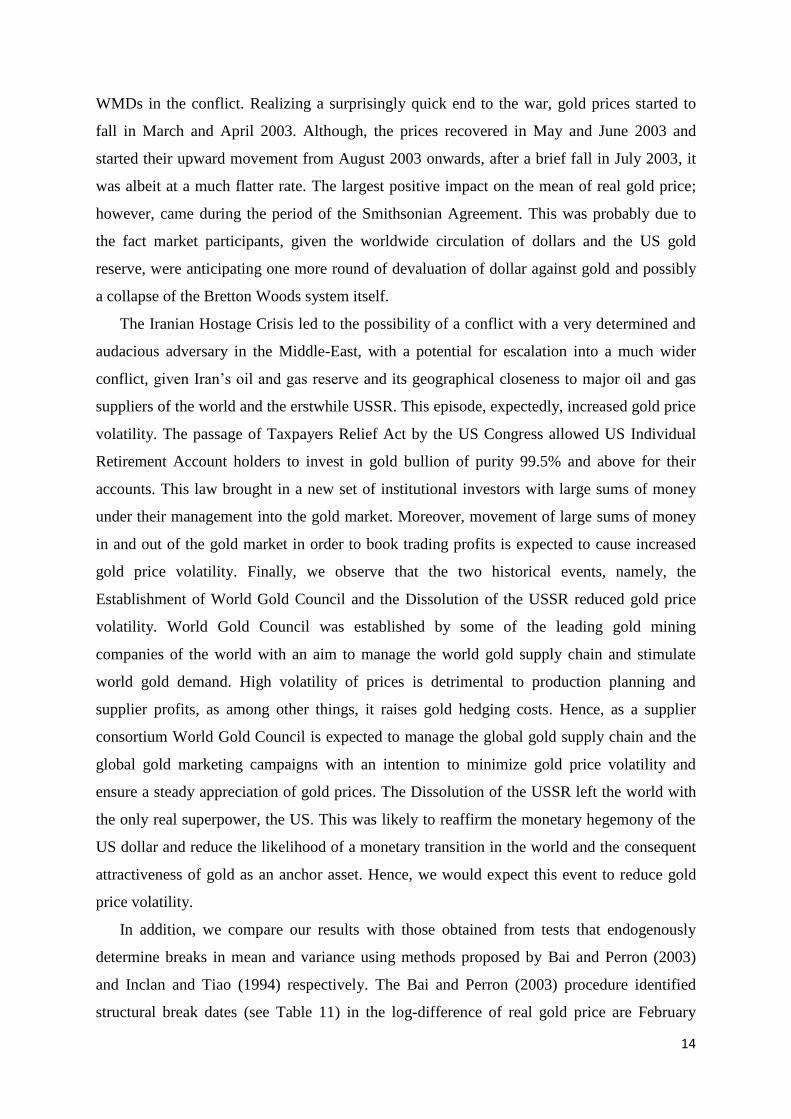
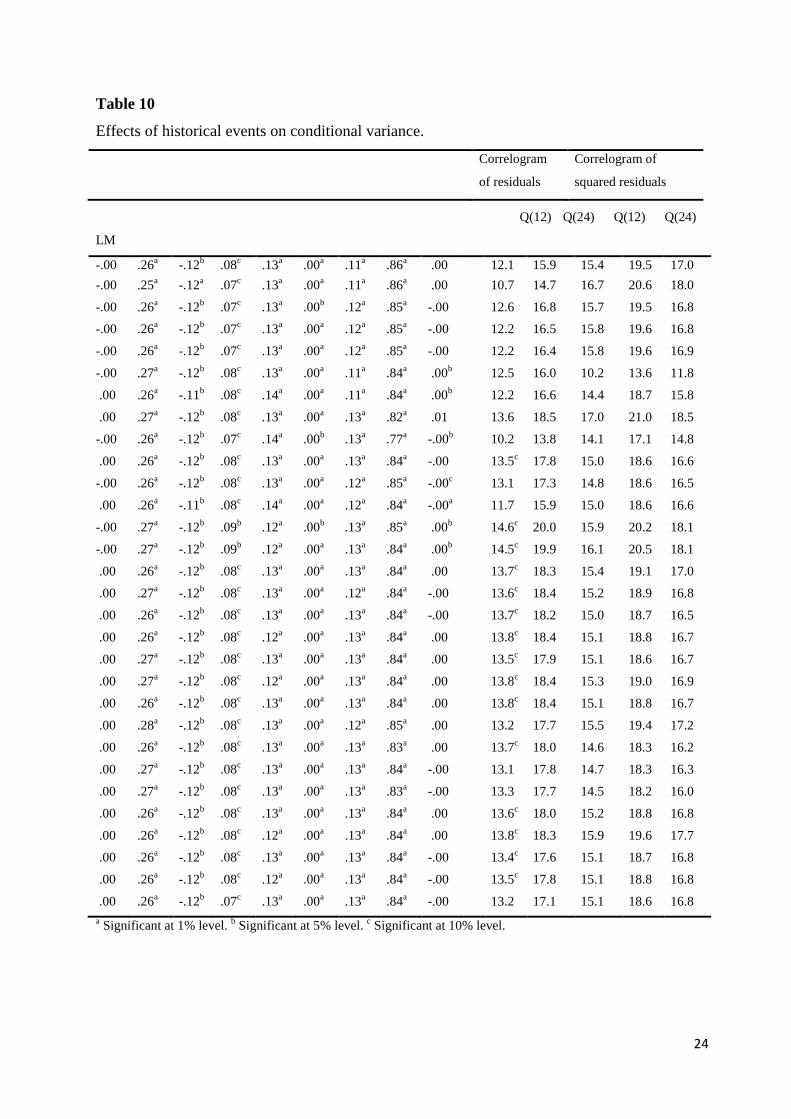
3.3 The effects of historical events on conditional variance of real gold price
In order analyze the effects of specific historical events on the conditional variance of the
log-difference of real gold price, we now extend our baseline AR (1, 2, 7, 11)-GARCH (1, 1)
model with dummy variables in the variance equation. Hence the formal model becomes:
(4)
where denotes the historical event under consideration. As before, we run 30 regressions
to test the effects of the 30 historical episodes on the conditional variance of the log-
difference of real gold price. Table 10 reports the results of these regressions along with the
Q-statistics for autocorrelations of residuals and squared residuals at some key lags and the
ARCH Lagrange Multiplier statistics at 12 lags. Based on the results of these tests we can be
confident of the validity of our regression results and hence proceed towards necessary
statistically inferences. The results indicate that only 6 of the 30 events had any significant
effects on the variance of our dependent variable. These events are the IMF Gold Sales
Program, the Iranian Hostage Crisis, the Establishment of World Gold Council, the
Dissolution of the USSR, the Passage of Taxpayers Relief Act by US Congress and the
Introduction of Euro. Barring the Establishment of World Gold Council and the Dissolution
of the USSR, the rest of the significant historical events affected the volatility of real gold
price positively.

13
4. Discussion and Conclusion
Our empirical exercise in the foregoing section has yielded some interesting results. Like
any other commodity prices, gold prices are quick to respond to world events. However,
some of these historical events stand out, in the sense that they have had significant impact on
the conditional mean and volatility of real gold prices. Out of the 30 events considered in our
exercise, only 5 of them significantly affected the mean of the log-difference of real gold
price, 6 events had a major impact on the volatility and among these 2 events (the IMF Gold
Sales Program and the Introduction of Euro) affected both the mean and volatility of real gold
price in monthly frequency. Both the IMF Gold Sales Program and the Introduction of Euro
affected the mean and volatility positively. After the collapse of the Bretton Woods system as
IMF sold its gold, market participants absorbed this gold in order include this asset as part of
their investment portfolio as a hedge against other assets, which were denoted in their
respective currencies that were then on without any real anchor. Indeed the gold price
dynamics seems to suggest that despite the collapse of the Bretton Woods system, market
participants continued to view gold as the unofficial anchor for their assets. Moreover, a
wider ownership of gold, post the official sector sales, increased the depth, tradability and
liquidity of the world gold market thereby positively impacting the mean and variance of gold
prices. Similarly, the birth of Euro was seen by market participants as the birth of a currency
with a potential to be an alternative to the dollar. This naturally brings the possibility of a
transition (gradual or drastic) of the dominant currency status away from dollar and towards
the Euro, leading to a positive impact on the mean and volatility of gold, which is often seen
as an anchor during uncertainties of monetary transitions.
When it comes to the positive impact on the mean of real gold price, the case of the long
US occupation of Iraq in order to combat its insurgency problem and bring back a semblance
of political stability in that country can be well understood. What is surprising, though, is the
negative effect of the Iraq War on the mean of real gold price. It must be noted that the
preparation of the Iraq War started in mid-2002 and one of the major reasons for the start of
the Iraq War was the adoption of the November 2002 UN Security Council Resolution
finding Iraq in breach of past UN resolutions prohibiting stockpiling and importing weapons
of mass destruction (WMDs). Hence, the market participants were anticipating a determined
and well-armed Iraqi army and a long and destructive conflict in Iraq. All this time, investors
were flocking towards gold as a safe haven and gold prices were rising steeply until February
2003. However, just after the beginning of the Iraq War in mid-March 2003, it was evident
that Iraqi army was in total disarray in the face of the US offensive and there was no use of
14
WMDs in the conflict. Realizing a surprisingly quick end to the war, gold prices started to
fall in March and April 2003. Although, the prices recovered in May and June 2003 and
started their upward movement from August 2003 onwards, after a brief fall in July 2003, it
was albeit at a much flatter rate. The largest positive impact on the mean of real gold price;
however, came during the period of the Smithsonian Agreement. This was probably due to
the fact market participants, given the worldwide circulation of dollars and the US gold
reserve, were anticipating one more round of devaluation of dollar against gold and possibly
a collapse of the Bretton Woods system itself.
The Iranian Hostage Crisis led to the possibility of a conflict with a very determined and
audacious adversary in the Middle-East, with a potential for escalation into a much wider
conflict, given Iran’s oil and gas reserve and its geographical closeness to major oil and gas
suppliers of the world and the erstwhile USSR. This episode, expectedly, increased gold price
volatility. The passage of Taxpayers Relief Act by the US Congress allowed US Individual
Retirement Account holders to invest in gold bullion of purity 99.5% and above for their
accounts. This law brought in a new set of institutional investors with large sums of money
under their management into the gold market. Moreover, movement of large sums of money
in and out of the gold market in order to book trading profits is expected to cause increased
gold price volatility. Finally, we observe that the two historical events, namely, the
Establishment of World Gold Council and the Dissolution of the USSR reduced gold price
volatility. World Gold Council was established by some of the leading gold mining
companies of the world with an aim to manage the world gold supply chain and stimulate
world gold demand. High volatility of prices is detrimental to production planning and
supplier profits, as among other things, it raises gold hedging costs. Hence, as a supplier
consortium World Gold Council is expected to manage the global gold supply chain and the
global gold marketing campaigns with an intention to minimize gold price volatility and
ensure a steady appreciation of gold prices. The Dissolution of the USSR left the world with
the only real superpower, the US. This was likely to reaffirm the monetary hegemony of the
US dollar and reduce the likelihood of a monetary transition in the world and the consequent
attractiveness of gold as an anchor asset. Hence, we would expect this event to reduce gold
price volatility.
In addition, we compare our results with those obtained from tests that endogenously
determine breaks in mean and variance using methods proposed by Bai and Perron (2003)
and Inclan and Tiao (1994) respectively. The Bai and Perron (2003) procedure identified
structural break dates (see Table 11) in the log-difference of real gold price are February

15
1980, March 1987, April 1994, May 2001, and August 2008. The February 1980 date
coincides with the concluding period of the IMF gold sales program. Around the March 1987
break date we saw a number of historical events relevant to the world gold market occur,
which include the establishment of the World Gold Council and the Black Monday stock
market crash. And around May 2001, we saw the September 11th
terrorist attack and the war
in Afghanistan. The August 2008 date is close to beginning of the first round of Quantitative
Easing. It is important to note that we could not find the historical importance of the April
1994 break date and except the IMF Gold Sales Program, all the remaining break dates
identified by the Bai and Perron (2003) procedure do not correspond with the historical
events that were identified by our empirical exercise as significant influencers on the
conditional mean of real gold price.
The Inclan and Tiao (1994) procedure detects 7 changes in the volatility of real gold
prices (see Table 12), which are April 1972, November 1974, August 1979, March 1980,
March 1983, November 2005 and February 2009. Several historical events occurred around
these identified break dates. These include the Smithsonian Agreement, the Legalization of
Private Ownership of Gold of All Forms in the US, the Iranian Hostage Crisis, the Iranian
Nuclear Crisis and the first round of Quantitative Easing. Barring the Iranian Hostage Crisis,
none of the other identified break dates were found to be significant changers of the
conditional volatility in our empirical exercise. We could not find the historical significance
of the March 1983 break date.
Finally, we note that the endogenous break point tests of mean and volatility seems to
suggest that although the three rounds of Quantitative Easing and the Operation Twist were
individually not found to be significant in our empirical exercise, the entire episode of
monetary expansion that started in the late 2008 with the first round of Quantitative Easing
may have been important movers of mean and volatility of real gold price.
To conclude, we find that the US economy and the current dollar-based monetary system
is still the main driver of the mean and volatility of real gold prices. Our empirical exercise in
this paper finds that the mean and variance of real gold prices have undergone significant
changes primarily when the historical events in question either reinforced or challenged the
economic dominance of the US and the role of dollar in the global monetary system.

16
References
Adrangi, B., Chatrath, A., and Raffiee, K. (2003), ‘Economic Activity, Inflation, and
Hedging:
The Case of Gold and Silver Investments’. The Journal of Wealth Management, 6,
60–77.
Bai, J. and Perron, P. (2003), ‘Computation and Analysis of Multiple Structural Change
Models’. Journal of Applied Econometrics, 18, 1–22.
Bampinas, G. and Panagiotidis, T. (2015), ‘Are Gold and Silver a Hedge against Inflation? A
Two
Century Perspective’. International Review of Financial Analysis.
Batten, J.A., Ciner, C., and Lucey, B. M. (2010), ‘The Macroeconomic Determinants of
Volatility
in Precious Metals Markets’. Resources Policy, 35, 65–71.
Batten, J.A., Ciner, C., and Lucey, B.M. (2014), ‘On the Economic Determinants of the Gold
Inflation Relation’. Resources Policy, 41, 101-108.
Baur, D.G. and Lucey, B.M. (2010), ‘Is Gold a Hedge or a Safe Haven? An Analysis of
Stocks,
Bonds and Gold’. Financial Review, 45, 217–229.
Baur, D.G. and McDermott, T.K. (2010), ‘Is Gold a Safe Haven? International Evidence’.
Journal
of Banking & Finance, 34, 1886–1898.
Beckmann, J. and Czudaj, R. (2013), ‘Gold as an Inflation Hedge in a Time-varying
Coefficient
Framework’. The North American Journal of Economics and Finance, 24, 208-222.
Borenstein, S. and Farrell, J. (2007), ‘Do Investors Forecast Fat Firms? Evidence from the
Gold
Mining Industry’. RAND Journal of Economics, 38, 626–647.
Bruno, S. and Chincarini, L. (2010), ‘A Historical Examination of Optimal Real Return
Portfolios
for Non-US Investors’. Review of Financial Economics, 19, 161–178.
Capie, F., Mills, T.C., and Wood, G. (2005)’ ‘Gold as a Hedge against the Dollar’. Journal of
International Financial Markets Institutions and Money, 15, 343–352.
Chua, J.H., Sick, G., and Woodward, R.S. (1990), ‘Diversifying with Gold Stocks’. Financial
Analysts Journal, 46, 76–79.
Ciner, C., Gurdgiev, C., & Lucey, B.M. (2013), ‘Hedges and Safe Havens: An Examination
of
Stocks, Bonds, Gold, Oil and Exchange Rates’. International Review of Financial
Analysis,
29, 202–211.
Dey, S. (2014), ‘Inflation Hedging in India’. Indian Institute of Management Kozhikode
Working
Paper, IIMK/WPS/164/ECO/2014/22.
Emmrich, O. and McGroarty, F. (2013), ‘Should Gold be Included in Institutional Investment
Portfolios?’ Applied Financial Economics, 23, 1553–1565.
Fama, E.F. and Schwert, G.W. (1977), ‘Asset Returns and Inflation’. Journal of Financial
Economics, 5, 115-146.
Feldstein, M. (1980), ‘Inflation, Tax Rules, and the Prices of Land and Gold’. Journal of
Public
Economics, 14, 309–317.
Hammoudeh, S.M., Yuan, Y., McAleer, M., and Thompson, M.A. (2010), ‘Precious Metals-

17
Exchange Rate Volatility Transmissions and Hedging Strategies’. International Review of
Economics and Finance, 19, 633–647.
Hillier, D., Draper, P., and Faff, R. (2006), ‘Do Precious Metals Shine? An Investment
Perspective’. Financial Analysts Journal, 62, 98–106.
Inclan, C. and Tiao, G. (1994), ‘Use of Cumulative Sums of Squares for Retrospective
Detection
of Changes of Variance’. Journal of the American Statistical Association. 89, 913–
923.
Jaffe, J.F. (1989), ‘Gold and Gold Stocks as Investments for Institutional Portfolios’.
Financial
Analysts Journal, 45, 53–59.
Joy, M. (2011), ‘Gold and the US Dollar: Hedge or Haven?’ Finance Research Letters, 8,
120–
131.
Levin, E.J., Abhyankar, A., and Ghosh, D. (1994), ‘Does the Gold Market Reveal Real
Interest
Rates?’ Manchester School, 62, 93–103.
Levin, E.J., Montagnoli, A., and Wright, R.E. (2006), ‘Short-run and Long-run Determinants
of
the Price of Gold’. World Gold Council. Research Study No. 32.
Lu, Y. and Hamori, S. (2013), ‘Gold Prices and Exchange Rates: A Time-varying Copula
Analysis’. Applied Financial Economics, 24, 41–50.
Lucey, B.M., Tully, E., and Poti, V. (2006), ‘International Portfolio Formation, Skewness and
the
Role of Gold’. Frontiers in Finance and Economics, 3, 49–68.
Melvin, M. and Sultan, J. (1990), ‘South African Political Unrest, Oil prices, and the Time
Varying
Risk Premium in the Gold Futures Market’. Journal of Futures Markets, 10, 103–111.
Noguera-Santaella, J. (2016), ‘Geopolitics and the Oil Price’. Economic Modelling, 52, 301–
309.
O’Connor, F.A., Lucey, B.M., Batten, J.A., and Baur, D.G. (2015), ‘The Financial
Economics of
Gold – A Survey’. International Review of Financial Analysis, 41, 186–205.
Reboredo, J.C. (2013), ‘Is Gold a Safe Haven or a Hedge for the US Dollar? Implications for
Risk
Management’. Journal of Banking and Finance, 37, 2665–2676.
Reboredo, J.C. and Rivera-Castro, M.A. (2014), ‘Can Gold Hedge and Preserve Value when
the
US Dollar Depreciates?’ Economic Modelling, 39, 168–173.
Sumner, S., Johnson, R., and Soenen, L. (2010), ‘Spillover Effects among Gold, Stocks, and
Bonds’. Journal of Centrum Cathedra, 3, 106.
Taylor, N. J. (1998), ‘Precious Metals and Inflation’. Applied Financial Economics, 8, 201–
210.
Worthington, A.C. and Pahlavani, M. (2007), ‘Gold Investment as an Inflationary Hedge:
Cointegration Evidence with Allowance for Endogenous Structural Breaks’. Applied
Financial Economics Letters, 3, 259–262.

18
Appendix
Table 1
Historical events.
Event Period
1 Suspension of dollar’s convertibility into gold August – November 1971
2 The Smithsonian Agreement December 1971 – January 1973
3 End of the Bretton Woods fixed exchange rate
system
March 1973 onwards
4 Private ownership of gold of all forms legal in the
US
December 1974 onwards
5 Gold futures trading begins in the US February 1975 onwards
6 IMF gold sales program June 1976 – May 1980
7 Iranian hostage crisis November 1979 – January 1981
8 US Gold Commission rejects return to gold standard March 1982
9 Establishment of World Gold Council January 1987 onwards
10 Black Monday stock market crash October 1987
11 Gulf War August 1990 – February 1991
12 Dissolution of the USSR August 1991 – December 1991
13 Passage of Taxpayers Relief Act by US Congress August 1997 onwards
14 The introduction of Euro January 1999 onwards
15 Central Bank Gold Agreements September 1999 onwards
16 September 11th
Terrorist Attack September 2001
17 War in Afghanistan October 2001 – December 2001
18 Shanghai Gold Exchange begins operation October 2002 onwards
19 Iraq War March – April 2003
20 US occupation of Iraq May 2003 – December 2011
21 Launch of SPDR Gold Trust ETF November 2004 onwards
22 Iran nuclear crisis January – December 2006
23 The Great Recession December 2007 – June 2009
24 QE1 November 2008 – August 2010
25 IMF gold sales February – December 2010
26 Central banks become net purchasers of gold January 2010 – December 2015
27 QE2 August 2010 – June 2011
28 S&P’s lowering of long-term US credit rating August 2011 onwards
29 Operation Twist September 2011 – June 2012
30 QE3 September 2012 – October 2014
19
-0.4
0.0
0.4
0.8
1.2
1.6
2.0
2.4
1970 1975 1980 1985 1990 1995 2000 2005 2010 2015
Fig. 1. Logarithm of Real Gold Price: April 1968 – December 2015
Table 2
Unit root tests for logarithm of real gold price
ADF t-stat PP Adj. t-stat KPSS LM-stat
Levels -1.728223 -1.833195 0.637963a
First differences -16.36725* -18.06809* 0.158750b
a Null hypothesis of stationarity is rejected at 5% level of significance.
* Null hypothesis of a unit root is rejected at 1% level of significance.
b Failed to reject the null hypothesis of stationarity.
Table 3
Q-stats for AR (1, 2, 7, 11) residuals
Lag Q-statistics
1
2
3
4
5
6
7
8
9
10
0.0004
0.0640
2.2751
2.3190
2.6047
3.8990
4.0091
7.1378
10.291*
11.559*

20
11
12
13
14
15
16
17
18
19
20
21
22
23
24
11.559
11.961
13.086
15.370
15.375
15.788
15.979
19.466
21.457
22.244
23.409
23.431
23.442
24.185 * Significant at 10% level.
Table 4
Q-stats for AR (1, 2, 7, 11) sqrd.-residuals
Lag Q-statistics*
1
2
3
4
5
6
7
8
9
10
11
12
13
14
15
16
17
18
19
20
21
22
38.365
52.965
64.101
82.571
94.431
108.40
112.39
115.97
117.95
121.91
129.54
132.46
134.89
141.37
142.32
143.66
145.67
147.93
148.80
149.66
151.39
151.82
21
23
24
151.95
152.94 * All Q-statistics values are significant at 1% level.
Table 5
ARCH-LM Test for Heteroskedasticity
LM statistic 61.81128*
* Significant at 1%
level.
Table 6
Q-stats for AR (.)-GARCH (1, 1) residuals
Lag Q-statistics
1
2
3
4
5
6
7
8
9
10
11
12
13
14
15
16
17
18
19
20
21
22
23
24
0.8485
0.9926
4.2287
4.6593
5.2272**
5.5705*
5.7312
7.9546*
9.3650*
10.677*
12.259*
13.552*
13.675
14.261
14.276
15.631
15.631
16.403
16.660
16.959
16.987
16.987
17.602
17.888 **
Significant at 5% level. * Significant at 10% level.

22
Table 7
Q-stats for AR (.)-GARCH (1, 1) sqrd.-residuals
Lag Q-statistics
1
2
3
4
5
6
7
8
9
10
11
12
13
14
15
16
17
18
19
20
21
22
23
24
0.5260
1.8976
1.9410
12.115**
12.700**
12.720**
12.832*
13.511*
13.594
13.733
14.009
15.055
15.070
15.715
16.137
17.904
17.936
18.003
18.047
18.058
18.127
18.577
18.580
18.681 **
Significant at 5% level. * Significant at 10% level.
Table 8
ARCH-LM Test for Heteroskedasticity
LM statistic 16.68142*
* Insignificant.
23
Table 9
Effects of historical events on conditional mean.
Correlogram of
residuals
Correlogram of squared
residuals
Q(12) Q(24) Q(12) Q(24) LM
.00 .26a
-.12b
.08c
.13a
.01 .00a
.13a
.84a
13.3 17.7 15.1 18.7 16.7
-.00 .25a
-.13b
.07
.12a
.04a .00
a .13
a .84
a 11.4 16.2 15.4 19.8 16.5
.00 .26a
-.12b
.08c
.13a
-.01 .00a
.13a
.84a
12.5 16.9 14.7 18.5 16.3
.01 .26a
-.12b
.08c
.13a
-.01 .00a
.13a
.83a
11.0 15.8 14.5 18.4 16.0
.01 .26a -.12
b .08
c .13
a -.01 .00
a .13
a .83
a 11.3 16.0 14.6 18.3 16.1
-.00 .26a -.13
b .08
c .14
a .02
a .00
a .13
a .83
a 11.2 15.4 15.1 19.0 16.5
.00 .27a -.12
b .08
c .13
a .03 .00
a .13
a .84
a 12.6 16.8 14.8 18.3 16.6
.00 .27a -.12
b .07
c .13
a -.14 .00
a .13
a .83
a 12.4 17.5 15.1 18.4 16.3
.00 .26a -.12
b .08
c .13
a -.00 .00
a .13
a .84
a 12.2 16.6 14.9 18.5 16.5
.00 .26a -.12
b .08
c .13
a .03 .00
a .13
a .84
a 13.8
c18.2 15.0 18.6 16.6
.00 .26a -.12
b .08
c .13
a -.00 .00
a .13
a .84
a 13.6
c17.9 15.0 18.7 16.7
.00 .26a -.12
b .08
c .13
a -.00 .00
a .13
a .84
a 13.5
c17.8 15.1 18.7 16.7
-.00 .26a -.12
b .07
c .12
a .01 .00
a .13
a .84
a 14.9
c19.1 15.5 19.5 17.3
-.00 .25a -.13
b .07 .12
a .01
b .00
a .13
a .84
a 14.5
c18.6 15.8 20.0 17.9
-.00 .26a -.12
b .07 .12
a .01 .00
a .13
a .84
a 13.3 17.6 14.0 17.7 15.7
.00 .26a -.12
b .08
c .13
a .02 .00
a .13
a .84
a 13.5
c17.5 15.0 18.6 16.6
.00 .26a -.12
b .08
c .13
a -.00 .00
a .13
a .84
a 13.5
c17.8 15.0 18.7 16.7
-.00 .26a -.12
b .07
c .12
a .01 .00
a .13
a .84
a 13.3 17.6 14.4 18.0 16.0
.00 .27a -.11
b .08
c .13
a -.06
b .00
a .12
a .84
a 12.8 16.9 15.4 18.8 17.0
-.00 .25a -.13
a .06 .11
a .02
a .00
a .13
a .84
a 12.3 16.5 13.4 16.9 15.0
-.00 .26a -.12
b .08
c .13
a .00 .00
a .13
a .84
a 13.3 17.6 14.8 18.4 16.5
.00 .26a -.12
b .08
c .13
a .00 .00
a .13
a .84
a 13.5
c17.9 15.0 18.7 16.7
.00 .26a -.12
b .08
c .13
a -.00 .00
a .13
a .84
a 13.5
c17.9 15.0 18.6 16.6
-.00 .26a -.13
b .07 .12
a .02 .00
a .13
a .84
a 14.2
c18.5 15.0 18.9 16.5
-.00 .26a -.12
b .07 .12
a .01 .00
a .13
a .83
a 13.1 17.4 15.1 18.8 16.5
.00 .26a -.12
b .08
c .13
a -.00 .00
a .13
a .84
a 13.8
c18.0 15.2 18.8 16.8
-.00 .26a -.12
b .07
c .12
a .02 .00
a .13
a .84
a 12.6 16.9 15.0 18.8 16.6
.00 .26a -.12
b .07
c .13
a -.01 .00
a .13
a .84
a 13.4
c17.6 14.8 18.5 16.3
.00 .26a -.12
b .08
c .13
a -.01 .00
a .13
a .84
a 14.2
c18.7 14.9 18.6 16.3
.00 .26a -.12
b .07
c .12
a -.01 .00
a .13
a .84
a 13.0 17.3 15.3 18.9 16.9
a Significant at 1% level.
b Significant at 5% level.
c Significant at 10% level.
24
Table 10
Effects of historical events on conditional variance.
Correlogram
of residuals
Correlogram of
squared residuals
Q(12) Q(24) Q(12) Q(24)
LM
-.00 .26a -.12
b .08
c .13
a .00
a .11
a .86
a .00 12.1 15.9 15.4 19.5 17.0
-.00 .25a -.12
a .07
c .13
a .00
a .11
a .86
a .00 10.7 14.7 16.7 20.6 18.0
-.00 .26a -.12
b .07
c .13
a .00
b .12
a .85
a -.00 12.6 16.8 15.7 19.5 16.8
-.00 .26a -.12
b .07
c .13
a .00
a .12
a .85
a -.00 12.2 16.5 15.8 19.6 16.8
-.00 .26a -.12
b .07
c .13
a .00
a .12
a .85
a -.00 12.2 16.4 15.8 19.6 16.9
-.00 .27a -.12
b .08
c .13
a .00
a .11
a .84
a .00
b 12.5 16.0 10.2 13.6 11.8
.00 .26a -.11
b .08
c .14
a .00
a .11
a .84
a .00
b 12.2 16.6 14.4 18.7 15.8
.00 .27a -.12
b .08
c .13
a .00
a .13
a .82
a .01 13.6 18.5 17.0 21.0 18.5
-.00 .26a -.12
b .07
c .14
a .00
b .13
a .77
a -.00
b 10.2 13.8 14.1 17.1 14.8
.00 .26a -.12
b .08
c .13
a .00
a .13
a .84
a -.00 13.5
c17.8 15.0 18.6 16.6
-.00 .26a -.12
b .08
c .13
a .00
a .12
a .85
a -.00
c 13.1 17.3 14.8 18.6 16.5
.00 .26a -.11
b .08
c .14
a .00
a .12
a .84
a -.00
a 11.7 15.9 15.0 18.6 16.6
-.00 .27a -.12
b .09
b .12
a .00
b .13
a .85
a .00
b 14.6
c20.0 15.9 20.2 18.1
-.00 .27a -.12
b .09
b .12
a .00
a .13
a .84
a .00
b 14.5
c19.9 16.1 20.5 18.1
.00 .26a -.12
b .08
c .13
a .00
a .13
a .84
a .00 13.7
c18.3 15.4 19.1 17.0
.00 .27a -.12
b .08
c .13
a .00
a .12
a .84
a -.00 13.6
c18.4 15.2 18.9 16.8
.00 .26a -.12
b .08
c .13
a .00
a .13
a .84
a -.00 13.7
c18.2 15.0 18.7 16.5
.00 .26a -.12
b .08
c .12
a .00
a .13
a .84
a .00 13.8
c18.4 15.1 18.8 16.7
.00 .27a -.12
b .08
c .13
a .00
a .13
a .84
a .00 13.5
c17.9 15.1 18.6 16.7
.00 .27a -.12
b .08
c .12
a .00
a .13
a .84
a .00 13.8
c18.4 15.3 19.0 16.9
.00 .26a -.12
b .08
c .13
a .00
a .13
a .84
a .00 13.8
c18.4 15.1 18.8 16.7
.00 .28a -.12
b .08
c .13
a .00
a .12
a .85
a .00 13.2 17.7 15.5 19.4 17.2
.00 .26a -.12
b .08
c .13
a .00
a .13
a .83
a .00 13.7
c18.0 14.6 18.3 16.2
.00 .27a -.12
b .08
c .13
a .00
a .13
a .84
a -.00 13.1 17.8 14.7 18.3 16.3
.00 .27a -.12
b .08
c .13
a .00
a .13
a .83
a -.00 13.3 17.7 14.5 18.2 16.0
.00 .26a -.12
b .08
c .13
a .00
a .13
a .84
a .00 13.6
c18.0 15.2 18.8 16.8
.00 .26a -.12
b .08
c .12
a .00
a .13
a .84
a .00 13.8
c18.3 15.9 19.6 17.7
.00 .26a -.12
b .08
c .13
a .00
a .13
a .84
a -.00 13.4
c17.6 15.1 18.7 16.8
.00 .26a -.12
b .08
c .12
a .00
a .13
a .84
a -.00 13.5
c17.8 15.1 18.8 16.8
.00 .26a -.12
b .07
c .13
a .00
a .13
a .84
a -.00 13.2 17.1 15.1 18.6 16.8
a Significant at 1% level.
b Significant at 5% level.
c Significant at 10% level.

25
Table 11
Bai and Perron (2003) identified breakpoints.
Number of Breaks F-statistic Critical Value
5 3.93**
3.91
Breakpoints
February 1980
March 1987
April 1994
May 2001
August 2008
** Significant at 5% level.
Table 12
Inclan and Tiao (1994) identified breakpoints.
Number of Breaks Level of Significance
7 5%
Breakpoints
April 1972
November 1974
August 1979
March 1980
March 1983
November 2005
February 2009

2
Research Office
Indian Institute of Management Kozhikode
IIMK Campus P. O.,
Kozhikode, Kerala, India,
PIN - 673 570
Phone: +91-495-2809238
Email: [email protected]
Web: https://iimk.ac.in/faculty/publicationmenu.php