Embed Size (px)
Citation preview

Universität Stuttgart Institut für Energiewirtschaft und Rationelle Energieanwendung Prof. Dr. Ing. A. Voß
Institute of Energy Economics and the Rational Use of Energy · Institut d´économie énergétique et d´utilisation rationnelle de l´énergie
....................................................................... .
The third oil price surge – What is different this time
and what are possible future oil price
developments?
Arbeitsbericht/Working Paper
F. Kesicki, U. Remme, M. Blesl, U. Fahl, A. Voß
Juli 2009
Bericht Nr. 7

Abstract The period from 2003 to 2008 was marked by an oil price increase comparable to the two oil price crises in the 1970/80s. Like in the past, different factors were held responsible for the recent price changes. First, our paper looks in more detail into the situation leading to the oil price crises 30 years ago and compares them along various aspects on the demand and supply side with the recent price increase in order to identify similarities and differences of the situa-tion in the past and today and to derive possible measures or conditions that might in the fu-ture contribute to an oil price development staying on a comparably low level. Second, based on this analysis of historic oil prices, we use a fundamental theoretic approach by linking an oil market model (LOPEX) with a global energy system model (TIAM-IER) to analyse possi-ble future developments of the oil price up to the year 2050 taking into account the interac-tions between the supply and demand of oil in the energy sector. Starting from a base scenario for the oil price development, we study the price impact of measures on the supply side and of factors influencing the demand for petroleum, at first separately in individual sce-narios, further in a second step in an integrated scenario to assess the combined effect on the oil price. While the oil price would peak in 2030 at about 150 USD2008/bbl under the conditions of the base scenario, measures increasing the liquid fuel supply by a better recovery rate through enhanced oil recovery, an accelerated production from unconventional oil or more optimistic conditions for the production of alternative liquid fuels can reduce the price peak to levels of 100 to 115 USD/bbl in 2030. On the demand side, an assumed lower average annual gross world product growth rate of 2.3 %/a between 2000 and 2050 compared to 2.7 %/a in the base scenario results in a maximum oil price of 90 USD/bbl in 2030. Measures and policies for stabilizing CO2 by 2050 to 20 Gt CO2 (level in 2000) yield to similar oil prices in 2030 of around 95 USD/bbl due to the reduced demand for oil under climate policies. The overall costs for the energetic use of petroleum products are, however, increasing under carbon mitigation policies due to the implied CO2 price penalty associated with the emitted CO2. Finally, different measures and developments on the supply and de-mand side, which may have the potential to dampen an oil price rise, have been combined in an integrated scenario. This scenario indicates that the oil price may be kept over the next four decades on a level between 50 and 60 USD/bbl. Adding to this scenario a CO2 mitiga-tion target, which drives back global CO2 emissions in 2050 again to 2005 levels, results only in a further price decrease of around 10 USD/bbl. So, overall the combination of different measures on the supply and demand side could stabilize the oil price between today and 2050 in a price range between 40 to 60 USD/bbl, which is far below the oil price development of the base scenario, though the return to the oil prices of 20 to 30 USD/bbl after the two oil price crises in the 1970s seems to be very unlikely for the future.
Kurzfassung Der Zeitraum zwischen 2003 und 2008 war gekennzeichnet durch einen Ölpreisanstieg ver-gleichbar zu den beiden Ölpreiskrisen in den 70/80er Jahren des vergangenen Jahrhunderts. Wie in der Vergangenheit können verschiedene Faktoren für die jüngste Ölpreisentwicklung verantwortlich gemacht werden. Zunächst wird die Situation, die zu den Ölpreiskrisen vor 30 Jahren führte, näher beleuchtet und anhand verschiedener Aspekte auf der Nachfrage- und Angebotsseite mit dem jüngsten Ölpreisanstieg verglichen, um so Gemeinsamkeiten und Unterschiede in der heutigen und der historischen Entwicklung zu identifizieren und mögliche Maßnahmen und Bedingungen aufzuzeigen, die tendenziell zu einem Rückgang des Ölpreises führen können. Basierend auf der Untersuchung der vergangenen Ölpreise, wird ein fundamental-theoretischer Ansatz, der ein Ölmarktmodell (LOPEX) mit einem globalen Energiesystemmodel (TIAM-IER) koppelt, verwendet, um mögliche zukünftige Entwicklungen des Ölpreises bis zum Jahr 2050 zu analysieren unter Berücksichtigung der Wechselwirkungen zwischen der Angebots- und Nachfrageseite von Erdöl innerhalb des Energiesektors. Ausgehend von einem Basisszenario für die Ölpreisentwicklung wird in einer Szenarioanalyse der Preiseinfluss von Maßnahmen auf der Produktionsseite und von Bedingungen auf der Nachfrageseite von Öl untersucht. Zunächst werden diese Faktoren separat in einzelnen Szenarien betrachtet, bevor dann der kombinierte Effekt in einem integrierten Szenario analysiert wird. Der Ölpreis erreicht im Basisszenario über den Betrachtungszeitraum einen Höchstwert von etwa 150 USD2008/bbl in 2030 erreicht. Maßnahmen, die das Angebot an Öl durch eine höhere Ausbeuterate bei der konventionellen Ölförderung (durch sog. enhanced oil recovery (EOR) Verfahren), durch eine beschleunigte Ausweitung der Nutzung unkonventionelles Rohöls oder durch optimistischerer Annahmen für die zukünftige Produktion von alternativen Kraftstoffen erhöhen, können den Maximalwert für den Ölpreis in 2030 auf einen Bereich von 100 bis 115 USD/bbl absenken. Auf der Nachfrageseite hat eine unterstellte, niedrigere durchschnittliche globale Wachstumsrate für das Bruttosozialprodukt von 2.3 % zwischen 2000 und 2050 gegenüber einer Rate von 2.7 % im Basisszenario einen Rückgang des Ölpreises in 2030 auf ungefähr 90 USD/bbl zur Folge. Unterstellt man Maßnahmen zur Stabilisierung der globalen CO2-Emissionen auf ein Niveau des Jahres 2000 von 20 Gt CO2bis 2050, stellt sich durch einen Nachfragerückgang für Öl ein ähnliches Preisniveau in 2030 von ca. 95 USD/bbl ein. Die Gesamtkosten für die energetische Verwendung von Mineralölprodukten steigen jedoch durch die zusätzliche kostenmäßige Bewertung der hervorgerufenen CO2-Emissionen in Form eines CO2-Preises. Schließlich wurden die verschiedenen Maßnahmen und Bedingungen, die einen preisdämpfenden Effekt auf den Ölpreis besitzen in einem integ-rierten Szenario kombiniert. Die Ergebnisse dieses Szenarios lassen es möglich erscheinen, dass der Ölpreis über die nächsten vier Dekaden auf einem Niveau von 50 bis 60 USD/bbl gehalten werden kann. Wird zusätzlich eine Minderung der globalen CO2-Emissionen bis 2050 auf den Wert von 2005 unterstellt, führt dies nur zu einem zusätzlichen Rückgang des

Ölpreisniveaus in der Größenordnung von 10 USD/bbl. Insgesamt deuten die Szenarioergeb-nisse somit daraufhin, dass der Ölpreis durch Maßnahmen auf der Angebots- und Nachfrage-seite in einem Bereich von 40 bis 60 USD/bbl stabilisiert werden kann, was deutlich unter-halb der Preisentwicklung im Basisszenario liegt. Basierend auf den vorgestellten Szena-rienergebnissen kann jedoch nicht mehr mit einer Rückkehr zu den Preisen von 20 bis 30 USD/bbl nach den Ölpreiskrisen in den 70er Jahren gerechnet werden.


Contents
1 Introduction .........................................................................................................................1
2 The first two oil price crises and how they emerged...........................................................2
3 Circumstances influencing the oil market at the beginning of the 21st century in comparison to the situation in the 70s ................................................................................3
3.1 Demand development..............................................................................................3 3.2 Supply......................................................................................................................6
3.2.1 Reserves and resources .............................................................................................6 3.2.2 Prospects for new supply ........................................................................................11
3.3 Infrastructure .........................................................................................................12 3.3.1 Production capacities ..............................................................................................13 3.3.2 Refining ..................................................................................................................14
3.4 Financial investors.................................................................................................16 3.5 Dollar exchange rate..............................................................................................21 3.6 Geopolitics and political constraints .....................................................................23 3.7 Summary ...............................................................................................................25
4 Explorative analysis of future oil price development paths ..............................................27 4.1 Base scenario.........................................................................................................31 4.2 Better use of conventional oil reserves .................................................................35 4.3 Development of unconventional oil production....................................................36 4.4 Alternative liquid fuel production .........................................................................38 4.5 Economic growth ..................................................................................................40 4.6 Climate policy .......................................................................................................41 4.7 Break-up of the OPEC...........................................................................................43 4.8 Combined measures and assumptions...................................................................45 4.9 Summary of scenario analysis...............................................................................47
5 Conclusions .......................................................................................................................50
6 References .........................................................................................................................53

The third oil price surge – what’s different this time? 1
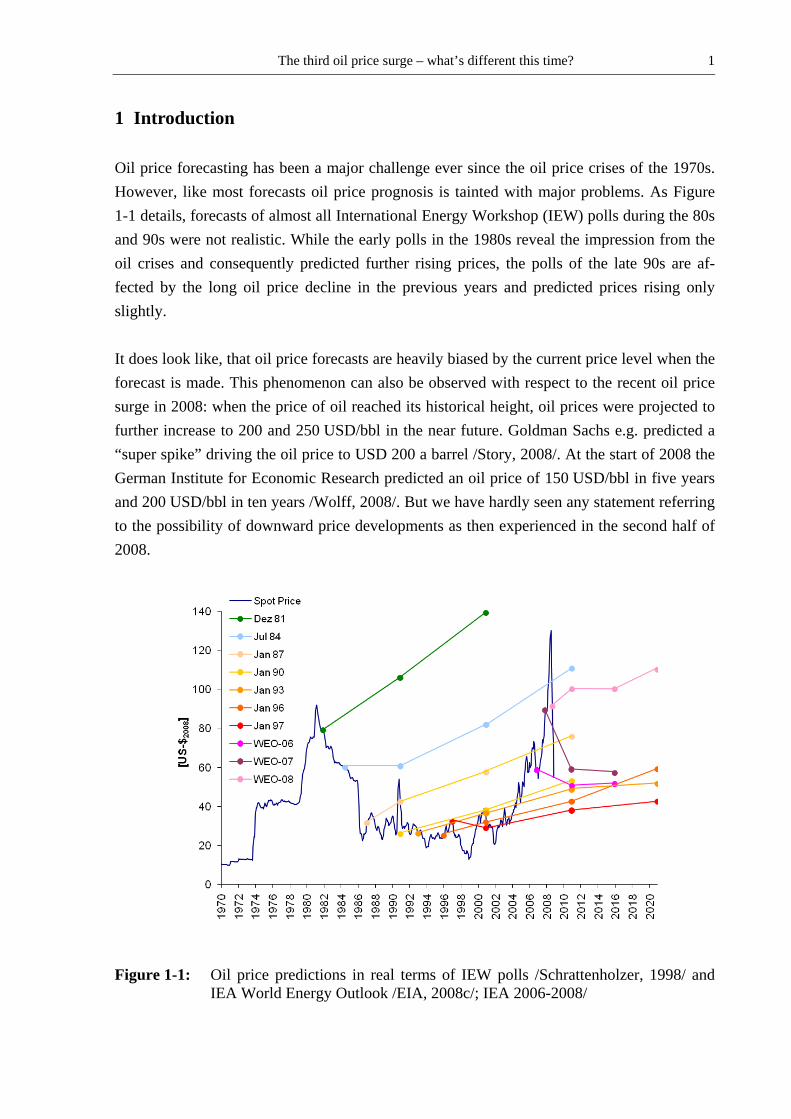
1 Introduction Oil price forecasting has been a major challenge ever since the oil price crises of the 1970s. However, like most forecasts oil price prognosis is tainted with major problems. As Figure 1-1 details, forecasts of almost all International Energy Workshop (IEW) polls during the 80s and 90s were not realistic. While the early polls in the 1980s reveal the impression from the oil crises and consequently predicted further rising prices, the polls of the late 90s are af-fected by the long oil price decline in the previous years and predicted prices rising only slightly. It does look like, that oil price forecasts are heavily biased by the current price level when the forecast is made. This phenomenon can also be observed with respect to the recent oil price surge in 2008: when the price of oil reached its historical height, oil prices were projected to further increase to 200 and 250 USD/bbl in the near future. Goldman Sachs e.g. predicted a “super spike” driving the oil price to USD 200 a barrel /Story, 2008/. At the start of 2008 the German Institute for Economic Research predicted an oil price of 150 USD/bbl in five years and 200 USD/bbl in ten years /Wolff, 2008/. But we have hardly seen any statement referring to the possibility of downward price developments as then experienced in the second half of 2008.
Figure 1-1: Oil price predictions in real terms of IEW polls /Schrattenholzer, 1998/ and IEA World Energy Outlook /EIA, 2008c/; IEA 2006-2008/

The third oil price surge – what’s different this time? 2
The objective of this paper1 is to analyse what can be learned from history with respect to typical features indicating significant price surges of the world oil price. We start off with the question, whether the period 1973 to 1985 with a record peak in oil price in 1980 and drastic decrease thereafter is comparable with the present oil price peak situation. Furthermore, we study if similar measures as during the eighties could contribute to control oil prices in the future and give indications about supply as well as demand side measures and their impact on the oil price development. After a historical retrospect in section 2, the factors that led to the recent oil price surge are studied and compared to the situation in the 1970s/80s in section 3. By means of a model based analysis of the oil market, we try to develop some insights into the necessary condi-tions as well as the means to be taken for an oil price staying on a comparably low level in section 4.
2 The first two oil price crises and how they emerged The first oil price crisis began on October 17, 1973 as a result of the ongoing Yom Kippur War. Arab OPEC members plus Egypt and Syria announced a monthly five percent reduction of oil production and an oil ban on nations that supported Israel during the conflict. This em-bargo, which affected America, Japan and parts of Europe, was lifted five months after its implementation. The effect on the oil price was immediately visible. From September 1973 to January 1974 the oil price quadrupled in nominal terms from USD 2.59 to 11.65 per barrel. As a conse-quence the world economy passed through the worst recession in post-war history. Further-more, strategic reserves were established in OECD-countries, while energy efficiency and alternative energy sources, including nuclear power, moved into the focus of public interest. The second oil price crisis emerged in Iran. Beginning in 1978 the Iranian Revolution forced the Shah to leave the country and transformed Iran into an Islamic republic. Amid country-wide protests and strikes, Iranian oil production dropped from about 6 million barrels per day (bbl/d) at the end of 1978, representing 10 % of world crude oil production, to less than 1 mb/d by October 1980. Thus, about 5 mb/d were withdrawn from the market. As a response to the drop in Iranian production Saudi Arabia, Iraq, Nigeria and Kuwait increased their pro-
1 The authors are grateful for a grant from the Stiftung Energieforschung Baden-Württemberg for the research
project “An integrated analysis of the long-term development of global energy prices”. The analysis presented here is part of this project.
The third oil price surge – what’s different this time? 3
duction, thereby mitigating the full effect of the production halt. Iranian oil production never recovered to levels seen in the 1970s. In total, world oil production decreased by 4 %, due to the situation in Iran and the following Iraq-Iran war causing the oil price to almost triple by the beginning of 1981. This demon-strates the very low elasticity of oil demand in the short run. Japan was particularly hit by this development as 15 % of their oil demand depended on imports from Iran.
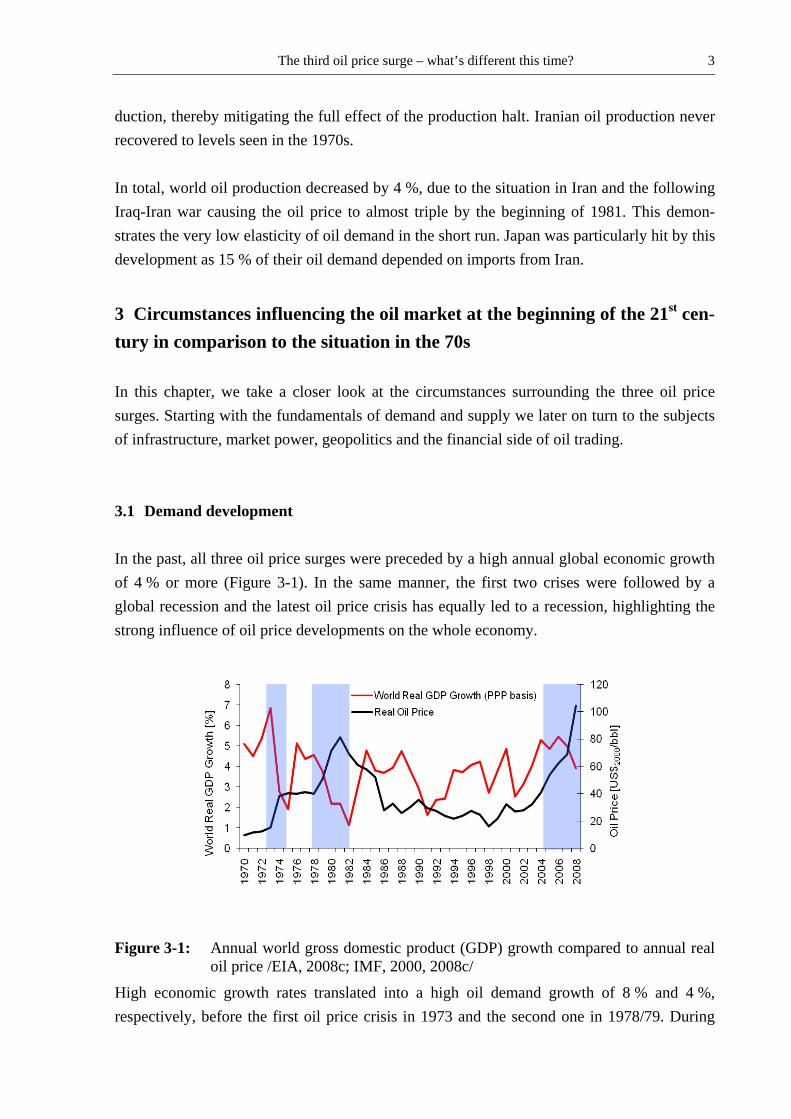
3 Circumstances influencing the oil market at the beginning of the 21st cen-tury in comparison to the situation in the 70s In this chapter, we take a closer look at the circumstances surrounding the three oil price surges. Starting with the fundamentals of demand and supply we later on turn to the subjects of infrastructure, market power, geopolitics and the financial side of oil trading. 3.1 Demand development In the past, all three oil price surges were preceded by a high annual global economic growth of 4 % or more (Figure 3-1). In the same manner, the first two crises were followed by a global recession and the latest oil price crisis has equally led to a recession, highlighting the strong influence of oil price developments on the whole economy.
Figure 3-1: Annual world gross domestic product (GDP) growth compared to annual real oil price /EIA, 2008c; IMF, 2000, 2008c/
High economic growth rates translated into a high oil demand growth of 8 % and 4 %, respectively, before the first oil price crisis in 1973 and the second one in 1978/79. During
The third oil price surge – what’s different this time? 4
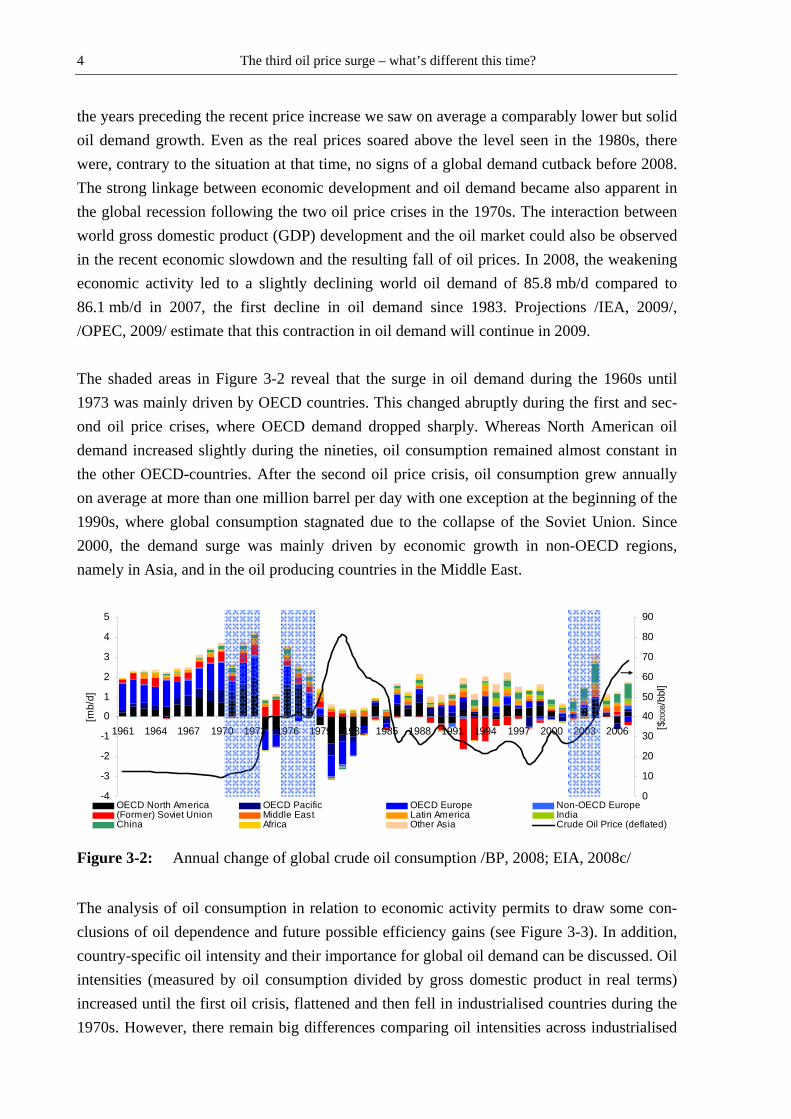
the years preceding the recent price increase we saw on average a comparably lower but solid oil demand growth. Even as the real prices soared above the level seen in the 1980s, there were, contrary to the situation at that time, no signs of a global demand cutback before 2008. The strong linkage between economic development and oil demand became also apparent in the global recession following the two oil price crises in the 1970s. The interaction between world gross domestic product (GDP) development and the oil market could also be observed in the recent economic slowdown and the resulting fall of oil prices. In 2008, the weakening economic activity led to a slightly declining world oil demand of 85.8 mb/d compared to 86.1 mb/d in 2007, the first decline in oil demand since 1983. Projections /IEA, 2009/, /OPEC, 2009/ estimate that this contraction in oil demand will continue in 2009. The shaded areas in Figure 3-2 reveal that the surge in oil demand during the 1960s until 1973 was mainly driven by OECD countries. This changed abruptly during the first and sec-ond oil price crises, where OECD demand dropped sharply. Whereas North American oil demand increased slightly during the nineties, oil consumption remained almost constant in the other OECD-countries. After the second oil price crisis, oil consumption grew annually on average at more than one million barrel per day with one exception at the beginning of the 1990s, where global consumption stagnated due to the collapse of the Soviet Union. Since 2000, the demand surge was mainly driven by economic growth in non-OECD regions, namely in Asia, and in the oil producing countries in the Middle East.
-4
-3
-2
-1
0
1
2
3
4
5
1961 1964 1967 1970 1973 1976 1979 1982 1985 1988 1991 1994 1997 2000 2003 2006
[mb/
d]
0
10
20
30
40
50
60
70
80
90
[$20
08/b
bl]
OECD North America OECD Pacific OECD Europe Non-OECD Europe(Former) Soviet Union Middle East Latin America IndiaChina Africa Other Asia Crude Oil Price (deflated)
Figure 3-2: Annual change of global crude oil consumption /BP, 2008; EIA, 2008c/
The analysis of oil consumption in relation to economic activity permits to draw some con-clusions of oil dependence and future possible efficiency gains (see Figure 3-3). In addition, country-specific oil intensity and their importance for global oil demand can be discussed. Oil intensities (measured by oil consumption divided by gross domestic product in real terms) increased until the first oil crisis, flattened and then fell in industrialised countries during the 1970s. However, there remain big differences comparing oil intensities across industrialised

The third oil price surge – what’s different this time? 5
countries, leaving a wide scope for decoupling oil demand growth from economic growth. While the United States for example consumes about 800 bbl per million USD2008, it is roughly half the value in the United Kingdom. Yet, in the 21st century oil demand is driven by emerging economies, like China and India, whose economies seem to be more robust to rising energy prices. Oil intensity began to drop in China in 1976 and total oil consumption in 1980 in response to economic reforms imple-mented at the time. In the nineties the oil intensity of the Chinese economy began to stabilise in the wake of surging industrial production. In emerging economies, such as India and China, there remains the possibility to decouple oil consumption growth from economic growth via efficiency gains. As China is the second biggest oil consumer and is dependent on crude oil imports since 1993 /IEA, 2007c/, the question whether China’s oil intensity will keep falling will be pivotal for oil demand in the coming years. This is even more true as the International Energy Agency (IEA) predicts that China and India will be responsible for 42% of oil demand growth from 2005 to 2030 /IEA, 2007c/ with the transport sector being the main driving force.
Figure 3-3: Oil intensity of selected economies /BP, 2008; IMF, 2008a/
In conclusion, the prospects for oil demand development are somewhat different during the recent oil price surge than during the first two. Demand growth in the 1970s was mainly made up from OECD-countries that reacted to the oil price shocks with substitution of oil in electricity generation. This can be explained to a certain extent with the fact that 92 % of global oil demand growth from 1973 to 2002 came from the transport sector, which exhibits a lower substitutability than electricity production /Ruiz, 2004/. A high number of transport
The third oil price surge – what’s different this time? 6
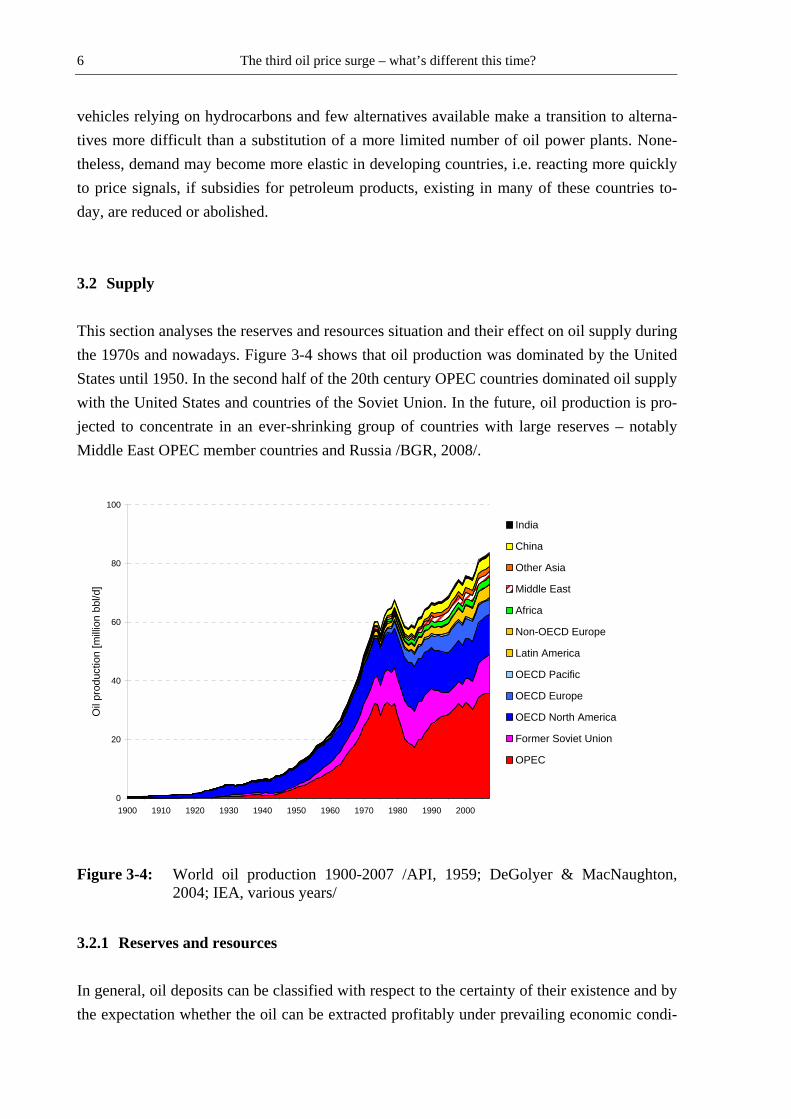
vehicles relying on hydrocarbons and few alternatives available make a transition to alterna-tives more difficult than a substitution of a more limited number of oil power plants. None-theless, demand may become more elastic in developing countries, i.e. reacting more quickly to price signals, if subsidies for petroleum products, existing in many of these countries to-day, are reduced or abolished. 3.2 Supply This section analyses the reserves and resources situation and their effect on oil supply during the 1970s and nowadays. Figure 3-4 shows that oil production was dominated by the United States until 1950. In the second half of the 20th century OPEC countries dominated oil supply with the United States and countries of the Soviet Union. In the future, oil production is pro-jected to concentrate in an ever-shrinking group of countries with large reserves – notably Middle East OPEC member countries and Russia /BGR, 2008/.
0
20
40
60
80
100
1900 1910 1920 1930 1940 1950 1960 1970 1980 1990 2000
Oil
prod
uctio
n [m
illion
bbl
/d]
India
China
Other Asia
Middle East
Africa
Non-OECD Europe
Latin America
OECD Pacific
OECD Europe
OECD North America
Former Soviet Union
OPEC
Figure 3-4: World oil production 1900-2007 /API, 1959; DeGolyer & MacNaughton, 2004; IEA, various years/
3.2.1 Reserves and resources In general, oil deposits can be classified with respect to the certainty of their existence and by the expectation whether the oil can be extracted profitably under prevailing economic condi-
The third oil price surge – what’s different this time? 7
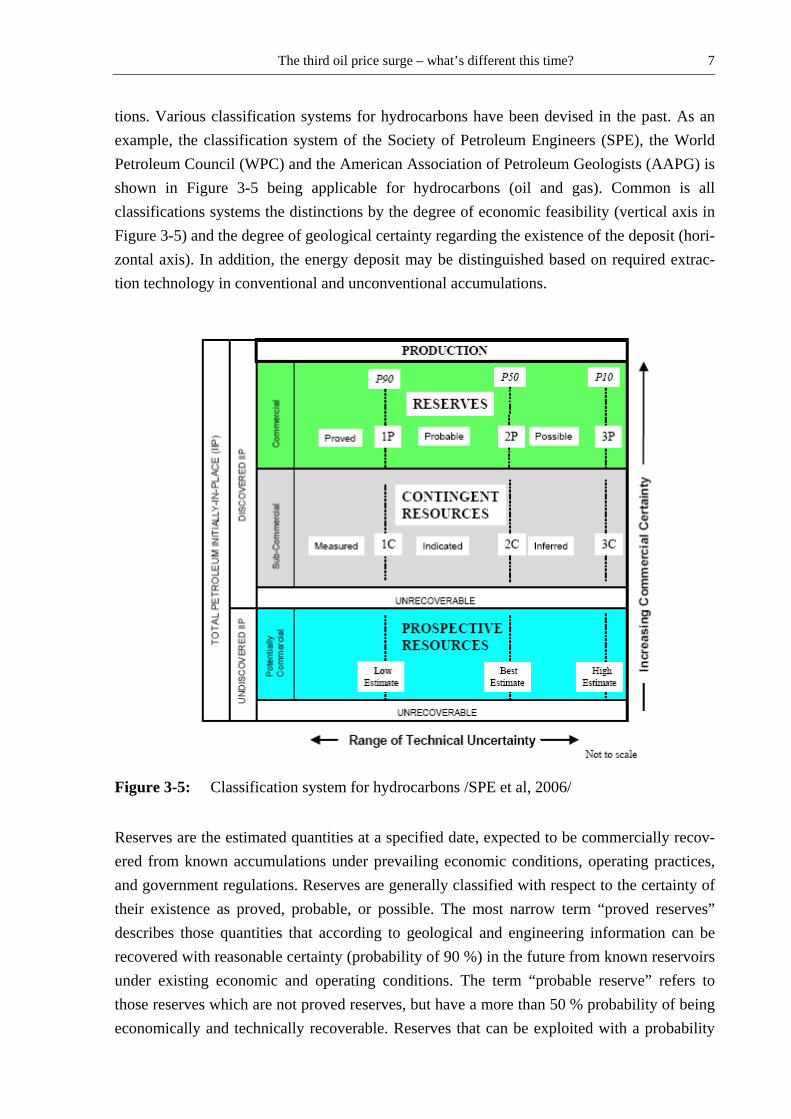
tions. Various classification systems for hydrocarbons have been devised in the past. As an example, the classification system of the Society of Petroleum Engineers (SPE), the World Petroleum Council (WPC) and the American Association of Petroleum Geologists (AAPG) is shown in Figure 3-5 being applicable for hydrocarbons (oil and gas). Common is all classifications systems the distinctions by the degree of economic feasibility (vertical axis in Figure 3-5) and the degree of geological certainty regarding the existence of the deposit (hori-zontal axis). In addition, the energy deposit may be distinguished based on required extrac-tion technology in conventional and unconventional accumulations.
Figure 3-5: Classification system for hydrocarbons /SPE et al, 2006/
Reserves are the estimated quantities at a specified date, expected to be commercially recov-ered from known accumulations under prevailing economic conditions, operating practices, and government regulations. Reserves are generally classified with respect to the certainty of their existence as proved, probable, or possible. The most narrow term “proved reserves” describes those quantities that according to geological and engineering information can be recovered with reasonable certainty (probability of 90 %) in the future from known reservoirs under existing economic and operating conditions. The term “probable reserve” refers to those reserves which are not proved reserves, but have a more than 50 % probability of being economically and technically recoverable. Reserves that can be exploited with a probability
The third oil price surge – what’s different this time? 8
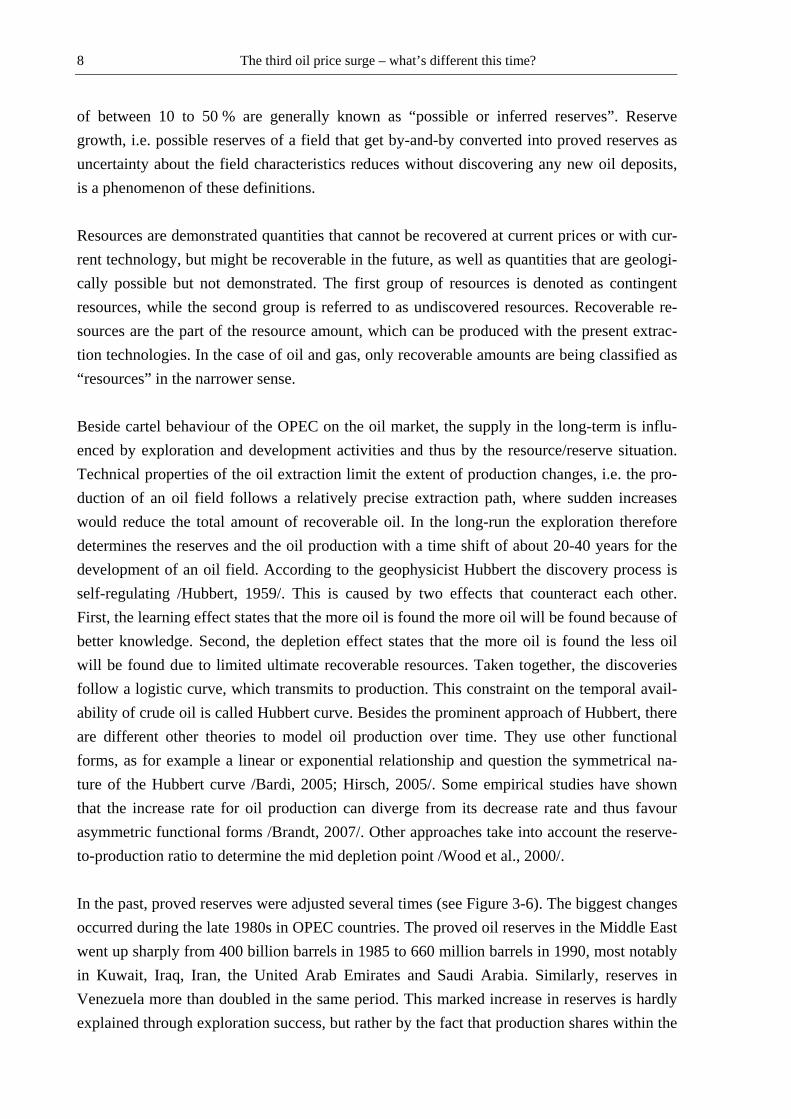
of between 10 to 50 % are generally known as “possible or inferred reserves”. Reserve growth, i.e. possible reserves of a field that get by-and-by converted into proved reserves as uncertainty about the field characteristics reduces without discovering any new oil deposits, is a phenomenon of these definitions. Resources are demonstrated quantities that cannot be recovered at current prices or with cur-rent technology, but might be recoverable in the future, as well as quantities that are geologi-cally possible but not demonstrated. The first group of resources is denoted as contingent resources, while the second group is referred to as undiscovered resources. Recoverable re-sources are the part of the resource amount, which can be produced with the present extrac-tion technologies. In the case of oil and gas, only recoverable amounts are being classified as “resources” in the narrower sense. Beside cartel behaviour of the OPEC on the oil market, the supply in the long-term is influ-enced by exploration and development activities and thus by the resource/reserve situation. Technical properties of the oil extraction limit the extent of production changes, i.e. the pro-duction of an oil field follows a relatively precise extraction path, where sudden increases would reduce the total amount of recoverable oil. In the long-run the exploration therefore determines the reserves and the oil production with a time shift of about 20-40 years for the development of an oil field. According to the geophysicist Hubbert the discovery process is self-regulating /Hubbert, 1959/. This is caused by two effects that counteract each other. First, the learning effect states that the more oil is found the more oil will be found because of better knowledge. Second, the depletion effect states that the more oil is found the less oil will be found due to limited ultimate recoverable resources. Taken together, the discoveries follow a logistic curve, which transmits to production. This constraint on the temporal avail-ability of crude oil is called Hubbert curve. Besides the prominent approach of Hubbert, there are different other theories to model oil production over time. They use other functional forms, as for example a linear or exponential relationship and question the symmetrical na-ture of the Hubbert curve /Bardi, 2005; Hirsch, 2005/. Some empirical studies have shown that the increase rate for oil production can diverge from its decrease rate and thus favour asymmetric functional forms /Brandt, 2007/. Other approaches take into account the reserve-to-production ratio to determine the mid depletion point /Wood et al., 2000/. In the past, proved reserves were adjusted several times (see Figure 3-6). The biggest changes occurred during the late 1980s in OPEC countries. The proved oil reserves in the Middle East went up sharply from 400 billion barrels in 1985 to 660 million barrels in 1990, most notably in Kuwait, Iraq, Iran, the United Arab Emirates and Saudi Arabia. Similarly, reserves in Venezuela more than doubled in the same period. This marked increase in reserves is hardly explained through exploration success, but rather by the fact that production shares within the
The third oil price surge – what’s different this time? 9
OPEC-cartel are attributed according to the reserve situation. As Kuwait began in 1985 to significantly increase its declared proved reserves, it seems that other OPEC countries fol-lowed to maintain their production stable.
0
200
400
600
800
1,000
1,200
1,400
1980
1982
1984
1986
1988
1990
1992
1994
1996
1998
2000
2002
2004
2006
2008
[bill
ion
bbl]
0
5
10
15
20
25
30
35
40
45
50
[yea
rs]
Middle East EurasiaNorth America EuropeCentral & South America AfricaAsia & Oceania R/P Ratio
Figure 3-6: Proved crude oil reserves /BP, 2008/
Since reserves include only oil that is recoverable with existing economic and operating con-ditions, unconventional oil resources, mainly oil sands, entered in 2003 the reserve statistics as they became economically recoverable. Consequently, Canadian oil reserves rose more than 37-fold to 180 billion barrels, making it the country with the second biggest oil reserves behind Saudi-Arabia. However, such reserve changes only have a minor influence on the oil price as they are anticipated and merely reflect exploration success – the turning of resources into reserves, which effect was described above. If one filters the changes in reserves caused by OPEC in the 1980s and Canada, a linear trend of annually increasing reserves can still be identified. As a consequence to rising reserves over the last 30 years, the reserve-to-produc-tion (R/P) ratio increased despite rising production from 30 years in 1980 to over 40 in 2008. Reserve estimations have to be treated with some caution, since the criteria for assessing re-serves may differ between countries and companies as well as a tendency to over- or under-estimate the reserve depending on the purpose of the assessment. Oil companies listed on the stock exchange may be more cautious in their reserve statements due to negative effects on the share price in case of later downward corrections. On the other hand, as discussed above, OPEC members may have a tendency to overestimate their reserve figures to gain a higher production quota within the cartel. Also developing countries, which are interested in at-
The third oil price surge – what’s different this time? 10
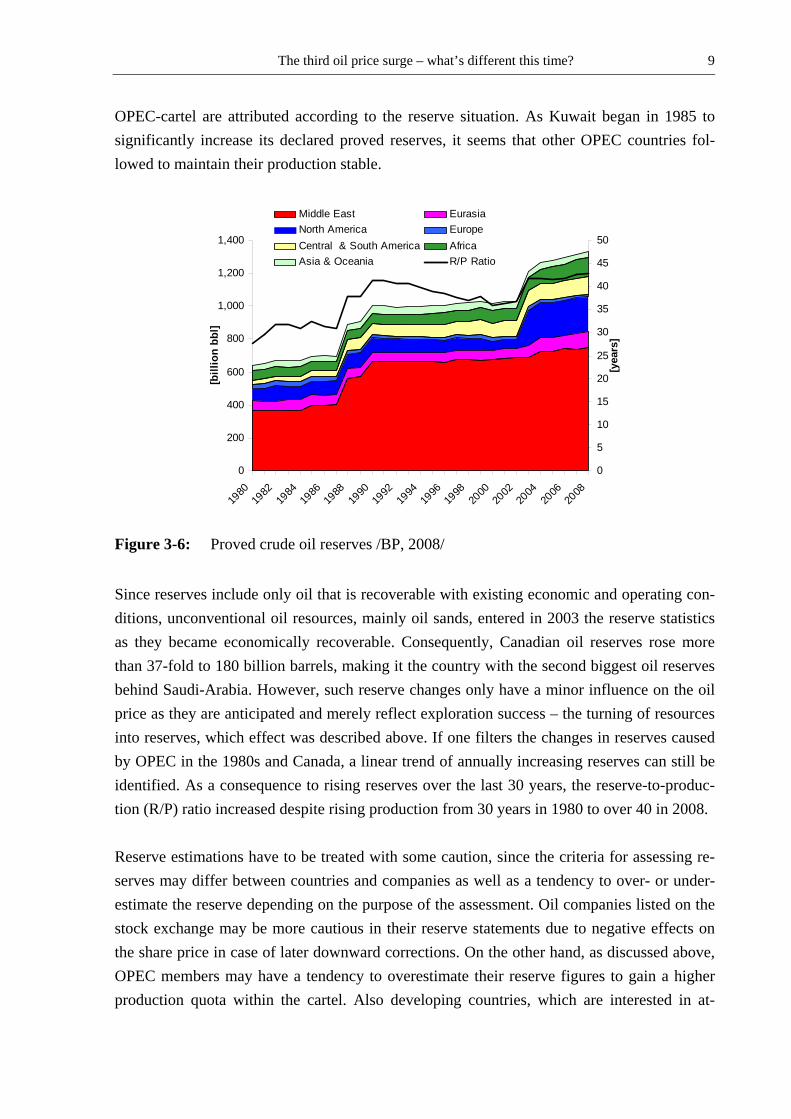
tracting foreign capital for developing their oil reserves, may be tempted to draw a more op-timistic picture of their situation to attract investors. During the 1970s the two oil price shocks led to a wave of new investment into new oil fields in Alaska, Siberia and the North Sea. So what is the situation during the recent price surge faced to a relative high oil price concerning exploration activity? At the beginning of the 21st century, investment activity is increasing. Upstream investment rose from USD 120 billion in 2000 to USD 390 billion in 2007 /IEA, 2008c/. The rising investment activity is also mirrored in an increased use of drilling rigs similar to the oil price crisis of 1979 (Figure 3-7). However, a major part of nominal investment spending is due to higher unit costs, which grew on average by an estimated 90 % between 2000 and 2007. Taking the decline in current production into account, investment into upstream facilities has to increase in order to satisfy projected demand in 2015 and beyond. Over the next years until 2030 investments in the exploration and development have to be around USD 350 billion per year in order to meet the demand projections of the World Energy Outlook 2008.
0
1000
2000
3000
4000
5000
6000
1975 1978 1981 1984 1987 1990 1993 1996 1999 2002 2005 2008
Num
ber o
f Act
ive
Dril
ling
Rig
s
0
20
40
60
80
100
120
Oil
Pric
e [U
S-$
2008
/bbl
]Correlation Coefficient: 0.82
Figure 3-7: Number of active drilling rigs /Baker Hughes, 2008; EIA, 2008d/
In summary, the numbers indicate an important increase in investment activity through to 2007, but the major part of this can be explained with cost inflation across the industry, caused by a lack of manpower, construction of transport infrastructure and more sophisticated upstream equipment. For the future, it is uncertain if the needed investments will be carried out, because investment has to shift to regions where national oil companies dominate the market in particular in the Middle East. What are the prospects for new supply in the near future? Over time the picture can change as prices rise and technological developments can reduce the production costs for some re-

The third oil price surge – what’s different this time? 11
sources. The next section analyses possible future resources and reserves which can mitigate the effect of decreasing existing capacities. 3.2.2 Prospects for new supply After the oil price crises of the 1970/80s, the developments of oil fields in Alaska, the North Sea and Western Siberia were some signs of relief. Oil fields in the North Sea were already discovered during the 1970s and they came on-stream in the 1980s and 90s. Although the region is a relatively high-cost producer, its political stability and proximity to major con-sumer regions have allowed it to play a major role in European oil and natural gas markets. Since 1999 oil production in Norway and the United Kingdom, two major oil suppliers in the North Sea, has peaked at about 6 mb/d and nowadays production in the North Sea is on a long-term decline /EIA, 2008a/. If the North Sea oil production will stick to its historic Hub-bert curve profile, oil production is projected to fall under 1 mb/d by 2019. Similarly, Alaska’s oil production has peaked in 1988 at 2 mb/d and accounted in 2007 for only 14 % of total U.S. oil production /EIA, 2008f/. Oil discoveries in Siberia helped Soviet production to peak in 1988 with 12.5 mb/d, which halved after the collapse of the Soviet Union in 1991 /BP, 2008/. Although Russia has about 60 billion barrels of proved oil reserves /BP, 2008/ and oil production took a turn after privatisation, political constraints make it difficult for Russia to surpass the 10 mb/d threshold again. Tax structure is the major impediment for supply growth (see section 3.6). Production in the countries of the former Soviet Union could be expanded but would require investments in exploration and development, often under difficult conditions in Arctic regions and the build-up of the necessary transport infrastructure. Today’s new sources of non-OPEC production are more focused in countries such as for ex-ample Mexico, Brazil and Angola. These cases concern mainly deep-water basins, which are likely to be more numerous but smaller. Those projects will have higher development and production costs per barrel of in the region of USD 40-60 /IEA, 2008c/, resulting in higher investment than current large oil fields and offering little relaxation on the oil price. Unex-plored areas with the possibilities of large new discoveries include beside Russian Arctic and deep-water Caspian also Iraq /BGR, 2008/. Though, in Iraq the primary concern will be the redevelopment of existing oil fields. Most other countries, e.g. China, can be considered as mature oil-producing countries, were the majority oil fields are more than 50 % depleted /IEA, 2007c/. Thus, enhanced oil recovery (EOR) will become more important to maximise the output of declining oil fields. In the beginning of the 21st century the hope for future major new oil supplies rests on un-conventional oil resources, i.e. oil sand and shale oil. Oil sands have rapidly developed in

The third oil price surge – what’s different this time? 12
Canada, especially in Alberta. Production costs according to the IEA /2008c/ are about 30-70 USD/bbl, compared to costs for Middle East oil of well below 20 USD/bbl. Oil sand production in Canada is expected to increase from 1.2 mb/d in 2007 to 3.5 mb/d in 2015 /CAPP, 2008/. In Venezuela, the other main producer of crude oil from oil sands (also called extra-heavy oil) production reached about 0.5 mb/d in 2007. Nevertheless, the development of oil sand projects remains uncertain. This resource category requires an upgrading process so that the resulting oil can be further used in a refinery process. This process requires a higher energy input (usually natural gas) between 10 to 20 % relative to the produced oil and thus emits higher CO2 emissions compared to conventional oil. Furthermore, depending on the process, shale oil and oil sand production can entail large scale destruction of landscape. Another problem represents the water consumption needed for the upgrading process, which is 2.5-4 times the amount of oil in the case of oil sand /National Energy Board, 2006/. The other unconventional oil category, shale oil, has far more proven resources than oil sands. Shale oil production costs are expected to be at 50-110 USD/bbl /IEA, 2008c/. In the past, shale oil was generally used as a primary energy source for heating and electricity gen-eration in pulverised firing, e.g. in Estonia. Only about 25 % were used for the conversion to oil, with Estonia, Brazil, China and Australia being the biggest producing countries with a total of 10,000 bbl/d in 2001 /Brendow, 2003/. The largest resources are in the United States with more than 60 % of the world total, followed by Brazil, Jordan and Morocco /IEA, 2008c/. As the process of transforming shale oil into an input for refineries is not as far devel-oped as that for oil sands, uncertainties remain regarding the potential of shale oil as a reli-able oil supply. The high need for water in the production process of shale oil of 2.1-5.2 times the amount of oil /Bartis et al., 2005/ is especially a critical issue in the exploitation of shale oil resources. In a nutshell, important quantities of oil are available in the near future for production, in particular deep-sea oil and unconventional oil. Yet, those types of resources require much higher production costs in comparison to the past production. 3.3 Infrastructure Capital-intensive infrastructure is necessary to produce crude oil, refine it to petroleum products and transport the petroleum from producing to consuming regions. The petroleum industry has undergone major changes in terms of technology and market players since the two oil crises in the 70s of the last century and today. The following section of the paper compares the initial situation and evolution of the oil price crises between these time periods to identify similarities and differences of the role of infrastructure on the oil price.

The third oil price surge – what’s different this time? 13
3.3.1 Production capacities In the decade between 1960 and 1970 global oil demand grew at a staggering rate of 8 % per year. In the USA, domestic oil supply was not able to catch up with this surge in demand for oil, the 20-year era of surplus production capacity was at its end. While in 1957 the US sur-plus production capacity had been around 4 mb/d, it went down to 1 mb/d by 1970. After low surplus capacities in OPEC countries in both periods leading to the oil price crises, the reduction in oil demand from OECD countries in the 1980s led to a surplus OPEC production (Fehler! Verweisquelle konnte nicht gefunden werden.), which was slowly reduced by an uptake of oil demand in non-OECD countries. During the price increase from 2003 to 2008 OPEC’s surplus capacity was comparably low, indicating a tight supply situation within the OPEC. All three oil price crises were marked by a low OPEC surplus capacity, indicating the importance of OPEC’s oil supply. The World Energy Outlook in 2008 /IEA, 2008c/ predicts that by 2030 crude oil production in non-OPEC countries from existing oil fields will fall by 12 mb/d from today’s 45 mb/d. In the OPEC output from existing fields is anticipated to fall by 17 mb/d from 31 mb/d in 2007. To make up for these production losses, expansion of oil production capacities has a particu-lar importance. In the OPEC, production capacities will be increased to a significant extent with enhanced oil recovery (EOR) techniques. Important upstream gas developments in the future will have consequences for the oil market, because the production of Natural Gas Liquids (NGL) as a by-product will increase. In 2008, 101 upstream oil projects are under development and planned with the majority in Saudi Arabia, Iran and Iraq. Saudi Arabia plans 3 mb/d in 2015 as capacity additions with five major oil fields. Capacity increases in Iraq and Iran mainly depend on constraints for investments due to the political instability. From offshore oil fields a capacity expansion of about 2.7 mb/d can be expected from Nigeria and Angola /IEA, 2008c/. In the near future, the situation for capacity additions is grimmer for countries outside the OPEC. This is due to fewer past investments in exploration and current high costs of developing offshore fields. Even in the longer-term the potential for onshore capacities is limited as many small oil fields are discovered that are not large enough to be exploited and due to political restrictions in Russia (see section 3.6). Significant capacity increases are ex-pected to come from the Caspian region, from Brazilian offshore fields with a level of 1.3 mb/d and from unconventional oil resources in Canada /IEA, 2008c/.

The third oil price surge – what’s different this time? 14
The data on the declining production from existing producing oil fields suggests major ca-pacity increases to make up for the losses. According to the International Energy Agency /2008c/ current oil projects are sufficient to keep up with projected demand up to 2011, whereupon the situation is much more uncertain.
Figure 3-8: OPEC surplus capacity 1970-2008 /U.S. Central Intelligence Agency; Energy
Intelligence Group/ Secrecy on its production and reserve/resource data on the part of the OPEC countries leaves much room for speculation whether the Middle East could expand its production capacity in order to cover a possible growth in global oil demand. This uncertainty regarding OPEC mid-term production capabilities in the current phase of oil demand growth and tight surplus may be a factor reflected as a mark-up in oil prices. 3.3.2 Refining Initially, in the 1950s, the majority of the refineries were located in the consuming nations. In the course of the nationalisation of oil companies in the OPEC countries, the national oil companies strived to gain control over the entire petroleum value chain by building export refineries in their countries. The breakdown of global oil consumption as a cause of the two oil price crises in 1970s created excess refinery capacities (Figure 3-9), which made it cheaper for producing countries like Venezuela, Saudi Arabia or Kuwait to acquire refineries in the consuming nations (e.g. Europe, USA) /Adelman et al., 2004/. Since the beginning of the 1980s, the refinery utilisation has continuously increased, leading to capacity utilisation of above 90 % over the last decade. Currently it is very difficult to ex-

The third oil price surge – what’s different this time? 15
pand or upgrade facilities in refineries in industrialised countries, due to environmental regu-lations and local opposition. This results in increases in product imports and expansions in refining capacities outside of industrialised countries, which have fewer regulations.
0
10
20
30
40
50
60
70
80
90
1971 1974 1977 1980 1983 1986 1989 1992 1995 1998 2001 2004
Ref
iner
y ca
paci
ty a
nd th
roug
hput
[mill
ion
bbl/d
]
0%
10%
20%
30%
40%
50%
60%
70%
80%
90%
100%
Ref
iner
y ut
ilisa
tion
[%]
Non-OPEC Refinery capacityNon-OPEC Refinery throughputOPEC Refinery throughputOPEC Refinery capacityNon-OPEC Refinery utilisationOPEC Refinery utilisation
Figure 3-9: World oil refinery capacity and utilisation 1971-2006 /BP, 2008; EIA, 2008b;
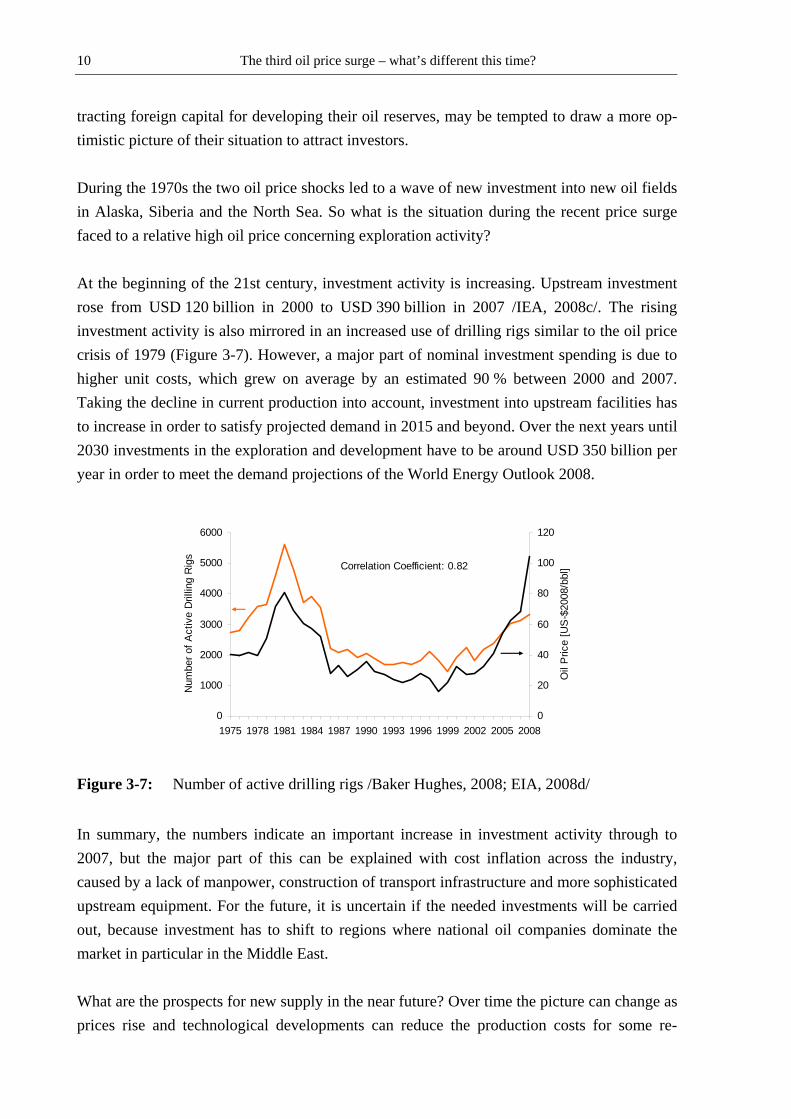
IEA, 2007b/ Different reasons have contributed to the need to upgrade refinery capacity. Besides the aim of a higher refinery throughput, the introduction of new, more stringent fuel specifications (low sulphur content) has required the modification of refinery facilities. Furthermore, product demand is shifting from heavy fuel oil in the 1970s to lighter middle distillates (die-sel), jet fuel and gasoline (Figure 3-10), while the available crude quality has become heavier and sourer over the last decade /Eni, 2008/. This mismatch coupled with the already high refinery utilisation level was in contrast to the driving forces behind the previous oil price increases. Refining margins have improved since 2004, in particular for complex refineries with upgrading capacity (which produce only gasoline (petrol) and middle distillates and virtually no fuel oil).
The third oil price surge – what’s different this time? 16
0
10
20
30
40
50
60
70
80
90
1971 1973 1975 1977 1979 1981 1983 1985 1987 1989 1991 1993 1995 1997 1999 2001 2003 2005
Wor
ld p
etro
leum
pro
duct
s de
man
d [m
illio
n bb
l/d]
Other Oil Products
Heavy Fuel Oil
Middle Distillates
Aviation Fuels
Motor Gasoline
LPG/Naphtha
Figure 3-10: World oil consumption by product group 1971-2006 /IEA, various years/
In contrast to the situation during the 1970s and 80s, the mismatch between existing refining capacities and the crude oil qualities, the changing petroleum product demands and the high utilisation level in the downstream sector have contributed to rising prices during the recent years. While there were still plans to significantly increase refinery capacity in 2007 to adapt to lighter and low-sulphur products and to increase tight capacity /IEA, 2007a/, some projects were abandoned or deferred during the oil price fall in the second half of 2008 because of an expected drop in oil products demand /IEA, 2008b/. 3.4 Financial investors During the oil price surge from 2003 to 2008 there have been comments from all corners of the political and economic spectrum that speculators are behind a significant portion of price movements in the crude oil market. A report for the United States senate concluded that “the large purchases of crude oil futures contracts by speculators have, in effect, created an addi-tional demand for oil, driving up the price of oil for future delivery … /Coleman et al., 2006/”. Even the former Federal Reserve chairman Alan Greenspan stated that “with the de-mand from the investment community, oil prices have moved up sooner than they would have otherwise” /Greenspan, 2006/. To distinguish speculators from commercial traders the US Commodity Futures Trading Commission (CFTC) defines a speculator as a person who does not produce or use the commodity, but risks his or her own capital trading futures in that commodity in hopes of making a profit on price changes /CFTC, 2008a/.

The third oil price surge – what’s different this time? 17
Those who see speculators behind the oil price developments point to the fact that speculative activity increased during the price surge. As can be seen in Figure 3-11, the number of open contracts in Light Sweet Crude Oil on the New York Mercantile Exchange (NYMEX), the biggest market for oil futures, and on the Intercontinental Exchange (ICE) in London has roughly tripled from 2003 to 2008, which mirrors the more than tripling of the Western Texas Intermediate (WTI) crude oil price over the same period. Furthermore the share of non-com-mercial traders in all open interest positions tended to increase during the period of the price increase. In part this is a result of oil becoming a popular asset, alongside stocks, bonds and property. The trouble with the housing markets worldwide combined with the financial crisis during these years has driven investors into commodities. During the recent oil price surge commodity traders and hedge funds were joined by pension funds and commodity index funds.
Figure 3-11: Open interest in future contracts /CFTC, 2008b; ICE, 2008/
The future market for nickel, which is a limited resource like crude oil, presents a good counterexample to the theory that increased trading leads to higher prices. On this market an increase in future trading went hand-in-hand with a long-term price decrease for the metal. The nickel price has more than halved from mid-2007 to mid-2008 on the London Metal Ex-change, while the volume of future trading increased. In fact, non-commercial traders help to provide the necessary liquidity for buyers and sellers on the market to offset their risks. So the entry of speculative capital into the crude oil future market in general improves market functioning /Weiner, 2002/. Well-informed speculators
The third oil price surge – what’s different this time? 18
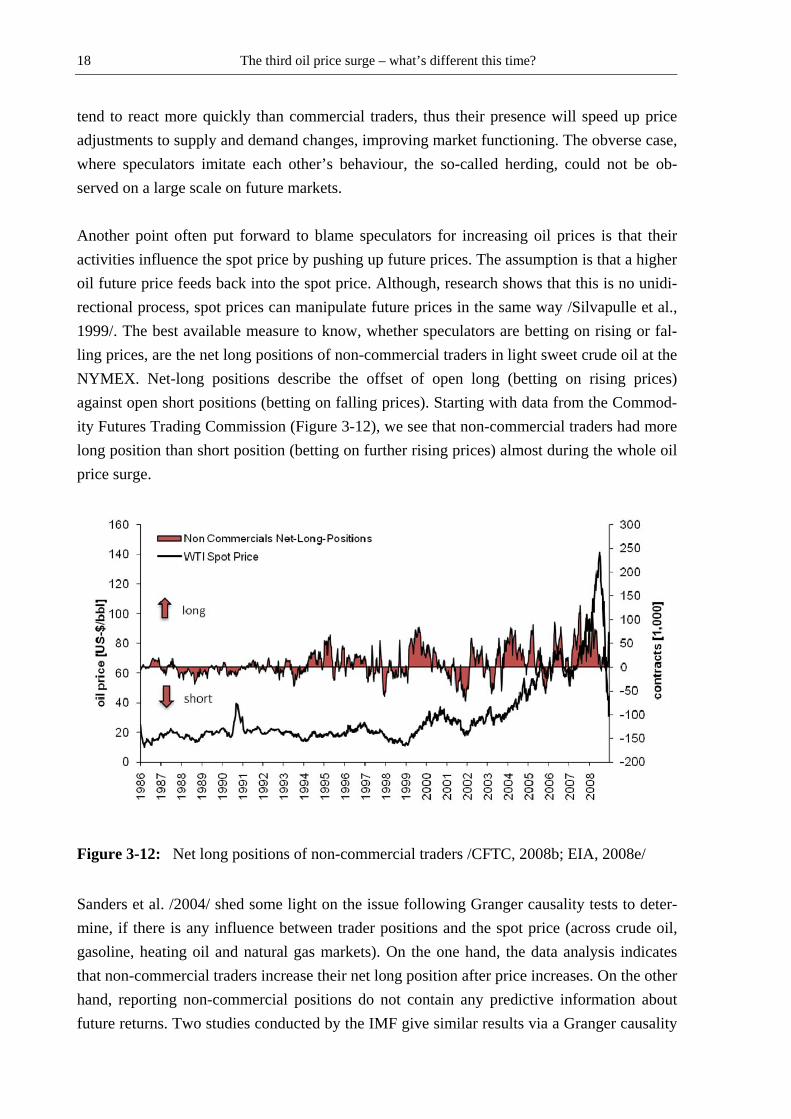
tend to react more quickly than commercial traders, thus their presence will speed up price adjustments to supply and demand changes, improving market functioning. The obverse case, where speculators imitate each other’s behaviour, the so-called herding, could not be ob-served on a large scale on future markets. Another point often put forward to blame speculators for increasing oil prices is that their activities influence the spot price by pushing up future prices. The assumption is that a higher oil future price feeds back into the spot price. Although, research shows that this is no unidi-rectional process, spot prices can manipulate future prices in the same way /Silvapulle et al., 1999/. The best available measure to know, whether speculators are betting on rising or fal-ling prices, are the net long positions of non-commercial traders in light sweet crude oil at the NYMEX. Net-long positions describe the offset of open long (betting on rising prices) against open short positions (betting on falling prices). Starting with data from the Commod-ity Futures Trading Commission (Figure 3-12), we see that non-commercial traders had more long position than short position (betting on further rising prices) almost during the whole oil price surge.
Figure 3-12: Net long positions of non-commercial traders /CFTC, 2008b; EIA, 2008e/
Sanders et al. /2004/ shed some light on the issue following Granger causality tests to deter-mine, if there is any influence between trader positions and the spot price (across crude oil, gasoline, heating oil and natural gas markets). On the one hand, the data analysis indicates that non-commercial traders increase their net long position after price increases. On the other hand, reporting non-commercial positions do not contain any predictive information about future returns. Two studies conducted by the IMF give similar results via a Granger causality
The third oil price surge – what’s different this time? 19
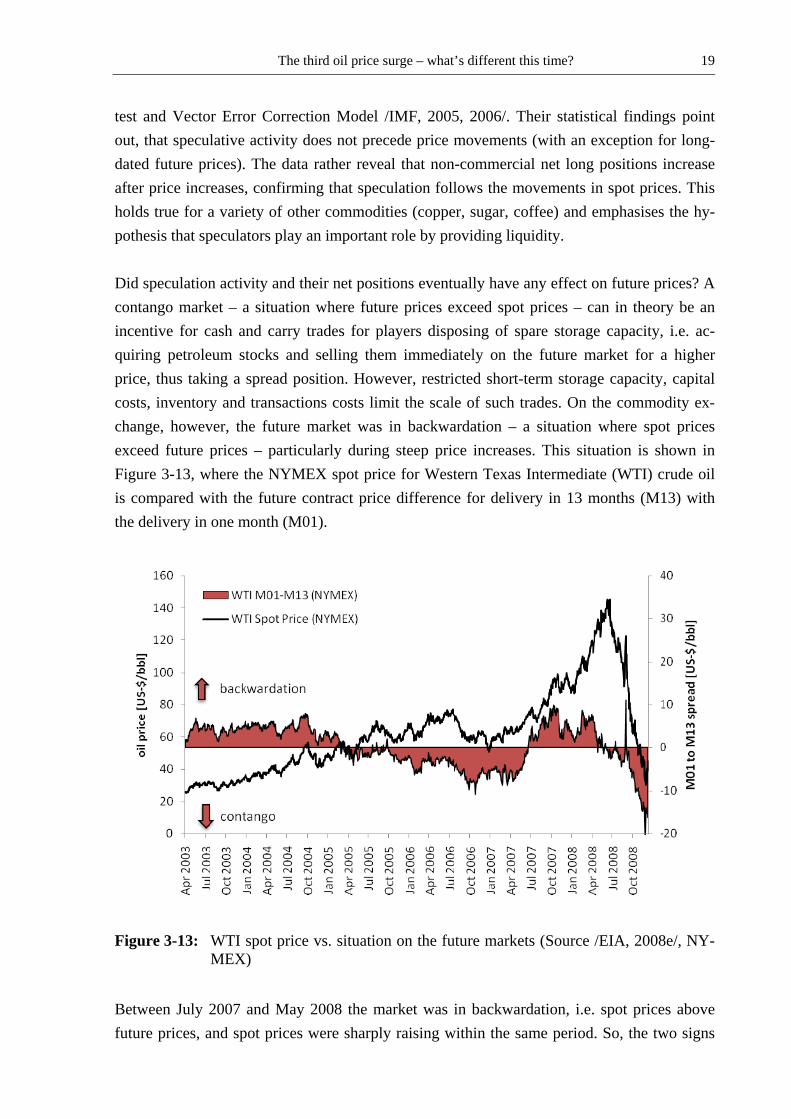
test and Vector Error Correction Model /IMF, 2005, 2006/. Their statistical findings point out, that speculative activity does not precede price movements (with an exception for long-dated future prices). The data rather reveal that non-commercial net long positions increase after price increases, confirming that speculation follows the movements in spot prices. This holds true for a variety of other commodities (copper, sugar, coffee) and emphasises the hy-pothesis that speculators play an important role by providing liquidity. Did speculation activity and their net positions eventually have any effect on future prices? A contango market – a situation where future prices exceed spot prices – can in theory be an incentive for cash and carry trades for players disposing of spare storage capacity, i.e. ac-quiring petroleum stocks and selling them immediately on the future market for a higher price, thus taking a spread position. However, restricted short-term storage capacity, capital costs, inventory and transactions costs limit the scale of such trades. On the commodity ex-change, however, the future market was in backwardation – a situation where spot prices exceed future prices – particularly during steep price increases. This situation is shown in Figure 3-13, where the NYMEX spot price for Western Texas Intermediate (WTI) crude oil is compared with the future contract price difference for delivery in 13 months (M13) with the delivery in one month (M01).
Figure 3-13: WTI spot price vs. situation on the future markets (Source /EIA, 2008e/, NY-MEX)
Between July 2007 and May 2008 the market was in backwardation, i.e. spot prices above future prices, and spot prices were sharply raising within the same period. So, the two signs
The third oil price surge – what’s different this time? 20
already mentioned – increase in speculation and betting on rising prices – have not been mirrored in the expected contango market, where future prices are above spot prices. The only way speculation can persistently influence the oil price is due to accumulation of the physical commodity. Future prices above spot prices that lead to expectations of higher prices in the future can influence oil producers to sell the oil later. Withholding oil from the market, thus diminishing supply, can substantially affect the price building mechanisms. But did hoarding of crude oil stimulate the recent price surge? In 2008 about 2 % of traders had the intention of getting their hands on barrels of crude oil /Economist, 2008/. The vast majority of speculators sell their contracts on to commercial traders or settle them with cash. Nevertheless, some analysts tried to prove the influence of speculators on the oil markets due to a simultaneous surge in petroleum stocks and prices in the United States from 2005 to 2007, indicating hoarding /Verleger, 2007/. An almost linear relationship between the US crude oil stocks excluding the Strategic Petroleum Reserve (SPR) and the oil price, starting in 2003 to mid-2007, could in fact be observed. However, this observation failed to materialise. The phenomenon was transitory, as in mid-2007 inventories were declining despite further rising prices. Moreover, the observation by /Verleger, 2007/ was restricted to US stocks and to crude oil stocks. Accordingly, shifts away from petroleum products and accumulations in other countries were not considered. Looking back into history reveals that a price surge accompanied by an accumulation of crude oil in inventories is nothing unusual (see shaded areas in Figure 3-14). Particularly dur-ing the second oil price crisis, panic stockpiling added to the price surge caused by the Iranian supply disruption and uncertainty caused by the following Iran-Iraq conflict. Since the mid-1980s total OECD petroleum stocks, measured in days of demand, are somewhat declining. During the price surge beginning in 2003, inventories have remained more or less on previous levels. Oil stocks including the Strategic Petroleum Reserve rose from 81 to 86 days of demand, but still in sharp contrast to earlier price surges, thus showing no relation-ship between increased speculative trading and rising oil stocks.

The third oil price surge – what’s different this time? 21
50
55
60
65
70
75
80
85
90
95
1973
1975
1977
1979
1981
1983
1985
1987
1989
1991
1993
1995
1997
1999
2001
2003
2005
2007
[day
s of
OE
CD
oil
dem
and]
0
20
40
60
80
100
120
[$(2
007)
/bbl
]
Petroleum Stocks, Total OECD
Oil Price (until 1982 arabian light, WTI afterwards)
Figure 3-14: OECD petroleum stocks /EIA, 2008c/
Other possibilities of storage would be a cutback of production below available capacities. As outlined before (see section 3.2) there were no signs of spare extraction capacities since 2003, except for a little margin in Saudi Arabia. Another point could be made that oil is stored in non-OECD stocks. In spite of robust data for non-OECD consumers, inventory changes in those countries do not indicate such an accumulation /HM Treasury, 2008/. In conclusion, the impact of derivative investors remains small and short-term relative to fundamental trends in demand and supply for the physical commodity. We argued that an increase in speculative activity and speculator’s betting on rising prices does not per se lead to price increases. Rather physical accumulation would be a sign for speculative influence, which did not happen during the last years. Nevertheless one cannot rule out a transitory in-fluence of those investors, in particular around turning points, accelerating price adjustments. According to this a transitory and limited influence of speculators during the steep price in-crease and fall cannot be ruled out. 3.5 Dollar exchange rate Not only speculators were blamed during the price rise starting in 2003. David T. King, a former chief of the New York Federal Reserve said in 2008 that the weak dollar is responsi-ble for “at least half” of the increase in gasoline prices paid by US consumers /King, 2008/. Ever since the trading of crude oil in USD, the role of the currency in price movements re-mains an open question. For a commodity that trades globally, as crude oil, trading in one currency lowers transaction costs.
The third oil price surge – what’s different this time? 22
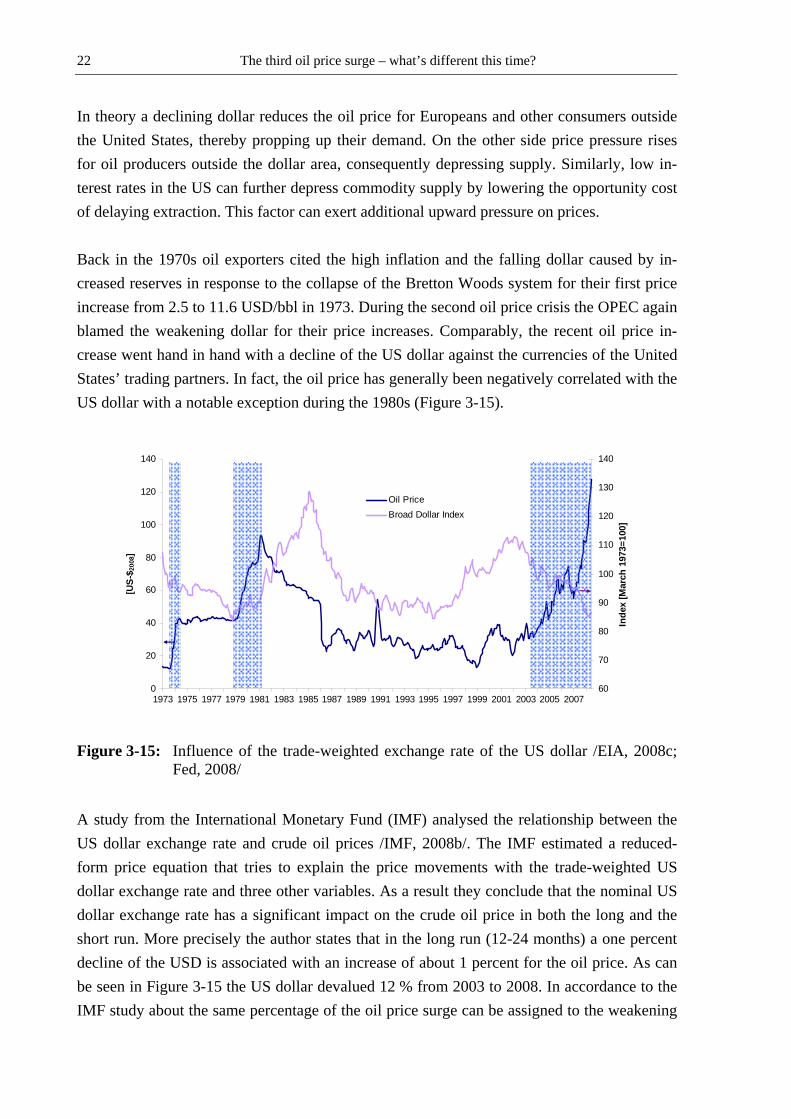
In theory a declining dollar reduces the oil price for Europeans and other consumers outside the United States, thereby propping up their demand. On the other side price pressure rises for oil producers outside the dollar area, consequently depressing supply. Similarly, low in-terest rates in the US can further depress commodity supply by lowering the opportunity cost of delaying extraction. This factor can exert additional upward pressure on prices. Back in the 1970s oil exporters cited the high inflation and the falling dollar caused by in-creased reserves in response to the collapse of the Bretton Woods system for their first price increase from 2.5 to 11.6 USD/bbl in 1973. During the second oil price crisis the OPEC again blamed the weakening dollar for their price increases. Comparably, the recent oil price in-crease went hand in hand with a decline of the US dollar against the currencies of the United States’ trading partners. In fact, the oil price has generally been negatively correlated with the US dollar with a notable exception during the 1980s (Figure 3-15).
0
20
40
60
80
100
120
140
1973 1975 1977 1979 1981 1983 1985 1987 1989 1991 1993 1995 1997 1999 2001 2003 2005 2007
[US-
$ 200
8]
60
70
80
90
100
110
120
130
140
Inde
x [M
arch
197
3=10
0]
Oil PriceBroad Dollar Index
Figure 3-15: Influence of the trade-weighted exchange rate of the US dollar /EIA, 2008c; Fed, 2008/
A study from the International Monetary Fund (IMF) analysed the relationship between the US dollar exchange rate and crude oil prices /IMF, 2008b/. The IMF estimated a reduced-form price equation that tries to explain the price movements with the trade-weighted US dollar exchange rate and three other variables. As a result they conclude that the nominal US dollar exchange rate has a significant impact on the crude oil price in both the long and the short run. More precisely the author states that in the long run (12-24 months) a one percent decline of the USD is associated with an increase of about 1 percent for the oil price. As can be seen in Figure 3-15 the US dollar devalued 12 % from 2003 to 2008. In accordance to the IMF study about the same percentage of the oil price surge can be assigned to the weakening
The third oil price surge – what’s different this time? 23
of the dollar. Concluding, the decline of the US dollar was one factor affecting the oil price in recent years, however, consistent with the IMF /IMF, 2008b/ this was no more than USD 20. 3.6 Geopolitics and political constraints Geopolitical instability has been one of the most prominent reasons for the oil price hikes in the past 30 years. The most far-reaching consequences were the political instability in the Middle East and in Iran in 1973 and 1978, which led to the first and second oil price crisis. The 21st century oil production is dominated by countries with political instability. The Mid-dle East, responsible for the lion’s share of oil supply, is shaken by the war in Iraq, and the continuous tensions between Israel and the Arab countries. Violence and permanent strikes in Nigeria have cut back the oil production of the country by a quarter. South America’s largest supplier of oil, Venezuela, is continuously provoking the world with fierce rhetoric towards the United States. Despite soaring oil prices, Russian oil production has levelled off in 2008 due to poor industry regulation. The Russian government retains as much as 92 % of profits from oil production to raise revenues, accounting for 50 % of the Russian budget. But Russia is not the only country to have increased tax assessments and raising the costs of international joint-ventures. Other countries, like Mexico or Venezuela, excluded foreign oil companies by nationalising their oil industries. In addition, national governments have an interest to restrict oil production in order to drive up prices and finally boost public revenues. With not much spare capacity and stocks at usual levels even a temporary loss of production can significantly affect prices in the short term. In addition, a persistent threat from some disputes, e.g. the US-Iran conflict can keep an upward pressure on prices for a longer period. The future market offers some indication for the uncertainty present in oil markets. In general, the forward curve should slope upwards, but the oil market was mainly in backwar-dation in recent years (see Figure 3-13). Thus, holding oil at present was valued higher than holding oil in the future. This can occur because of sudden supply disruption or a remaining uncertainty about the security of oil supplies, where refiners aggressively demand oil to avoid shutting down operations. Another aspect is that crude oil has been and continuous to be used as a strategic instrument of power. Consequently, the political stability of the producing and transit countries is of importance for a risk premium on the oil price. Due to the dependency on oil imports from the post-Soviet states, the pipeline system is of high importance for Western Europe today. The transit through several states bears the risk of supply disruptions and related impacts on short-term price fluctuation. In contrast to the gas market, the market power from ownership

The third oil price surge – what’s different this time? 24
of the pipeline system is, however, limited, since the supply by tanker represents for many import countries an alternative supply option. Necessary investments in maintenance and upgrade of some older pipeline sections built in the 1960s in the former Soviet republics may have a price-raising effect for Russian crude oil in the future. Despite the important role of pipeline imports for Europe, tanker transportation dominates the global trade in oil with two-thirds of oil produced being transported by tanker. Several pas-sages, capes and straits are of importance for the global oil trade. 17 % of global or 65 % of Middle East oil production crosses the Strait of Hormuz, being one of the most important transit or chokepoint for global oil supply (Figure 3-16). In the future, the importance of the Strait of Hormuz and of Malacca will further increase with growing oil exports from the Middle East to China and India. Possible geopolitical tensions and conflicts in the Middle East, as the Iran-Iraq war in the 1980s, may reduce the available transit capacity at choke-points as the Strait of Hormuz or the Suez Canal and yield to an increase in global oil prices. More fundamentally, since the transport capacity through these chokepoints is limited, alter-native transport routes, as around the Cape of Good Hope, implying higher transportation costs and hence prices, may be required in the future. This will be the case either when the capacity limit of existing routes has been reached or to hedge possible disruptions at these major transport lines by diversifying shipping routes.
0 2 4 6 8 10 12 14 16 18
Strait of Hormuz
Strait of Malacca
Suez Canal & SumedPipeline
Bab el-Mandab
Bosporus
Panama Canal
Transit flow [Million barrels/day]
Figure 3-16: Maritime oil transit at major strategic locations in 2003 /Rodrigue, 2004/
On the other side, policy measures directed towards the demand side can diminish the effect of rising prices. Subsidies and price controls in developing countries, addressing poverty and economic necessities, amplify demand artificially. Almost a quarter of the world’s petroleum

The third oil price surge – what’s different this time? 25
products are sold below the market price /HM Treasury, 2008/. Such subsidies hamper an automatic stabilisation that is brought about by changes in consumption as a response to price movements. Concluding, political constraints on the supply and demand side can substantially affect the oil price. On the one hand a risk premium for potential supply disruption can increase the oil price or when production capacities are intentionally restricted for example by tax policy. On the other hand, subsidies on petroleum products increase the oil demand and therewith the crude oil price artificially. Whereas the first two oil crises were triggered by singular geopo-litical events, the situation today is much more diffuse with different potential conflict re-gions, making a quantification of the influence on the oil price very difficult.
3.7 Summary In section 3, we reviewed the aspects having an influence on the oil price in the past and be-ing of high significance for future oil price developments. First, we turned to the demand situation where it seems that high growth of oil demand precedes an oil price crisis, which again leads to lower economic growth. Today, the economy is less depended on oil supply, but further reductions seem difficult as the majority of oil is consumed in the transport sector, where changes are complicated due to the high number of vehicles. Second, concerning the supply side, we showed that as a consequence of the first two oil price crises the oil resources in the North Sea, Alaska and Siberia were developed. Today, the hope is on Arctic resources, deep-sea oil and unconventional oil resources, in particular oil sands. The potential for a fu-ture supply contribution from these resource categories exists requiring, however, steady in-vestments in exploration and development as well as in the development of production tech-nologies. Third, a rapid and consequent investment in exploration and development will be necessary to make up for the decreasing supply of existing oil fields. An investment surge in the upstream sector could be observed in the first half of the 1980s and also during the recent oil price increase. In the downstream sector, high utilisation rates indicate necessary invest-ments into refineries, which have to adapt to changing crude oil qualities and an increasing demand for lighter petroleum products. Forth, we argued that speculators can have a limited and temporary influence especially around turning points and can accelerate oil price increases and falls. Fifth, the weakening of the US-Dollar has also been a somewhat limited influencing factor on the oil price in the past and was responsible for a part of the recent oil price surge. Sixth, geopolitics was responsible for both oil price crises during the 1970s. Today the political landscape is more diffuse with latent geopolitical tensions in the Middle East, Asia and Africa affecting the oil price. During

The third oil price surge – what’s different this time? 26
the last years restrictive political constraints were responsible for a lower supply and in some regions subsidised retail prices kept demand up despite increasing global crude oil prices.
The third oil price surge – what’s different this time? 27
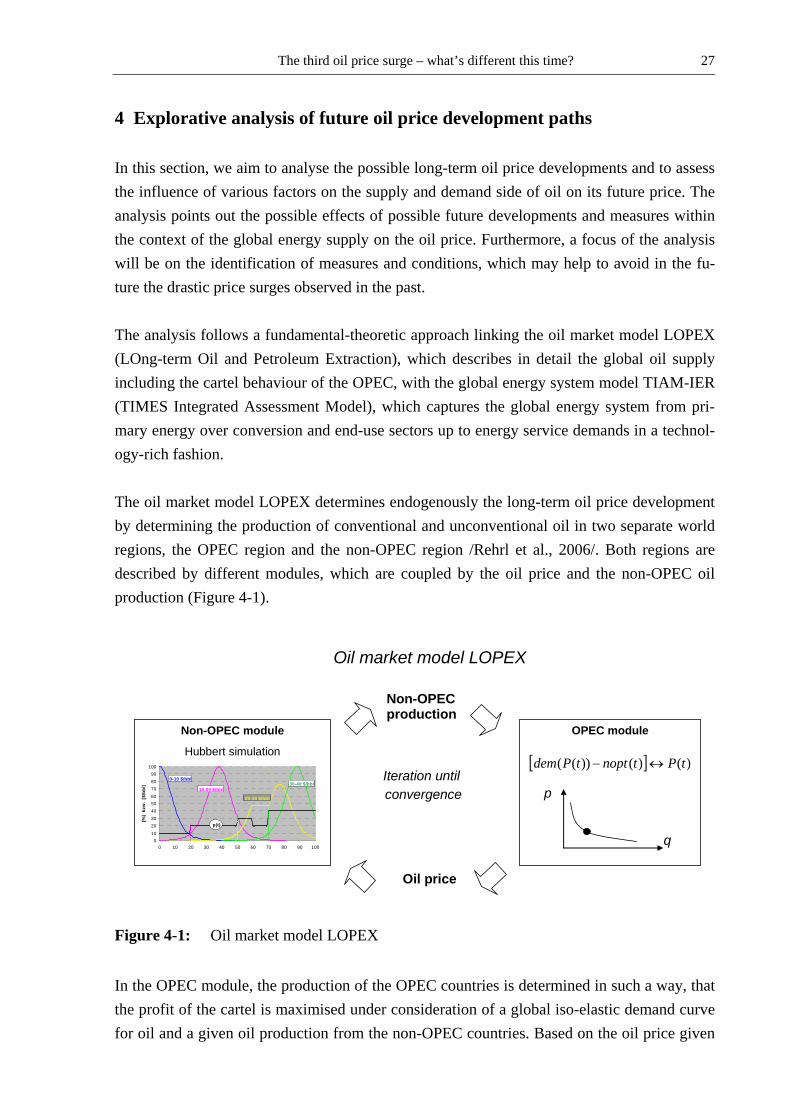
4 Explorative analysis of future oil price development paths In this section, we aim to analyse the possible long-term oil price developments and to assess the influence of various factors on the supply and demand side of oil on its future price. The analysis points out the possible effects of possible future developments and measures within the context of the global energy supply on the oil price. Furthermore, a focus of the analysis will be on the identification of measures and conditions, which may help to avoid in the fu-ture the drastic price surges observed in the past. The analysis follows a fundamental-theoretic approach linking the oil market model LOPEX (LOng-term Oil and Petroleum Extraction), which describes in detail the global oil supply including the cartel behaviour of the OPEC, with the global energy system model TIAM-IER (TIMES Integrated Assessment Model), which captures the global energy system from pri-mary energy over conversion and end-use sectors up to energy service demands in a technol-ogy-rich fashion. The oil market model LOPEX determines endogenously the long-term oil price development by determining the production of conventional and unconventional oil in two separate world regions, the OPEC region and the non-OPEC region /Rehrl et al., 2006/. Both regions are described by different modules, which are coupled by the oil price and the non-OPEC oil production (Figure 4-1).
Oil market model LOPEX
Non-OPECproduction
Iteration untilconvergence
Non-OPEC module
Hubbert simulation
0102030405060708090
100
0 10 20 30 40 50 60 70 80 90 100
[%]
bzw
. [$
/bbl
]
p(t)
10-20 $/bbl
0-10 $/bbl
20-30 $/bbl
30-40 $/bbl
OPEC module
[ ] )()())(( tPtnopttPdem ↔−
q
p
Oil price
Figure 4-1: Oil market model LOPEX
In the OPEC module, the production of the OPEC countries is determined in such a way, that the profit of the cartel is maximised under consideration of a global iso-elastic demand curve for oil and a given oil production from the non-OPEC countries. Based on the oil price given
The third oil price surge – what’s different this time? 28
by the OPEC, the non-OPEC is setting its oil production taking into account the oil reserves and resources in the non-OPEC region, their supply costs as well as temporal restrictions in the availability of oil. To model the latter aspect, the production of different oil categories (distinguished by their production costs) is described by a logistic curve over time. The reason for this production curve is the fact that the oil production of an existing field cannot be expanded above certain production limits without compromising the overall recoverable amount of oil. Therefore, the long-term oil supply is driven by the rate at which new fields are discovered and brought into operation. The discovery process for oil itself is assumed to be driven by two factors: a learning factor, which accelerates the discovery rate the more oil has already been discovered, and a depletion factor, which takes into account that due to the finiteness of oil the quantity of discoverable oil declines with each new discovery. Both fac-tors result in a logistic pathway of oil discoveries over time. Transferring this profile from the discovery process to the oil production, taking into account a certaintime lag between discovery and production for the development of the oil field, results in the so-called Hubbert curve, which can be empirically observed for the oil production of several countries. After having determined the oil production of the non-OPEC region using these Hubbert curves, the OPEC module again maximises its profit taking into account the updated non-OPEC production figure. The iteration of the two modules continues until equilibrium has been reached. The energy system model TIAM-IER is a regionalised bottom-up model depicting the global energy system in a technology rich manner from primary energy supply over the conversion sector and the final energy sectors to energy service demand. The TIAM-IER model is based on the model generator TIMES (The Integrated MARKAL EFOM System, /Loulou et al., 2005/) being maintained by the ETSAP (Energy Technology Systems Analysis Programme) Implementing Agreement of the International Energy Agency and represents a variant of the also within the ETSAP group developed ETSAP-TIAM model /Loulou et al., 2008/. The model covers the time horizon from 2000 to 2100. The analysis presented here in the following focuses, however, on the time span from 2000 to 2050. In the TIAM-IER model the world is divided in the 17 world regions: which are USA, Canada, Mexico, Latin America, EU-27, Balkan, Other Europe, Russia, Central Asia and Caucasus, Remaining For-mer Soviet Union, Africa, the Middle East, India, China, Japan, South Korea, Other Devel-oping Asia and Australia/New Zealand. The primary energy resources and the petroleum processing sector are further divided in OPEC and non-OPEC regions, while in the residential and commercial sector up to 4 different sub-regional areas for capturing different heating and cooling demands are being distinguished. The world regions are linked through the trade in crude oil, hard coal, pipeline gas, LNG (liquefied natural gas), petroleum products (diesel, gasoline, naphtha, heavy fuel oil) and bioethanol. Therefore, the physical trade activities are described by pipelines or tankers taking into account the existing capacities and their techni-

The third oil price surge – what’s different this time? 29
cal and economic characteristics as well as new trade options and their investment costs. On the resource side, the conventional and unconventional oil and gas reserves and resources in the different regions as well as various enhanced recovery methods are included in the model (oil: extra-heavy oil, oil shale, tar sands; natural gas: coal-bed methane, aquifer gas, tight gas). Coal accumulations of hard coal and lignite are distinguished in reserves and resources. In addition, renewable energy sources and their potentials as well as alternative technologies for synthetic fuels (e.g. coal-to-liquid, gas-to-liquid) and different pathways for the hydrogen production are considered in the supply side of the model. In each region, the TIAM-IER model describes the entire energy system by all essential current and future energy technolo-gies from the primary energy supply over the processing, conversion, transport, distribution of energy carriers to the end-use sectors and the useful energy demand. TIAM-IER balances in addition to CO2 also the greenhouse gases N2O and CH4, marginal abatement curves for the process-related emissions of the latter two are implemented, whereas for CO2 capturing at power and synthetic fuel production plants followed by storage in geological formations is being considered. In order to capture the impacts from the supply side and from the demand on the oil price as well as the interactions between demand and supply in a consistent way, the LOPEX and TIAM model have been linked as shown in Figure 4-2. The two models are linked by exchanging information on the global oil price and oil consumption. The TIAM-IER model provides for each time period a reference point consisting of crude oil price and demand. This reference point is used as input to describe the elastic demand curve in the OPEC module of the LOPEX model. After convergence has been reached between OPEC and non-OPEC module in the LOPEX model, the resulting oil price path is transferred as price mark-up for oil as input to the TIAM-IER model. The price mark-up reflects the price increase caused by the OPEC cartel rent as well as the opportunity costs induced by the Hubbert curves in the LOPEX model. With this price mark-up TIAM-IER determines a new demand vector for oil taking into account possible substitution and saving options for crude oil in the global energy system (e.g. switching to biofuels or increased use of more efficient transport vehicles). The iteration between the two models lasts, until convergence is achieved.

The third oil price surge – what’s different this time? 30
Oil market model LOPEX
Global energy system model
TIAM-IERCost and emissions balance
GDP
Process energy
Heating area
Population
Light
Communication
Power
Person kilometers
Freightkilometers
Demand services
Coal processing
Refineries
Power plantsand
Transportation
CHP plantsand district
heat networks
Gas network
Industry
Commercial and tertiary sector
Households
Transportation
Final energyPrimary energy
Domesticsources
Imports
Dem
ands
Ener
gy p
rices
, Res
ourc
eav
aila
bilit
y
Energy flows
Emissions
Capacities
Costs
Prices
Oil priceNon-OPECproduction
Iterating untilconvergence
Reference point (crude oil consumption and price) for demand function
Cartel and Hubbert rent for crude oil, Gas price linked to oil price
Non-OPEC modul
Hubbert simulation
0102030405060708090
100
0 10 20 30 40 50 60 70 80 90 100
[%]
bzw
. [$
/bbl
]
p(t)
10-20 $/bbl
0-10 $/bbl
20-30 $/bbl
30-40 $/bbl
OPEC modul[ ] )()())(( tPtnopttPdem ↔−
q
p
Figure 4-2: Schematic overview of the linkage between the LOPEX and the TIAM-IER model
The resulting oil price obtained from the coupling of the LOPEX and TIAM-IER model should be considered as a long-term price trajectory. Due to the time resolution of 5 year pe-riods in TIAM-IER, short term price fluctuations are not captured with our approach as illus-trated for historic oil prices in Figure 4-3.
Figure 4-3: Oil price development in annual and five year average prices
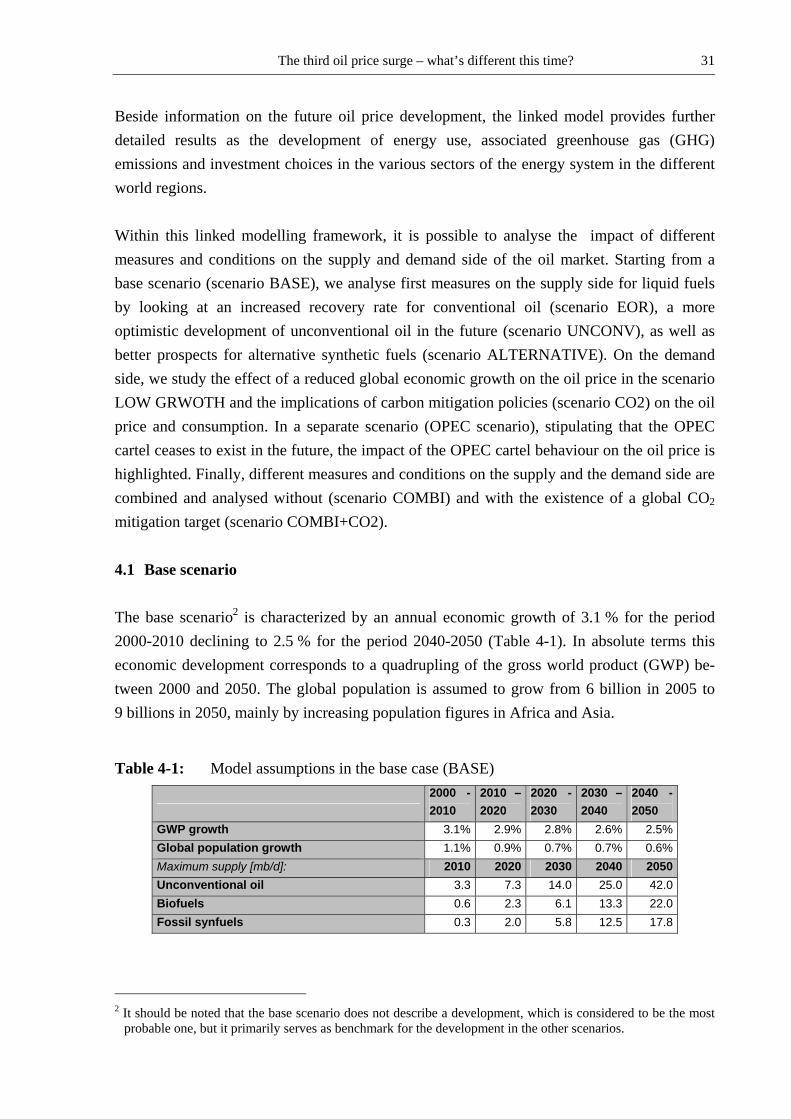
The third oil price surge – what’s different this time? 31
Beside information on the future oil price development, the linked model provides further detailed results as the development of energy use, associated greenhouse gas (GHG) emissions and investment choices in the various sectors of the energy system in the different world regions. Within this linked modelling framework, it is possible to analyse the impact of different measures and conditions on the supply and demand side of the oil market. Starting from a base scenario (scenario BASE), we analyse first measures on the supply side for liquid fuels by looking at an increased recovery rate for conventional oil (scenario EOR), a more optimistic development of unconventional oil in the future (scenario UNCONV), as well as better prospects for alternative synthetic fuels (scenario ALTERNATIVE). On the demand side, we study the effect of a reduced global economic growth on the oil price in the scenario LOW GRWOTH and the implications of carbon mitigation policies (scenario CO2) on the oil price and consumption. In a separate scenario (OPEC scenario), stipulating that the OPEC cartel ceases to exist in the future, the impact of the OPEC cartel behaviour on the oil price is highlighted. Finally, different measures and conditions on the supply and the demand side are combined and analysed without (scenario COMBI) and with the existence of a global CO2 mitigation target (scenario COMBI+CO2). 4.1 Base scenario The base scenario2 is characterized by an annual economic growth of 3.1 % for the period 2000-2010 declining to 2.5 % for the period 2040-2050 (Table 4-1). In absolute terms this economic development corresponds to a quadrupling of the gross world product (GWP) be-tween 2000 and 2050. The global population is assumed to grow from 6 billion in 2005 to 9 billions in 2050, mainly by increasing population figures in Africa and Asia.
Table 4-1: Model assumptions in the base case (BASE)
2000 - 2010
2010 – 2020
2020 - 2030
2030 – 2040
2040 - 2050
GWP growth 3.1% 2.9% 2.8% 2.6% 2.5%Global population growth 1.1% 0.9% 0.7% 0.7% 0.6%Maximum supply [mb/d]: 2010 2020 2030 2040 2050Unconventional oil 3.3 7.3 14.0 25.0 42.0Biofuels 0.6 2.3 6.1 13.3 22.0Fossil synfuels 0.3 2.0 5.8 12.5 17.8
2 It should be noted that the base scenario does not describe a development, which is considered to be the most
probable one, but it primarily serves as benchmark for the development in the other scenarios.

The third oil price surge – what’s different this time? 32
In the analysis, global recoverable oil deposits at the end of 2005 are assumed to be around 4,215 billion bbl consisting of 2,390 billion bbl of conventional oil and 1,825 billion bbl of unconventional oil (Table 4-2). The conventional oil category includes natural gas liquids (NGL) and oil condensates; the unconventional oil category comprises oil sands, extra-heavy oil and shale oil. While the majority of conventional oil is located in Africa, the Former So-viet Union, South America and the Middle East, larger unconventional oil deposits are lo-cated in North and South America with oil shale in the USA, oil sands in Canada and extra-heavy oil in Venezuela. The reserve and resource estimations are based on assessments from the World Energy Council (WEC), US Geological Survey (USGS) and the German Federal Institute for Geosciences and Natural Resources (BGR). Conventional oil resources have been divided into proven and probable reserves, oil from enhanced oil recovery (EOR) and resources. The conventional oil volume of 522 billion bbl listed in Table 4-2 as EOR category describes the quantity that can be additionally extracted, if today’s average recovery rate of 35 % (based on the oil-in-place amount for past production and future production from proved and probable reserves) can be increased by means of enhanced oil recovery mecha-nisms (e.g. injection of hot water or CO2 in the oil field) to 50 % in the future. Depending on the quality of the oil and the characteristics of the source rock, even recovery rates of up to 75 % are technically feasible today.
Table 4-2: Reserve and resource base for conventional and unconventional oil at the end of 2005
Conventional crude oil Unconventional oil reserves and resources
[billion bbl]: Proven and prob-able reserves EOR Resources Oil
Sand Extra-
heavy Oil Shale oil
Total
Base scenario 1,349 522 519 458 257 1,110 4,215
The overall recoverable oil resource base assumed here with 4,200 billion bbl is in the range stated by the BGR in their latest assessment with 4,130 billion bbl (BGR, 2008), but significantly lower than the estimate of 5,400 billion bbl of the IEA given in the World Energy Outlook 2008 (IEA, 2008c). Adding production costs for the different oil categories, one can construct a global oil supply costs curve as shown in Figure 4-4 differentiated by world regions. Assumed production costs for conventional oil (excluding EOR) range from 7 USD2008/bbl in the Middle East to 42 USD2008/bbl in Western Europe, whereas costs for unconventional oil lie between 27 USD/bbl for oil sands in Canada and 115 USD2008/bbl for shale oil in the USA. The esti-mates for the oil production costs are based on an update of a literature review done in 2007 (/Remme et al., 2007/). Due to lack of publically available data on oil production costs for

The third oil price surge – what’s different this time? 33
different geological provinces and the price increase for exploration, development and pro-duction over the last years, the assumed cost assumptions contain a great deal of uncertainty. Comparing the assumptions for production costs with recent studies by the IEA /IEA, 2008c/ and /Rodrigue et al., 2008/, one observes that the production cost estimates for conventional oil (7-42 USD2008/bbl) are partially lower than the ones given by the IEA with 10-80 USD2008/bbl, but higher than the range of 1-27 USD2008/bbl estimated by /Aguilera et al., 2008/. The range for unconventional oil production costs lies with 27-110 USD2008/bbl in the range assumed by the IEA with 40-100 USD2008/bbl. Estimates by /Aguilera et al., 2008/ are, however, with 16-36 USD2008/bbl significantly lower, which is explained by a more optimis-tic assumption regarding shale oil production costs of 36 USD2008/bbl compared to a range of 55-115 USD2008/bbl used here.
0
10
20
30
40
50
60
70
80
90
100
110
120
0 500 1000 1500 2000 2500 3000 3500 4000 4500Oil quantitiy [billion bbl]
Supp
ly c
ost c
urve
cru
de o
il [$
2008
/bbl
]
USA
Ukraine, Belarus, Moldova
Central Asia and Caucasia
Russia
Other Europe
Other Asia
Mexico
Middle East
Japan
India
EU-27
South America
China
Canada
Balkan
Australia
Africa
Figure 4-4: Global supply cost curve for crude oil
Various alternative technology options to provide liquid fuels are available in the energy system model TIAM-IER to substitute petroleum fuels. Alternative options based on coal, natural gas or biomass are the production of diesel, kerosene and methanol using the Fischer-Tropsch process. In addition, ethanol as gasoline alternative can be produced from corn or sugar cane as well as from lingo-cellulosic biomass using so-called 2nd generation production technologies. The maximum growth of fossil synthetic fuels and biofuels is restricted in the base scenario by absolute production bounds based on various editions of the World Energy Outlook from the IEA and studies from Cambridge Energy Research Associates and the U.S.

The third oil price surge – what’s different this time? 34
Energy Information Administration. Similarly, the future penetration of unconventional oil sands (including extra-heavy oil) and shale oil are limited by upper production bounds (Table 4-1). Motivation for bounding the alternative fuel production as well as the use of unconventional oil is the fact that the investment decisions for these options in the energy system model TIAM-IER are based on cost criteria, which means that an option as coal-to-liquid becomes economically viable at oil prices of 70-80 USD/bbl. Although these price levels have been observed in the past, only very few capital-intensive coal-to-liquid plants were built, which can be explained by additional factors others than costs as uncertainty about future oil price levels or climate policy measures. To capture the effect of these addi-tional non-cost factors in the energy system model, the additional upper production bounds given in Table 4-1 have been added in TIAM-IER. Furthermore, it has been assumed in the base scenario that no explicit greenhouse gas mitigation policies are being pursued.
The assumptions for the base scenario result in a price path that rises from the historical average of 55 USD2008/bbl for the period 2003-2007 to 153 USD2008/bbl in 2030 and then de-clines to 89 USD2008/bbl in 2050 (Figure 4-5).
0
20
40
60
80
100
120
140
160
1970 1980 1990 2000 2010 2020 2030 2040 2050
Oil
Pric
e [$
2008
/bbl
]
HISTORIC
BASE
0102030405060708090
100110120130140150
2000
2005
2010
2015
2020
2025
2030
2035
2040
2045
2050
Prod
uctio
n liq
uid
ener
gy c
arrie
rs
[Mill
. bbl
/d]
BiofuelsFossil synfuelsUnconventionalNon-OPEC Oil conventionalOPEC Oil conventional
Figure 4-5: Oil price (5-year average) and liquid fuel production in the BASE scenario
The oil price peak of 153 USD/bbl in 2030 is caused by a decreasing conventional oil produc-tion in non-OPEC countries, which cannot be fully absorbed by a higher unconventional production. This leads to a higher market share of the OPEC in 2030 and thus a higher market power of the OPEC cartel (Figure 4-6), resulting in higher oil prices. After 2030, unconventional oil production in countries outside OPEC contributes to a reduction of OPEC’s market share and thus an easing of the oil price.
The overall global liquid fuel supply, which includes conventional and unconventional oil as well as fossil synfuels and biofuels, increases by 75 % from 83 mb/d in 2005 to 139 mb/d in

The third oil price surge – what’s different this time? 35
2050 (Figure 4-5, right hand diagram). The growth in liquid fuel consumption is entirely covered by unconventional oil and synthetic fuels. These non-conventional options provide in 2050 more than 40 % of global liquid fuel supply. The level of conventional oil production is stagnating over the model horizon with a continuous decline of the conventional non-OPEC production from 48 mb/d in 2005 over 38 mb/d in 2030 to 28 mb/d in 2050. This decrease is compensated by an increase of OPEC production from 33 mb/d in 2005 to 51 mb/d.
0
25
50
75
100
125
150
2000 2010 2020 2030 2040 2050
Liqu
id p
rodu
ctio
n [M
ill. b
bl/d
]
0
5
10
15
20
25
30
35
40
45
50
OPE
C m
arke
t sha
re [%
]
Conventional OPEC Unconventional OPEC Conventional Non-OPECUnconventional Non-OPEC Alternative fuels OPEC share
Figure 4-6: Crude oil production (conventional and unconventional combined) and OPEC market share for the BASE scenario
4.2 Better use of conventional oil reserves In the base scenario, it is assumed that the ultimate recovery factor of oil in-place reserves is 50 % compared to a current average oil recovery rate around 35 % /IEA, 2005/. This means that current or already abandoned oil fields represent an additional resource in the way that more oil can be extracted than initially expected. A recovery rate of 50 % is currently achieved for example for Norwegian oil fields in the North Sea. In the early 1980s many en-hanced oil recovery techniques were developed, but abandoned during the subsequent period of low oil prices. These techniques inject steam or hot water (thermal recovery), solvents as methane or CO2 (miscible recovery) or chemical substances as polymers (chemical recovery) into the oil field to increase the recovery rate up to 75 % /Lake et al., 1992/. For the purpose of highlighting the consequences of a higher recovery rate for existing and future new oil

The third oil price surge – what’s different this time? 36
fields, we assume for the EOR scenario a recovery factor of 60 % instead of 50 %, thus increasing the global resource base in Table 4-2 by about 5 % or 218 billion barrel
0
20
40
60
80
100
120
140
160
1970 1980 1990 2000 2010 2020 2030 2040 2050
Oil
Pric
e [$
2008
/bbl
]HISTORICBASEEOR
Figure 4-7: Oil price development (5-year average) in the scenario EOR
In the EOR scenario, oil prices are constantly lower than in the base case. In 2030, oil prices are with 116 USD/bbl about 35 USD/bbl lower than in the BASE scenario due to higher oil supply of 5 mb/d stemming mainly from increased EOR activities in countries outside the OPEC cartel. Overall oil production from EOR is around 15 mb/d in 2030 in the EOR scenario and increases to 20 mb/d by 2050. 4.3 Development of unconventional oil production To study the impact of an accelerated development and market penetration of unconventional crude oil, the maximum possible production bounds for shale oil, oil sands and extra-heavy oil combined (scenario UNCONV) have been increased compared to the upper limits in the base scenario. Today oil sand production is 1.2 mb/d, mainly in Canada /IEA, 2008c/, and shale oil produc-tion is 10,000 bbl/d, mainly in Brazil and Estonia /Brendow, 2003/. For the UNCONV scenarios, production profiles for shale oil are calibrated according to a study of the U.S. Department of Energy /U.S. DoE, 2004/ (see Table 4-3), which is judged optimistic on the development of oil production. The modified maximum production profile for oil sands and extra-heavy oil is obtained by moving the corresponding bounds of the base scenario after 2020 by a decade in the direction of today, i.e. the upper bound in 2030 of the BASE scenario
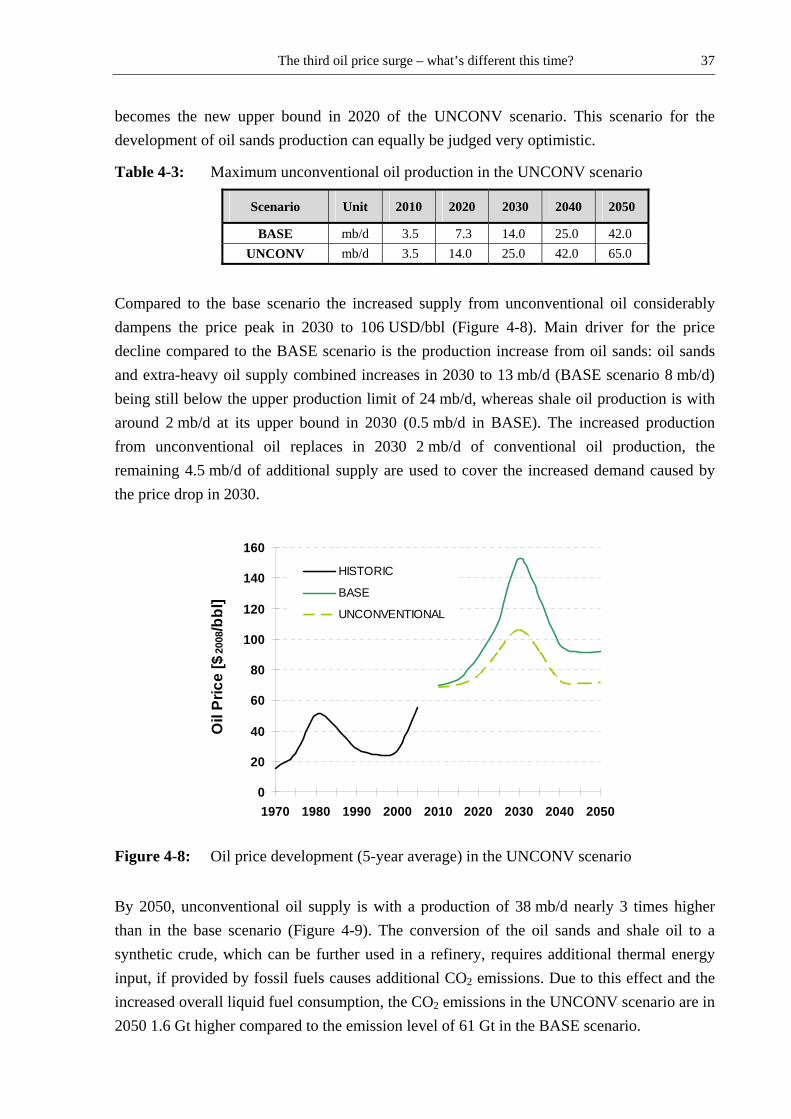
The third oil price surge – what’s different this time? 37
becomes the new upper bound in 2020 of the UNCONV scenario. This scenario for the development of oil sands production can equally be judged very optimistic.
Table 4-3: Maximum unconventional oil production in the UNCONV scenario
Scenario Unit 2010 2020 2030 2040 2050
BASE mb/d 3.5 7.3 14.0 25.0 42.0 UNCONV mb/d 3.5 14.0 25.0 42.0 65.0
Compared to the base scenario the increased supply from unconventional oil considerably dampens the price peak in 2030 to 106 USD/bbl (Figure 4-8). Main driver for the price decline compared to the BASE scenario is the production increase from oil sands: oil sands and extra-heavy oil supply combined increases in 2030 to 13 mb/d (BASE scenario 8 mb/d) being still below the upper production limit of 24 mb/d, whereas shale oil production is with around 2 mb/d at its upper bound in 2030 (0.5 mb/d in BASE). The increased production from unconventional oil replaces in 2030 2 mb/d of conventional oil production, the remaining 4.5 mb/d of additional supply are used to cover the increased demand caused by the price drop in 2030.
0
20
40
60
80
100
120
140
160
1970 1980 1990 2000 2010 2020 2030 2040 2050
Oil
Pric
e [$
2008
/bbl
]
HISTORIC
BASE
UNCONVENTIONAL
Figure 4-8: Oil price development (5-year average) in the UNCONV scenario
By 2050, unconventional oil supply is with a production of 38 mb/d nearly 3 times higher than in the base scenario (Figure 4-9). The conversion of the oil sands and shale oil to a synthetic crude, which can be further used in a refinery, requires additional thermal energy input, if provided by fossil fuels causes additional CO2 emissions. Due to this effect and the increased overall liquid fuel consumption, the CO2 emissions in the UNCONV scenario are in 2050 1.6 Gt higher compared to the emission level of 61 Gt in the BASE scenario.

The third oil price surge – what’s different this time? 38
0
25
50
75
100
125
150
BA
SE
UN
CO
NV
BA
SE
UN
CO
NV
BA
SE
UN
CO
NV
BA
SE
UN
CO
NV
BA
SE
UN
CO
NV
2005 2010 2020 2030 2040 2050
Liqu
id p
rodu
ctio
n [M
ill. b
bl/d
] BiofuelsFossil synfuelsUnconventional oilNon-OPEC Oil conventionalOPEC Oil conventional
Figure 4-9: Liquid fuel production profiles in the BASE and UNCONV scenarios
4.4 Alternative liquid fuel production Alternative liquid fuels based on biomass or fossil fuels are an option to reduce the demand for crude oil in the future. Possible biofuels are biodiesel from oil seeds, ethanol from starchy biomass or in the future possibly from ligno-cellulosic biomass as well as synthetic diesel or kerosene being produced via indirect liquefaction from biomass. Biofuel production in 2007, comprising bioethanol and biodiesel, provided 0.5 mb/d of liquid fuel, mainly from Brazil and the United States /IEA, 2008d/. A possible obstacle for an increased use of biofuels is the competition with land resources designated for food production and for the forest based in-dustries. Fossil synfuels from coal or natural gas are already being produced today using an indirect liquefaction process (Fischer-Tropsch process). Large-scale synthetic fuel production plants from natural gas-to-liquid (GTL) or coal-to-liquid (CTL) exist today in South Africa, the Middle East and Asia (Figure 4-10). The installed capacity covers with 198,300 bbl/d in 2007, however, only 0.2 % of global oil demand. As for unconventional oil and bioethanol, the high initial investment capital for a synfuel plant requires a minimum oil price level to operate the plant economically (50-80 USD/bbl for coal-to-liquid plants).
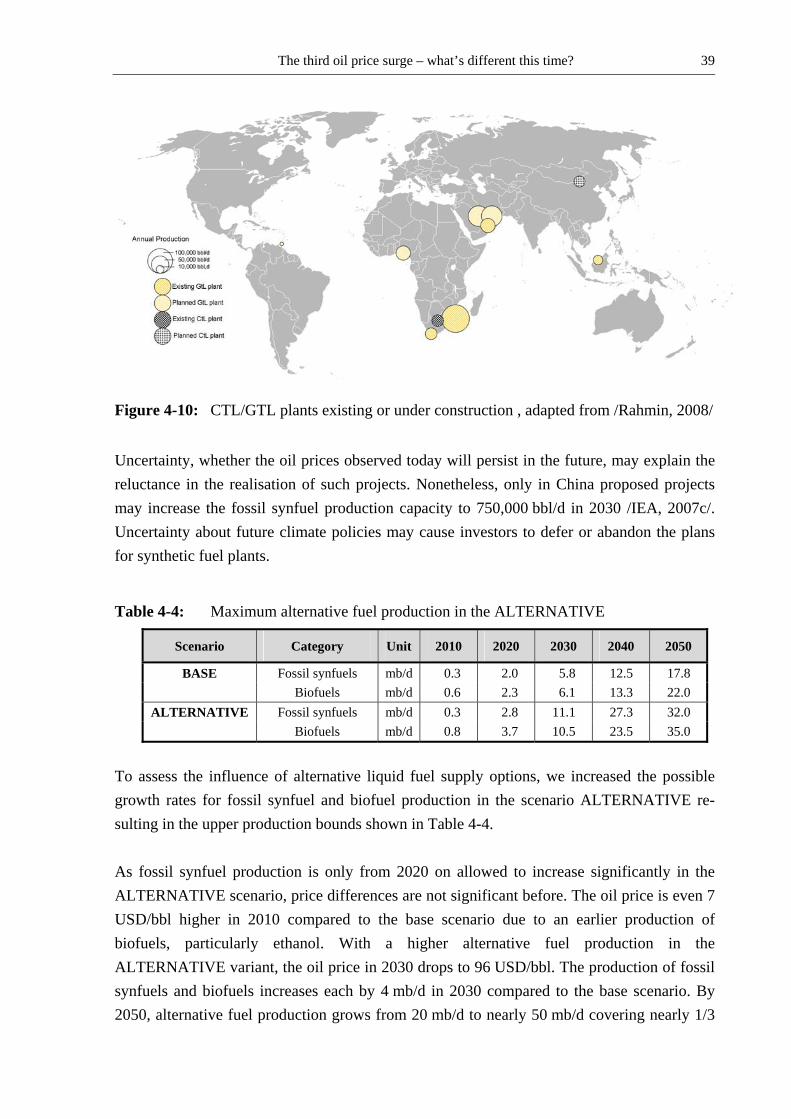
The third oil price surge – what’s different this time? 39
Figure 4-10: CTL/GTL plants existing or under construction , adapted from /Rahmin, 2008/
Uncertainty, whether the oil prices observed today will persist in the future, may explain the reluctance in the realisation of such projects. Nonetheless, only in China proposed projects may increase the fossil synfuel production capacity to 750,000 bbl/d in 2030 /IEA, 2007c/. Uncertainty about future climate policies may cause investors to defer or abandon the plans for synthetic fuel plants.
Table 4-4: Maximum alternative fuel production in the ALTERNATIVE
Scenario Category Unit 2010 2020 2030 2040 2050
BASE Fossil synfuels mb/d 0.3 2.0 5.8 12.5 17.8 Biofuels mb/d 0.6 2.3 6.1 13.3 22.0
ALTERNATIVE Fossil synfuels mb/d 0.3 2.8 11.1 27.3 32.0 Biofuels mb/d 0.8 3.7 10.5 23.5 35.0
To assess the influence of alternative liquid fuel supply options, we increased the possible growth rates for fossil synfuel and biofuel production in the scenario ALTERNATIVE re-sulting in the upper production bounds shown in Table 4-4. As fossil synfuel production is only from 2020 on allowed to increase significantly in the ALTERNATIVE scenario, price differences are not significant before. The oil price is even 7 USD/bbl higher in 2010 compared to the base scenario due to an earlier production of biofuels, particularly ethanol. With a higher alternative fuel production in the ALTERNATIVE variant, the oil price in 2030 drops to 96 USD/bbl. The production of fossil synfuels and biofuels increases each by 4 mb/d in 2030 compared to the base scenario. By 2050, alternative fuel production grows from 20 mb/d to nearly 50 mb/d covering nearly 1/3

The third oil price surge – what’s different this time? 40
of global liquid consumption. This increase in large parts results from the use of coal in synthetic fuel production, so that global CO2 emissions in 2050 are 4 Gt higher than in the base scenario.
0
20
40
60
80
100
120
140
160
1970 1980 1990 2000 2010 2020 2030 2040 2050
Oil
Pric
e [$
2008
/bbl
]
HISTORICBASEALTERNATIVE
Figure 4-11: Oil price development in the ALTERNATIVE scenario (5-year average)
As in the unconventional scenario variants, the additional supply for liquid fuel does not re-sult in a significant reduced production of conventional oil (only decline of 3 mb/d in 2030), but yields a new equilibrium of supply and demand with a lower oil price and a higher overall liquid fuel demand. Global liquid fuel consumption in the ALTERNATIVE scenario is 5 mb/d and 10 mb/d higher in 2030 and 2050, respectively, compared to the BASE case. 4.5 Economic growth In the low economic growth scenario, we assume a world with a more pessimistic economic development with an annual gross world product (GWP) growth of 2.7 % in the first decade of the 21st century, diminishing to 2.2 % in the period from 2040 to 2050 (Table 4-5). Over-all, this leads to an average annual GWP growth rate between 2000 and 2050 of 2.3 % com-pared to 2.7 % in the base scenario. The LOW GROWTH scenario permits to bring the development of the oil price in the context of a world with a lower demand for energy com-pared to the base scenario.

The third oil price surge – what’s different this time? 41
Table 4-5: Annual gross world product (GWP) growth rates
GWP growth 2000 - 2010
2010 - 2020
2020 - 2030
2030 - 2040
2040 - 2050
2000 - 2050
BASE 3.1 % 2.9 % 2.8 % 2.6 % 2.5 % 2.7 %
LOW GROWTH 2.7 % 2.4 % 2.4 % 2.3 % 2.2 % 2.3 %
The effect of lower economic growth is immediately visible in a lower oil demand. In 2020 oil consumption is 1.7 mb/d lower than in the base case and 3.8 and 5.0 mb/d in 2030 and 2050 respectively. Lower economic growth and therefore lower demand is mirrored in lower oil prices. Crude oil prices in the LOW GROWTH scenario tend to be 20-30 USD/bbl lower than in the base case. One exception is the model period 2030, where due to a lower demand OPEC is deprived of most of its market power, resulting in an oil price of around 90 USD/bbl instead of ca. 150 USD/bbl in the base scenario.
0
20
40
60
80
100
120
140
160
1970 1980 1990 2000 2010 2020 2030 2040 2050
Oil
Pric
e [$
2008
/bbl
]
HISTORICBASELOW GROWTH
Figure 4-12: Oil price development in the LOW GROWTH scenario (5-year average)
4.6 Climate policy In the base case and the scenarios discussed before no explicit policy measures to mitigate greenhouse gases were assumed. To respect climate policy measures, in the light of the EU Emission Trading System and possible future post-Kyoto architectures, we integrated a global CO2 price into a climate policy scenario called CO2. In this scenario, a CO2 price of 25 USD/t CO2 was implemented in 2015, increasing to 200 USD/t in 2030 and staying con-stant afterwards. The given CO2 price in the different years represents an incentive to miti-

The third oil price surge – what’s different this time? 42
gate CO2 by measures having mitigation costs up to the given CO2 price. The CO2 price pro-file results in a global reduction of CO2 emissions from 61 Gt in the BASE scenario to 18 Gt in the CO2 scenario in 2050. This mitigation effort corresponds to a 27 % reduction of CO2 emissions in 2050 compared to emission levels in 2000 (Figure 4-13).
0
10
20
30
40
50
60
70
2000
2005
BA
SE
CO
2
BA
SE
CO
2
BA
SE
CO
2
BA
SE
CO
2
BA
SE
CO
2
Statistics 2010 2020 2030 2040 2050
CO
2 em
issi
ons
by s
ecto
r [G
t CO
2]
CO2 captured
Residential,Commerical, Agriculture
Industry
Transport
Conversion, Upstream
Figure 4-13: Global CO2 emissions by sector in the BASE and the CO2 scenario
The introduced CO2 price penalises the burning of fossil fuels, if CO2 is emitted to the at-mosphere. CO2 from the use of fossil fuels can also be captured and then stored in geological formations, e.g. in aquifers or depleted oil and gas fields, or used for example to increase the recovery of oil fields. It is assumed here, that carbon capture and storage (CCS) is available after 2015 for power plants and fossil synthetic fuel production from coal and natural gas. Due to its carbon content the consumption of conventional oil decreases in the CO2 scenario to 39 mb/d in 2050 compared to 79 mb/d in the BASE case. Since the conversion of shale oil and oil sands requires thermal energy, assumed to be provided from fossil sources, also the production of unconventional oil nearly vanishes by 2050 in the CO2 scenario. For similar reasons, the fossil synthetic fuel production declines by more than 50 % in the CO2 scenario compared to the BASE scenario. From the non-conventional liquid fuel options, bioethanol production is the only one which benefits from the carbon penalty in the CO2 scenario and increases to 26 mb/d in 2050 (16 mb/d in the BASE case). Due to fuel switching and energy efficiency measures total liquid fuel demand falls to 88 mb/d in 2050, which corresponds to a reduction of more than one third relative to the base scenario.

The third oil price surge – what’s different this time? 43
Overall, the lower demand for fossil-based liquid fuels results in a lower oil price trajectory in the CO2 variant compared to the base scenario (Figure 4-14). In 2030, the oil price of around 90 USD/bbl is approximately 60 USD/bbl lower than in the BASE scenario. Nevertheless, the consumption of oil in the CO2 scenario is more expensive than in the BASE case, since the petroleum related CO2 emissions are penalised by the given CO2 price. The constant CO2 price of 200 USD/t CO2 after 2030 converts for crude oil to a price increase of 80 USD/bbl, which is higher than the maximum price difference to the base scenario of 60 USD/bbl.
0
20
40
60
80
100
120
140
160
1970 1980 1990 2000 2010 2020 2030 2040 2050
Oil
Pric
e [$
2008
/bbl
]
HISTORICBASECO2
Figure 4-14: Oil price in the CO2 scenario (5-year average)
4.7 Break-up of the OPEC The scenarios presented so far are based on the premise that the Organization of the Petroleum Exporting Countries (OPEC) is continuing to influence the oil prices. Founded in 1960 in Bagdad, OPEC’s power comes mainly from its huge proven oil reserves and its export volume. In addition, the gulf states of the OPEC have the lowest production costs of oil of under 10 USD/bbl compared to about 15 USD/bbl for North Sea oil /EIA, 2006/. Although in previous decades OPEC has been very important in influencing oil prices, for example, during the oil embargo in 1973, when its members accounted for 53 % of global production, this market power is now much reduced. OPEC now has limited spare capacity, with only Saudi Arabia retaining a significant margin of spare capacity and most of that is unsuited to the current composition of the refinery sector. Historically, OPEC members have
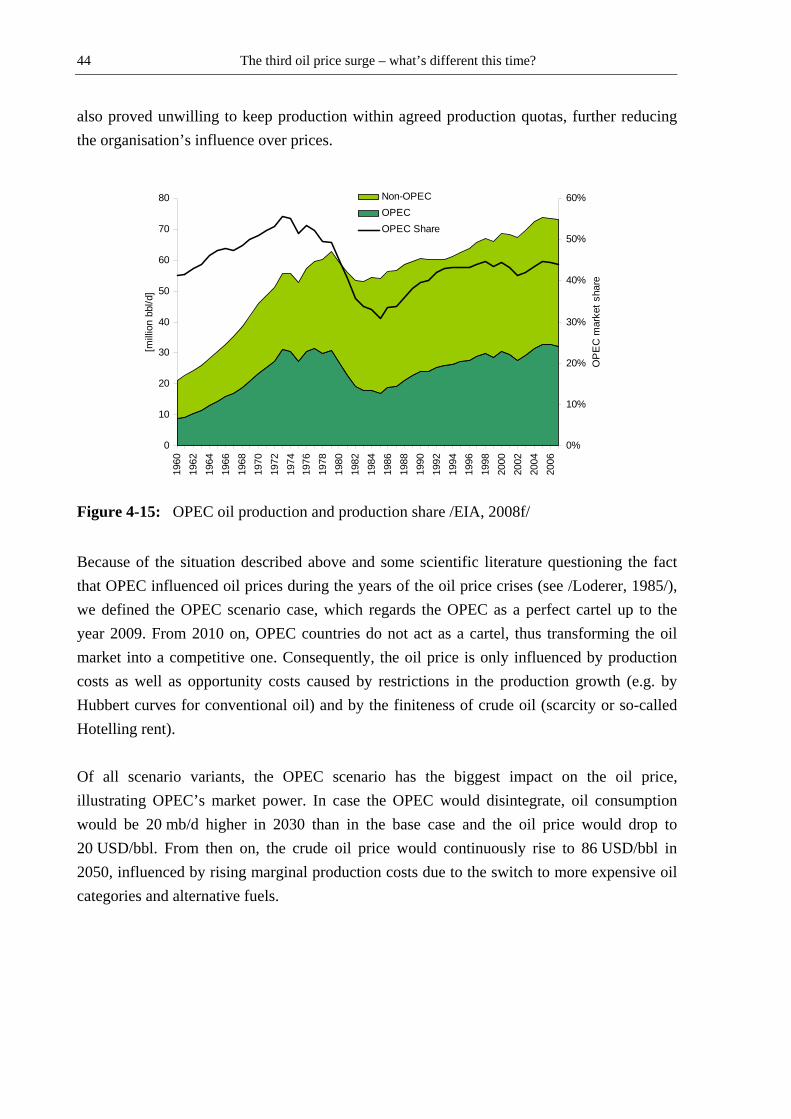
The third oil price surge – what’s different this time? 44
also proved unwilling to keep production within agreed production quotas, further reducing the organisation’s influence over prices.
0
10
20
30
40
50
60
70
80
1960
1962
1964
1966
1968
1970
1972
1974
1976
1978
1980
1982
1984
1986
1988
1990
1992
1994
1996
1998
2000
2002
2004
2006
[mill
ion
bbl/d
]
0%
10%
20%
30%
40%
50%
60%
OP
EC
mar
ket s
hare
Non-OPECOPECOPEC Share
Figure 4-15: OPEC oil production and production share /EIA, 2008f/
Because of the situation described above and some scientific literature questioning the fact that OPEC influenced oil prices during the years of the oil price crises (see /Loderer, 1985/), we defined the OPEC scenario case, which regards the OPEC as a perfect cartel up to the year 2009. From 2010 on, OPEC countries do not act as a cartel, thus transforming the oil market into a competitive one. Consequently, the oil price is only influenced by production costs as well as opportunity costs caused by restrictions in the production growth (e.g. by Hubbert curves for conventional oil) and by the finiteness of crude oil (scarcity or so-called Hotelling rent). Of all scenario variants, the OPEC scenario has the biggest impact on the oil price, illustrating OPEC’s market power. In case the OPEC would disintegrate, oil consumption would be 20 mb/d higher in 2030 than in the base case and the oil price would drop to 20 USD/bbl. From then on, the crude oil price would continuously rise to 86 USD/bbl in 2050, influenced by rising marginal production costs due to the switch to more expensive oil categories and alternative fuels.
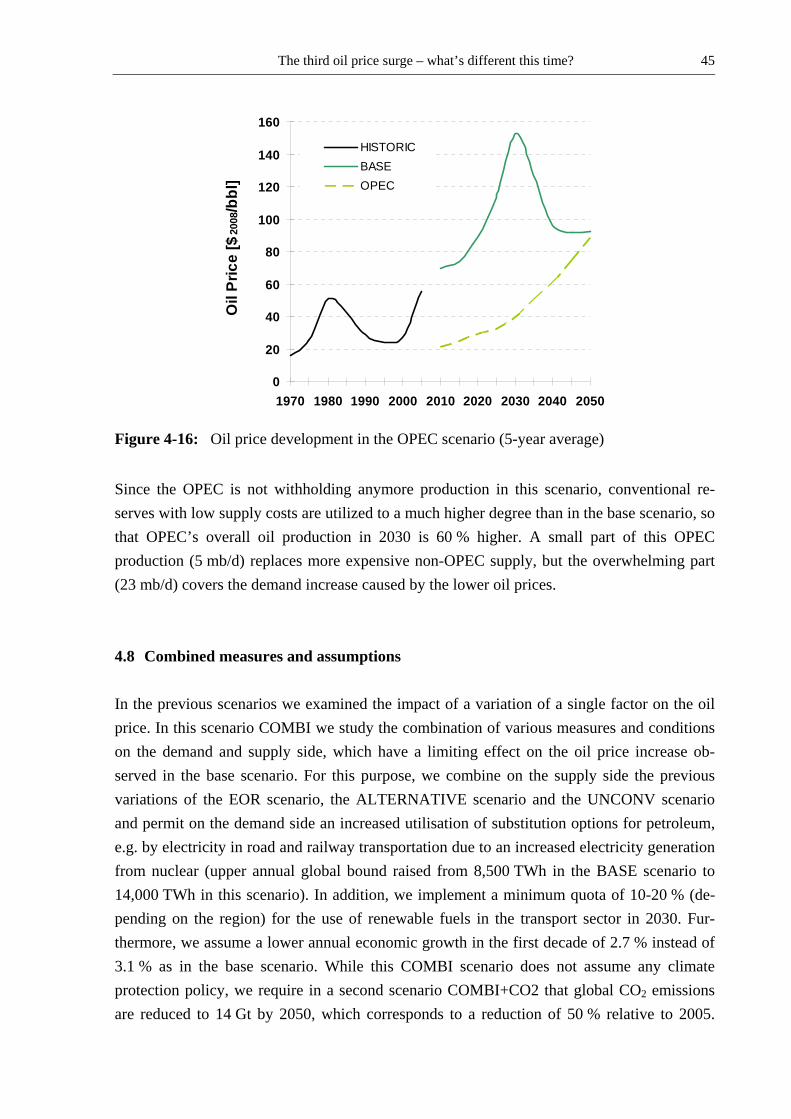
The third oil price surge – what’s different this time? 45
0
20
40
60
80
100
120
140
160
1970 1980 1990 2000 2010 2020 2030 2040 2050
Oil
Pric
e [$
2008
/bbl
]
HISTORICBASEOPEC
Figure 4-16: Oil price development in the OPEC scenario (5-year average)
Since the OPEC is not withholding anymore production in this scenario, conventional re-serves with low supply costs are utilized to a much higher degree than in the base scenario, so that OPEC’s overall oil production in 2030 is 60 % higher. A small part of this OPEC production (5 mb/d) replaces more expensive non-OPEC supply, but the overwhelming part (23 mb/d) covers the demand increase caused by the lower oil prices. 4.8 Combined measures and assumptions In the previous scenarios we examined the impact of a variation of a single factor on the oil price. In this scenario COMBI we study the combination of various measures and conditions on the demand and supply side, which have a limiting effect on the oil price increase ob-served in the base scenario. For this purpose, we combine on the supply side the previous variations of the EOR scenario, the ALTERNATIVE scenario and the UNCONV scenario and permit on the demand side an increased utilisation of substitution options for petroleum, e.g. by electricity in road and railway transportation due to an increased electricity generation from nuclear (upper annual global bound raised from 8,500 TWh in the BASE scenario to 14,000 TWh in this scenario). In addition, we implement a minimum quota of 10-20 % (de-pending on the region) for the use of renewable fuels in the transport sector in 2030. Fur-thermore, we assume a lower annual economic growth in the first decade of 2.7 % instead of 3.1 % as in the base scenario. While this COMBI scenario does not assume any climate protection policy, we require in a second scenario COMBI+CO2 that global CO2 emissions are reduced to 14 Gt by 2050, which corresponds to a reduction of 50 % relative to 2005.
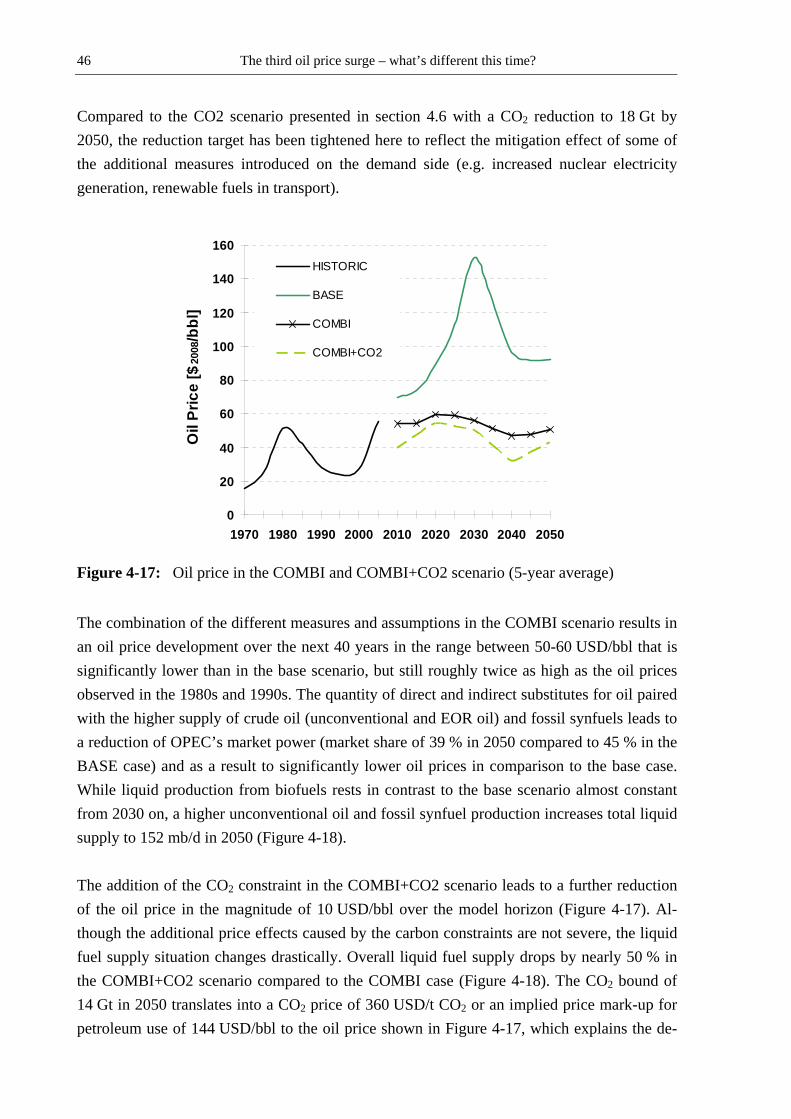
The third oil price surge – what’s different this time? 46
Compared to the CO2 scenario presented in section 4.6 with a CO2 reduction to 18 Gt by 2050, the reduction target has been tightened here to reflect the mitigation effect of some of the additional measures introduced on the demand side (e.g. increased nuclear electricity generation, renewable fuels in transport).
0
20
40
60
80
100
120
140
160
1970 1980 1990 2000 2010 2020 2030 2040 2050
Oil
Pric
e [$
2008
/bbl
]
HISTORIC
BASE
COMBI
COMBI+CO2
Figure 4-17: Oil price in the COMBI and COMBI+CO2 scenario (5-year average)
The combination of the different measures and assumptions in the COMBI scenario results in an oil price development over the next 40 years in the range between 50-60 USD/bbl that is significantly lower than in the base scenario, but still roughly twice as high as the oil prices observed in the 1980s and 1990s. The quantity of direct and indirect substitutes for oil paired with the higher supply of crude oil (unconventional and EOR oil) and fossil synfuels leads to a reduction of OPEC’s market power (market share of 39 % in 2050 compared to 45 % in the BASE case) and as a result to significantly lower oil prices in comparison to the base case. While liquid production from biofuels rests in contrast to the base scenario almost constant from 2030 on, a higher unconventional oil and fossil synfuel production increases total liquid supply to 152 mb/d in 2050 (Figure 4-18). The addition of the CO2 constraint in the COMBI+CO2 scenario leads to a further reduction of the oil price in the magnitude of 10 USD/bbl over the model horizon (Figure 4-17). Al-though the additional price effects caused by the carbon constraints are not severe, the liquid fuel supply situation changes drastically. Overall liquid fuel supply drops by nearly 50 % in the COMBI+CO2 scenario compared to the COMBI case (Figure 4-18). The CO2 bound of 14 Gt in 2050 translates into a CO2 price of 360 USD/t CO2 or an implied price mark-up for petroleum use of 144 USD/bbl to the oil price shown in Figure 4-17, which explains the de-

The third oil price surge – what’s different this time? 47
mand decrease for liquid fuels based on fossil fuels by fuel switching and efficiency or saving measures in the consumption sectors. The contribution of biofuels to the total liquid fuel supply increases in absolute and relative terms compared to the BASE and the COMBI sce-nario. Nearly one third of total liquid fuel supply in 2050 is based on biofuels.
0
20
40
60
80
100
120
140
160
BA
SE
CO
MB
I
CO
MB
I+C
O2
BA
SE
CO
MB
I
CO
MB
I+C
O2
BA
SE
CO
MB
I
CO
MB
I+C
O2
BA
SE
CO
MB
I
CO
MB
I+C
O2
BA
SE
CO
MB
I
CO
MB
I+C
O2
2005 2010 2020 2030 2040 2050
Liqu
id s
uppl
y [M
ill. b
bl/d
]
BiofuelsFossil synfuelsUnconventional oilNon-OPEC Oil conventionalOPEC Oil conventional
Figure 4-18: Liquid fuel production profiles in the BASE, COMBI and COMBI+CO2 scenario
This effect combined with the demand decline reduces the market share of OPEC under 30 % by 2050 (compared to 36 % and 33 % in the BASE and COMBI scenario, respectively), so that OPEC’s role and market power to influence oil prices is further weakened. 4.9 Summary of scenario analysis In this section, we analysed measures and conditions on the supply and demand side of oil, which may in the future have a price-decreasing effect on the oil price. The analysis was car-ried out by linking the oil market model LOPEX, which captures the oil production and the cartel situation on the oil market in detail, with the global energy system model TIAM-IER, which covers in a technology rich manner the energy system from primary energy to useful energy demand by world region. The linkage of the two models allows to quantify the impact of developments on the supply and demand side of oil on the long-term oil price formation in a consistent way
The third oil price surge – what’s different this time? 48
Starting from a base scenario, measures increasing the supply of liquid fuels have been studied in scenarios assuming a better recovery rate for conventional oil (scenario EOR), an accelerated production from unconventional oil (scenario UNCONV) and a more optimistic assumption regarding the role of alternative liquid fuels (scenario ALTERNATIVE). Com-pared to the base scenario, where the oil price peaks around 150 USD/bbl in 2030, the supply-side measures drive-down the maximum oil price in 2030 to a range between 100 USD/bbl (scenario ALTERNATIVE) and 115 USD/bbl (scenario EOR). Since the sup-ply-side scenarios have been defined in a way that the overall liquid supply is in the same range in all scenarios, the price difference mainly reflects the different supply costs with the exception of the EOR scenario. Due to low supply costs of EOR categories in the Middle East, one might expect a lower oil price in this scenario. The possible additional supply from these low cost categories is, however, on the one hand withhold by the OPEC to maintain a higher oil price level and on the other hand limited for Non-OPEC countries in its temporal availability, which is depicted by Hubbert curves in the modelling framework. The price drop in the supply-side scenarios is accompanied by a demand increase for liquid fuel demand, which is in all three scenarios with around 110 mb/d in 2030 and 150 mb/d in 2050 by 5 mb/d and 10 mb/d, respectively, higher than in the base scenario. On the demand side the price impacts of reduced global economic growth and CO2 mitigation policies have been studied. The LOW GROWTH scenario, which reduces the total liquid fuel demand in 2030 by 4 mb/d and in 2050 by 10 mb/d, yields a price of about 90 USD/bbl in 2030. The CO2 mitigation scenario, which assumes the introduction of a CO2 price of 200 USD/t by 2030, results, with a price of 95 USD/bbl in 2030, in similar price reductions. However, if one keeps in mind, that the implemented CO2 price of 200 USD/t represents ad-ditional costs of 80 USD for one barrel of crude oil, the oil prices for the consumers are still higher in the climate protection scenario than in the base case. This CO2 penalty for burning fossil fuels also results in a reduction of liquid fuel demand by nearly 50 % by 2050. To illustrate the price impact of the OPEC cartel, we assumed in the OPEC scenario that the OPEC will break-up after 2010. Since oil prices are then driven only by production costs and opportunity costs from production constraints and from the scarcity of oil, the maximum oil price difference to the base scenario of 110 USD/bbl in 2030 is an indicator for the price impact, which the OPEC can have on the oil price, when alternative options or substitutes to conventional oil are not developed timely enough. Finally, different measures and conditions on the supply and demand, which have the poten-tial to dampen an oil price increase, have been combined and analysed in a scenario with and without a CO2 mitigation constraint. In the variant COMBI without CO2 constraint, the oil price ranges between 50 and 60 USD/bbl. The additional CO2 constraint limiting global CO2
The third oil price surge – what’s different this time? 49
emissions in 2050 to 50 % of the level in 2005 leads to an additional price reduction around just 10 USD/bbl compared to the variant without CO2 constraint. The liquid fuel production changes, however, drastically, with an overall reduction of liquid fuel demand by nearly 50 % and a switch to biofuels on the expense of conventional and unconventional oil as well as fossil synfuels. The last scenario indicates that by exploiting non-conventional oil supply options and by tap-ping the substitution and saving potential for liquid fuels on the demand side, the possibility exists to stabilize the oil price development between 2010 and 2050 on a level of 40-60 USD/bbl, which is far below the price peak of around 150 USD/bbl in the base scenario, but still nearly twice as high as the oil prices observed in the past between 1986 and 2002.
The third oil price surge – what’s different this time? 50
5 Conclusions The first section of this paper studied similarities and differences between the two oil price shocks in the 1970s and the recent oil price peak in 2008. Regarding the demand for oil, the two oil price shocks in the 70s were both preceded by a sustained high global economic growth in the developed world causing a surging oil consumption. From 2003 to 2008 the global economy was in a similar way rapidly expanding at an annual rate of more than 4 % driven by emerging economies as China and India. Oil consumption was further accelerated by the high energy intensity in these regions, similar to the situation in the developed countries in the 1970s. Today, the developed countries are less dependent on oil supply, but further reductions seem difficult to achieve, since the majority of oil is consumed in the transport sector, where changes are more difficult to realise due the large number of vehicles. The strong relationship between economic development and oil price became also apparent in the global recession following the oil price crises at the end of the 1970s. The interaction between economic development and the oil market could also be observed in the recent eco-nomic slowdown and the resulting fall of oil prices. On the supply side, the oil price shocks in the 1970s made Western oil importing countries increasingly wary of oil supply from the OPEC, which intensified exploration efforts outside the OPEC and led to the development of oil fields in the North Sea, Alaska and West Africa. Nevertheless, the OPEC is still an important player on the oil market today. Uncertainty exists today about OPEC’s actual production capabilities and its sufficient investment in future oil production. In a similar way as the build-up of non-OPEC oil production as reaction on the first two oil price crises, a response to these uncertainties and to the fears associated with an exhaustion of conventional oil resources in general could be the production from ul-tra-deep offshore oil fields, the exploitation of Arctic resources and supply from unconven-tional oil resources. The future use of these supply options requires, however, steady invest-ments in exploration and development as well as in some cases the development of new pro-duction technologies. In fact, the oil price increase over the last decade was accompanied by a rise in upstream exploration and development activities, but it is too early to say whether the falling oil prices since mid 2008 will yield in a cutback of upstream investments as ob-served during the period of low oil prices in the 1990s. Speculators from financial markets, although often blamed to be responsible for the last oil price surge, have only limited and short-term influence on the oil price. They may accelerate an oil price increase or decrease, but cannot be made responsible for the long-term price surge between 2002 and 2008. On the monetary markets, however, the weakening of the US-Dollar observed during the oil price crises in the 1970s and the recent oil price rise can be identified as a factor contributing to these price increases. Finally, geopolitical crises can be

The third oil price surge – what’s different this time? 51
the trigger for oil price surges, as it was the case for the two oil price crises in the 1970s. The situation today is more diffuse with latent geopolitical tensions in different world regions representing potential threats to the production and transport of oil and thus affecting the oil price. By linking the oil market model LOPEX with the energy system model TIAM-IER, the im-pact of several measures and conditions on the long-term future oil price development have been analysed. The assumed developments in the base scenario, characterized by an OPEC cartel on the oil market and by deferred investments in unconventional and alternative liquid fuel supply options, result in an oil price trajectory with a peak of around 150 USD/bbl in 2030. The peak is caused by a decline of conventional oil production outside the OPEC, which cannot be compensated made by an increasing unconventional or synthetic oil production, only after 2030 these options contribute to a reduction of OPEC’s influence. Several measures on the supply side for oil, as a better recovery rate for conventional oil by enhanced oil recovery techniques (scenario EOR), an increased production from un-conventional oil (scenario UNCONV) or an accelerated investment in synthetic fuel and bio-fuel production plants (scenario ALTERNATIVE), have the potential to limit the price peak observed in the base scenario to a range of 100-115 USD/bbl. Pure supply side measures might, however, as the scenario results indicate, increase the demand due to the lower oil price, so that only a limited amount of conventional oil is saved by these supply measures. Developments on the demand side, as a lower economic growth or climate protection poli-cies, can reduce the price and demand for oil at the same time. Climate protection efforts, as analysed in the scenario CO2, trigger on the supply side the increased production of biofuels and of fossil synfuels at plants with CO2 capture and on the demand side substitution and saving measures for petroleum products, so that the oil price peak of the base scenario can be reduced to roughly 95 USD/bbl. To assess the integrated price effect of measures and conditions on the supply and demand side together, more optimistic assumptions regarding the recovery rate for conventional oil and the production rates of non-conventional oil options have been combined in a scenario with increased substitution options for petroleum on the demand side and a higher electricity generation from nuclear power. Under these conditions, the oil price in this COMBI scenario fluctuates in a range between 50-60 USD/bbl. An additional CO2 mitigation target leads to a limited further price decline of approximately 10 USD/bbl. Therefore, the scenario analysis indicates that combining measures accelerating the production from non-conventional oil with efforts to substitute petroleum on the consumption side may have the potential to stabilize the long-term oil price development over the next four decades on a level of 40-60 USD/bbl, which is far below the price level observed for this time horizon in the base

The third oil price surge – what’s different this time? 52
scenario, but still higher than the historic prices of 20-30 USD/bbl observed between 1986 and 2002 on the oil market. Regarding the results of our approach, it has to be kept in mind that this approach is not able to consider all price influencing factors. With our model it is not possible to consider the in-fluence of financial investors neither exchange rate variations on the oil price. Instead, the oil price development derived in the analysis framework is driven by fundamental factors on the demand and supply side determining the decisions of the producers on the oil market as well as the fuel choices and investment decisions in the energy sector in the long term. Though some aspects affecting the investment environment, e.g. uncertainty regarding future developments, are not endogenously treated in the approach, but handled exogenously through a scenario approach.

The third oil price surge – what’s different this time? 53
6 References
/Adelman et al., 2004/
Adelman, M.A., Lynch, M.C., 2004. Markets for Petroleum. In: Cleveland
(Editor), Encyclopedia of Energy, Elsevier
/Aguilera et al., 2008/
Aguilera, R.F., Eggert, R.G., Lagos, G.L., Tilton, J.E. Depletion of the future
availability of petroleum resources. Presentation at the 31st IAEE conference,
18-20 June 2008, Istanbul
/API, 1959/
API, American Association of Petroleum Engineers, 1959. API Facts and Fig-
ures - Centennial edition
/Baker Hughes, 2008/
Baker Hughes. Worldwide Rig Counts - Current & Historical data. 2008,
Houston, http://investor.shareholder.com/bhi/rig_counts/rc_index.cfm
(11/21/2009)
/Bardi, 2005/
Bardi, Ugo, 2005. The mineral economy: a model for the shape of oil produc-
tion curves. Energy Policy 33 (1), 53-61
/Bartis et al., 2005/
Bartis, J.T., La Tourrette, T., Dixon, L., Peterson, D.J., Cecchine, G.: Shale oil
development in the United States: Prospects and Policy Issues, 2005
/BGR, 2008/
BGR, Bundesanstalt für Geowissenschaften und Rohstoffe. Reserven,
Ressourcen und Verfügbarkeit von Energierohstoffen 2007, Hannover, 2008
/BP, 2008/
BP, British Petroleum. BP Statistical Review of World Energy, 2008
/Brandt, 2007/
Brandt, Adam R., 2007. Testing Hubbert. Energy Policy 35 (5), 3074-3088
The third oil price surge – what’s different this time? 54
/Brendow, 2003/
Brendow, K., 2003. Global Shale oil Issues and Perspectives - Synthesis of the
Symposium on Shale oil Held in Tallinn (Estonia) on 18 and 19 November
2002. Oil Shale 20 (1), 81-92
/CAPP, 2008/
CAPP, Canadian Association of Petroleum Producers. Crude Oil, Forecast,
Markets & Pipeline Expansions, 2008, Calgary,
http://www.capp.ca/raw.asp?x=1&dt=NTV&e=PDF&dn=138295
(11/20/2008)
/CFTC, 2008a/
CFTC, Commodity Futures Trading Commission. The Economic Purpose of
Futures Markets and How They Work, 2008a,
http://www.cftc.gov/educationcenter/economicpurpose.html (11/24/2008)
/CFTC, 2008b/
CFTC, Commodity Futures Trading Commission. Historical Commitments of
Traders Reports, 2008b,
http://www.cftc.gov/marketreports/commitmentsoftraders/cot_historical.html#
P305_1156 (11/24/2008)
/Coleman et al., 2006/
Coleman, Norm, Levin, Carl, 2006. The Role of Market Speculation in Rising
Oil and Gas Prices: A Need to Put the Cop Back on the Beat, Committee on
Homeland Security and Governmental Affairs, Permanent Subcommittee on
Investigations, Washington D.C.
/DeGolyer & MacNaughton, 2004/
DeGolyer & MacNaughton. Twentieth Century Petroleum Statistics, 2004
/Economist, 2008/
Economist, The. Nothing to smile about - The oil price is dropping. Reasons
not to cheer, 2008, London,
http://www.economist.com/finance/displaystory.cfm?story_id=11877319
(11/24/2008)

The third oil price surge – what’s different this time? 55
/EIA, 2006/
EIA, Energy Information Administration. Performance Profiles of Major
Energy Producers, Office of Energy Markets and End Use, Washington, D.C.,
2006
/EIA, 2008a/
EIA, Energy Information Administration. Country Analysis Briefs: North Sea,
2008a, http://www.eia.doe.gov/cabs/North_Sea/Oil.html (11/20/2008)
/EIA, 2008b/
EIA, Energy Information Administration. Crude Oil Distillation Capacity,
2008b, http://www.eia.doe.gov/emeu/international/oilother.html (11/21/2008)
/EIA, 2008c/
EIA, Energy Information Administration. October 2008 Monthly Energy Re-
view, 2008c, http://www.eia.doe.gov/mer/prices.html (11/20/2008)
/EIA, 2008d/
EIA, Energy Information Administration. Short-Term Energy Outlook, August
12, 2008, 2008d, http://www.eia.doe.gov/emeu/steo/pub/contents.html
(09/01/2008)
/EIA, 2008e/
EIA, Energy Information Administration. Spot Prices, 2008e,
http://tonto.eia.doe.gov/dnav/pet/pet_pri_spt_s1_m.htm (11/24/2008)
/EIA, 2008f/
EIA, Energy Information Administration. U.S. Crude Oil Supply & Disposi-
tion October 2008, 2008f,
http://tonto.eia.doe.gov/dnav/pet/pet_sum_crdsnd_adc_mbblpd_m.htm
(11/20/2008)
/Eni, 2008/
Eni. World Oil and Gas Review 2008, 2008,
www.eni.it/wogr_2008/default_en.htm (09/01/2008)

The third oil price surge – what’s different this time? 56
/Fed, 2008/
Fed, Federal Reserve System. Foreign Exchange Rates - Federal Reserve
Statistical Release, 2008,
http://www.federalreserve.gov/releases/h10/summary/ (11/24/2008)
/Greenspan, 2006/
Greenspan, Alan, 2006. Statement before the Committee on Foreign Relations,
Committee on Foreign Relations
/Hirsch, 2005/
Hirsch, Robert L.: The Shape of World Oil Peaking: Learning From Experi-
ence, Science Applications International Corporation (SAIC), Washington
D.C., 2005
/HM Treasury, 2008/
HM Treasury. Global commodities: a long term vision for stable, secure and
sustainable global markets, London, 2008
/Hubbert, 1959/
Hubbert, M.K., 1959. Techniques of prediction with application to the petro-
leum industry, 44th Annual Meeting of the American Association of Petro-
leum Geologists. Shell Development Company, Dallas
/ICE, 2008/
ICE, IntercontinentalExchange. ICE Futures Historical Daily Volume, 2008,
London,
https://www.theice.com/marketdata/settlementPrices/getFuturesDailyVolume
Results.do (11/24/2008)
/IEA, 2005/
IEA, International Energy Agency. Resources to Reserves - Oil & Gas
Technologies for the Energy Markets of the Future, Paris, 2005
/IEA, 2007a/
IEA, International Energy Agency. Medium-Term Oil Market Report, Paris,
2007a
The third oil price surge – what’s different this time? 57
/IEA, 2007b/
IEA, International Energy Agency. Oil Information 2007, Paris, 2007b
/IEA, 2007c/
IEA, International Energy Agency. World Energy Outlook 2007 - China and
India Insights, Paris, 2007c
/IEA, 2008a/
IEA, International Energy Agency. Energy Technology Perspectives 2008,
Paris, 2008a
/IEA, 2008b/
IEA, International Energy Agency. Oil Market Report released 10 October
2008, Paris, 2008b
/IEA, 2008c/
IEA, International Energy Agency. World Energy Outlook 2008, Paris, 2008c
/IEA, 2008d/
IEA, International Energy Agency. From 1st to 2nd generation biofuel
technologies, Paris, 2008d
/IEA, 2009/
IEA, International Energy Agency. Highlights of the Oil Market Report re-
leased 19 January 2009, Paris, 2009
/IEA, various years/
IEA, International Energy Agency. Oil information, Paris, various years
/IMF, 2000/
IMF, International Monetary Fund, 2000. The World Economic Outlook
(WEO) Database November 2000
/IMF, 2005/
IMF, International Monetary Fund. World Economic Outlook - Globalization
and External Imbalances, Washington D.C., 2005

The third oil price surge – what’s different this time? 58
/IMF, 2006/
IMF, International Monetary Fund. World Economic Outlook - Financial Sys-
tems and Eocnomic Cycles, Washington, D.C., 2006
/IMF, 2008a/
IMF, International Monetary Fund. International Financial Statistics,
Washington, D.C., 2008a
/IMF, 2008b/
IMF, International Monetary Fund. World Economic Outlook - Housing and
the Business Cycle, Washington, D.C., 2008b
/IMF, 2008c/
IMF, International Monetary Fund, 2008c. The World Economic Outlook
(WEO) Database November 2008
/King, 2008/
King, David T., 2008. Oil Is Up Because the Dollar Is Down, The Wall Street
Journal, New York
/Lake et al., 1992/
Lake, W.L., Schmidt, R.L., Venuto, P.B., 1992. A niche for enhanced oil
recovery in the 1990s. Oil review 4 (2), 55-61
/Loderer, 1985/
Loderer, Claudio, 1985. A Test of the OPEC Cartel Hypothesis: 1974-1983.
The Journal of Finance 40 (3), 991-1006
/Loulou et al., 2005/
Loulou, R., Remme, U., Lehtilä, A., Kanudia, A., Goldstein, G.: Documenta-
tion for the TIMES model, 2005, www.etsap.org/documentation.asp
(09/01/2008)
/Loulou et al., 2008/
Loulou, R., Labriet, M., 2008. “ETSAP-TIAM: the TIMES integrated assess-
ment model Part I: Model structure”, in: Computational Management Science
2, 5 (1), 7-40
The third oil price surge – what’s different this time? 59
/National Energy Board, 2006/
National Energy Board. Canada's Oil Sands - Opportunities and Challenges to
2015: An Update, Calgary, 2006
/OECD, 2008/
OECD: OECD Economic Outlook, Volume 2008/2, No. 84, December 2008
/OPEC, 2009/
Organization of the Petroleum Exporting Countries (OPEC): Monthly Oil
Market Report, January 2009
/Rahmin, 2008/
Rahmin, I.I., 2008. Special Report: GTL, CTL finding roles in global energy
supply. Oil and Gas Journal 106 (2)
/Rehrl et al., 2006/
Rehrl, T., Friedrich, R., 2006. Modelling long-term oil price and extraction
with a Hubbert approach: The LOPEX model. Energy Policy 34 (15), 2413-
2428
/Remme et al., 2007/
Remme, U., Blesl, M., Fahl, U. Global resources and energy trade: An over-
view of for coal, natural gas, oil and uranium, Forschungsbericht Band 101,
Institute of Energy Economics and the Rational Use of Energy, July 2007
/Rodrigue, 2004/
Rodrigue, J.P., 2004. Straits, Passages and Chokepoints: A maritime
geostrategy of petroleum distribution. Les Cahiers de Geographie du Quebec
48 (135, Special Issue on maritime strategic passages), 357-374
/Ruiz, 2004/
Ruiz, Juan. Causas y consecuencias de la evolución reciente del precio del
petróleo, Madrid, 2004
The third oil price surge – what’s different this time? 60
/Sanders et al., 2004/
Sanders, Dwigth R., Boris, Keith, Manfredo, Mark, 2004. Hedgers, funds, and
small speculators in the energy futures markets: an analysis of the CFTC's
Commitiments of Traders report. Energy Economics 26 (3), 425-445
/Schrattenholzer, 1998/
Schrattenholzer, Leo, 1998. A Brief History of the International Energy Work-
shop, in: Weyant, J. (Ed.), Energy and Environmental Policy Modeling, Nor-
well
/Silvapulle et al., 1999/
Silvapulle, Param, Moosa, Imad A., 1999. The Relationship between Spot and
Futures Prices: Evidence from the Crude Oil Market. The Journal of Futures
Markets 19 (2), 175-193
/SPE et al., 2006/
Society of Petroleum Engineers (SPE), American Association of Petroleum
Geologists (AAPG), World Petroleum Council (WPC), Society of Petroleum
Evaluation Engineers (SPEE): Petroleum Reserves and Resources Classifica-
tion, Definitions, and Guidelines September 2006, DRAFT for Industry Re-
view
/Story, 2008/
Story, Luise, 2008. An Oracle of Oil Predicts $200-a-Barrel Crude, The New
York Times, New York
/U.S. DoE, 2004/
U.S. DoE, Department of Energy. America's Shale oil - A Roadmap for
Federal Decision Making. Sustainable Development of the Shale oil Resources
of the United States, Deputy Assistant Secretary for Petroleum Reserves. Of-
fice of Naval Petroleum and Shale oil Reserves, Washington D.C., 2004
/Verleger, 2007/
Verleger, Philipp K., 2007. How Wall Street Controls Oil. The International
Economcy (Winter 2007)

The third oil price surge – what’s different this time? 61
/Weiner, 2002/
Weiner, Robert J., 2002. Sheep in wolves' clothing? Speculators and price
volatility in petroleum futures. The Quarterly Review of Economics and Fi-
nance 42 42, 391-400
/Wolff, 2008/
Wolff, Sebastian, 2008. Ölpreis klettert erstmals auf 100 Dollar, Berliner Zei-
tung, Berlin
/Wood et al., 2000/
Wood, John H., Long, Gary R., Morehouse, David F.: Long-Term World Oil
Supply Scenarios - The Future Is Neither as Bleak or Rosy as Some Assert,
Energy Information Administration (EIA), Washington D.C., 2000