Embed Size (px)
Citation preview
WORKING PAPER 128
I n t e r n a t i o n a lWater ManagementI n s t i t u t eISBN: 978-92-9090-691-9
Postal AddressP O Box 2075ColomboSri Lanka
Location127, Sunil MawathaPelawattaBattaramullaSri Lanka
Telephone+94-11 2880000
Fax+94-11 2786854
Websitehttp://www.iwmi.org
SM
IWMI is a Future Harvest Centersupported by the CGIAR
I n t e r n a t i o n a lWater ManagementI n s t i t u t e
Wastewater Reuse andRecycling Systems: A Perspective into India and Australia
Gayathri Devi Mekala, Brian Davidson, Madar Samad and Anne-Maree Boland

Working Paper 128
Wastewater Reuse and Recycling Systems: APerspective into India and Australia
Gayathri Devi MekalaBrian DavidsonMadar Samad
andAnne-Maree Boland
International Water Management Institute
ii
The authors: Gayathri Devi Mekala is a PhD scholar enrolled at the University of Melbourne, Australia.Ms. Mekala’s research is funded by the International Water Management Institute (IWMI) and CooperativeResearch Centre for Irrigation Futures (CRC IF). She is currently studying the economics of wastewaterrecycling in Australia and India. Email: [email protected]
Brian Davidson is a Senior Lecturer in the School of Resource Management at the University of Melbourneand is also associated with the Cooperative Research Centre for Irrigation Futures. He has over 20 yearsexperience in teaching and researching many different issues in agricultural and resource economics. Hisresearch interests lie in understanding and measuring how water markets deliver services to users, howwater can be shared amongst stakeholders and how the market failures evident in water and land can beevaluated. Email: [email protected]
Madar Samad is a Principal Researcher and Head of the India and Nepal offices of the International WaterManagement Institute (IWMI). He has more than 20 years experience as an Agricultural Economist dealingwith research in the field of agricultural and rural development, project planning and evaluation, policyanalysis and project management. Email: [email protected]
Anne-Maree Boland is Associate Partner at the RM Consulting Group. Anne-Maree has 15 years experiencein dealing with natural resource and water management in Australian agricultural industries. This hasincluded research and development in the areas of water use efficiency (WUE), salinity, waterlogging,recycled water and environmental management systems. Anne-Maree has experience in working with andestablishing partnerships with diverse stakeholder groups (government, CMAs, water and agriculturalindustries).Email: [email protected]
Mekala, G. D.; Davidson, B.; Samad, M.; Boland, A. M. 2008. Wastewater reuse and recycling systems:A perspective into India and Australia. Colombo, Sri Lanka: International Water Management Institute.35p. (IWMI Working Paper 128)
/ water reuse / recycling / costs / wastewater irrigation / water use / water balance / water quality / watermarket / water scarcity / developing countries / developed countries / India / Australia /
ISBN 978-92-9090-691-9
Copyright © 2008, by IWMI and IF Technologies Pty Ltd. All rights reserved. This work is copyright. Itmay be reproduced subject to the inclusion of an acknowledgement of the source.
Important DisclaimerThe Cooperative Research Centre for Irrigation Futures advises that the information contained in thispublication comprises general statements based on scientific research. The reader is advised and needsto be aware that such information may be incomplete or unable to be used in any specific situation. Noreliance or actions must therefore be made on that information without seeking prior expert professional,scientific and technical advice. To the extent permitted by law, the Cooperative Research Centre forIrrigation Futures (including its employees and consultants) excludes all liability to any person for anyconsequences, including but not limited to all losses, damages, costs, expenses and any othercompensation, arising directly or indirectly from using this publication (in part or in whole) and anyinformation or material contained in it.
Please direct inquiries and comments to: [email protected]
IWMI receives its principal funding from 58 governments, private foundations and internationaland regional organizations known as the Consultative Group on International AgriculturalResearch (CGIAR). Support is also given by the Governments of Ghana, Pakistan, South Africa,Sri Lanka and Thailand.
iii
Contents
SUMMARY ................................................................................................................................ v
1. WASTEWATER – A GROWING RESOURCE .................................................................. 1
1.1 Area under Wastewater Irrigation ................................................................................. 1
1.2 Rationale for Wastewater Irrigation .............................................................................. 2
1.3 Wastewater Use in Developed Countries ...................................................................... 2
1.4 Quality of Wastewater ................................................................................................... 2
1.5 Economic Characteristics of Wastewater ...................................................................... 3
2. WASTEWATER RECYCLING IN AUSTRALIA .............................................................. 4
2.1 Population and Water Use in Australia ......................................................................... 4
2.2 The urban Water Balance Sheet .................................................................................... 6
2.3 Current Wastewater Recycling in Australia .................................................................. 7
2.4 Key Drivers for Wastewater Recycling ........................................................................ 8
2.5 Quality of Wastewater in Australia ............................................................................. 10
2.6 Government / Institutional Role in Wastewater Recycling ......................................... 11
2.7 Social Aspects of Wastewater Recycling .................................................................... 13
2.8 Costs of Recycling ...................................................................................................... 14
3. WASTEWATER REUSE IN INDIA .................................................................................. 17
3.1 Wastewater Volumes in India ....................................................................................... 17
3.2 Wastewater Market ....................................................................................................... 18
3.3 Wastewater Reuse ......................................................................................................... 18
3.4 Implications of Wastewater Reuse ............................................................................... 19
3.5 Water Markets and Potential of Wastewater ................................................................ 20
3.6 Urban Water Pricing ..................................................................................................... 21
3.7 Should Urban Consumers Pay More for Water Supply and Sewerage ....................... 25
4. CONCLUSIONS ................................................................................................................ 27
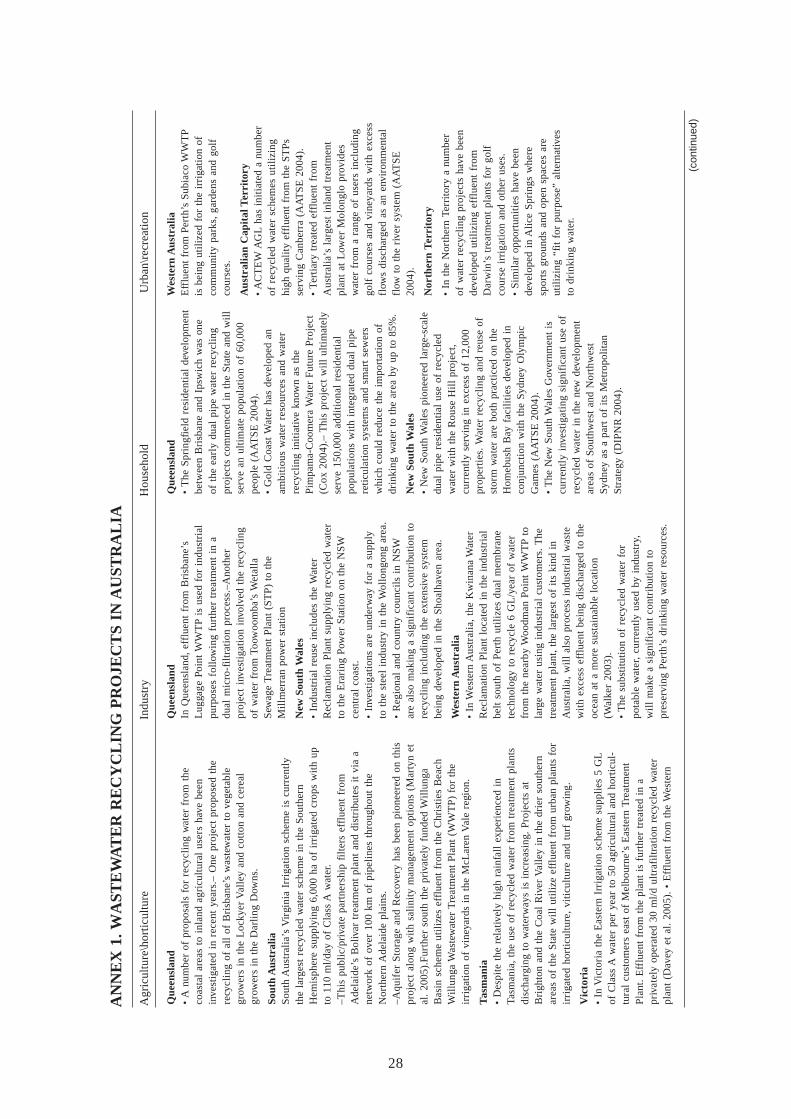
Annex 1: Wastewater Recycling Projects in Australia ............................................................. 28
REFERENCES .......................................................................................................................... 31

iv
v
Summary
Wastewater irrigation is a common practice in developing countries of Asia and Africa and also inthe water scarce regions of the developed world like Australia. In India, wastewater is used eitherraw or partially treated due to high treatment costs, whereas in Australia, treated wastewater isrecycled in agriculture and other sectors in water scarce areas and regions with severe restrictionson disposal of treated wastewater effluents. In spite of ill effects of untreated wastewater on humanhealth and the environment, the practice continues in India, as wastewater is highly reliable, nutrientrich and provides year-round income, employment and food security to the urban and peri-urbanpoor helping them escape poverty. Whereas in Australia, recycling is promoted to complementexisting water resources and reduce nutrient disposal into natural water bodies. While the problemsassociated with wastewater reuse in India arise from its lack of treatment, in Australia often recyclingprojects do not take off even when wastewater is treated to tertiary level, due to a number of reasonslike the “yuck factor”, high cost of supply, higher salinity than normal river water, lack of informationand trust in authorities. A number of issues related to wastewater reuse and recycling are yet to beunderstood and researched. A literature review shows the following research gaps: to identifyopportunities and constraints to recycling; identify conditions required for wastewater markets tofunction efficiently; test commercial feasibility for wastewater treatment and recycling, pricing andsupply mechanisms versus other options to complement existing water resources for urban areas;need for a uniform international approach to assess the feasibility of recycling, while providingflexibility for individual countries to vary requirements to suit local circumstances of affordabilityand risk; lack of decision support tools to efficiently allocate water and wastewater resources amongdifferent sectors, stakeholder objectives and priorities for wastewater recycling. With issues of climatechange, increases in urban population and increased demand for water from competing sectors,wastewater recycling is becoming an important strategy to complement the existing water resourcesfor both developing and developed countries and there are lessons, experiences, data and technologythat can be shared for mutual benefit.

1
1. WASTEWATER – A GROWING RESOURCE
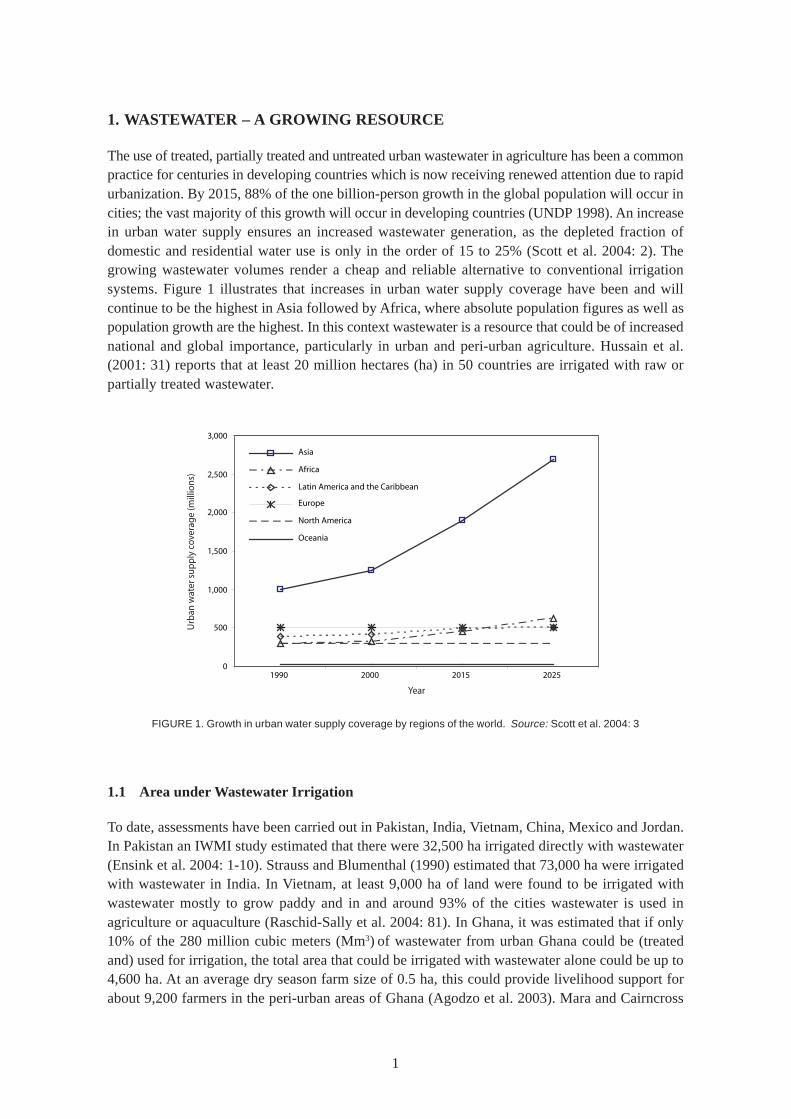
The use of treated, partially treated and untreated urban wastewater in agriculture has been a commonpractice for centuries in developing countries which is now receiving renewed attention due to rapidurbanization. By 2015, 88% of the one billion-person growth in the global population will occur incities; the vast majority of this growth will occur in developing countries (UNDP 1998). An increasein urban water supply ensures an increased wastewater generation, as the depleted fraction ofdomestic and residential water use is only in the order of 15 to 25% (Scott et al. 2004: 2). Thegrowing wastewater volumes render a cheap and reliable alternative to conventional irrigationsystems. Figure 1 illustrates that increases in urban water supply coverage have been and willcontinue to be the highest in Asia followed by Africa, where absolute population figures as well aspopulation growth are the highest. In this context wastewater is a resource that could be of increasednational and global importance, particularly in urban and peri-urban agriculture. Hussain et al.(2001: 31) reports that at least 20 million hectares (ha) in 50 countries are irrigated with raw orpartially treated wastewater.
FIGURE 1. Growth in urban water supply coverage by regions of the world. Source: Scott et al. 2004: 3
0
500
1,000
1,500
2,000
2,500
3,000
1990 2000 2015 2025
Asia
Africa
Latin America and the Caribbean
Europe
North America
Oceania
Year
Urb
an w
ater
sup
ply
cov
erag
e (m
illio
ns)
1.1 Area under Wastewater Irrigation
To date, assessments have been carried out in Pakistan, India, Vietnam, China, Mexico and Jordan.In Pakistan an IWMI study estimated that there were 32,500 ha irrigated directly with wastewater(Ensink et al. 2004: 1-10). Strauss and Blumenthal (1990) estimated that 73,000 ha were irrigatedwith wastewater in India. In Vietnam, at least 9,000 ha of land were found to be irrigated withwastewater mostly to grow paddy and in and around 93% of the cities wastewater is used inagriculture or aquaculture (Raschid-Sally et al. 2004: 81). In Ghana, it was estimated that if only10% of the 280 million cubic meters (Mm3) of wastewater from urban Ghana could be (treatedand) used for irrigation, the total area that could be irrigated with wastewater alone could be up to4,600 ha. At an average dry season farm size of 0.5 ha, this could provide livelihood support forabout 9,200 farmers in the peri-urban areas of Ghana (Agodzo et al. 2003). Mara and Cairncross
2
(1989: 187) estimated that 1.3 million ha were irrigated with wastewater in China. Scott et al. (2000)has estimated that in Mexico, about 500,000 ha of land is under wastewater irrigation. Hussain etal. (2001:31) report that at least 20 million ha in 50 countries are irrigated with raw or partiallytreated wastewater.
1.2 Rationale for Wastewater Irrigation
Whether recycling will be appropriate in a given situation depends on the availability of additionalwater resources, a desire or necessity to conserve rather than develop water resources, carefuleconomic considerations, potential uses for the recycled water, the strategy of waste discharge andpublic policies that may override economic and public health considerations or perceptions(Mantovani et al. 2001). There are many ill effects of using untreated or partially treated wastewaterlike groundwater pollution, soil contamination, and the adverse effect on farmers and consumers ofwastewater products. In spite of these facts, wastewater is widely used as it supports livelihoodsand generates considerable value in urban and peri-urban agriculture. In many countries of thedeveloping world, farmers use wastewater out of necessity and it is a reality that cannot be deniedor effectively banned (Buechler et al. 2002). Highly specialized farmers use every free space withwater access to cultivate cash crops. Although their plots are often small, irrigation (including witheffluents, no matter what level of treatment, if any), allows these farmers to escape from poverty(Drechsel et al. 2002). Wastewater treatment in these countries is not possible due to low municipal/government resources, and small, old or non-extendable sewerage systems.
1.3 Wastewater Use in Developed Countries
Wastewater reuse1 is a common practice in developing countries of Asia and Africa and wastewaterrecycling2 is common in water scarce regions of the developed countries such as the Australia, MiddleEast, south west of US, and in regions with severe restrictions on disposal of treated wastewatereffluents, such as Florida, coastal or inland areas of France and Italy, and densely populatedEuropean countries such as England and Germany (Marsalek et al. 2002). Even in high rainfallcountries like Japan, whose mean annual precipitation of 1,714 millimeters (mm), urban wastewaterreuse is common due to high population density in some regions, which suffer from water shortages(Ogoshi et al. 2001). The developed countries have generated techniques and guidelines for safereuse of wastewater, which can be adopted by the developing countries. After reviewing manyoverseas recycling projects, Radcliffe (2004) concluded that worldwide, water reuse is becomingan increasingly common component of water resource planning as the costs of wastewater disposalrise and opportunities for conventional water supply development dwindle.
1.4 Quality of Wastewater
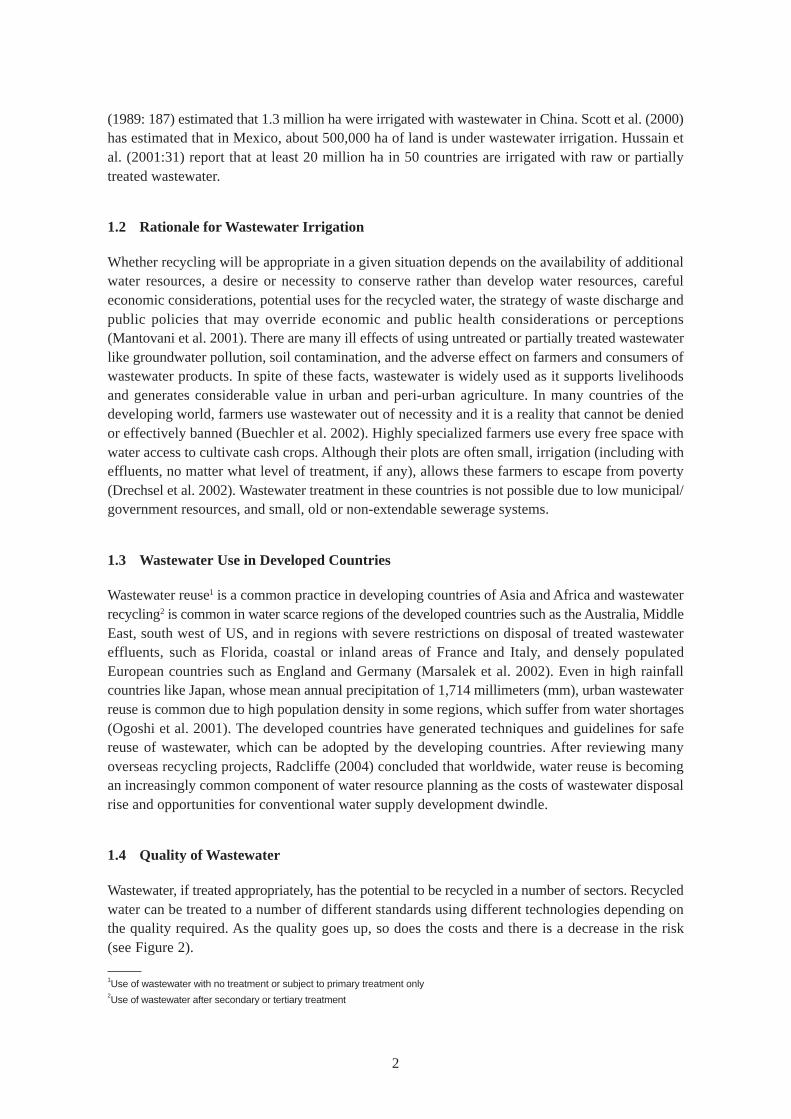
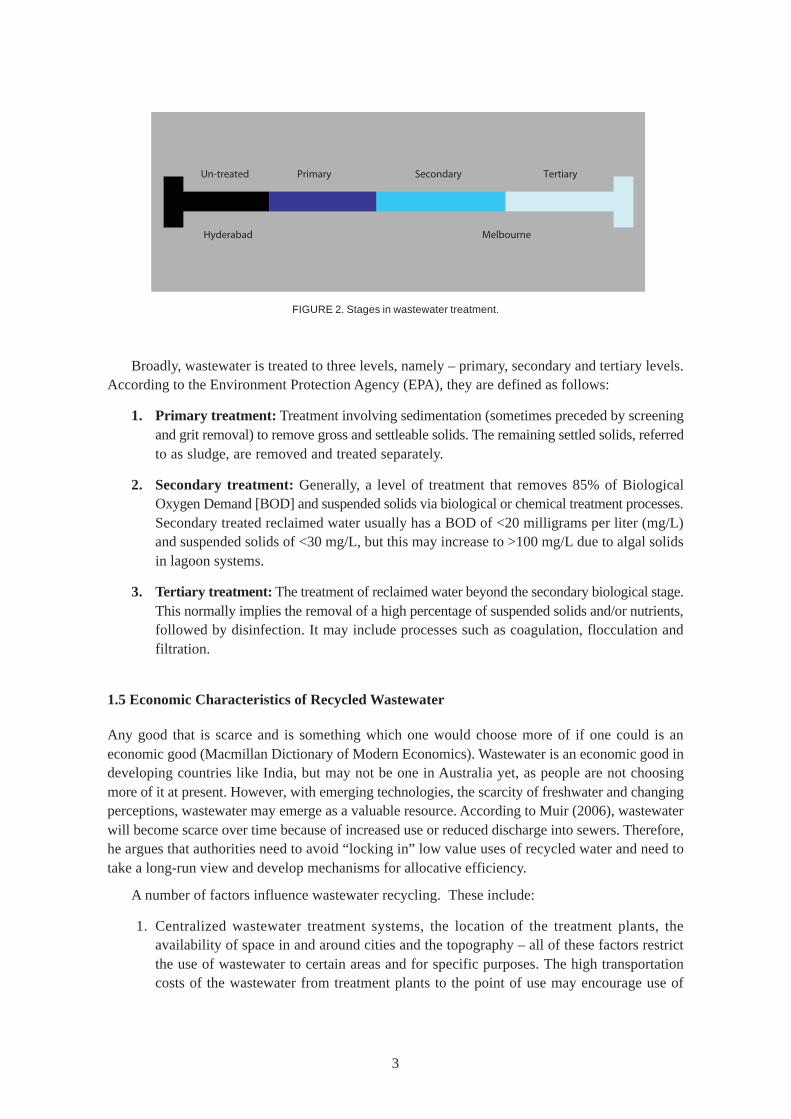
Wastewater, if treated appropriately, has the potential to be recycled in a number of sectors. Recycledwater can be treated to a number of different standards using different technologies depending onthe quality required. As the quality goes up, so does the costs and there is a decrease in the risk(see Figure 2).
1Use of wastewater with no treatment or subject to primary treatment only2Use of wastewater after secondary or tertiary treatment
3
Un Primary Secondary Tertiary
Hyderabad Melbourne
Un-treated Primary Secondary Tertiary
Hyderabad Melbourne
FIGURE 2. Stages in wastewater treatment.
Broadly, wastewater is treated to three levels, namely – primary, secondary and tertiary levels.According to the Environment Protection Agency (EPA), they are defined as follows:
1. Primary treatment: Treatment involving sedimentation (sometimes preceded by screeningand grit removal) to remove gross and settleable solids. The remaining settled solids, referredto as sludge, are removed and treated separately.
2. Secondary treatment: Generally, a level of treatment that removes 85% of BiologicalOxygen Demand [BOD] and suspended solids via biological or chemical treatment processes.Secondary treated reclaimed water usually has a BOD of <20 milligrams per liter (mg/L)and suspended solids of <30 mg/L, but this may increase to >100 mg/L due to algal solidsin lagoon systems.
3. Tertiary treatment: The treatment of reclaimed water beyond the secondary biological stage.This normally implies the removal of a high percentage of suspended solids and/or nutrients,followed by disinfection. It may include processes such as coagulation, flocculation andfiltration.
1.5 Economic Characteristics of Recycled Wastewater
Any good that is scarce and is something which one would choose more of if one could is aneconomic good (Macmillan Dictionary of Modern Economics). Wastewater is an economic good indeveloping countries like India, but may not be one in Australia yet, as people are not choosingmore of it at present. However, with emerging technologies, the scarcity of freshwater and changingperceptions, wastewater may emerge as a valuable resource. According to Muir (2006), wastewaterwill become scarce over time because of increased use or reduced discharge into sewers. Therefore,he argues that authorities need to avoid “locking in” low value uses of recycled water and need totake a long-run view and develop mechanisms for allocative efficiency.
A number of factors influence wastewater recycling. These include:
1. Centralized wastewater treatment systems, the location of the treatment plants, theavailability of space in and around cities and the topography – all of these factors restrictthe use of wastewater to certain areas and for specific purposes. The high transportationcosts of the wastewater from treatment plants to the point of use may encourage use of
4
existing infrastructure (like irrigation canals) so that wastewater is increasingly used inagriculture or on market gardens in the peri-urban areas of the city, rather than in householdsor by industry.
2. There are substantial barriers to entry in the field of wastewater recycling. Wastewater isoften operated and owned by a single entity, like the Water Board or sewage treatment plant,which is often the retailer. Also, wastewater recycling often requires a dual reticulationsystem that is inefficient to duplicate (Muir 2006).
3. There are both positive and negative externalities associated with wastewater recycling.The positive externality is: environmental benefits from reduced discharge of salinewastewater into natural water bodies. The negative externalities include potentialgroundwater pollution and increase in soil salinity if used for irrigation and potentialunknown ill effects on human health if used for potable uses. Recycled water could wellbe subsidized to internalize the value transfer for costs avoided between those avoiding thecosts to those generating the benefit (users of recycled water). However, any subsidy maywell lead to an inefficient allocation of resources.
2. WASTEWATER RECYCLING IN AUSTRALIA
While the term “recycled water” is loosely defined, for the current research purposes, it only refersto treated urban wastewater collected by the urban sewage system and transported to the wastewatertreatment plant of the city. Wastewater use in agriculture is a common phenomenon in developingcountries where more than 80% is untreated. Farmers in these countries face various health problemsassociated with close contact to wastewater and over time the practice leads to a decrease in theland productivity, due to increased soil salinity and loss a of cropping options. However, in developedcountries like Australia all the wastewater generated is treated according to Environment ProtectionAgency (EPA) standards, before it is released into natural water bodies.
Wastewater recycling in Australia has resulted due to a combination of factors: urbanpopulation increase, decrease in rainfall, environmental concerns, need for greener water strategiesand improved technology. In this section, we look at all these factors, research done in theseareas and some crucial data.
2.1 Population and Water Use in Australia
More than 80% of the Australian population (approximately 19 million) lives in cities that are within100 kilometers (km) of the coast (WSAA 2005: 4). In spite of this fact, the water policy debatehas concentrated mainly on agricultural water shortages. This occurs because 67% of all waterextracted is used in agriculture and only 9% is used by households and 7% by the manufacturingindustry. Until the 1990s water authorities have kept pace with the growth in population and itswater requirements. However, in recent years the gap between supply and demand has grown andthe marginal costs of providing additional supplies are rising sharply. The population of Australia’smajor cities is predicted to increase by 35%, or by 4.5 million people, by the year 2030 (ABS2006). The combined impact of an increase in demand from population (see Table 1), allocating
5
more water for river health and possible decreases in water yields due to anticipated droughts andclimate change makes it necessary to manage both the supply and demand for water.
TABLE 1. Projected population and water consumption in Australia’s major cities. Source: WSAA 2005.
City Current Projected Increase AdjustedPopulation population in (%) unrestricted(’000s) 2030 (’000s) consumption (ML/yr)
Adelaide 1,090 1,182 8 190,383
Brisbane 931 1,509 62 196,095
Canberra 357 486 36 51,208
Darwin 101 168 67 35,142
Gold Coast 472 800 69 69,899
Hobart 188 215 14 40,679
Melbourne 3,497 4,573 31 498,295
Lower Hunter 496 585 18 72,231
Perth 1,453 2,177 50 262,359
Sydney 4,189 5,592 33 647,158
Total 12,774 17,287 35 2,063,449
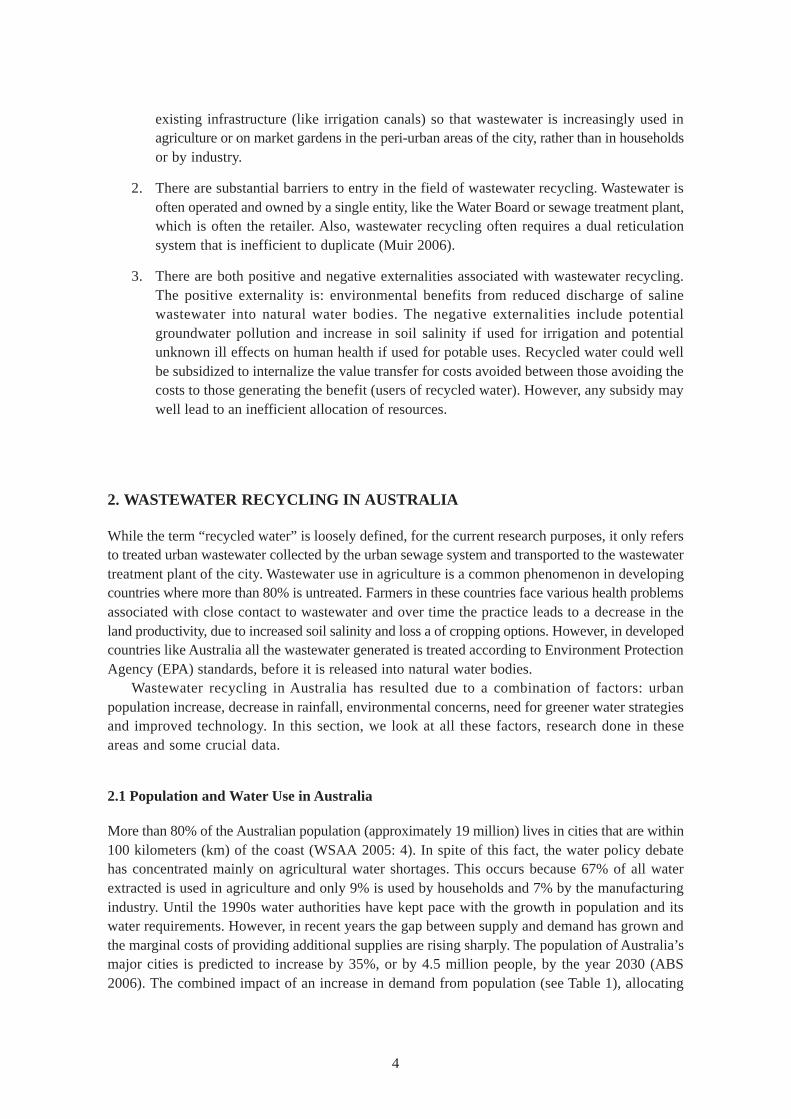
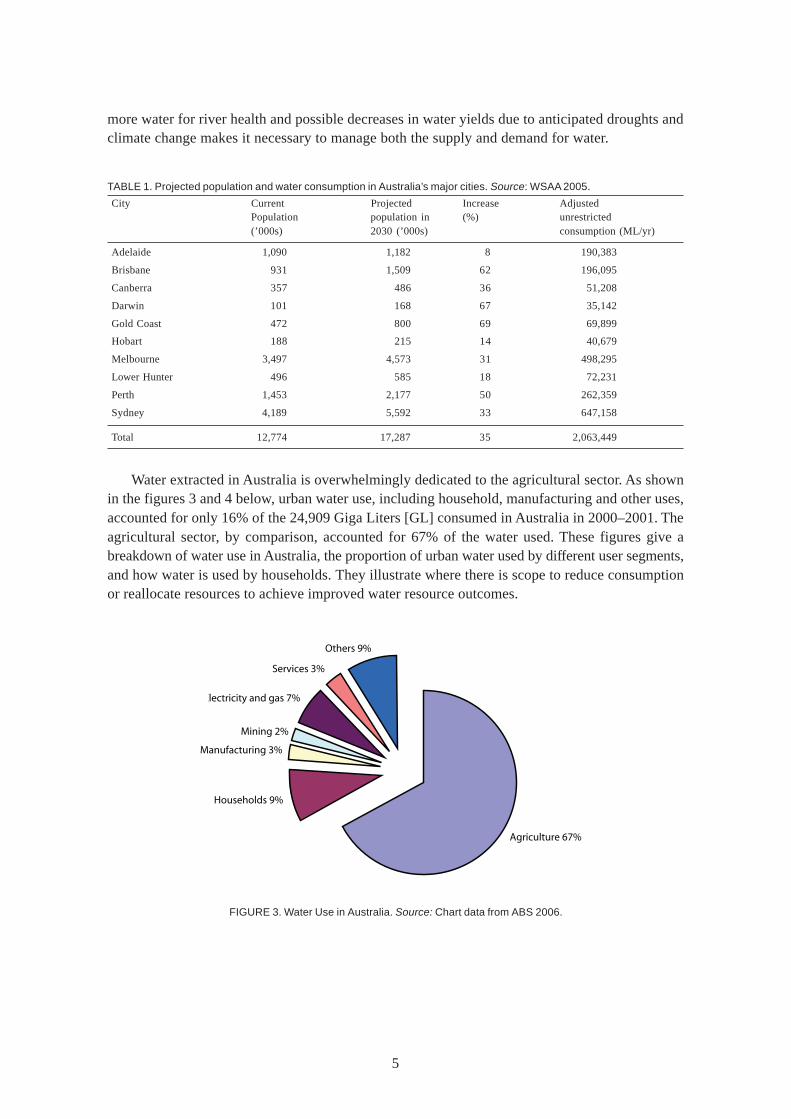
Water extracted in Australia is overwhelmingly dedicated to the agricultural sector. As shownin the figures 3 and 4 below, urban water use, including household, manufacturing and other uses,accounted for only 16% of the 24,909 Giga Liters [GL] consumed in Australia in 2000–2001. Theagricultural sector, by comparison, accounted for 67% of the water used. These figures give abreakdown of water use in Australia, the proportion of urban water used by different user segments,and how water is used by households. They illustrate where there is scope to reduce consumptionor reallocate resources to achieve improved water resource outcomes.
Agriculture 67%
Households 9%
Manufacturing 3%
Mining 2%
Electricity and gas 7%
Services 3%
Others 9%
FIGURE 3. Water Use in Australia. Source: Chart data from ABS 2006.
6
2.2 The Urban Water Balance Sheet
Taking the current drought period as an opportunity, the urban water industry has developed waterresources strategies for each major Australian city. These strategies have a strong supply-side focusand include interbasin transfers, accessing groundwater and desalination, sourcing water from watermarkets and increasing the use of recycled water. However, as these strategies take some time toimplement, governments currently rely on demand-side programs to reduce per capita use, whichmainly involves improving water use efficiency.
The urban water balance (see Table 2) seeks to maintain equilibrium between increases in thedemand for water due to population growth and the potential reductions in yield from existing watersources, with additional and new sources of supply. Without the supply-side measures, this wouldresult in a water deficit of 854 GL by 2030 (WSAA 2005: 24). The limitations of relying on ongoingwater efficiency programs to close the gap between demand and supply-side measures – with bothnew sources of water and alternative sources of water - are expected to enable Australian cities togrow and prosper into the future. New sources of water include, the transfer of water from adjoiningcatchments, accessing agricultural water through water markets, reducing water losses from runoff,leakages and water loss management, construction of desalination plants, expanding groundwatersources, better use of existing dams that are currently not being used for potable purposes andextracting additional water from rivers. Alternative supplies of water mostly involve recycled waterfrom wastewater and storm water that can be used as a substitute for potable water.
FIGURE 4. Urban Water Consumption (shown as a percentage of total consumption) in Australia.Source: Chart data from ABS 2006.
Domestic 62%
Industrial and commercial 23%
Parks and Fire
fighting 5%
System losses 8% Errors 2%
7
2.3 Current Wastewater Recycling in Australia
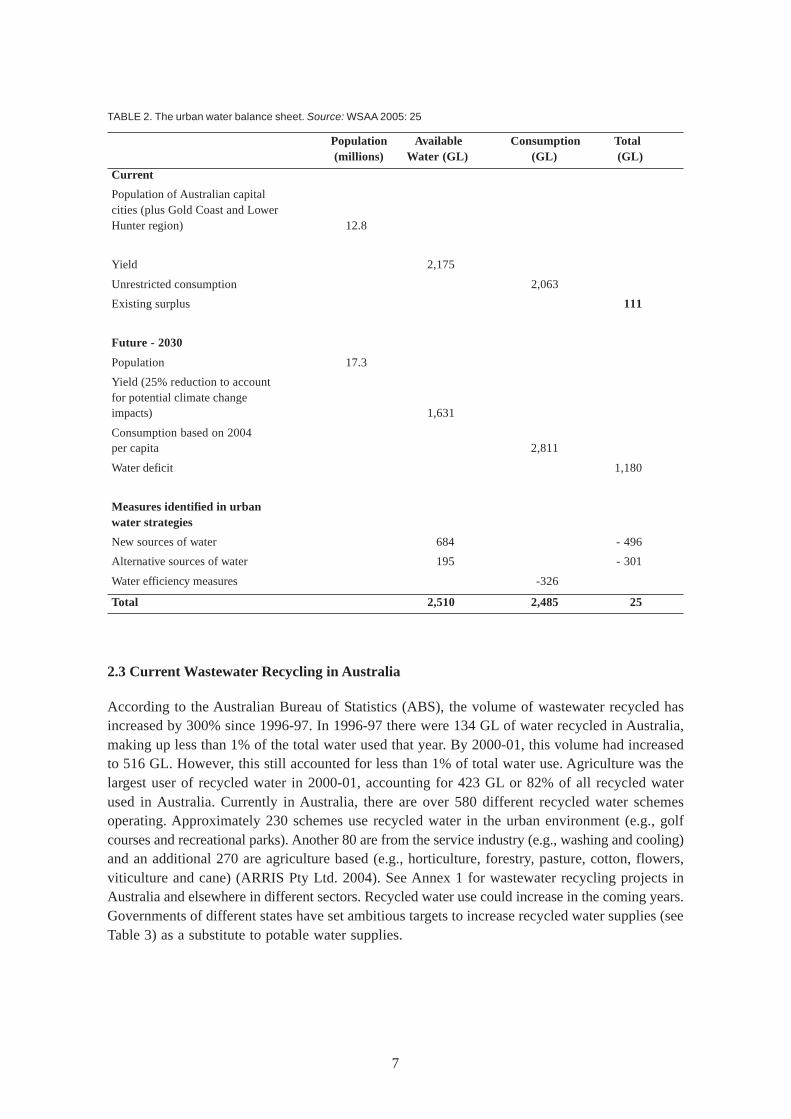
According to the Australian Bureau of Statistics (ABS), the volume of wastewater recycled hasincreased by 300% since 1996-97. In 1996-97 there were 134 GL of water recycled in Australia,making up less than 1% of the total water used that year. By 2000-01, this volume had increasedto 516 GL. However, this still accounted for less than 1% of total water use. Agriculture was thelargest user of recycled water in 2000-01, accounting for 423 GL or 82% of all recycled waterused in Australia. Currently in Australia, there are over 580 different recycled water schemesoperating. Approximately 230 schemes use recycled water in the urban environment (e.g., golfcourses and recreational parks). Another 80 are from the service industry (e.g., washing and cooling)and an additional 270 are agriculture based (e.g., horticulture, forestry, pasture, cotton, flowers,viticulture and cane) (ARRIS Pty Ltd. 2004). See Annex 1 for wastewater recycling projects inAustralia and elsewhere in different sectors. Recycled water use could increase in the coming years.Governments of different states have set ambitious targets to increase recycled water supplies (seeTable 3) as a substitute to potable water supplies.
TABLE 2. The urban water balance sheet. Source: WSAA 2005: 25
Population Available Consumption Total (millions) Water (GL) (GL) (GL)
Current
Population of Australian capitalcities (plus Gold Coast and LowerHunter region) 12.8
Yield 2,175
Unrestricted consumption 2,063
Existing surplus 111
Future - 2030
Population 17.3
Yield (25% reduction to accountfor potential climate changeimpacts) 1,631
Consumption based on 2004per capita 2,811
Water deficit 1,180
Measures identified in urbanwater strategies
New sources of water 684 - 496
Alternative sources of water 195 - 301
Water efficiency measures -326
Total 2,510 2,485 25
8
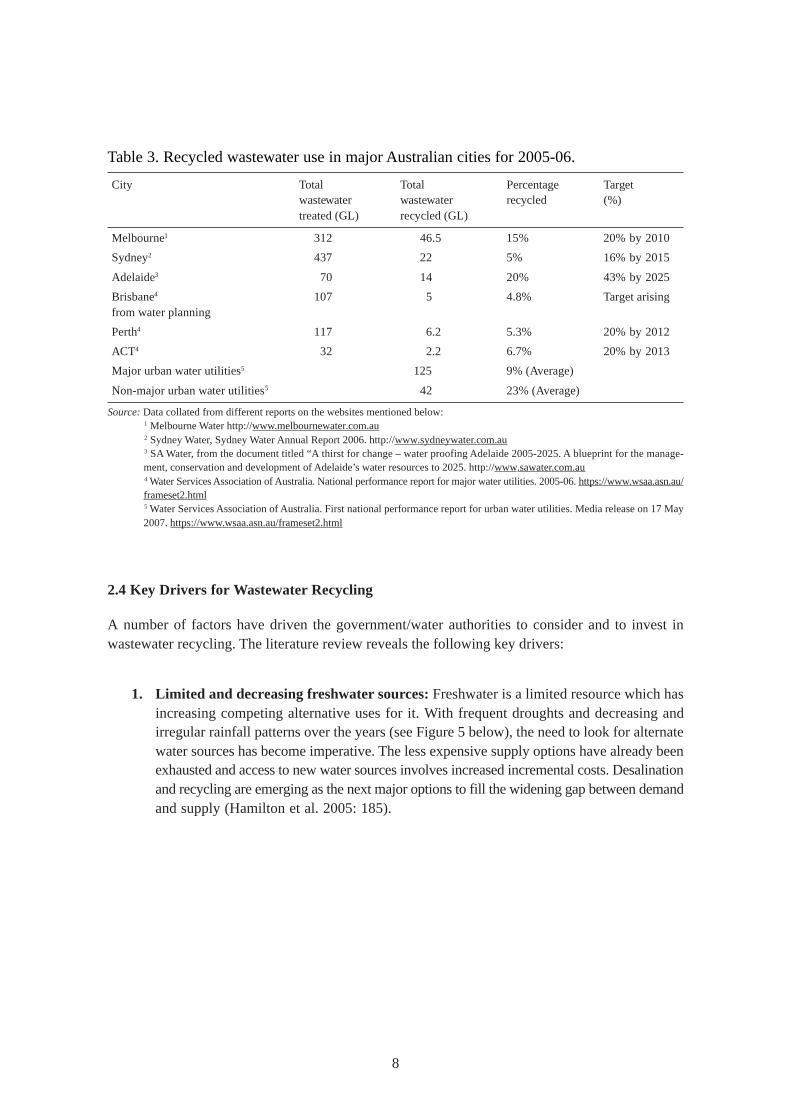
Table 3. Recycled wastewater use in major Australian cities for 2005-06.
City Total Total Percentage Targetwastewater wastewater recycled (%)treated (GL) recycled (GL)
Melbourne1 312 46.5 15% 20% by 2010
Sydney2 437 22 5% 16% by 2015
Adelaide3 70 14 20% 43% by 2025
Brisbane4 107 5 4.8% Target arisingfrom water planning
Perth4 117 6.2 5.3% 20% by 2012
ACT4 32 2.2 6.7% 20% by 2013
Major urban water utilities5 125 9% (Average)
Non-major urban water utilities5 42 23% (Average)
Source: Data collated from different reports on the websites mentioned below:1 Melbourne Water http://www.melbournewater.com.au2 Sydney Water, Sydney Water Annual Report 2006. http://www.sydneywater.com.au3 SA Water, from the document titled “A thirst for change – water proofing Adelaide 2005-2025. A blueprint for the manage-ment, conservation and development of Adelaide’s water resources to 2025. http://www.sawater.com.au4 Water Services Association of Australia. National performance report for major water utilities. 2005-06. https://www.wsaa.asn.au/frameset2.html5 Water Services Association of Australia. First national performance report for urban water utilities. Media release on 17 May2007. https://www.wsaa.asn.au/frameset2.html
2.4 Key Drivers for Wastewater Recycling
A number of factors have driven the government/water authorities to consider and to invest inwastewater recycling. The literature review reveals the following key drivers:
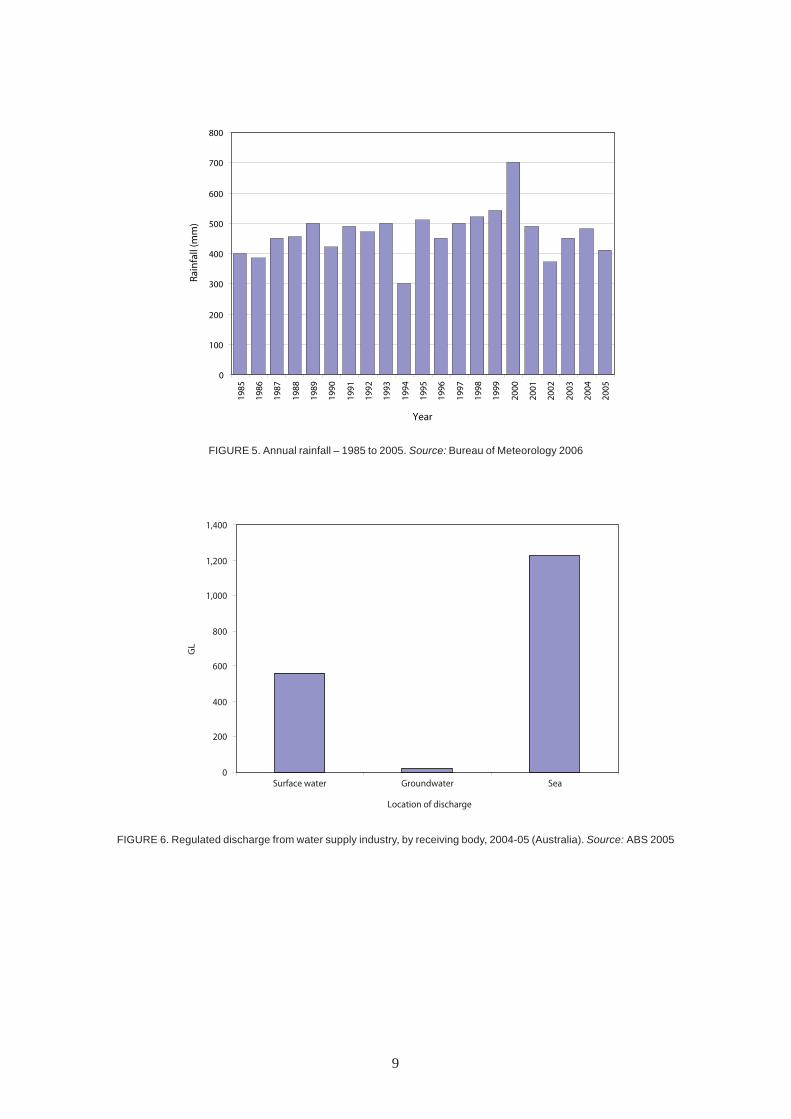
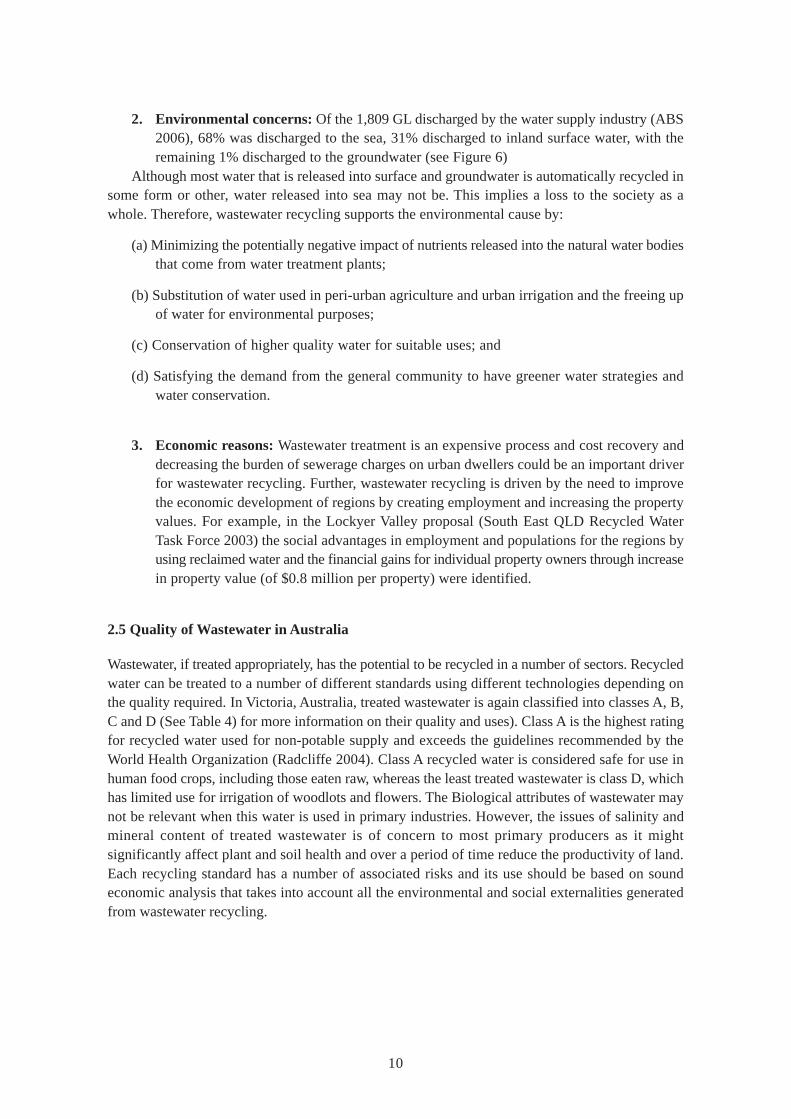
1. Limited and decreasing freshwater sources: Freshwater is a limited resource which hasincreasing competing alternative uses for it. With frequent droughts and decreasing andirregular rainfall patterns over the years (see Figure 5 below), the need to look for alternatewater sources has become imperative. The less expensive supply options have already beenexhausted and access to new water sources involves increased incremental costs. Desalinationand recycling are emerging as the next major options to fill the widening gap between demandand supply (Hamilton et al. 2005: 185).
9
FIGURE 5. Annual rainfall – 1985 to 2005. Source: Bureau of Meteorology 2006
FIGURE 6. Regulated discharge from water supply industry, by receiving body, 2004-05 (Australia). Source: ABS 2005
0
100
200
300
400
500
600
700
800
1985
1986
1987
1988
1989
1990
1991
1992
1993
1994
1995
1996
1997
1998
1999
2000
2001
2002
2003
2004
2005
Year
Rain
fall
(mm
)
0
200
400
600
800
1,000
1,200
1,400
Surface water Groundwater Sea
Location of discharge
GL
10
2. Environmental concerns: Of the 1,809 GL discharged by the water supply industry (ABS2006), 68% was discharged to the sea, 31% discharged to inland surface water, with theremaining 1% discharged to the groundwater (see Figure 6)
Although most water that is released into surface and groundwater is automatically recycled insome form or other, water released into sea may not be. This implies a loss to the society as awhole. Therefore, wastewater recycling supports the environmental cause by:
(a) Minimizing the potentially negative impact of nutrients released into the natural water bodiesthat come from water treatment plants;
(b) Substitution of water used in peri-urban agriculture and urban irrigation and the freeing upof water for environmental purposes;
(c) Conservation of higher quality water for suitable uses; and
(d) Satisfying the demand from the general community to have greener water strategies andwater conservation.
3. Economic reasons: Wastewater treatment is an expensive process and cost recovery anddecreasing the burden of sewerage charges on urban dwellers could be an important driverfor wastewater recycling. Further, wastewater recycling is driven by the need to improvethe economic development of regions by creating employment and increasing the propertyvalues. For example, in the Lockyer Valley proposal (South East QLD Recycled WaterTask Force 2003) the social advantages in employment and populations for the regions byusing reclaimed water and the financial gains for individual property owners through increasein property value (of $0.8 million per property) were identified.
2.5 Quality of Wastewater in Australia
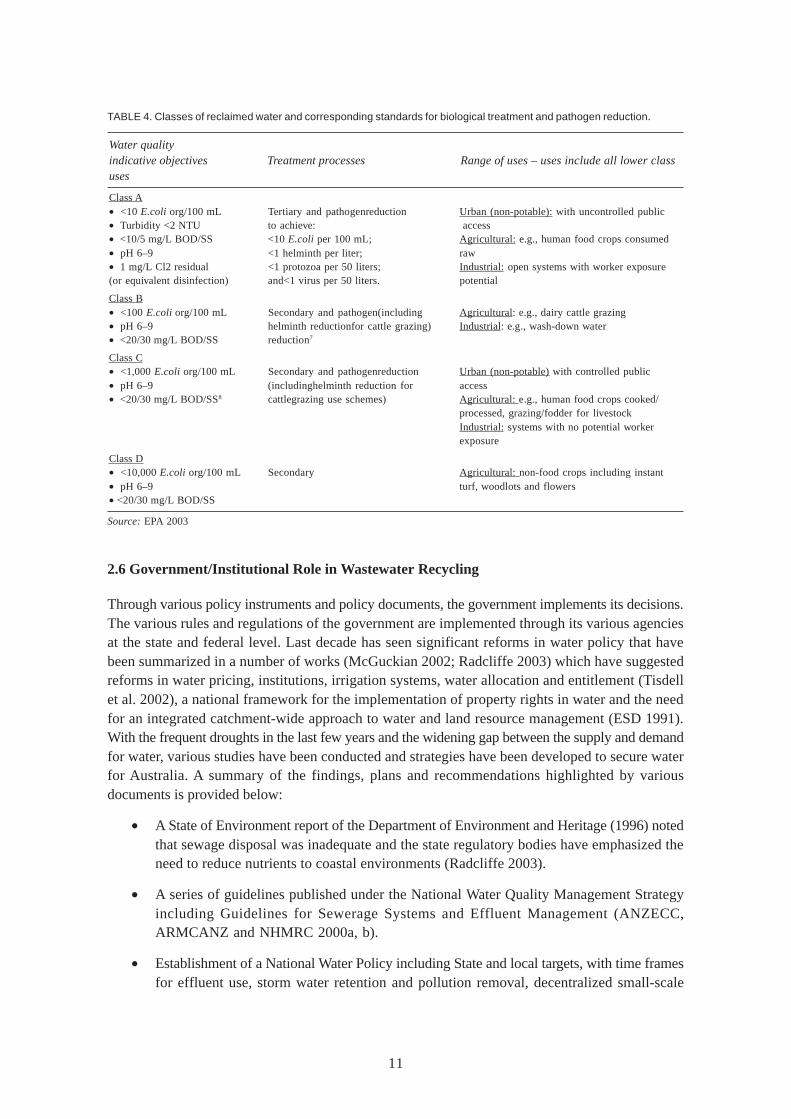
Wastewater, if treated appropriately, has the potential to be recycled in a number of sectors. Recycledwater can be treated to a number of different standards using different technologies depending onthe quality required. In Victoria, Australia, treated wastewater is again classified into classes A, B,C and D (See Table 4) for more information on their quality and uses). Class A is the highest ratingfor recycled water used for non-potable supply and exceeds the guidelines recommended by theWorld Health Organization (Radcliffe 2004). Class A recycled water is considered safe for use inhuman food crops, including those eaten raw, whereas the least treated wastewater is class D, whichhas limited use for irrigation of woodlots and flowers. The Biological attributes of wastewater maynot be relevant when this water is used in primary industries. However, the issues of salinity andmineral content of treated wastewater is of concern to most primary producers as it mightsignificantly affect plant and soil health and over a period of time reduce the productivity of land.Each recycling standard has a number of associated risks and its use should be based on soundeconomic analysis that takes into account all the environmental and social externalities generatedfrom wastewater recycling.
11
TABLE 4. Classes of reclaimed water and corresponding standards for biological treatment and pathogen reduction.
Water qualityindicative objectives Treatment processes Range of uses – uses include all lower classuses
Class A• <10 E.coli org/100 mL Tertiary and pathogenreduction Urban (non-potable): with uncontrolled public• Turbidity <2 NTU to achieve: access• <10/5 mg/L BOD/SS <10 E.coli per 100 mL; Agricultural: e.g., human food crops consumed• pH 6–9 <1 helminth per liter; raw• 1 mg/L Cl2 residual <1 protozoa per 50 liters; Industrial: open systems with worker exposure(or equivalent disinfection) and<1 virus per 50 liters. potential
Class B• <100 E.coli org/100 mL Secondary and pathogen(including Agricultural: e.g., dairy cattle grazing• pH 6–9 helminth reductionfor cattle grazing) Industrial: e.g., wash-down water• <20/30 mg/L BOD/SS reduction7
Class C• <1,000 E.coli org/100 mL Secondary and pathogenreduction Urban (non-potable) with controlled public• pH 6–9 (includinghelminth reduction for access• <20/30 mg/L BOD/SS8 cattlegrazing use schemes) Agricultural: e.g., human food crops cooked/
processed, grazing/fodder for livestockIndustrial: systems with no potential workerexposure
Class D• <10,000 E.coli org/100 mL Secondary Agricultural: non-food crops including instant• pH 6–9 turf, woodlots and flowers• <20/30 mg/L BOD/SS
Source: EPA 2003
2.6 Government/Institutional Role in Wastewater Recycling
Through various policy instruments and policy documents, the government implements its decisions.The various rules and regulations of the government are implemented through its various agenciesat the state and federal level. Last decade has seen significant reforms in water policy that havebeen summarized in a number of works (McGuckian 2002; Radcliffe 2003) which have suggestedreforms in water pricing, institutions, irrigation systems, water allocation and entitlement (Tisdellet al. 2002), a national framework for the implementation of property rights in water and the needfor an integrated catchment-wide approach to water and land resource management (ESD 1991).With the frequent droughts in the last few years and the widening gap between the supply and demandfor water, various studies have been conducted and strategies have been developed to secure waterfor Australia. A summary of the findings, plans and recommendations highlighted by variousdocuments is provided below:
• A State of Environment report of the Department of Environment and Heritage (1996) notedthat sewage disposal was inadequate and the state regulatory bodies have emphasized theneed to reduce nutrients to coastal environments (Radcliffe 2003).
• A series of guidelines published under the National Water Quality Management Strategyincluding Guidelines for Sewerage Systems and Effluent Management (ANZECC,ARMCANZ and NHMRC 2000a, b).
• Establishment of a National Water Policy including State and local targets, with time framesfor effluent use, storm water retention and pollution removal, decentralized small-scale
12
sewage treatment and reduced effluent discharge to oceans were recommended by a senateinquiry into Australia’s management of urban water (Allison et al. 2002).
• In 2004, the Victorian government released a Cabinet White Paper with the specific aim ofsecuring the supply and use of the State’s water assets over the next 50 years which includesrecycled water in Victoria’s water allocation framework.
The role of various government institutions related to wastewater recycling is as follows:
1. Environmental Protection Agency (EPA): EPA is responsible for the developing andapplying of best practice management guidelines for reclaimed water irrigation (EPA 2003).The draft guidelines are developed on a systems view of the irrigation process, incorporatinga risk management approach. Performance outcomes for thirteen critical components of arecycled water irrigation system covering the topics of reclaimed water, environmental, socialand economical factors are provided by the guidelines. For each factor, the guidelines listdesired results, probable associated risks, appropriate practices and monitoring required(Kularatne et al. 2005: 15). Every reuse scheme requires the approval of the Departmentof Human Services and the EPA and must show that appropriate safeguards are in placebefore the reuse scheme is commissioned to ensure that the water quality offered to thegrowers is ‘fit-for-purpose’. It is the role of the EPA to ensure that these guidelines areeffectively implemented. This is achieved by undertaking audits of selected reuse schemes(random or priority site basis) and maintaining a database of all schemes throughout Victoria.The EPA is also responsible for auditing and reviewing the effectiveness of these guidelines.Reviews will occur from time to time reflecting up-to-date developments on the use andmanagement of reclaimed water in Australia and overseas. For complete guidelines forVictoria visit http://www.epa.vic.gov.au/water/reuse/default.asp
2. Department of Human Services (DHS): DHS is responsible for ensuring that Class Areuse schemes do not pose a risk to public health. Given the potential lack of exposure‘barriers’ in Class A schemes DHS involvement is to ensure that treatment plants produceClass A reclaimed water. Unless Class A reclaimed water uses involve variations from thisguideline, the DHS is not required to endorse the aspects of an EIP dealing with end-use.As such, the treatment plant commissioning and water quality verification aspects of ClassA schemes must be referred to the DHS for endorsement, prior to submission to the EPA,Victoria, for sign-off.
3. Council/local government: Councils control development zoning, minimum subdivision size,infrastructure size, infrastructure provision, and land use controls. Depending upon theselected application of the recycled water, a large recycled water development requiresapproval from the council for setting up/construction of the required infrastructure forrecycling. Developments like farm forestry, aquaculture and structures for cut flowers requiredevelopment consent from the council.
13
2.7 Social Aspects of Wastewater Recycling
1. Yuck factor
The “yuck” factor or disgust in psychological terms is defined as the emotional discomfort generatedfrom close contact with certain unpleasant stimuli (Angyal 1941). The general community has openlyacknowledged that there is a psychological barrier to using recycled water on many occasions(Melbourne Water 1998; Kaercher et al. 2003). According to the law of contagion (Rozin and Fallon1987) any neutral object through brief contact with another object (e.g., hair in soup) may acquiredisgusting properties. Therefore, regardless of the highest treatment of the wastewater, people maystill perceive the water to be disgusting because the water has been in contact with human wasteswhich results in disgusting stimuli. Also, Frewer et al. (1998) stated that people use their moraland social values known as outrage factors to evaluate situations. Based on these outrage factors,Po et al. (2004) suggests that people may perceive wastewater too risky to use because (1) the useof this water source is not natural; (2) it may be harmful to people; (3) there might be unknownfuture consequences; (4) their decision to recycle water may be irreversible; and (5) that the qualityand safety of the water is not within their control.
Studies conducted by Bruvold (1988), ARCWIS (2002) and Sydney Water (1999) showed thatthe closer the recycled water is to human contact or ingestion, the more people are opposed to usingthe water. Reuse decreased substantially as the use moved from public areas to inside the home,and from toilet flushing, laundry, bathroom and kitchen uses to drinking. Introducing recycled wateron low or non-human contact use and gradually moving along the contact continuum is expectedto increase the acceptability of recycled water.
2. Acceptability of wastewater by the primary producers
Scarcity of water is assumed to trigger the demand for recycled water. However, according toKularatne et al. (2005: 17) the presence or absence of water is only one dimension of the problemand wastewater recycling is influenced by a number of other factors like – the volume of wateravailable relative to existing supply, the timing of availability, the consistency and quality of supplyand the desire of suitably skilled and knowledgeable people to invest. In addition to this Kularatneet al. (2005: 19) present a number of social aspects that influence the primary producers’/landholders’decision to accept wastewater recycling which are as follows:
• Landholder’s aspirations for their properties: The goals of the families of primary producersare varied and may include financial security, environmental improvement, social approvaland personal ethical standards. The dynamic social setting of a region is also supposed toplay an important role in the adoption of new technologies and all the “bigger decisions”by farmers (Pannell et al. 2005). Real estate prices and the increasing demand for landsuited to lifestyle choices and not production will also influence landholders’ aspirationsfor their properties.
• Landholder’s capacity to change: Doyle and Johnson (2005) found that farmers with a higherrisk tolerant attitude and flexibility to building farm equity may be more open to adoptingnew technologies for water use efficiency. According to them farmers adopt new technologiesunder these scenarios namely – adoption will provide measurable benefit; interventions arein place to overcome any barriers that a farmer might face; mechanisms are used to alter
14
the operating environment so that the consequences of adoption are preferable to theconsequences of non-adoption. A detailed analysis of how recycled water might changeexisting farm management operations and business planning might be essential to revealthe capacity for changing practices and associated resource use. While contemplating a majorchange in the farming system, the landholder will actively seek information. The more seriousthe consequences of a new practice, the stronger the need for information and confidenceabout the outcomes (Pannell et al. 2005). Kularatne et al. (2005: 19) conclude that farmers’decisions to change production management or practices will be based on a complex andinterwoven series of contextual issues that span personal, family, economic and social goals.
• Landholder’s willingness to use recycled water: Adoption is based on subjective perceptionor expectations rather than on objective truth (Pannell et al. 2005). The Virginia pipelineScheme, north of Adelaide initially faced significant customer resistance to paying the fullcost of recycled water and government equity effectively subsidized those that pioneeredshifts in water use. As the customer confidence in the scheme increased, the pricing structurefor the water has been altered to reflect the true cost of providing the resource to thecustomer. Farmer’s confidence in production yield and quality, income security, andcontractual supply chain issues may be more important than the potential for windfall gainsor high marginal returns. Incentives in the form of pricing, education and trainingmechanisms are important introductory measures that assist with promotion of userconfidence.
• Landholder’s economic considerations: The economic drivers for using recycled water andthe economic impact it can make on individual farms can vary according to the scale offarm production (i.e., small versus medium and large operations). In some cases, largerthe scales of operation, greater are the production benefits from new systems or technology.Whereas in some cases, it may be beneficial for small or medium scale businesses to adoptrecycled water due to the lower impact of the overall on-farm infrastructure cost comparedto more extensive operations. Smaller scale operations may also limit costly negativeexternalities. However, more research is required in this regard, since the exact on-farmeconomic impact of using recycled water for individual farm businesses is currently unclear.
2.8 Costs of Recycling
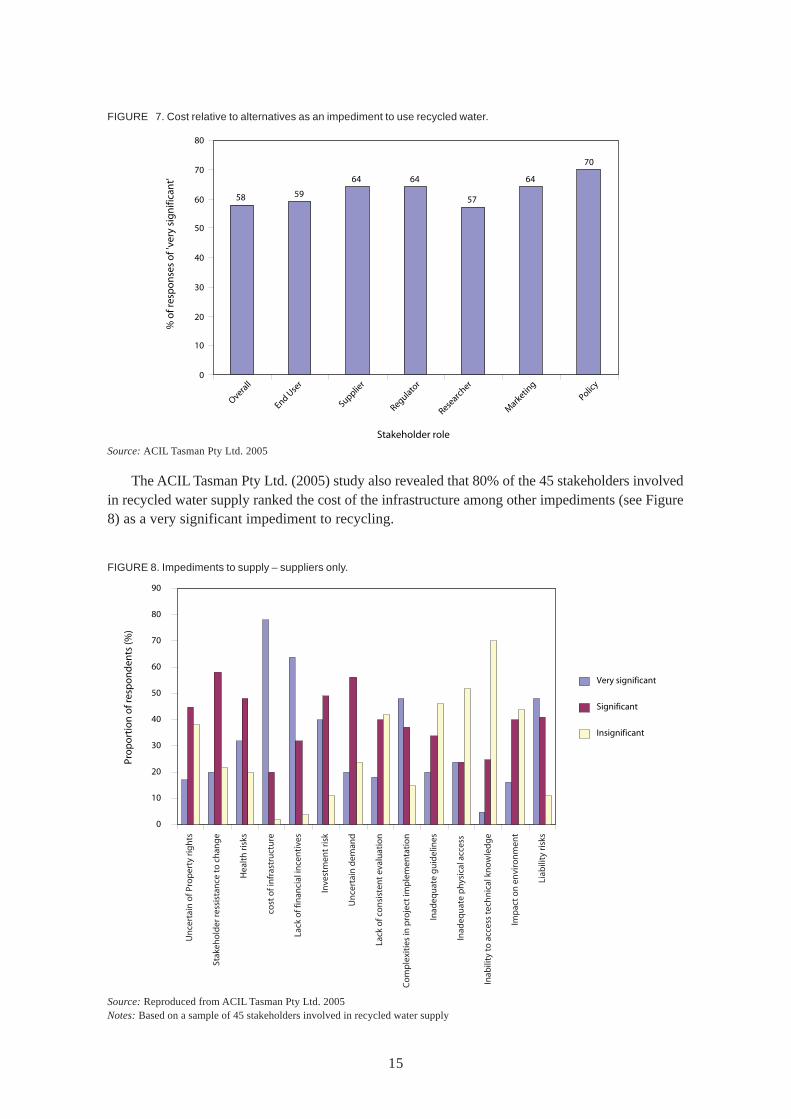
The absolute as well as the relative cost of supply of recycled water to the suppliers and to the enduser are important components for the overall implementation and success of recycle water projects.In a research carried out by ACIL Tasman Pty Ltd. (2005) for the Australian government, 58% ofrespondents believe that the issue is “very significant” as an impediment to the use of recycledwater, while only 13% believe it is “insignificant” (see Figure 7). The demand for recycled wateruse is influenced by not only cost of supply of recycled water alone but also the relative cost ofalternative sources of water.
15
0
10
20
30
40
50
60
70
80
90
Pro
po
rtio
n o
f res
po
nd
ents
(%)
Very significant
Significant
Insignificant
Un
cert
ain
of P
rop
erty
rig
hts
Stak
eho
lder
ress
ista
nce
to
ch
ang
e
Hea
lth
risk
s
cost
of i
nfr
astr
uct
ure
Lack
of f
inan
cial
ince
nti
ves
Inve
stm
ent
risk
Un
cert
ain
dem
and
Lack
of c
on
sist
ent
eval
uat
ion
Co
mp
lexi
ties
in p
roje
ct im
ple
men
tati
on
Inad
equ
ate
gu
idel
ines
Inad
equ
ate
ph
ysic
al a
cces
s
Inab
ility
to
acc
ess
tech
nic
al k
no
wle
dg
e
Imp
act
on
en
viro
nm
ent
Liab
ility
risk
s
FIGURE 7. Cost relative to alternatives as an impediment to use recycled water.
Source: ACIL Tasman Pty Ltd. 2005
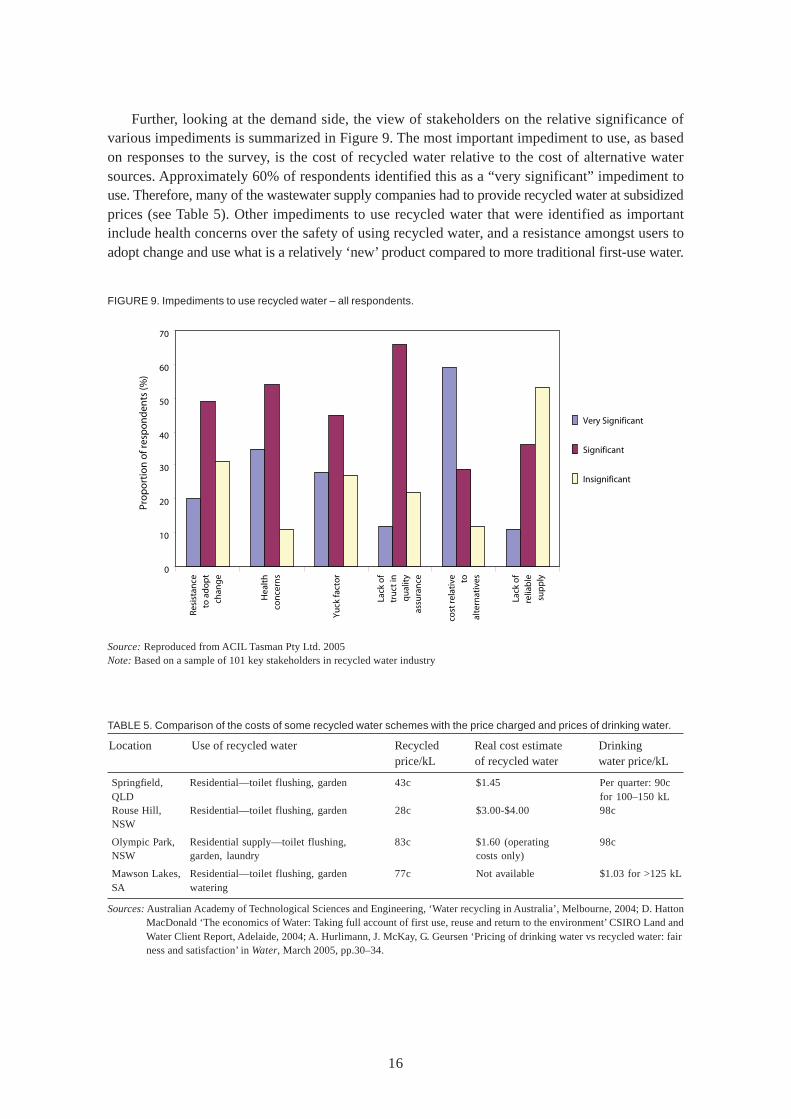
The ACIL Tasman Pty Ltd. (2005) study also revealed that 80% of the 45 stakeholders involvedin recycled water supply ranked the cost of the infrastructure among other impediments (see Figure8) as a very significant impediment to recycling.
FIGURE 8. Impediments to supply – suppliers only.
Source: Reproduced from ACIL Tasman Pty Ltd. 2005Notes: Based on a sample of 45 stakeholders involved in recycled water supply
58 59
64 64
57
64
70
0
10
20
30
40
50
60
70
80
Overall
End Use
r
Supplier
Regulator
Researc
her
Mark
eting
Policy
Stakeholder role
% o
f res
po
nse
s o
f 've
ry s
ign
ifica
nt'
16
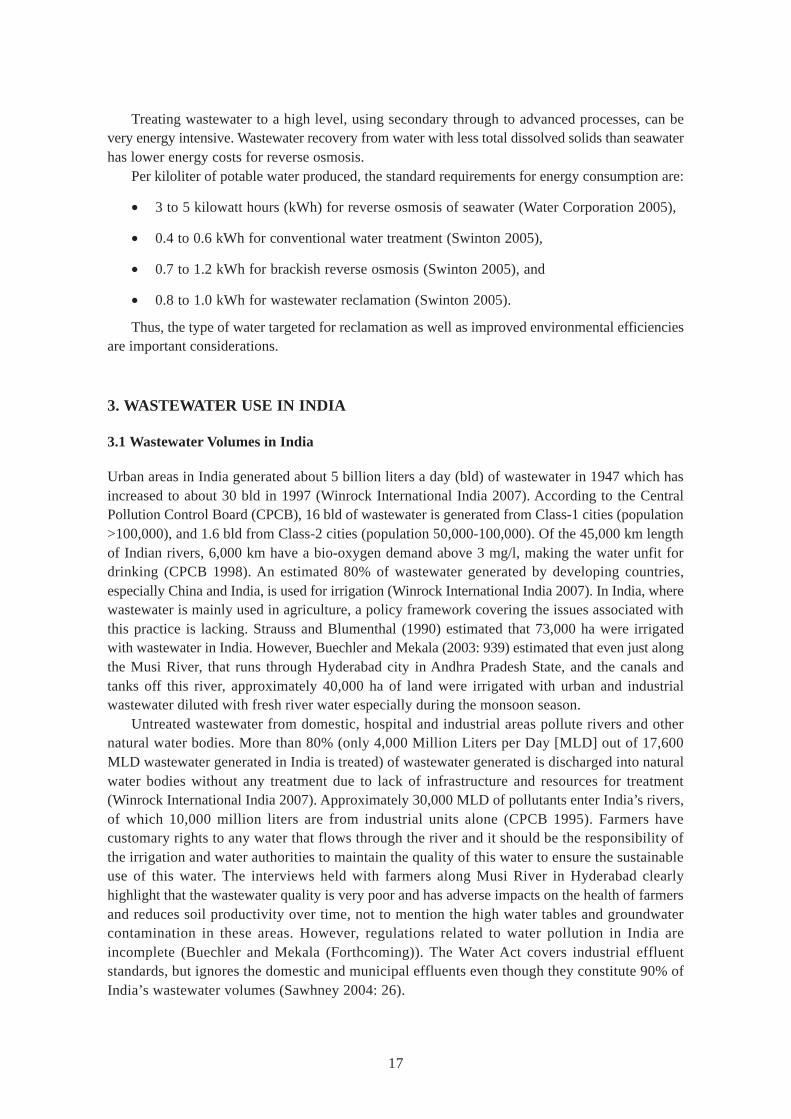
Further, looking at the demand side, the view of stakeholders on the relative significance ofvarious impediments is summarized in Figure 9. The most important impediment to use, as basedon responses to the survey, is the cost of recycled water relative to the cost of alternative watersources. Approximately 60% of respondents identified this as a “very significant” impediment touse. Therefore, many of the wastewater supply companies had to provide recycled water at subsidizedprices (see Table 5). Other impediments to use recycled water that were identified as importantinclude health concerns over the safety of using recycled water, and a resistance amongst users toadopt change and use what is a relatively ‘new’ product compared to more traditional first-use water.
FIGURE 9. Impediments to use recycled water – all respondents.
Source: Reproduced from ACIL Tasman Pty Ltd. 2005Note: Based on a sample of 101 key stakeholders in recycled water industry
TABLE 5. Comparison of the costs of some recycled water schemes with the price charged and prices of drinking water.
Location Use of recycled water Recycled Real cost estimate Drinkingprice/kL of recycled water water price/kL
Springfield, Residential—toilet flushing, garden 43c $1.45 Per quarter: 90cQLD for 100–150 kLRouse Hill, Residential—toilet flushing, garden 28c $3.00-$4.00 98cNSW
Olympic Park, Residential supply—toilet flushing, 83c $1.60 (operating 98cNSW garden, laundry costs only)
Mawson Lakes, Residential—toilet flushing, garden 77c Not available $1.03 for >125 kLSA watering
Sources: Australian Academy of Technological Sciences and Engineering, ‘Water recycling in Australia’, Melbourne, 2004; D. Hatton MacDonald ‘The economics of Water: Taking full account of first use, reuse and return to the environment’ CSIRO Land and Water Client Report, Adelaide, 2004; A. Hurlimann, J. McKay, G. Geursen ‘Pricing of drinking water vs recycled water: fair ness and satisfaction’ in Water, March 2005, pp.30–34.
0
10
20
30
40
50
60
70
Resi
stan
ceto
ad
op
tch
ang
e
Hea
lth
con
cern
s
Yu
ck fa
cto
r
Lack
of
tru
ct in
qu
alit
yas
sura
nce
cost
rela
tive to
alte
rnat
ives
Lack
of
relia
ble
sup
ply
Pro
po
rtio
n o
f res
po
nd
ents
(%)
Very Significant
Significant
Insignificant
17
Treating wastewater to a high level, using secondary through to advanced processes, can bevery energy intensive. Wastewater recovery from water with less total dissolved solids than seawaterhas lower energy costs for reverse osmosis.
Per kiloliter of potable water produced, the standard requirements for energy consumption are:
• 3 to 5 kilowatt hours (kWh) for reverse osmosis of seawater (Water Corporation 2005),
• 0.4 to 0.6 kWh for conventional water treatment (Swinton 2005),
• 0.7 to 1.2 kWh for brackish reverse osmosis (Swinton 2005), and
• 0.8 to 1.0 kWh for wastewater reclamation (Swinton 2005).
Thus, the type of water targeted for reclamation as well as improved environmental efficienciesare important considerations.
3. WASTEWATER USE IN INDIA
3.1 Wastewater Volumes in India
Urban areas in India generated about 5 billion liters a day (bld) of wastewater in 1947 which hasincreased to about 30 bld in 1997 (Winrock International India 2007). According to the CentralPollution Control Board (CPCB), 16 bld of wastewater is generated from Class-1 cities (population>100,000), and 1.6 bld from Class-2 cities (population 50,000-100,000). Of the 45,000 km lengthof Indian rivers, 6,000 km have a bio-oxygen demand above 3 mg/l, making the water unfit fordrinking (CPCB 1998). An estimated 80% of wastewater generated by developing countries,especially China and India, is used for irrigation (Winrock International India 2007). In India, wherewastewater is mainly used in agriculture, a policy framework covering the issues associated withthis practice is lacking. Strauss and Blumenthal (1990) estimated that 73,000 ha were irrigatedwith wastewater in India. However, Buechler and Mekala (2003: 939) estimated that even just alongthe Musi River, that runs through Hyderabad city in Andhra Pradesh State, and the canals andtanks off this river, approximately 40,000 ha of land were irrigated with urban and industrialwastewater diluted with fresh river water especially during the monsoon season.
Untreated wastewater from domestic, hospital and industrial areas pollute rivers and othernatural water bodies. More than 80% (only 4,000 Million Liters per Day [MLD] out of 17,600MLD wastewater generated in India is treated) of wastewater generated is discharged into naturalwater bodies without any treatment due to lack of infrastructure and resources for treatment(Winrock International India 2007). Approximately 30,000 MLD of pollutants enter India’s rivers,of which 10,000 million liters are from industrial units alone (CPCB 1995). Farmers havecustomary rights to any water that flows through the river and it should be the responsibility ofthe irrigation and water authorities to maintain the quality of this water to ensure the sustainableuse of this water. The interviews held with farmers along Musi River in Hyderabad clearlyhighlight that the wastewater quality is very poor and has adverse impacts on the health of farmersand reduces soil productivity over time, not to mention the high water tables and groundwatercontamination in these areas. However, regulations related to water pollution in India areincomplete (Buechler and Mekala (Forthcoming)). The Water Act covers industrial effluentstandards, but ignores the domestic and municipal effluents even though they constitute 90% ofIndia’s wastewater volumes (Sawhney 2004: 26).
18
3.2 Wastewater Market
Pollution of both surface and groundwater sources and its associated problems, constitute one ofthe biggest environmental problems of India. A report by Winrock International India (2007) statesthat the market for adoption of advanced technologies for wastewater use arising from industriesand municipal corporations accounts for the largest percentage of the total environmental marketin India. A survey by the US Trade department reveals that the total market potential for water andwastewater treatment including the requirements of Municipal and Industrial sectors is estimatedat US$900 million and is expected to grow at approximately 14% each year in the mid-term (SwissBusiness Hub India & Heinz Habegger, Baleco AG, Thun 2004). The survey further states thatindustrial wastewater treatment accounts for nearly half of the total market size for treatment. Thewater and wastewater treatment sector also accounts for the highest environmental spending withinboth the public and private sectors. Considering the fact that conventional treatment techniques areextremely expensive for countries like India, there is an urgent need for alternate methods of treatmentand recycling of wastewater.
3.3 Wastewater Reuse
In India, since wastewater is mainly untreated, it is used in the agricultural sector where the risksare considerably lower to using it in households or industry. From literature review and personalexperience in this area, one can state that untreated and partially treated wastewater released fromthe major cities of India like New Delhi, Mumbai, Bangalore, Kolkata, Hyderabad, Ahmedabad,etc., is mainly used for irrigation of the following crops:
• Cereals: In Hyderabad, along the Musi River about 2,100 ha of land is irrigated withwastewater to cultivate paddy (Mekala 2006). In Ahmedabad and Kapur, wheat isextensively irrigated with wastewater (Winrock International India 2007).
• Vegetables: In New Delhi, about 12,000 farmers use treated wastewater in areas aroundKeshopur STP and Okhla STP to irrigate 1,700 ha of land to grow vegetables like Cucurbits,eggplant, okra, and coriander in the summers; Spinach, mustard, cauliflower, and cabbagein the winters (Winrock International India 2007). In Hyderabad, about thirteen differentkinds of vegetables are grown with wastewater all year round which include spinach, malabarspinach, amaranths, gogu (Hibiscus cannabinus), mint, coriander, bladder dock, okra,colocasia, soya (Glycine max), common purslane and chennangi (Lagerstroemia parviflora).
• Flowers: Farmers in Kanpur grow roses and marigold with wastewater. In Hyderabad, thefarmers cultivating Jasmine through wastewater generates a lot of employment. The jasmineplantation produces flowers for 8-9 months per year and a 118 farmers can earnapproximately Rs. 15,000 to Rs. 20,000 per ha for an 8-9 month flowering season (Buechleret al. 2002).
• Avenue trees and parks: In Hyderabad, secondary treated wastewater is used to irrigatepublic parks and avenue trees.
• Fodder crops: In Hyderabad, along the Musi River about 10,000 ha of land is irrigatedwith wastewater to cultivate para grass, a kind of fodder grass (Mekala 2006).
19
• Aquaculture: The East Calcutta sewage fisheries are the largest single wastewater usesystem in aquaculture in the world (Pescod 1992). The wetland ecosystem of Kolkatasupports 100,000 direct stakeholders and 5,100 ha of cultivation. Annually, it provides directemployment for about 70,000 people, produces 128,000 quintals of paddy, 69,000 quintalsof fish and 7.3 quintals of vegetables (Chattopadhyay 2004).
• Agroforestry: In the villages near Hubli-Dharwad in Karnataka, the main wastewater-irrigated agroforestry land uses are orchards and agrosilviculture which consists of spatiallymixed tree–crop combinations (Bradford et al. 2003). The two most important tree speciesare sapota and guava, and other common species are coconut, mango, arecanut and teak.Species found on farm boundaries include neem, tamarind, coconut and teak. Other lesscommon species are banana, ramphal, curry leaf, pomegranate, lemon, galimara andmulberry. In agrosilviculture, field crops grown include irrigated groundnut in the dry seasonand sorghum in the kharif season. Many adaptations of the agrosilviculture system wereobserved. Farmers in Budarsingi and Katnur villages also identified vigorous weed growthas the main constraint to agroforestry.
Treated wastewater can be used for various industrial uses such as in cooling towers, boilers,washing the work spaces, etc., if adequately treated, depending upon its availability and location.Chennai is a pioneer in such wastewater reuse in India (YUVA, Mumbai. 2005).
3.4 Implications of Wastewater Reuse
There are both positive and negative implications of wastewater reuse. The positive implicationsinclude: employment generation, food security for urban and peri-urban poor farmers, reliable supplyof irrigation water and the recycling of nutrients in wastewater. Since wastewater is available allyear round, the urban poor farmers and migrant laborers are assured of employment throughoutthe year. In the peri-urban areas along Musi, Hyderabad, it was found that wastewater-irrigatedpaddy contributes almost 43% of household food consumption (Buechler and Mekala 2005). Thehigh nutrient content of the wastewater helps farmers save on the fertilizer costs and its reliablesupply helps increase the cropping intensity. Wastewater can also have a positive or negative impacton the property values. In Haroonabad, in Pakistan, the wastewater-irrigated land has a higher valuethan the canal-irrigated land (Hussain et al. 2001).
On the other hand, because of the partial or no treatment of wastewater, it endangers the verylivelihoods it generates over the long term. Long-term use of wastewater for irrigation increasessoil salinity, accumulation of heavy metals in the soil, and finally breakdown of the soil structure.This in turn leads to restriction on crop choice and reduction in yields over the long run. Along theMusi River near Hyderabad, where wastewater is drawn from the river for irrigation, the paddy(rice) production has reduced by 40-50%. Ample evidences are available which show that thegroundwater in all wastewater irrigated areas has high salt levels and is unfit for drinking. Further,high groundwater tables and waterlogging are also common features of these areas. Wastewatercontains a number of pathogens of which human parasites such as protozoa and helminth eggs areof special significance which can cause diseases in user communities and consumers. Further,wastewater containing a high level of nutrients may cause eutrophication and cause imbalances inthe ecology of the water bodies, it is released into.

20
In addition, a number of social concerns like impaired quality of life, loss of property value,food safety, health and welfare and sustainability of land use are associated with wastewater use(Hussain et al. 2001).
3.5 Water Markets and Potential of Wastewater
The price of water, just as other commodities, can be determined using the demand and supplycurves. Figure 10 shows the supply curve (S) and demand curve (D) for water and their point ofintersection gives the quantity of water (Q) that should be supplied at price P under normal marketconditions with no government interventions. Whenever, there is a scarcity of water due to higherdemand or lower rainfall or when the government decides to conserve water for future use, it needsto reduce the present supply (from Q to Q’). Accordingly, P’ gives the scarcity price of water. Toreduce the gap between supply and demand, water boards and communities are exploring a numberof alternate water options to complement the existing urban water supplies which include –wastewater recycling, rainwater harvesting, storm water recycling, exploring new groundwatersources, diverting agriculture water to cities and the construction of new dams. If any or acombination of these sources are tapped, the supply curve will move towards the right (S”) and theurban people can pay a lesser price, P”. Wastewater if treated to appropriate levels has a hugepotential to complement the existing water sources and bring down the price from P’ to P”. However,the costs of treatment need to be deducted from the benefits to realize the net profit from recycling.
FIGURE 10. Water markets: demand and supply curves.
D
S
P
Q
P’
P”
S”
S’
Q”Q’
21
3.6 Urban water pricing
Urban water pricing has the following components:
1. Cost of water supply: In most OECD (Organisation for Economic Co-operation andDevelopment) countries and in the USA water pricing is based on average cost pricing ormarginal cost pricing. The consumers are charged at the rate of per kiloliter of waterconsumed. This rate varies depending on the pricing structure in each city.
2. Cost of maintenance of sewerage services: In most cities around the world, the water boardsare also responsible for maintaining the sewerage system and consumers are charged forthis service. In Hyderabad, 35% of water supply charge is charged as sewerage cess. InNew Delhi, 50% of water supply charge is charged as sewerage cess.
3. Cost of treatment of sewage water or wastewater discharged by households and industries:Urban consumers in none of the Indian cities are charged for treatment of sewage. However,most of the developed countries have introduced the “polluter pays principle” for the amountof water pollution load discharged by companies and wastewater treatment charges are fullyrecovered from the urban consumers as well.
4. Service charge: In India, in most cities, a minimum service charge is included in the waterbill.
In India water is a highly subsidized commodity leading to market inefficiencies and henceinefficient use of the already scarce resource. The water subsidy in the urban areas has importantconsequences for the poor and the environment. The urban water authorities, usually known asWater Supply and Sewerage Boards, are responsible for the city’s water supply and sewerageservices. Since urban water is subsidized, these institutions constantly incur losses and have nofunds to invest in repairs and maintenance of existing water supply infrastructure, wastewatertreatment and expansion of their services. Another important consequence of urban water subsidiesis that the urban water consumers and polluters are not charged for sewerage treatment and hencein most developing countries, only 20-30% of wastewater is treated to secondary level.
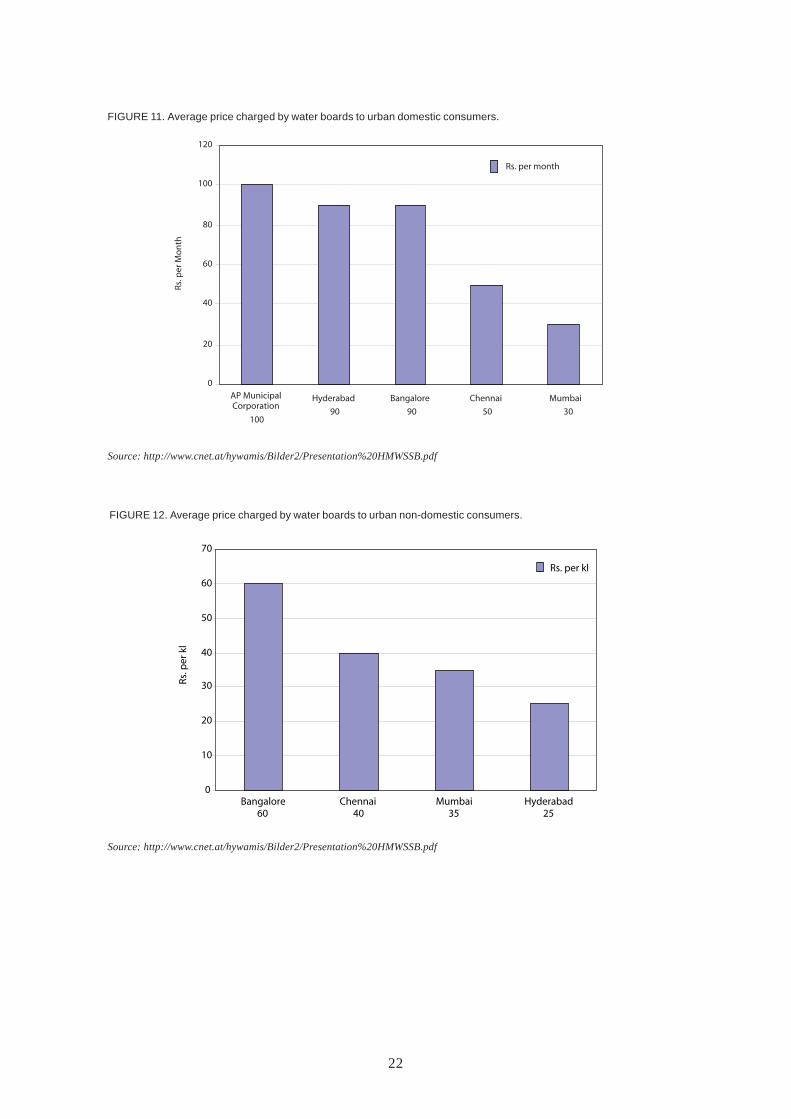
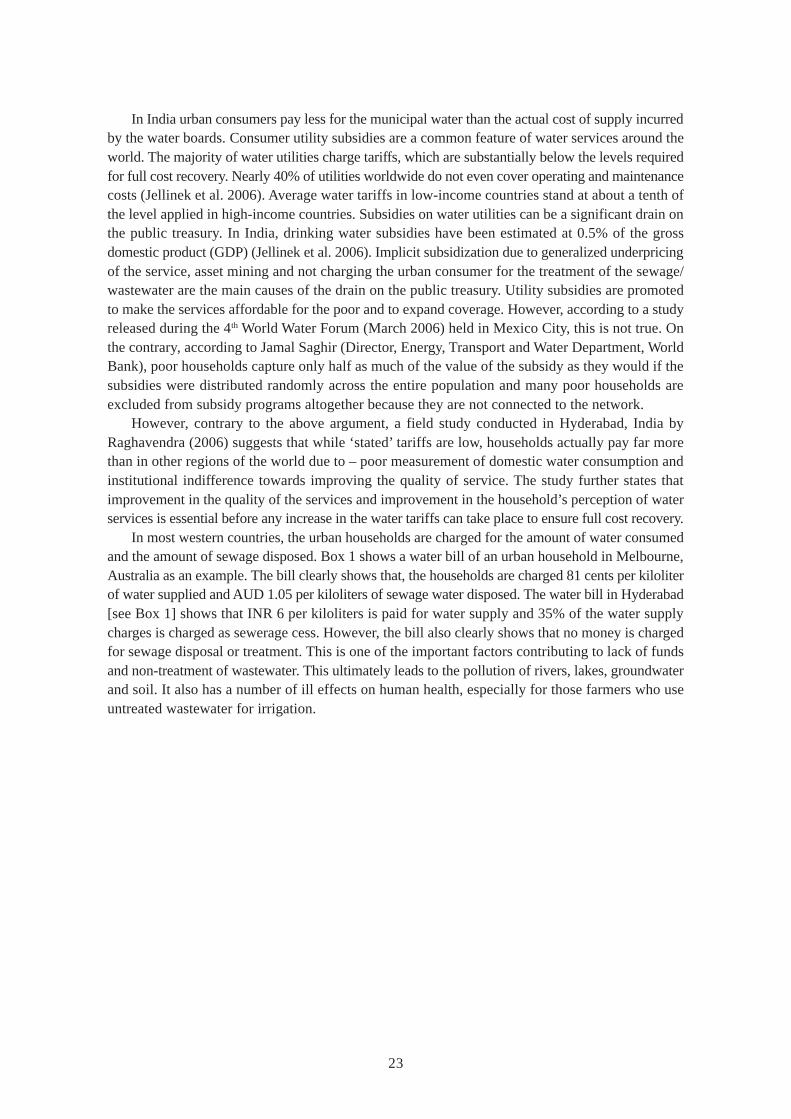
Figure 11 shows the average price charged by water boards to urban domestic consumers inthe major cities of India – Delhi, Kolkata, Bangalore, Chennai and Hyderabad. The average costincurred by the water boards to supply water in most metropolitan cities ranges from Rs. 10 to 35per kl and the price charged to urban domestic consumers ranges from Rs. 6 to 36 per kl dependingon the volume consumed. The price for non-domestic consumers varies from Rs. 20-100 per kldepending on the volume consumed and the type of industry (see Figure 12).
22
FIGURE 11. Average price charged by water boards to urban domestic consumers.
FIGURE 12. Average price charged by water boards to urban non-domestic consumers.
Source: http://www.cnet.at/hywamis/Bilder2/Presentation%20HMWSSB.pdf
Source: http://www.cnet.at/hywamis/Bilder2/Presentation%20HMWSSB.pdf
0
20
40
60
80
100
120
Rs. p
er M
on
thRs. per month
10090 90 50 30
AP Municipal Corporation
Hyderabad Bangalore Chennai Mumbai
0
10
20
30
40
50
60
70
Rs.
per
kl
Rs. per kl
60 40 35 25Bangalore Chennai Mumbai Hyderabad
23
In India urban consumers pay less for the municipal water than the actual cost of supply incurredby the water boards. Consumer utility subsidies are a common feature of water services around theworld. The majority of water utilities charge tariffs, which are substantially below the levels requiredfor full cost recovery. Nearly 40% of utilities worldwide do not even cover operating and maintenancecosts (Jellinek et al. 2006). Average water tariffs in low-income countries stand at about a tenth ofthe level applied in high-income countries. Subsidies on water utilities can be a significant drain onthe public treasury. In India, drinking water subsidies have been estimated at 0.5% of the grossdomestic product (GDP) (Jellinek et al. 2006). Implicit subsidization due to generalized underpricingof the service, asset mining and not charging the urban consumer for the treatment of the sewage/wastewater are the main causes of the drain on the public treasury. Utility subsidies are promotedto make the services affordable for the poor and to expand coverage. However, according to a studyreleased during the 4th World Water Forum (March 2006) held in Mexico City, this is not true. Onthe contrary, according to Jamal Saghir (Director, Energy, Transport and Water Department, WorldBank), poor households capture only half as much of the value of the subsidy as they would if thesubsidies were distributed randomly across the entire population and many poor households areexcluded from subsidy programs altogether because they are not connected to the network.
However, contrary to the above argument, a field study conducted in Hyderabad, India byRaghavendra (2006) suggests that while ‘stated’ tariffs are low, households actually pay far morethan in other regions of the world due to – poor measurement of domestic water consumption andinstitutional indifference towards improving the quality of service. The study further states thatimprovement in the quality of the services and improvement in the household’s perception of waterservices is essential before any increase in the water tariffs can take place to ensure full cost recovery.
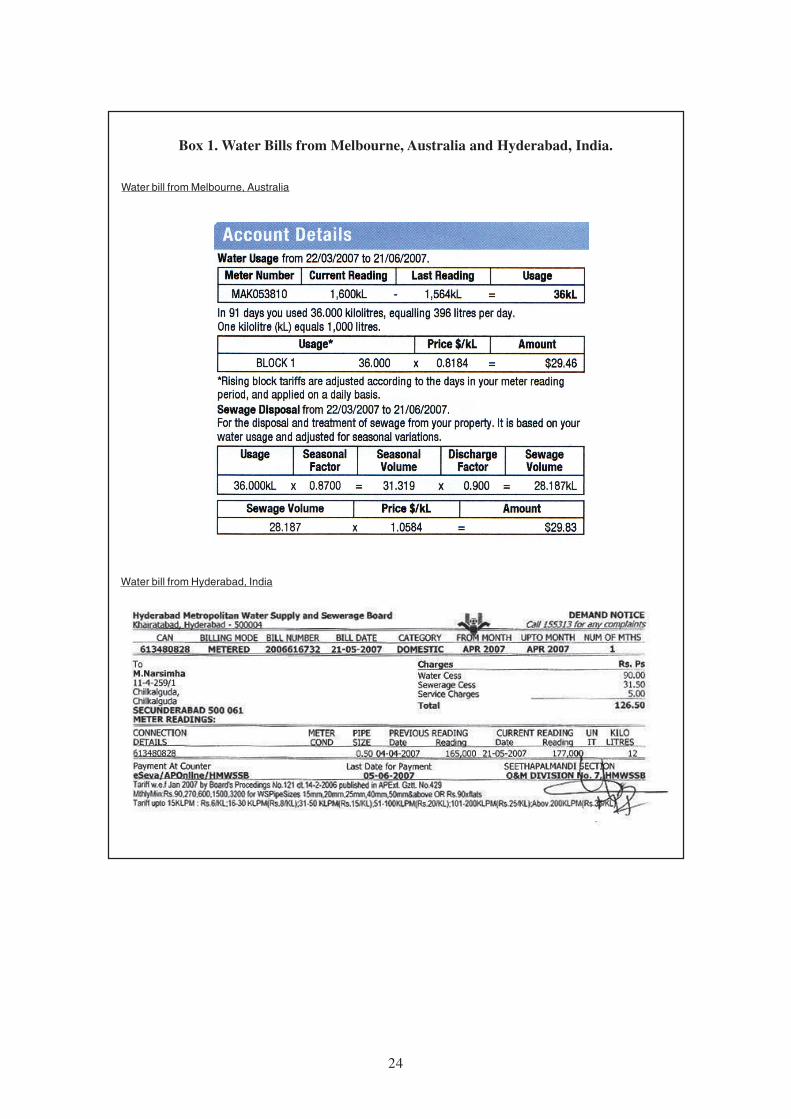
In most western countries, the urban households are charged for the amount of water consumedand the amount of sewage disposed. Box 1 shows a water bill of an urban household in Melbourne,Australia as an example. The bill clearly shows that, the households are charged 81 cents per kiloliterof water supplied and AUD 1.05 per kiloliters of sewage water disposed. The water bill in Hyderabad[see Box 1] shows that INR 6 per kiloliters is paid for water supply and 35% of the water supplycharges is charged as sewerage cess. However, the bill also clearly shows that no money is chargedfor sewage disposal or treatment. This is one of the important factors contributing to lack of fundsand non-treatment of wastewater. This ultimately leads to the pollution of rivers, lakes, groundwaterand soil. It also has a number of ill effects on human health, especially for those farmers who useuntreated wastewater for irrigation.
24
Box 1. Water Bills from Melbourne, Australia and Hyderabad, India.
Water bill from Melbourne, Australia
Water bill from Hyderabad, India
25
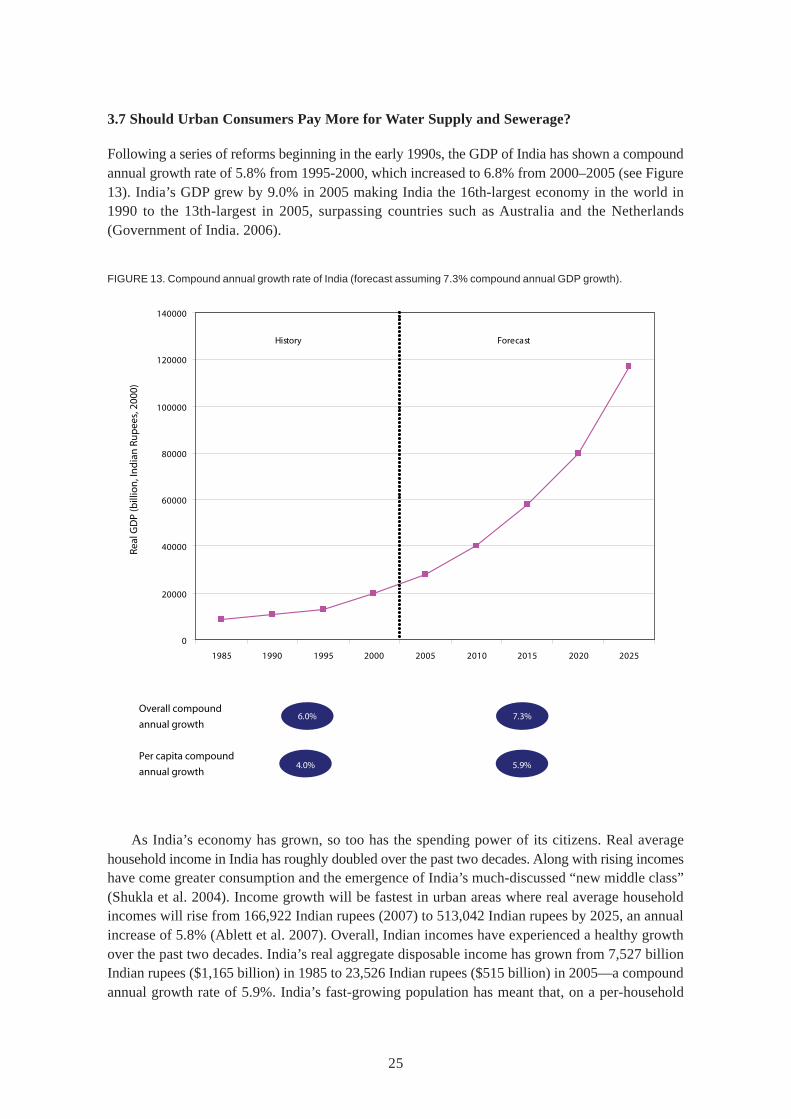
3.7 Should Urban Consumers Pay More for Water Supply and Sewerage?
Following a series of reforms beginning in the early 1990s, the GDP of India has shown a compoundannual growth rate of 5.8% from 1995-2000, which increased to 6.8% from 2000–2005 (see Figure13). India’s GDP grew by 9.0% in 2005 making India the 16th-largest economy in the world in1990 to the 13th-largest in 2005, surpassing countries such as Australia and the Netherlands(Government of India. 2006).
FIGURE 13. Compound annual growth rate of India (forecast assuming 7.3% compound annual GDP growth).
0
20000
40000
60000
80000
100000
120000
140000
1985 1990 1995 2000 2005 2010 2015 2020 2025
Real
GD
P (b
illio
n, I
nd
ian
Ru
pee
s, 2
000)
Overall compound
annual growth
Per capita compound
annual growth
6.0%
4.0%
7.3%
5.9%
History Forecast
As India’s economy has grown, so too has the spending power of its citizens. Real averagehousehold income in India has roughly doubled over the past two decades. Along with rising incomeshave come greater consumption and the emergence of India’s much-discussed “new middle class”(Shukla et al. 2004). Income growth will be fastest in urban areas where real average householdincomes will rise from 166,922 Indian rupees (2007) to 513,042 Indian rupees by 2025, an annualincrease of 5.8% (Ablett et al. 2007). Overall, Indian incomes have experienced a healthy growthover the past two decades. India’s real aggregate disposable income has grown from 7,527 billionIndian rupees ($1,165 billion) in 1985 to 23,526 Indian rupees ($515 billion) in 2005—a compoundannual growth rate of 5.9%. India’s fast-growing population has meant that, on a per-household
26
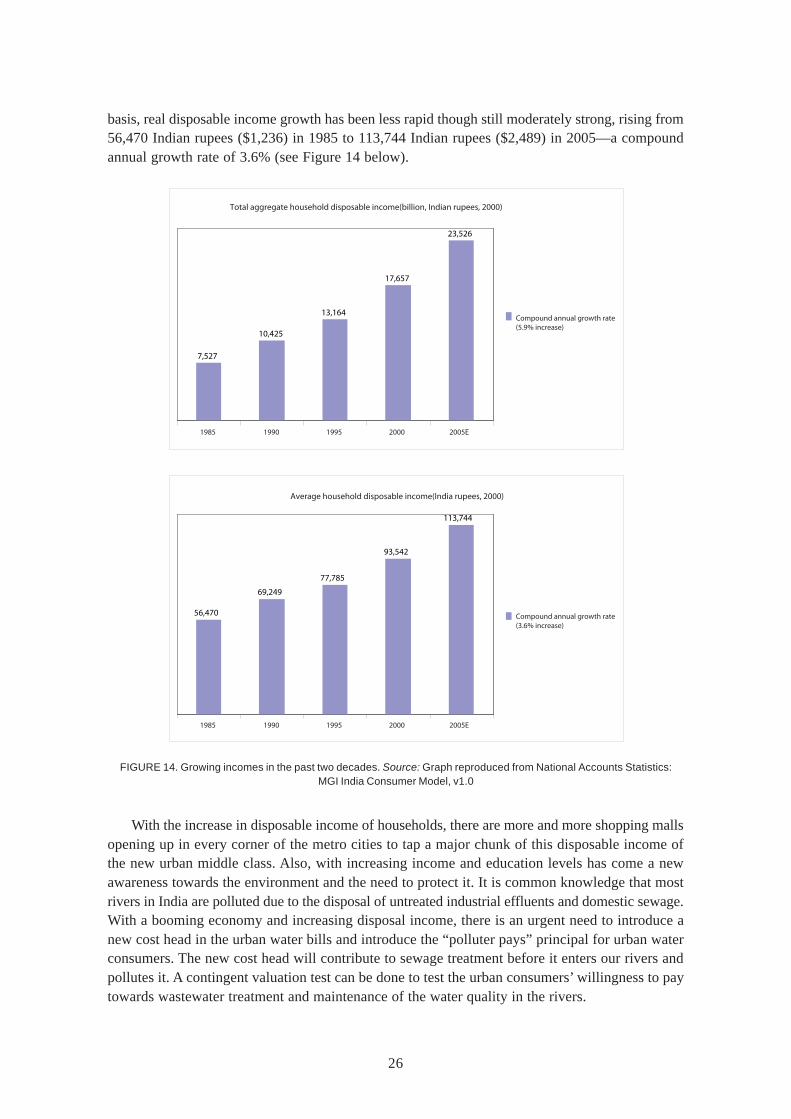
basis, real disposable income growth has been less rapid though still moderately strong, rising from56,470 Indian rupees ($1,236) in 1985 to 113,744 Indian rupees ($2,489) in 2005—a compoundannual growth rate of 3.6% (see Figure 14 below).
Total aggregate household disposable income(billion, Indian rupees, 2000)
7,527
10,425
13,164
17,657
23,526
1985 1990 1995 2000 2005E
Compound annual growth rate(5.9% increase)
Average household disposable income(India rupees, 2000)
56,470
69,249
77,785
93,542
113,744
1985 1990 1995 2000 2005E
Compound annual growth rate (3.6% increase)
With the increase in disposable income of households, there are more and more shopping mallsopening up in every corner of the metro cities to tap a major chunk of this disposable income ofthe new urban middle class. Also, with increasing income and education levels has come a newawareness towards the environment and the need to protect it. It is common knowledge that mostrivers in India are polluted due to the disposal of untreated industrial effluents and domestic sewage.With a booming economy and increasing disposal income, there is an urgent need to introduce anew cost head in the urban water bills and introduce the “polluter pays” principal for urban waterconsumers. The new cost head will contribute to sewage treatment before it enters our rivers andpollutes it. A contingent valuation test can be done to test the urban consumers’ willingness to paytowards wastewater treatment and maintenance of the water quality in the rivers.
FIGURE 14. Growing incomes in the past two decades. Source: Graph reproduced from National Accounts Statistics:MGI India Consumer Model, v1.0
27
4. CONCLUSIONS
Wastewater use in agriculture has been a common phenomenon in a number of water scarcedeveloping countries for more than a century now. It has been and is still supporting the livelihoodsof a number of urban and peri-urban farmers. However, with the growing population the volumesof urban wastewater have dramatically increased. The problem is further complicated with increasedcontamination of wastewater with new chemicals (in shampoos, soaps, etc.), with changing lifestylesof people and the addition of industrial effluents. The environmental and health related problems ofthe use of untreated wastewater has become prominent. There is an urgent need to address theseproblems before this untreated wastewater completely pollutes all the rivers/natural water bodies.Most of the developed countries have been able tackle this problem by appropriate treatment ofwastewater and safe disposal with minimum environmental and health impacts. Time and again,developing countries have tried to adopt similar water treatment technologies from the western worldand have failed. There are both social and economic reasons for this failure. It is very important tounderstand the social and economic context of a society/community/city before a technology isimplemented. The different social economic aspects to be considered are – perceptions of peopleregarding water, education levels, awareness towards the environment and the willingness and abilityto pay to protect their environment. In addition to this, the political will and institutional supportare essential to make wastewater a safe asset for people in developing countries. In a number ofwater scarce developed countries like USA, UK, Germany and Australia, wastewater recycling isgaining importance. But they are also facing different kinds of social and economic problems (detailedin the above sections). Developed countries can benefit from the various soil, water, crop qualitydata of wastewater irrigated areas and wastewater use experiences of farmers in developing countriesand can set their own quality standards. With issues of climate change, increases in urban populationand increased demand for water from competing sectors, wastewater recycling is becoming animportant strategy to complement the existing water resources for both developing and developedcountries and there are lessons, experiences, data and technology which can be shared for mutualbenefit.
28
AN
NE
X 1
. WA
STE
WA
TE
R R
EC
YC
LIN
G P
RO
JEC
TS
IN A
UST
RA
LIA
Que
ensl
and
• A
num
ber
of p
ropo
sals
for
rec
ycli
ng w
ater
fro
m t
heco
asta
l ar
eas
to i
nlan
d ag
ricu
ltur
al u
sers
hav
e be
enin
vest
igat
ed i
n re
cent
yea
rs.–
One
pro
ject
pro
pose
d th
ere
cycl
ing
of a
ll o
f B
risb
ane’
s w
aste
wat
er t
o ve
geta
ble
grow
ers
in t
he L
ocky
er V
alle
y an
d co
tton
and
cer
eal
grow
ers
in t
he D
arli
ng D
owns
.
Sout
h A
ustr
alia
Sou
th A
ustr
alia
’s V
irgi
nia
Irri
gati
on s
chem
e is
cur
rent
lyth
e la
rges
t re
cycl
ed w
ater
sch
eme
in t
he S
outh
ern
Hem
isph
ere
supp
lyin
g 6,
000
ha o
f ir
riga
ted
crop
s w
ith
upto
110
ml/
day
of C
lass
A w
ater
.–T
his
publ
ic/p
riva
te p
artn
ersh
ip f
ilte
rs e
fflu
ent
from
Ade
laid
e’s
Bol
ivar
tre
atm
ent
plan
t an
d di
stri
bute
s it
via
ane
twor
k of
ove
r 10
0 km
of
pipe
line
s th
roug
hout
the
Nor
ther
n A
dela
ide
plai
ns.
–Aqu
ifer
Sto
rage
and
Rec
over
y ha
s be
en p
ione
ered
on
this
proj
ect
alon
g w
ith
sali
nity
man
agem
ent
opti
ons
(Mar
tyn
etal
. 20
05).
Fur
ther
sou
th t
he p
riva
tely
fun
ded
Wil
lung
aB
asin
sch
eme
util
izes
eff
luen
t fr
om t
he C
hris
ties
Bea
chW
illu
nga
Was
tew
ater
Tre
atm
ent
Pla
nt (
WW
TP
) fo
r th
eir
riga
tion
of
vine
yard
s in
the
McL
aren
Val
e re
gion
.
Tas
man
ia•
Des
pite
the
rel
ativ
ely
high
rai
nfal
l ex
peri
ence
d in
Tasm
ania
, th
e us
e of
rec
ycle
d w
ater
fro
m t
reat
men
t pl
ants
disc
harg
ing
to w
ater
way
s is
inc
reas
ing.
Pro
ject
s at
Bri
ghto
n an
d th
e C
oal
Riv
er V
alle
y in
the
dri
er s
outh
ern
area
s of
the
Sta
te w
ill
util
ize
effl
uent
fro
m u
rban
pla
nts
for
irri
gate
d ho
rtic
ultu
re,
viti
cult
ure
and
turf
gro
win
g.
Vic
tori
a•
In V
icto
ria
the
Eas
tern
Irr
igat
ion
sche
me
supp
lies
5 G
Lof
Cla
ss A
wat
er p
er y
ear
to 5
0 ag
ricu
ltur
al a
nd h
orti
cul-
tura
l cu
stom
ers
east
of
Mel
bour
ne’s
Eas
tern
Tre
atm
ent
Pla
nt.
Eff
luen
t fr
om t
he p
lant
is
furt
her
trea
ted
in a
priv
atel
y op
erat
ed 3
0 m
l/d
ultr
afil
trat
ion
recy
cled
wat
erpl
ant
(Dav
ey e
t al
. 20
05).
• E
fflu
ent
from
the
Wes
tern
Que
ensl
and
• T
he S
prin
gfie
ld r
esid
enti
al d
evel
opm
ent
betw
een
Bri
sban
e an
d Ip
swic
h w
as o
neof
the
ear
ly d
ual
pipe
wat
er r
ecyc
ling
proj
ects
com
men
ced
in t
he S
tate
and
wil
lse
rve
an u
ltim
ate
popu
lati
on o
f 60
,000
peop
le (
AA
TS
E 2
004)
.•
Gol
d C
oast
Wat
er h
as d
evel
oped
an
ambi
tiou
s w
ater
res
ourc
es a
nd w
ater
recy
clin
g in
itia
tive
know
n as
the
Pim
pam
a-C
oom
era
Wat
er F
utur
e P
roje
ct(C
ox 2
004)
.– T
his
proj
ect
wil
l ul
tim
atel
yse
rve
150,
000
addi
tion
al r
esid
enti
alpo
pula
tion
s w
ith
inte
grat
ed d
ual
pipe
reti
cula
tion
sys
tem
s an
d sm
art
sew
ers
whi
ch c
ould
red
uce
the
impo
rtat
ion
ofdr
inki
ng w
ater
to
the
area
by
up t
o 85
%.
New
Sou
th W
ales
• N
ew S
outh
Wal
es p
ione
ered
lar
ge-s
cale
dual
pip
e re
side
ntia
l us
e of
rec
ycle
dw
ater
wit
h th
e R
ouse
Hil
l pr
ojec
t,cu
rren
tly
serv
ing
in e
xces
s of
12,
000
prop
erti
es.
Wat
er r
ecyc
ling
and
reu
se o
fst
orm
wat
er a
re b
oth
prac
tice
d on
the
Hom
ebus
h B
ay f
acil
itie
s de
velo
ped
inco
njun
ctio
n w
ith
the
Syd
ney
Oly
mpi
cG
ames
(A
AT
SE
200
4).
• T
he N
ew S
outh
Wal
es G
over
nmen
t is
curr
entl
y in
vest
igat
ing
sign
ific
ant
use
ofre
cycl
ed w
ater
in
the
new
dev
elop
men
tar
eas
of S
outh
wes
t an
d N
orth
wes
tS
ydne
y as
a p
art
of i
ts M
etro
poli
tan
Stra
tegy
(D
IPN
R 2
004)
.
Wes
tern
Aus
tral
iaE
fflu
ent
from
Per
th’s
Sub
iaco
WW
TP
is b
eing
uti
lize
d fo
r th
e ir
riga
tion
of
com
mun
ity
park
s, g
arde
ns a
nd g
olf
cour
ses.
Aus
tral
ian
Cap
ital
Ter
rito
ry•
AC
TE
W A
GL
has
ini
tiat
ed a
num
ber
of r
ecyc
led
wat
er s
chem
es u
tili
zing
high
qua
lity
eff
luen
t fr
om t
he S
TP
sse
rvin
g C
anbe
rra
(AA
TS
E 2
004)
.•
Ter
tiar
y tr
eate
d ef
flue
nt f
rom
Aus
tral
ia’s
lar
gest
inl
and
trea
tmen
tpl
ant
at L
ower
Mol
ongl
o pr
ovid
esw
ater
fro
m a
ran
ge o
f us
ers
incl
udin
ggo
lf c
ours
es a
nd v
iney
ards
wit
h ex
cess
flow
s di
scha
rged
as
an e
nvir
onm
enta
lfl
ow t
o th
e ri
ver
syst
em (
AA
TS
E20
04).
Nor
ther
n T
erri
tory
• In
the
Nor
ther
n Te
rrit
ory
a nu
mbe
rof
wat
er r
ecyc
ling
pro
ject
s ha
ve b
een
deve
lope
d ut
iliz
ing
effl
uent
fro
mD
arw
in’s
tre
atm
ent
plan
ts f
or g
olf
cour
se i
rrig
atio
n an
d ot
her
uses
.•
Sim
ilar
opp
ortu
niti
es h
ave
been
deve
lope
d in
Ali
ce S
prin
gs w
here
spor
ts g
roun
ds a
nd o
pen
spac
es a
reut
iliz
ing
“fit
for
pur
pose
” al
tern
ativ
esto
dri
nkin
g w
ater
.
Agr
icul
ture
\hor
ticu
ltur
eIn
dust
ryH
ouse
hold
Urb
an\r
ecre
atio
n
Que
ensl
and
In Q
ueen
slan
d, e
fflu
ent
from
Bri
sban
e’s
Lug
gage
Poi
nt W
WT
P i
s us
ed f
or i
ndus
tria
lpu
rpos
es f
ollo
win
g fu
rthe
r tr
eatm
ent
in a
dual
mic
ro-f
iltr
atio
n pr
oces
s.–A
noth
erpr
ojec
t in
vest
igat
ion
invo
lved
the
rec
ycli
ngof
wat
er f
rom
Too
woo
mba
’s W
etal
laS
ewag
e T
reat
men
t P
lant
(S
TP
) to
the
Mil
lmer
ran
pow
er s
tati
on
New
Sou
th W
ales
• In
dust
rial
reu
se i
nclu
des
the
Wat
erR
ecla
mat
ion
Pla
nt s
uppl
ying
rec
ycle
d w
ater
to t
he E
rari
ng P
ower
Sta
tion
on
the
NS
Wce
ntra
l co
ast.
• In
vest
igat
ions
are
und
erw
ay f
or a
sup
ply
to t
he s
teel
ind
ustr
y in
the
Wol
long
ong
area
.•
Reg
iona
l an
d co
untr
y co
unci
ls i
n N
SW
are
also
mak
ing
a si
gnif
ican
t co
ntri
buti
on t
ore
cycl
ing
incl
udin
g th
e ex
tens
ive
syst
embe
ing
deve
lope
d in
the
Sho
alha
ven
area
.
Wes
tern
Aus
tral
ia•
In W
este
rn A
ustr
alia
, th
e K
win
ana
Wat
erR
ecla
mat
ion
Pla
nt l
ocat
ed i
n th
e in
dust
rial
belt
sou
th o
f P
erth
uti
lize
s du
al m
embr
ane
tech
nolo
gy t
o re
cycl
e 6
GL
/yea
r of
wat
erfr
om t
he n
earb
y W
oodm
an P
oint
WW
TP
to
larg
e w
ater
usi
ng i
ndus
tria
l cu
stom
ers.
The
trea
tmen
t pl
ant,
the
larg
est
of i
ts k
ind
inA
ustr
alia
, w
ill
also
pro
cess
ind
ustr
ial
was
tew
ith
exce
ss e
fflu
ent
bein
g di
scha
rged
to
the
ocea
n at
a m
ore
sust
aina
ble
loca
tion
(Wal
ker
2003
).•
The
sub
stit
utio
n of
rec
ycle
d w
ater
for
pota
ble
wat
er,
curr
entl
y us
ed b
y in
dust
ry,
wil
l m
ake
a si
gnif
ican
t co
ntri
buti
on t
opr
eser
ving
Per
th’s
dri
nkin
g w
ater
res
ourc
es.
(con
tinue
d)
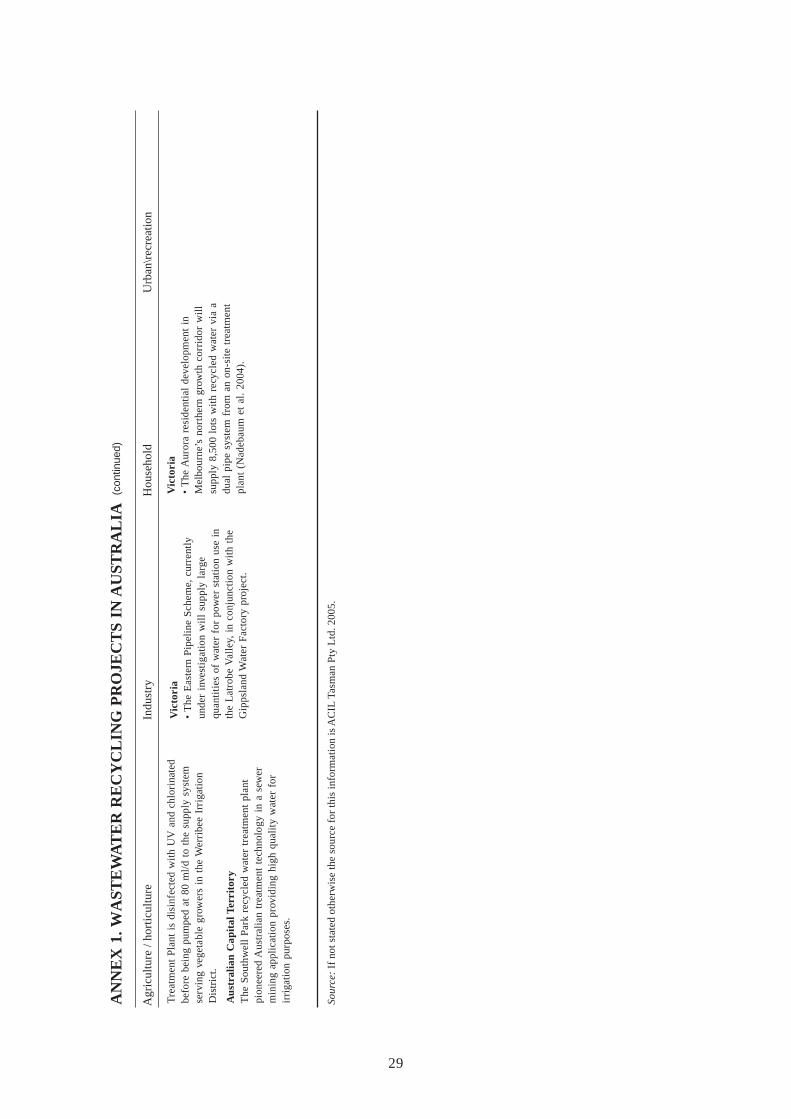
29
Sour
ce:
If n
ot s
tate
d ot
herw
ise
the
sour
ce f
or th
is in
form
atio
n is
AC
IL T
asm
an P
ty L
td. 2
005.
Agr
icul
ture
/ ho
rtic
ultu
reIn
dust
ryH
ouse
hold
Urb
an\r
ecre
atio
n
Tre
atm
ent
Pla
nt i
s di
sinf
ecte
d w
ith
UV
and
chl
orin
ated
befo
re b
eing
pum
ped
at 8
0 m
l/d
to t
he s
uppl
y sy
stem
serv
ing
vege
tabl
e gr
ower
s in
the
Wer
ribe
e Ir
riga
tion
Dis
tric
t.
Aus
tral
ian
Cap
ital
Ter
rito
ryT
he S
outh
wel
l Pa
rk r
ecyc
led
wat
er t
reat
men
t pl
ant
pion
eere
d A
ustr
alia
n tr
eatm
ent
tech
nolo
gy i
n a
sew
erm
inin
g ap
plic
atio
n pr
ovid
ing
high
qua
lity
wat
er f
orir
riga
tion
pur
pose
s.
Vic
tori
a•
The
Eas
tern
Pip
elin
e S
chem
e, c
urre
ntly
unde
r in
vest
igat
ion
wil
l su
pply
lar
gequ
anti
ties
of
wat
er f
or p
ower
sta
tion
use
in
the
Lat
robe
Val
ley,
in
conj
unct
ion
wit
h th
eG
ipps
land
Wat
er F
acto
ry p
roje
ct.
Vic
tori
a•
The
Aur
ora
resi
dent
ial
deve
lopm
ent
inM
elbo
urne
’s n
orth
ern
grow
th c
orri
dor
wil
lsu
pply
8,5
00 l
ots
wit
h re
cycl
ed w
ater
via
adu
al p
ipe
syst
em f
rom
an
on-s
ite
trea
tmen
tpl
ant
(Nad
ebau
m e
t al
. 20
04).
AN
NE
X 1
. WA
STE
WA
TE
R R
EC
YC
LIN
G P
RO
JEC
TS
IN A
UST
RA
LIA
(con
tinue
d)
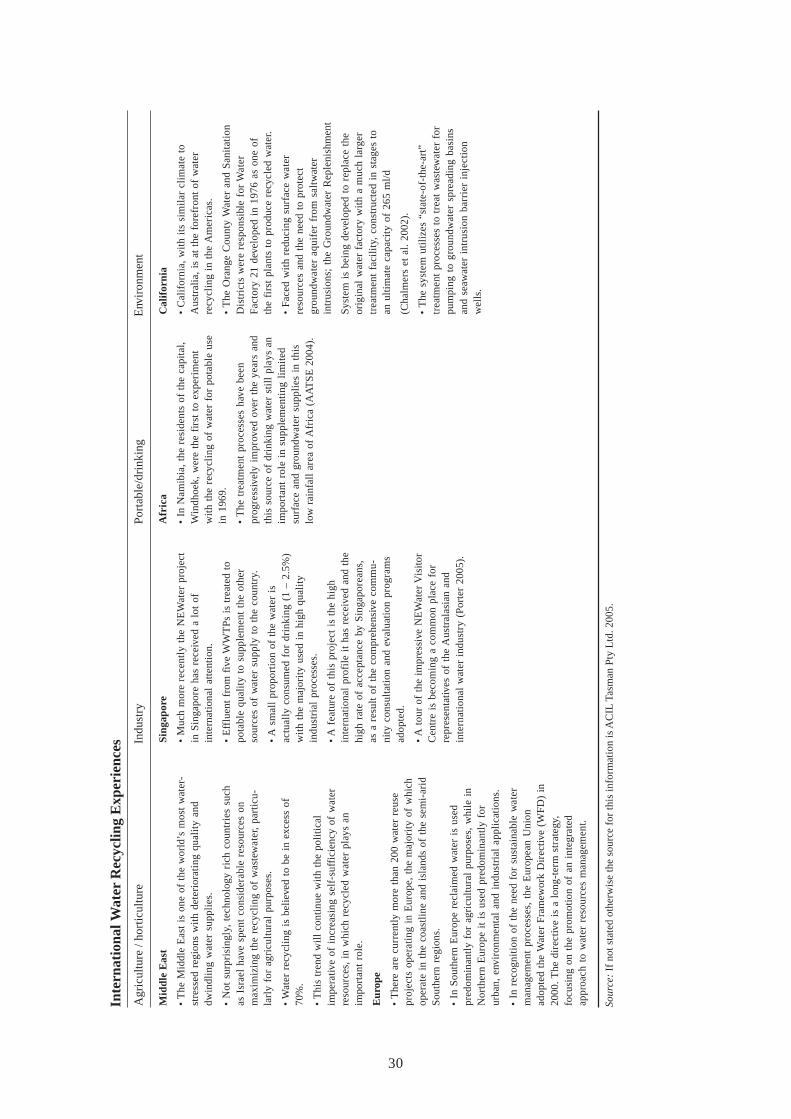
30
Agr
icul
ture
/ ho
rtic
ultu
reIn
dust
ryP
orta
ble/
drin
king
Env
iron
men
t
Inte
rnat
iona
l Wat
er R
ecyc
ling
Exp
erie
nces
Sour
ce:
If n
ot s
tate
d ot
herw
ise
the
sour
ce f
or th
is in
form
atio
n is
AC
IL T
asm
an P
ty L
td. 2
005.
Mid
dle
Eas
t
• T
he M
iddl
e E
ast
is o
ne o
f th
e w
orld
’s m
ost
wat
er-
stre
ssed
reg
ions
wit
h de
teri
orat
ing
qual
ity
and
dwin
dlin
g w
ater
sup
plie
s.
• N
ot s
urpr
isin
gly,
tec
hnol
ogy
rich
cou
ntri
es s
uch
as I
srae
l ha
ve s
pent
con
side
rabl
e re
sour
ces
onm
axim
izin
g th
e re
cycl
ing
of w
aste
wat
er,
part
icu-
larl
y fo
r ag
ricu
ltur
al p
urpo
ses.
• W
ater
rec
ycli
ng i
s be
liev
ed t
o be
in
exce
ss o
f70
%.
• T
his
tren
d w
ill
cont
inue
wit
h th
e po
liti
cal
impe
rativ
e of
inc
reas
ing
self
-suf
fici
ency
of
wat
erre
sour
ces,
in
whi
ch r
ecyc
led
wat
er p
lays
an
impo
rtan
t ro
le.
Eur
ope
• T
here
are
cur
rent
ly m
ore
than
200
wat
er r
euse
proj
ects
ope
rati
ng i
n E
urop
e, t
he m
ajor
ity
of w
hich
oper
ate
in t
he c
oast
line
and
isl
ands
of
the
sem
i-ar
idS
outh
ern
regi
ons.
• In
Sou
ther
n E
urop
e re
clai
med
wat
er i
s us
edpr
edom
inan
tly
for
agri
cult
ural
pur
pose
s, w
hile
in
Nor
ther
n E
urop
e it
is
used
pre
dom
inan
tly
for
urba
n, e
nvir
onm
enta
l an
d in
dust
rial
app
lica
tion
s.
• In
rec
ogni
tion
of
the
need
for
sus
tain
able
wat
erm
anag
emen
t pr
oces
ses,
the
Eur
opea
n U
nion
adop
ted
the
Wat
er F
ram
ewor
k D
irec
tive
(WF
D)
in20
00. T
he d
irec
tive
is a
lon
g-te
rm s
trat
egy,
focu
sing
on
the
prom
otio
n of
an
inte
grat
edap
proa
ch t
o w
ater
res
ourc
es m
anag
emen
t.
Afr
ica
• In
Nam
ibia
, th
e re
side
nts
of t
he c
apit
al,
Win
dhoe
k, w
ere
the
firs
t to
exp
erim
ent
wit
h th
e re
cycl
ing
of w
ater
for
pot
able
use
in 1
969.
• T
he t
reat
men
t pr
oces
ses
have
bee
npr
ogre
ssiv
ely
impr
oved
ove
r th
e ye
ars
and
this
sou
rce
of d
rink
ing
wat
er s
till
pla
ys a
nim
port
ant
role
in
supp
lem
enti
ng l
imit
edsu
rfac
e an
d gr
ound
wat
er s
uppl
ies
in t
his
low
rai
nfal
l ar
ea o
f A
fric
a (A
AT
SE
200
4).
Sing
apor
e
• M
uch
mor
e re
cent
ly t
he N
EW
ater
pro
ject
in S
inga
pore
has
rec
eive
d a
lot
ofin
tern
atio
nal
atte
ntio
n.
• E
fflu
ent
from
fiv
e W
WT
Ps
is t
reat
ed t
opo
tabl
e qu
alit
y to
sup
plem
ent
the
othe
rso
urce
s of
wat
er s
uppl
y to
the
cou
ntry
.
• A
sm
all
prop
orti
on o
f th
e w
ater
is
actu
ally
con
sum
ed f
or d
rink
ing
(1 –
2.5
%)
wit
h th
e m
ajor
ity
used
in
high
qua
lity
indu
stri
al p
roce
sses
.
• A
fea
ture
of
this
pro
ject
is
the
high
inte
rnat
iona
l pr
ofil
e it
has
rec
eive
d an
d th
ehi
gh r
ate
of a
ccep
tanc
e by
Sin
gapo
rean
s,as
a r
esul
t of
the
com
preh
ensi
ve c
omm
u-ni
ty c
onsu
ltat
ion
and
eval
uati
on p
rogr
ams
adop
ted.
• A
tou
r of
the
im
pres
sive
NE
Wat
er V
isit
orC
entr
e is
bec
omin
g a
com
mon
pla
ce f
orre
pres
enta
tives
of
the
Aus
tral
asia
n an
din
tern
atio
nal
wat
er i
ndus
try
(Por
ter
2005
).
Cal
ifor
nia
• C
alif
orni
a, w
ith
its
sim
ilar
cli
mat
e to
Aus
tral
ia,
is a
t th
e fo
refr
ont
of w
ater
recy
clin
g in
the
Am
eric
as.
• T
he O
rang
e C
ount
y W
ater
and
San
itat
ion
Dis
tric
ts w
ere
resp
onsi
ble
for
Wat
erF
acto
ry 2
1 de
velo
ped
in 1
976
as o
ne o
fth
e fi
rst
plan
ts t
o pr
oduc
e re
cycl
ed w
ater
.
• Fa
ced
wit
h re
duci
ng s
urfa
ce w
ater
reso
urce
s an
d th
e ne
ed t
o pr
otec
tgr
ound
wat
er a
quif
er f
rom
sal
twat
erin
trus
ions
; th
e G
roun
dwat
er R
eple
nish
men
t
Sys
tem
is
bein
g de
velo
ped
to r
epla
ce t
heor
igin
al w
ater
fac
tory
wit
h a
muc
h la
rger
trea
tmen
t fa
cili
ty,
cons
truc
ted
in s
tage
s to
an u
ltim
ate
capa
city
of
265
ml/
d
(Cha
lmer
s et
al.
2002
).
• T
he s
yste
m u
tili
zes
“sta
te-o
f-th
e-ar
t”tr
eatm
ent
proc
esse
s to
tre
at w
aste
wat
er f
orpu
mpi
ng t
o gr
ound
wat
er s
prea
ding
bas
ins
and
seaw
ater
int
rusi
on b
arri
er i
njec
tion
wel
ls.
31
REFERENCES
AATSE (Australian Academy of Technological Sciences and Engineering). 2004. Water Recycling in Australia. StudyDirector and Author: Dr. John Radcliffe, Victoria.
Ablett, J.; Baijal, A.; Beinhocker, E.; Bose, A.; Farrell, D.; Gersch, U.; Greenberg, E.; Gupta, S.; Gupta, S. 2007. The‘Bird of Gold’: The Rise of India’s Consumer Market. May 2007 Report. McKinsey Global Institute [MGI].
ABS. 2005. Annual Report 2005-06. http://www.ausstats.abs.gov.au/ausstats/subscriber.nsf/0/0407DA584588E138CA25720300182FBA/$File/10010_2005-06.pdf
ABS (Australian Bureau of Statistics). 2006. Water Account Australia. Report no. 4610.0. Latest issue released 11.30am (Canberra Time) 28 November 2006. Australian Bureau of Statistics. Commonwealth of Australia http://www.abs.gov.au.
ACIL Tasman Pty Ltd. 2005. Economics Policy Strategy. Research into access to recycled water and impediments torecycled water investment. Report prepared for the Australian Government Department of Agriculture, Fisheriesand Forestry on behalf of the Natural Resource Policy and Programs Committee. June 2005, pp. 1-82.
Agodzo, S. K.; Huibers, F.; Chenini, F.; van Lier, J. B.; Duran, A. 2003. Use of Wastewater in irrigated agriculture.Country studies from Bolivia, Ghana and Tunisia, Vol. 2 (Ghana). WUR, Wageningen, the Netherlands.
Allison, L.; Tierney, J.; Lundy, K.; Mackay, S.; Tchen, T.; Wong, P. 2002. The value of water: inquiry into Australia’smanagement o urban water. Report of the Senate Environment, Communications, Information Technology and ArtsReference Committee, Parliament of Australia, Canberra, ACT. http://www.aph.gov.au/senate/committee/ecita_ctte/water/report
Angyal, A. 1941. Disgust and related aversions. Journal of Abnormal and Social Psychology 36: 393-412.
ANZECC, ARMCANZ, NHMRC. 2000a. Guidelines for Sewerage Systems: reclaimed water. Paper No. 14. Australiaand New Zealand Environment and Conservation Council and Agriculture and Resource Management Council ofAustralia and New Zealand. Australia and New Zealand. National Water Quality Management Strategy. http://www.deh.gov.au/water/quality/nwqms/
ANZECC, ARMCANZ, NHMRC. 2000b. Guidelines for Sewerage Systems: effluent management. Paper No. 11.Australia and New Zealand Environment and Conservation Council and Agriculture and Resource ManagementCouncil of Australia and New Zealand. Australia and New Zealand. National Water Quality Management Strategy.http://www.deh.gov.au/water/quality/nwqms/
ARCWIS (Australian Research Centre for Water in Society). 2002. Perth domestic water use study Household applianceownership and Community attitudinal analysis. 1999-2000. Sydney: CSIRO Urban Water Programme.
ARRIS Pty Ltd. 2004. Quality Assurance Programs and Growing Crops with Recycled Water. Brochure funded byHorticulture Australia Ltd.
Bradford, A.; Brook, R.; Hunshal, C. S. 2003. Wastewater irrigation in Hubli–Dharwad, India: Implications for healthand livelihoods. Environment and Urbanization 15(2): 157-170.
Bruvold, W. 1988. Public opinion on water reuse options. Journal WPCF 60(1): 45-49.
Buechler, S.; Mekala, G. D.; Raschid-Sally, L. 2002. Livelihoods and Wastewater Irrigated Agriculture along the MusiRiver in Hyderabad City, Andhra Pradesh, India. Urban Agriculture Magazine 8: 14-17.
Buechler, S.; Mekala, G. D. 2003. Wastewater as a Source of Multiple Livelihoods? A Study in Rural Andhra Pradesh,South India. In: Devi, R.; Ahsan, N. (Eds.), Water and Wastewater: Perspectives of Developing Countries. London,UK: International Water Association.
Buechler, S.; Mekala, G. D. 2005. Household Food Security and Wastewater-dependent Livelihood Activities Along theMusi River in Andhra Pradesh, India. Internet publication. http://www.who.int/water_sanitation_health/wastewater/gwwufoodsecurity.pdf
Buechler, S.; Mekala, G. D. Highlighting the User in Wastewater Research: Gender, Caste and Class in the Study ofWastewater-dependent Livelihoods in Hyderabad, India. In: Ahmed, S.; Gautam, S. R.; Zwarteveen, M. (eds.),Engendering Integrated Water Management in South Asia: Policy, Practice and Institutions. New Delhi: Sage Press.Forthcoming.
Bureau of Meteorology. 2006. Annual Report. 2006-07. Published by Bureau of Meteorology, Australian Government.http://www.bom.gov.au/inside/eiab/reports/ar06-07/index.shtml
Chalmers, P. E.; Williams, R.; Everest, P. E. 2002. ‘Supercharged’, Civil Engineering, January 2002.
32
Chattopadhyay, K. 2004. Jalabhumir Kolkata – a fact-finding observation of East Calcutta Wetlands. Kolkata (publisherunknown).
Cox, S. 2004. Alternative Water Sources: The Pimpana – Coomera Scheme, Water 31(3), May 2004.
CPCB (Central Pollution Control Board). 1995. Status of Water supply and wastewater generation, collection, treatmentand disposal in metro cities (1994-95).
CPCB. 1998. Water Quality Status of Yamuna River.
Davey, A.; Miller, P.; Knops, F. 2005. Australia’s Largest Ultra-Filtration Reclaimed Water Plant, Water 32(2), March2005.
Department of Environment and Heritage. 1996. Portfolio Budget Statements 1996-97. http://www.environment.gov.au/about/publications/budget/budget96/statement/index.html
DIPNR (Department of Infrastructure, Planning and Natural Resources). 2004. Meeting the challenges, Securing Sydney’swater future. The Metropolitan Water Plan.
Doyle, P. T.; Johnson, F. 2005. Complexity of increasing water use efficiency on irrigated dairy farms. Proceedings ofDairy Industry Association of Australia Conference.
Drechsel, P.; Blumenthal, U.; Keraita, B. 2002. Balancing Health and Livelihoods, Adjusting Wastewater IrrigationGuidelines for Resource-poor Countries. UA Magazine No. 8.
Ensink, J. H. J.; Mahmood, T.; van der Hoek, W.; Raschid-Sally, L.; Amerasinghe, F. 2004. A Nationwide Assessmentof Wastewater Use in Pakistan: An Obscure Activity or a Vitally Important One? Water Policy 6: 1-10.
EPA (Environment Protection Agency). 2003. Guidelines for Environment Management: Use of Reclaimed water.Publication 464.2. ISBN 0 7306 7622 6. EPA, Victoria, June 2003. Available at http://epanote2.epa.vic.gov.au/EPA/publications.nsf/2f1c2625731746aa4a256ce90001cbb5/64c2a15969d75e184a2569a00025de63/$FILE/464.2.pdf
ESD. 1991..Final Report – Agriculture, Ecologically Sustainable Working Groups. AGPS, Canberra. ACT ESD 1991.Contact the Department of Environment and Heritage at http://www.deh.gov.au
Frewer, L. J.; Howard, C.; Shepard, R. 1998. Understanding public attitude to technology. Journal of Risk Research221-235.
Government of India. 2006. Press releases from the Ministry of Statistics and Programme Implementation. http://www.mospi.nic.in/mospi_press_releases.htm.
Hamilton, A. J.; Boland, A.; Stevens, D.; Kelly, J.; Radcliffe, J.; Ziehrl, A.; Dillon, P.; Paulin, B. 2005. Position ofAustralian horticultural industry with respect to the use of reclaimed water. Agricultural Water Management 71:181-209.
Hussain, I.; Raschid-Sally, L.; Hanjra, M. A.; Marikar, F.; van der Hoek, W. 2001. A framework for analyzingsocioeconomic, health and environmental impacts of wastewater use in agriculture in developing countries. IWMIWorking Paper 26.Colombo, Sri Lanka: International Water Management Institute.
Jellinek, S.; Milverton, D.; Martinez, G. A.; Schrader, K. 2006. World Bank Report: Water Utility Subsidies Benefit The‘Haves’, Not The ‘Have Nots’. News Release No:2006/317/ESSD. http://web.worldbank.org
Kaercher, J. D.; Po, M.; Nancarrow, B. E. 2003. Water Recycling Community Discussion Meeting I (unpublishedmanuscript). Perth: ARCWIS (Australian Research Centre for Water in Society).
Kularatne, D.; Ridley, D.; Cameron, C. 2005. Assumptions Associated with using Recycled Water for Primary Industries.Discussion Paper. Department of Primary Industries. Pp. 1-31.
Mantovani, P.; Asano, T.; Chang, A.; Okun, D. A. 2001. Management practices for non-potable water reuse. Project 97-IRM-6, Water Environment Research Foundation, Alexandria VA.
Mara, D.; Cairncross, S. 1989. Guidelines for the Safe Use of Wastewater and Excreta in Agriculture and Aquaculture.Geneva, Switzerland: World Health Organization.
Marsalek, J.; Schaefer, K.; Excall, K.; Brannen, L.;.Aidun, B. 2002. Water Reuse and Recycling. Canadian Council ofMinisters of the Environment, Winnipeg, Manitoba. CCME Linking Water Science to Policy Workshop Series. ReportNo. 3, 39pp.
Martyn, H.; Kaeding, V.; Heidenreich, C. 2005. Desalination Options for Salinity Management in the Northern AdelaidePlains, Water 32(3), May 2005.
33
McGuckian, R. 2002. Consequences of current and proposed water reform on Australian Horticulture. Preliminary draftreport, commissioned by Horticulture Australia, October. Contact Horticulture Australia at www.horticulture.com.au
Mekala, G. D. 2006. Multi-stakeholder Processes for safe use of wastewater and sustainable urban, peri-urban agriculture– A case study of Hyderabad, India. Powerpoint presentation at the UN Habitat third World Urban Forum June 19-23, 2006, Vancouver, Canada.
Melbourne Water. 1998. Exploring community attitudes to water conservation and effluent reuse. A consultancy reportprepared by Open Mind Group. St. Kilda, Victoria.
Muir, R. 2006. The economics of recycling. Power point presentation at the Water Recycling and Infrastructure Summiton 06 December 2006. Sydney. Synergies Economic Consulting.
Nadebaum, P. R.; Pamminger, F.; Moore, L. 2004. A Third Pipe Recycled Water Scheme: Business Risk Considerations,Water 31(3), May 2004.
Ogoshi, M.; Suzuki, Y.; Asano, T. 2001. Water reuse in Japan. Water Science and Technology 43(10): 17-23.
Pannell, D. J.; Marshall, G. R.; Barr, N.; Curtis, A.; Vanclay, F.; Wilkinson, R. 2005. Understanding and promotingadoption of conservation practices by rural landholders. Unpublished manuscript submitted to Aust. Jour. Exp.Agric. Accessed at http://www.general.uwa.edu.au/u/dpannell/dp0502.htm
Pescod, M. B. 1992. Wastewater Treatment and Uses in Agriculture – FAO Paper 47.
Po, M.; Kaercher, J.; Nancarrow, B. E. 2004. Australian Water Conservation and Reuse Research Program: Literaturereview of factors influencing public perceptions of water reuse. Australian Water Association. April 2004. pp 1-27.
Porter, C. 2005, Singapore Technotour, Water 32(3), May 2005.
Radcliffe, J. 2003. An overview of water recycling in Australia - results of a recent ATSE study. In: Proceedings of WaterRecycling Australia: Second National Conference, Brisbane, 1-3 September 2003 (CD-ROM).
Radcliffe, J. 2004. Water recycling in Australia. Australian Academy of Technological Sciences and Engineering, Parkville,Melbourne.
Raghavendra, S. 2006. Re-examining the ‘low water tariff’ hypothesis: lessons from Hyderabad, India. Urban WaterJournal 3(4): 235-247.
Raschid-Sally, L.; Doan Doan Tuan, Abayawardana, S. 2004. National Assessments on Wastewater Use in Agriculturean Emerging Typology: The Vietnam Case Study. In: Scott, C. A.; Faruqui, N. I.; Raschid-Sally, L. (eds.), Wastewateruse in irrigated agriculture: Confronting the livelihood and Environmental realities. IWMI/IDRC-CRDI/CABI,Wallingford, UK.
Rozin, P.; Fallon, A. E. 1987. A Perspective on disgust. Psychological Reports 94: 23-41.
Sawhney, A. 2004. The New Face of Environmental Management in India. Ashgate Publishing, Ltd. ISBN 075461915X.
Scott, C.; Faruqui, N.; Raschid-Sally, L. 2004. Wastewater Use in Irrigated Agriculture: Management Challenges inDeveloping Countries. In: Scott, C. A.; Faruqui, N. I.; Raschid-Sally, L. (eds.). Wastewater Use in IrrigatedAgriculture: Confronting the livelihood and Environmental realities. IWMI/IDRC-CRDI/CABI, Wallingford, UK.
Scott, C. A.; Zarazúa, J. A.; Levine, G. 2000. Urban-Wastewater Reuse for Crop Production in the Water-short GuanajuatoRiver Basin, Mexico. IWMI Research Report 41. Colombo, Sri Lanka: International Water Management Institute.
Shukla, R. K.; Dwivedi, S. K.; Sharma, A. (with assistance from Sunil Jain). 2004. The Great Indian Middle Class:Results from the NCAER Market information Survey of Households. National Council of Applied Economic Research(in association with Business Standard).
South East QLD Recycled Water Task Force. 2003. South East QLD Recycled Water Task Force Report (unpublished).http://www.sd.qld.gov.au/dsdweb/docs-in/ppp/SEQ_Recycled_Water_Taskforce_Report.pdf
Strauss, M.; Blumenthal, U. 1990. Human Waste Use in Agriculture and Aquaculture: Utilization Practices and HealthPerspectives. IRCWD Report 09/90. International Reference Center for Waste Disposal (IRCWD). Duebendorf,Germany.
Swiss Business Hub India & Heinz Habegger, Baleco AG, Thun. 2004. Market Report: Opportunities for EnvironmentalTechnology in India. Focus on Water, Air and Hazardous Waste. Swiss Business Hub India, 2004.
Swinton, B. 2005. Membrane technology. Water 36–41.
Sydney Water. 1999. Community views on recycled water. Sydney:
34
Solomon, Cheere. 2006. Irrigation Policies, Strategies and Institutional Support Conditions in Ethiopia. in: Awulacew,S.B.; Menkir, M.; Abesha, D.; Atnafe, T.; Wondimkun, Y. (Eds). 2006. Best Practices and Technologies for SmallScale Agricultural Water Management in Ethiopia. Procedings of a MoARD/MoWR/USAID/IWMI symposiumand exhibition held at Ghion Hotel, Addis Ababa, Ethiopia 7-9 March, 2006 Colombo, Srilanka, International WaterManagement Institute.
Tadesse, K. 2004. Strategic planning for groundwater assessment in Ethiopia. A paper presented to InternationalConference and Exhibition on Groundwater in Ethiopia: from May, 25-27 2004. Addis Ababa: Ethiopia.
UNESCO (United Nations Educational, Scientific and Cultural Organization). 2004. National development report forEthiopia, UNESCO, World Water Assessment Program, December 2004.
WAPCOS (Water & Power Consultancy Services (I) Ltd.). 1995. The National Water Resources Master Plan,Addis Ababa: Ethiopia.
Werfring, A. 2004. Typology of Irrigation in Ethiopia. A thesis submitted to the University of Natural Resources andApplied Life Sciences Vienna. Institute of Hydraulics and Rural Water Management in partial fulfillment of thedegree of Diplomingeieur.
World Bank. 2005. World Bank Development Indicator (WDI).Tisdell, J.; Ward, J.; Grudzinski, T. 2002. The development of water reform in Australia. Technical Report, 02/5, May
2002. Cooperative Research Centre for Catchment Hydrology (unpublished).
UNDP (United Nations Development Programme). 1998. Global Human Development Report 1998. Oxford UniversityPress, New York.
Walker, T. 2003. Kwinana Water Reclamation Plant. Water 30(5), August 2003.
Water Corporation. 2005. Perths seawater desalination plant. Last accessed: 8 August 2005. http://www.watercorporation.com.au/docs/desal_faq.pdf
Winrock International India. 2007. Urban Wastewater: Livelihoods, Health and Environmental Impacts in India. Researchreport submitted to International Water Management Institute.
WSAA (Water Services Association of Australia). 2005. Testing Water-Urban water in our growing cities-the risks,challenges, innovation and planning. Position Paper No.01, October 2005. Published by Water Services Associationof Australia (WSAA). Pp 1-30. http://www.wsaa.asn.au
YUVA, Mumbai. 2005. National Assessment of Wastewater Generation and Utilization: A Case of India. Unpublished.


WORKING PAPER 128
I n t e r n a t i o n a lWater ManagementI n s t i t u t eISBN: 978-92-9090-691-9
Postal AddressP O Box 2075ColomboSri Lanka
Location127, Sunil MawathaPelawattaBattaramullaSri Lanka
Telephone+94-11 2880000
Fax+94-11 2786854
Websitehttp://www.iwmi.org
SM
IWMI is a Future Harvest Centersupported by the CGIAR
I n t e r n a t i o n a lWater ManagementI n s t i t u t e
Wastewater Reuse andRecycling Systems: A Perspective into India and Australia
Gayathri Devi Mekala, Brian Davidson, Madar Samad and Anne-Maree Boland