Embed Size (px)
Citation preview
Working on aWARMERplanetThe impact of heat stress on labour productivity and decent work
International Labour Office • Geneva
Working on a warmer planetThe impact of heat stress on labour productivity and decent work
Produced by the Publications Production Unit (PRODOC) of the ILO.
Graphic and typographic design, manuscript preparation, copy editing, layout and composition, proofreading, printing, electronic publishing and distribution.
PRODOC endeavours to use paper sourced from forests managed in an environmentally sustainable and socially responsible manner.
Code: DTP-WEI-CORREDIT-REP
The designations employed in ILO publications, which are in conformity with United Nations practice, and the presenta-tion of material therein do not imply the expression of any opinion whatsoever on the part of the International Labour Office concerning the legal status of any country, area or territory or of its authorities, or concerning the delimitation of its frontiers.
The responsibility for opinions expressed in signed articles, studies and other contributions rests solely with their authors, and publication does not constitute an endorsement by the International Labour Office of the opinions expressed in them.
Reference to names of firms and commercial products and processes does not imply their endorsement by the International Labour Office, and any failure to mention a particular firm, commercial product or process is not a sign of disapproval.
Information on ILO publications and digital products can be found at: www.ilo.org/publns.
Copyright © International Labour Organization 2019 First published 2019
Publications of the International Labour Office enjoy copyright under Protocol 2 of the Universal Copyright Convention. Nevertheless, short excerpts from them may be reproduced without authorization, on condition that the source is indi-cated. For rights of reproduction or translation, application should be made to ILO Publications (Rights and Licensing), International Labour Office, CH-1211 Geneva 22, Switzerland, or by email: [email protected]. The International Labour Office welcomes such applications.
Libraries, institutions and other users registered with a reproduction rights organization may make copies in accordance with the licences issued to them for this purpose. Visit www.ifrro.org to find the reproduction rights organization in your country.
Working on a warmer planet: The impact of heat stress on labour productivity and decent workInternational Labour Office – Geneva, ILO, 2019
ISBN 978-92-2-132967-1 (print) ISBN 978-92-2-132968-8 (web pdf)
decent work / labour productivity / climate change / temperature / stress / environment deterioration / employment / labour market policy
13.01.2
ILO Cataloguing in Publication Data
3
“It’s too hot to work today!”
For many of us, an exclamation like the above is a way of giving vent to our annoyance at the occasional inconveniences of the hottest months of the year. For millions of workers across the world, it is a sign of distress. For many economies, it is a threat to their productivity.
The phenomenon of heat stress refers to heat received in excess of that which the body can tolerate without physiological impairment. Heat stress affects, above all, outdoor workers such as those engaged in agriculture and on construction sites. It is a serious problem for a large proportion of the world’s 1 billion agricultural workers and 66 million textile workers (many of whom have to work inside factories and workshops without air conditioning), and for workers employed, inter alia, in refuse collection, emergency repair work, transport, tourism and sports.
Temperatures exceeding 39°C can kill. But even where there are no fatalities, such temperatures can leave many people unable to work or able to work only at a reduced rate. Some groups of workers are more vulnerable than others because they suffer the effects of heat stress at lower temperatures. Older workers, in particular, have lower physiological resistance to high levels of heat. Yet they represent an increasing share of workers – a natural consequence of population ageing. Heat stress, moreover, can be one of many factors prompting people to migrate.
By 2030 the equivalent of more than 2 per cent of total working hours worldwide is projected to be lost every year, either because it is too hot to work or because workers have to work at a slower pace. In Southern Asia and Western Africa the resulting productivity loss may even reach 5 per cent. Unfortunately, heat stress is often accompanied by other challenges as it is more prevalent in countries with decent work deficits, such as a lack of social protection and high rates of informality and working poverty. Excessive heat levels aggravate inequality between rich and poor countries, and between population groups within the same country.
Heat stress is increasingly becoming an obstacle to economic activity. It reduces the ability of busi-nesses to operate during the hottest hours. Adapting to these new and threatening conditions is costly. Even if it does prove possible to limit global warming by the end of the century to 1.5°C above pre- industrial levels, the accumulated financial loss due to heat stress is expected to reach US$2,400 billion by 2030. If nothing is done now to mitigate climate change, these costs will be much higher as global temperatures increase even further towards the end of the century.
Solutions do exist. In particular, the structural transformation of rural economies should be speeded up so that fewer agricultural workers are exposed to high temperatures and so that less physical effort has to be expended in such conditions. Other important policy measures that can help are skills devel-opment, the promotion of an enabling environment for sustainable enterprises, public investment in infrastructure, and improved integration of developing countries into global trade. At the workplace level, enhanced information about on-site weather conditions, the adaptation of workwear and equip-ment, and technological improvements can make it easier for workers and their employers to cope with higher temperatures. Employers and workers should discuss together how to adjust working hours, in addition to adopting other occupational safety and health measures. Accordingly, social dialogue is a relevant tool for improving working conditions on a warming planet.
International collaboration and the coordination of joint efforts are a key part of the package of solutions to the problem of heat stress. This report has been prepared in part to follow up on the ILO Guidelines for a just transition towards environmentally sustainable economies and societies for all, which invite governments, in consultation with the social partners, to conduct assessments of increased or new occupational safety and health risks resulting from climate change or other risks related to human health and the environment, and identify adequate prevention and protection measures that seek to ensure occupational safety and health. Furthermore, in March 2017, the ILO
Preface
Working on a warmer planet: The impact of heat stress on labour productivity and decent work4
Governing Body requested the Director-General to promote further discussion, knowledge and under-standing of the implications of climate change for the world of work, particularly for those most affected and vulnerable.
Overall, the findings presented in this report make it clear that heat stress in the world of work must be tackled, above all, by promoting occupational safety and health, social dialogue and structural transformation in agriculture, and by encouraging the development of responsible and sustainable, or “green”, businesses. Such an integrated approach was also taken in 2019 by the Global Commission on the Future of Work, which highlighted the need for a universal labour guarantee that includes health and safety standards in all places of work.
Damian Grimshaw Vic van Vuuren Director, Research Department Director, Enterprises Department
5
This report was prepared by the Work Income and Equity Unit (led by Catherine Saget) of the ILO Research Department, under the guidance of its Directors a.i. Moazam Mahmood and Sangheon Lee, and Director Damian Grimshaw. The main authors of the report are Tord Kjellstrom (independent expert), Nicolas Maître, Catherine Saget, Matthias Otto (independent expert) and Tahmina Karimova, with inputs from Trang Luu, Adam Elsheikhi, Guillermo Montt, Bruno Lemke (independent expert), Antoine Bonnet, Marek Harsdorff, Chris Freyberg (independent expert), David Briggs (independent expert) and Angela Giannini.
The team wishes to thank Marek Harsdorff and Moustapha Kamal Gueye from the ILO’s Green Jobs Programme for their support, close collaboration and valuable contributions.
The team also wishes to thank two anonymous reviewers for their comments.
The team would like to acknowledge the inputs, helpful comments and suggestions for improvement received from the following ILO colleagues past and present:
Adam Adrien-Kirby, Antonia Asenjo, Floriana Borino, Kazutoshi Chatani, Ryszard Cholewinski, Marva Corley-Coulibaly, Anne Drouin, Sara Elder, Ekkehard Ernst, Veronica Escudero, Marialaura Fino, Claire Harasty, Carla Henry, Houtan Homayounpour, Lawrence Jeff Johnson, Sophia Kagan, Takaaki Kizu, Stefan Kühn, Heike Lautenschlager, Nancy Leppink, Hannah Liepmann, Christina Martinez, Santo Milasi, Lene Olsen, Martin Ostermeier, Clemente Pignatti, Uma Rani, Pelin Sekerler Richiardi, René Robert, Ken Chamuva Shawa, Pamphile Sossa, Domenico Tabasso, Mito Tsukamoto, Max Tunon, Yuka Ujita, Christian Viegelahn and Hans von Rohland. Special mention should also be made of Judy Rafferty for her assistance in the publication process and of Béatrice Guillemain for her administra-tive support.
Acknowledgements
7
Preface 3
Acknowledgements 5
Executive summary 13
1. Heat stress and decent work 17
2. Global overview 212.1 Climate change and the rising incidence of heat stress 21
2.2 Labour market trends and exposure to heat stress 24
2.3 Methodology 25
2.4 Heat stress and its effect on labour productivity 26
2.5 Urban heat islands 29
2.6 Vulnerability of disadvantaged workers and subregions 30
3. Africa 333.1 Current and projected heat levels 33
3.2 Labour market trends 34
3.3 Subregional and national estimates 35
3.4 Conclusion and key findings 40
4. Americas 414.1 Current and projected heat levels 41
4.2 Labour market trends 42
4.3 Subregional and national estimates 43
4.4 Conclusion and key findings 48
5. Arab States 495.1 Current and projected heat levels 49
5.2 Labour market trends 50
5.3 Regional and national estimates 51
5.4 Conclusion and key findings 54
6. Asia and the Pacific 556.1 Current and projected heat levels 55
6.2 Labour market trends 56
6.3 Subregional and national estimates 58
6.4 Conclusion and key findings 64
Table of contents
Working on a warmer planet: The impact of heat stress on labour productivity and decent work8
Boxes3.1 Heat stress and vulnerable outdoor workers in the city of Bulawayo in Zimbabwe 37
4.1 Vulnerability to heat exposure among farm workers in North America 44
4.2 Heat stress, poor working conditions and health impacts among workers on Central American sugar cane plantations 45
5.1 Heat-related risks and occupational safety and health measures in the GCC countries 53
6.1 Occupational heat stress and brickmaking workers in India 59
6.2 The impact of outdoor occupational heat stress in the Islamic Republic of Iran 60
6.3 Extreme heat and migration in Pakistan 60
6.4 Low-income outdoor workers and heat stress risks in Da Nang, Viet Nam 61
6.5 The impact of climate change on the labour market in Thailand 62
7.1 Ambient temperature, heatwaves and occupational injuries in Europe and Central Asia 68
8.1 Heat stress as a driver of migration: Implications for policy action 78
8.2 Adapting to heat stress in the agricultural sector 81
7. Europe and Central Asia 657.1 Current and projected heat levels 65
7.2 Labour market trends 66
7.3 Subregional and national estimates 67
7.4 Conclusion and key findings 71
8. Employment and labour market policies Part I. Adapting to heat-related hazards through international labour standards and tripartism 738.1 The role of international labour standards 75
8.2 The role of governments 77
8.3 The role of employers 79
8.4 The role of workers 80
8.5 The role of social dialogue 82
9. Employment and labour market policies Part II. Complementary mitigation efforts to reduce heat-related hazards 839.1 Mitigation pathways and occupational heat stress 83
9.2 Long-term projections of the impact of heat stress 84
9.3 Employment opportunities resulting from mitigation efforts 86
Conclusion 87
Appendix I. Detailed methodology 89
Appendix II. Comparison of in-shade and in-sun estimates 93
Bibliography 97
Table of contents 9
Figures2.1 Estimated incidence of heat stress worldwide in 1995 22
2.2 Projected incidence of heat stress worldwide in 2085 22
2.3 Sectoral composition of total employment by subregion, 1995 and projections for 2030 (percentages) 24
2.4 Equivalent full-time jobs and GDP lost to heat stress, global and by country income group, 1995 and projections for 2030 27
2.5 Working hours lost to heat stress by subregion, 1995 and projections for 2030 (percentages) 27
2.6 Working hours lost to heat stress by sector, 1995 and projections for 2030 (percentages) 28
2.7 Correlation between estimated labour productivity loss due to heat stress and urbanization, 183 countries from all world subregions, 1995 (percentages) 29
2.8 Correlation between labour productivity loss due to heat stress and share of (A) own-account and contributing family workers; and (B) working poverty, all world subregions, 2015 31
2.9 Correlation between labour productivity loss due to heat stress, 2015 and (A) informality; and (B) social security coverage, selected countries, latest available year 31
2.10 Correlation between GHG emissions and labour productivity loss due to heat stress, all world subregions, 2012 and 2015 32
3.1 Incidence of heat stress during the hottest month in Africa, 1995 and 2030 (projections) 34
3.2 Breakdown of total employment in Africa, by sector and subregion, 1995 and 2030 (projections) 35
3.3 Percentage of GDP lost to heat stress under a 1.5°C global warming scenario, ten most affected countries in Africa, 1995 and 2030 (projections) 39
4.1 Incidence of heat stress during the hottest month in the Americas, 1995 and 2030 (projections) 42
4.2 Breakdown of total employment in the Americas, by sector and subregion, 1995 and 2030 (projections) 43
4.3 Percentage of GDP lost to heat stress under a 1.5°C global warming scenario, ten most affected countries in the Americas, 1995 and 2030 (projections) 47
5.1 Incidence of heat stress during the hottest month in the Arab States, 1995 and 2030 (projections) 50
5.2 Breakdown of total employment by sector, Arab States, 1995 and 2030 (projections) 51
5.3 Percentage of GDP lost to heat stress under a 1.5°C global warming scenario, ten most affected countries/territories, Arab States, 1995 and 2030 (projections) 54
6.1 Incidence of heat stress during the hottest month in Asia and the Pacific, 1995 and 2030 (projections) 56
6.2 Breakdown of total employment by sector, Asia-Pacific subregions, 1995 and 2030 (projections) 57
6.3 Percentage of GDP lost to heat stress under a 1.5°C global warming scenario, ten most affected countries in Asia and the Pacific, 1995 and 2030 (projections) 64
7.1 Incidence of heat stress during the hottest month in Europe and Central Asia, 1995 and 2030 (projections) 66
7.2 Breakdown of total employment by sector, Europe and Central Asia subregions, 1995 and 2030 (projections) 67
7.3 Percentage of GDP lost to heat stress under a 1.5°C global warming scenario, ten most affected countries in Europe and Central Asia, 1995 and 2030 (projections) 70
8.1 The role of governments, employers and workers in reducing vulnerability to heat stress and promoting adaptation 74
8.2 Correlation between net migration and labour productivity loss 78
9.1 Percentages of working hours lost to heat stress under the RCP2.6 and RCP6.0 climate change scenarios, Ghana, Cambodia, Panama, Qatar and Spain, 1995–2085 (projections) 85
Working on a warmer planet: The impact of heat stress on labour productivity and decent work10
AI.1 Estimated exposure–response relationships for reduced hourly work capacity in jobs with a physical intensity of 200 W, 300 W and 400 W 91
AII.1 Percentages of global working hours lost to heat stress, 1995 and 2030 (projections) 93
AII.2 Percentages of working hours lost to heat stress calculated using in-sun and in-shade estimates of heat stress, all subregions, 2030 (projections) 94
AII.3 Percentages of working hours lost to heat stress, Cambodia, Ghana, Chad and India, 1995 and 2030 (projections) 94
Tables1.1 Heat stress impacts on work in relation to the Sustainable Development Goals 20
2.1 Annual average temperature in world subregions in 1995 and projected increases by 2025 and 2085 (°C) 23
2.2 Summary of data sources and models used, and of analytical steps performed 26
3.1 Working hours lost to heat stress, by sector and country/territory, Northern Africa, 1995 and 2030 (projections) 35
3.2 Working hours lost to heat stress, by sector and country, Central Africa, 1995 and 2030 (projections) 36
3.3 Working hours lost to heat stress, by sector and country, Eastern Africa, 1995 and 2030 (projections) 37
3.4 Working hours lost to heat stress, by sector and country, Southern Africa, 1995 and 2030 (projections) 38
3.5 Working hours lost to heat stress, by sector and country, Western Africa, 1995 and 2030 (projections) 38
4.1 Working hours lost to heat stress, by sector and country, North America, 1995 and 2030 (projections) 44
4.2 Working hours lost to heat stress, by sector and country, Central America, 1995 and 2030 (projections) 45
4.3 Working hours lost to heat stress, by sector and country, South America, 1995 and 2030 (projections) 46
4.4 Working hours lost to heat stress, by sector and country/territory, Caribbean, 1995 and 2030 (projections) 46
5.1 Working hours lost to heat stress, by sector and country/territory, Arab States, 1995 and 2030 (projections) 52
6.1 Working hours lost to heat stress, by sector and country/territory, Eastern Asia, 1995 and 2030 (projections) 58
6.2 Working hours lost to heat stress, by sector and country, Southern Asia, 1995 and 2030 (projections) 59
6.3 Working hours lost to heat stress, by sector and country, South-East Asia, 1995 and 2030 (projections) 62
6.4 Working hours lost to heat stress, by sector and country/territory, Pacific Islands, 1995 and 2030 (projections) 63
7.1 Working hours lost to heat stress, by sector and country, Eastern Europe, 1995 and 2030 (projections) 68
7.2 Working hours lost to heat stress, by sector and country, Southern Europe, 1995 and 2030 (projections) 69
7.3 Working hours lost to heat stress, by sector and country, Central Asia, 1995 and 2030 (projections) 69
7.4 Working hours lost to heat stress, by sector and country, Western Asia, 1995 and 2030 (projections) 70
13
Executive summary
Global warming will make heat stress and extreme weather events more common
Climate projections point towards an increase in the frequency and intensity of extreme weather events, and one result of this trend is the loss of jobs and productivity. The rise in global temperatures caused by climate change will also make the phenomenon of “heat stress” more common. Heat stress refers to heat received in excess of that which the body can tolerate without suffering physiological impairment. Such excess heat increases workers’ occupational risks and vulnerability; it can lead to heatstroke and, ultimately, even to death. The proliferation of so-called “urban heat islands”, areas of concentrated heat inside cities resulting from growing population numbers and urbanization, will further intensify the impact of heatwaves, aggravating the risks faced by workers. The world of work’s response to global warming should include: adaptation policies and actions to protect workers from these conditions; an overall strategy to mitigate climate change and limit further temperature increases; structural reforms to help agricultural workers achieve the transition to other sectors; and measures to prepare for climatic hazards. Equally important is a coherent approach to sustainable economic development.
Heat is an occupational safety and health hazard
Excessive heat during work creates occupational health risks; it restricts a worker’s physical func-tions and capabilities, work capacity and productivity. Temperatures above 24–26°C are associated with reduced labour productivity. At 33–34°C, a worker operating at moderate work intensity loses 50 per cent of his or her work capacity. Exposure to excessive heat levels can lead to heatstroke, sometimes even with a fatal outcome. Workers in all sectors are affected, but certain occupations are especially at risk because they involve more physical effort and/or take place outdoors. Such jobs are typically found in agriculture, environmental goods and services (natural resource management), construction, refuse collection, emergency repair work, transport, tourism and sports. Industrial workers in indoor settings are also at risk if temperature levels inside factories and workshops are not regulated properly. At high heat levels, performing even basic office and desk tasks becomes difficult as mental fatigue sets in.
Heat stress is projected to reduce total working hours worldwide by 2.2 per cent and global GDP by US$2,400 billion in 2030
Projections based on a global temperature rise of 1.5°C by the end of the twenty-first century, and also on labour force trends, suggest that, in 2030, 2.2 per cent of total working hours worldwide will be lost to high temperatures – a productivity loss equivalent to 80 million full-time jobs. This is, however, a conservative estimate because, apart from postulating that the long-term increase in global mean temperature will not exceed 1.5°C, it rests on the assumption that agricultural and construction work is carried out in the shade. This assumption is based partly on the fact that in tropical countries about 40 per cent of days are cloudy, not sunny, and partly on the fact that some tasks, especially in subsistence agriculture, can often be moved to times of the day when it is less hot. If, instead, we assume that agricultural and construction work is carried out in the sun, the projected loss of working hours worldwide in 2030 goes up to 3.8 per cent – the equivalent of 136 million full-time jobs. As global warming continues beyond 2030, greater temperature rises are expected to diminish labour productivity even further.
The economic losses due to heat stress at work were estimated at US$280 billion in 1995; this figure is projected to increase to US$2,400 billion in 2030, with the impact of heat stress being most pronounced in lower-middle- and low-income countries.
Working on a warmer planet: The impact of heat stress on labour productivity and decent work14
Heat stress is more prevalent in countries with decent work deficits
On the whole, the countries that are most affected by heat stress have higher rates of working poverty, informal employment and subsistence agriculture. In addition, disadvantaged and vulnerable population groups and communities – including indigenous and tribal peoples who are dependent on agricultural or coastal livelihoods – are at greater risk of suffering the adverse consequences of rising temperatures. Given that the United Nations 2030 Agenda for Sustainable Development emphasizes the simultaneous achievement of environmental, social and economic goals, it is worth noting that the countries that are expected to be most affected by heat stress are also those with the greatest decent work deficits. A general pattern for most countries is that the greater the number of working hours expected to be lost as a result of heat stress, the lower the coverage of their social protection systems.
The impact of heat stress is unevenly distributed geographically, with the expected reduction in working hours in 2030 amounting to around 5 per cent in both Southern Asia and Western Africa
Some subregions are at a higher risk of suffering the adverse consequences of global warming. Southern Asia and Western Africa are expected to be the worst affected. Under a scenario of 1.5°C global warming by the end of the century, heat stress in these two subregions would lead to the loss of 5.3 per cent and 4.8 per cent of working hours in 2030, corresponding to around 43 million and 9 million full-time jobs, respectively. The European subregions are expected to experience a smaller impact, with their productivity losses projected to be less than 0.1 per cent in all cases. However, in Europe and North America the health, social and economic losses could be substantial during unusually intense heatwaves.
Subregions in tropical and subtropical latitudes are at higher risk of heat stress because of a com-bination of both extreme temperatures and the high share of agriculture in total employment, a sector particularly exposed to heat stress. These are densely populated geographical areas characterized by high rates of informality and vulnerable employment, making workers there particularly susceptible to rising temperatures.
Agricultural and construction workers are expected to be the worst affected, accounting for 60 per cent and 19 per cent, respectively, of working hours lost to heat stress in 2030
The effects of rising average temperatures are felt differently across occupations and employment sectors. For example, jobs involving high levels of physical exertion or prolonged work outdoors are particularly affected by increasing heat levels. Agricultural and construction workers are expected to be the worst affected. The agricultural sector alone accounted for 83 per cent of global working hours lost to heat stress in 1995 and is projected to account for 60 per cent of such loss in 2030. Further temperature rises will make some agricultural areas unproductive, displacing a large number of workers. Whereas construction accounted for just 6 per cent of global working hours lost to heat stress in 1995, this share is expected to increase to 19 per cent by 2030. Significantly, most of the working hours lost to heat stress in North America, Western Europe, Northern and Southern Europe and in the Arab States are concentrated in the construction sector.
Heat stress exacerbates inequality and contributes to the displacement of people
Labour productivity losses caused by heat stress are concentrated in subregions with already pre-carious labour market conditions, such as high rates of vulnerable employment and working poverty. Additionally, heat stress is more common in agriculture and construction – two sectors that are char-acterized by a high level of informality. The challenges of heat stress could widen existing gender gaps in the world of work, notably by making working conditions worse for the many women employed in subsistence agriculture (although, of course, conditions for men working on construction sites would also become more arduous). Heat exposure during work adds to the health and productivity risks faced by pregnant women.
Heat stress may also act as a push factor prompting agricultural workers to leave rural areas in search of better prospects in the cities or in other countries. Although various factors ultimately contribute to the decision to migrate (e.g. inequality, lack of opportunities or social ties, conflicts and other security issues), heat stress is increasingly becoming a driver of international migration. Higher levels of heat stress were associated with higher out-migration in recent years, suggesting households take climate conditions into account in their migration decisions.
Executive summary 15
The age distribution of populations will be an important determinant of the future of work under con-ditions of heat stress because, for both women and men, ageing results in changes to the regulation of body temperature. Moreover, people aged over 50 are at greater risk of suffering from cardiovascular diseases. These factors need to be considered in the design of adaptation measures.
For workers and businesses to be able to cope with heat stress, appropriate policies, technological investments and behavioural change are required
Efforts to improve the capacity of workplaces to adapt to rising temperatures are necessary if the goals of the 2030 Agenda are to be achieved. Although governments are instrumental in creating a regulatory and institutional environment that facilitates behavioural change at the workplace level, the role of both employers’ and workers’ organizations is no less crucial to a successful implemen-tation of adaptation measures. In addition to the enforcement of occupational safety and health standards, appropriate measures are necessary to improve early warning systems for heat events and to ensure that social protection covers the entire population. International labour standards, such as the Occupational Safety and Health Convention, 1981 (No. 155), can help to guide governments when designing national policies to tackle the occupational safety and health hazards associated with heat stress.
A sectoral response to heat stress in agriculture and construction should include technological improvements, skills development and awareness raising
Around 60 per cent of the reduction in working hours projected to take place worldwide in 2030 as a result of heat stress is concentrated in the agricultural sector. Indeed, agriculture is expected to account for more than 90 per cent of the working hours lost in Central and Eastern Africa in that year owing to heat stress. Because of the impact of such productivity losses on the yields of subsistence agriculture and hence on food prices, the consequences would be greater poverty and food insecurity. The long-term options for reducing the impact of heat stress on agriculture include promoting mechan-ization and skills development in order to ensure higher productivity and food security. Measures for monitoring and raising awareness of local weather conditions, such as those currently being applied in Kenya, can help rural households to adapt to heat stress conditions.
As for the construction sector, smart urban planning could help significantly to mitigate heat stress on construction sites in large cities in the medium and long term. Moreover, specific measures for the monitoring of on-site weather conditions, enhanced information sharing and communication, and technological improvements can enable construction workers and their employers to adapt more effectively to heat stress.
Governments, employers and workers are the primary drivers of change in adaptation to, and mitigation of, the effects of rising temperatures on the world of work
Governments must work together with workers’ and employers’ organizations, through social dialogue, in designing, implementing and monitoring mitigation and adaptation policies, as recommended in the ILO’s 2015 Guidelines for a just transition towards environmentally sustainable economies and societies for all. Social dialogue plays a crucial role in the development of national policies, including policies on occupational safety and health. With the help of social dialogue tools, such as collective agreements, employers and workers can design and implement policies for dealing with heat stress that are tailored to the specific needs and realities of their workplace.
17
The world of work is intimately connected with the natural environment. Environmental degradation directly affects the world of work in a negative way. Both the availability of jobs and the provision of safe, healthy and decent working conditions rely on the absence of environmental hazards and the preservation of environmental stability. The risks and hazards associated with environmental deg-radation tend to affect vulnerable workers most strongly (ILO, 2018a). The increasing frequency and intensity of natural disasters associated with human activity have already caused productivity losses. Looking ahead, projected temperature increases will make heat stress more common, reducing the total number of working hours and affecting, above all, vulnerable workers in developing countries. The damage resulting from unmitigated climate change is therefore a direct threat to the growth of real gross domestic product (GDP), as well as to labour productivity and working conditions (ILO, 2018b).
Heat stress is a health hazard…
“Heat stress” refers to heat received in excess of that which the body can tolerate without suffering physiological impairment (Kjellstrom et al., 2016). Maintaining a core body temperature of around 37°C is essential for continued normal body function. Achieving this body temperature equilibrium requires a constant exchange of heat between the body and the environment. The amount of heat that must be exchanged depends on the total heat produced by the body from muscular physical activity and the heat gained, if any, from the environment (NIOSH, 2016). Four environmental factors contribute to the stress level experienced by a worker in a workplace with hot conditions: temperature, humidity, radiant heat (e.g. from the sun or a furnace) and wind speed (EHS, 2018).
Above a certain threshold of heat stress, the body’s internal regulation mechanisms are no longer capable of maintaining body temperature at a level required for normal functioning. As a result, there is an increased risk of discomfort, of limitations in physical functions and capabilities, and ultimately also of injuries and heat-related illnesses. The latter illnesses range from mild forms, such as heat rash, heat cramps and heat exhaustion, to potentially fatal heatstroke. If the body temperature rises above 38°C (“heat exhaustion”), physical and cognitive functions are impaired; if it rises above 40.6°C (“heatstroke”), the risk of organ damage, loss of consciousness and, ultimately, death increases sharply (IPCC, 2014a). Physiological heat acclimatization1 may offer some protection, but only up to a point; moreover, it can only be developed after a certain transition period (typically one to two weeks of heat exposure). During peak heat periods in some hot countries, the acclimatization threshold of workers is exceeded far too often and the risks of working under high temperatures persist.
… which endangers the safety of workers and reduces their productivity…
A worker’s natural defence mechanism against heat stress is to slow down work, take more frequent and longer breaks and/or limit the number of working hours, all of which, in turn, reduce productivity, economic output and family income. International standards have been issued that specify maximum recommended heat exposure levels and prescribe regular rest periods at workplaces for both accli-matized and non-acclimatized workers (ISO, 1989; Parsons, 2003). The Hygiene (Commerce and Offices) Recommendation, 1964 (No. 120), stipulates that “[w]hen work is carried out in a very low
1. Heat acclimatization or acclimation happens through repeated natural (acclimatization) or artificial (acclimation) heat exposures that are sufficiently stressful to elevate both core and skin temperatures. Such biological adaptation reduces physiological strain (e.g. heart rate and body temperatures), improves comfort, enhances the capacity for physical activity and reduces the risk of serious heat-related illness during exposure to heat stress (Sawka, Périard and Racinais, 2016).
1. Heat stress and decent work
Working on a warmer planet: The impact of heat stress on labour productivity and decent work18
or a very high temperature, workers should be given a shortened working day or breaks included in the working hours, or other relevant measures taken” (Para. 25).
Exposure to extreme heat can result in occupational illnesses and productivity losses, as well as increasing the risk of injury. Specific negative effects include sweaty palms, fogged-up safety glasses, dizziness and an impairment of brain function responsible for reasoning ability, which of course creates additional hazards. Heat-related occupational safety and health risks are exacerbated in workplaces that are poorly ventilated and lack cooling systems (ILO, 2019). Moreover, the majority of workers suffering from heat stress in developing countries are not covered by employment injury insurance and are thus unable to enjoy the requisite medical care and sickness benefits during the period of incapacity for work, or a disability pension if their earning capacity is reduced. Nor can their families claim a survivors’ pension in case of the breadwinner’s death. Even in global terms, only 34 per cent of individuals of working age are covered in the event of an injury at work (ILO, 2017a).
… unevenly across sectors and regions.
The impact of heat stress varies across different employment sectors and geographical regions. For instance, jobs that involve high levels of physical exertion are particularly affected by increasing heat levels because the physical activity itself causes the body to produce a lot of internal heat, which must be released to prevent the onset of heat strain. Jobs that require workers to wear heavy clothing and personal protective equipment are also more likely to be affected by heat stress. Agricultural and construction workers are therefore among the most exposed (IPCC, 2014a). However, heat stress can become a problem for industrial workers in indoor settings, too, if temperature levels inside factories and workshops are not regulated properly. Certain service sector occupations are also affected by increasing heat levels, including jobs in refuse collection, emergency repair work, transport, tourism and sports. Even basic office and desk tasks become difficult to perform at high temperatures as mental exhaustion sets in (Hancock, Ross and Szalma, 2007; Costa et al., 2016).
The fact that the most vulnerable workers in developing and emerging countries (e.g. the self- employed in agriculture or migrant workers in the construction sector) are the hardest hit by heat stress raises questions of social justice. The social equity challenges of heat exposure are already making them-selves felt in some tropical areas (Kjellstrom et al., 2018). No less than 79 per cent of the total population of low-income countries lives in tropical areas.
Exacerbated by climate change, heat stress impedes progress towards decent work and social justice…
The higher heat levels caused by climate change threaten progress towards decent work by leading to a deterioration of working conditions and undermining the security, health and well-being of workers, as well as reducing their productivity, which is closely tied to living standards. Because of the link between employment type and heat conditions at work, when making projections of heat stress incidence it is necessary to take into account the employment distribution in the country or region in question, together with various other labour market indicators.
Although the physiological effects of workplace heat exposure have been studied since the 1950s, the debate on the impact of heat stress on decent work in the context of climate change has gained momentum only quite recently. Concerns over workplace heat exposure were first raised in the Fourth Assessment Report of the Intergovernmental Panel on Climate Change (IPCC, 2007) and received a stronger focus in the IPCC’s Fifth Assessment Report (2014a and 2014b). Attaining a better understanding of the issue became possible only when the results of long-standing research into physiological responses to heat were combined with the emerging science of climate change. The late recognition of climate change as a scientific discipline has delayed policy responses.
Ongoing global climate change is making occupational safety and health risks more severe for a large share of the global working population (Kjellstrom et al., 2009; Flouris et al., 2018). Unless timely action is taken, more than 4 billion people living in hot areas will experience negative health and safety effects and suffer from reduced work capacity in the course of the twenty-first century (Kjellstrom et al., 2016). When local conditions become excessively hot, migration to cooler areas is very often the only solution (IOM, 2017).
The altered thermal conditions at many workplaces worldwide are leading to non-compliance with international standards (e.g. ISO, 2017) and with ILO guidelines and codes of practice on hot work-place environments (e.g. ILO, 2001a and 2001b) as companies struggle to adapt to the increasing heat. Also, future episodes of extreme heat are likely to prompt many vulnerable workers to migrate, exacerbating current migration patterns (IOM, 2017). That climate change is one of the root causes of
1. Heat stress and decent work 19
migration is recognized in the Paris Agreement, which contains a specific reference to “migrants” in its preamble (UNFCCC, 2015). Indeed, migrant workers are often among the most severely affected by climate-related risks. However, internal or international migration also constitutes a feasible strategy for adaptation to climate change, if regular migration channels are open to workers, for example, opportunities for seasonal or temporary work in cooler areas.
… and, more generally, jeopardizes achievement of the Sustainable Development Goals unless concrete measures are taken.
The impact of heat stress on labour productivity is likely to be among the most serious economic consequences of climate change. Economic losses are expected to occur at various levels, affecting individual workers, their families, businesses and entire communities. In the case of heavily exposed economies, the effects could be so strong as to undermine national economic output, which in turn would have implications for the global outlook. The economic, social and health effects of heat stress would make it harder to tackle poverty and promote human development, and, consequently, also to attain most of the United Nations Sustainable Development Goals (SDGs), including those related to poverty, food security, health, decent work and economic growth, inequality and cities.
If no efforts are undertaken to improve the adaptive capacities2 of workplaces across all countries, rising temperatures are likely to jeopardize progress towards the environmental, social and economic sustainability objectives laid down in the SDGs (table 1.1).
It is clear that preventive measures must be taken proactively to deal with heat stress. Together with governments, both employers and workers should be involved in the design and implementation of mitigation and adaptation policies. As indicated in the ILO’s 2015 Guidelines for a just transition towards environmentally sustainable economies and societies for all (hereinafter referred to as the ILO Guidelines for a just transition), workers and employers are best placed to implement adaptation measures and to take action at the workplace, such as ensuring compliance with health and safety standards and finding practical solutions to enable workers to cope with high temperatures and con-tinue to do their jobs.
This report looks at the impact of rising temperatures, and of the increasing frequency and intensity of heatwaves, on decent work and labour productivity. Drawing on climate and employment data, it presents estimates of the current and projected productivity losses resulting from heat stress at the national, regional and global levels. Our analysis takes into account the fact that temperature, humidity, wind speed, physical intensity and other factors affect the way in which rising temper-atures impact on the physical work capacity of workers. Productivity loss is measured in terms of reduced work capacity and translated into an equivalent number of working hours lost.3 The effects of heat stress on workers are reported for four sectors, to each of which we have assigned one of three levels of physical work intensity. Higher physical work intensity is assumed for workers in agri-culture and construction (these workers are also assumed to work outdoors), moderate intensity for industrial workers,4 and lower intensity for service workers. The report continues with a discussion of relevant adaptation and mitigation policies. In the short run, proactive employment policies and appropriate climate change adaptation measures are required to enable workers, businesses and vulnerable households to adapt to rising temperatures. In the long term, climate change mitigation is indispensable if occupational heat stress is to be prevented and the future labour force protected from heat-related risks.
2. “Adaptive capacity” refers to the potential, capability or ability of a system to adapt to climate change stimuli or their effects or impacts (IPCC, 2014a).3. For example, up to a temperature of around 24°C workers do not slow down and there is no impact on their work capacity. However, at around 33–34°C, assuming a job of moderate physical intensity, 50 per cent of their work capacity is lost. This means that in one hour a worker produces only half of what he or she would have been able to produce in the absence of heat stress, which translates into the equivalent of 0.5 working hours lost (see Appendix I). The exposure–response functions we have used are derived from epidemiological data (Wyndham, 1969; Sahu, Sett and Kjellstrom, 2013).4. For the purposes of this report, construction is considered separately from the industry sector. The latter therefore includes mainly mining, manufacturing and utilities.
Working on a warmer planet: The impact of heat stress on labour productivity and decent work20
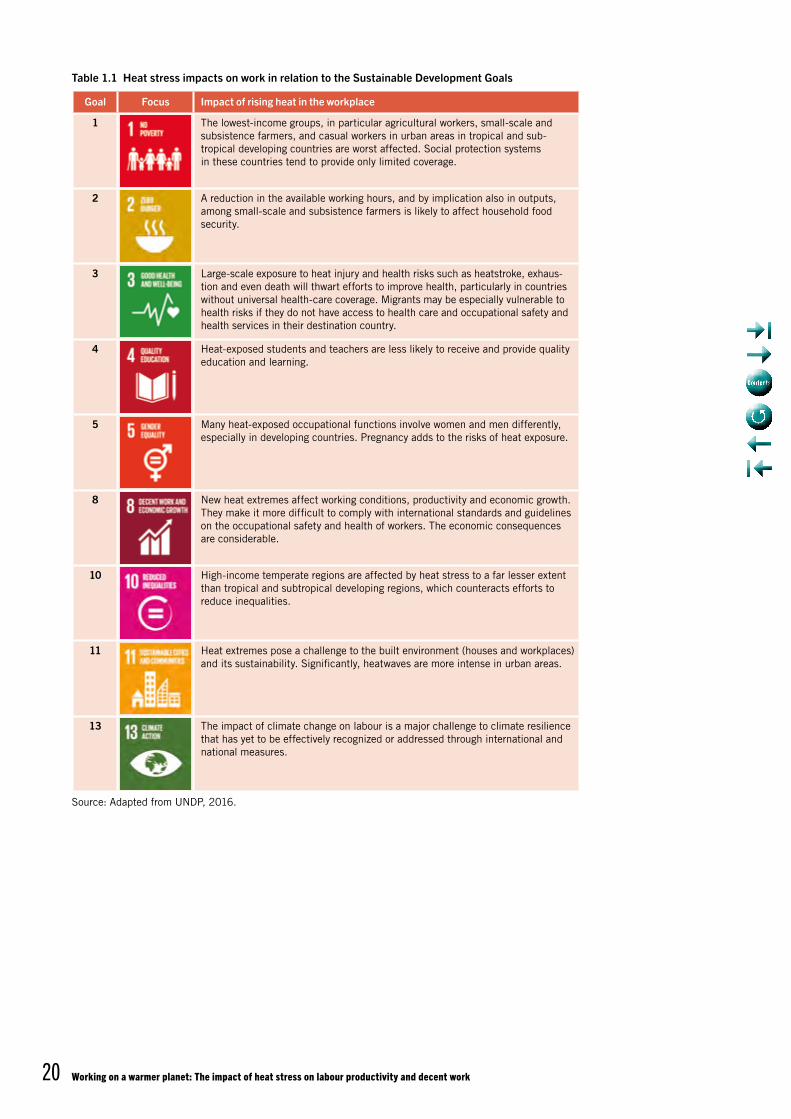
Table 1.1 Heat stress impacts on work in relation to the Sustainable Development Goals
Goal Focus Impact of rising heat in the workplace
1 The lowest-income groups, in particular agricultural workers, small-scale and subsistence farmers, and casual workers in urban areas in tropical and sub-tropical developing countries are worst affected. Social protection systems in these countries tend to provide only limited coverage.
2 A reduction in the available working hours, and by implication also in outputs, among small-scale and subsistence farmers is likely to affect household food security.
3 Large-scale exposure to heat injury and health risks such as heatstroke, exhaus-tion and even death will thwart efforts to improve health, particularly in countries without universal health-care coverage. Migrants may be especially vulnerable to health risks if they do not have access to health care and occupational safety and health services in their destination country.
4 Heat-exposed students and teachers are less likely to receive and provide quality education and learning.
5 Many heat-exposed occupational functions involve women and men differently, especially in developing countries. Pregnancy adds to the risks of heat exposure.
8 New heat extremes affect working conditions, productivity and economic growth. They make it more difficult to comply with international standards and guidelines on the occupational safety and health of workers. The economic consequences are considerable.
10 High-income temperate regions are affected by heat stress to a far lesser extent than tropical and subtropical developing regions, which counteracts efforts to reduce inequalities.
11 Heat extremes pose a challenge to the built environment (houses and workplaces) and its sustainability. Significantly, heatwaves are more intense in urban areas.
13 The impact of climate change on labour is a major challenge to climate resilience that has yet to be effectively recognized or addressed through international and national measures.
Source: Adapted from UNDP, 2016.
21
2.1 Climate change and the rising incidence of heat stress
This section discusses global heat levels and presents an overall picture of the countries and regions that are at risk. In order to estimate the incidence of heat stress, one of the most common heat stress indices in occupational health is used, namely the wet bulb globe temperature (WBGT), measured in degrees Celsius. The WBGT index was specifically designed for work activity assessments and is calculated on the basis of temperature, humidity, air movement (wind speed) and radiated heat (sun or shade) (Parsons, 2014). For the purposes of our analysis we have calculated the maximum WBGT value for the hottest month in small geographical areas (grid cells), following the same method that was used to identify heat threats to occupational health in the latest IPCC Assessment Report (IPCC, 2014a).
The heat levels and trends presented in this section cover two periods of 30 years each. Thirty-year averages are used because the climate science community regards 30 years as the minimum time period over which a long-term climate trend, as opposed to weather or extreme events, can be demon-strated (WMO, 2018). The values presented for climate variables are therefore “snapshots” of the 30-year mean of these two 30-year periods. For example, figure 2.1 covers the years 1981–2010 and offers a snapshot of the climate in 1995, while figure 2.2 covers the years 2071–20991 and offers a snapshot of the projected climate in 2085.
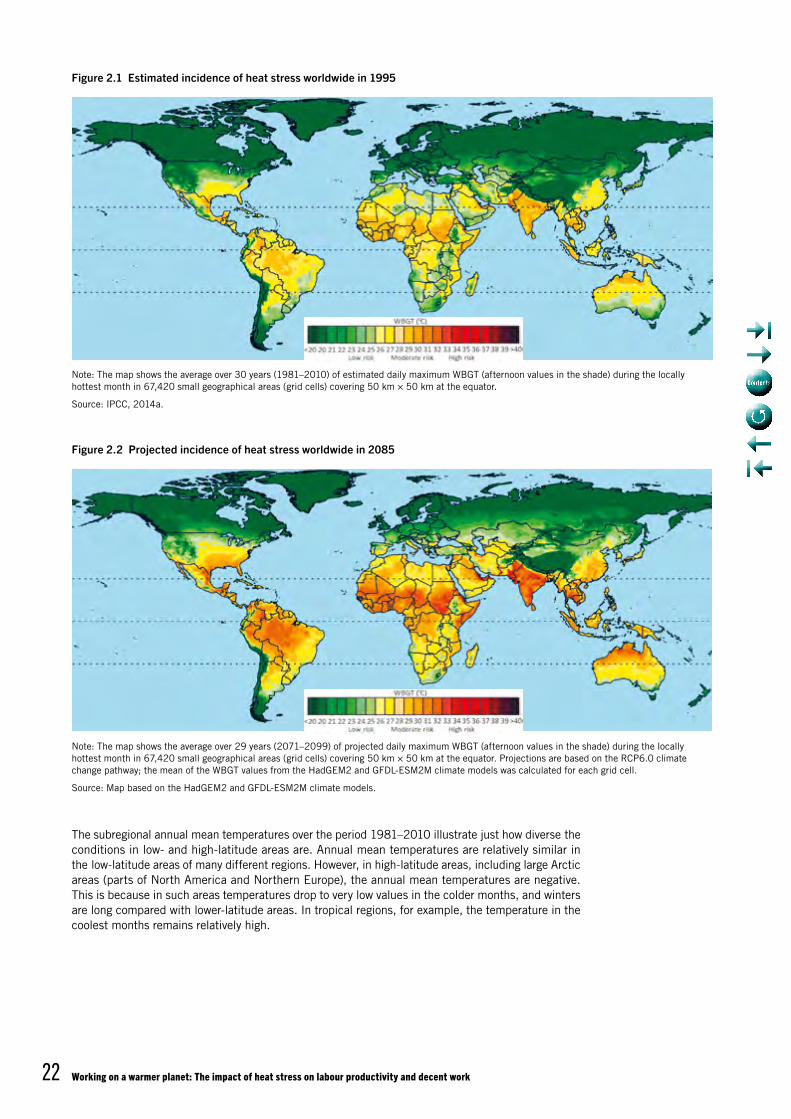
The distribution of heat stress in the world is not uniform. As can be seen in figure 2.1, the tropical and subtropical areas are the hottest overall. The month that is actually the hottest in each of these areas depends on several variables, such as wind patterns and monsoons. It is worth noting that the WBGT values shown in this figure are based on temperatures measured in the shade; in full afternoon sun conditions they would be around 2–3°C higher.2
To help workers in hot areas cope with the heat, certain adjustments need to be made, such as scheduling work appropriately and allowing for rest periods to reduce heat strain on their bodies. This is an example of an existing climate-related impact on labour productivity. The only cool areas in the tropical and subtropical latitudes are to be found at high altitudes, including parts of Mexico and South America (the Andes), Eastern Africa (Ethiopia and Kenya) and Asia (Tibet and the Himalayas). Consequently, workforce output in tropical and subtropical regions is already lower than that in cooler regions (Gallup, Sachs and Mellinger, 1999).
Figure 2.2 shows, using the same colour scheme, the projected incidence of heat stress in 2085 under a scenario in which the global mean temperature increases by 2.7°C above pre-industrial levels by the end of the century in accordance with Representative Concentration Pathway 6.0 (RCP6.0). The latter is one of the four scenarios for the evolution of atmospheric concentrations of greenhouse gases (GHGs) adopted by the IPCC (2014b), which correspond to four different climate futures. As can be seen from comparison with figure 2.1, the greatest increases in heat stress in populated areas are expected to occur in sub-Saharan Africa, southern India, northern Australia and South-East Asia.
1. This is a 29-year period (2071–2099) because of the availability of climate data used for modelling.
2. To calculate the heat stress index for work in the sun in the afternoon it is necessary to add 2°C to the in-shade WBGT (Kjellstrom, Lemke and Otto, 2013).
2. Global overview
Working on a warmer planet: The impact of heat stress on labour productivity and decent work22
The subregional annual mean temperatures over the period 1981–2010 illustrate just how diverse the conditions in low- and high-latitude areas are. Annual mean temperatures are relatively similar in the low-latitude areas of many different regions. However, in high-latitude areas, including large Arctic areas (parts of North America and Northern Europe), the annual mean temperatures are negative. This is because in such areas temperatures drop to very low values in the colder months, and winters are long compared with lower-latitude areas. In tropical regions, for example, the temperature in the coolest months remains relatively high.
Note: The map shows the average over 30 years (1981–2010) of estimated daily maximum WBGT (afternoon values in the shade) during the locally hottest month in 67,420 small geographical areas (grid cells) covering 50 km × 50 km at the equator.
Source: IPCC, 2014a.
Note: The map shows the average over 29 years (2071–2099) of projected daily maximum WBGT (afternoon values in the shade) during the locally hottest month in 67,420 small geographical areas (grid cells) covering 50 km × 50 km at the equator. Projections are based on the RCP6.0 climate change pathway; the mean of the WBGT values from the HadGEM2 and GFDL-ESM2M climate models was calculated for each grid cell.
Source: Map based on the HadGEM2 and GFDL-ESM2M climate models.
Figure 2.1 Estimated incidence of heat stress worldwide in 1995
Figure 2.2 Projected incidence of heat stress worldwide in 2085
2. Global overview 23
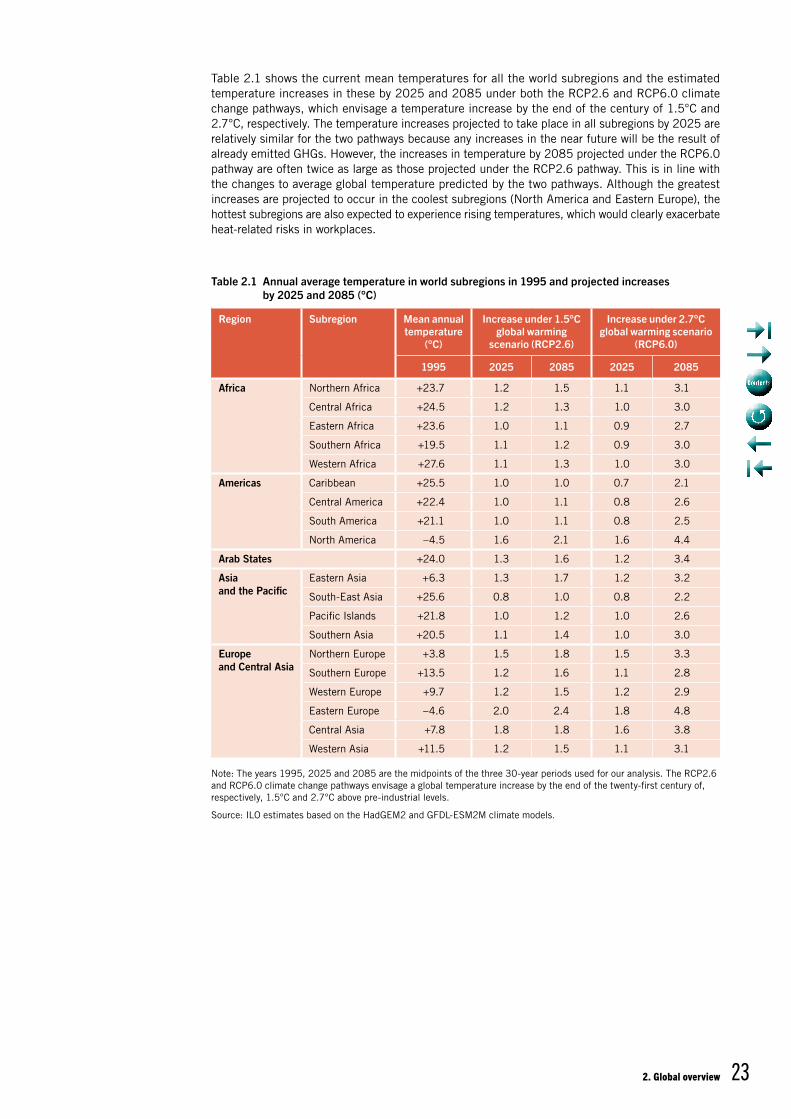
Table 2.1 shows the current mean temperatures for all the world subregions and the estimated temperature increases in these by 2025 and 2085 under both the RCP2.6 and RCP6.0 climate change pathways, which envisage a temperature increase by the end of the century of 1.5°C and 2.7°C, respectively. The temperature increases projected to take place in all subregions by 2025 are relatively similar for the two pathways because any increases in the near future will be the result of already emitted GHGs. However, the increases in temperature by 2085 projected under the RCP6.0 pathway are often twice as large as those projected under the RCP2.6 pathway. This is in line with the changes to average global temperature predicted by the two pathways. Although the greatest increases are projected to occur in the coolest subregions (North America and Eastern Europe), the hottest subregions are also expected to experience rising temperatures, which would clearly exacerbate heat-related risks in workplaces.
Table 2.1 Annual average temperature in world subregions in 1995 and projected increases by 2025 and 2085 (°C)
Region Subregion Mean annual temperature
(°C)
Increase under 1.5°C global warming
scenario (RCP2.6)
Increase under 2.7°C global warming scenario
(RCP6.0)
1995 2025 2085 2025 2085
Africa Northern Africa +23.7 1.2 1.5 1.1 3.1
Central Africa +24.5 1.2 1.3 1.0 3.0
Eastern Africa +23.6 1.0 1.1 0.9 2.7
Southern Africa +19.5 1.1 1.2 0.9 3.0
Western Africa +27.6 1.1 1.3 1.0 3.0
Americas Caribbean +25.5 1.0 1.0 0.7 2.1
Central America +22.4 1.0 1.1 0.8 2.6
South America +21.1 1.0 1.1 0.8 2.5
North America –4.5 1.6 2.1 1.6 4.4
Arab States +24.0 1.3 1.6 1.2 3.4
Asia and the Pacific
Eastern Asia +6.3 1.3 1.7 1.2 3.2
South-East Asia +25.6 0.8 1.0 0.8 2.2
Pacific Islands +21.8 1.0 1.2 1.0 2.6
Southern Asia +20.5 1.1 1.4 1.0 3.0
Europe and Central Asia
Northern Europe +3.8 1.5 1.8 1.5 3.3
Southern Europe +13.5 1.2 1.6 1.1 2.8
Western Europe +9.7 1.2 1.5 1.2 2.9
Eastern Europe –4.6 2.0 2.4 1.8 4.8
Central Asia +7.8 1.8 1.8 1.6 3.8
Western Asia +11.5 1.2 1.5 1.1 3.1
Note: The years 1995, 2025 and 2085 are the midpoints of the three 30-year periods used for our analysis. The RCP2.6 and RCP6.0 climate change pathways envisage a global temperature increase by the end of the twenty-first century of, respectively, 1.5°C and 2.7°C above pre-industrial levels.
Source: ILO estimates based on the HadGEM2 and GFDL-ESM2M climate models.
Working on a warmer planet: The impact of heat stress on labour productivity and decent work24
2.2 Labour market trends and exposure to heat stress
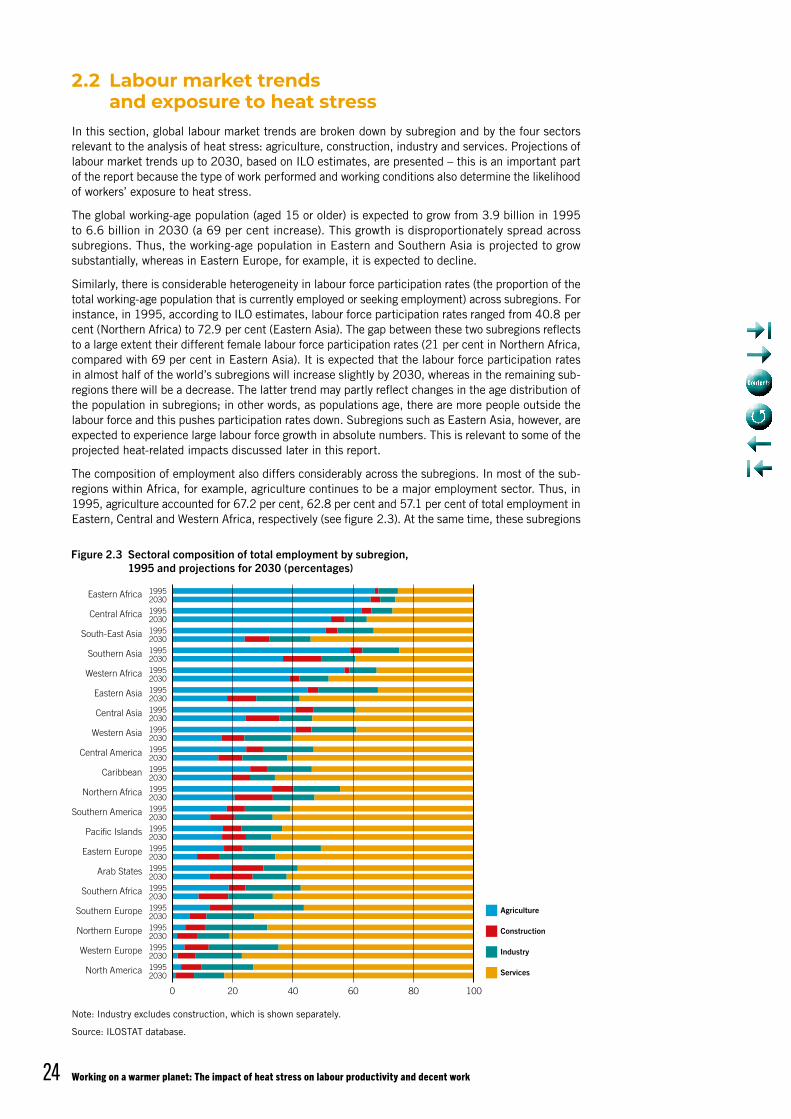
In this section, global labour market trends are broken down by subregion and by the four sectors relevant to the analysis of heat stress: agriculture, construction, industry and services. Projections of labour market trends up to 2030, based on ILO estimates, are presented – this is an important part of the report because the type of work performed and working conditions also determine the likelihood of workers’ exposure to heat stress.
The global working-age population (aged 15 or older) is expected to grow from 3.9 billion in 1995 to 6.6 billion in 2030 (a 69 per cent increase). This growth is disproportionately spread across subregions. Thus, the working-age population in Eastern and Southern Asia is projected to grow substantially, whereas in Eastern Europe, for example, it is expected to decline.
Similarly, there is considerable heterogeneity in labour force participation rates (the proportion of the total working-age population that is currently employed or seeking employment) across subregions. For instance, in 1995, according to ILO estimates, labour force participation rates ranged from 40.8 per cent (Northern Africa) to 72.9 per cent (Eastern Asia). The gap between these two subregions reflects to a large extent their different female labour force participation rates (21 per cent in Northern Africa, compared with 69 per cent in Eastern Asia). It is expected that the labour force participation rates in almost half of the world’s subregions will increase slightly by 2030, whereas in the remaining sub-regions there will be a decrease. The latter trend may partly reflect changes in the age distribution of the population in subregions; in other words, as populations age, there are more people outside the labour force and this pushes participation rates down. Subregions such as Eastern Asia, however, are expected to experience large labour force growth in absolute numbers. This is relevant to some of the projected heat-related impacts discussed later in this report.
The composition of employment also differs considerably across the subregions. In most of the sub-regions within Africa, for example, agriculture continues to be a major employment sector. Thus, in 1995, agriculture accounted for 67.2 per cent, 62.8 per cent and 57.1 per cent of total employment in Eastern, Central and Western Africa, respectively (see figure 2.3). At the same time, these subregions
Figure 2.3 Sectoral composition of total employment by subregion, 1995 and projections for 2030 (percentages)
Note: Industry excludes construction, which is shown separately.
Source: ILOSTAT database.
North America
Western Europe
Northern Europe
Southern Europe
Southern Africa
Arab States
Eastern Europe
Pacific Islands
1995203019952030199520301995203019952030199520301995203019952030199520301995203019952030199520301995203019952030199520301995203019952030199520301995203019952030
Southern America
Northern Africa
Caribbean
Central America
Western Asia
Central Asia
Eastern Asia
Western Africa
Southern Asia
South-East Asia
Central Africa
Eastern Africa
Agriculture
Construction
Industry
Services
0 10020 40 60 80
2. Global overview 25
exhibit moderate to high risk of exposure to heat stress. The combination of high agricultural employment and geographical location makes these subregions prone to severe heat-related impacts, intensifying the associated health risks for workers and increasing the number of working hours lost. Subregions with a high share of employment in the construction sector, such as the Arab States, are also likely to be susceptible to heat-related hazards. By contrast, in North America and several European subregions agriculture accounts for a low share of total employment. With the exception of certain areas of North America, these subregions exhibit a low risk of exposure to heat stress.
It is worth noting that, depending on their stage of development, certain areas possess greater adaptive capacities than others. Financial resources for the creation and upgrading of infrastructure, institu-tional ability to adapt regulations (particularly occupational safety and health regulations) to reflect altered working conditions, awareness raising and training are some of the means by which advanced countries can deal with heat exposure. Subregions within Africa and Asia, where workers are at high risk of suffering heat-related impacts, have a lower adaptive capacity than, say, European subregions, where heat-related issues are less pronounced.
Changing demographics and the increase in heat stress will determine various future social and labour market challenges in many parts of the world, notably in Asia and the Pacific. First, the projected increase in that region’s population from 3 billion in 1990 to 4.6 billion in 2030 (estimates based on the ILOSTAT database) means that many more people in Asia and the Pacific will be affected by heat stress in their daily lives. Second, population ageing aggravates the detrimental effects of heat stress because older people generally have more difficulties in adapting to high heat levels. Indeed, older adults are at greater risk of suffering heat stress on account of their diminished capacity to dissipate heat through skin blood flow and sweating (McGregor et al., 2015). As for the labour market impacts, looking at the share of older workers (aged 55–64), measured as a percentage of the total population, gives an idea of the challenges lying ahead. In Asia and the Pacific, older workers represented 6 per cent of the total population in 1990, and it is expected that this share will increase to 11 per cent in 2030 (estimates based on ILOSTAT).
2.3 MethodologyThe methodology we used to determine the impact of heat stress on labour productivity combines climate models and global temperature projections with labour force projections and occupational health data. The correlation between projected temperature, heat stress and labour productivity was estimated using a combination of data sources and models (Kjellstrom et al., 2018). Table 2.2 pro-vides a simplified summary of the data sources and models used, and of the analytical steps performed (they are explained further in Appendix I).
Data sources include historical data on temperature, humidity and wind speed from the Climatic Research Unit at the University of East Anglia. Climate projections are based on general circulation models agreed on by the IPCC to obtain climate parameter outputs on the basis of GHG emissions and atmosphere–ocean coupling. The projections also draw on data from the Inter-Sectoral Impact Model Intercomparison Project, and from the HadGEM2 (Hadley Centre Global Environmental Model, version 2) and GFDL-ESM2M (Geophysical Fluid Dynamics Laboratory) climate models for the RCP2.6 scenario, which envisages global warming of 1.5°C by the end of the century. It is worth noting here that the projected heat levels in all parts of the world in 2030 are similar under all four RCP scen-arios; significant differences start to appear later in the century. Population data are taken from the “Gridded Population of the World” data set, which is based on United Nations population estimates and assessments of age distribution carried out by the International Institute for Applied Systems Analysis (Lutz, Butz and KC, 2014).
Working on a warmer planet: The impact of heat stress on labour productivity and decent work26
2.4 Heat stress and its effect on labour productivity
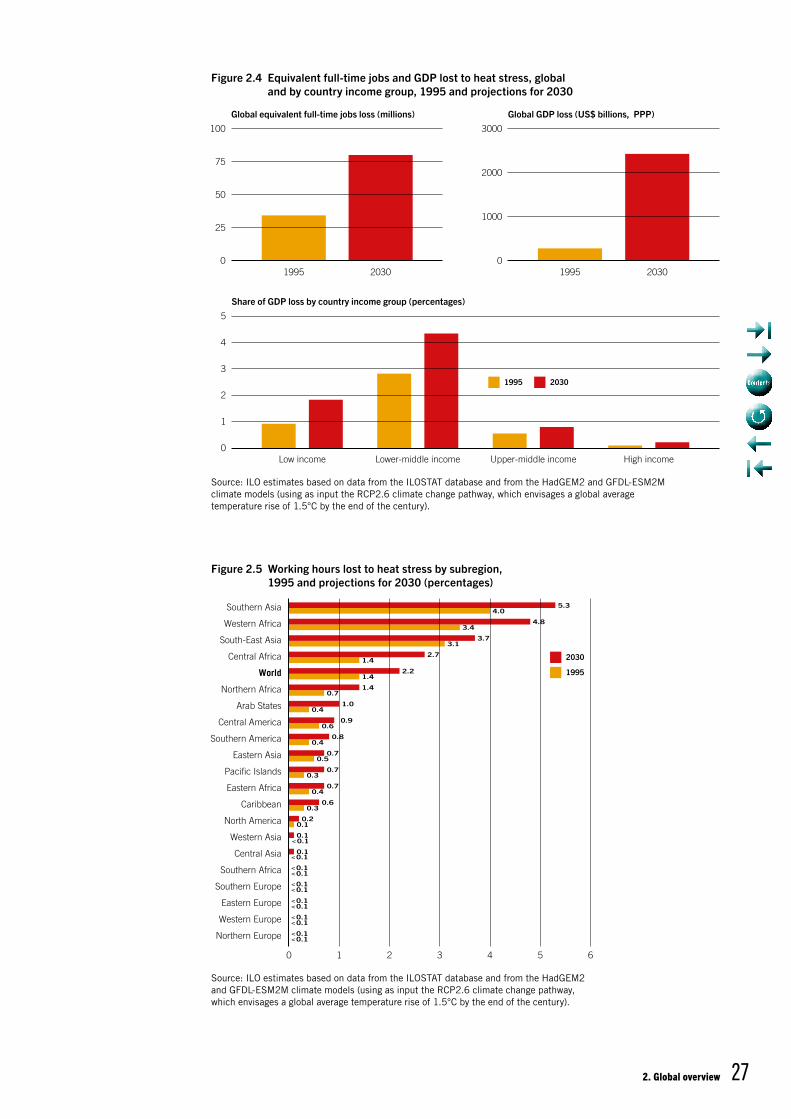
An estimated 1.4 per cent of total working hours were lost worldwide in 1995 as a result of high heat levels – the equivalent of around 35 million full-time jobs (see figure 2.4). The resulting GDP loss is estimated to have been US$280 billion in purchasing power parity (PPP) terms. Estimates obtained by combining a global temperature rise of 1.5°C by the end of the twenty-first century with labour force trends suggest that, by 2030, when the global temperature is expected to have risen by about 1.3°C, the share of total working hours lost will rise to 2.2 per cent – a productivity loss equivalent to 80 million full-time jobs. The loss in monetary terms is then expected to total US$2,400 billion (PPP). Lower-middle- and low-income countries would be the worst affected, losing 4 and 1.5 per cent of their GDP in 2030, respectively. These results are in line with a study that points to losses of US$311 billion (PPP) in 2010 and US$2,400 billion (PPP) in 2030 (DARA and Climate Vulnerable Forum, 2012). GDP loss will increase by up to 9 per cent for a representative low-income country in 2100 (IMF, 2017).
The above figures are almost certainly underestimates, however, since the projections assume that the increase in global mean temperature by the end of the century will not exceed 1.5°C, as well as assuming that agricultural and construction work is carried out in the shade. (For a comparison of in-sun and in-shade estimates, see Appendix II.) The economic loss due to decreased labour product-ivity is expected to be greater than that caused by any other major disruption related to climate change, including sea-level rise and biodiversity loss (for a comparison between these phenomena, see DARA and Climate Vulnerable Forum, 2012).
The negative impact of rising temperatures is unevenly distributed across subregions (see figure 2.5). Southern Asia and Western Africa are expected to be the subregions most affected by heat stress, with productivity losses in 2030 of 5.3 per cent and 4.8 per cent, corresponding to around 43 and 9 million full-time jobs, respectively.
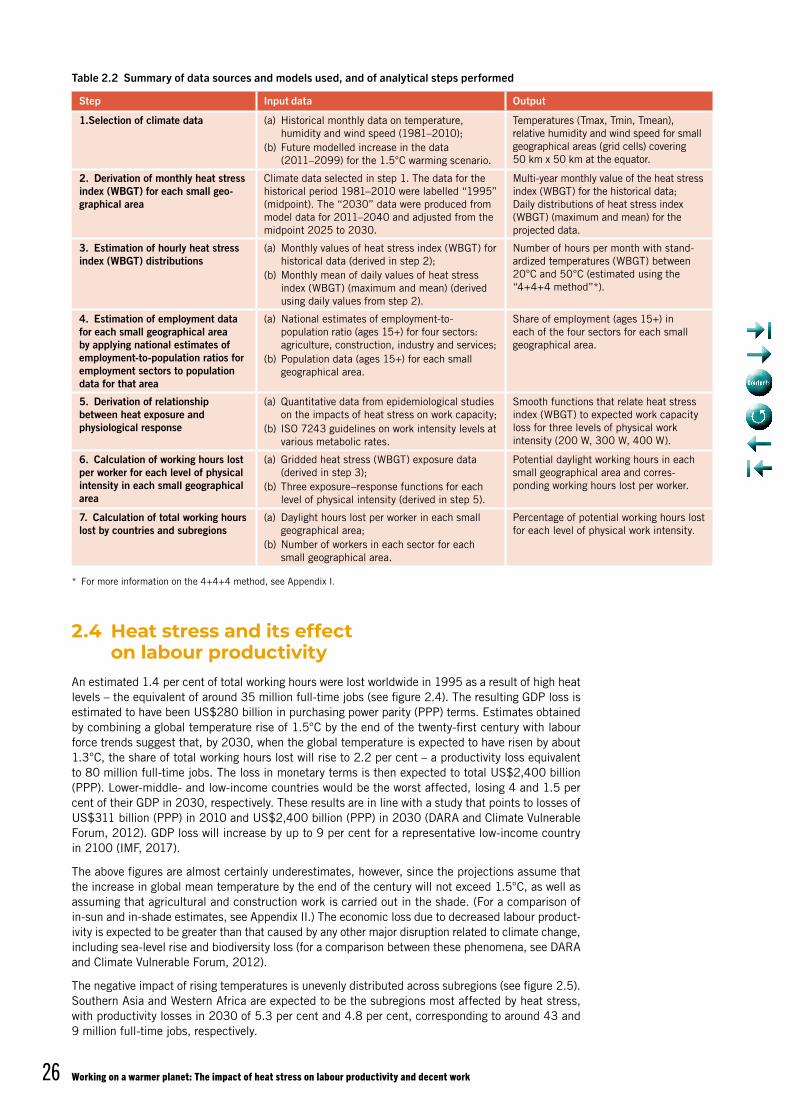
Table 2.2 Summary of data sources and models used, and of analytical steps performed
Step Input data Output
1.Selection of climate data (a) Historical monthly data on temperature, humidity and wind speed (1981–2010);
(b) Future modelled increase in the data (2011 – 2099) for the 1.5°C warming scenario.
Temperatures (Tmax, Tmin, Tmean), relative humidity and wind speed for small geographical areas (grid cells) covering 50 km x 50 km at the equator.
2. Derivation of monthly heat stress index (WBGT) for each small geo-graphical area
Climate data selected in step 1. The data for the historical period 1981–2010 were labelled “1995” (midpoint). The “2030” data were produced from model data for 2011–2040 and adjusted from the midpoint 2025 to 2030.
Multi-year monthly value of the heat stress index (WBGT) for the historical data;Daily distributions of heat stress index (WBGT) (maximum and mean) for the projected data.
3. Estimation of hourly heat stress index (WBGT) distributions
(a) Monthly values of heat stress index (WBGT) for historical data (derived in step 2);
(b) Monthly mean of daily values of heat stress index (WBGT) (maximum and mean) (derived using daily values from step 2).
Number of hours per month with stand-ardized temperatures (WBGT) between 20°C and 50°C (estimated using the “4+4+4 method”*).
4. Estimation of employment data for each small geographical area by applying national estimates of employment-to-population ratios for employment sectors to population data for that area
(a) National estimates of employment-to- population ratio (ages 15+) for four sectors: agriculture, construction, industry and services;
(b) Population data (ages 15+) for each small geographical area.
Share of employment (ages 15+) in each of the four sectors for each small geographical area.
5. Derivation of relationship between heat exposure and physiological response
(a) Quantitative data from epidemiological studies on the impacts of heat stress on work capacity;
(b) ISO 7243 guidelines on work intensity levels at various metabolic rates.
Smooth functions that relate heat stress index (WBGT) to expected work capacity loss for three levels of physical work intensity (200 W, 300 W, 400 W).
6. Calculation of working hours lost per worker for each level of physical intensity in each small geographical area
(a) Gridded heat stress (WBGT) exposure data (derived in step 3);
(b) Three exposure–response functions for each level of physical intensity (derived in step 5).
Potential daylight working hours in each small geographical area and corres-ponding working hours lost per worker.
7. Calculation of total working hours lost by countries and subregions
(a) Daylight hours lost per worker in each small geographical area;
(b) Number of workers in each sector for each small geographical area.
Percentage of potential working hours lost for each level of physical work intensity.
* For more information on the 4+4+4 method, see Appendix I.
2. Global overview 27
Figure 2.4 Equivalent full-time jobs and GDP lost to heat stress, global and by country income group, 1995 and projections for 2030
Figure 2.5 Working hours lost to heat stress by subregion, 1995 and projections for 2030 (percentages)
1995 2030 1995 2030
Global equivalent full-time jobs loss (millions) Global GDP loss (US$ billions, PPP)
Share of GDP loss by country income group (percentages)
Low income Lower-middle income Upper-middle income High income
00
0
25
50
75
100
1000
2000
3000
1
2
3
4
5
20301995
6
2030
1995
0
Northern Europe
Western Europe
Eastern Europe
Southern Europe
Southern Africa
Central Asia
Western Asia
North America
Caribbean
Eastern Africa
Pacific Islands
Eastern Asia
Southern America
Central America
Arab States
Northern Africa
Central Africa
South-East Asia
Western Africa
Southern Asia
World
1 2 3 4 5
0.1<0.1
<0.1
<0.1<0.1
<0.1<0.1
<0.1<0.1
<0.1<0.1
<0.1<0.1
0.1
0.10.2
0.30.6
0.40.7
0.30.7
0.50.7
0.40.8
0.60.9
0.41.0
0.71.4
1.42.2
1.42.7
3.13.7
3.44.8
4.05.3
Source: ILO estimates based on data from the ILOSTAT database and from the HadGEM2 and GFDL-ESM2M climate models (using as input the RCP2.6 climate change pathway, which envisages a global average temperature rise of 1.5°C by the end of the century).
Source: ILO estimates based on data from the ILOSTAT database and from the HadGEM2 and GFDL-ESM2M climate models (using as input the RCP2.6 climate change pathway, which envisages a global average temperature rise of 1.5°C by the end of the century).
Working on a warmer planet: The impact of heat stress on labour productivity and decent work28
Looking at the opposite end of the climate spectrum, geographical areas in which it is currently too cold to work may acquire a more work-friendly climate as a result of global warming. Since these areas have a low population density, the impact of global warming on increasing working hours is expected to be small. Indeed, our projections point to a virtually zero effect of heat stress on labour productivity in Northern Europe.
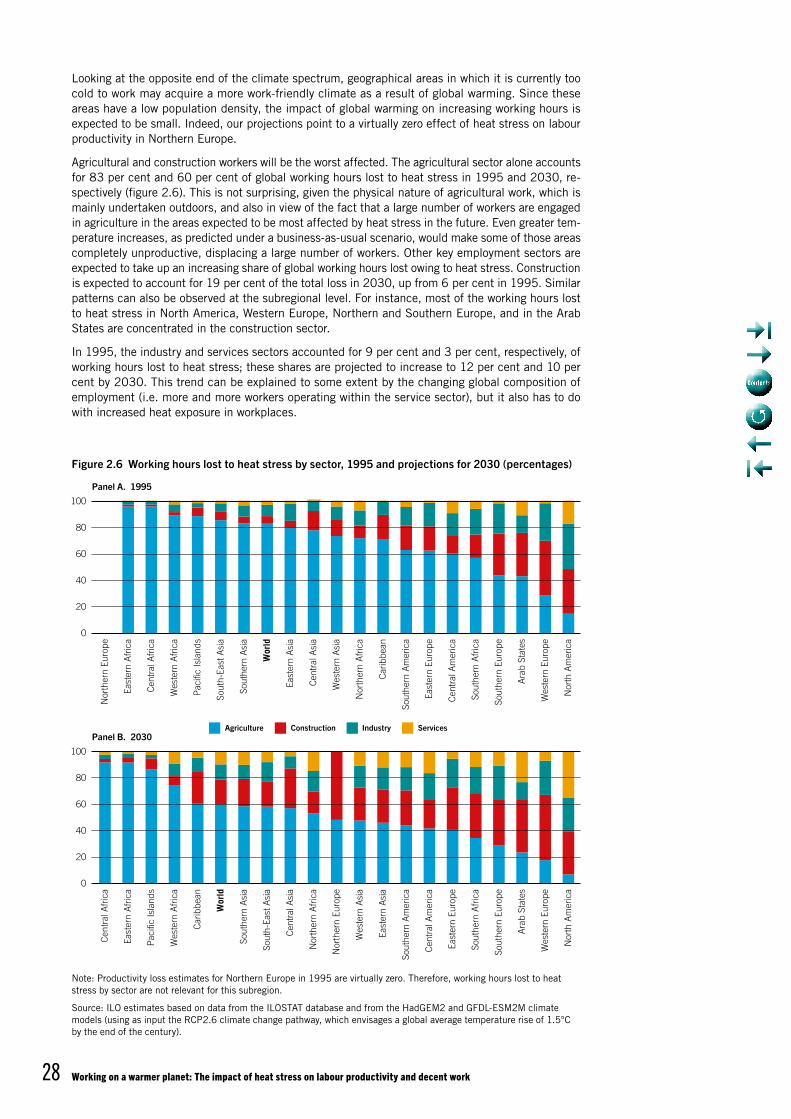
Agricultural and construction workers will be the worst affected. The agricultural sector alone accounts for 83 per cent and 60 per cent of global working hours lost to heat stress in 1995 and 2030, re-spectively (figure 2.6). This is not surprising, given the physical nature of agricultural work, which is mainly undertaken outdoors, and also in view of the fact that a large number of workers are engaged in agriculture in the areas expected to be most affected by heat stress in the future. Even greater tem-perature increases, as predicted under a business-as-usual scenario, would make some of those areas completely unproductive, displacing a large number of workers. Other key employment sectors are expected to take up an increasing share of global working hours lost owing to heat stress. Construction is expected to account for 19 per cent of the total loss in 2030, up from 6 per cent in 1995. Similar patterns can also be observed at the subregional level. For instance, most of the working hours lost to heat stress in North America, Western Europe, Northern and Southern Europe, and in the Arab States are concentrated in the construction sector.
In 1995, the industry and services sectors accounted for 9 per cent and 3 per cent, respectively, of working hours lost to heat stress; these shares are projected to increase to 12 per cent and 10 per cent by 2030. This trend can be explained to some extent by the changing global composition of employment (i.e. more and more workers operating within the service sector), but it also has to do with increased heat exposure in workplaces.
Figure 2.6 Working hours lost to heat stress by sector, 1995 and projections for 2030 (percentages)
Note: Productivity loss estimates for Northern Europe in 1995 are virtually zero. Therefore, working hours lost to heat stress by sector are not relevant for this subregion.
Source: ILO estimates based on data from the ILOSTAT database and from the HadGEM2 and GFDL-ESM2M climate models (using as input the RCP2.6 climate change pathway, which envisages a global average temperature rise of 1.5°C by the end of the century).
Agriculture Construction Industry Services
Nor
ther
n Eu
rope
East
ern
Afr
ica
Cen
tral
Afr
ica
Wes
tern
Afr
ica
Pac
ific
Isla
nds
Sout
h-Ea
st A
sia
Sout
hern
Asi
a
Wor
ld
East
ern
Asi
a
Cen
tral
Asi
a
Wes
tern
Asi
a
Nor
ther
n A
fric
a
Car
ibbe
an
Sout
hern
Am
eric
a
East
ern
Euro
pe
Cen
tral
Am
eric
a
Sout
hern
Afr
ica
Sout
hern
Eur
ope
Ara
b St
ates
Wes
tern
Eur
ope
Nor
th A
mer
ica
Cen
tral
Afr
ica
East
ern
Afr
ica
Pac
ific
Isla
nds
Wes
tern
Afr
ica
Car
ibbe
an
Wor
ld
Sout
hern
Asi
a
Sout
h-Ea
st A
sia
Cen
tral
Asi
a
Nor
ther
n A
fric
a
Nor
ther
n Eu
rope
Wes
tern
Asi
a
East
ern
Asi
a
Sout
hern
Am
eric
a
Cen
tral
Am
eric
a
East
ern
Euro
pe
Sout
hern
Afr
ica
Sout
hern
Eur
ope
Ara
b St
ates
Wes
tern
Eur
ope
Nor
th A
mer
ica
Panel A. 1995
20
40
60
80
Panel B. 2030
0
20
40
60
80
100
0
100
2. Global overview 29
2.5 Urban heat islandsThe intensity of temperature increases can vary within countries, and the impact can be especially high in cities. The urban heat island (UHI) phenomenon refers to urban or metropolitan areas that are significantly warmer than surrounding rural areas as a result of the absorption of solar heat by buildings and roads, and also as a result of human activities (IPCC, 2007). This human-induced modification of local climate can be principally attributed to alterations in the surface energy bal-ance caused by variations in land use, surface properties and geometry of the urban area (Coutts, Beringer and Tapper, 2007). For example, unlike vegetation, urban building materials (e.g. concrete and asphalt) can absorb heat during the day and radiate it back at night (Bhargava, Lakmini and Bhargava, 2017). Moreover, the heating and cooling systems of buildings and vehicles contribute to the background heat in urban environments.
The resulting differences in temperature between urban and rural areas can be quite pronounced. For instance, at the turn of the millennium, maximum UHI intensities (based on air temperature) of 7°C and 8°C were recorded in London and New York, respectively (Watkins et al., 2002; Gedzelman et al., 2003). Similarly, a study covering around 20 cities of the Iberian Peninsula identified maximum UHI intensities of 8–9°C in Madrid, 8°C in Barcelona, and 5°C in Zaragoza (Cuadrat and Martín Vide, 2007).
Although some UHI effects may be beneficial (e.g. lengthening of the plant-growing season), most of them have a negative impact on local economies. These negative effects include increased energy consumption (notably in cooling systems), elevated emissions of air pollutants and GHGs, compro-mised human health and comfort, and deterioration of water quality (Bhargava, Lakmini and Bhargava, 2017). A study by Estrada, Botzen and Tol (2017) analysed 1,692 cities (including all the main cities in the world) and found that the total economic costs of climate change for cities in the course of this century could be up to 2.6 times higher if UHI effects are taken into account than if they are not. On average, cities could lose 5.6 per cent of their GDP by the end of the century.
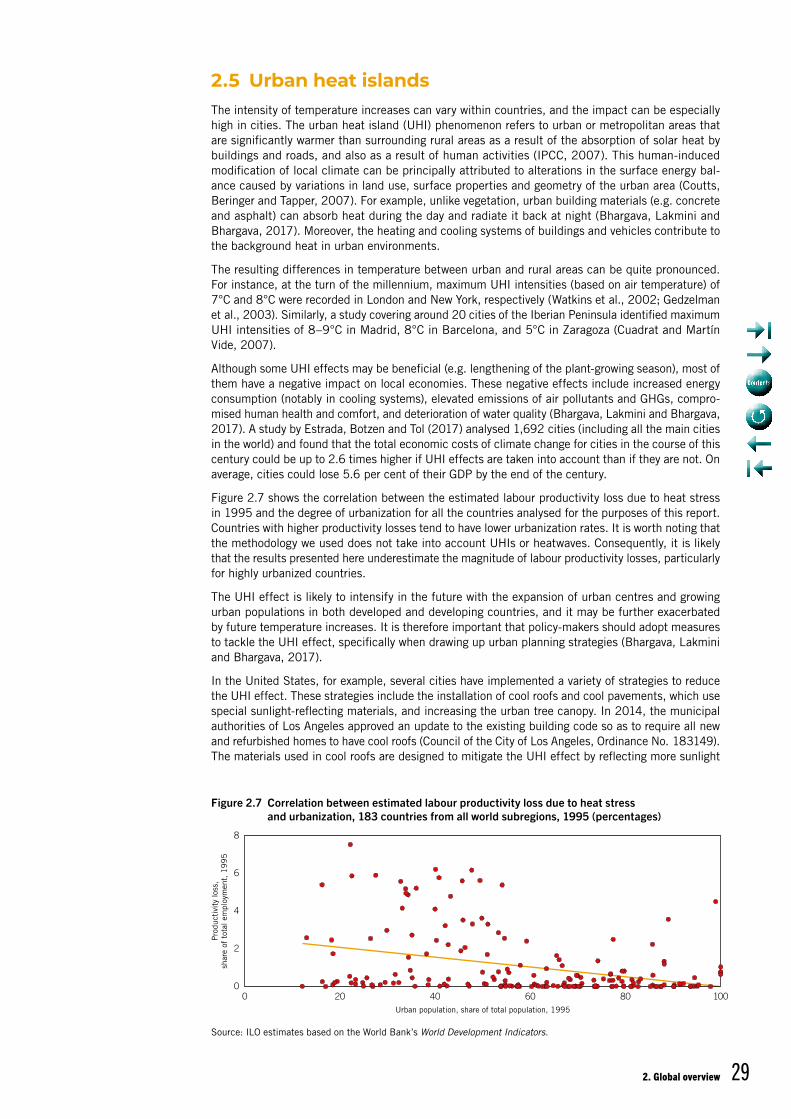
Figure 2.7 shows the correlation between the estimated labour productivity loss due to heat stress in 1995 and the degree of urbanization for all the countries analysed for the purposes of this report. Countries with higher productivity losses tend to have lower urbanization rates. It is worth noting that the methodology we used does not take into account UHIs or heatwaves. Consequently, it is likely that the results presented here underestimate the magnitude of labour productivity losses, particularly for highly urbanized countries.
The UHI effect is likely to intensify in the future with the expansion of urban centres and growing urban populations in both developed and developing countries, and it may be further exacerbated by future temperature increases. It is therefore important that policy-makers should adopt measures to tackle the UHI effect, specifically when drawing up urban planning strategies (Bhargava, Lakmini and Bhargava, 2017).
In the United States, for example, several cities have implemented a variety of strategies to reduce the UHI effect. These strategies include the installation of cool roofs and cool pavements, which use special sunlight-reflecting materials, and increasing the urban tree canopy. In 2014, the municipal authorities of Los Angeles approved an update to the existing building code so as to require all new and refurbished homes to have cool roofs (Council of the City of Los Angeles, Ordinance No. 183149). The materials used in cool roofs are designed to mitigate the UHI effect by reflecting more sunlight
Figure 2.7 Correlation between estimated labour productivity loss due to heat stress and urbanization, 183 countries from all world subregions, 1995 (percentages)
Source: ILO estimates based on the World Bank’s World Development Indicators.
2
4
6
00 20 40
Urban population, share of total population, 1995
Pro
duct
ivit
y lo
ss,
shar
e of
tot
al e
mpl
oym
ent,
19
95
60 80 100
8
J JJ
J
JJ JJJ
J J
JJ
J
J
J
JJ J
J
JJ
J JJ J
J
JJ J
J
J
JJ
J
J
JJJ
J J J
J
JJ
J
JJ
J
JJ
JJ J
J
JJ
J
JJ
J
JJ
JJ
J
JJ
JJ
J
J
J
JJ
JJJJJ JJJ
JJ
J
J
J
J
J
J
JJ
J
J J JJ
J
JJJ
J
J
J
J
J
J
J J
J
J
JJ
J
J J
J
J
J
JJ
J
JJ
J
J
J
JJ
J JJ J
J JJ
J
J JJJ
J
J
JJ
J
J
J
J J
J
JJ JJ J
JJ J
J JJJ
JJ
J
JJJ JJJ
JJ
J
J
JJ
J
JJJ
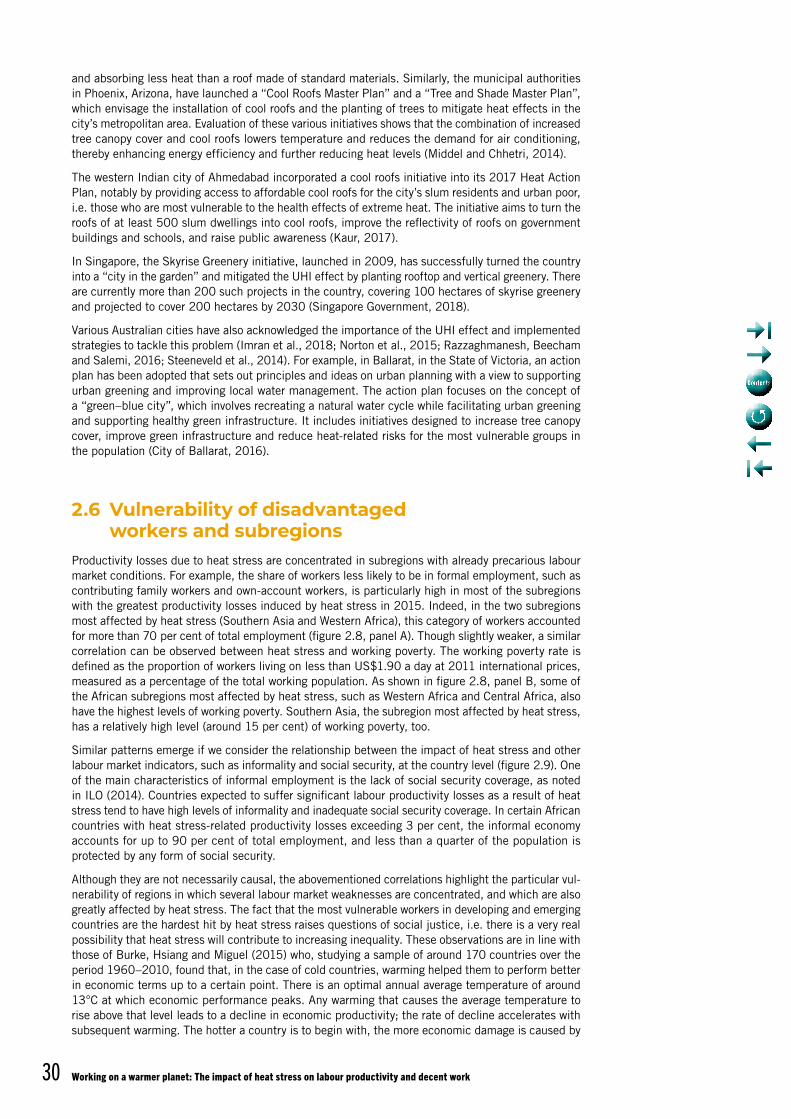
Working on a warmer planet: The impact of heat stress on labour productivity and decent work30
and absorbing less heat than a roof made of standard materials. Similarly, the municipal authorities in Phoenix, Arizona, have launched a “Cool Roofs Master Plan” and a “Tree and Shade Master Plan”, which envisage the installation of cool roofs and the planting of trees to mitigate heat effects in the city’s metropolitan area. Evaluation of these various initiatives shows that the combination of increased tree canopy cover and cool roofs lowers temperature and reduces the demand for air conditioning, thereby enhancing energy efficiency and further reducing heat levels (Middel and Chhetri, 2014).
The western Indian city of Ahmedabad incorporated a cool roofs initiative into its 2017 Heat Action Plan, notably by providing access to affordable cool roofs for the city’s slum residents and urban poor, i.e. those who are most vulnerable to the health effects of extreme heat. The initiative aims to turn the roofs of at least 500 slum dwellings into cool roofs, improve the reflectivity of roofs on government buildings and schools, and raise public awareness (Kaur, 2017).
In Singapore, the Skyrise Greenery initiative, launched in 2009, has successfully turned the country into a “city in the garden” and mitigated the UHI effect by planting rooftop and vertical greenery. There are currently more than 200 such projects in the country, covering 100 hectares of skyrise greenery and projected to cover 200 hectares by 2030 (Singapore Government, 2018).
Various Australian cities have also acknowledged the importance of the UHI effect and implemented strategies to tackle this problem (Imran et al., 2018; Norton et al., 2015; Razzaghmanesh, Beecham and Salemi, 2016; Steeneveld et al., 2014). For example, in Ballarat, in the State of Victoria, an action plan has been adopted that sets out principles and ideas on urban planning with a view to supporting urban greening and improving local water management. The action plan focuses on the concept of a “green–blue city”, which involves recreating a natural water cycle while facilitating urban greening and supporting healthy green infrastructure. It includes initiatives designed to increase tree canopy cover, improve green infrastructure and reduce heat-related risks for the most vulnerable groups in the population (City of Ballarat, 2016).
2.6 Vulnerability of disadvantaged workers and subregions
Productivity losses due to heat stress are concentrated in subregions with already precarious labour market conditions. For example, the share of workers less likely to be in formal employment, such as contributing family workers and own-account workers, is particularly high in most of the subregions with the greatest productivity losses induced by heat stress in 2015. Indeed, in the two subregions most affected by heat stress (Southern Asia and Western Africa), this category of workers accounted for more than 70 per cent of total employment (figure 2.8, panel A). Though slightly weaker, a similar correlation can be observed between heat stress and working poverty. The working poverty rate is defined as the proportion of workers living on less than US$1.90 a day at 2011 international prices, measured as a percentage of the total working population. As shown in figure 2.8, panel B, some of the African subregions most affected by heat stress, such as Western Africa and Central Africa, also have the highest levels of working poverty. Southern Asia, the subregion most affected by heat stress, has a relatively high level (around 15 per cent) of working poverty, too.
Similar patterns emerge if we consider the relationship between the impact of heat stress and other labour market indicators, such as informality and social security, at the country level (figure 2.9). One of the main characteristics of informal employment is the lack of social security coverage, as noted in ILO (2014). Countries expected to suffer significant labour productivity losses as a result of heat stress tend to have high levels of informality and inadequate social security coverage. In certain African countries with heat stress-related productivity losses exceeding 3 per cent, the informal economy accounts for up to 90 per cent of total employment, and less than a quarter of the population is protected by any form of social security.
Although they are not necessarily causal, the abovementioned correlations highlight the particular vul-nerability of regions in which several labour market weaknesses are concentrated, and which are also greatly affected by heat stress. The fact that the most vulnerable workers in developing and emerging countries are the hardest hit by heat stress raises questions of social justice, i.e. there is a very real possibility that heat stress will contribute to increasing inequality. These observations are in line with those of Burke, Hsiang and Miguel (2015) who, studying a sample of around 170 countries over the period 1960–2010, found that, in the case of cold countries, warming helped them to perform better in economic terms up to a certain point. There is an optimal annual average temperature of around 13°C at which economic performance peaks. Any warming that causes the average temperature to rise above that level leads to a decline in economic productivity; the rate of decline accelerates with subsequent warming. The hotter a country is to begin with, the more economic damage is caused by
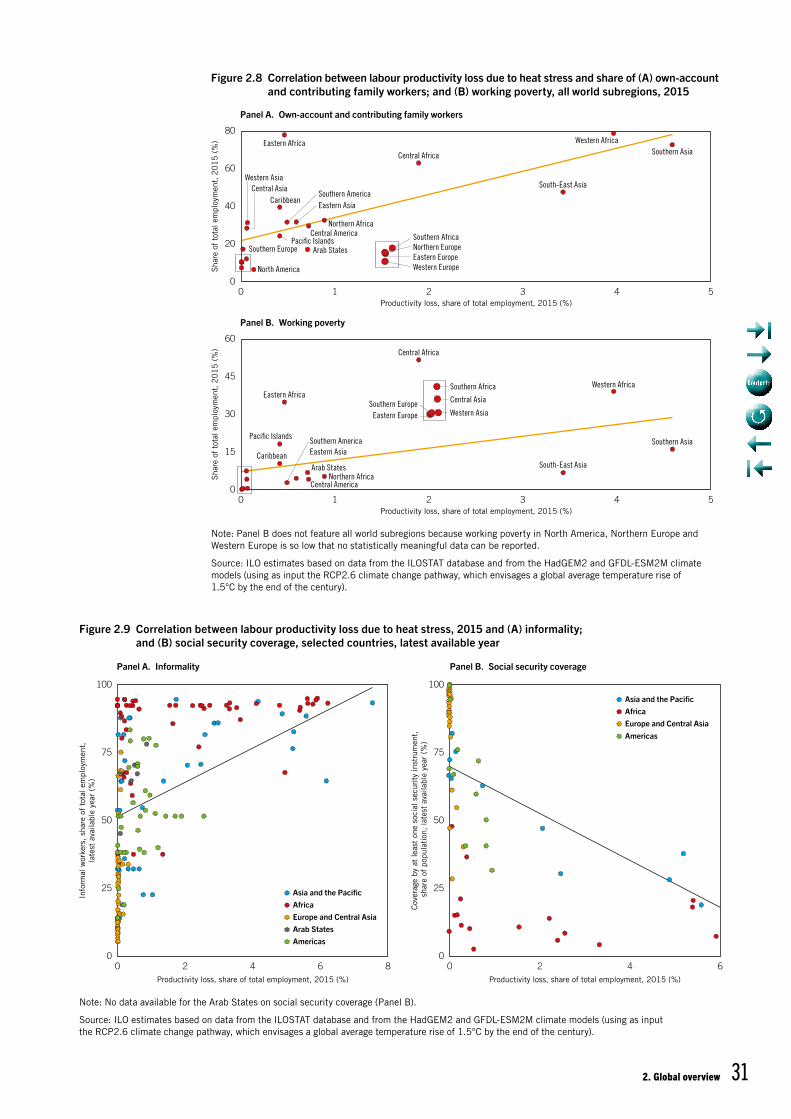
2. Global overview 31
Figure 2.8 Correlation between labour productivity loss due to heat stress and share of (A) own-account and contributing family workers; and (B) working poverty, all world subregions, 2015
Figure 2.9 Correlation between labour productivity loss due to heat stress, 2015 and (A) informality; and (B) social security coverage, selected countries, latest available year
Note: Panel B does not feature all world subregions because working poverty in North America, Northern Europe and Western Europe is so low that no statistically meaningful data can be reported.
Source: ILO estimates based on data from the ILOSTAT database and from the HadGEM2 and GFDL-ESM2M climate models (using as input the RCP2.6 climate change pathway, which envisages a global average temperature rise of 1.5°C by the end of the century).
Note: No data available for the Arab States on social security coverage (Panel B).
Source: ILO estimates based on data from the ILOSTAT database and from the HadGEM2 and GFDL-ESM2M climate models (using as input the RCP2.6 climate change pathway, which envisages a global average temperature rise of 1.5°C by the end of the century).
20
40
60
00 1 2
Productivity loss, share of total employment, 2015 (%)
Sha
re o
f to
tal e
mpl
oym
ent,
20
15
(%
)
3 4 5
80
Panel A. Own-account and contributing family workers
15
30
45
00 1 2
Productivity loss, share of total employment, 2015 (%)
Sha
re o
f to
tal e
mpl
oym
ent,
20
15
(%
)
3 4 5
60
Panel B. Working poverty
J
J
J
JJ
J
J
J
J
JJ
J
J
J
J
J
J
J
J
J
JJ
J
JJ
J
J
J
J
J
JJJ
J
J
J
J
JJ
J
JJ
JJJJ
Arab States
Caribbean
Central Africa
Central America
Central Asia
Eastern Africa
Eastern Asia
Northern Africa
North America
Pacific Islands
Southern AmericaSouth-East Asia
Southern Asia
Southern Europe
Western Africa
Western Asia
Arab StatesCaribbean
Central Africa
Central America
Central AsiaEastern Africa
Eastern Asia
Eastern Europe
Northern Africa
Pacific IslandsSouthern America
South-East Asia
Southern Africa
Southern Asia
Southern Europe
Western Africa
Western Asia
Eastern EuropeNorthern EuropeSouthern Africa
Western Europe
25
50
75
00 2 4
Productivity loss, share of total employment, 2015 (%)
Info
rmal
wor
kers
, sh
are
of t
otal
em
ploy
men
t,la
test
ava
ilabl
e ye
ar (
%)
6 8
100
25
50
75
00 2 4
Productivity loss, share of total employment, 2015 (%)
Cov
erag
e by
at
leas
t on
e so
cial
sec
urit
y in
stru
men
t, s
hare
of
popu
lati
on,
late
st a
vaila
ble
year
(%
)
6
100
Panel A. Informality Panel B. Social security coverage
J
J
J
J
J
Asia and the PacificAfricaEurope and Central AsiaArab StatesAmericas
J
J
J
Asia and the PacificAfricaEurope and Central Asia
J Americas
J
J
J
J
J
J
J
J
J
JJJ
J
J
J
J
J
J
JJ
J
J
J
J
J
J
J
J
J
J J
J
J
J
J
J
J
J
J
J
J
J
J
J
J
JJ
JJ
JJ
J J
J
J JJJ
JJ
J
JJ
JJ
J
JJ
J
J
J
J
J
J
J
J
J JJ J
J
J
J
JJJ
J
J JJJ JJ J
J
JJ
J
JJ
J
JJ
J
JJ
JJ
J
JJJ
JJ
J
J
J
J
J
J
J
JJ
J
J
J
J
JJJ
J
JJJ
J
J
JJJ
J
JJ
J
J
JJ
J
J
J
J
JJ
J
J
J
J
J
J
JJ
J
JJ
J
J
JJJJJJJJJJJJJJJJJJJ
J
J
J
J
J
J
J
J
JJ
J
J
J
J
J
J
J
J
J
J
J
J
J
JJ
J
J
JJ
JJJ
J
J
J
J
JJ
J
J
J
J
J
JJ
J
J
J
J
J
J
JJ
J
JJ
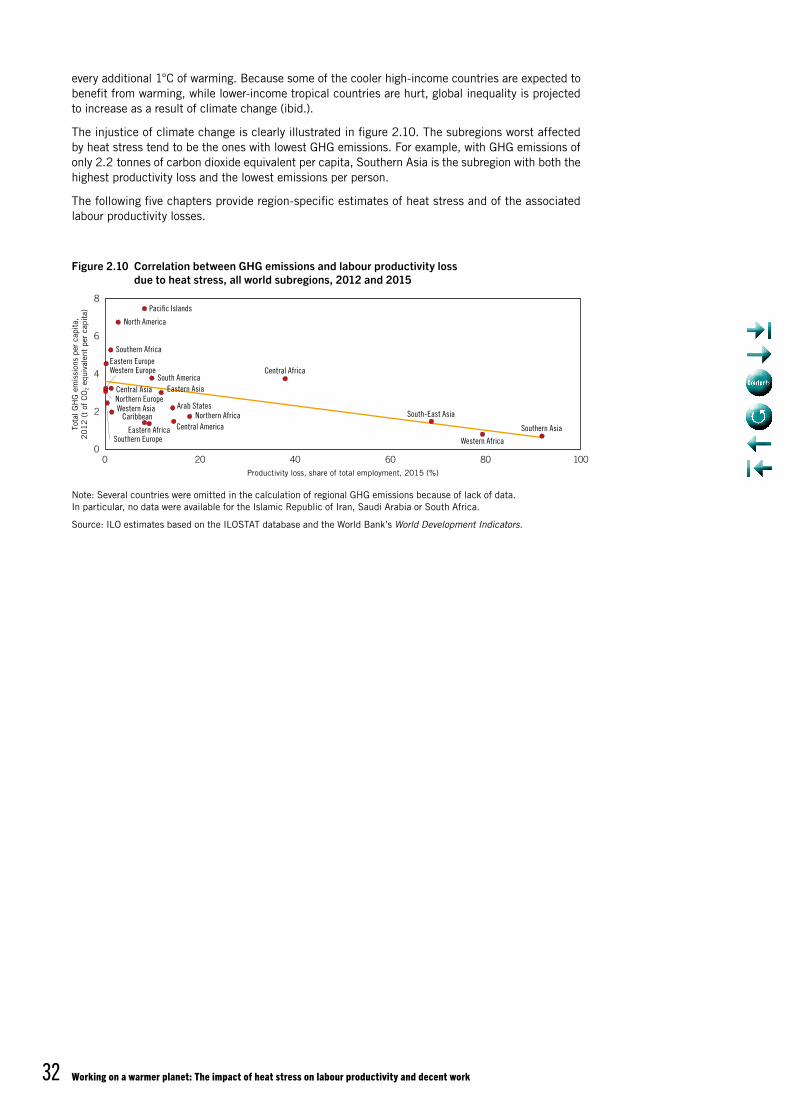
Working on a warmer planet: The impact of heat stress on labour productivity and decent work32
every additional 1°C of warming. Because some of the cooler high-income countries are expected to benefit from warming, while lower-income tropical countries are hurt, global inequality is projected to increase as a result of climate change (ibid.).
The injustice of climate change is clearly illustrated in figure 2.10. The subregions worst affected by heat stress tend to be the ones with lowest GHG emissions. For example, with GHG emissions of only 2.2 tonnes of carbon dioxide equivalent per capita, Southern Asia is the subregion with both the highest productivity loss and the lowest emissions per person.
The following five chapters provide region-specific estimates of heat stress and of the associated labour productivity losses.
Figure 2.10 Correlation between GHG emissions and labour productivity loss due to heat stress, all world subregions, 2012 and 2015
Note: Several countries were omitted in the calculation of regional GHG emissions because of lack of data. In particular, no data were available for the Islamic Republic of Iran, Saudi Arabia or South Africa.
Source: ILO estimates based on the ILOSTAT database and the World Bank’s World Development Indicators.
2
4
6
00 20 40
Productivity loss, share of total employment, 2015 (%)
Tota
l GH
G e
mis
sion
s pe
r ca
pita
,2
01
2 (
t of
CO
2 e
quiv
alen
t pe
r ca
pita
)
60 80 100
8
J
J
J
J
J
J
J
J
J
J
J
J
J
J
J
J
JJ
J
Arab StatesCaribbean
Central Africa
Central America
Central Asia
Eastern Africa
Eastern Asia
Eastern Europe
Northern Africa
North America
Northern Europe
Pacific Islands
South America
South-East Asia
Southern Africa
Southern AsiaSouthern Europe Western Africa
Western Asia
Western Europe
J
33
3.1 Current and projected heat levelsWith a population of around 1.2 billion and a land area of approximately 30.1 million km2, Africa1 is the world’s second most populated region after Asia and the Pacific. It is also one of the most vulnerable to heat stress because of its high heat exposure and low adaptive capacity.2 According to the IPCC’s Fifth Assessment Report, during the last 50 to 100 years, near-surface temperatures have increased by at least 0.5°C across most parts of Africa, with minimum temperatures rising more rapidly than maximum temperatures. The report also concludes that temperatures in Africa are projected to rise faster than the global average during the twenty-first century. Indeed, projections indicate that the mean annual temperature rise is likely to exceed 2°C by the end of the present century. Under a high Representative Concentration Pathway (RCP) scenario, which is one of the climatic futures considered by the IPCC (2014b), this could even occur by the middle of the century in many areas of Africa, with the mean annual temperature rise ranging from 3°C to 6°C by the end of the century.
Given the continent’s vast size, varying topography and unique geographical location (it almost sym-metrically straddles the equator), the climate in Africa varies widely and is influenced by the climates of both the northern and southern hemispheres. Whereas the northern half of Africa is primarily desert or arid, the central and southern areas contain savannah and rainforest regions. In fact, Africa has eight distinct climate zones, as defined by the Köppen climate classification system. Some of the extreme temperatures that have been recorded in Africa include a maximum of +57.8°C at Al Aziziyah, Libya, in September 1922 and a minimum of −23.9°C at Ifrane, Morocco, in February 1935.
Figure 3.1 shows the heat stress levels in Africa for 1995 and 2030, presented as WBGT values. (As explained in Chapter 2, the WBGT index measures temperature taking into account the effects of humidity, wind and solar radiation.) As can be seen, most countries in Africa exhibit heat levels in the hottest month that are likely to affect labour productivity. However, some areas are more exposed than others. For instance, high-altitude areas stretching from Ethiopia to Zimbabwe are less affected by heat during the hottest month compared with low-altitude areas, including the coasts. Coastal areas tend to have relatively higher humidity levels than inland low-lying areas, contributing to higher WBGT values.
Many countries in Africa already experience heat-related issues, which are having a negative impact on individuals, the economy, social conditions and the environment. For example, high ambient tem-peratures have led to increased mortality in Ghana and Burkina Faso, with children and elderly people being particularly at risk (Azongo et al., 2012; Diboulo et al., 2012; Egondi et al., 2012). Heat-related health effects are also a cause for concern in Western and Southern Africa (Dapi et al., 2010; Mathee, Oba and Rose, 2010). In Northern Africa, north-western Sahara experienced 40 to 50 heatwave days per year during the period 1989–2009 (Vizy and Cook, 2012). Moreover, projections suggest that the number of heatwave days in this subregion will increase over the course of the twenty-first century (Patricola and Cook, 2010; Vizy and Cook, 2012).
1. In this report, the five subregions of Africa are Northern Africa (countries and territories listed in table 3.1), Central Africa (table 3.2), Eastern Africa (table 3.3), Southern Africa (table 3.4), and Western Africa (table 3.5).
2. According to the IPCC, “[w]hile overall adaptive capacity is considered low in Africa because of economic, demographic, health, education, infrastructure, governance, and natural factors, levels vary within countries and across sub-regions, with some indication of higher adaptive capacity in North Africa and some other countries” (2014a, p. 1226).
3. Africa
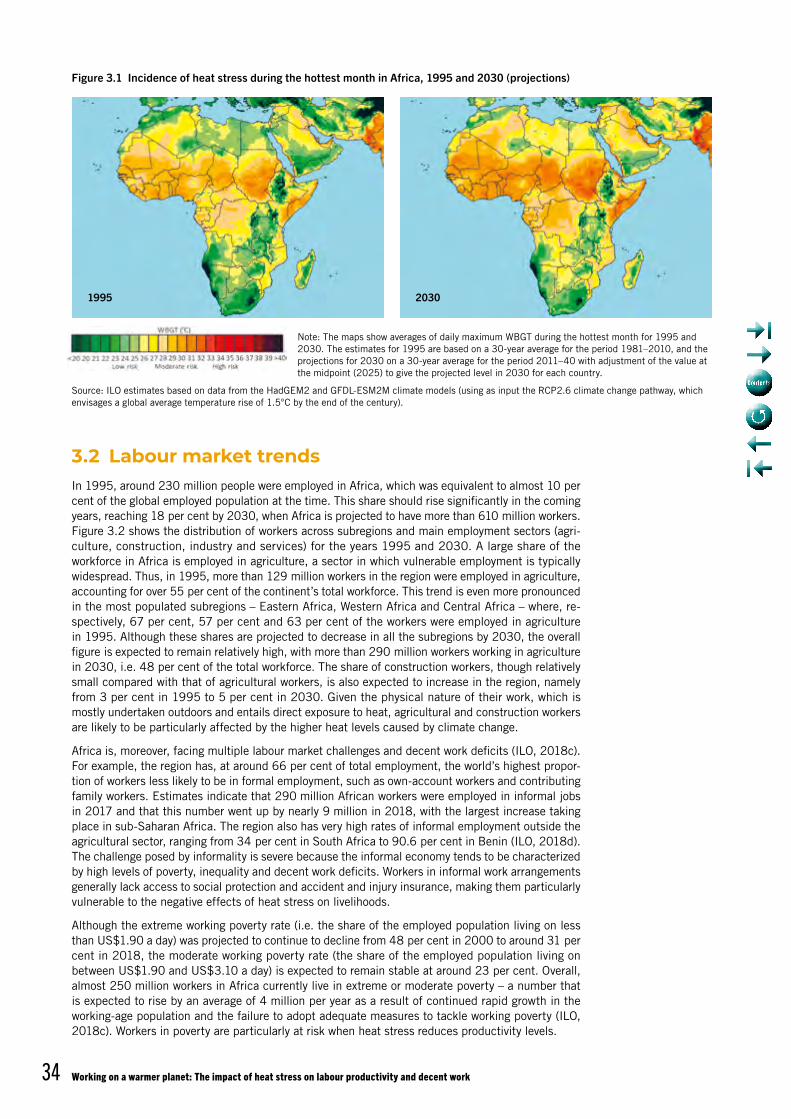
Working on a warmer planet: The impact of heat stress on labour productivity and decent work34
3.2 Labour market trendsIn 1995, around 230 million people were employed in Africa, which was equivalent to almost 10 per cent of the global employed population at the time. This share should rise significantly in the coming years, reaching 18 per cent by 2030, when Africa is projected to have more than 610 million workers. Figure 3.2 shows the distribution of workers across subregions and main employment sectors (agri-culture, construction, industry and services) for the years 1995 and 2030. A large share of the workforce in Africa is employed in agriculture, a sector in which vulnerable employment is typically widespread. Thus, in 1995, more than 129 million workers in the region were employed in agriculture, accounting for over 55 per cent of the continent’s total workforce. This trend is even more pronounced in the most populated subregions – Eastern Africa, Western Africa and Central Africa – where, re-spectively, 67 per cent, 57 per cent and 63 per cent of the workers were employed in agriculture in 1995. Although these shares are projected to decrease in all the subregions by 2030, the overall figure is expected to remain relatively high, with more than 290 million workers working in agriculture in 2030, i.e. 48 per cent of the total workforce. The share of construction workers, though relatively small compared with that of agricultural workers, is also expected to increase in the region, namely from 3 per cent in 1995 to 5 per cent in 2030. Given the physical nature of their work, which is mostly undertaken outdoors and entails direct exposure to heat, agricultural and construction workers are likely to be particularly affected by the higher heat levels caused by climate change.
Africa is, moreover, facing multiple labour market challenges and decent work deficits (ILO, 2018c). For example, the region has, at around 66 per cent of total employment, the world’s highest propor-tion of workers less likely to be in formal employment, such as own-account workers and contributing family workers. Estimates indicate that 290 million African workers were employed in informal jobs in 2017 and that this number went up by nearly 9 million in 2018, with the largest increase taking place in sub-Saharan Africa. The region also has very high rates of informal employment outside the agricultural sector, ranging from 34 per cent in South Africa to 90.6 per cent in Benin (ILO, 2018d). The challenge posed by informality is severe because the informal economy tends to be characterized by high levels of poverty, inequality and decent work deficits. Workers in informal work arrangements generally lack access to social protection and accident and injury insurance, making them particularly vulnerable to the negative effects of heat stress on livelihoods.
Although the extreme working poverty rate (i.e. the share of the employed population living on less than US$1.90 a day) was projected to continue to decline from 48 per cent in 2000 to around 31 per cent in 2018, the moderate working poverty rate (the share of the employed population living on between US$1.90 and US$3.10 a day) is expected to remain stable at around 23 per cent. Overall, almost 250 million workers in Africa currently live in extreme or moderate poverty – a number that is expected to rise by an average of 4 million per year as a result of continued rapid growth in the working-age population and the failure to adopt adequate measures to tackle working poverty (ILO, 2018c). Workers in poverty are particularly at risk when heat stress reduces productivity levels.
Note: The maps show averages of daily maximum WBGT during the hottest month for 1995 and 2030. The estimates for 1995 are based on a 30-year average for the period 1981–2010, and the projections for 2030 on a 30-year average for the period 2011–40 with adjustment of the value at the midpoint (2025) to give the projected level in 2030 for each country.
Source: ILO estimates based on data from the HadGEM2 and GFDL-ESM2M climate models (using as input the RCP2.6 climate change pathway, which envisages a global average temperature rise of 1.5°C by the end of the century).
Figure 3.1 Incidence of heat stress during the hottest month in Africa, 1995 and 2030 (projections)
1995 2030
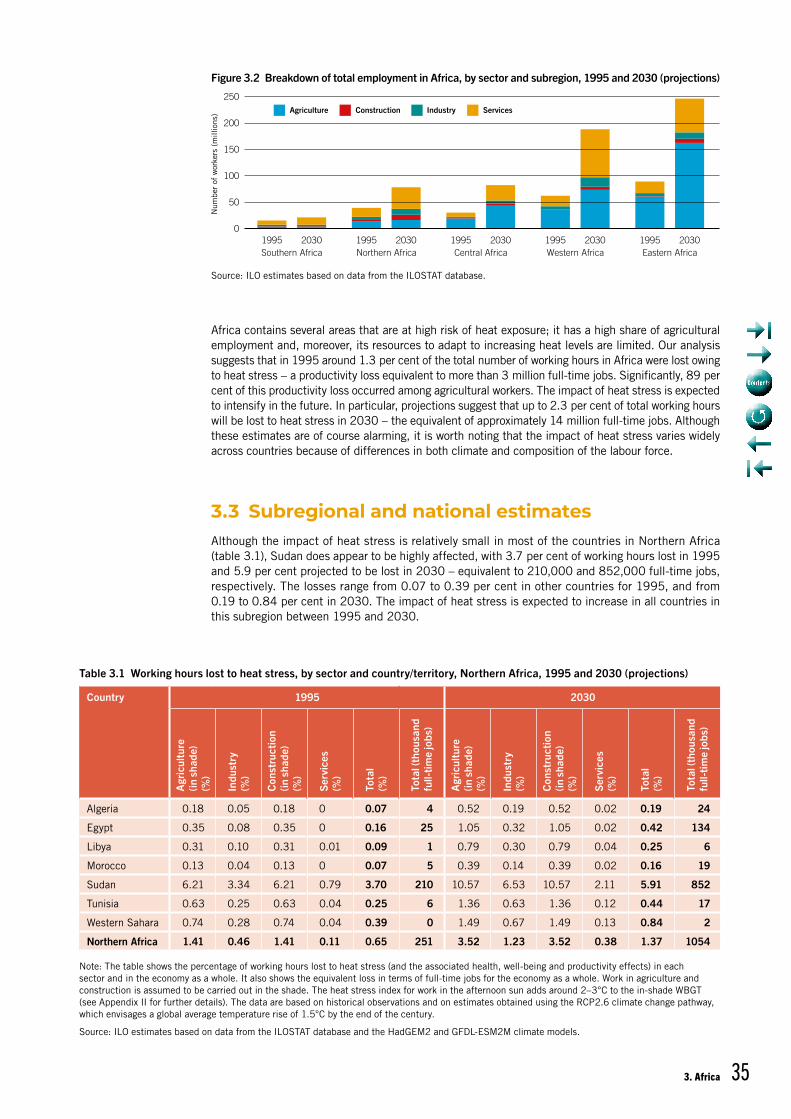
3. Africa 35
Africa contains several areas that are at high risk of heat exposure; it has a high share of agricultural employment and, moreover, its resources to adapt to increasing heat levels are limited. Our analysis suggests that in 1995 around 1.3 per cent of the total number of working hours in Africa were lost owing to heat stress – a productivity loss equivalent to more than 3 million full-time jobs. Significantly, 89 per cent of this productivity loss occurred among agricultural workers. The impact of heat stress is expected to intensify in the future. In particular, projections suggest that up to 2.3 per cent of total working hours will be lost to heat stress in 2030 – the equivalent of approximately 14 million full-time jobs. Although these estimates are of course alarming, it is worth noting that the impact of heat stress varies widely across countries because of differences in both climate and composition of the labour force.
3.3 Subregional and national estimatesAlthough the impact of heat stress is relatively small in most of the countries in Northern Africa (table 3.1), Sudan does appear to be highly affected, with 3.7 per cent of working hours lost in 1995 and 5.9 per cent projected to be lost in 2030 – equivalent to 210,000 and 852,000 full-time jobs, respectively. The losses range from 0.07 to 0.39 per cent in other countries for 1995, and from 0.19 to 0.84 per cent in 2030. The impact of heat stress is expected to increase in all countries in this subregion between 1995 and 2030.
Source: ILO estimates based on data from the ILOSTAT database.
Figure 3.2 Breakdown of total employment in Africa, by sector and subregion, 1995 and 2030 (projections)
Agriculture Construction Industry Services
250
1995 2030 1995 2030 1995 2030 1995 2030 1995 2030Southern Africa Northern Africa Central Africa Western Africa Eastern Africa
0
Num
ber
of w
orke
rs (
mill
ions
)50
100
150
200
Table 3.1 Working hours lost to heat stress, by sector and country/territory, Northern Africa, 1995 and 2030 (projections)
Country 1995 2030
Agr
icul
ture
(in
sha
de)
(%)
Indu
stry
(%
)
Con
stru
ctio
n (in
sha
de)
(%)
Serv
ices
(%
)
Tota
l (%
)
Tota
l (th
ousa
nd
full-
time
jobs
)
Agr
icul
ture
(in
sha
de)
(%)
Indu
stry
(%
)
Con
stru
ctio
n (in
sha
de)
(%)
Serv
ices
(%
)
Tota
l (%
)
Tota
l (th
ousa
nd
full-
time
jobs
)
Algeria 0.18 0.05 0.18 0 0.07 4 0.52 0.19 0.52 0.02 0.19 24
Egypt 0.35 0.08 0.35 0 0.16 25 1.05 0.32 1.05 0.02 0.42 134
Libya 0.31 0.10 0.31 0.01 0.09 1 0.79 0.30 0.79 0.04 0.25 6
Morocco 0.13 0.04 0.13 0 0.07 5 0.39 0.14 0.39 0.02 0.16 19
Sudan 6.21 3.34 6.21 0.79 3.70 210 10.57 6.53 10.57 2.11 5.91 852
Tunisia 0.63 0.25 0.63 0.04 0.25 6 1.36 0.63 1.36 0.12 0.44 17
Western Sahara 0.74 0.28 0.74 0.04 0.39 0 1.49 0.67 1.49 0.13 0.84 2
Northern Africa 1.41 0.46 1.41 0.11 0.65 251 3.52 1.23 3.52 0.38 1.37 1054
Note: The table shows the percentage of working hours lost to heat stress (and the associated health, well-being and productivity effects) in each sector and in the economy as a whole. It also shows the equivalent loss in terms of full-time jobs for the economy as a whole. Work in agriculture and construction is assumed to be carried out in the shade. The heat stress index for work in the afternoon sun adds around 2–3°C to the in-shade WBGT (see Appendix II for further details). The data are based on historical observations and on estimates obtained using the RCP2.6 climate change pathway, which envisages a global average temperature rise of 1.5°C by the end of the century.
Source: ILO estimates based on data from the ILOSTAT database and the HadGEM2 and GFDL-ESM2M climate models.
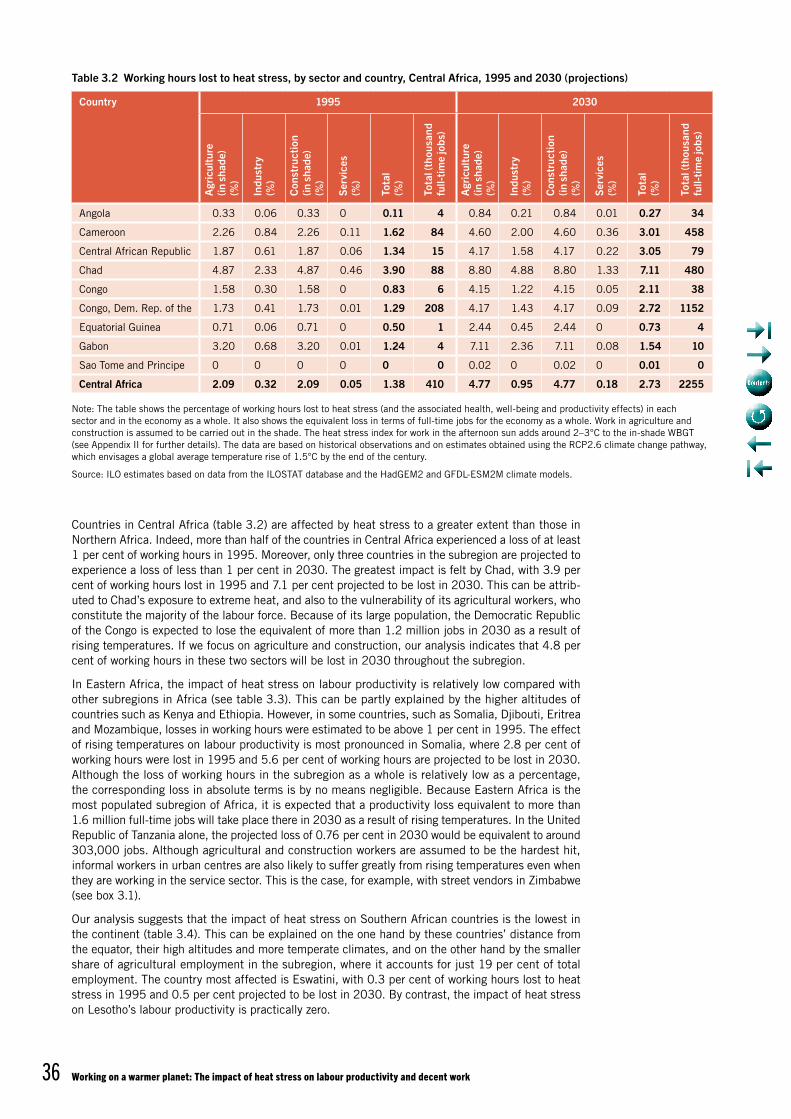
Working on a warmer planet: The impact of heat stress on labour productivity and decent work36
Countries in Central Africa (table 3.2) are affected by heat stress to a greater extent than those in Northern Africa. Indeed, more than half of the countries in Central Africa experienced a loss of at least 1 per cent of working hours in 1995. Moreover, only three countries in the subregion are projected to experience a loss of less than 1 per cent in 2030. The greatest impact is felt by Chad, with 3.9 per cent of working hours lost in 1995 and 7.1 per cent projected to be lost in 2030. This can be attrib-uted to Chad’s exposure to extreme heat, and also to the vulnerability of its agricultural workers, who constitute the majority of the labour force. Because of its large population, the Democratic Republic of the Congo is expected to lose the equivalent of more than 1.2 million jobs in 2030 as a result of rising temperatures. If we focus on agriculture and construction, our analysis indicates that 4.8 per cent of working hours in these two sectors will be lost in 2030 throughout the subregion.
In Eastern Africa, the impact of heat stress on labour productivity is relatively low compared with other subregions in Africa (see table 3.3). This can be partly explained by the higher altitudes of countries such as Kenya and Ethiopia. However, in some countries, such as Somalia, Djibouti, Eritrea and Mozambique, losses in working hours were estimated to be above 1 per cent in 1995. The effect of rising temperatures on labour productivity is most pronounced in Somalia, where 2.8 per cent of working hours were lost in 1995 and 5.6 per cent of working hours are projected to be lost in 2030. Although the loss of working hours in the subregion as a whole is relatively low as a percentage, the corresponding loss in absolute terms is by no means negligible. Because Eastern Africa is the most populated subregion of Africa, it is expected that a productivity loss equivalent to more than 1.6 million full-time jobs will take place there in 2030 as a result of rising temperatures. In the United Republic of Tanzania alone, the projected loss of 0.76 per cent in 2030 would be equivalent to around 303,000 jobs. Although agricultural and construction workers are assumed to be the hardest hit, informal workers in urban centres are also likely to suffer greatly from rising temperatures even when they are working in the service sector. This is the case, for example, with street vendors in Zimbabwe (see box 3.1).
Our analysis suggests that the impact of heat stress on Southern African countries is the lowest in the continent (table 3.4). This can be explained on the one hand by these countries’ distance from the equator, their high altitudes and more temperate climates, and on the other hand by the smaller share of agricultural employment in the subregion, where it accounts for just 19 per cent of total employment. The country most affected is Eswatini, with 0.3 per cent of working hours lost to heat stress in 1995 and 0.5 per cent projected to be lost in 2030. By contrast, the impact of heat stress on Lesotho’s labour productivity is practically zero.
Table 3.2 Working hours lost to heat stress, by sector and country, Central Africa, 1995 and 2030 (projections)
Country 1995 2030
Agr
icul
ture
(in
sha
de)
(%)
Indu
stry
(%
)
Con
stru
ctio
n (in
sha
de)
(%)
Serv
ices
(%
)
Tota
l (%
)
Tota
l (th
ousa
nd
full-
time
jobs
)
Agr
icul
ture
(in
sha
de)
(%)
Indu
stry
(%
)
Con
stru
ctio
n (in
sha
de)
(%)
Serv
ices
(%
)
Tota
l (%
)
Tota
l (th
ousa
nd
full-
time
jobs
)
Angola 0.33 0.06 0.33 0 0.11 4 0.84 0.21 0.84 0.01 0.27 34
Cameroon 2.26 0.84 2.26 0.11 1.62 84 4.60 2.00 4.60 0.36 3.01 458
Central African Republic 1.87 0.61 1.87 0.06 1.34 15 4.17 1.58 4.17 0.22 3.05 79
Chad 4.87 2.33 4.87 0.46 3.90 88 8.80 4.88 8.80 1.33 7.11 480
Congo 1.58 0.30 1.58 0 0.83 6 4.15 1.22 4.15 0.05 2.11 38
Congo, Dem. Rep. of the 1.73 0.41 1.73 0.01 1.29 208 4.17 1.43 4.17 0.09 2.72 1152
Equatorial Guinea 0.71 0.06 0.71 0 0.50 1 2.44 0.45 2.44 0 0.73 4
Gabon 3.20 0.68 3.20 0.01 1.24 4 7.11 2.36 7.11 0.08 1.54 10
Sao Tome and Principe 0 0 0 0 0 0 0.02 0 0.02 0 0.01 0
Central Africa 2.09 0.32 2.09 0.05 1.38 410 4.77 0.95 4.77 0.18 2.73 2255
Note: The table shows the percentage of working hours lost to heat stress (and the associated health, well-being and productivity effects) in each sector and in the economy as a whole. It also shows the equivalent loss in terms of full-time jobs for the economy as a whole. Work in agriculture and construction is assumed to be carried out in the shade. The heat stress index for work in the afternoon sun adds around 2–3°C to the in-shade WBGT (see Appendix II for further details). The data are based on historical observations and on estimates obtained using the RCP2.6 climate change pathway, which envisages a global average temperature rise of 1.5°C by the end of the century.
Source: ILO estimates based on data from the ILOSTAT database and the HadGEM2 and GFDL-ESM2M climate models.
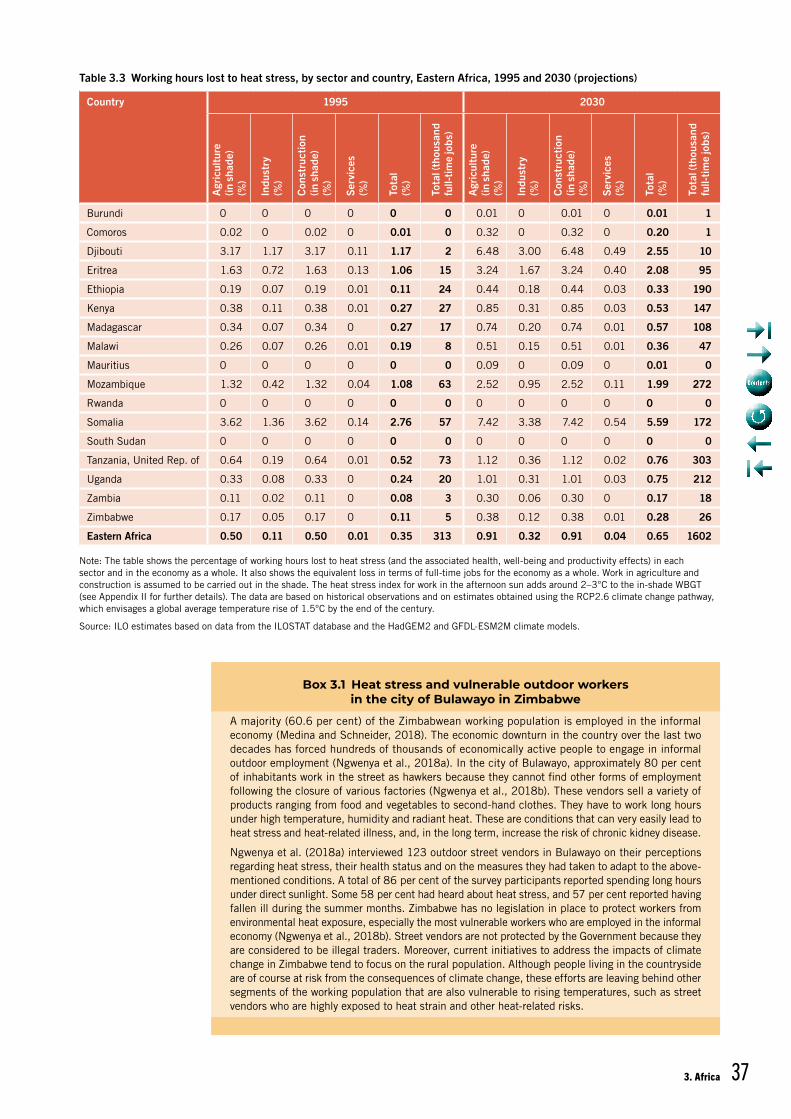
3. Africa 37
Table 3.3 Working hours lost to heat stress, by sector and country, Eastern Africa, 1995 and 2030 (projections)
Country 1995 2030
Agr
icul
ture
(in
sha
de)
(%)
Indu
stry
(%
)
Con
stru
ctio
n (in
sha
de)
(%)
Serv
ices
(%
)
Tota
l (%
)
Tota
l (th
ousa
nd
full-
time
jobs
)
Agr
icul
ture
(in
sha
de)
(%)
Indu
stry
(%
)
Con
stru
ctio
n (in
sha
de)
(%)
Serv
ices
(%
)
Tota
l (%
)
Tota
l (th
ousa
nd
full-
time
jobs
)
Burundi 0 0 0 0 0 0 0.01 0 0.01 0 0.01 1
Comoros 0.02 0 0.02 0 0.01 0 0.32 0 0.32 0 0.20 1
Djibouti 3.17 1.17 3.17 0.11 1.17 2 6.48 3.00 6.48 0.49 2.55 10
Eritrea 1.63 0.72 1.63 0.13 1.06 15 3.24 1.67 3.24 0.40 2.08 95
Ethiopia 0.19 0.07 0.19 0.01 0.11 24 0.44 0.18 0.44 0.03 0.33 190
Kenya 0.38 0.11 0.38 0.01 0.27 27 0.85 0.31 0.85 0.03 0.53 147
Madagascar 0.34 0.07 0.34 0 0.27 17 0.74 0.20 0.74 0.01 0.57 108
Malawi 0.26 0.07 0.26 0.01 0.19 8 0.51 0.15 0.51 0.01 0.36 47
Mauritius 0 0 0 0 0 0 0.09 0 0.09 0 0.01 0
Mozambique 1.32 0.42 1.32 0.04 1.08 63 2.52 0.95 2.52 0.11 1.99 272
Rwanda 0 0 0 0 0 0 0 0 0 0 0 0
Somalia 3.62 1.36 3.62 0.14 2.76 57 7.42 3.38 7.42 0.54 5.59 172
South Sudan 0 0 0 0 0 0 0 0 0 0 0 0
Tanzania, United Rep. of 0.64 0.19 0.64 0.01 0.52 73 1.12 0.36 1.12 0.02 0.76 303
Uganda 0.33 0.08 0.33 0 0.24 20 1.01 0.31 1.01 0.03 0.75 212
Zambia 0.11 0.02 0.11 0 0.08 3 0.30 0.06 0.30 0 0.17 18
Zimbabwe 0.17 0.05 0.17 0 0.11 5 0.38 0.12 0.38 0.01 0.28 26
Eastern Africa 0.50 0.11 0.50 0.01 0.35 313 0.91 0.32 0.91 0.04 0.65 1602
Note: The table shows the percentage of working hours lost to heat stress (and the associated health, well-being and productivity effects) in each sector and in the economy as a whole. It also shows the equivalent loss in terms of full-time jobs for the economy as a whole. Work in agriculture and construction is assumed to be carried out in the shade. The heat stress index for work in the afternoon sun adds around 2–3°C to the in-shade WBGT (see Appendix II for further details). The data are based on historical observations and on estimates obtained using the RCP2.6 climate change pathway, which envisages a global average temperature rise of 1.5°C by the end of the century.
Source: ILO estimates based on data from the ILOSTAT database and the HadGEM2 and GFDL-ESM2M climate models.
Box 3.1 Heat stress and vulnerable outdoor workers in the city of Bulawayo in Zimbabwe
A majority (60.6 per cent) of the Zimbabwean working population is employed in the informal economy (Medina and Schneider, 2018). The economic downturn in the country over the last two decades has forced hundreds of thousands of economically active people to engage in informal outdoor employment (Ngwenya et al., 2018a). In the city of Bulawayo, approximately 80 per cent of inhabitants work in the street as hawkers because they cannot find other forms of employment following the closure of various factories (Ngwenya et al., 2018b). These vendors sell a variety of products ranging from food and vegetables to second-hand clothes. They have to work long hours under high temperature, humidity and radiant heat. These are conditions that can very easily lead to heat stress and heat-related illness, and, in the long term, increase the risk of chronic kidney disease.
Ngwenya et al. (2018a) interviewed 123 outdoor street vendors in Bulawayo on their perceptions regarding heat stress, their health status and on the measures they had taken to adapt to the above-mentioned conditions. A total of 86 per cent of the survey participants reported spending long hours under direct sunlight. Some 58 per cent had heard about heat stress, and 57 per cent reported having fallen ill during the summer months. Zimbabwe has no legislation in place to protect workers from environmental heat exposure, especially the most vulnerable workers who are employed in the informal economy (Ngwenya et al., 2018b). Street vendors are not protected by the Government because they are considered to be illegal traders. Moreover, current initiatives to address the impacts of climate change in Zimbabwe tend to focus on the rural population. Although people living in the countryside are of course at risk from the consequences of climate change, these efforts are leaving behind other segments of the working population that are also vulnerable to rising temperatures, such as street vendors who are highly exposed to heat strain and other heat-related risks.
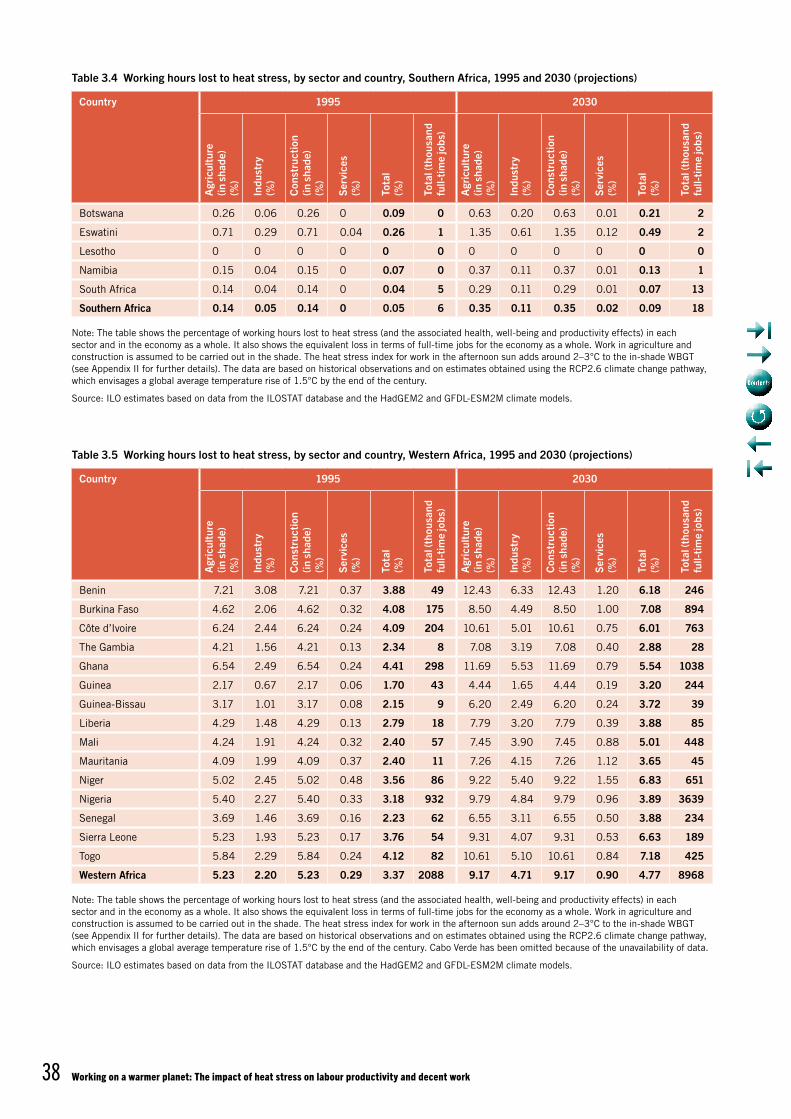
Working on a warmer planet: The impact of heat stress on labour productivity and decent work38
Table 3.4 Working hours lost to heat stress, by sector and country, Southern Africa, 1995 and 2030 (projections)
Country 1995 2030
Agr
icul
ture
(in
sha
de)
(%)
Indu
stry
(%
)
Con
stru
ctio
n (in
sha
de)
(%)
Serv
ices
(%
)
Tota
l (%
)
Tota
l (th
ousa
nd
full-
time
jobs
)
Agr
icul
ture
(in
sha
de)
(%)
Indu
stry
(%
)
Con
stru
ctio
n (in
sha
de)
(%)
Serv
ices
(%
)
Tota
l (%
)
Tota
l (th
ousa
nd
full-
time
jobs
)
Botswana 0.26 0.06 0.26 0 0.09 0 0.63 0.20 0.63 0.01 0.21 2
Eswatini 0.71 0.29 0.71 0.04 0.26 1 1.35 0.61 1.35 0.12 0.49 2
Lesotho 0 0 0 0 0 0 0 0 0 0 0 0
Namibia 0.15 0.04 0.15 0 0.07 0 0.37 0.11 0.37 0.01 0.13 1
South Africa 0.14 0.04 0.14 0 0.04 5 0.29 0.11 0.29 0.01 0.07 13
Southern Africa 0.14 0.05 0.14 0 0.05 6 0.35 0.11 0.35 0.02 0.09 18
Note: The table shows the percentage of working hours lost to heat stress (and the associated health, well-being and productivity effects) in each sector and in the economy as a whole. It also shows the equivalent loss in terms of full-time jobs for the economy as a whole. Work in agriculture and construction is assumed to be carried out in the shade. The heat stress index for work in the afternoon sun adds around 2–3°C to the in-shade WBGT (see Appendix II for further details). The data are based on historical observations and on estimates obtained using the RCP2.6 climate change pathway, which envisages a global average temperature rise of 1.5°C by the end of the century.
Source: ILO estimates based on data from the ILOSTAT database and the HadGEM2 and GFDL-ESM2M climate models.
Table 3.5 Working hours lost to heat stress, by sector and country, Western Africa, 1995 and 2030 (projections)
Country 1995 2030
Agr
icul
ture
(in
sha
de)
(%)
Indu
stry
(%
)
Con
stru
ctio
n (in
sha
de)
(%)
Serv
ices
(%
)
Tota
l (%
)
Tota
l (th
ousa
nd
full-
time
jobs
)
Agr
icul
ture
(in
sha
de)
(%)
Indu
stry
(%
)
Con
stru
ctio
n (in
sha
de)
(%)
Serv
ices
(%
)
Tota
l (%
)
Tota
l (th
ousa
nd
full-
time
jobs
)
Benin 7.21 3.08 7.21 0.37 3.88 49 12.43 6.33 12.43 1.20 6.18 246
Burkina Faso 4.62 2.06 4.62 0.32 4.08 175 8.50 4.49 8.50 1.00 7.08 894
Côte d’Ivoire 6.24 2.44 6.24 0.24 4.09 204 10.61 5.01 10.61 0.75 6.01 763
The Gambia 4.21 1.56 4.21 0.13 2.34 8 7.08 3.19 7.08 0.40 2.88 28
Ghana 6.54 2.49 6.54 0.24 4.41 298 11.69 5.53 11.69 0.79 5.54 1038
Guinea 2.17 0.67 2.17 0.06 1.70 43 4.44 1.65 4.44 0.19 3.20 244
Guinea-Bissau 3.17 1.01 3.17 0.08 2.15 9 6.20 2.49 6.20 0.24 3.72 39
Liberia 4.29 1.48 4.29 0.13 2.79 18 7.79 3.20 7.79 0.39 3.88 85
Mali 4.24 1.91 4.24 0.32 2.40 57 7.45 3.90 7.45 0.88 5.01 448
Mauritania 4.09 1.99 4.09 0.37 2.40 11 7.26 4.15 7.26 1.12 3.65 45
Niger 5.02 2.45 5.02 0.48 3.56 86 9.22 5.40 9.22 1.55 6.83 651
Nigeria 5.40 2.27 5.40 0.33 3.18 932 9.79 4.84 9.79 0.96 3.89 3639
Senegal 3.69 1.46 3.69 0.16 2.23 62 6.55 3.11 6.55 0.50 3.88 234
Sierra Leone 5.23 1.93 5.23 0.17 3.76 54 9.31 4.07 9.31 0.53 6.63 189
Togo 5.84 2.29 5.84 0.24 4.12 82 10.61 5.10 10.61 0.84 7.18 425
Western Africa 5.23 2.20 5.23 0.29 3.37 2088 9.17 4.71 9.17 0.90 4.77 8968
Note: The table shows the percentage of working hours lost to heat stress (and the associated health, well-being and productivity effects) in each sector and in the economy as a whole. It also shows the equivalent loss in terms of full-time jobs for the economy as a whole. Work in agriculture and construction is assumed to be carried out in the shade. The heat stress index for work in the afternoon sun adds around 2–3°C to the in-shade WBGT (see Appendix II for further details). The data are based on historical observations and on estimates obtained using the RCP2.6 climate change pathway, which envisages a global average temperature rise of 1.5°C by the end of the century. Cabo Verde has been omitted because of the unavailability of data.
Source: ILO estimates based on data from the ILOSTAT database and the HadGEM2 and GFDL-ESM2M climate models.
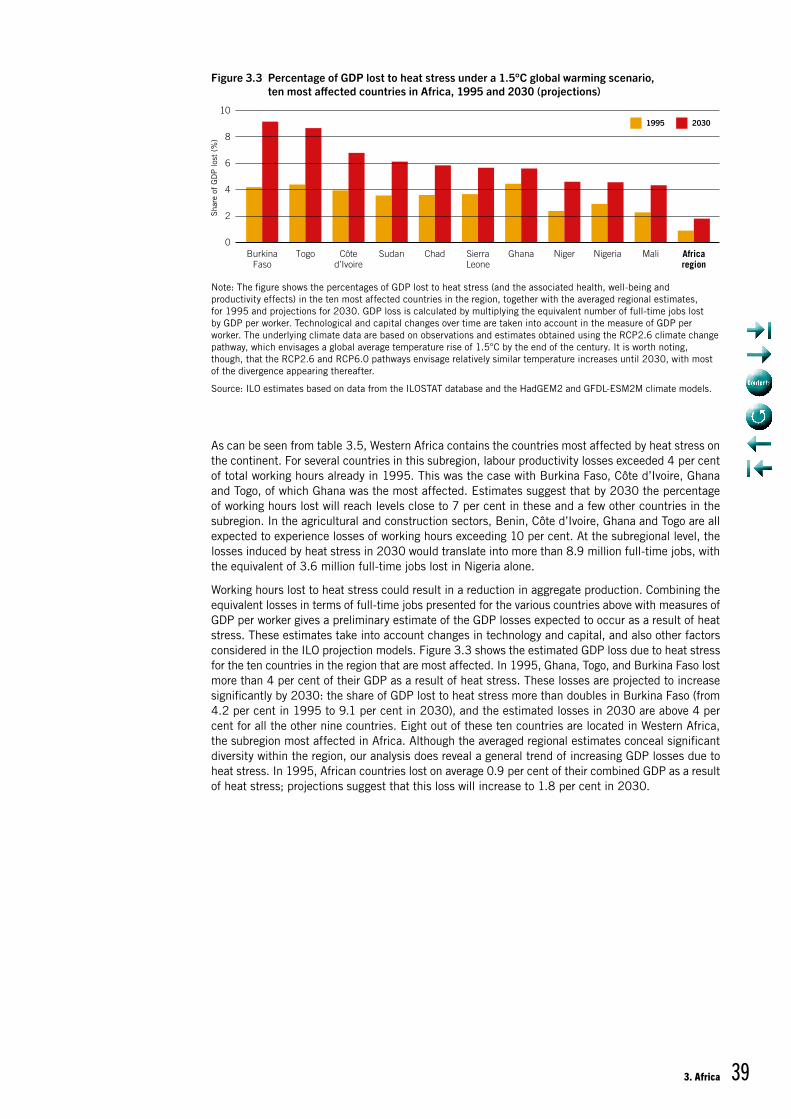
3. Africa 39
As can be seen from table 3.5, Western Africa contains the countries most affected by heat stress on the continent. For several countries in this subregion, labour productivity losses exceeded 4 per cent of total working hours already in 1995. This was the case with Burkina Faso, Côte d’Ivoire, Ghana and Togo, of which Ghana was the most affected. Estimates suggest that by 2030 the percentage of working hours lost will reach levels close to 7 per cent in these and a few other countries in the subregion. In the agricultural and construction sectors, Benin, Côte d’Ivoire, Ghana and Togo are all expected to experience losses of working hours exceeding 10 per cent. At the subregional level, the losses induced by heat stress in 2030 would translate into more than 8.9 million full-time jobs, with the equivalent of 3.6 million full-time jobs lost in Nigeria alone.
Working hours lost to heat stress could result in a reduction in aggregate production. Combining the equivalent losses in terms of full-time jobs presented for the various countries above with measures of GDP per worker gives a preliminary estimate of the GDP losses expected to occur as a result of heat stress. These estimates take into account changes in technology and capital, and also other factors considered in the ILO projection models. Figure 3.3 shows the estimated GDP loss due to heat stress for the ten countries in the region that are most affected. In 1995, Ghana, Togo, and Burkina Faso lost more than 4 per cent of their GDP as a result of heat stress. These losses are projected to increase significantly by 2030: the share of GDP lost to heat stress more than doubles in Burkina Faso (from 4.2 per cent in 1995 to 9.1 per cent in 2030), and the estimated losses in 2030 are above 4 per cent for all the other nine countries. Eight out of these ten countries are located in Western Africa, the subregion most affected in Africa. Although the averaged regional estimates conceal significant diversity within the region, our analysis does reveal a general trend of increasing GDP losses due to heat stress. In 1995, African countries lost on average 0.9 per cent of their combined GDP as a result of heat stress; projections suggest that this loss will increase to 1.8 per cent in 2030.
Note: The figure shows the percentages of GDP lost to heat stress (and the associated health, well-being and productivity effects) in the ten most affected countries in the region, together with the averaged regional estimates, for 1995 and projections for 2030. GDP loss is calculated by multiplying the equivalent number of full-time jobs lost by GDP per worker. Technological and capital changes over time are taken into account in the measure of GDP per worker. The underlying climate data are based on observations and estimates obtained using the RCP2.6 climate change pathway, which envisages a global average temperature rise of 1.5°C by the end of the century. It is worth noting, though, that the RCP2.6 and RCP6.0 pathways envisage relatively similar temperature increases until 2030, with most of the divergence appearing thereafter.
Source: ILO estimates based on data from the ILOSTAT database and the HadGEM2 and GFDL-ESM2M climate models.
Figure 3.3 Percentage of GDP lost to heat stress under a 1.5°C global warming scenario, ten most affected countries in Africa, 1995 and 2030 (projections)
10
Sha
re o
f G
DP
lost
(%
)
BurkinaFaso
Togo Côted’Ivoire
Sudan Chad SierraLeone
Ghana Niger Nigeria Mali Africaregion
20301995
0
2
4
6
8
Working on a warmer planet: The impact of heat stress on labour productivity and decent work40
3.4 Conclusion and key findingsAfrica is the second largest and most populated region in the world. With a projected 610 million workers in 2030, it would then account for 18 per cent of global employment. Africa contains some of the warmest areas of the world, has a high share of workers in agriculture, and exhibits high rates of vulnerable forms of employment and informality; moreover, its resources for adapting to increasing heat levels are limited. These characteristics mean that the impact of heat stress on labour product-ivity in the region is significant. Overall, projections suggest that 2.3 per cent of the total number of working hours in Africa will be lost to heat stress in 2030 – the equivalent of more than 14 million full-time jobs.
This productivity loss will put additional pressure on an increasing number of workers who are already threatened by other negative effects of climate change, such as changing rain patterns, natural dis-asters, water scarcity and biodiversity loss. The significant impact of climate change in Africa raises questions of social justice, especially given that the continent has contributed less than 1 per cent of the historical GHG emissions that are responsible for current climate change.
The impact of rising temperatures will vary considerably across countries and subregions, with Western Africa and Central Africa being the subregions most affected. The countries that are particularly at risk include Benin, Ghana, Togo, Burkina Faso, Côte d’Ivoire, Sierra Leone, Niger, Nigeria, Somalia, Chad and Sudan. In the African context, which is dominated by agricultural employment, such measures as promoting the mechanization of agriculture and skills development policies aimed at increasing the efficiency and sustainability of food production under new climatic conditions (ILO, 2018a) can complement monitoring and awareness campaigns as part of efforts to adapt to heat stress. So far, the impact of agroecological practices in Africa has been disappointing in terms of yields, employment and farmers’ income (ibid.), but it should be possible to improve their implementation so that they promote both sustainability and social justice (Montt and Luu, 2018).
41
4.1 Current and projected heat levelsWith a population of approximately 1 billion and a land area of around 40.7 million km2, the Americas1 are the world’s largest region and have the lowest population density. The Americas extend for approx-imately 14,000 km from their northernmost point in the Arctic tundra almost down to the Antarctic Circle. The climate and temperatures therefore vary significantly across the region, with Latin America (which comprises Central America and South America) and the Caribbean being particularly at risk of heat exposure.
According to the IPCC’s Fifth Assessment Report, mean annual temperature has increased over the past century in most of North America. Observations also point to an increase in the frequency of extreme heat events across the United States. Climate projections indicate that the mean annual temperature in North America will continue to increase during the twenty-first century. The largest increases are expected to occur in the high latitudes of the United States and Canada, and also in much of eastern Canada. Under the business-as-usual scenario (the RCP8.5 climate change pathway), temperature increases would even exceed 6°C in the late twenty-first century. The Fifth Assessment Report makes it clear that, without increased investment in adaptation measures, hot temperatures and extreme weather events in Canada and the United States will exacerbate the adverse health impacts of climate change (IPCC, 2014b).
As for Latin America and the Caribbean, a temperature increase of around 0.7°C to 1°C has been observed throughout Central America and South America over the last 40 years. The only exception is the Chilean coast, which experienced a cooling of approximately 1°C during the same period. Moreover, increases in temperature extremes have been identified in Central America, and also in most parts of the tropical and subtropical areas of South America. Looking forward, projections indicate an increase in mean temperature varying between 1.6°C and 4°C in Central America and between 1.7°C and 6.7°C in South America by the end of the century (ibid.).
Figure 4.1 shows the heat stress levels in the Americas for 1995 and projections for 2030, presented as WBGT values. Some areas of the Americas exhibit heat levels in the hottest month that are likely to affect labour productivity. The areas most affected are those within the tropical and subtropical zones, including large swaths of Central America, South America and the Caribbean. On the other hand, the risk of heat stress is lower in North America, except for some areas in the south, because of its proximity to the northern polar region. High-altitude areas such as the Andes are also at lower risk of heat exposure.
1. In this report, the four subregions of the Americas are North America (countries listed in table 4.1), Central America (table 4.2), South America (table 4.3), and the Caribbean (table 4.4).
4. Americas
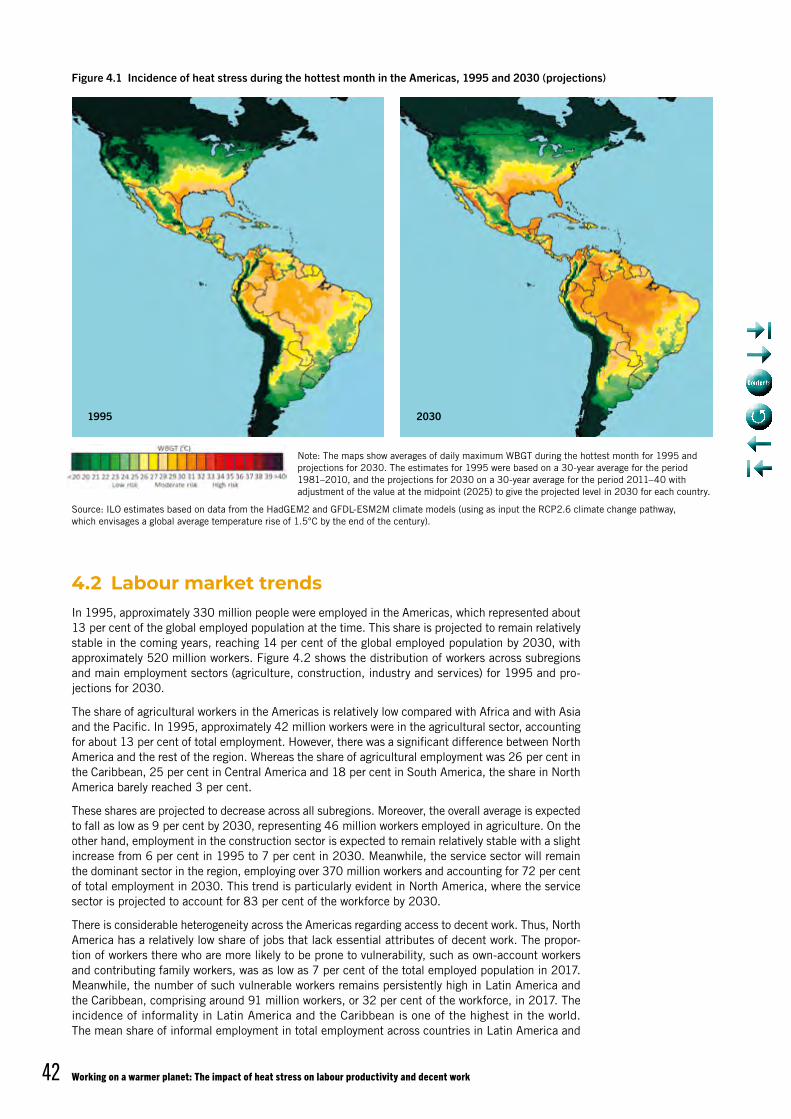
Working on a warmer planet: The impact of heat stress on labour productivity and decent work42
4.2 Labour market trendsIn 1995, approximately 330 million people were employed in the Americas, which represented about 13 per cent of the global employed population at the time. This share is projected to remain relatively stable in the coming years, reaching 14 per cent of the global employed population by 2030, with approximately 520 million workers. Figure 4.2 shows the distribution of workers across subregions and main employment sectors (agriculture, construction, industry and services) for 1995 and pro-jections for 2030.
The share of agricultural workers in the Americas is relatively low compared with Africa and with Asia and the Pacific. In 1995, approximately 42 million workers were in the agricultural sector, accounting for about 13 per cent of total employment. However, there was a significant difference between North America and the rest of the region. Whereas the share of agricultural employment was 26 per cent in the Caribbean, 25 per cent in Central America and 18 per cent in South America, the share in North America barely reached 3 per cent.
These shares are projected to decrease across all subregions. Moreover, the overall average is expected to fall as low as 9 per cent by 2030, representing 46 million workers employed in agriculture. On the other hand, employment in the construction sector is expected to remain relatively stable with a slight increase from 6 per cent in 1995 to 7 per cent in 2030. Meanwhile, the service sector will remain the dominant sector in the region, employing over 370 million workers and accounting for 72 per cent of total employment in 2030. This trend is particularly evident in North America, where the service sector is projected to account for 83 per cent of the workforce by 2030.
There is considerable heterogeneity across the Americas regarding access to decent work. Thus, North America has a relatively low share of jobs that lack essential attributes of decent work. The propor-tion of workers there who are more likely to be prone to vulnerability, such as own-account workers and contributing family workers, was as low as 7 per cent of the total employed population in 2017. Meanwhile, the number of such vulnerable workers remains persistently high in Latin America and the Caribbean, comprising around 91 million workers, or 32 per cent of the workforce, in 2017. The incidence of informality in Latin America and the Caribbean is one of the highest in the world. The mean share of informal employment in total employment across countries in Latin America and
Note: The maps show averages of daily maximum WBGT during the hottest month for 1995 and projections for 2030. The estimates for 1995 were based on a 30-year average for the period 1981–2010, and the projections for 2030 on a 30-year average for the period 2011–40 with adjustment of the value at the midpoint (2025) to give the projected level in 2030 for each country.
Source: ILO estimates based on data from the HadGEM2 and GFDL-ESM2M climate models (using as input the RCP2.6 climate change pathway, which envisages a global average temperature rise of 1.5°C by the end of the century).
Figure 4.1 Incidence of heat stress during the hottest month in the Americas, 1995 and 2030 (projections)
1995 2030
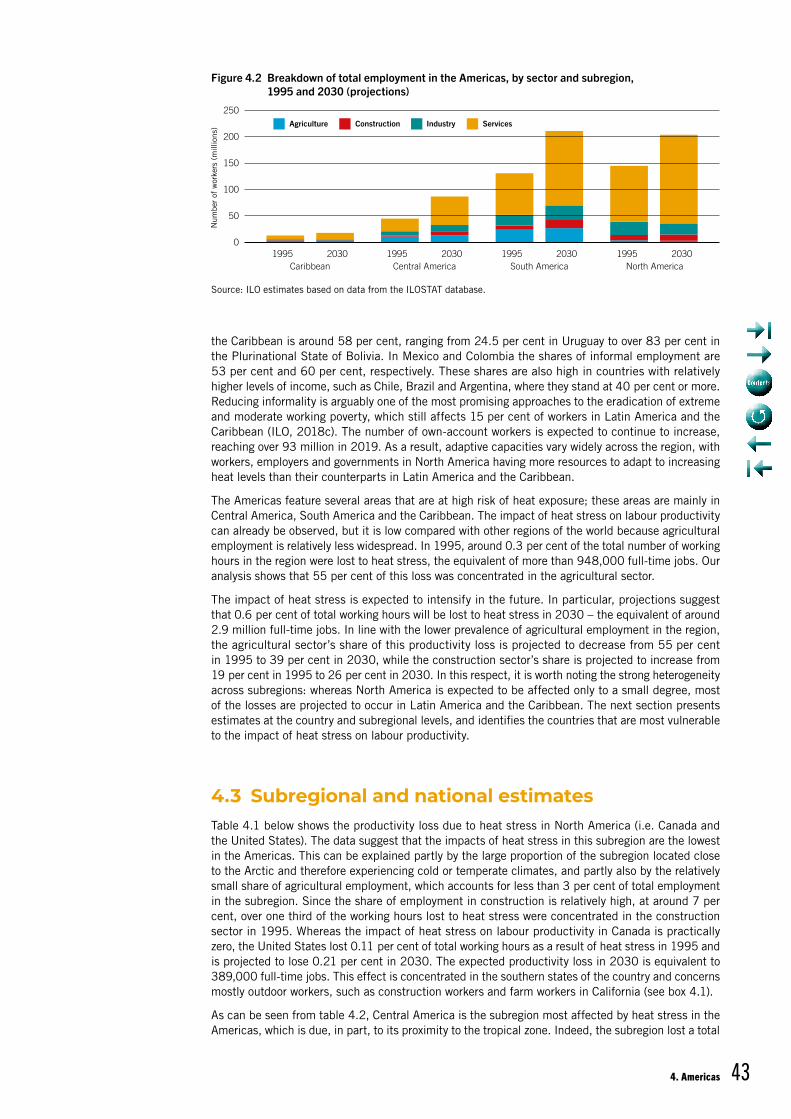
4. Americas 43
the Caribbean is around 58 per cent, ranging from 24.5 per cent in Uruguay to over 83 per cent in the Plurinational State of Bolivia. In Mexico and Colombia the shares of informal employment are 53 per cent and 60 per cent, respectively. These shares are also high in countries with relatively higher levels of income, such as Chile, Brazil and Argentina, where they stand at 40 per cent or more. Reducing informality is arguably one of the most promising approaches to the eradication of extreme and moderate working poverty, which still affects 15 per cent of workers in Latin America and the Caribbean (ILO, 2018c). The number of own-account workers is expected to continue to increase, reaching over 93 million in 2019. As a result, adaptive capacities vary widely across the region, with workers, employers and governments in North America having more resources to adapt to increasing heat levels than their counterparts in Latin America and the Caribbean.
The Americas feature several areas that are at high risk of heat exposure; these areas are mainly in Central America, South America and the Caribbean. The impact of heat stress on labour productivity can already be observed, but it is low compared with other regions of the world because agricultural employment is relatively less widespread. In 1995, around 0.3 per cent of the total number of working hours in the region were lost to heat stress, the equivalent of more than 948,000 full-time jobs. Our analysis shows that 55 per cent of this loss was concentrated in the agricultural sector.
The impact of heat stress is expected to intensify in the future. In particular, projections suggest that 0.6 per cent of total working hours will be lost to heat stress in 2030 – the equivalent of around 2.9 million full-time jobs. In line with the lower prevalence of agricultural employment in the region, the agricultural sector’s share of this productivity loss is projected to decrease from 55 per cent in 1995 to 39 per cent in 2030, while the construction sector’s share is projected to increase from 19 per cent in 1995 to 26 per cent in 2030. In this respect, it is worth noting the strong heterogeneity across subregions: whereas North America is expected to be affected only to a small degree, most of the losses are projected to occur in Latin America and the Caribbean. The next section presents estimates at the country and subregional levels, and identifies the countries that are most vulnerable to the impact of heat stress on labour productivity.
4.3 Subregional and national estimatesTable 4.1 below shows the productivity loss due to heat stress in North America (i.e. Canada and the United States). The data suggest that the impacts of heat stress in this subregion are the lowest in the Americas. This can be explained partly by the large proportion of the subregion located close to the Arctic and therefore experiencing cold or temperate climates, and partly also by the relatively small share of agricultural employment, which accounts for less than 3 per cent of total employment in the subregion. Since the share of employment in construction is relatively high, at around 7 per cent, over one third of the working hours lost to heat stress were concentrated in the construction sector in 1995. Whereas the impact of heat stress on labour productivity in Canada is practically zero, the United States lost 0.11 per cent of total working hours as a result of heat stress in 1995 and is projected to lose 0.21 per cent in 2030. The expected productivity loss in 2030 is equivalent to 389,000 full-time jobs. This effect is concentrated in the southern states of the country and concerns mostly outdoor workers, such as construction workers and farm workers in California (see box 4.1).
As can be seen from table 4.2, Central America is the subregion most affected by heat stress in the Americas, which is due, in part, to its proximity to the tropical zone. Indeed, the subregion lost a total
Source: ILO estimates based on data from the ILOSTAT database.
Figure 4.2 Breakdown of total employment in the Americas, by sector and subregion, 1995 and 2030 (projections)
1995 2030Caribbean
1995 2030Central America
1995 2030South America
1995 2030North America
0
50
100
150
200
250Agriculture Construction Industry Services
Num
ber
of w
orke
rs (
mill
ions
)
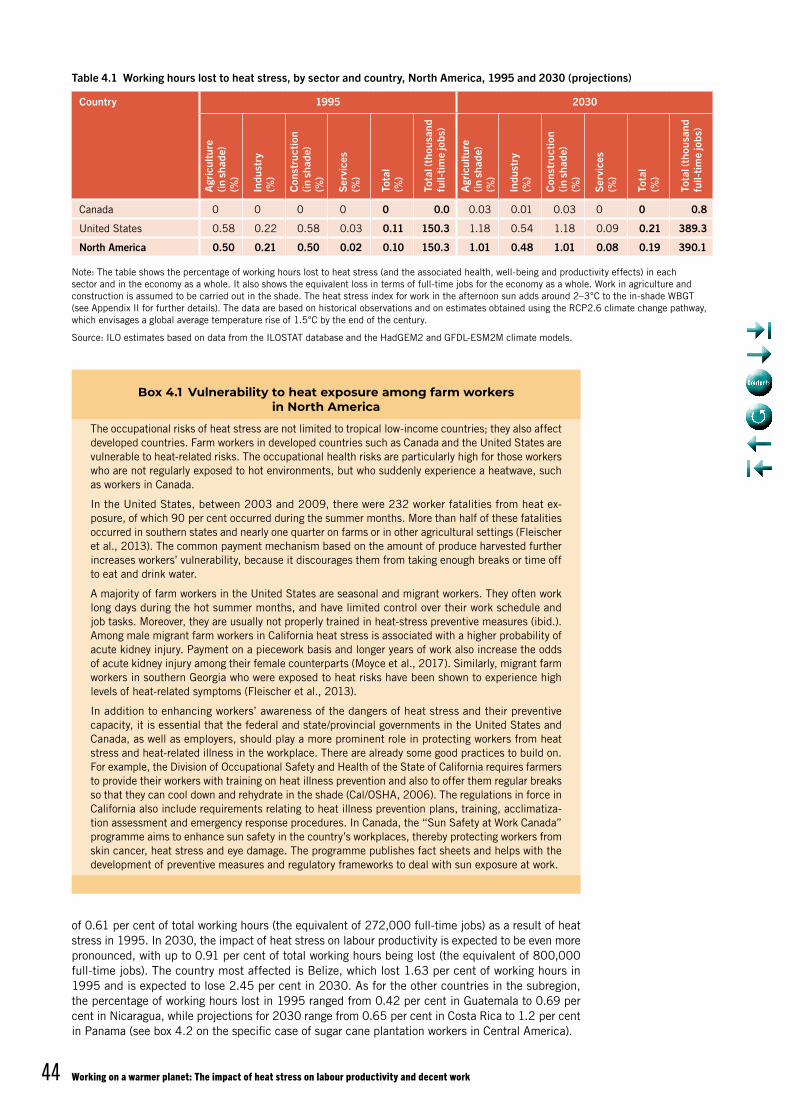
Working on a warmer planet: The impact of heat stress on labour productivity and decent work44
Table 4.1 Working hours lost to heat stress, by sector and country, North America, 1995 and 2030 (projections)
Country 1995 2030
Agr
icul
ture
(in
sha
de)
(%)
Indu
stry
(%
)
Con
stru
ctio
n (in
sha
de)
(%)
Serv
ices
(%
)
Tota
l (%
)
Tota
l (th
ousa
nd
full-
time
jobs
)
Agr
icul
ture
(in
sha
de)
(%)
Indu
stry
(%
)
Con
stru
ctio
n (in
sha
de)
(%)
Serv
ices
(%
)
Tota
l (%
)
Tota
l (th
ousa
nd
full-
time
jobs
)
Canada 0 0 0 0 0 0.0 0.03 0.01 0.03 0 0 0.8
United States 0.58 0.22 0.58 0.03 0.11 150.3 1.18 0.54 1.18 0.09 0.21 389.3
North America 0.50 0.21 0.50 0.02 0.10 150.3 1.01 0.48 1.01 0.08 0.19 390.1
Note: The table shows the percentage of working hours lost to heat stress (and the associated health, well-being and productivity effects) in each sector and in the economy as a whole. It also shows the equivalent loss in terms of full-time jobs for the economy as a whole. Work in agriculture and construction is assumed to be carried out in the shade. The heat stress index for work in the afternoon sun adds around 2–3°C to the in-shade WBGT (see Appendix II for further details). The data are based on historical observations and on estimates obtained using the RCP2.6 climate change pathway, which envisages a global average temperature rise of 1.5°C by the end of the century.
Source: ILO estimates based on data from the ILOSTAT database and the HadGEM2 and GFDL-ESM2M climate models.
Box 4.1 Vulnerability to heat exposure among farm workers in North America
The occupational risks of heat stress are not limited to tropical low-income countries; they also affect developed countries. Farm workers in developed countries such as Canada and the United States are vulnerable to heat-related risks. The occupational health risks are particularly high for those workers who are not regularly exposed to hot environments, but who suddenly experience a heatwave, such as workers in Canada.
In the United States, between 2003 and 2009, there were 232 worker fatalities from heat ex-posure, of which 90 per cent occurred during the summer months. More than half of these fatalities occurred in southern states and nearly one quarter on farms or in other agricultural settings (Fleischer et al., 2013). The common payment mechanism based on the amount of produce harvested further increases workers’ vulnerability, because it discourages them from taking enough breaks or time off to eat and drink water.
A majority of farm workers in the United States are seasonal and migrant workers. They often work long days during the hot summer months, and have limited control over their work schedule and job tasks. Moreover, they are usually not properly trained in heat-stress preventive measures (ibid.). Among male migrant farm workers in California heat stress is associated with a higher probability of acute kidney injury. Payment on a piecework basis and longer years of work also increase the odds of acute kidney injury among their female counterparts (Moyce et al., 2017). Similarly, migrant farm workers in southern Georgia who were exposed to heat risks have been shown to experience high levels of heat-related symptoms (Fleischer et al., 2013).
In addition to enhancing workers’ awareness of the dangers of heat stress and their preventive capacity, it is essential that the federal and state/provincial governments in the United States and Canada, as well as employers, should play a more prominent role in protecting workers from heat stress and heat-related illness in the workplace. There are already some good practices to build on. For example, the Division of Occupational Safety and Health of the State of California requires farmers to provide their workers with training on heat illness prevention and also to offer them regular breaks so that they can cool down and rehydrate in the shade (Cal/OSHA, 2006). The regulations in force in California also include requirements relating to heat illness prevention plans, training, acclimatiza-tion assessment and emergency response procedures. In Canada, the “Sun Safety at Work Canada” programme aims to enhance sun safety in the country’s workplaces, thereby protecting workers from skin cancer, heat stress and eye damage. The programme publishes fact sheets and helps with the development of preventive measures and regulatory frameworks to deal with sun exposure at work.
of 0.61 per cent of total working hours (the equivalent of 272,000 full-time jobs) as a result of heat stress in 1995. In 2030, the impact of heat stress on labour productivity is expected to be even more pronounced, with up to 0.91 per cent of total working hours being lost (the equivalent of 800,000 full-time jobs). The country most affected is Belize, which lost 1.63 per cent of working hours in 1995 and is expected to lose 2.45 per cent in 2030. As for the other countries in the subregion, the percentage of working hours lost in 1995 ranged from 0.42 per cent in Guatemala to 0.69 per cent in Nicaragua, while projections for 2030 range from 0.65 per cent in Costa Rica to 1.2 per cent in Panama (see box 4.2 on the specific case of sugar cane plantation workers in Central America).
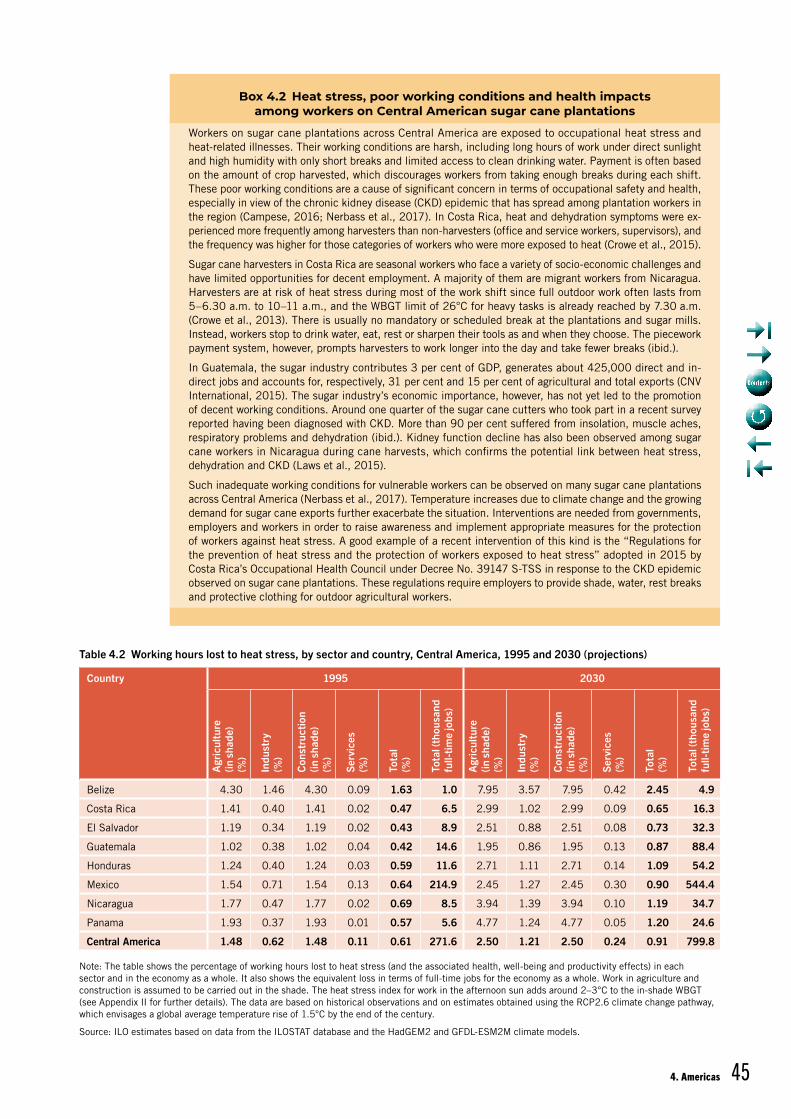
4. Americas 45
Table 4.2 Working hours lost to heat stress, by sector and country, Central America, 1995 and 2030 (projections)
Country 1995 2030
Agr
icul
ture
(in
sha
de)
(%)
Indu
stry
(%
)
Con
stru
ctio
n (in
sha
de)
(%)
Serv
ices
(%
)
Tota
l (%
)
Tota
l (th
ousa
nd
full-
time
jobs
)
Agr
icul
ture
(in
sha
de)
(%)
Indu
stry
(%
)
Con
stru
ctio
n (in
sha
de)
(%)
Serv
ices
(%
)
Tota
l (%
)
Tota
l (th
ousa
nd
full-
time
jobs
)
Belize 4.30 1.46 4.30 0.09 1.63 1.0 7.95 3.57 7.95 0.42 2.45 4.9
Costa Rica 1.41 0.40 1.41 0.02 0.47 6.5 2.99 1.02 2.99 0.09 0.65 16.3
El Salvador 1.19 0.34 1.19 0.02 0.43 8.9 2.51 0.88 2.51 0.08 0.73 32.3
Guatemala 1.02 0.38 1.02 0.04 0.42 14.6 1.95 0.86 1.95 0.13 0.87 88.4
Honduras 1.24 0.40 1.24 0.03 0.59 11.6 2.71 1.11 2.71 0.14 1.09 54.2
Mexico 1.54 0.71 1.54 0.13 0.64 214.9 2.45 1.27 2.45 0.30 0.90 544.4
Nicaragua 1.77 0.47 1.77 0.02 0.69 8.5 3.94 1.39 3.94 0.10 1.19 34.7
Panama 1.93 0.37 1.93 0.01 0.57 5.6 4.77 1.24 4.77 0.05 1.20 24.6
Central America 1.48 0.62 1.48 0.11 0.61 271.6 2.50 1.21 2.50 0.24 0.91 799.8
Note: The table shows the percentage of working hours lost to heat stress (and the associated health, well-being and productivity effects) in each sector and in the economy as a whole. It also shows the equivalent loss in terms of full-time jobs for the economy as a whole. Work in agriculture and construction is assumed to be carried out in the shade. The heat stress index for work in the afternoon sun adds around 2–3°C to the in-shade WBGT (see Appendix II for further details). The data are based on historical observations and on estimates obtained using the RCP2.6 climate change pathway, which envisages a global average temperature rise of 1.5°C by the end of the century.
Source: ILO estimates based on data from the ILOSTAT database and the HadGEM2 and GFDL-ESM2M climate models.
Box 4.2 Heat stress, poor working conditions and health impacts among workers on Central American sugar cane plantations
Workers on sugar cane plantations across Central America are exposed to occupational heat stress and heat-related illnesses. Their working conditions are harsh, including long hours of work under direct sunlight and high humidity with only short breaks and limited access to clean drinking water. Payment is often based on the amount of crop harvested, which discourages workers from taking enough breaks during each shift. These poor working conditions are a cause of significant concern in terms of occupational safety and health, especially in view of the chronic kidney disease (CKD) epidemic that has spread among plantation workers in the region (Campese, 2016; Nerbass et al., 2017). In Costa Rica, heat and dehydration symptoms were ex-perienced more frequently among harvesters than non-harvesters (office and service workers, supervisors), and the frequency was higher for those categories of workers who were more exposed to heat (Crowe et al., 2015).
Sugar cane harvesters in Costa Rica are seasonal workers who face a variety of socio-economic challenges and have limited opportunities for decent employment. A majority of them are migrant workers from Nicaragua. Harvesters are at risk of heat stress during most of the work shift since full outdoor work often lasts from 5–6.30 a.m. to 10–11 a.m., and the WBGT limit of 26°C for heavy tasks is already reached by 7.30 a.m. (Crowe et al., 2013). There is usually no mandatory or scheduled break at the plantations and sugar mills. Instead, workers stop to drink water, eat, rest or sharpen their tools as and when they choose. The piecework payment system, however, prompts harvesters to work longer into the day and take fewer breaks (ibid.).
In Guatemala, the sugar industry contributes 3 per cent of GDP, generates about 425,000 direct and in-direct jobs and accounts for, respectively, 31 per cent and 15 per cent of agricultural and total exports (CNV International, 2015). The sugar industry’s economic importance, however, has not yet led to the promotion of decent working conditions. Around one quarter of the sugar cane cutters who took part in a recent survey reported having been diagnosed with CKD. More than 90 per cent suffered from insolation, muscle aches, respiratory problems and dehydration (ibid.). Kidney function decline has also been observed among sugar cane workers in Nicaragua during cane harvests, which confirms the potential link between heat stress, dehydration and CKD (Laws et al., 2015).
Such inadequate working conditions for vulnerable workers can be observed on many sugar cane plantations across Central America (Nerbass et al., 2017). Temperature increases due to climate change and the growing demand for sugar cane exports further exacerbate the situation. Interventions are needed from governments, employers and workers in order to raise awareness and implement appropriate measures for the protection of workers against heat stress. A good example of a recent intervention of this kind is the “Regulations for the prevention of heat stress and the protection of workers exposed to heat stress” adopted in 2015 by Costa Rica’s Occupational Health Council under Decree No. 39147 S-TSS in response to the CKD epidemic observed on sugar cane plantations. These regulations require employers to provide shade, water, rest breaks and protective clothing for outdoor agricultural workers.
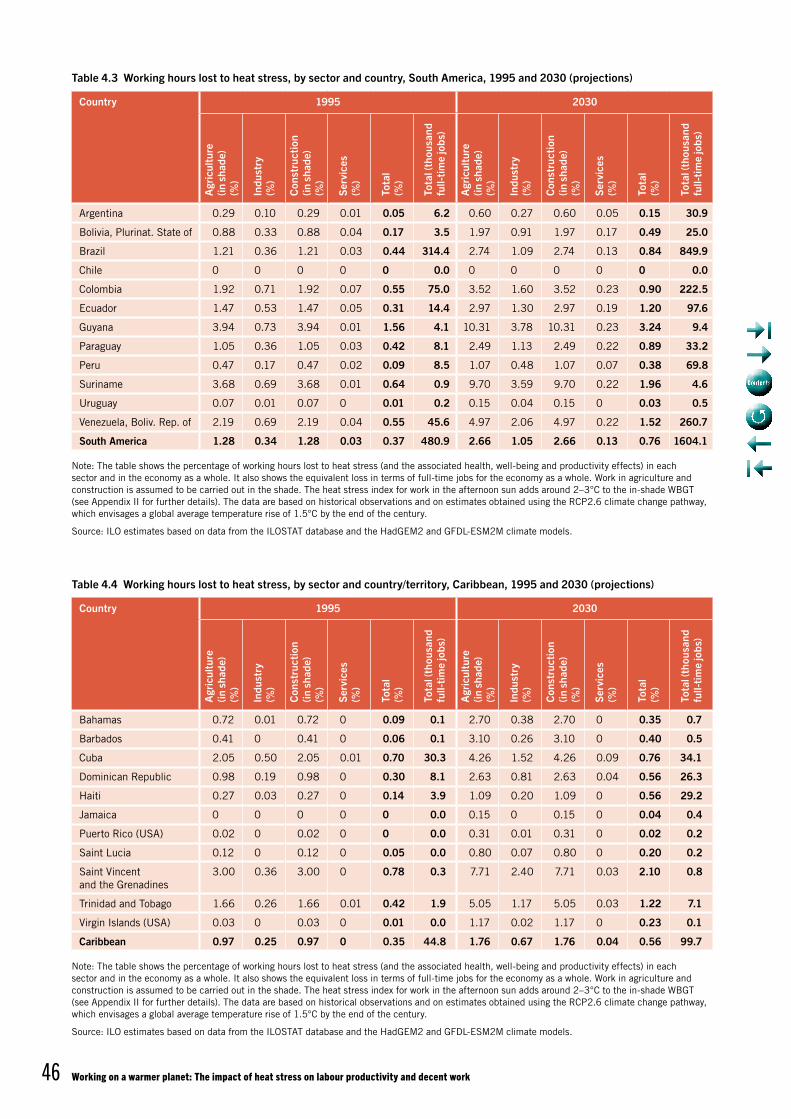
Working on a warmer planet: The impact of heat stress on labour productivity and decent work46
Table 4.3 Working hours lost to heat stress, by sector and country, South America, 1995 and 2030 (projections)
Country 1995 2030
Agr
icul
ture
(in
sha
de)
(%)
Indu
stry
(%
)
Con
stru
ctio
n (in
sha
de)
(%)
Serv
ices
(%
)
Tota
l (%
)
Tota
l (th
ousa
nd
full-
time
jobs
)
Agr
icul
ture
(in
sha
de)
(%)
Indu
stry
(%
)
Con
stru
ctio
n (in
sha
de)
(%)
Serv
ices
(%
)
Tota
l (%
)
Tota
l (th
ousa
nd
full-
time
jobs
)
Argentina 0.29 0.10 0.29 0.01 0.05 6.2 0.60 0.27 0.60 0.05 0.15 30.9
Bolivia, Plurinat. State of 0.88 0.33 0.88 0.04 0.17 3.5 1.97 0.91 1.97 0.17 0.49 25.0
Brazil 1.21 0.36 1.21 0.03 0.44 314.4 2.74 1.09 2.74 0.13 0.84 849.9
Chile 0 0 0 0 0 0.0 0 0 0 0 0 0.0
Colombia 1.92 0.71 1.92 0.07 0.55 75.0 3.52 1.60 3.52 0.23 0.90 222.5
Ecuador 1.47 0.53 1.47 0.05 0.31 14.4 2.97 1.30 2.97 0.19 1.20 97.6
Guyana 3.94 0.73 3.94 0.01 1.56 4.1 10.31 3.78 10.31 0.23 3.24 9.4
Paraguay 1.05 0.36 1.05 0.03 0.42 8.1 2.49 1.13 2.49 0.22 0.89 33.2
Peru 0.47 0.17 0.47 0.02 0.09 8.5 1.07 0.48 1.07 0.07 0.38 69.8
Suriname 3.68 0.69 3.68 0.01 0.64 0.9 9.70 3.59 9.70 0.22 1.96 4.6
Uruguay 0.07 0.01 0.07 0 0.01 0.2 0.15 0.04 0.15 0 0.03 0.5
Venezuela, Boliv. Rep. of 2.19 0.69 2.19 0.04 0.55 45.6 4.97 2.06 4.97 0.22 1.52 260.7
South America 1.28 0.34 1.28 0.03 0.37 480.9 2.66 1.05 2.66 0.13 0.76 1604.1
Note: The table shows the percentage of working hours lost to heat stress (and the associated health, well-being and productivity effects) in each sector and in the economy as a whole. It also shows the equivalent loss in terms of full-time jobs for the economy as a whole. Work in agriculture and construction is assumed to be carried out in the shade. The heat stress index for work in the afternoon sun adds around 2–3°C to the in-shade WBGT (see Appendix II for further details). The data are based on historical observations and on estimates obtained using the RCP2.6 climate change pathway, which envisages a global average temperature rise of 1.5°C by the end of the century.
Source: ILO estimates based on data from the ILOSTAT database and the HadGEM2 and GFDL-ESM2M climate models.
Table 4.4 Working hours lost to heat stress, by sector and country/territory, Caribbean, 1995 and 2030 (projections)
Country 1995 2030
Agr
icul
ture
(in
sha
de)
(%)
Indu
stry
(%
)
Con
stru
ctio
n (in
sha
de)
(%)
Serv
ices
(%
)
Tota
l (%
)
Tota
l (th
ousa
nd
full-
time
jobs
)
Agr
icul
ture
(in
sha
de)
(%)
Indu
stry
(%
)
Con
stru
ctio
n (in
sha
de)
(%)
Serv
ices
(%
)
Tota
l (%
)
Tota
l (th
ousa
nd
full-
time
jobs
)
Bahamas 0.72 0.01 0.72 0 0.09 0.1 2.70 0.38 2.70 0 0.35 0.7
Barbados 0.41 0 0.41 0 0.06 0.1 3.10 0.26 3.10 0 0.40 0.5
Cuba 2.05 0.50 2.05 0.01 0.70 30.3 4.26 1.52 4.26 0.09 0.76 34.1
Dominican Republic 0.98 0.19 0.98 0 0.30 8.1 2.63 0.81 2.63 0.04 0.56 26.3
Haiti 0.27 0.03 0.27 0 0.14 3.9 1.09 0.20 1.09 0 0.56 29.2
Jamaica 0 0 0 0 0 0.0 0.15 0 0.15 0 0.04 0.4
Puerto Rico (USA) 0.02 0 0.02 0 0 0.0 0.31 0.01 0.31 0 0.02 0.2
Saint Lucia 0.12 0 0.12 0 0.05 0.0 0.80 0.07 0.80 0 0.20 0.2
Saint Vincent and the Grenadines
3.00 0.36 3.00 0 0.78 0.3 7.71 2.40 7.71 0.03 2.10 0.8
Trinidad and Tobago 1.66 0.26 1.66 0.01 0.42 1.9 5.05 1.17 5.05 0.03 1.22 7.1
Virgin Islands (USA) 0.03 0 0.03 0 0.01 0.0 1.17 0.02 1.17 0 0.23 0.1
Caribbean 0.97 0.25 0.97 0 0.35 44.8 1.76 0.67 1.76 0.04 0.56 99.7
Note: The table shows the percentage of working hours lost to heat stress (and the associated health, well-being and productivity effects) in each sector and in the economy as a whole. It also shows the equivalent loss in terms of full-time jobs for the economy as a whole. Work in agriculture and construction is assumed to be carried out in the shade. The heat stress index for work in the afternoon sun adds around 2–3°C to the in-shade WBGT (see Appendix II for further details). The data are based on historical observations and on estimates obtained using the RCP2.6 climate change pathway, which envisages a global average temperature rise of 1.5°C by the end of the century.
Source: ILO estimates based on data from the ILOSTAT database and the HadGEM2 and GFDL-ESM2M climate models.
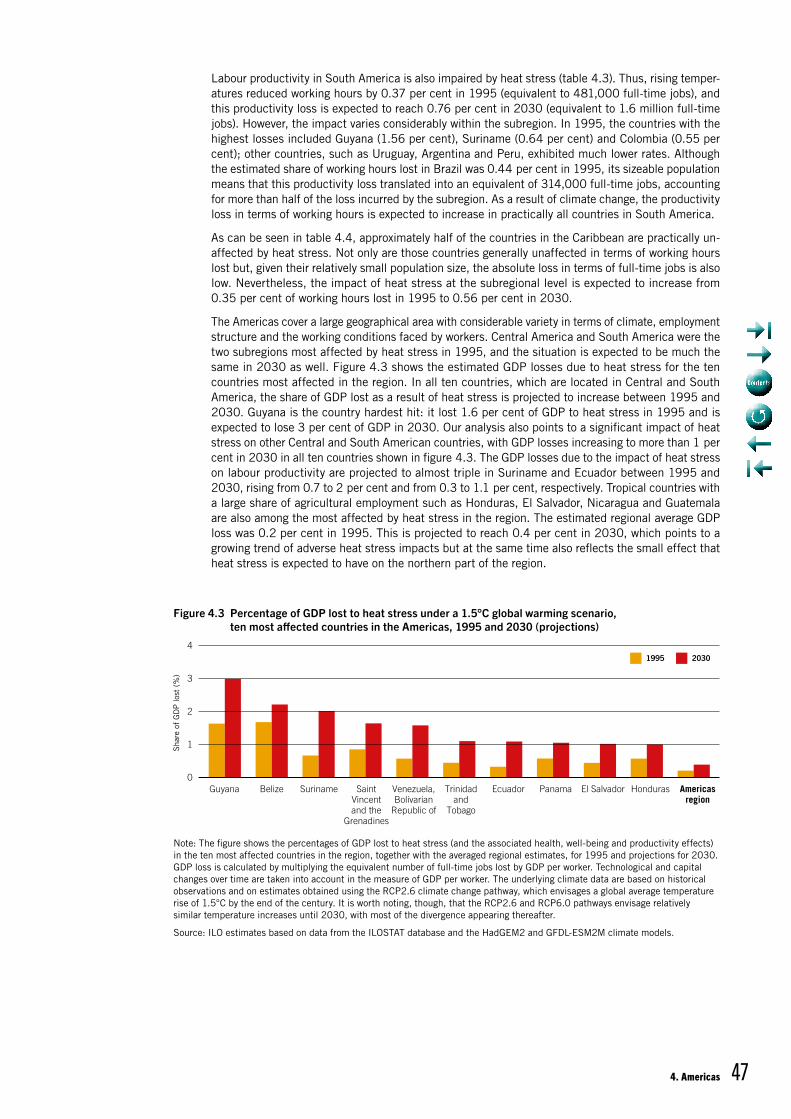
4. Americas 47
Labour productivity in South America is also impaired by heat stress (table 4.3). Thus, rising temper-atures reduced working hours by 0.37 per cent in 1995 (equivalent to 481,000 full-time jobs), and this productivity loss is expected to reach 0.76 per cent in 2030 (equivalent to 1.6 million full-time jobs). However, the impact varies considerably within the subregion. In 1995, the countries with the highest losses included Guyana (1.56 per cent), Suriname (0.64 per cent) and Colombia (0.55 per cent); other countries, such as Uruguay, Argentina and Peru, exhibited much lower rates. Although the estimated share of working hours lost in Brazil was 0.44 per cent in 1995, its sizeable population means that this productivity loss translated into an equivalent of 314,000 full-time jobs, accounting for more than half of the loss incurred by the subregion. As a result of climate change, the productivity loss in terms of working hours is expected to increase in practically all countries in South America.
As can be seen in table 4.4, approximately half of the countries in the Caribbean are practically un -affected by heat stress. Not only are those countries generally unaffected in terms of working hours lost but, given their relatively small population size, the absolute loss in terms of full-time jobs is also low. Nevertheless, the impact of heat stress at the subregional level is expected to increase from 0.35 per cent of working hours lost in 1995 to 0.56 per cent in 2030.
The Americas cover a large geographical area with considerable variety in terms of climate, employment structure and the working conditions faced by workers. Central America and South America were the two subregions most affected by heat stress in 1995, and the situation is expected to be much the same in 2030 as well. Figure 4.3 shows the estimated GDP losses due to heat stress for the ten countries most affected in the region. In all ten countries, which are located in Central and South America, the share of GDP lost as a result of heat stress is projected to increase between 1995 and 2030. Guyana is the country hardest hit: it lost 1.6 per cent of GDP to heat stress in 1995 and is expected to lose 3 per cent of GDP in 2030. Our analysis also points to a significant impact of heat stress on other Central and South American countries, with GDP losses increasing to more than 1 per cent in 2030 in all ten countries shown in figure 4.3. The GDP losses due to the impact of heat stress on labour productivity are projected to almost triple in Suriname and Ecuador between 1995 and 2030, rising from 0.7 to 2 per cent and from 0.3 to 1.1 per cent, respectively. Tropical countries with a large share of agricultural employment such as Honduras, El Salvador, Nicaragua and Guatemala are also among the most affected by heat stress in the region. The estimated regional average GDP loss was 0.2 per cent in 1995. This is projected to reach 0.4 per cent in 2030, which points to a growing trend of adverse heat stress impacts but at the same time also reflects the small effect that heat stress is expected to have on the northern part of the region.
Note: The figure shows the percentages of GDP lost to heat stress (and the associated health, well-being and productivity effects) in the ten most affected countries in the region, together with the averaged regional estimates, for 1995 and projections for 2030. GDP loss is calculated by multiplying the equivalent number of full-time jobs lost by GDP per worker. Technological and capital changes over time are taken into account in the measure of GDP per worker. The underlying climate data are based on historical observations and on estimates obtained using the RCP2.6 climate change pathway, which envisages a global average temperature rise of 1.5°C by the end of the century. It is worth noting, though, that the RCP2.6 and RCP6.0 pathways envisage relatively similar temperature increases until 2030, with most of the divergence appearing thereafter.
Source: ILO estimates based on data from the ILOSTAT database and the HadGEM2 and GFDL-ESM2M climate models.
Figure 4.3 Percentage of GDP lost to heat stress under a 1.5°C global warming scenario, ten most affected countries in the Americas, 1995 and 2030 (projections)
4
Sha
re o
f G
DP
lost
(%
)
20301995
Guyana Belize Suriname SaintVincentand the
Grenadines
Venezuela,Bolivarian
Republic of
Trinidadand
Tobago
Ecuador Panama El Salvador Honduras Americasregion
0
1
2
3
Working on a warmer planet: The impact of heat stress on labour productivity and decent work48
4.4 Conclusion and key findingsClimate change impacts, decent work challenges and adaptive capacity levels vary considerably across the Americas. The North America subregion, for instance, enjoys low levels of heat stress and relatively high labour standards. By contrast, the number of vulnerable workers, such as own-account workers and contributing family workers, remains persistently high in Latin America and the Caribbean.
Because of its overall proximity to the equator, Central America is the subregion most affected by heat stress. Although the reduction in working hours due to heat stress is projected to remain below 1 per cent at the subregional level in Central America, South America and the Caribbean in 2030, locally the productivity losses can be much higher. The adverse impact of heat stress on labour productivity is sometimes very high precisely in those countries where the lack of decent work remains a major issue (e.g. Guyana).
49
5.1 Current and projected heat levelsWith a population of approximately 161 million and a land area of around 3.8 million km2, the Arab States1 are the smallest and least populated region in the world. Although the region as a whole is vulnerable to heat exposure, some countries face greater risks of heat stress than others. In par-ticular, the wealthier countries that are members of the Gulf Cooperation Council (GCC) have greater adaptive capacity than non-GCC countries. The Arab region also has widely contrasting topography and distinctive landforms. Thus, it is characterized by large mountainous zones (e.g. the Hijaz and Asir Mountains in Saudi Arabia and the highlands of Hadhramaut in Yemen) and vast deserts that cover most of the area. These desert expanses are interspersed with oases that create microclimates which make agriculture possible to a limited extent. The Arab States mostly experience a hot desert climate with less than 100 mm of rainfall per year. Average temperatures range from +40°C to +50°C in the summer and from +5°C to +15°C in the winter, with very wide daily fluctuations. Exceptions to these conditions occur in the coastal zones of eastern Oman, south-western Saudi Arabia, and Yemen, where rainfall is more abundant because of the seasonal monsoon winds and northward expansion of the intertropical convergence zone.
Compared with other parts of the world, relatively little is known about the evolution of climate in the Arab region. However, the available studies do suggest that average surface temperatures rose during the twentieth century, accompanied by an increase in the frequency of hot days and a gradual reduc-tion in the number of cold days (Zhang et al., 2005; ESCWA et al., 2017). For instance, Tanarhte, Hadjinicolaou and Lelieveld (2012) identified an overall temperature increase of 0.2°C to 0.4°C per decade in Saudi Arabia and the Persian Gulf, with particularly significant increases occurring during the summer months. In addition to rising temperatures, other studies note that there has been an increase in the number of heatwaves in countries within the region (Rahman et al., 2015). Looking forward, a report by ESCWA et al. (2017) concludes that temperatures in the Arab States are set to increase further during the twenty-first century. Indeed, under a high Representative Concentration Pathway (RCP) scenario, the increase in average annual temperatures could range from 1.5°C to 2.3°C by the end of the century.
Figure 5.1 shows the heat stress levels in the Arab States for 1995 and 2030. As can be seen, large areas of the region exhibit heat levels in the hottest month that are likely to affect labour productivity. However, heat exposure is most pronounced mainly in the coastal areas, where humidity is higher than in the inland desert areas.
1. In this report, the Arab States region refers to the 11 countries and Occupied Palestinian Territory listed in table 5.1.
5. Arab States
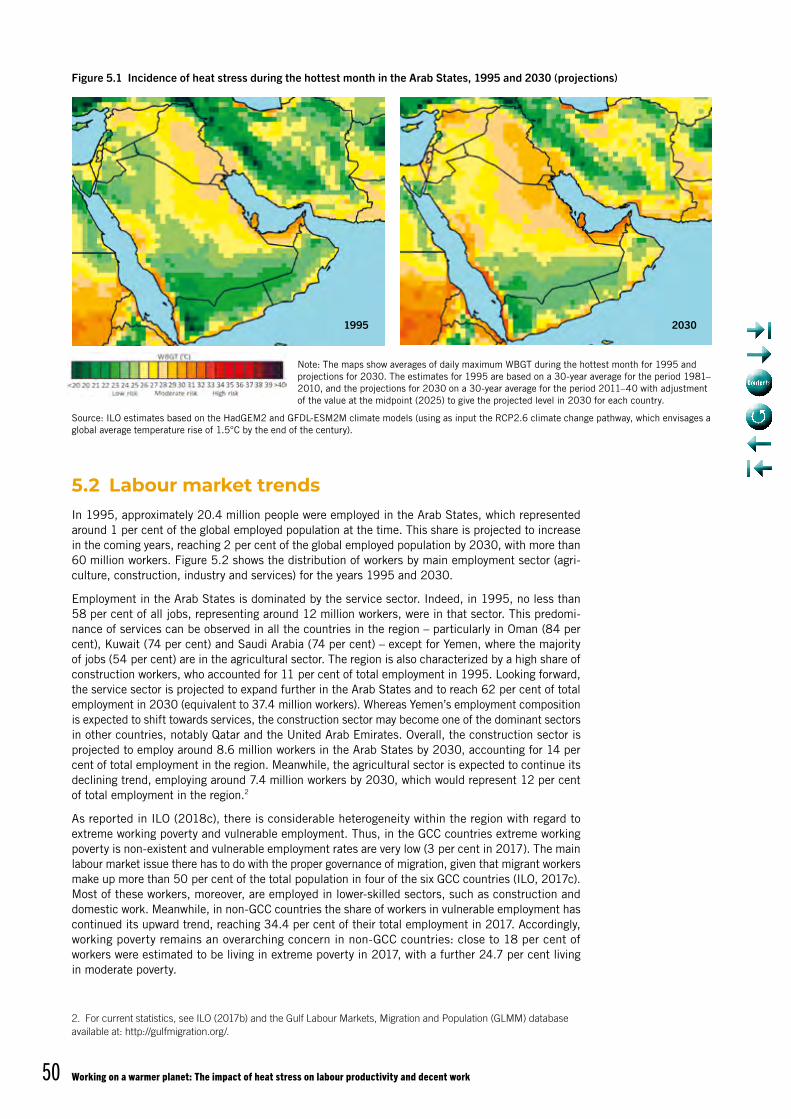
Working on a warmer planet: The impact of heat stress on labour productivity and decent work50
5.2 Labour market trendsIn 1995, approximately 20.4 million people were employed in the Arab States, which represented around 1 per cent of the global employed population at the time. This share is projected to increase in the coming years, reaching 2 per cent of the global employed population by 2030, with more than 60 million workers. Figure 5.2 shows the distribution of workers by main employment sector (agri-culture, construction, industry and services) for the years 1995 and 2030.
Employment in the Arab States is dominated by the service sector. Indeed, in 1995, no less than 58 per cent of all jobs, representing around 12 million workers, were in that sector. This predomi-nance of services can be observed in all the countries in the region – particularly in Oman (84 per cent), Kuwait (74 per cent) and Saudi Arabia (74 per cent) – except for Yemen, where the majority of jobs (54 per cent) are in the agricultural sector. The region is also characterized by a high share of construction workers, who accounted for 11 per cent of total employment in 1995. Looking forward, the service sector is projected to expand further in the Arab States and to reach 62 per cent of total employment in 2030 (equivalent to 37.4 million workers). Whereas Yemen’s employment composition is expected to shift towards services, the construction sector may become one of the dominant sectors in other countries, notably Qatar and the United Arab Emirates. Overall, the construction sector is projected to employ around 8.6 million workers in the Arab States by 2030, accounting for 14 per cent of total employment in the region. Meanwhile, the agricultural sector is expected to continue its declining trend, employing around 7.4 million workers by 2030, which would represent 12 per cent of total employment in the region.2
As reported in ILO (2018c), there is considerable heterogeneity within the region with regard to extreme working poverty and vulnerable employment. Thus, in the GCC countries extreme working poverty is non-existent and vulnerable employment rates are very low (3 per cent in 2017). The main labour market issue there has to do with the proper governance of migration, given that migrant workers make up more than 50 per cent of the total population in four of the six GCC countries (ILO, 2017c). Most of these workers, moreover, are employed in lower-skilled sectors, such as construction and domestic work. Meanwhile, in non-GCC countries the share of workers in vulnerable employment has continued its upward trend, reaching 34.4 per cent of their total employment in 2017. Accordingly, working poverty remains an overarching concern in non-GCC countries: close to 18 per cent of workers were estimated to be living in extreme poverty in 2017, with a further 24.7 per cent living in moderate poverty.
2. For current statistics, see ILO (2017b) and the Gulf Labour Markets, Migration and Population (GLMM) database available at: http://gulfmigration.org/.
Note: The maps show averages of daily maximum WBGT during the hottest month for 1995 and projections for 2030. The estimates for 1995 are based on a 30-year average for the period 1981–2010, and the projections for 2030 on a 30-year average for the period 2011–40 with adjustment of the value at the midpoint (2025) to give the projected level in 2030 for each country.
Source: ILO estimates based on the HadGEM2 and GFDL-ESM2M climate models (using as input the RCP2.6 climate change pathway, which envisages a global average temperature rise of 1.5°C by the end of the century).
Figure 5.1 Incidence of heat stress during the hottest month in the Arab States, 1995 and 2030 (projections)
1995 2030
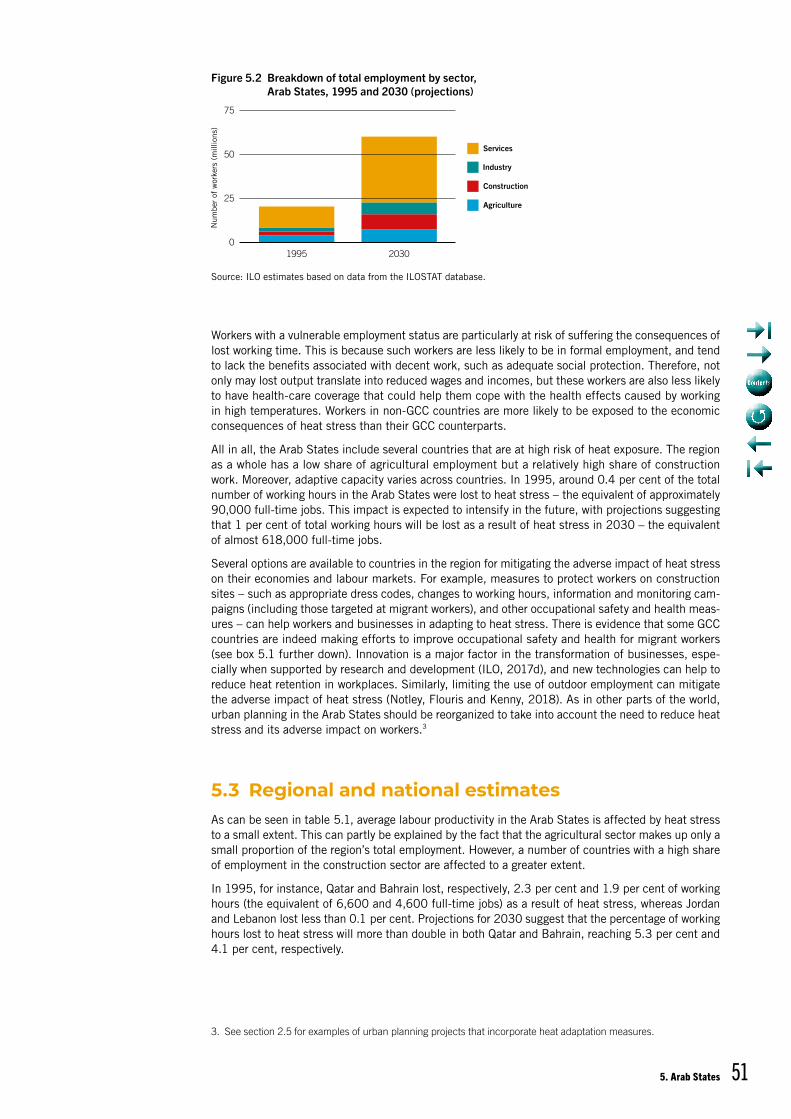
5. Arab States 51
Workers with a vulnerable employment status are particularly at risk of suffering the consequences of lost working time. This is because such workers are less likely to be in formal employment, and tend to lack the benefits associated with decent work, such as adequate social protection. Therefore, not only may lost output translate into reduced wages and incomes, but these workers are also less likely to have health-care coverage that could help them cope with the health effects caused by working in high temperatures. Workers in non-GCC countries are more likely to be exposed to the economic consequences of heat stress than their GCC counterparts.
All in all, the Arab States include several countries that are at high risk of heat exposure. The region as a whole has a low share of agricultural employment but a relatively high share of construction work. Moreover, adaptive capacity varies across countries. In 1995, around 0.4 per cent of the total number of working hours in the Arab States were lost to heat stress – the equivalent of approximately 90,000 full-time jobs. This impact is expected to intensify in the future, with projections suggesting that 1 per cent of total working hours will be lost as a result of heat stress in 2030 – the equivalent of almost 618,000 full-time jobs.
Several options are available to countries in the region for mitigating the adverse impact of heat stress on their economies and labour markets. For example, measures to protect workers on construction sites – such as appropriate dress codes, changes to working hours, information and monitoring cam-paigns (including those targeted at migrant workers), and other occupational safety and health meas-ures – can help workers and businesses in adapting to heat stress. There is evidence that some GCC countries are indeed making efforts to improve occupational safety and health for migrant workers (see box 5.1 further down). Innovation is a major factor in the transformation of businesses, espe-cially when supported by research and development (ILO, 2017d), and new technologies can help to reduce heat retention in workplaces. Similarly, limiting the use of outdoor employment can mitigate the adverse impact of heat stress (Notley, Flouris and Kenny, 2018). As in other parts of the world, urban planning in the Arab States should be reorganized to take into account the need to reduce heat stress and its adverse impact on workers.3
5.3 Regional and national estimatesAs can be seen in table 5.1, average labour productivity in the Arab States is affected by heat stress to a small extent. This can partly be explained by the fact that the agricultural sector makes up only a small proportion of the region’s total employment. However, a number of countries with a high share of employment in the construction sector are affected to a greater extent.
In 1995, for instance, Qatar and Bahrain lost, respectively, 2.3 per cent and 1.9 per cent of working hours (the equivalent of 6,600 and 4,600 full-time jobs) as a result of heat stress, whereas Jordan and Lebanon lost less than 0.1 per cent. Projections for 2030 suggest that the percentage of working hours lost to heat stress will more than double in both Qatar and Bahrain, reaching 5.3 per cent and 4.1 per cent, respectively.
3. See section 2.5 for examples of urban planning projects that incorporate heat adaptation measures.
Source: ILO estimates based on data from the ILOSTAT database.
Figure 5.2 Breakdown of total employment by sector, Arab States, 1995 and 2030 (projections)
Agriculture
Construction
Industry
Services
1995 2030
Num
ber
of w
orke
rs (
mill
ions
)
0
25
50
75
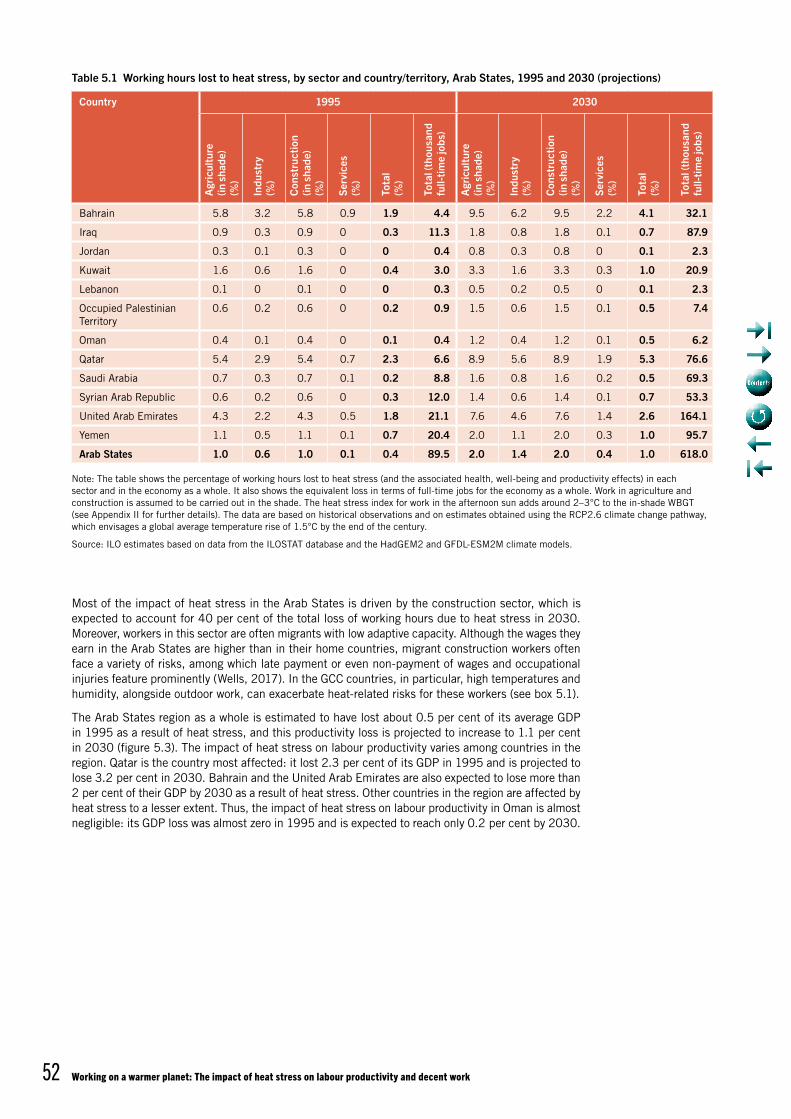
Working on a warmer planet: The impact of heat stress on labour productivity and decent work52
Most of the impact of heat stress in the Arab States is driven by the construction sector, which is expected to account for 40 per cent of the total loss of working hours due to heat stress in 2030. Moreover, workers in this sector are often migrants with low adaptive capacity. Although the wages they earn in the Arab States are higher than in their home countries, migrant construction workers often face a variety of risks, among which late payment or even non-payment of wages and occupational injuries feature prominently (Wells, 2017). In the GCC countries, in particular, high temperatures and humidity, alongside outdoor work, can exacerbate heat-related risks for these workers (see box 5.1).
The Arab States region as a whole is estimated to have lost about 0.5 per cent of its average GDP in 1995 as a result of heat stress, and this productivity loss is projected to increase to 1.1 per cent in 2030 (figure 5.3). The impact of heat stress on labour productivity varies among countries in the region. Qatar is the country most affected: it lost 2.3 per cent of its GDP in 1995 and is projected to lose 3.2 per cent in 2030. Bahrain and the United Arab Emirates are also expected to lose more than 2 per cent of their GDP by 2030 as a result of heat stress. Other countries in the region are affected by heat stress to a lesser extent. Thus, the impact of heat stress on labour productivity in Oman is almost negligible: its GDP loss was almost zero in 1995 and is expected to reach only 0.2 per cent by 2030.
Table 5.1 Working hours lost to heat stress, by sector and country/territory, Arab States, 1995 and 2030 (projections)
Country 1995 2030
Agr
icul
ture
(in
sha
de)
(%)
Indu
stry
(%
)
Con
stru
ctio
n (in
sha
de)
(%)
Serv
ices
(%
)
Tota
l (%
)
Tota
l (th
ousa
nd
full-
time
jobs
)
Agr
icul
ture
(in
sha
de)
(%)
Indu
stry
(%
)
Con
stru
ctio
n (in
sha
de)
(%)
Serv
ices
(%
)
Tota
l (%
)
Tota
l (th
ousa
nd
full-
time
jobs
)
Bahrain 5.8 3.2 5.8 0.9 1.9 4.4 9.5 6.2 9.5 2.2 4.1 32.1
Iraq 0.9 0.3 0.9 0 0.3 11.3 1.8 0.8 1.8 0.1 0.7 87.9
Jordan 0.3 0.1 0.3 0 0 0.4 0.8 0.3 0.8 0 0.1 2.3
Kuwait 1.6 0.6 1.6 0 0.4 3.0 3.3 1.6 3.3 0.3 1.0 20.9
Lebanon 0.1 0 0.1 0 0 0.3 0.5 0.2 0.5 0 0.1 2.3
Occupied Palestinian Territory
0.6 0.2 0.6 0 0.2 0.9 1.5 0.6 1.5 0.1 0.5 7.4
Oman 0.4 0.1 0.4 0 0.1 0.4 1.2 0.4 1.2 0.1 0.5 6.2
Qatar 5.4 2.9 5.4 0.7 2.3 6.6 8.9 5.6 8.9 1.9 5.3 76.6
Saudi Arabia 0.7 0.3 0.7 0.1 0.2 8.8 1.6 0.8 1.6 0.2 0.5 69.3
Syrian Arab Republic 0.6 0.2 0.6 0 0.3 12.0 1.4 0.6 1.4 0.1 0.7 53.3
United Arab Emirates 4.3 2.2 4.3 0.5 1.8 21.1 7.6 4.6 7.6 1.4 2.6 164.1
Yemen 1.1 0.5 1.1 0.1 0.7 20.4 2.0 1.1 2.0 0.3 1.0 95.7
Arab States 1.0 0.6 1.0 0.1 0.4 89.5 2.0 1.4 2.0 0.4 1.0 618.0
Note: The table shows the percentage of working hours lost to heat stress (and the associated health, well-being and productivity effects) in each sector and in the economy as a whole. It also shows the equivalent loss in terms of full-time jobs for the economy as a whole. Work in agriculture and construction is assumed to be carried out in the shade. The heat stress index for work in the afternoon sun adds around 2–3°C to the in-shade WBGT (see Appendix II for further details). The data are based on historical observations and on estimates obtained using the RCP2.6 climate change pathway, which envisages a global average temperature rise of 1.5°C by the end of the century.
Source: ILO estimates based on data from the ILOSTAT database and the HadGEM2 and GFDL-ESM2M climate models.
5. Arab States 53
Box 5.1 Heat-related risks and occupational safety and health measures in the GCC countries
Outdoor workers are highly exposed to heat-related risks in the countries of the GCC, because the regional climate is characterized by dry and subtropical desert conditions. During the summer, temperature and humidity levels are high and rainfall is scarce. Between April and September, temperatures can reach 55°C even in the shade, with humidity exceeding 80 per cent.
In the GCC countries, the construction sector accounted for 23 per cent of employment in 2017 (ILOSTAT), putting a large number of workers at risk of heat stress. In the United Arab Emirates, heat-related illnesses and heightened risk of accidents are, together with long working hours, the main health issues faced by construction workers (Sönmez et al., 2011). In a survey conducted among Nepalese migrant workers in Qatar, the United Arab Emirates and Saudi Arabia, 17.6 per cent of the respondents said that they suffered from heat-related illness (Joshi, Simkhada and Prescott, 2011). For migrant workers in the GCC countries, occupational safety and health (OSH) risks are exacerbated by cultural and language barriers. Language barriers impede communication, especially when it comes to the delivery of training on OSH guidelines and on preventive practices. They also make it harder for workers to report symptoms and raise concerns with their managers, or even just to explain that they need to take a break or drink some water. The GCC countries have some of the world’s highest ratios of migrant workers to total workforce. Indeed, migrant workers make up around 50 per cent of the population in Bahrain and Oman, and more than 80 per cent in Qatar and the United Arab Emirates (ILO, 2018e). In the construction sector, more than 95 per cent of the workforce are migrant workers from low-wage Asian countries such as Pakistan, India, the Philippines, Bangladesh and Nepal (ibid.).
The governments of the GCC countries have been developing measures to protect workers from OSH risks, including heat stress. A ban on midday work has been adopted by all GCC countries. This prohibits any out-door work during the hottest hours in the summer (typically from June to August, though the exact dates and hours vary from country to country), with violations being punished by fines or business closures. Sometimes, however, temperatures are still extremely high outside of the banned hours, and limited labour inspection undermines the policy’s effectiveness. Moreover, since climate change is expected to increase the frequency and intensity of heatwaves, fixed restrictions on working hours may not be enough to protect workers from heat stress in these countries. Consequently, the current ban on outdoor midday work in the GCC countries could be adjusted to reflect real-time temperature, humidity and workload for all outdoor worksites. For example, in Qatar, the Supreme Committee for Delivery and Legacy, in 2016, mandated work-to-rest ratios based on a real-time heat and humidity index (the “Humidex” index, also used in Canada) for a limited number of workers on construction sites related to the preparations for the 2022 FIFA World Cup.
General OSH measures have been developed in most GCC countries. Bahrain, Kuwait, the United Arab Emirates and Oman include exposure to extreme temperatures as a specific risk in their OSH frameworks.* In Abu Dhabi, the “Safety in Heat” programme aims to assist and guide employers in the implementa-tion of heat stress management procedures, and also to ensure proper control measures for the protec-tion of workers from heat stress (OSHAD, 2018). In Saudi Arabia, the National Strategic Programme for Occupational Safety and Health requires companies with 50 or more workers to have an OSH strategy in place; an additional legal instrument regulating noise, heat, lighting and personal safety was enacted in late 2018 (Muhammad, 2018). In Qatar, the Supreme Council of Health was established in 2005 to improve OSH governance and regulation (Mehmood et al., 2018). Qatar’s National Health Strategy 2011–2016 acknowledges the importance of protecting the health of migrant workers in the country, who have limited access to health-care services and work in hazardous environments. In addition, Qatar has already imple-mented several other heat stress management practices on its World Cup construction sites. The ILO has launched a joint technical cooperation programme with the Government of Qatar with a view to the adop-tion and implementation of an Occupational Safety and Health National Policy, which would also address heat-related risks (ILO, 2017e). In the United Arab Emirates, an ILO project that ran from 2016 to 2018 focused on strengthening the labour inspection system and the capacity of staff in the Ministry of Human Resources and Emiratization to address OSH issues (ILO, 2018f).
In the current context, further regulatory improvements can help reduce heat-stress risks, enhance workers’ ability to deal with these risks and provide them with more space to voice their concerns in the GCC countries (QDVC, VINCI and BWI, 2017). Mechanisms that ensure compliance with laws and policies are important in protecting workers from occupational heat stress. One such mechanism is the labour inspectorate, which should have sufficient resources to monitor a large number of worksites and sufficient capacity to communicate with migrant workers speaking languages other than English or Arabic (Crocombe, 2014; Wells, 2017). In this respect, the posters and infographics used in awareness-raising campaigns that have been delivered in the languages most frequently spoken by migrant workers in Kuwait and Qatar have been considered very helpful (Wells, 2017).
* Bahrain: Law No. 36 of 2012 Promulgating the Labour Law in the Private Sector (Title XV, Art. 166(3)); Kuwait: Order No. 45 to Publish Scales, Standards and Measures for Safety at Workplaces (1979), and Ministerial Decree No. 22 of 1974 regarding the Safety Precautions to be Taken against Occupational Injury and Disease (Section 3, Art. 44); United Arab Emirates: Ministerial Order No. 32 of 1982 on Determining Prevention Means and Measures to Protect Workers from Work Hazards (Art. 5(B)); Oman: Ministerial Decision No. 286 of 2008 on Occupational Safety Regulations Governed by the Labour Code (Ch. 2, Art.16(3)).
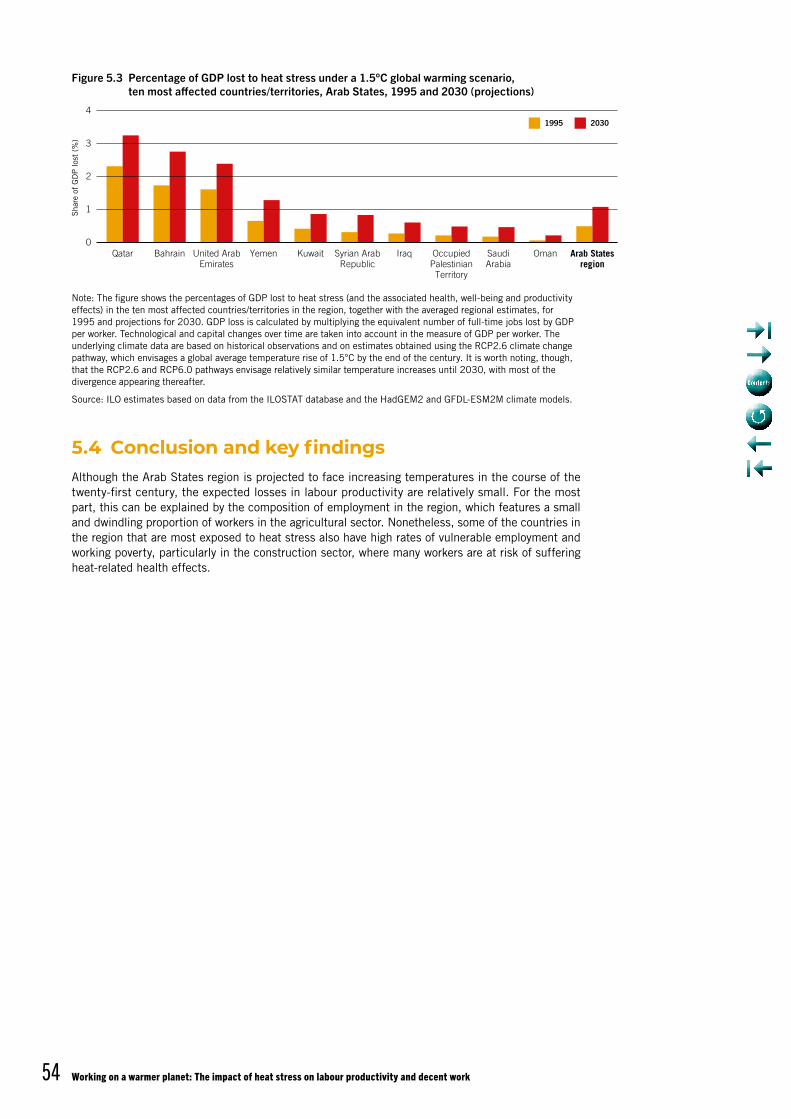
Working on a warmer planet: The impact of heat stress on labour productivity and decent work54
5.4 Conclusion and key findingsAlthough the Arab States region is projected to face increasing temperatures in the course of the twenty-first century, the expected losses in labour productivity are relatively small. For the most part, this can be explained by the composition of employment in the region, which features a small and dwindling proportion of workers in the agricultural sector. Nonetheless, some of the countries in the region that are most exposed to heat stress also have high rates of vulnerable employment and working poverty, particularly in the construction sector, where many workers are at risk of suffering heat-related health effects.
Note: The figure shows the percentages of GDP lost to heat stress (and the associated health, well-being and productivity effects) in the ten most affected countries/territories in the region, together with the averaged regional estimates, for 1995 and projections for 2030. GDP loss is calculated by multiplying the equivalent number of full-time jobs lost by GDP per worker. Technological and capital changes over time are taken into account in the measure of GDP per worker. The underlying climate data are based on historical observations and on estimates obtained using the RCP2.6 climate change pathway, which envisages a global average temperature rise of 1.5°C by the end of the century. It is worth noting, though, that the RCP2.6 and RCP6.0 pathways envisage relatively similar temperature increases until 2030, with most of the divergence appearing thereafter.
Source: ILO estimates based on data from the ILOSTAT database and the HadGEM2 and GFDL-ESM2M climate models.
Figure 5.3 Percentage of GDP lost to heat stress under a 1.5°C global warming scenario, ten most affected countries/territories, Arab States, 1995 and 2030 (projections)
Sha
re o
f G
DP
lost
(%
)
20301995
Qatar Bahrain United ArabEmirates
Yemen Kuwait Syrian ArabRepublic
Iraq OccupiedPalestinianTerritory
SaudiArabia
Oman Arab Statesregion
4
0
1
2
3
55
6. Asia and the Pacific
6.1 Current and projected heat levelsWith a population of approximately 4.2 billion and a land area of around 32 million km2, Asia and the Pacific1 is the world’s most populated region. It is particularly vulnerable to heat stress because of its high exposure in some subregions. The region also has varying degrees of adaptive capacity.
Comprising some of the world’s most diverse subregions in terms of geography and climate, Asia is bounded to the north by the Arctic Ocean, to the east by the Pacific Ocean, and to the south by the Indian Ocean. Moreover, it features 11 climate zones, which range from a tropical monsoon climate in the far south, through humid, cool and temperate climates in the north, to a desert climate in the west and north-west. In the rest of its populated areas, a humid, temperate climate prevails.
According to the IPCC’s Fifth Assessment Report, warming trends and increasing temperature extremes have been observed across most of Asia over the past century. As a result of polar amplification, there have been significant warming trends in northern Asia, where the temperature increase exceeded 2°C in the second half of the twentieth century. Over the period 1901–2009, such trends were particularly pronounced in the cold season, with an increase of 2.4°C in the mid-latitude semi-arid areas of Asia. Rising annual mean temperatures have been observed at the country level in Eastern and Southern Asia during the twentieth century. Across South-East Asia, the temperature has been increasing at a rate of 0.14°C to 0.2°C per decade since the 1960s – a trend accompanied by a rising number of hot days and warm nights, and a decline in cooler weather. Looking forward, projections indicate that Asia’s climate throughout the twenty-first century will be warmer, with a rising occurrence of extreme events, including more intense and frequent heatwaves in some parts.
The Pacific part of the region is composed of Australia and 25 island States, and includes several areas that are highly vulnerable to increasing temperatures. This subregion exhibits a wide diversity of climates (e.g. moist tropical monsoonal, arid and moist temperate, including alpine conditions) and geography. Accordingly, the risks associated with climate change differ notably across Australia, New Zealand and the Pacific islands. Thus, although long-term trends in the Pacific as a whole point to a shift towards higher land surface air temperatures and sea surface temperatures (including more hot extremes and fewer cold extremes), and also to changing rainfall patterns, an overarching concern for the Pacific islands in particular is rising sea levels. Moreover, Australia and New Zealand have a high adaptive capacity, whereas there is considerable heterogeneity in that respect across the small Pacific islands (IPCC, 2014b).
Figure 6.1 shows the heat stress levels in Asia and parts of the Pacific for 1995 and projections for 2030, presented as WBGT values. Asia and the Pacific exhibit heat levels in the hottest month that are likely to affect labour productivity. However, some areas are significantly more exposed than others. For instance, with the exception of high-altitude areas such as Tibet and the Himalayas, areas within the tropical and subtropical zones are the most affected. These include parts of Southern Asia, South-East Asia and southern China (Eastern Asia), and also northern Australia and some Pacific islands.
1. In this report, the four subregions of the Asia and Pacific region are Eastern Asia (countries and territories listed in table 6.1), Southern Asia (table 6.2), South-East Asia (table 6.3), and the Pacific Islands (table 6.4).
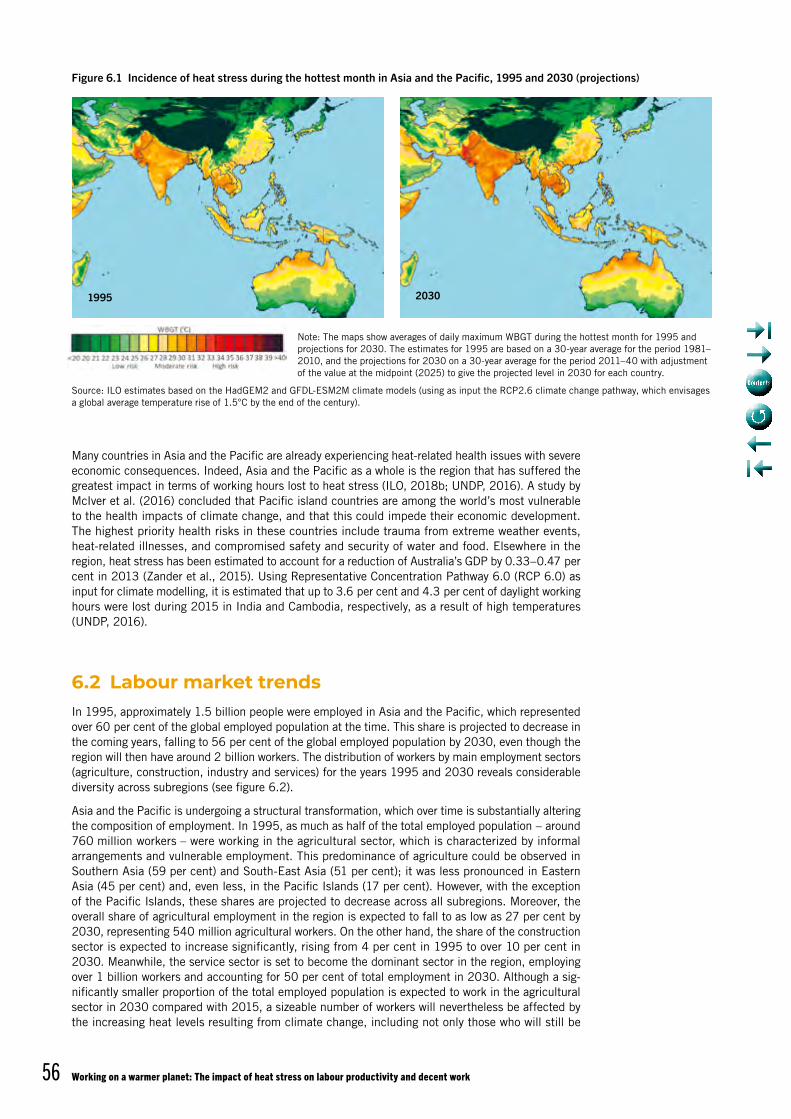
Working on a warmer planet: The impact of heat stress on labour productivity and decent work56
Many countries in Asia and the Pacific are already experiencing heat-related health issues with severe economic consequences. Indeed, Asia and the Pacific as a whole is the region that has suffered the greatest impact in terms of working hours lost to heat stress (ILO, 2018b; UNDP, 2016). A study by McIver et al. (2016) concluded that Pacific island countries are among the world’s most vulnerable to the health impacts of climate change, and that this could impede their economic development. The highest priority health risks in these countries include trauma from extreme weather events, heat- related illnesses, and compromised safety and security of water and food. Elsewhere in the region, heat stress has been estimated to account for a reduction of Australia’s GDP by 0.33–0.47 per cent in 2013 (Zander et al., 2015). Using Representative Concentration Pathway 6.0 (RCP 6.0) as input for climate modelling, it is estimated that up to 3.6 per cent and 4.3 per cent of daylight working hours were lost during 2015 in India and Cambodia, respectively, as a result of high temperatures (UNDP, 2016).
6.2 Labour market trendsIn 1995, approximately 1.5 billion people were employed in Asia and the Pacific, which represented over 60 per cent of the global employed population at the time. This share is projected to decrease in the coming years, falling to 56 per cent of the global employed population by 2030, even though the region will then have around 2 billion workers. The distribution of workers by main employment sectors (agriculture, construction, industry and services) for the years 1995 and 2030 reveals considerable diversity across subregions (see figure 6.2).
Asia and the Pacific is undergoing a structural transformation, which over time is substantially altering the composition of employment. In 1995, as much as half of the total employed population – around 760 million workers – were working in the agricultural sector, which is characterized by informal arrangements and vulnerable employment. This predominance of agriculture could be observed in Southern Asia (59 per cent) and South-East Asia (51 per cent); it was less pronounced in Eastern Asia (45 per cent) and, even less, in the Pacific Islands (17 per cent). However, with the exception of the Pacific Islands, these shares are projected to decrease across all subregions. Moreover, the overall share of agricultural employment in the region is expected to fall to as low as 27 per cent by 2030, representing 540 million agricultural workers. On the other hand, the share of the construction sector is expected to increase significantly, rising from 4 per cent in 1995 to over 10 per cent in 2030. Meanwhile, the service sector is set to become the dominant sector in the region, employing over 1 billion workers and accounting for 50 per cent of total employment in 2030. Although a sig-nificantly smaller proportion of the total employed population is expected to work in the agricultural sector in 2030 compared with 2015, a sizeable number of workers will nevertheless be affected by the increasing heat levels resulting from climate change, including not only those who will still be
Note: The maps show averages of daily maximum WBGT during the hottest month for 1995 and projections for 2030. The estimates for 1995 are based on a 30-year average for the period 1981–2010, and the projections for 2030 on a 30-year average for the period 2011–40 with adjustment of the value at the midpoint (2025) to give the projected level in 2030 for each country.
Source: ILO estimates based on the HadGEM2 and GFDL-ESM2M climate models (using as input the RCP2.6 climate change pathway, which envisages a global average temperature rise of 1.5°C by the end of the century).
Figure 6.1 Incidence of heat stress during the hottest month in Asia and the Pacific, 1995 and 2030 (projections)
1995 2030
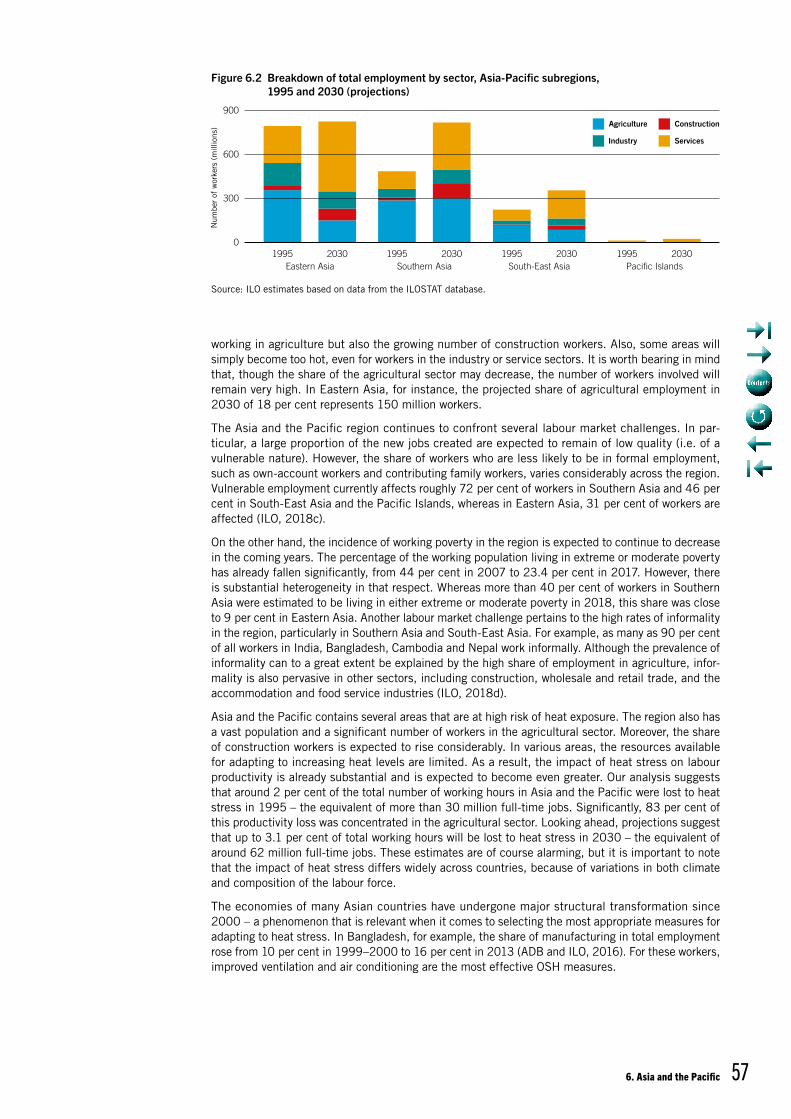
6. Asia and the Pacifc 57
working in agriculture but also the growing number of construction workers. Also, some areas will simply become too hot, even for workers in the industry or service sectors. It is worth bearing in mind that, though the share of the agricultural sector may decrease, the number of workers involved will remain very high. In Eastern Asia, for instance, the projected share of agricultural employment in 2030 of 18 per cent represents 150 million workers.
The Asia and the Pacific region continues to confront several labour market challenges. In par-ticular, a large proportion of the new jobs created are expected to remain of low quality (i.e. of a vulnerable nature). However, the share of workers who are less likely to be in formal employment, such as own-account workers and contributing family workers, varies considerably across the region. Vulnerable employment currently affects roughly 72 per cent of workers in Southern Asia and 46 per cent in South-East Asia and the Pacific Islands, whereas in Eastern Asia, 31 per cent of workers are affected (ILO, 2018c).
On the other hand, the incidence of working poverty in the region is expected to continue to decrease in the coming years. The percentage of the working population living in extreme or moderate poverty has already fallen significantly, from 44 per cent in 2007 to 23.4 per cent in 2017. However, there is substantial heterogeneity in that respect. Whereas more than 40 per cent of workers in Southern Asia were estimated to be living in either extreme or moderate poverty in 2018, this share was close to 9 per cent in Eastern Asia. Another labour market challenge pertains to the high rates of informality in the region, particularly in Southern Asia and South-East Asia. For example, as many as 90 per cent of all workers in India, Bangladesh, Cambodia and Nepal work informally. Although the prevalence of informality can to a great extent be explained by the high share of employment in agriculture, infor-mality is also pervasive in other sectors, including construction, wholesale and retail trade, and the accommodation and food service industries (ILO, 2018d).
Asia and the Pacific contains several areas that are at high risk of heat exposure. The region also has a vast population and a significant number of workers in the agricultural sector. Moreover, the share of construction workers is expected to rise considerably. In various areas, the resources available for adapting to increasing heat levels are limited. As a result, the impact of heat stress on labour productivity is already substantial and is expected to become even greater. Our analysis suggests that around 2 per cent of the total number of working hours in Asia and the Pacific were lost to heat stress in 1995 – the equivalent of more than 30 million full-time jobs. Significantly, 83 per cent of this productivity loss was concentrated in the agricultural sector. Looking ahead, projections suggest that up to 3.1 per cent of total working hours will be lost to heat stress in 2030 – the equivalent of around 62 million full-time jobs. These estimates are of course alarming, but it is important to note that the impact of heat stress differs widely across countries, because of variations in both climate and composition of the labour force.
The economies of many Asian countries have undergone major structural transformation since 2000 – a phenomenon that is relevant when it comes to selecting the most appropriate measures for adapting to heat stress. In Bangladesh, for example, the share of manufacturing in total employment rose from 10 per cent in 1999–2000 to 16 per cent in 2013 (ADB and ILO, 2016). For these workers, improved ventilation and air conditioning are the most effective OSH measures.
Source: ILO estimates based on data from the ILOSTAT database.
Figure 6.2 Breakdown of total employment by sector, Asia-Pacific subregions, 1995 and 2030 (projections)
Agriculture Construction
Industry Services
1995 2030Eastern Asia
1995 2030Southern Asia
1995 2030South-East Asia
1995 2030Pacific Islands
Num
ber
of w
orke
rs (
mill
ions
)
0
300
600
900
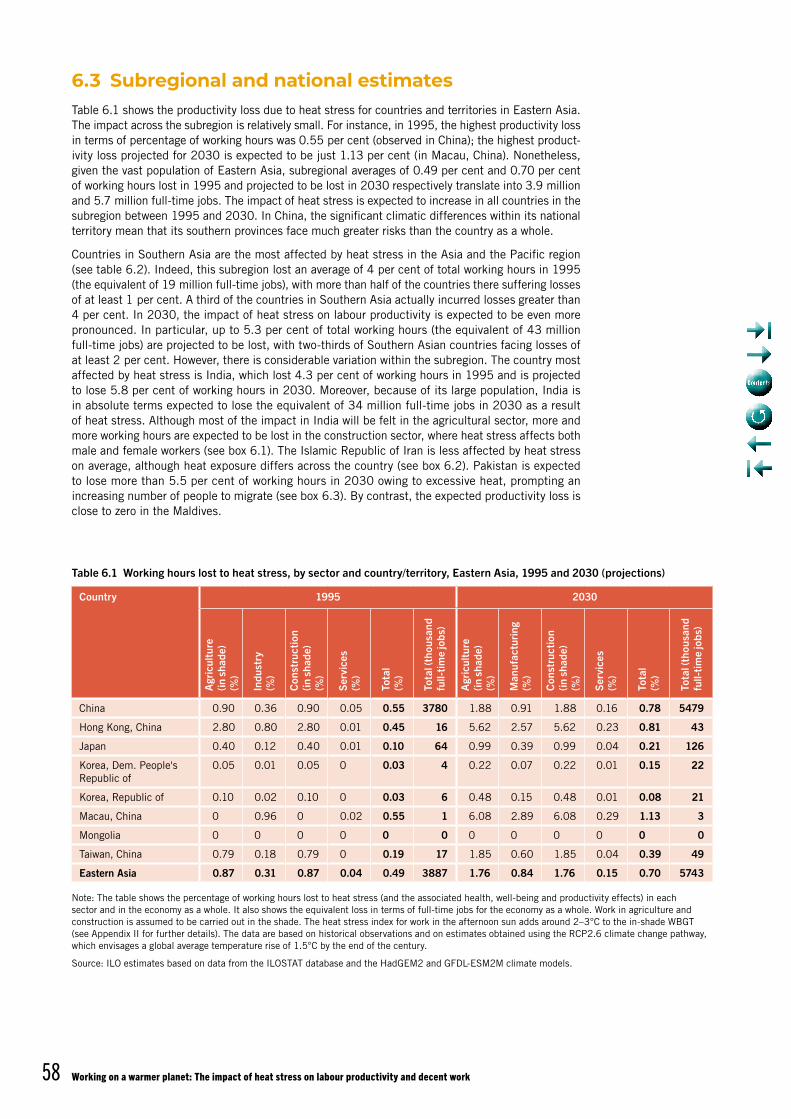
Working on a warmer planet: The impact of heat stress on labour productivity and decent work58
6.3 Subregional and national estimatesTable 6.1 shows the productivity loss due to heat stress for countries and territories in Eastern Asia. The impact across the subregion is relatively small. For instance, in 1995, the highest productivity loss in terms of percentage of working hours was 0.55 per cent (observed in China); the highest product-ivity loss projected for 2030 is expected to be just 1.13 per cent (in Macau, China). Nonetheless, given the vast population of Eastern Asia, subregional averages of 0.49 per cent and 0.70 per cent of working hours lost in 1995 and projected to be lost in 2030 respectively translate into 3.9 million and 5.7 million full-time jobs. The impact of heat stress is expected to increase in all countries in the subregion between 1995 and 2030. In China, the significant climatic differences within its national territory mean that its southern provinces face much greater risks than the country as a whole.
Countries in Southern Asia are the most affected by heat stress in the Asia and the Pacific region (see table 6.2). Indeed, this subregion lost an average of 4 per cent of total working hours in 1995 (the equivalent of 19 million full-time jobs), with more than half of the countries there suffering losses of at least 1 per cent. A third of the countries in Southern Asia actually incurred losses greater than 4 per cent. In 2030, the impact of heat stress on labour productivity is expected to be even more pronounced. In particular, up to 5.3 per cent of total working hours (the equivalent of 43 million full-time jobs) are projected to be lost, with two-thirds of Southern Asian countries facing losses of at least 2 per cent. However, there is considerable variation within the subregion. The country most affected by heat stress is India, which lost 4.3 per cent of working hours in 1995 and is projected to lose 5.8 per cent of working hours in 2030. Moreover, because of its large population, India is in absolute terms expected to lose the equivalent of 34 million full-time jobs in 2030 as a result of heat stress. Although most of the impact in India will be felt in the agricultural sector, more and more working hours are expected to be lost in the construction sector, where heat stress affects both male and female workers (see box 6.1). The Islamic Republic of Iran is less affected by heat stress on average, although heat exposure differs across the country (see box 6.2). Pakistan is expected to lose more than 5.5 per cent of working hours in 2030 owing to excessive heat, prompting an increasing number of people to migrate (see box 6.3). By contrast, the expected productivity loss is close to zero in the Maldives.
Table 6.1 Working hours lost to heat stress, by sector and country/territory, Eastern Asia, 1995 and 2030 (projections)
Country 1995 2030
Agr
icul
ture
(in
sha
de)
(%)
Indu
stry
(%
)
Con
stru
ctio
n (in
sha
de)
(%)
Serv
ices
(%
)
Tota
l (%
)
Tota
l (th
ousa
nd
full-
time
jobs
)
Agr
icul
ture
(in
sha
de)
(%)
Man
ufac
turin
g
(%)
Con
stru
ctio
n (in
sha
de)
(%)
Serv
ices
(%
)
Tota
l (%
)
Tota
l (th
ousa
nd
full-
time
jobs
)China 0.90 0.36 0.90 0.05 0.55 3780 1.88 0.91 1.88 0.16 0.78 5479
Hong Kong, China 2.80 0.80 2.80 0.01 0.45 16 5.62 2.57 5.62 0.23 0.81 43
Japan 0.40 0.12 0.40 0.01 0.10 64 0.99 0.39 0.99 0.04 0.21 126
Korea, Dem. People's Republic of
0.05 0.01 0.05 0 0.03 4 0.22 0.07 0.22 0.01 0.15 22
Korea, Republic of 0.10 0.02 0.10 0 0.03 6 0.48 0.15 0.48 0.01 0.08 21
Macau, China 0 0.96 0 0.02 0.55 1 6.08 2.89 6.08 0.29 1.13 3
Mongolia 0 0 0 0 0 0 0 0 0 0 0 0
Taiwan, China 0.79 0.18 0.79 0 0.19 17 1.85 0.60 1.85 0.04 0.39 49
Eastern Asia 0.87 0.31 0.87 0.04 0.49 3887 1.76 0.84 1.76 0.15 0.70 5743
Note: The table shows the percentage of working hours lost to heat stress (and the associated health, well-being and productivity effects) in each sector and in the economy as a whole. It also shows the equivalent loss in terms of full-time jobs for the economy as a whole. Work in agriculture and construction is assumed to be carried out in the shade. The heat stress index for work in the afternoon sun adds around 2–3°C to the in-shade WBGT (see Appendix II for further details). The data are based on historical observations and on estimates obtained using the RCP2.6 climate change pathway, which envisages a global average temperature rise of 1.5°C by the end of the century.
Source: ILO estimates based on data from the ILOSTAT database and the HadGEM2 and GFDL-ESM2M climate models.
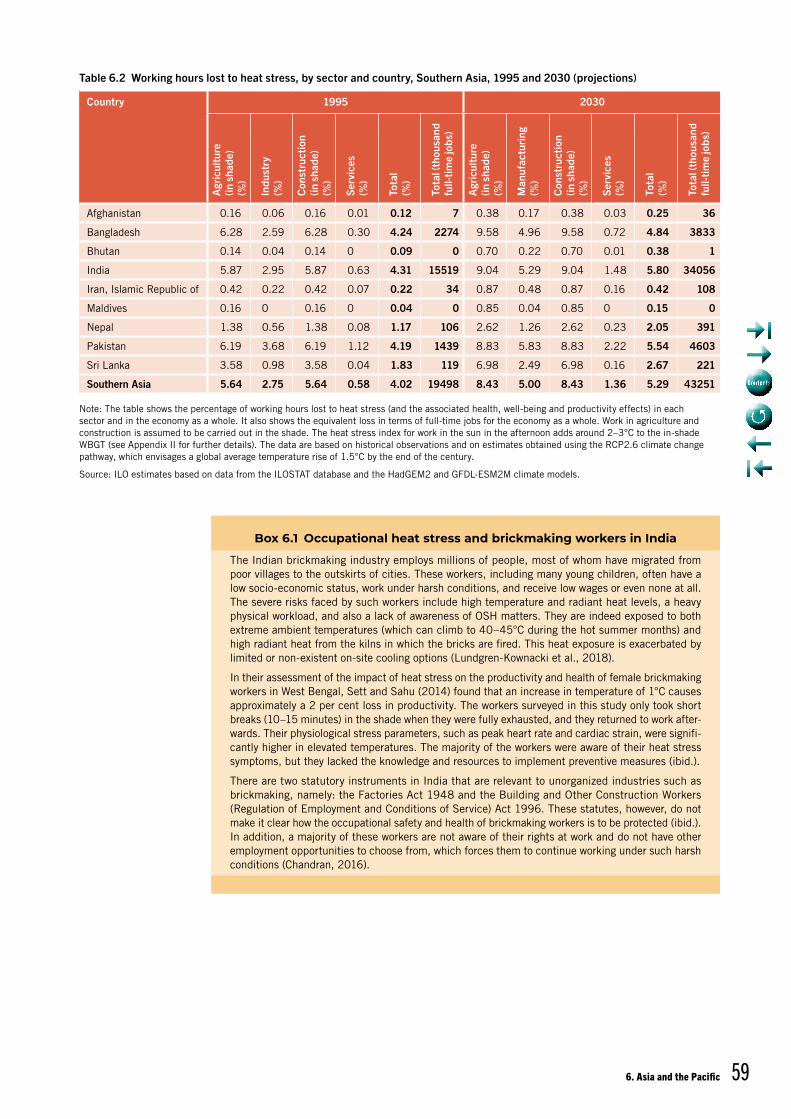
6. Asia and the Pacifc 59
Table 6.2 Working hours lost to heat stress, by sector and country, Southern Asia, 1995 and 2030 (projections)
Country 1995 2030
Agr
icul
ture
(in
sha
de)
(%)
Indu
stry
(%
)
Con
stru
ctio
n (in
sha
de)
(%)
Serv
ices
(%
)
Tota
l (%
)
Tota
l (th
ousa
nd
full-
time
jobs
)
Agr
icul
ture
(in
sha
de)
(%)
Man
ufac
turin
g
(%)
Con
stru
ctio
n (in
sha
de)
(%)
Serv
ices
(%
)
Tota
l (%
)
Tota
l (th
ousa
nd
full-
time
jobs
)
Afghanistan 0.16 0.06 0.16 0.01 0.12 7 0.38 0.17 0.38 0.03 0.25 36
Bangladesh 6.28 2.59 6.28 0.30 4.24 2274 9.58 4.96 9.58 0.72 4.84 3833
Bhutan 0.14 0.04 0.14 0 0.09 0 0.70 0.22 0.70 0.01 0.38 1
India 5.87 2.95 5.87 0.63 4.31 15519 9.04 5.29 9.04 1.48 5.80 34056
Iran, Islamic Republic of 0.42 0.22 0.42 0.07 0.22 34 0.87 0.48 0.87 0.16 0.42 108
Maldives 0.16 0 0.16 0 0.04 0 0.85 0.04 0.85 0 0.15 0
Nepal 1.38 0.56 1.38 0.08 1.17 106 2.62 1.26 2.62 0.23 2.05 391
Pakistan 6.19 3.68 6.19 1.12 4.19 1439 8.83 5.83 8.83 2.22 5.54 4603
Sri Lanka 3.58 0.98 3.58 0.04 1.83 119 6.98 2.49 6.98 0.16 2.67 221
Southern Asia 5.64 2.75 5.64 0.58 4.02 19498 8.43 5.00 8.43 1.36 5.29 43251
Note: The table shows the percentage of working hours lost to heat stress (and the associated health, well-being and productivity effects) in each sector and in the economy as a whole. It also shows the equivalent loss in terms of full-time jobs for the economy as a whole. Work in agriculture and construction is assumed to be carried out in the shade. The heat stress index for work in the sun in the afternoon adds around 2–3°C to the in-shade WBGT (see Appendix II for further details). The data are based on historical observations and on estimates obtained using the RCP2.6 climate change pathway, which envisages a global average temperature rise of 1.5°C by the end of the century.
Source: ILO estimates based on data from the ILOSTAT database and the HadGEM2 and GFDL-ESM2M climate models.
Box 6.1 Occupational heat stress and brickmaking workers in India
The Indian brickmaking industry employs millions of people, most of whom have migrated from poor villages to the outskirts of cities. These workers, including many young children, often have a low socio-economic status, work under harsh conditions, and receive low wages or even none at all. The severe risks faced by such workers include high temperature and radiant heat levels, a heavy physical workload, and also a lack of awareness of OSH matters. They are indeed exposed to both extreme ambient temperatures (which can climb to 40–45°C during the hot summer months) and high radiant heat from the kilns in which the bricks are fired. This heat exposure is exacerbated by limited or non-existent on-site cooling options (Lundgren-Kownacki et al., 2018).
In their assessment of the impact of heat stress on the productivity and health of female brickmaking workers in West Bengal, Sett and Sahu (2014) found that an increase in temperature of 1°C causes approximately a 2 per cent loss in productivity. The workers surveyed in this study only took short breaks (10–15 minutes) in the shade when they were fully exhausted, and they returned to work after-wards. Their physiological stress parameters, such as peak heart rate and cardiac strain, were signifi-cantly higher in elevated temperatures. The majority of the workers were aware of their heat stress symptoms, but they lacked the knowledge and resources to implement preventive measures (ibid.).
There are two statutory instruments in India that are relevant to unorganized industries such as brickmaking, namely: the Factories Act 1948 and the Building and Other Construction Workers (Regulation of Employment and Conditions of Service) Act 1996. These statutes, however, do not make it clear how the occupational safety and health of brickmaking workers is to be protected (ibid.). In addition, a majority of these workers are not aware of their rights at work and do not have other employment opportunities to choose from, which forces them to continue working under such harsh conditions (Chandran, 2016).
Working on a warmer planet: The impact of heat stress on labour productivity and decent work60
Box 6.2 The impact of outdoor occupational heat stress in the Islamic Republic of Iran
The Islamic Republic of Iran enjoys considerable climatic diversity, having 11 of the 13 climate zones into which the world’s climate is normally classified. A total of 82 per cent of the country’s territory comprises arid and semi-arid areas (Heidari et al., 2015). In these areas, heat exposure in outdoor workplaces is prevalent and a significant risk factor. The limited provision of health services by employers and local governments exacerbates the health impacts of heat exposure (Golbabaei et al., 2016).
A study assessing heat exposure across different regions of the Islamic Republic of Iran found that the WBGT exceeds threshold values in the entire country between noon and 3 p.m. in the summer, while the south, the south-west and large areas of the central regions experience heat stress situations in both spring and summer (Heidari et al., 2015). Another study, conducted among male farmers in Bukan, West Azerbaijan Province, identified a direct correlation between heat indices and the levels of physiological parameters such as blood pressure and skin and core body temperatures, implying that heat stress could have adverse impacts on farmers’ health and productivity (Zamanian et al., 2017). In a cross-sectional study, Golbabaei et al. (2016) found that concrete makers, porters, farmers, road-building workers and workers in the construction sector are more prone to heat exposure than workers employed in other outdoor occupations (e.g. waste site workers, street vendors, traffic officers and stonemasons). The adaptation measures used by these workers include scheduled short breaks in shaded areas, the frequent drinking of water, and the use of personal protective equipment such as sunglasses, hats and masks. However, the facilities available to outdoor workers to avoid heat are often inadequate.
No formal guidelines have been issued yet in the Islamic Republic of Iran to protect workers from the health effects of heat stress. Nor are there any regulations or legislative frameworks focusing on OSH for outdoor workers (ibid.). In view of these workers’ high exposure to heat stress during the midday hours in hot months, interventions by the Government, employers’ and workers’ organizations are necessary to raise awareness of the potential impact of heat stress and other heat-related illnesses, and also of suitable adaptive measures.
Box 6.3 Extreme heat and migration in Pakistan
Pakistan is among the ten countries most affected by climate change (Eckstein, Künzel and Schäfer, 2017). On account of its geographic location and limited financial and technical capacity for adap-tation, the country faces high risks arising from the increased frequency and intensity of extreme weather events, such as droughts, floods and rising temperatures, which result in heat and water stresses. In the summer of 2015, a severe heatwave with temperatures as high as 49°C hit southern Pakistan and caused up to 2,000 deaths from heatstroke and dehydration (Haider and Anis, 2015). The high death toll was the result of a combination of factors, including extreme temperatures and humidity, fasting during Ramadan, and electricity and water shortages.
Migration is an adaptation strategy to deal with climate change; it can help reduce livelihood vulner-abilities and provide more economic opportunities. Heat stress is one of the main climatic drivers of migration as people move to minimize the effects of rising temperatures on their health or to compen-sate for income lost as a result of their reduced labour productivity (IOM, 2017). In a unique 21-year longitudinal survey in rural Pakistan covering the period 1991–2012, Mueller, Gray and Kosec (2014) were able to demonstrate a statistically significant relationship between heat stress and long-term migration, but found no consistent links between high rainfall, flooding or moisture and migration. Heat stress was observed to have negative effects on both farm and non-farm incomes, thus forcing people to move. Such migration was more likely among poorer rural dwellers (ibid.). A case study conducted in Pakistan’s Punjab Province also found that people migrated mainly to improve their level of income and reduce their vulnerabilities with respect to heat stress (Umar and Saeed, 2018).
The increased risks of climate change combined with other socio-economic pressures have driven people to migrate both internally and internationally. However, people who decide or are forced to migrate because of push factors (i.e. negative environmental or economic pressures) and do not have access to regular migration channels may have a low socio-economic status, and migrating may make them even more vulnerable. Thus, Umar and Saeed (2018) found that, owing to their low level of edu-cation and skills, migrant workers have only been able to improve their livelihoods to a limited extent.
6. Asia and the Pacifc 61
Labour productivity in South-East Asia is also severely affected by heat stress (see table 6.3). Thus, rising temperatures caused the loss of 3.1 per cent of working hours in this subregion in 2015 (equiva-lent to 6.9 million full-time jobs) and are projected to lead to the loss of 3.7 per cent of working hours in 2030 (equivalent to 13 million full-time jobs). However, the impact varies considerably within the subregion. In 1995, some countries suffered high losses, such as Cambodia (7.5 per cent), Thailand (5.3 per cent) and Viet Nam (4.4 per cent). Projected temperature increases will put extra pressure on the most vulnerable workers in these countries (see boxes 6.4 and 6.5). Other countries experienced much smaller losses, including Timor-Leste (0.1 per cent) and Malaysia (1.1 per cent). In Indonesia, the estimated percentage of working hours lost in 1995 was 2.1 per cent; and this is projected to reach 3 per cent in 2030, which, because of the country’s sizeable population, translates into a productivity loss equivalent to 4 million full-time jobs. Labour productivity losses are expected to increase in all countries in South-East Asia, except Myanmar. The latter exception can be explained by the fact that Myanmar is undergoing rapid structural transformation from agriculture to services: fewer agricultural workers are therefore being exposed to the risks associated with rising temperatures.
Box 6.4 Low-income outdoor workers and heat stress risks in Da Nang, Viet Nam
The rise in temperatures caused by climate change increases health risks at workplaces, especially for low-income, informal and migrant workers who have limited resources to prevent or cope with exposure to extreme heat. In Da Nang, the fifth most populated city in Viet Nam, heat stress and rising temperatures adversely affect the living and working conditions of low-income outdoor workers (Dao et al., 2013). Poverty is one of the key drivers of heat stress vulnerability, because workers have to prioritize earning income over protecting themselves against health risks at work. Poverty also limits workers’ access to social protection and health-care services, which further increases their vulnerability (ibid.).
Da Nang has a tropical monsoon climate with two seasons: a wet season from September to March and a dry season from April to August, with an average temperature of 33.5°C and high level of humidity during the hottest months of the year. The Vietnamese Ministry of Health has issued regu-lations specifying that during the hot season and when humidity is equal to or below 80 per cent, temperatures in a work environment should not exceed 34°C, 32°C and 30°C for light, medium and heavy work, respectively (MOH, 2002). These thresholds must be lowered when humidity exceeds 80 per cent because heat stress conditions can then rapidly develop and endanger workers’ health (Opitz-Stapleton, 2014). The abovementioned regulations are, however, rarely enforced in the informal economy, which is where the majority of outdoor and vulnerable workers operate (e.g. street ven-dors and casual workers). Outdoor workers working for government-owned or big companies have been found to be less exposed to heat stress risks than those working for small and medium-sized enterprises; they are also less exposed than casual outdoor workers (Dao et al., 2013). The adap-tive measures introduced by employers in workplaces are still limited in number and insufficiently effective (ibid.).
In an assessment of historical and projected heat stress levels in Da Nang (using temperature, humidity and workload to construct heat stress indices), Opitz-Stapleton (2014) found that over the period 1970–2011 there were on average 210 days a year on which the heat index was equal to or above the Ministry of Health’s threshold of 34°C for light labour, and that this number of especially hot days increased by approximately five days per decade. On the basis of projected increases in ambient temperature, the study came to the conclusion that, by 2050, the median heat index during the day is likely to be 40°C during May–September and that it will never fall below 35°C in any season. In addition to heat stress induced by climate change, the urban heat-island effect resulting from population growth and urbanization will also increase workers’ occupational risks and vulnerability. This effect can cause temperatures in the urban core to be up to 10°C higher than those in the surrounding rural areas, which makes low-income outdoor workers in Da Nang even more vulnerable to heat-related risks (ibid.).
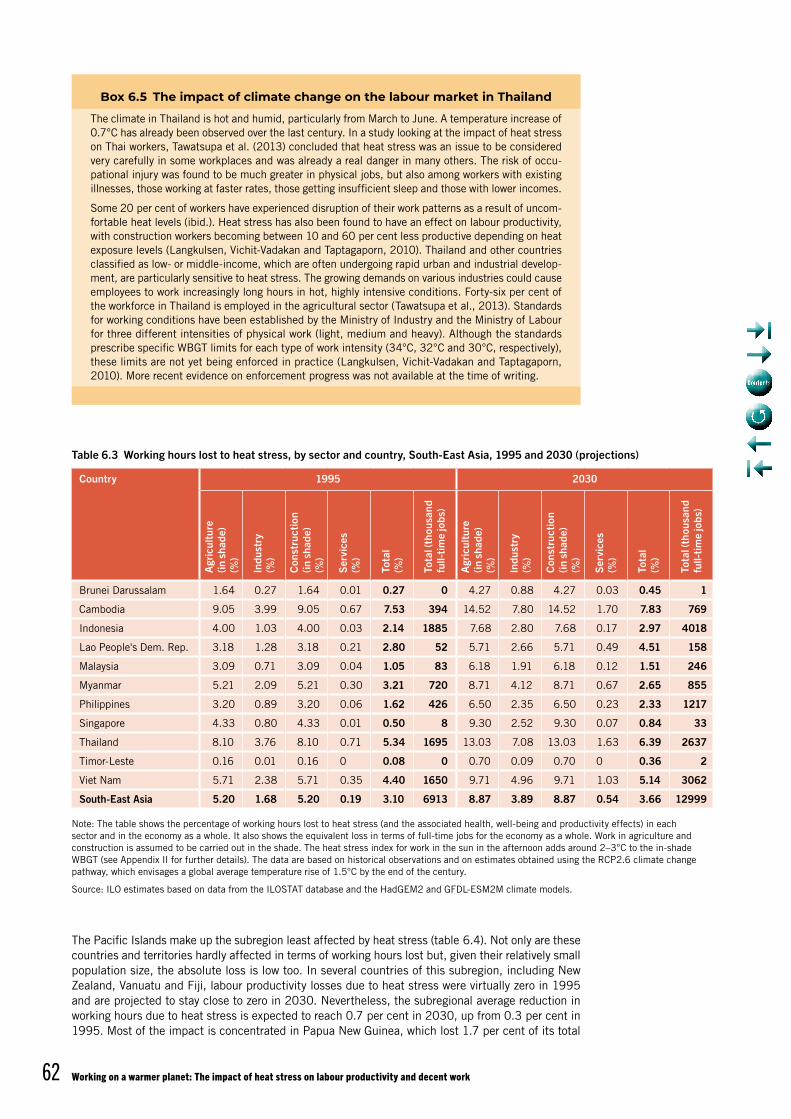
Working on a warmer planet: The impact of heat stress on labour productivity and decent work62
The Pacific Islands make up the subregion least affected by heat stress (table 6.4). Not only are these countries and territories hardly affected in terms of working hours lost but, given their relatively small population size, the absolute loss is low too. In several countries of this subregion, including New Zealand, Vanuatu and Fiji, labour productivity losses due to heat stress were virtually zero in 1995 and are projected to stay close to zero in 2030. Nevertheless, the subregional average reduction in working hours due to heat stress is expected to reach 0.7 per cent in 2030, up from 0.3 per cent in 1995. Most of the impact is concentrated in Papua New Guinea, which lost 1.7 per cent of its total
Box 6.5 The impact of climate change on the labour market in Thailand
The climate in Thailand is hot and humid, particularly from March to June. A temperature increase of 0.7°C has already been observed over the last century. In a study looking at the impact of heat stress on Thai workers, Tawatsupa et al. (2013) concluded that heat stress was an issue to be considered very carefully in some workplaces and was already a real danger in many others. The risk of occu-pational injury was found to be much greater in physical jobs, but also among workers with existing illnesses, those working at faster rates, those getting insufficient sleep and those with lower incomes.
Some 20 per cent of workers have experienced disruption of their work patterns as a result of uncom-fortable heat levels (ibid.). Heat stress has also been found to have an effect on labour productivity, with construction workers becoming between 10 and 60 per cent less productive depending on heat exposure levels (Langkulsen, Vichit-Vadakan and Taptagaporn, 2010). Thailand and other countries classified as low- or middle-income, which are often undergoing rapid urban and industrial develop-ment, are particularly sensitive to heat stress. The growing demands on various industries could cause employees to work increasingly long hours in hot, highly intensive conditions. Forty-six per cent of the workforce in Thailand is employed in the agricultural sector (Tawatsupa et al., 2013). Standards for working conditions have been established by the Ministry of Industry and the Ministry of Labour for three different intensities of physical work (light, medium and heavy). Although the standards prescribe specific WBGT limits for each type of work intensity (34°C, 32°C and 30°C, respectively), these limits are not yet being enforced in practice (Langkulsen, Vichit-Vadakan and Taptagaporn, 2010). More recent evidence on enforcement progress was not available at the time of writing.
Table 6.3 Working hours lost to heat stress, by sector and country, South-East Asia, 1995 and 2030 (projections)
Country 1995 2030
Agr
icul
ture
(in
sha
de)
(%)
Indu
stry
(%
)
Con
stru
ctio
n (in
sha
de)
(%)
Serv
ices
(%
)
Tota
l (%
)
Tota
l (th
ousa
nd
full-
time
jobs
)
Agr
icul
ture
(in
sha
de)
(%)
Indu
stry
(%
)
Con
stru
ctio
n (in
sha
de)
(%)
Serv
ices
(%
)
Tota
l (%
)
Tota
l (th
ousa
nd
full-
time
jobs
)
Brunei Darussalam 1.64 0.27 1.64 0.01 0.27 0 4.27 0.88 4.27 0.03 0.45 1
Cambodia 9.05 3.99 9.05 0.67 7.53 394 14.52 7.80 14.52 1.70 7.83 769
Indonesia 4.00 1.03 4.00 0.03 2.14 1885 7.68 2.80 7.68 0.17 2.97 4018
Lao People's Dem. Rep. 3.18 1.28 3.18 0.21 2.80 52 5.71 2.66 5.71 0.49 4.51 158
Malaysia 3.09 0.71 3.09 0.04 1.05 83 6.18 1.91 6.18 0.12 1.51 246
Myanmar 5.21 2.09 5.21 0.30 3.21 720 8.71 4.12 8.71 0.67 2.65 855
Philippines 3.20 0.89 3.20 0.06 1.62 426 6.50 2.35 6.50 0.23 2.33 1217
Singapore 4.33 0.80 4.33 0.01 0.50 8 9.30 2.52 9.30 0.07 0.84 33
Thailand 8.10 3.76 8.10 0.71 5.34 1695 13.03 7.08 13.03 1.63 6.39 2637
Timor-Leste 0.16 0.01 0.16 0 0.08 0 0.70 0.09 0.70 0 0.36 2
Viet Nam 5.71 2.38 5.71 0.35 4.40 1650 9.71 4.96 9.71 1.03 5.14 3062
South-East Asia 5.20 1.68 5.20 0.19 3.10 6913 8.87 3.89 8.87 0.54 3.66 12999
Note: The table shows the percentage of working hours lost to heat stress (and the associated health, well-being and productivity effects) in each sector and in the economy as a whole. It also shows the equivalent loss in terms of full-time jobs for the economy as a whole. Work in agriculture and construction is assumed to be carried out in the shade. The heat stress index for work in the sun in the afternoon adds around 2–3°C to the in-shade WBGT (see Appendix II for further details). The data are based on historical observations and on estimates obtained using the RCP2.6 climate change pathway, which envisages a global average temperature rise of 1.5°C by the end of the century.
Source: ILO estimates based on data from the ILOSTAT database and the HadGEM2 and GFDL-ESM2M climate models.
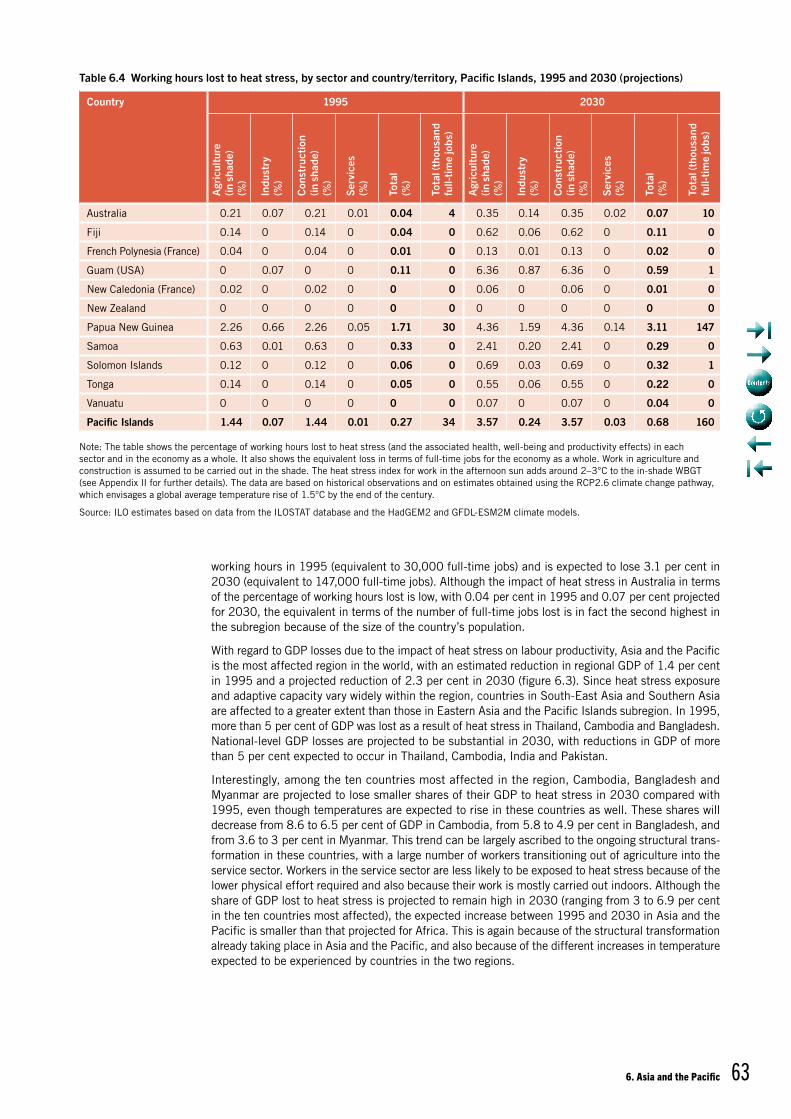
6. Asia and the Pacifc 63
working hours in 1995 (equivalent to 30,000 full-time jobs) and is expected to lose 3.1 per cent in 2030 (equivalent to 147,000 full-time jobs). Although the impact of heat stress in Australia in terms of the percentage of working hours lost is low, with 0.04 per cent in 1995 and 0.07 per cent projected for 2030, the equivalent in terms of the number of full-time jobs lost is in fact the second highest in the subregion because of the size of the country’s population.
With regard to GDP losses due to the impact of heat stress on labour productivity, Asia and the Pacific is the most affected region in the world, with an estimated reduction in regional GDP of 1.4 per cent in 1995 and a projected reduction of 2.3 per cent in 2030 (figure 6.3). Since heat stress exposure and adaptive capacity vary widely within the region, countries in South-East Asia and Southern Asia are affected to a greater extent than those in Eastern Asia and the Pacific Islands subregion. In 1995, more than 5 per cent of GDP was lost as a result of heat stress in Thailand, Cambodia and Bangladesh. National-level GDP losses are projected to be substantial in 2030, with reductions in GDP of more than 5 per cent expected to occur in Thailand, Cambodia, India and Pakistan.
Interestingly, among the ten countries most affected in the region, Cambodia, Bangladesh and Myanmar are projected to lose smaller shares of their GDP to heat stress in 2030 compared with 1995, even though temperatures are expected to rise in these countries as well. These shares will decrease from 8.6 to 6.5 per cent of GDP in Cambodia, from 5.8 to 4.9 per cent in Bangladesh, and from 3.6 to 3 per cent in Myanmar. This trend can be largely ascribed to the ongoing structural trans-formation in these countries, with a large number of workers transitioning out of agriculture into the service sector. Workers in the service sector are less likely to be exposed to heat stress because of the lower physical effort required and also because their work is mostly carried out indoors. Although the share of GDP lost to heat stress is projected to remain high in 2030 (ranging from 3 to 6.9 per cent in the ten countries most affected), the expected increase between 1995 and 2030 in Asia and the Pacific is smaller than that projected for Africa. This is again because of the structural transformation already taking place in Asia and the Pacific, and also because of the different increases in temperature expected to be experienced by countries in the two regions.
Table 6.4 Working hours lost to heat stress, by sector and country/territory, Pacific Islands, 1995 and 2030 (projections)
Country 1995 2030
Agr
icul
ture
(in
sha
de)
(%)
Indu
stry
(%
)
Con
stru
ctio
n (in
sha
de)
(%)
Serv
ices
(%
)
Tota
l (%
)
Tota
l (th
ousa
nd
full-
time
jobs
)
Agr
icul
ture
(in
sha
de)
(%)
Indu
stry
(%
)
Con
stru
ctio
n (in
sha
de)
(%)
Serv
ices
(%
)
Tota
l (%
)
Tota
l (th
ousa
nd
full-
time
jobs
)
Australia 0.21 0.07 0.21 0.01 0.04 4 0.35 0.14 0.35 0.02 0.07 10
Fiji 0.14 0 0.14 0 0.04 0 0.62 0.06 0.62 0 0.11 0
French Polynesia (France) 0.04 0 0.04 0 0.01 0 0.13 0.01 0.13 0 0.02 0
Guam (USA) 0 0.07 0 0 0.11 0 6.36 0.87 6.36 0 0.59 1
New Caledonia (France) 0.02 0 0.02 0 0 0 0.06 0 0.06 0 0.01 0
New Zealand 0 0 0 0 0 0 0 0 0 0 0 0
Papua New Guinea 2.26 0.66 2.26 0.05 1.71 30 4.36 1.59 4.36 0.14 3.11 147
Samoa 0.63 0.01 0.63 0 0.33 0 2.41 0.20 2.41 0 0.29 0
Solomon Islands 0.12 0 0.12 0 0.06 0 0.69 0.03 0.69 0 0.32 1
Tonga 0.14 0 0.14 0 0.05 0 0.55 0.06 0.55 0 0.22 0
Vanuatu 0 0 0 0 0 0 0.07 0 0.07 0 0.04 0
Pacific Islands 1.44 0.07 1.44 0.01 0.27 34 3.57 0.24 3.57 0.03 0.68 160
Note: The table shows the percentage of working hours lost to heat stress (and the associated health, well-being and productivity effects) in each sector and in the economy as a whole. It also shows the equivalent loss in terms of full-time jobs for the economy as a whole. Work in agriculture and construction is assumed to be carried out in the shade. The heat stress index for work in the afternoon sun adds around 2–3°C to the in-shade WBGT (see Appendix II for further details). The data are based on historical observations and on estimates obtained using the RCP2.6 climate change pathway, which envisages a global average temperature rise of 1.5°C by the end of the century.
Source: ILO estimates based on data from the ILOSTAT database and the HadGEM2 and GFDL-ESM2M climate models.
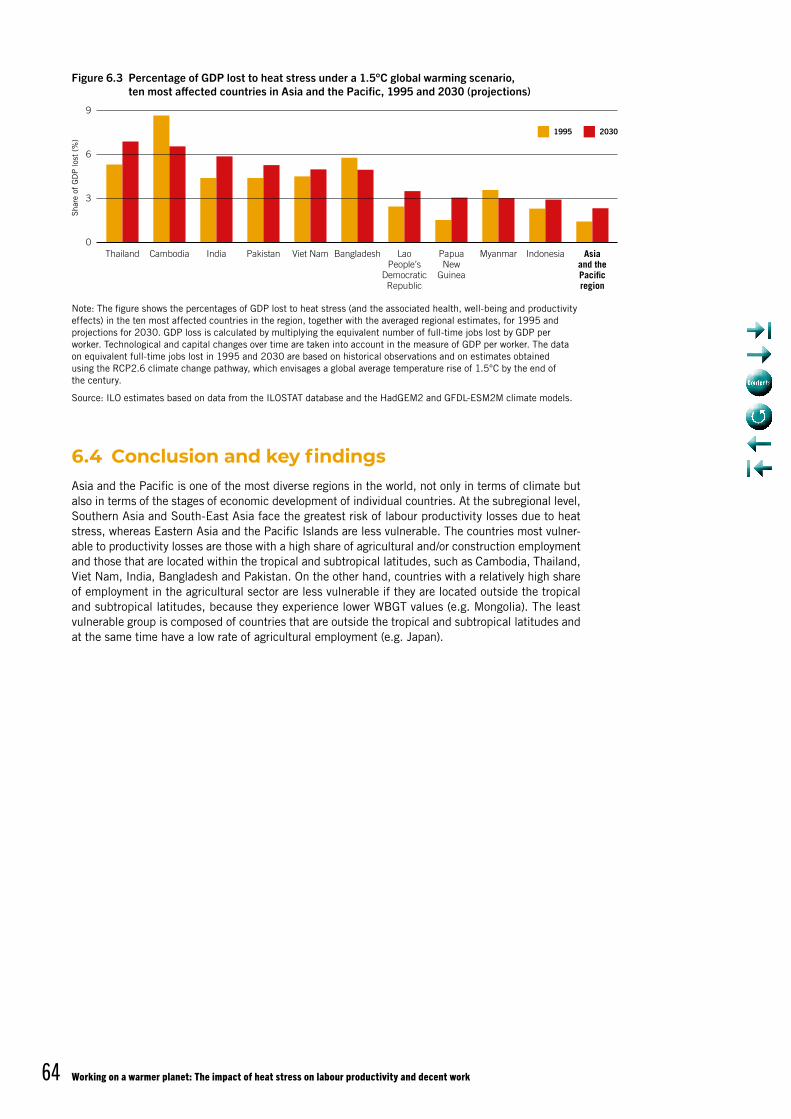
Working on a warmer planet: The impact of heat stress on labour productivity and decent work64
6.4 Conclusion and key findingsAsia and the Pacific is one of the most diverse regions in the world, not only in terms of climate but also in terms of the stages of economic development of individual countries. At the subregional level, Southern Asia and South-East Asia face the greatest risk of labour productivity losses due to heat stress, whereas Eastern Asia and the Pacific Islands are less vulnerable. The countries most vulner-able to productivity losses are those with a high share of agricultural and/or construction employment and those that are located within the tropical and subtropical latitudes, such as Cambodia, Thailand, Viet Nam, India, Bangladesh and Pakistan. On the other hand, countries with a relatively high share of employment in the agricultural sector are less vulnerable if they are located outside the tropical and subtropical latitudes, because they experience lower WBGT values (e.g. Mongolia). The least vulnerable group is composed of countries that are outside the tropical and subtropical latitudes and at the same time have a low rate of agricultural employment (e.g. Japan).
Note: The figure shows the percentages of GDP lost to heat stress (and the associated health, well-being and productivity effects) in the ten most affected countries in the region, together with the averaged regional estimates, for 1995 and projections for 2030. GDP loss is calculated by multiplying the equivalent number of full-time jobs lost by GDP per worker. Technological and capital changes over time are taken into account in the measure of GDP per worker. The data on equivalent full-time jobs lost in 1995 and 2030 are based on historical observations and on estimates obtained using the RCP2.6 climate change pathway, which envisages a global average temperature rise of 1.5°C by the end of the century.
Source: ILO estimates based on data from the ILOSTAT database and the HadGEM2 and GFDL-ESM2M climate models.
Figure 6.3 Percentage of GDP lost to heat stress under a 1.5°C global warming scenario, ten most affected countries in Asia and the Pacific, 1995 and 2030 (projections)
20301995
Thailand Cambodia India Pakistan Viet Nam Bangladesh LaoPeople’s
DemocraticRepublic
PapuaNew
Guinea
Myanmar Indonesia Asiaand thePacificregion
9
Sha
re o
f G
DP
lost
(%
)
0
3
6
65
7.1 Current and projected heat levelsThe Europe and Central Asia1 region has a population of approximately 925 million and a land area of 27 million km2. Although small in comparison with other regions such as Asia and the Pacific and Africa, three of its subregions – Northern, Southern and Western Europe – taken together have the second-highest population density in the world. This amplifies the effect of local weather conditions in terms of the number of people affected. Nevertheless, thanks to its low exposure and high adaptive capacity, the region is relatively less vulnerable to heat stress.
Although a significant proportion of Europe lies in the northern latitudes, the relatively warm seas that border the continent give most of Central and Western Europe a temperate climate, with mild winters and summers. The winds from the west bring precipitation throughout most of the year. Partly on account of the North Atlantic Oscillation, the strength of these winds varies considerably. In the Mediterranean area, for instance, the summer months are usually hot and dry, with almost all rainfall occurring in the winter. By contrast, from central Poland eastwards, the moderating effect of the seas is reduced, which results in drier conditions accompanied by a greater variation of annual temperatures. Meanwhile, north-western Europe is characterized by comparatively mild winters, with high precipitation along the Scottish and Norwegian coasts and mountains.
The average temperature in Europe has increased continuously since the turn of the twentieth century. For instance, the average temperature from 2002 to 2011 was 1.3°C higher than the average for the period between 1850 and 1899 (IPCC, 2014b). However, the spatial distribution of temperatures is heterogeneous: regionally and seasonally, there are different rates of warming, with high-latitude areas in Northern Europe being the most affected because of polar amplification. Moreover, since the 1980s warming has been most pronounced across Scandinavia, especially in the winter, while increased warming over the Iberian Peninsula has been observed mostly in the summer (EEA, 2012). Also, since 1950, high-temperature extremes – including hot days, tropical nights, and heatwaves – have become more frequent, whereas the opposite is true of low-temperature extremes. Looking forward, climate models indicate that the climate of the twenty-first century will be warmer all over Europe, with the strongest warming projected to occur in Southern Europe in summer and in Northern Europe in winter (Kjellström et al., 2011). As for climate extremes, it is expected that there will be a marked increase in the incidence of heatwaves, droughts, and heavy precipitation events (Beniston et al., 2007).
Central Asia, on the other hand, is predominantly characterized by arid and semi-arid climatic con-ditions. It comprises the Turan Lowland and is bounded by the Middle Asian mountain ranges on its southern and south-eastern edges. The deserts and semi-deserts of Central Asia have a continental climate. Summers in Central Asia are hot, whereas winters are humid and relatively warm in the south and cold with severe frosts in the north. According to the IPCC (2014b), annual and winter temper-atures in the subregion have been rising steadily since the beginning of the twentieth century. The incidence of climate-induced diseases and heat stress has increased accordingly. Projections suggest that average temperatures in arid Central Asia will increase by a further 1°C by 2030.
Figure 7.1 shows the average heat stress levels in Europe and Central Asia for 1995 and projections for 2030, based on WBGT values. The region as a whole exhibits average heat levels in the hottest month that are likely to have only a negligible effect on labour productivity. However, some subregions are more exposed than others, notably Central and Western Asia. In addition, exceptionally intense heatwaves in the region can cause major problems for the labour force.
1. In this report, the six subregions of Europe and Central Asia are Eastern Europe (countries listed in table 7.1), Southern Europe (table 7.2), Western Europe, Northern Europe, Central Asia (7.3), and Western Asia (table 7.4).
7. Europe and Central Asia
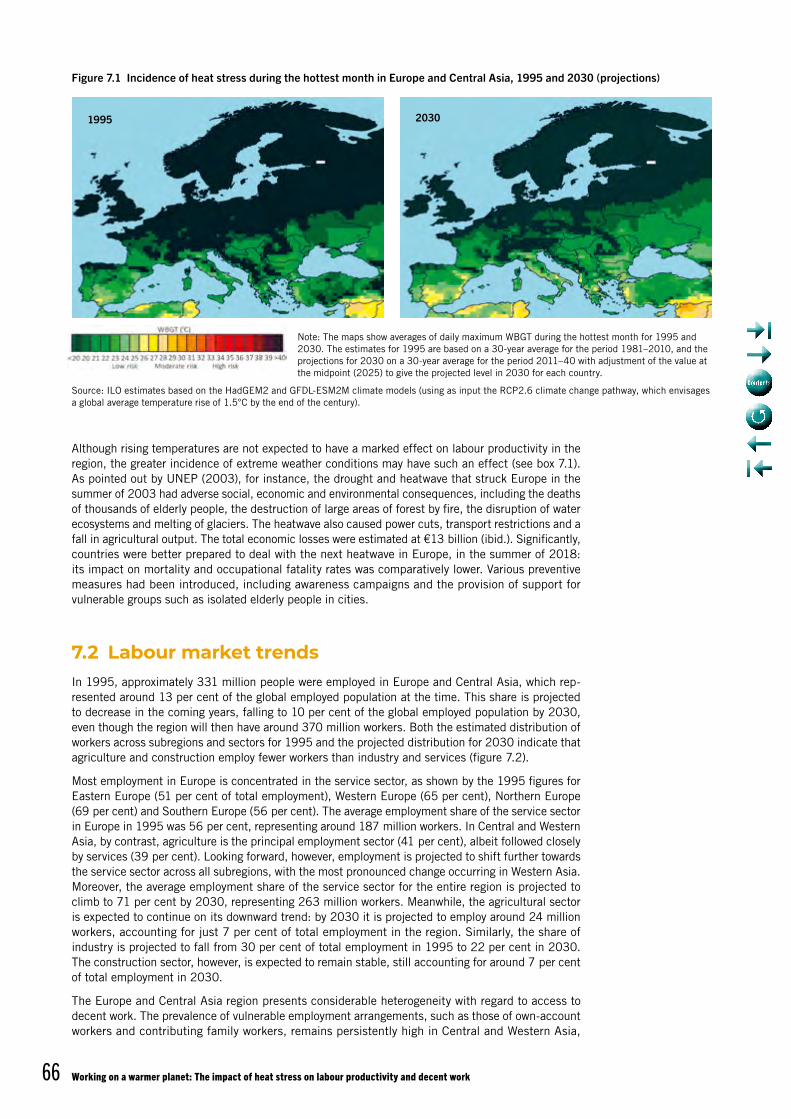
Working on a warmer planet: The impact of heat stress on labour productivity and decent work66
Although rising temperatures are not expected to have a marked effect on labour productivity in the region, the greater incidence of extreme weather conditions may have such an effect (see box 7.1). As pointed out by UNEP (2003), for instance, the drought and heatwave that struck Europe in the summer of 2003 had adverse social, economic and environmental consequences, including the deaths of thousands of elderly people, the destruction of large areas of forest by fire, the disruption of water ecosystems and melting of glaciers. The heatwave also caused power cuts, transport restrictions and a fall in agricultural output. The total economic losses were estimated at €13 billion (ibid.). Significantly, countries were better prepared to deal with the next heatwave in Europe, in the summer of 2018: its impact on mortality and occupational fatality rates was comparatively lower. Various preventive measures had been introduced, including awareness campaigns and the provision of support for vulnerable groups such as isolated elderly people in cities.
7.2 Labour market trendsIn 1995, approximately 331 million people were employed in Europe and Central Asia, which rep-resented around 13 per cent of the global employed population at the time. This share is projected to decrease in the coming years, falling to 10 per cent of the global employed population by 2030, even though the region will then have around 370 million workers. Both the estimated distribution of workers across subregions and sectors for 1995 and the projected distribution for 2030 indicate that agriculture and construction employ fewer workers than industry and services (figure 7.2).
Most employment in Europe is concentrated in the service sector, as shown by the 1995 figures for Eastern Europe (51 per cent of total employment), Western Europe (65 per cent), Northern Europe (69 per cent) and Southern Europe (56 per cent). The average employment share of the service sector in Europe in 1995 was 56 per cent, representing around 187 million workers. In Central and Western Asia, by contrast, agriculture is the principal employment sector (41 per cent), albeit followed closely by services (39 per cent). Looking forward, however, employment is projected to shift further towards the service sector across all subregions, with the most pronounced change occurring in Western Asia. Moreover, the average employment share of the service sector for the entire region is projected to climb to 71 per cent by 2030, representing 263 million workers. Meanwhile, the agricultural sector is expected to continue on its downward trend: by 2030 it is projected to employ around 24 million workers, accounting for just 7 per cent of total employment in the region. Similarly, the share of industry is projected to fall from 30 per cent of total employment in 1995 to 22 per cent in 2030. The construction sector, however, is expected to remain stable, still accounting for around 7 per cent of total employment in 2030.
The Europe and Central Asia region presents considerable heterogeneity with regard to access to decent work. The prevalence of vulnerable employment arrangements, such as those of own-account workers and contributing family workers, remains persistently high in Central and Western Asia,
Note: The maps show averages of daily maximum WBGT during the hottest month for 1995 and 2030. The estimates for 1995 are based on a 30-year average for the period 1981–2010, and the projections for 2030 on a 30-year average for the period 2011–40 with adjustment of the value at the midpoint (2025) to give the projected level in 2030 for each country.
Source: ILO estimates based on the HadGEM2 and GFDL-ESM2M climate models (using as input the RCP2.6 climate change pathway, which envisages a global average temperature rise of 1.5°C by the end of the century).
Figure 7.1 Incidence of heat stress during the hottest month in Europe and Central Asia, 1995 and 2030 (projections)
1995 2030
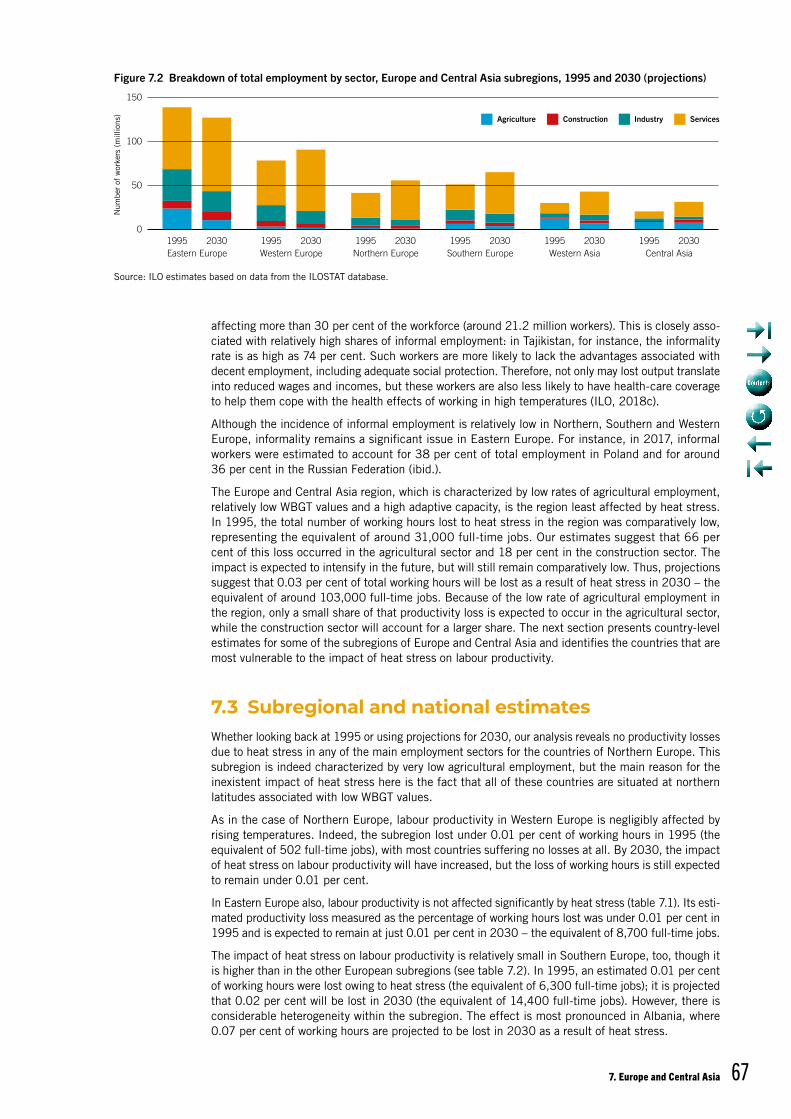
7. Europe and Central Asia 67
affecting more than 30 per cent of the workforce (around 21.2 million workers). This is closely asso-ciated with relatively high shares of informal employment: in Tajikistan, for instance, the informality rate is as high as 74 per cent. Such workers are more likely to lack the advantages associated with decent employment, including adequate social protection. Therefore, not only may lost output translate into reduced wages and incomes, but these workers are also less likely to have health-care coverage to help them cope with the health effects of working in high temperatures (ILO, 2018c).
Although the incidence of informal employment is relatively low in Northern, Southern and Western Europe, informality remains a significant issue in Eastern Europe. For instance, in 2017, informal workers were estimated to account for 38 per cent of total employment in Poland and for around 36 per cent in the Russian Federation (ibid.).
The Europe and Central Asia region, which is characterized by low rates of agricultural employment, relatively low WBGT values and a high adaptive capacity, is the region least affected by heat stress. In 1995, the total number of working hours lost to heat stress in the region was comparatively low, representing the equivalent of around 31,000 full-time jobs. Our estimates suggest that 66 per cent of this loss occurred in the agricultural sector and 18 per cent in the construction sector. The impact is expected to intensify in the future, but will still remain comparatively low. Thus, projections suggest that 0.03 per cent of total working hours will be lost as a result of heat stress in 2030 – the equivalent of around 103,000 full-time jobs. Because of the low rate of agricultural employment in the region, only a small share of that productivity loss is expected to occur in the agricultural sector, while the construction sector will account for a larger share. The next section presents country-level estimates for some of the subregions of Europe and Central Asia and identifies the countries that are most vulnerable to the impact of heat stress on labour productivity.
7.3 Subregional and national estimatesWhether looking back at 1995 or using projections for 2030, our analysis reveals no productivity losses due to heat stress in any of the main employment sectors for the countries of Northern Europe. This subregion is indeed characterized by very low agricultural employment, but the main reason for the inexistent impact of heat stress here is the fact that all of these countries are situated at northern latitudes associated with low WBGT values.
As in the case of Northern Europe, labour productivity in Western Europe is negligibly affected by rising temperatures. Indeed, the subregion lost under 0.01 per cent of working hours in 1995 (the equivalent of 502 full-time jobs), with most countries suffering no losses at all. By 2030, the impact of heat stress on labour productivity will have increased, but the loss of working hours is still expected to remain under 0.01 per cent.
In Eastern Europe also, labour productivity is not affected significantly by heat stress (table 7.1). Its esti-mated productivity loss measured as the percentage of working hours lost was under 0.01 per cent in 1995 and is expected to remain at just 0.01 per cent in 2030 – the equivalent of 8,700 full-time jobs.
The impact of heat stress on labour productivity is relatively small in Southern Europe, too, though it is higher than in the other European subregions (see table 7.2). In 1995, an estimated 0.01 per cent of working hours were lost owing to heat stress (the equivalent of 6,300 full-time jobs); it is projected that 0.02 per cent will be lost in 2030 (the equivalent of 14,400 full-time jobs). However, there is considerable heterogeneity within the subregion. The effect is most pronounced in Albania, where 0.07 per cent of working hours are projected to be lost in 2030 as a result of heat stress.
Source: ILO estimates based on data from the ILOSTAT database.
Figure 7.2 Breakdown of total employment by sector, Europe and Central Asia subregions, 1995 and 2030 (projections)
Agriculture Construction Industry Services
1995 2030 1995 2030 1995 2030 1995 2030 1995 2030Western Europe Northern Europe
1995 2030Eastern Europe Southern Europe Western Asia Central Asia
150
0
Num
ber
of w
orke
rs (
mill
ions
)
50
100
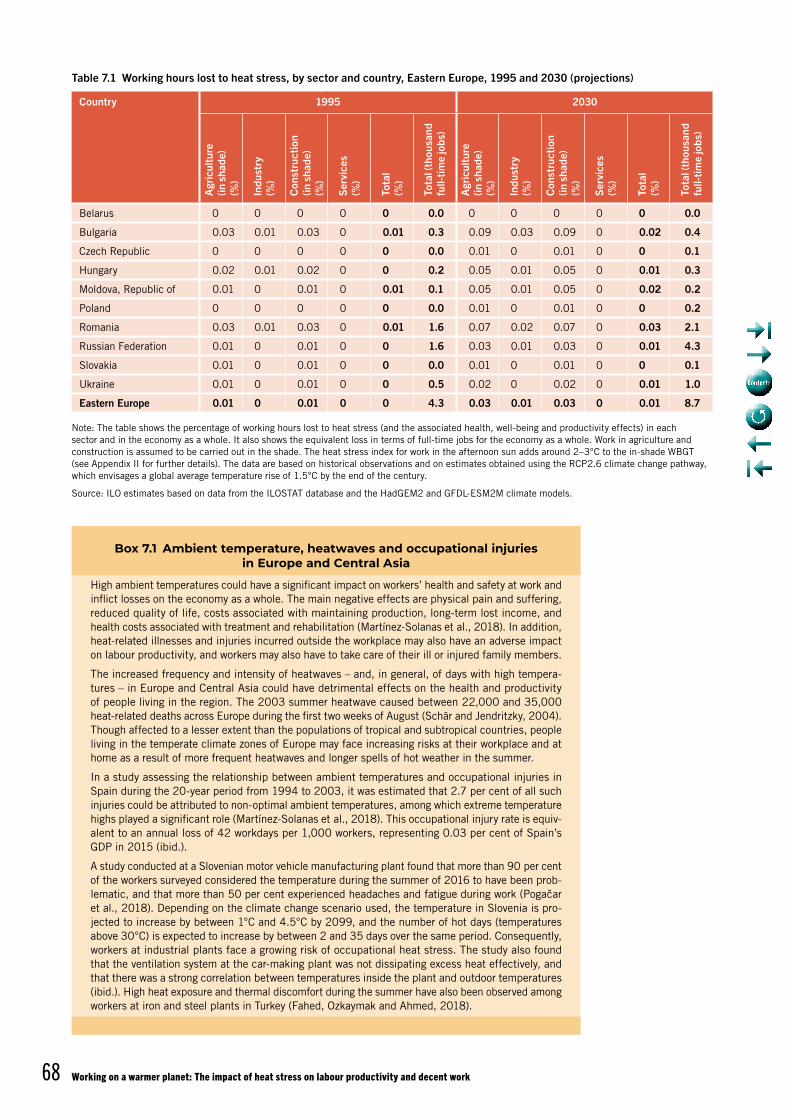
Working on a warmer planet: The impact of heat stress on labour productivity and decent work68
Table 7.1 Working hours lost to heat stress, by sector and country, Eastern Europe, 1995 and 2030 (projections)
Country 1995 2030
Agr
icul
ture
(in
sha
de)
(%)
Indu
stry
(%
)
Con
stru
ctio
n (in
sha
de)
(%)
Serv
ices
(%
)
Tota
l (%
)
Tota
l (th
ousa
nd
full-
time
jobs
)
Agr
icul
ture
(in
sha
de)
(%)
Indu
stry
(%
)
Con
stru
ctio
n (in
sha
de)
(%)
Serv
ices
(%
)
Tota
l (%
)
Tota
l (th
ousa
nd
full-
time
jobs
)
Belarus 0 0 0 0 0 0.0 0 0 0 0 0 0.0
Bulgaria 0.03 0.01 0.03 0 0.01 0.3 0.09 0.03 0.09 0 0.02 0.4
Czech Republic 0 0 0 0 0 0.0 0.01 0 0.01 0 0 0.1
Hungary 0.02 0.01 0.02 0 0 0.2 0.05 0.01 0.05 0 0.01 0.3
Moldova, Republic of 0.01 0 0.01 0 0.01 0.1 0.05 0.01 0.05 0 0.02 0.2
Poland 0 0 0 0 0 0.0 0.01 0 0.01 0 0 0.2
Romania 0.03 0.01 0.03 0 0.01 1.6 0.07 0.02 0.07 0 0.03 2.1
Russian Federation 0.01 0 0.01 0 0 1.6 0.03 0.01 0.03 0 0.01 4.3
Slovakia 0.01 0 0.01 0 0 0.0 0.01 0 0.01 0 0 0.1
Ukraine 0.01 0 0.01 0 0 0.5 0.02 0 0.02 0 0.01 1.0
Eastern Europe 0.01 0 0.01 0 0 4.3 0.03 0.01 0.03 0 0.01 8.7
Note: The table shows the percentage of working hours lost to heat stress (and the associated health, well-being and productivity effects) in each sector and in the economy as a whole. It also shows the equivalent loss in terms of full-time jobs for the economy as a whole. Work in agriculture and construction is assumed to be carried out in the shade. The heat stress index for work in the afternoon sun adds around 2–3°C to the in-shade WBGT (see Appendix II for further details). The data are based on historical observations and on estimates obtained using the RCP2.6 climate change pathway, which envisages a global average temperature rise of 1.5°C by the end of the century.
Source: ILO estimates based on data from the ILOSTAT database and the HadGEM2 and GFDL-ESM2M climate models.
Box 7.1 Ambient temperature, heatwaves and occupational injuries in Europe and Central Asia
High ambient temperatures could have a significant impact on workers’ health and safety at work and inflict losses on the economy as a whole. The main negative effects are physical pain and suffering, reduced quality of life, costs associated with maintaining production, long-term lost income, and health costs associated with treatment and rehabilitation (Martínez-Solanas et al., 2018). In addition, heat-related illnesses and injuries incurred outside the workplace may also have an adverse impact on labour productivity, and workers may also have to take care of their ill or injured family members.
The increased frequency and intensity of heatwaves – and, in general, of days with high tempera-tures – in Europe and Central Asia could have detrimental effects on the health and productivity of people living in the region. The 2003 summer heatwave caused between 22,000 and 35,000 heat-related deaths across Europe during the first two weeks of August (Schär and Jendritzky, 2004). Though affected to a lesser extent than the populations of tropical and subtropical countries, people living in the temperate climate zones of Europe may face increasing risks at their workplace and at home as a result of more frequent heatwaves and longer spells of hot weather in the summer.
In a study assessing the relationship between ambient temperatures and occupational injuries in Spain during the 20-year period from 1994 to 2003, it was estimated that 2.7 per cent of all such injuries could be attributed to non-optimal ambient temperatures, among which extreme temperature highs played a significant role (Martínez-Solanas et al., 2018). This occupational injury rate is equiv-alent to an annual loss of 42 workdays per 1,000 workers, representing 0.03 per cent of Spain’s GDP in 2015 (ibid.).
A study conducted at a Slovenian motor vehicle manufacturing plant found that more than 90 per cent of the workers surveyed considered the temperature during the summer of 2016 to have been prob-lematic, and that more than 50 per cent experienced headaches and fatigue during work (Pogačar et al., 2018). Depending on the climate change scenario used, the temperature in Slovenia is pro-jected to increase by between 1°C and 4.5°C by 2099, and the number of hot days (temperatures above 30°C) is expected to increase by between 2 and 35 days over the same period. Consequently, workers at industrial plants face a growing risk of occupational heat stress. The study also found that the ventilation system at the car-making plant was not dissipating excess heat effectively, and that there was a strong correlation between temperatures inside the plant and outdoor temperatures (ibid.). High heat exposure and thermal discomfort during the summer have also been observed among workers at iron and steel plants in Turkey (Fahed, Ozkaymak and Ahmed, 2018).
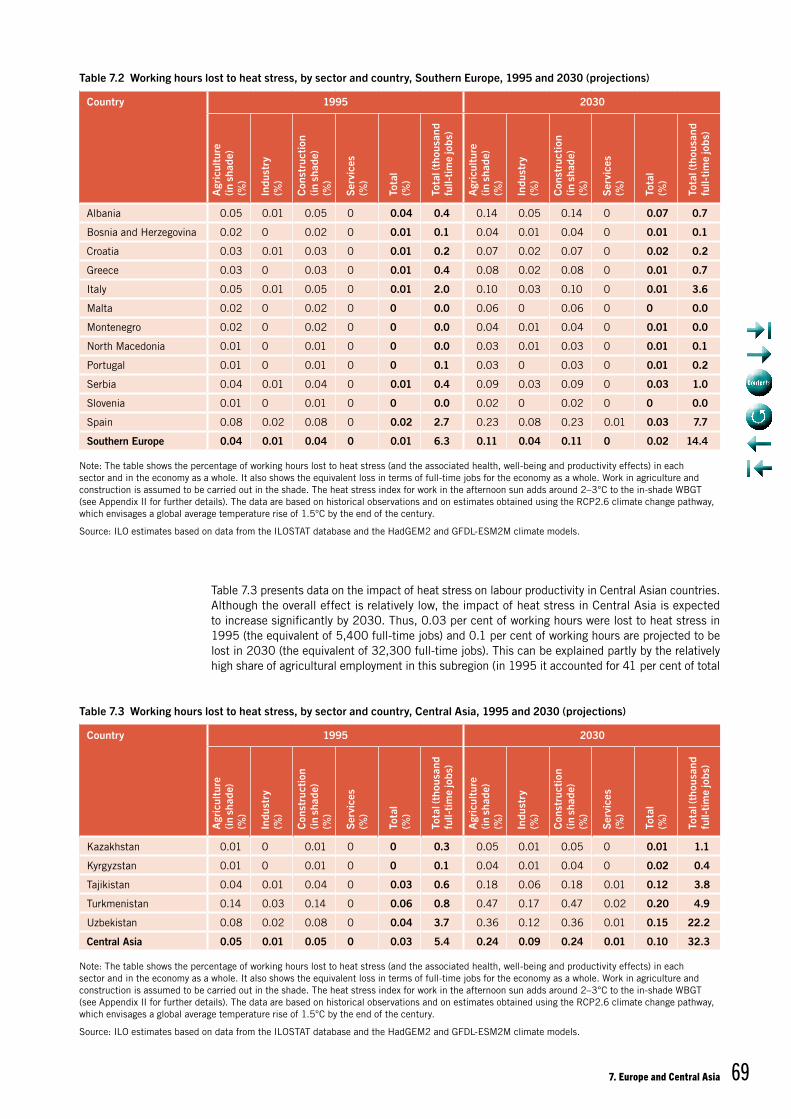
7. Europe and Central Asia 69
Table 7.3 presents data on the impact of heat stress on labour productivity in Central Asian countries. Although the overall effect is relatively low, the impact of heat stress in Central Asia is expected to increase significantly by 2030. Thus, 0.03 per cent of working hours were lost to heat stress in 1995 (the equivalent of 5,400 full-time jobs) and 0.1 per cent of working hours are projected to be lost in 2030 (the equivalent of 32,300 full-time jobs). This can be explained partly by the relatively high share of agricultural employment in this subregion (in 1995 it accounted for 41 per cent of total
Table 7.2 Working hours lost to heat stress, by sector and country, Southern Europe, 1995 and 2030 (projections)
Country 1995 2030
Agr
icul
ture
(in
sha
de)
(%)
Indu
stry
(%
)
Con
stru
ctio
n (in
sha
de)
(%)
Serv
ices
(%
)
Tota
l (%
)
Tota
l (th
ousa
nd
full-
time
jobs
)
Agr
icul
ture
(in
sha
de)
(%)
Indu
stry
(%
)
Con
stru
ctio
n (in
sha
de)
(%)
Serv
ices
(%
)
Tota
l (%
)
Tota
l (th
ousa
nd
full-
time
jobs
)
Albania 0.05 0.01 0.05 0 0.04 0.4 0.14 0.05 0.14 0 0.07 0.7
Bosnia and Herzegovina 0.02 0 0.02 0 0.01 0.1 0.04 0.01 0.04 0 0.01 0.1
Croatia 0.03 0.01 0.03 0 0.01 0.2 0.07 0.02 0.07 0 0.02 0.2
Greece 0.03 0 0.03 0 0.01 0.4 0.08 0.02 0.08 0 0.01 0.7
Italy 0.05 0.01 0.05 0 0.01 2.0 0.10 0.03 0.10 0 0.01 3.6
Malta 0.02 0 0.02 0 0 0.0 0.06 0 0.06 0 0 0.0
Montenegro 0.02 0 0.02 0 0 0.0 0.04 0.01 0.04 0 0.01 0.0
North Macedonia 0.01 0 0.01 0 0 0.0 0.03 0.01 0.03 0 0.01 0.1
Portugal 0.01 0 0.01 0 0 0.1 0.03 0 0.03 0 0.01 0.2
Serbia 0.04 0.01 0.04 0 0.01 0.4 0.09 0.03 0.09 0 0.03 1.0
Slovenia 0.01 0 0.01 0 0 0.0 0.02 0 0.02 0 0 0.0
Spain 0.08 0.02 0.08 0 0.02 2.7 0.23 0.08 0.23 0.01 0.03 7.7
Southern Europe 0.04 0.01 0.04 0 0.01 6.3 0.11 0.04 0.11 0 0.02 14.4
Note: The table shows the percentage of working hours lost to heat stress (and the associated health, well-being and productivity effects) in each sector and in the economy as a whole. It also shows the equivalent loss in terms of full-time jobs for the economy as a whole. Work in agriculture and construction is assumed to be carried out in the shade. The heat stress index for work in the afternoon sun adds around 2–3°C to the in-shade WBGT (see Appendix II for further details). The data are based on historical observations and on estimates obtained using the RCP2.6 climate change pathway, which envisages a global average temperature rise of 1.5°C by the end of the century.
Source: ILO estimates based on data from the ILOSTAT database and the HadGEM2 and GFDL-ESM2M climate models.
Table 7.3 Working hours lost to heat stress, by sector and country, Central Asia, 1995 and 2030 (projections)
Country 1995 2030
Agr
icul
ture
(in
sha
de)
(%)
Indu
stry
(%
)
Con
stru
ctio
n (in
sha
de)
(%)
Serv
ices
(%
)
Tota
l (%
)
Tota
l (th
ousa
nd
full-
time
jobs
)
Agr
icul
ture
(in
sha
de)
(%)
Indu
stry
(%
)
Con
stru
ctio
n (in
sha
de)
(%)
Serv
ices
(%
)
Tota
l (%
)
Tota
l (th
ousa
nd
full-
time
jobs
)
Kazakhstan 0.01 0 0.01 0 0 0.3 0.05 0.01 0.05 0 0.01 1.1
Kyrgyzstan 0.01 0 0.01 0 0 0.1 0.04 0.01 0.04 0 0.02 0.4
Tajikistan 0.04 0.01 0.04 0 0.03 0.6 0.18 0.06 0.18 0.01 0.12 3.8
Turkmenistan 0.14 0.03 0.14 0 0.06 0.8 0.47 0.17 0.47 0.02 0.20 4.9
Uzbekistan 0.08 0.02 0.08 0 0.04 3.7 0.36 0.12 0.36 0.01 0.15 22.2
Central Asia 0.05 0.01 0.05 0 0.03 5.4 0.24 0.09 0.24 0.01 0.10 32.3
Note: The table shows the percentage of working hours lost to heat stress (and the associated health, well-being and productivity effects) in each sector and in the economy as a whole. It also shows the equivalent loss in terms of full-time jobs for the economy as a whole. Work in agriculture and construction is assumed to be carried out in the shade. The heat stress index for work in the afternoon sun adds around 2–3°C to the in-shade WBGT (see Appendix II for further details). The data are based on historical observations and on estimates obtained using the RCP2.6 climate change pathway, which envisages a global average temperature rise of 1.5°C by the end of the century.
Source: ILO estimates based on data from the ILOSTAT database and the HadGEM2 and GFDL-ESM2M climate models.
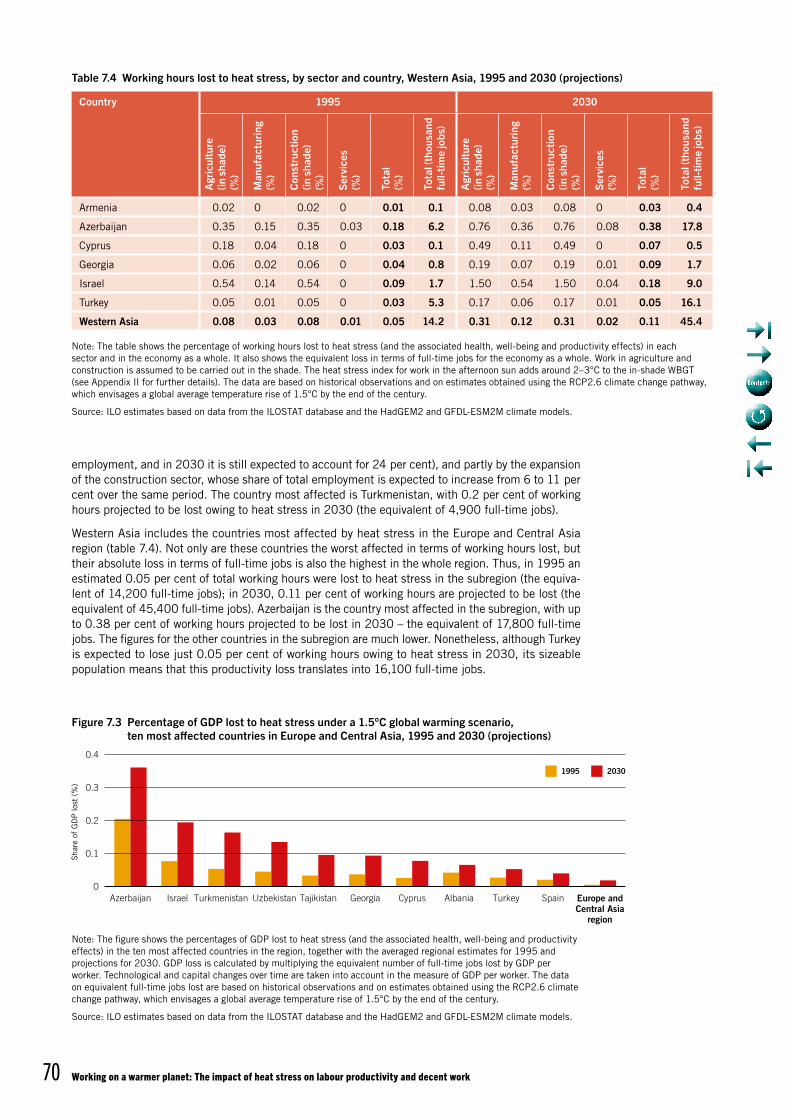
Working on a warmer planet: The impact of heat stress on labour productivity and decent work70
employment, and in 2030 it is still expected to account for 24 per cent), and partly by the expansion of the construction sector, whose share of total employment is expected to increase from 6 to 11 per cent over the same period. The country most affected is Turkmenistan, with 0.2 per cent of working hours projected to be lost owing to heat stress in 2030 (the equivalent of 4,900 full-time jobs).
Western Asia includes the countries most affected by heat stress in the Europe and Central Asia region (table 7.4). Not only are these countries the worst affected in terms of working hours lost, but their absolute loss in terms of full-time jobs is also the highest in the whole region. Thus, in 1995 an estimated 0.05 per cent of total working hours were lost to heat stress in the subregion (the equiva-lent of 14,200 full-time jobs); in 2030, 0.11 per cent of working hours are projected to be lost (the equivalent of 45,400 full-time jobs). Azerbaijan is the country most affected in the subregion, with up to 0.38 per cent of working hours projected to be lost in 2030 – the equivalent of 17,800 full-time jobs. The figures for the other countries in the subregion are much lower. Nonetheless, although Turkey is expected to lose just 0.05 per cent of working hours owing to heat stress in 2030, its sizeable population means that this productivity loss translates into 16,100 full-time jobs.
Table 7.4 Working hours lost to heat stress, by sector and country, Western Asia, 1995 and 2030 (projections)
Country 1995 2030
Agr
icul
ture
(in
sha
de)
(%)
Man
ufac
turin
g
(%)
Con
stru
ctio
n (in
sha
de)
(%)
Serv
ices
(%
)
Tota
l (%
)
Tota
l (th
ousa
nd
full-
time
jobs
)
Agr
icul
ture
(in
sha
de)
(%)
Man
ufac
turin
g
(%)
Con
stru
ctio
n (in
sha
de)
(%)
Serv
ices
(%
)
Tota
l (%
)
Tota
l (th
ousa
nd
full-
time
jobs
)
Armenia 0.02 0 0.02 0 0.01 0.1 0.08 0.03 0.08 0 0.03 0.4
Azerbaijan 0.35 0.15 0.35 0.03 0.18 6.2 0.76 0.36 0.76 0.08 0.38 17.8
Cyprus 0.18 0.04 0.18 0 0.03 0.1 0.49 0.11 0.49 0 0.07 0.5
Georgia 0.06 0.02 0.06 0 0.04 0.8 0.19 0.07 0.19 0.01 0.09 1.7
Israel 0.54 0.14 0.54 0 0.09 1.7 1.50 0.54 1.50 0.04 0.18 9.0
Turkey 0.05 0.01 0.05 0 0.03 5.3 0.17 0.06 0.17 0.01 0.05 16.1
Western Asia 0.08 0.03 0.08 0.01 0.05 14.2 0.31 0.12 0.31 0.02 0.11 45.4
Note: The table shows the percentage of working hours lost to heat stress (and the associated health, well-being and productivity effects) in each sector and in the economy as a whole. It also shows the equivalent loss in terms of full-time jobs for the economy as a whole. Work in agriculture and construction is assumed to be carried out in the shade. The heat stress index for work in the afternoon sun adds around 2–3°C to the in-shade WBGT (see Appendix II for further details). The data are based on historical observations and on estimates obtained using the RCP2.6 climate change pathway, which envisages a global average temperature rise of 1.5°C by the end of the century.
Source: ILO estimates based on data from the ILOSTAT database and the HadGEM2 and GFDL-ESM2M climate models.
Note: The figure shows the percentages of GDP lost to heat stress (and the associated health, well-being and productivity effects) in the ten most affected countries in the region, together with the averaged regional estimates for 1995 and projections for 2030. GDP loss is calculated by multiplying the equivalent number of full-time jobs lost by GDP per worker. Technological and capital changes over time are taken into account in the measure of GDP per worker. The data on equivalent full-time jobs lost are based on historical observations and on estimates obtained using the RCP2.6 climate change pathway, which envisages a global average temperature rise of 1.5°C by the end of the century.
Source: ILO estimates based on data from the ILOSTAT database and the HadGEM2 and GFDL-ESM2M climate models.
Figure 7.3 Percentage of GDP lost to heat stress under a 1.5°C global warming scenario, ten most affected countries in Europe and Central Asia, 1995 and 2030 (projections)
20301995
Azerbaijan Israel Turkmenistan Uzbekistan Tajikistan Georgia Cyprus Albania Turkey Spain Europe andCentral Asia
region
0.4
Sha
re o
f G
DP
lost
(%
)
0
0.1
0.2
0.3
7. Europe and Central Asia 71
In a global perspective, Europe and Central Asia is the region least affected by heat stress in terms of working hours lost. As mentioned above, the region is characterized by a low share of agricultural employment, relatively low levels of exposure to heat stress as measured by WBGT values, and high adaptive capacity. However, the adverse impact of heatwaves on working hours and the corresponding GDP losses are expected to become more significant by 2030, as shown in figure 7.3. The countries in Western and Central Asia are those most affected in the region. According to our projections, the share of GDP lost to heat stress is set to more than double between 1995 and 2030 in most of the top ten countries affected, including Israel, Turkmenistan, Uzbekistan, Tajikistan, Georgia, Cyprus and Turkey.
7.4 Conclusion and key findingsEurope and Central Asia appears to be the region that is least affected by heat exposure, mainly because it is characterized by low rates of agricultural employment, relatively low WBGT values and a high adaptive capacity. However, at the subregional level there is considerable heterogeneity. Although most subregions are located at high northern latitudes, parts of Western and Central Asia are situated in or near subtropical latitudes. These two subregions, which also have decent work deficits, are at greater risk of suffering labour productivity losses due to heat stress. Conversely, Northern, Central and Eastern Europe are markedly less vulnerable, while Southern Europe is expected to be only marginally affected by heat stress. Nonetheless, the increased frequency and intensity of heatwaves in Europe can have serious impacts on health and productivity. Especially in countries in Southern Europe, elderly people, outdoor workers, and indoor workers performing physical work without air conditioning are vulnerable to heat-related illness and injuries.
73
Heat stress has implications for the pursuit of decent work and labour productivity in all of the coun-tries examined in this report. However, the impact of heat stress will not be felt equally across the world; rather, it is expected to be the strongest for businesses and workers in South Asia, Western Africa, South-East Asia and Central Africa. As already noted, occupational exposure to heat stress is highest in the agricultural and construction sectors because of the physical nature of the work and the fact that it is carried out mainly outdoors. Workers in these sectors are also less likely to have access to health insurance and other social protection benefits that would help them to cope with workplace accidents and injuries resulting from heat stress.
Furthermore, heat stress could entrench existing inequalities in the world of work, notably by worsening the working conditions of the many women working in agriculture, and of male workers on construc-tion sites. It may also act as a push factor for migration by prompting people to leave rural areas in search of better prospects in the cities of their country or in other countries. Different countries have different levels of public, financial, institutional and technological capabilities to deal with heat stress. Accordingly, the impact of rising temperatures on businesses and workers will vary greatly across the world.
Addressing these challenges and ensuring a path to decent work requires a mixture of proactive employment policies and appropriate climate change adaptation measures to enable workers, busi-nesses and vulnerable households to adapt to rising temperatures. Figure 8.1 illustrates the role of governments, employers and workers in promoting adaptation measures in three key areas, namely: regulation and behavioural change, the development of infrastructure and technology, and cap-acity building.
The ILO Guidelines for a just transition provide practical orientation for governments and employers’ and workers’ organizations, including specific guidance on how to design, implement and monitor policies and measures aimed at addressing the labour market implications of climate change in accordance with national circumstances and priorities. They recommend a mix of macroeconomic, industrial, sectoral and labour policies. In particular, governments, employers and workers are advised to conduct assessments of increased or new OSH risks that arise from climate change, including increasingly hot weather, and to identify adequate preventive and protective measures (ILO, 2015).
The ILO Guidelines for a just transition emphasize that social protection and skills development are both key policy areas when it comes to increasing the adaptive capabilities of individuals and com-munities seeking to cope with the hazards caused by rising temperatures. As the results presented in earlier chapters of this report make clear, productivity losses due to heat stress are – and will be – most acute in subregions characterized by fragile labour market conditions. Social protection policies are an essential element of strategies to protect workers against the detrimental effects of heat that jeopardize their ability to earn income (ILO, 2018b). Skills development is a further crucial element of such adaptation strategies because it helps displaced workers to move on to sectors where there is employment growth, thus protecting them against income losses and other adverse effects of heat stress (ibid.).
8. Employment and labour market policiesPart I. Adapting to heat-related hazards through international labour standards and tripartism
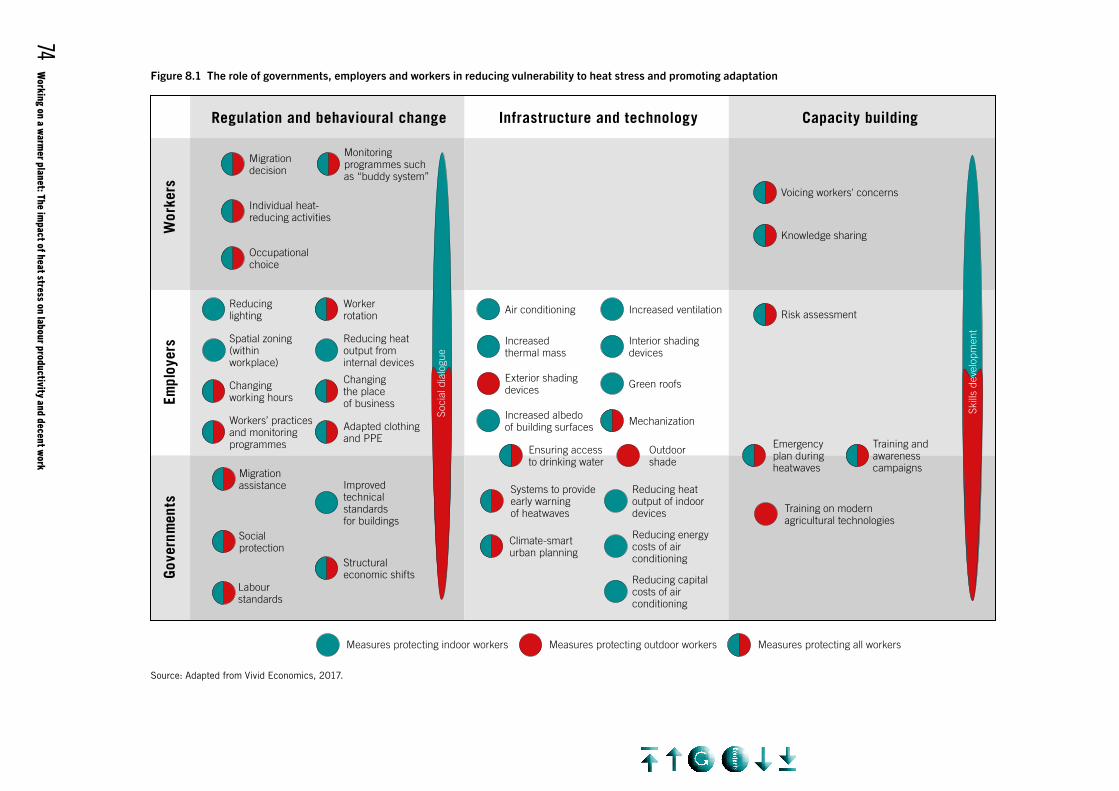
Working on a w
armer planet: The im
pact of heat stress on labour productivity and decent work74
Source: Adapted from Vivid Economics, 2017.
Figure 8.1 The role of governments, employers and workers in reducing vulnerability to heat stress and promoting adaptation
Infrastructure and technology Capacity building
Wor
kers
Empl
oyer
sGo
vern
men
tsMigrationdecision
Air conditioning
Increasedthermal mass
Occupationalchoice
Exterior shadingdevices
MechanizationIncreased albedoof building surfaces
Interior shadingdevices
Reducinglighting
Reducing heatoutput frominternal devices
Green roofs
Outdoorshade
Workers’ practicesand monitoringprogrammes
Increased ventilation
Reducing capitalcosts of air conditioning
Reducing heatoutput of indoordevices
Reducing energycosts of airconditioning
Training on modernagricultural technologies
Training andawarenesscampaigns
Ensuring access to drinking water
Systems to provideearly warningof heatwaves
Changingworking hours
Changingthe placeof business
Improvedtechnicalstandardsfor buildings
Labourstandards
Socialprotection
Migrationassistance
Spatial zoning(withinworkplace)
Adapted clothingand PPE Emergency
plan duringheatwaves
Structuraleconomic shifts
Soci
al d
ialo
gue
Skill
s de
velo
pmen
t
Voicing workers' concerns
Risk assessment
Measures protecting indoor workers Measures protecting outdoor workers Measures protecting all workers
Knowledge sharing
Monitoringprogrammes suchas “buddy system”
Workerrotation
Regulation and behavioural change
Individual heat-reducing activities
Climate-smarturban planning
8. Employment and labour market policies – Part I 75
Some of the countries most affected by heat stress (notably in Africa and Asia) have limited adaptive capacity and resources to protect their workers from the detrimental effects of rising temperatures. Rapid structural transformation would be an ideal first option for these countries, since heat-vulner-able workers could then move out of agriculture into more productive sectors. However, demographic and economic projections indicate that this is unlikely to happen.1 Unplanned migration may be one of the consequences if no action is taken. Governments, employers and workers have a number of important tools at their disposal that they can use to promote adaptation to the changes expected to occur in the world of work, and to mitigate their potential negative effects.
The ILO Guidelines for a just transition stress the important role of international labour standards and social dialogue in addressing the challenges associated with increasing temperatures; they also recognize that the establishment of effective OSH systems requires joint commitment and cooper-ation between governments, employers and workers. Possible adaptation measures can be drawn up using the ILO’s principle of tripartism to outline the respective roles and responsibilities of govern-ments, employers’ and workers’ organizations; these measures can then be incorporated into national employment policies (see figure 8.1).
The following sections focus on the role of international labour standards, governments, employers, workers and social dialogue in the development and implementation of some of the policy options shown in the above figure.
8.1 The role of international labour standardsRising temperatures will require governments, businesses and workers to prepare for, adapt to, and manage the risks of extreme heat events. Their ability to do so depends on regulatory frameworks, including labour standards, rules and regulations, and agreements. At the international level, it is worth emphasizing the important role of international labour standards in promoting adaptation to rising temperatures. These standards provide tools for managing the risks associated with heat stress and for ensuring decent working conditions for the workers and businesses affected.
As indicated in manuals produced by OSH agencies around the world,2 heat stress is an OSH hazard and should be treated as such by workers, employers and governments, in accordance with the Occupational Safety and Health Convention, 1981 (No. 155), and its accompanying Recommendation, (No. 164). Together, these two international labour standards provide guidance for States on how to develop and implement a national OSH policy that addresses, among other risks, heat stress, in accordance with their individual needs and in consultation with the employers’ and workers’ organizations concerned.
Convention No. 155 itself does not contain any specific guidelines on ambient factors in the work-place, such as high temperatures. It does, however, make the adoption of a national OSH policy an obligation in order to “prevent accidents and injury to health arising out of, linked with or occurring in the course of work”. The accompanying Recommendation No. 164 specifies that a national OSH policy should include measures dealing with “temperature, humidity and movement of air in the workplace”.
Other international labour standards also offer tools for the management of heat stress risks and can facilitate adaptation efforts by governments, employers’ and workers’ organizations. These include the Hygiene (Commerce and Offices) Recommendation, 1964 (No. 120), the Protection of Workers’ Health Recommendation, 1953 (No. 97), and the Workers’ Housing Recommendation, 1961 (No. 115). For example, Recommendation No. 97 states that “national laws or regulations should provide for methods of preventing, reducing or eliminating risks to health in places of employment”, including “special risks of injury to health”. Though not explicitly mentioned in the Recommendation, heat is one of these special risks. Recommendation No. 97 also stipulates that employers should take “all appropriate measures” to provide “adequate protection of the health of the workers concerned”, in particular by avoiding “sudden variations in temperature” and ”excessive heat”.
The Hygiene (Commerce and Offices) Recommendation, 1964 (No. 120), is one of the most detailed ILO instruments setting out protective and preventive measures expressly tailored to situations of heat stress. As a general principle, Paragraph 20 of Recommendation No. 120 lays down that “[n]o worker should be required to work regularly in an extreme temperature”. To this end, “the competent authority
1. The projections for 2030 used for this report take into account projected structural change; they suggest that agricultural productivity loss due to heat stress will be highest in Africa.
2. See, for example, the heat stress information resources developed by the Ontario Ministry of Labour (https://www.labour.gov.on.ca/english/hs/pubs/gl_heat.php), the United Kingdom Health and Safety Executive (http://www.hse.gov.uk/pubns/indg451.htm), and the United States Occupational Safety and Health Administration (https://www.osha.gov/SLTC/heatstress/) [all three addresses accessed 20 Nov. 2018].
Working on a warmer planet: The impact of heat stress on labour productivity and decent work76
should determine either maximum or minimum standards of temperature, or both, having regard to the climate and to the nature of the establishment, institution or administrative service and of the work”.
Recommendation No. 120 further specifies that “[f]ixed or movable screens, deflectors or other suit-able devices should be provided and used to protect workers” engaged in commerce or office work. These devices should protect them against “any large-scale intake of … heat, including the heat of the sun” (Para. 22). The Recommendation further provides that “[n]o worker should be required to work at an outdoor sales counter in high temperatures likely to be harmful unless suitable means of protection against such high temperatures are available” (Para. 23). Moreover, “[w]hen work is carried out in a very low or a very high temperature, workers should be given a shortened working day or breaks included in the working hours, or other relevant measures taken” (Para. 25).
The range of international labour standards applicable and relevant to adaptation measures for coping with heat stress is not limited to those that contain specific OSH provisions related to heat. For ex-ample, workers affected by heat stress are entitled to injury benefits as prescribed by the Employment Injury Benefits Convention, 1964 (No. 121). Similarly, international labour standards dealing with social security, including the Social Security (Minimum Standards) Convention, 1952 (No. 102), and the Social Protection Floors Recommendation, 2012 (No. 202), provide detailed guidance on how to develop social protection systems for all.
In addition, the Committee of Experts on the Application of Conventions and Recommendations (CEACR), which supervises compliance with international labour standards, has been monitoring issues related to heat stress in the workplace when examining member States’ application of, inter alia, the Hours of Work (Industry) Convention, 1919 (No. 1),3 the Labour Inspection Convention, 1947 (No. 81),4 the Occupational Safety and Health Convention, 1981 (No. 155),5 and the Safety and Health in Agriculture Convention, 2001 (No. 184).6
More specifically, in one of its observations concerning the implementation of the Labour Inspection Convention, 1947 (No. 81), the CEACR raised the issue of protection for workers exposed to direct sunlight and dehydration.7 In particular, the CEACR requested the Government of the United Arab Emirates to provide further information on the implementation of its national legislation requiring employers, under certain circumstances, to adopt such heat-reducing measures as the provision of fresh drinks, the provision of thirst-quenching products (e.g. salt and lemons), first aid at the work-place, adequate industrial air conditioning, and means of ensuring the necessary shade for protection against direct sunlight.
In order to complement existing international labour standards, the ILO has developed a number of the-matic codes of practice8 that address heat stress in general, such as Ambient factors in the workplace (2001), or in particular settings, such as Safety and health in the use of machinery (2013).9 The ILO code of practice Ambient factors in the workplace provides detailed technical advice on hazards and risks associated with heat exposure, and on how such risks can be effectively managed so as to pre-vent occupational accidents and diseases. For example, with regard to prevention and control in hot environments, the code advises that “[f]or hydration maintenance, employers should make water at low salt concentration or dilute flavoured drinks readily available to workers, and should encourage them to drink at least hourly, by providing a close source or arranging for drinks to be brought to the workers” (ILO, 2001).
3. CEACR Direct Request to Slovakia concerning Convention No. 1 (adopted in 2009 and published during the 99th Session of the International Labour Conference in 2010). Available at: https://www.ilo.org/dyn/normlex/en/f?p=1000:13100:0::NO::P13100_COMMENT_ID,P13100_LANG_CODE:2321121,en:NO.
4. CEACR Direct Request to Azerbaijan concerning Convention No. 81 (adopted in 2010 and published during the 100th Session of the International Labour Conference in 2011). Available at: https://www.ilo.org/dyn/normlex/en/f?p=1000:13100:0::NO:13100:P13100_COMMENT_ID:2333273.
5. CEACR Direct Request to Cyprus concerning Convention No. 155 (adopted in 2015 and published during the 105th Session of the International Labour Conference in 2016). Available at: https://www.ilo.org/dyn/normlex/en/f?p=1000:13100:0::NO::P13100_COMMENT_ID,P13100_LANG_CODE:3254822,en:NO.
6. CEACR Direct Request to the Republic of Moldova concerning Convention No. 184 (adopted in 2015 and pub-lished during the 105th Session of the International Labour Conference in 2016). Available at: https://www.ilo.org/dyn/normlex/en/f?p=NORMLEXPUB:13100:0::NO::P13100_COMMENT_ID:3245019.
7. CEACR Observation to the United Arab Emirates concerning Convention No. 81 (adopted in 2008 and published during the 98th Session of the International Labour Conference in 2009). Available at: https://www.ilo.org/dyn/normlex/en/f?p=1000:13100:0::NO::P13100_COMMENT_ID,P13100_LANG_CODE:2298914,en:NO.
8. ILO codes of practice are technical standards that provide detailed practical guidance for specific sectors or topic areas. They complement existing international labour standards but, unlike Conventions, they are non-binding.
9. Section 6.6. of the ILO code of practice Safety and health in the use of machinery is entitled “Effect of climate” and contains guidance on the use of machinery in very high ambient temperatures and/or humidity (such as in tropical or subtropical regions).
8. Employment and labour market policies – Part I 77
8.2 The role of governmentsAs heatwaves and high temperatures become more common, labour productivity is reduced and decent working conditions are endangered. This requires the adjustment of regulatory frameworks. Governments are instrumental in creating a regulatory environment that facilitates behavioural change among employers and individual workers, and that guides the development of measures to tackle heat stress at the workplace (see figure 8.1 above). Some countries have already adopted specific regula-tions to protect workers from heat exposure and ensuing heat stress (see, for example, ILO, 2017f, for a discussion of such regulations in sub-Saharan African countries). Some of these regulations prescribe maximum temperatures to which workers may be exposed (e.g. Cyprus);10 others specify detailed measures for preventing excessive heat levels and stipulate that protective equipment should be used (e.g. Gabon).11 In the absence of clearly prescribed standards, the national legislation of some countries requires employers, as a minimum, to provide a safe place of work and to identify and control risks and hazards – an approach that has been adopted in New Zealand and by the Government of Ontario in Canada, for example.12
The risk of occupational heat stress becomes particularly severe during heatwaves. Thus, improving warning systems for such events is a key element of protective strategies to deal with temperature extremes (Bi et al., 2011; Pogačar et al., 2018). Surveillance and warning systems for heatwaves rely on meteorological stations. Africa, however, has only a fraction of the number of stations that is recommended for information gathering as part of a successful warning system. As is often the case in developing countries, financial and technical restrictions have to be taken into account (Watts et al., 2018). To achieve the comprehensive development of infrastructure required to adapt to heat stress, it is important to foster international cooperation among countries, including information sharing and joint action under the aegis of the ILO.
Social protection systems must also be grounded in a regulatory and institutional framework that ensures coverage for all, particularly for the most disadvantaged. Such systems provide a range of policy instruments that can play a significant role in strengthening the adaptive capacity and resilience of workers, including the most vulnerable and the hardest hit by heat stress, namely the self-employed in agriculture (ILO, 2018b, Ch. 4; ILO, 2017a). Social protection instruments, including social insur-ance and social assistance (e.g. weather index-based insurance and cash transfers), can compensate for the loss of income experienced by households as a consequence of heatwaves and ensure effective access to health care. In Algeria, for example, the coverage of the National Unemployment Insurance Fund for the Construction, Public Works and Hydraulics Sectors was extended in 2016 to weather- related work stoppages, including heat-related work stoppages (Mendaci, 2016).
In some countries, workers affected by an environmental hazard at work as a result of a heatwave are entitled to employment injury benefits. In others (e.g. Germany and Romania), there are specific provisions for the payment of unemployment benefits in case of work stoppages in the construction sector as a result of cold weather. In developing countries, public works or public employment pro-grammes that promote decent labour practices can enable low-skilled workers to earn an income and reduce their risk of heat stress by working only at adequate temperatures.
Regulatory interventions are also needed to promote specific technologies; to improve technical standards for buildings (e.g. so that internal temperatures are reduced); and to strengthen local public employment policies so as to discourage rural–urban migration or, alternatively, to facilitate migration, since future extreme heat events are likely to prompt many vulnerable workers to migrate (see box 8.1 below). In some cases, when climate change threatens livelihoods, temporary or per-manent migration can be the only adaptation response. Heat stress is one of the main climatic drivers of migration (see box 6.3 in Chapter 6).
Structural economic shifts may also have major regulatory implications. Since the sector most adversely affected by heat stress is agriculture, any structural change that encourages transition from agriculture to industry and the service sector can facilitate adaptation to heat stress. Structural trans-formation is driven by public investment in infrastructure, the promotion of an enabling environment
10. Decision taken on 5 July 2002 by the Minister of Labour and Social Insurance “for dealing with heat stress of workers in outdoor work activities during the summer months”, available at: http://www.mlsi.gov.cy/mlsi/dli/dliup.nsf/pagem2_en/pagem2_en?OpenDocument [accessed 3 Jan. 2019].
11. Decree No. 01494/PR/MTEPS of 29 December 2011 “on general rules of health and safety at workplaces” stipu-lates, inter alia, that rest periods should be granted to workers exposed to extreme temperatures and that appropriate measures should be taken to protect workers from heat (Art. 41); it also stipulates that personal protective equipment should be provided to workers who perform their work outdoors (Art. 44).
12. On New Zealand, see the Health and Safety in Employment Act 1992; on Ontario, see Art. 25(2)(h) of the Occupational Health and Safety Act 1990. For a general overview, see ILO (2009).
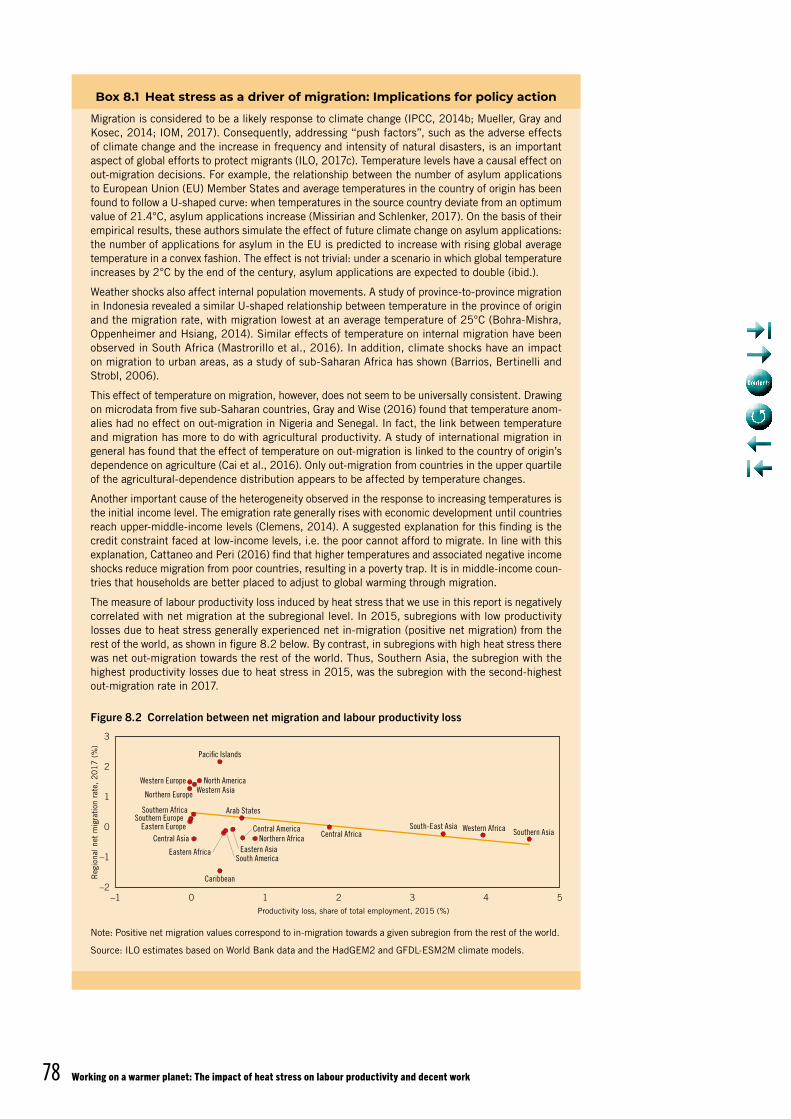
Working on a warmer planet: The impact of heat stress on labour productivity and decent work78
Box 8.1 Heat stress as a driver of migration: Implications for policy action
Migration is considered to be a likely response to climate change (IPCC, 2014b; Mueller, Gray and Kosec, 2014; IOM, 2017). Consequently, addressing “push factors”, such as the adverse effects of climate change and the increase in frequency and intensity of natural disasters, is an important aspect of global efforts to protect migrants (ILO, 2017c). Temperature levels have a causal effect on out-migration decisions. For example, the relationship between the number of asylum applications to European Union (EU) Member States and average temperatures in the country of origin has been found to follow a U-shaped curve: when temperatures in the source country deviate from an optimum value of 21.4°C, asylum applications increase (Missirian and Schlenker, 2017). On the basis of their empirical results, these authors simulate the effect of future climate change on asylum applications: the number of applications for asylum in the EU is predicted to increase with rising global average temperature in a convex fashion. The effect is not trivial: under a scenario in which global temperature increases by 2°C by the end of the century, asylum applications are expected to double (ibid.).
Weather shocks also affect internal population movements. A study of province-to-province migration in Indonesia revealed a similar U-shaped relationship between temperature in the province of origin and the migration rate, with migration lowest at an average temperature of 25°C (Bohra-Mishra, Oppenheimer and Hsiang, 2014). Similar effects of temperature on internal migration have been observed in South Africa (Mastrorillo et al., 2016). In addition, climate shocks have an impact on migration to urban areas, as a study of sub-Saharan Africa has shown (Barrios, Bertinelli and Strobl, 2006).
This effect of temperature on migration, however, does not seem to be universally consistent. Drawing on microdata from five sub-Saharan countries, Gray and Wise (2016) found that temperature anom-alies had no effect on out-migration in Nigeria and Senegal. In fact, the link between temperature and migration has more to do with agricultural productivity. A study of international migration in general has found that the effect of temperature on out-migration is linked to the country of origin’s dependence on agriculture (Cai et al., 2016). Only out-migration from countries in the upper quartile of the agricultural-dependence distribution appears to be affected by temperature changes.
Another important cause of the heterogeneity observed in the response to increasing temperatures is the initial income level. The emigration rate generally rises with economic development until countries reach upper-middle-income levels (Clemens, 2014). A suggested explanation for this finding is the credit constraint faced at low-income levels, i.e. the poor cannot afford to migrate. In line with this explanation, Cattaneo and Peri (2016) find that higher temperatures and associated negative income shocks reduce migration from poor countries, resulting in a poverty trap. It is in middle-income coun-tries that households are better placed to adjust to global warming through migration.
The measure of labour productivity loss induced by heat stress that we use in this report is negatively correlated with net migration at the subregional level. In 2015, subregions with low productivity losses due to heat stress generally experienced net in-migration (positive net migration) from the rest of the world, as shown in figure 8.2 below. By contrast, in subregions with high heat stress there was net out-migration towards the rest of the world. Thus, Southern Asia, the subregion with the highest productivity losses due to heat stress in 2015, was the subregion with the second-highest out-migration rate in 2017.
Figure 8.2 Correlation between net migration and labour productivity loss
Note: Positive net migration values correspond to in-migration towards a given subregion from the rest of the world.
Source: ILO estimates based on World Bank data and the HadGEM2 and GFDL-ESM2M climate models.
1
2
–2
–1
0
–1 10 2Productivity loss, share of total employment, 2015 (%)
Reg
iona
l net
mig
rati
on r
ate,
20
17
(%
)
3 4 5
3
J
J
JJJ
J JJ
J
JJ
J
J J
J
J
J
J
JJ
Arab States
Caribbean
Central AfricaCentral America
Central Asia
Eastern Africa Eastern Asia
Eastern EuropeNorthern Africa
North America
Northern Europe
Pacific Islands
South America
South-East Asia
Southern Africa
Southern Asia
Southern EuropeWestern Africa
Western AsiaWestern Europe
8. Employment and labour market policies – Part I 79
for “green” businesses, and sustainable participation in international trade (Ocampo, Rada and Taylor, 2009). It is also driven by the development of necessary skills and business acumen, and by the accu-mulation of collective knowledge (Salazar-Xirinachs, Nübler and Kozul-Wright, 2014). A combination of all these factors can help developing countries to catch up, thereby increasing the chances of their being able to mitigate the impact of heat stress.
Successful examples of countries that have launched a structural transformation of their economies include China, Costa Rica and the Republic of Korea. Both China and the Republic of Korea facilitated diversification into low- and medium-technology industries by investing heavily in infrastructure and import substitution, and also in education at all levels. During its ongoing structural transformation China has decided to pay greater attention to social and environmental outcomes, in particular to such issues as growing inequality and social polarization. By promoting skills development and investment, the structural transformation of economies makes it easier to “redirect” potential losses in working hours caused by heat stress to employment in more productive sectors.
The role of the government is not limited to setting standards. This is because the enforcement of standards and their implementation both depend on existing infrastructure and institutional capacity. The development of comprehensive infrastructure – such as that required for early warning systems, the provision of access to safe water supplies, and climate-smart urban planning – requires direct participation by the government. This is also true of measures aimed at reducing the heat output of indoor devices and at reducing the energy and capital costs of air conditioning. Since standards play an important role in protecting workers against heat stress, appropriate resources have to be made available for labour inspections to supervise enforcement and compliance.
Lastly, the government can also play the role of a facilitator by ensuring that employers and workers alike act in the interest of the general good – an aspect that is emphasized in the ILO Guidelines for a just transition. Through consistent policy-making, governments can create an environment that is conducive to bringing key stakeholders together in efforts to adapt workplaces to rising temperatures. In this respect, governments can help employers’ and workers’ organizations to comply with OSH regu-lations by launching educational and awareness-raising campaigns. Adaptation efforts can be further enhanced by the government’s allocation, through financial and business development services, of resources to employers and workers in order to help them achieve specific outcomes.
8.3 The role of employersEmployers play a crucial role in the implementation of effective adaptation measures to reduce the impact of heat stress. Although it is the government that sets regulations and standards, employers are responsible for providing a safe and healthy workplace and ensuring that working conditions conform to those standards.13 Health and safety regulations oblige employers to assess risks in the workplace, and to protect workers from recognized serious hazards, including heat-related hazards. Such assessments should be part of an OSH management system implemented by the employer with the participation of the workers. Risk assessments are necessary because heat-related hazards can vary widely across and within regions and activities. These risks depend, inter alia, on the level of heat, the physicality of the work, and the adaptive capacity of businesses and workers. When heat stress is identified as a hazard, employers need to take action to eliminate the hazard and minimize the risk by implementing a series of control measures.
Many options are available to employers for protecting workers against heat stress, particularly in the areas of infrastructure and internal regulation (see figure 8.1 above). The appropriate mix of adaptation measures depends very much on the local context, and whereas some measures can protect both outdoor and indoor workers, others will protect only one of the two groups. For example, infrastructural measures in buildings, such as air conditioning, misting and ventilation systems and cool roofs, pro-tect only indoor workers. Outdoor workers sitting inside vehicles or large machinery can be protected from heat by air-conditioned cabins, but most outdoor workers have limited protection against hot air or the sun. Furthermore, although very effective in reducing high temperatures, air conditioning is energy-intensive and, when powered by electricity generated from fossil fuels, it is also a significant source of GHG emissions, which contribute to climate change and the increase of global temperatures. Air conditioning systems powered by solar energy generated from panels on factory roofs already exist
13. The role of the State is fundamental in the regulation of working conditions. However, the economic benefits of OSH policies (e.g. the positive correlation between good OSH performance and labour productivity) should encourage businesses, too, to take an active role in initiating the development of such policies in order to address the challenges posed by heat stress. Promoting the safety and health of workers keeps them healthy, productive and motivated, which in turn enables businesses to remain competitive and innovative.
Working on a warmer planet: The impact of heat stress on labour productivity and decent work80
and need to be tailored to local conditions; such systems support climate change adaptation without leading to GHG emissions. In addition, regulatory measures such as flexible working hours, worker rotation, changes to the dress code or changing the location of a business can effectively protect both indoor and outdoor workers against heat stress (Vivid Economics, 2017).
As for infrastructure, employers can reduce the impact of heat-related hazards on workers most effectively through building design (e.g. nature-inspired, biomimetic building solutions). This includes the introduction of adaptation measures such as air conditioning that can be used to deal with brief temperature peaks, and also various means of reducing high base temperature, including: (a) increased thermal mass, which improves the ability of buildings to absorb and store heat energy, so that internal building temperatures increase more slowly over time; (b) increased ventilation; (c) increasing the albedo of building surfaces (e.g. through “cool roofs”), which leads to greater reflection of solar radi-ation; (d) “green roofs”, which are covered with vegetation and help reduce average temperatures; and (e) increased interior shading through shutters, curtains or window film, for example.
Building design focuses on indoor workers, but other types of infrastructure-related measures can pro-tect outdoor workers as well. For example, setting up shade canopies over work areas exposed to direct sunshine or moving certain jobs, where possible, to naturally shaded areas can be effective adaptation measures. Increasing mechanization (especially in agriculture) can also reduce the physical demands and pace of jobs. However, mechanization can be expensive; apart from resources that may not be available, it also requires advanced planning, which can be difficult to achieve because of the need to involve various disciplines and bodies (Spector and Sheffield, 2014). For outdoor workers in particular, ensuring that they have regular access to drinking water, shade and rest breaks, and providing all of them with personal protective equipment and appropriate clothing, are essential components of any adaptation plan (see, for example, box 4.2 in Chapter 4, which explains how Costa Rica has made such measures obligatory).
Relevant changes that can be introduced by employers within their firms include reducing the heat output from internal devices, adjusting working hours so that workers can cope better with high tem-peratures, moving the place of business to a cooler area, and adapting workwear to heat levels. Many of the physically demanding jobs threatened by heat stress require protective clothing to be worn, which in fact adds to the risk of heat exhaustion by inhibiting heat loss (Bernard, 1999). Therefore, improving safety clothing by using more breathable fabrics or allowing workers to take breaks during which they can remove heavy protective items could improve working conditions in those jobs. Several of the measures discussed in this section are also relevant to self-employed workers.
Training can help workers to understand better how heat stress affects their health and safety, and how it can be prevented. Employers can also set up monitoring programmes based on having more than one worker present at particularly hot locations, so that workers can look out for any signs and symptoms of heat-related illness in their colleagues (see the discussion of “buddy systems” in section 8.4 below).
8.4 The role of workersWorkers also have an important role to play in the implementation of adaptation measures and, more generally, in taking appropriate action at the workplace (see figure 8.1 above). However, the options available to workers depend very much on the regulations, infrastructure and training programmes put in place by governments and employers. Still, there are a number of things they can do to reduce the impact of heat stress on their health and productivity (for a specific case study from the agricultural sector, see box 8.2).
Workers can take individual action to reduce their body temperature. This may be done by drinking water frequently, shifting one’s working hours, taking breaks in cool and shaded areas, taking more breaks during particularly hot periods, wearing clothing that provides protection from the sun while allowing airflow to the body, protecting one’s head with a hat if working outside, and being alert to the symptoms of heat exhaustion or heatstroke.
Individual heat-reducing measures can be complemented by the use of a “buddy system”. The latter is a type of monitoring system at the workplace that involves workers observing one another for the symp-toms of heat stress, specifically by monitoring such physiological parameters as body temperature, hydration and heart rate. Moreover, workers should, whenever possible, inform their employers about any concerns they may have regarding the work environment. However, the feasibility of such measures often depends on the infrastructure available, the awareness of the workers, and the regulations in place at the national level and within individual firms.
8. Employment and labour market policies – Part I 81
Box 8.2 Adapting to heat stress in the agricultural sector
There are currently more than 850 million people working in the agricultural sector worldwide, the majority of whom are self-employed and subsistence farmers. Together, they represent 26.5 per cent of the world’s total labour force (ILO, 2018c). Low- and lower-middle-income countries are highly dependent on the agri-cultural sector, which accounts for, respectively, 68.9 per cent and 38.8 per cent of their total employment (ibid.). Agricultural workers are the group of workers most vulnerable to heat stress, as can be seen from figure 2.6 in Chapter 2, which shows that the agricultural sector accounted for 83 per cent of global working hours lost to heat stress in 1995 and that it is still expected to account for 60 per cent of the loss in 2030. Furthermore, agricultural workers often find it difficult to follow certain OSH recommendations that could help reduce heat-related risks, such as avoiding exposure to the sun or reducing workloads and taking longer rest breaks during hot weather, since the work they have to perform largely depends on seasonal growing cycles and market forces (Jackson and Rosenberg, 2010). Tackling heat stress could help to promote decent work in the agricultural sector.
Governments, employers, and workers play important roles in the adoption of protective measures against heat stress in agriculture. Agricultural workers can adapt to heat-related risks by drinking water more fre-quently, taking breaks under shaded shelters and wearing heat-protective clothing that allows airflow to the body; they can also contribute to the adaptation process by sharing relevant information with their peers. However, workers’ adaptive capacity and motivation depend very much on the availability of infrastructure and regulations, both of which need to be provided by employers and governments. For example, a study of farm workers in the State of Washington, United States, found that piece-rate (as opposed to hourly rate) payment was associated with a greater risk of health-related illness, probably because economic incentives prompt workers to work longer hours and take fewer breaks (Spector, Krenz and Blank, 2015). A payment method taking into account break times, or a transition to hourly pay in addition to mandatory scheduled breaks, would improve conditions for such workers.
There are a number of international standards and national regulations on OSH in the agricultural sector that are relevant to addressing the problem of heat stress. Thus, the Safety and Health in Agriculture Convention, 2001 (No. 184), and its accompanying Recommendation (No. 192) set out the fundamental principles of OSH in the agricultural sector. As a general principle, Convention No. 184 requires States to develop a “coherent national policy on safety and health in agriculture”. Such a policy should have the aim of “preventing accidents and injury to health arising out of, linked with, or occurring in the course of work, by eliminating, minimizing or controlling hazards in the agricultural working environment”. Heat is of course one of the main hazards in question.
As for preventive and protective measures, Convention No. 184 stipulates that employers have “a duty to ensure the safety and health of workers in every aspect related to the work”. Furthermore, employers should carry out “risk assessments in relation to the safety and health of workers and, on the basis of these results, adopt preventive and protective measures to ensure that … all agricultural activities [and] workplaces … are safe”. Employers are also obliged to “ensure that adequate and appropriate training and comprehensible instructions on safety and health and any necessary guidance or supervision are provided to workers in agriculture, including information on the hazards and risks associated with their work and the action to be taken for their protection, taking into account their level of education and differences in language” (Art. 7).
Convention No. 184 also strengthens the rights of agricultural workers by establishing that they are entitled “(a) to be informed and consulted on safety and health matters … (b) to participate in the application and review of safety and health measures … and (c) to remove themselves from danger resulting from their work activity when … there is an imminent and serious risk to their safety and health” (Art. 8). They should not be placed at any disadvantage as a result of these actions.
At the national level, Costa Rica has implemented “Regulations for the prevention of heat stress and the protection of workers exposed thereto”, adopted by the Occupational Health Council in 2015 under Decree No. 39147 S-TSS. These regulations require employers to provide shade, water, rest breaks and protective clothing for outdoor agricultural workers. In the United States, California has taken the pioneering step of adopting a “Heat Illness Prevention Standard” for outdoor employment in its General Industry Safety Orders, which also covers the agricultural sector. Employers are required to provide water, access to shade, emergency response plans, procedures for dealing with high heat levels, and employee and supervisor training (Cal/OSHA, 2006). The State of Washington also explicitly mentions outdoor heat exposure in its Safety Standards for Agriculture, which include provisions on the responsibilities of employers and workers, access to drinking water, how to respond to the signs and symptoms of heat-related illness, and information and training (Washington State Legislature, 2012).
The abovementioned aspects are all covered in the ILO Code of practice on safety and health in agriculture. This Code of practice, which is meant to complement the above international labour standards, contains detailed practical guidance on managing and preventing heat stress, and includes advice for employers on a range of matters such as providing shaded rest areas, drinking water, protective clothing, and mechanical aids to reduce workloads and physical stress during spells of high temperature, in addition to ensuring adequate supervision so that workers can be withdrawn from hot conditions if heat stress symptoms occur. Moreover, employers are recommended to “prohibit alcohol consumption during work and breaks, since alcohol consumption inhibits cognitive judgement and muscle coordination, dehydrating the body and making it more susceptible to heat stress” (ILO, 2010).
Working on a warmer planet: The impact of heat stress on labour productivity and decent work82
8.5 The role of social dialogueTogether with the government, both workers’ and employers’ organizations must be involved in the design and implementation of climate change mitigation and adaptation policies, as emphasized in the ILO Guidelines for a just transition. Workers and employers are best placed to implement adaptation policies and take appropriate action at the workplace, such as ensuring compliance with health and safety standards, and finding practical solutions so that workers can cope with high temperatures and humidity, and continue to do their jobs (TUC, 2009).
As higher temperatures begin to have an increasing impact on working conditions, it is important carefully to reconsider indoor and outdoor working methods, working hours, dress codes, uniforms and equipment, shifts and breaks, and other issues. Social dialogue can play a crucial role in reaching consensus on adequate solutions.
Through social dialogue and collective bargaining agreements, employers’ and workers’ organizations can develop and implement detailed policies for dealing with heat stress at the workplace that are tailored to the needs and realities of individual businesses. For example, in Canada, employers and workers frequently make use of threshold values of the “Humidex” index14 to trigger implementation of hot weather plans at workplaces. Thus, in one Canadian collective agreement, the company and the union agree that on any shift, when the Humidex reading equals or exceeds 39°C, workers may choose either to be paid an additional 25 per cent of their regular hourly rate for the shift or to be excused from the shift.15
Social dialogue is also crucial to the development of national OSH policies, which should be drawn up in consultation with the most representative organizations of employers and workers. The implementing infrastructure for national OSH policies should be established, maintained, progressively developed and periodically reviewed in consultation with those organizations (ILO, 2017f).
In addition, social dialogue can help to make climate change governance more labour-friendly by promoting policies that take account of both environmental and labour concerns (ILO, 2018b). The goal of reducing GHG emissions is compatible with efforts to reduce the negative impact of heat stress on the labour force.
14. Humidex is an index number used by Canadian meteorologists to measure how hot the weather feels to the average person; it combines the effects of heat and humidity. Other indices have been developed elsewhere and they are all accompanied by an interpretation scale to assist in identifying safe heat levels at the workplace.
15. See Articles 3.01–3.02 of the Letter of Understanding included in the Collective Agreement between Riverside Brass and Aluminum Foundry Limited and United Steel, Paper and Forestry, Rubber, Manufacturing, Energy, Allied Industrial and Service Workers International Union, Local 838-04 (2014–2017). Available at: https://www.sdc.gov.on.ca/sites/mol/drs/ca/Manufacturing%20%20Fabrication%20and%20Machinery/331-22116-17%20(295-0015).pdf [accessed 20 Nov. 2018].
Box 8.2 (cont.)
Despite the existence of national regulations and international standards on safety and health in agricultural work, there are concerns regarding their implementation and enforcement in low- and lower-middle-income countries, where a large share of the population is employed in agriculture (Staal Wästerlund, 2018). Furthermore, many agricultural workers worldwide are self-employed or work in the informal sector, which makes the application of national OSH regulations even more challenging. Similarly, OSH regulations often do not apply to workers’ family members, including women and children, who may be helping out on the farm. A study of OSH legislation in ten selected low- and middle-income countries in Asia and Africa found that most of the countries lacked OSH regulations for the agricultural sector; where such regulations did exist, they did not address heat-related risks. The study also revealed how the “inferior” position of farm workers vis-à-vis the farm owner and the localized nature of farm activities acted as obstacles to labour inspections, making it more difficult to enforce regulations, compensation and medical surveillance (Ncube and Kanda, 2018). Such limitations exacerbate the vulnerability of agricultural workers and farmers to heat-related risks, and make the improvement of OSH regulations for the agricultural sector an even more pressing task. The recently launched “HEAT-SHIELD” research programme (funded by the EU) is identifying and testing heat protection measures in agriculture, as well as in transport, construction, manufacturing and tourism.
83
9.1 Mitigation pathways and occupational heat stress
Climate change mitigation is key to preventing occupational heat stress and protecting the future labour force from heat-related risks. So far, this report has mainly discussed adaptation measures, because these are the most suitable to help protect workers in the period up to 2030 (projected temperature increases up to 2030 being a result of the GHGs already emitted). Efforts undertaken to mitigate future climate change will affect the trend in temperature increases beyond 2030. Taking such action now is a matter of urgency. A worker who is aged 20 today will keep working for another 40 to 50 years, i.e. well into the 2060s. A child born in 2019 is likely to be still alive in 2099. Climate change trends and increasing temperatures are already a concern for most families.
Mitigation is any “human intervention to reduce the sources or enhance the sinks of greenhouse gases” (IPCC, 2014b). Mitigation can be achieved through a variety of means, including decarbonization of the energy sector, electrification of transport, promotion of sustainable agriculture, reforestation and afforestation, and investment in carbon capture and storage technologies. By reducing the emission and accumulation of GHGs, mitigation measures can slow down anthropogenic climate change and, consequently, reduce the risk of occupational heat stress in the future. Mitigation also lessens the need for adaptation measures. The changes required to achieve mitigation will involve the reduction of certain jobs, but other job opportunities will emerge at the same time. These changes should be informed by the ILO Guidelines for a just transition.
The level of mitigation efforts undertaken will affect temperature increases (ibid.). In order to ensure a future with low temperature increases, swift and comprehensive action is required (IPCC, 2018). Delayed action or taking no action at all would lead to catastrophic impacts (IPCC, 2014b). If there is minimal or no mitigation action, the adverse impacts of heat stress on labour productivity will worsen with time. As can be seen from table 2.1 in Chapter 2, the average increases in temperature under RCP2.6 and RCP6.0 do not differ significantly until 2030. For most of the subregions, however, the average temperature rise by the end of the century under the RCP6.0 scenario (with 2.7°C global warming) is more than double that under the RCP2.6 scenario (1.5°C global warming). This implies that the future impacts of climate change, including effects on working conditions and productivity, will very much depend on the level of mitigation efforts undertaken here and now.
Previous chapters of the report discussed the impact of heat stress on labour productivity until 2030 on the basis of the RCP2.6 pathway, since temperature increases under the RCP2.6 and RCP6.0 scenarios do not differ significantly before 2030. Projections of the impact of heat stress on labour productivity beyond 2030 depend very much on the climate change scenario chosen for the analysis. In our projections for the percentage of working hours lost at the country level, however, we have kept 2030 as the cut-off year because estimations of employment data reflecting the future sectoral structure of economies beyond 2030 would be too uncertain.
9. Employment and labour market policiesPart II. Complementary mitigation efforts to reduce heat-related hazards
Working on a warmer planet: The impact of heat stress on labour productivity and decent work84
9.2 Long-term projections of the impact of heat stress
As explained in Chapter 2, the percentage of working hours lost to heat stress in a small geographical area, or “grid cell” in our methodology, is a function of temperature, work intensity, the type of work carried out and employment in each grid cell. By using climate-modelling projections we can extend our analysis to 2099, which makes it possible to estimate productivity losses at the level of individual workers over a longer period and to compare the impact of heat stress on labour productivity under different mitigation scenarios. In this section we present estimates for the two climate change path-ways, RCP2.6 and RCP6.0, which respectively predict temperature increases of 1.5°C and 2.7°C above pre-industrial levels by the end of the century. The RCP2.6 scenario entails vigorous climate action being taken today to decarbonize the economy and enhance carbon sinks, thereby limiting global warming to 1.5°C and effectively mitigating future climate change. The RCP6.0 scenario also involves mitigation, but of a weaker sort, so that global warming is limited only to 2.7°C. As noted by the IPCC (2018), moving from a 1.5°C global warming pathway to a 2°C pathway would be sufficient to bring about substantial negative effects on the environment, economies and societies. A business-as-usual scenario (e.g. RCP8.5) would lead to even higher temperatures and, consequently, a higher incidence of heat stress.
Figure 9.1 illustrates the different trends in the impact of heat stress on labour productivity in the country most affected in each of the five world regions: Ghana (Africa), Cambodia (Asia and the Pacific), Panama (Americas), Qatar (Arab States) and Spain (Europe and Central Asia). As the differences in the vertical-axis scales for the various panels make clear, countries in Africa and in Asia and the Pacific are likely to be affected by heat stress to a significantly greater extent than countries in other regions under the less ambitious mitigation scenario (RCP6.0).
Figure 9.1 compares the percentages of working hours lost to heat stress in 1995 and projections for 2025, 2055 and 2085 at the level of individual workers under the climate change pathways RCP2.6 and RCP6.0. Up to 2025, the productivity losses in all five regions are relatively similar for the two pathways, but by 2085 the productivity loss under the RCP6.0 pathway is often double the loss under the RCP2.6 pathway. This is in line with the changes in average global temperature envisaged under the two pathways: namely, a 1.5°C increase under RCP2.6 and a 2.7°C increase under RCP6.0. The significantly different projections under the two scenarios reflect the quite different climate futures that are possible. Which one comes to pass ultimately depends on the level of GHG emissions in the years from 2025 onwards.
As can be seen in figure 9.1, the difference in the labour productivity losses due to heat stress pre-dicted under the two climate change pathways increases as we approach the end of the century. This trend is observed at all three work intensities (i.e. for all four main employment sectors) in all five countries. The magnitude of the difference is significant. For example, in Ghana, by 2025, an outdoor construction or agricultural worker would, on average, lose 11 per cent of her/his working hours as a result of heat stress under both pathways. By 2085, however, the same worker would, on average, lose 12 per cent of her/his working hours under RCP2.6 and up to some 21 per cent under RCP6.0.
Workers employed in sectors that involve less physical effort, such as industry and services, would also suffer significantly more under the RCP6.0 pathway than under the RCP2.6 pathway. For Ghana, the productivity loss increases from 5.6 to 12.4 per cent for an industrial worker, and from 0.8 to 3.3 per cent for a service worker. This implies that the delay or lack of mitigation action at the global level would lead to substantial heat stress impacts in Ghana and other countries in sub-Saharan Africa. Hence, the additional impact expected in the absence of proper mitigation efforts could be significant regardless of any structural changes, because workers in industry and the service sector would also be affected.
Similar trends can be observed for Cambodia, Panama and Qatar (see figure 9.1). The productivity loss due to heat stress in all work categories increases substantially under RCP6.0 compared with RCP2.6 in these countries. In Cambodia, where workers in the agricultural and construction sectors are already vulnerable to heat stress, the impact on labour productivity would increase from 13.9 per cent of working hours lost in 2085 under RCP2.6 to 21.5 per cent under RCP6.0. Failure to keep the global average temperature rise below 2.7°C would exacerbate the impact of heat stress further. In Spain, even though the impact is lower compared with the other four countries, the less ambitious mitigation pathway would also result in more working hours being lost for workers in all categories.
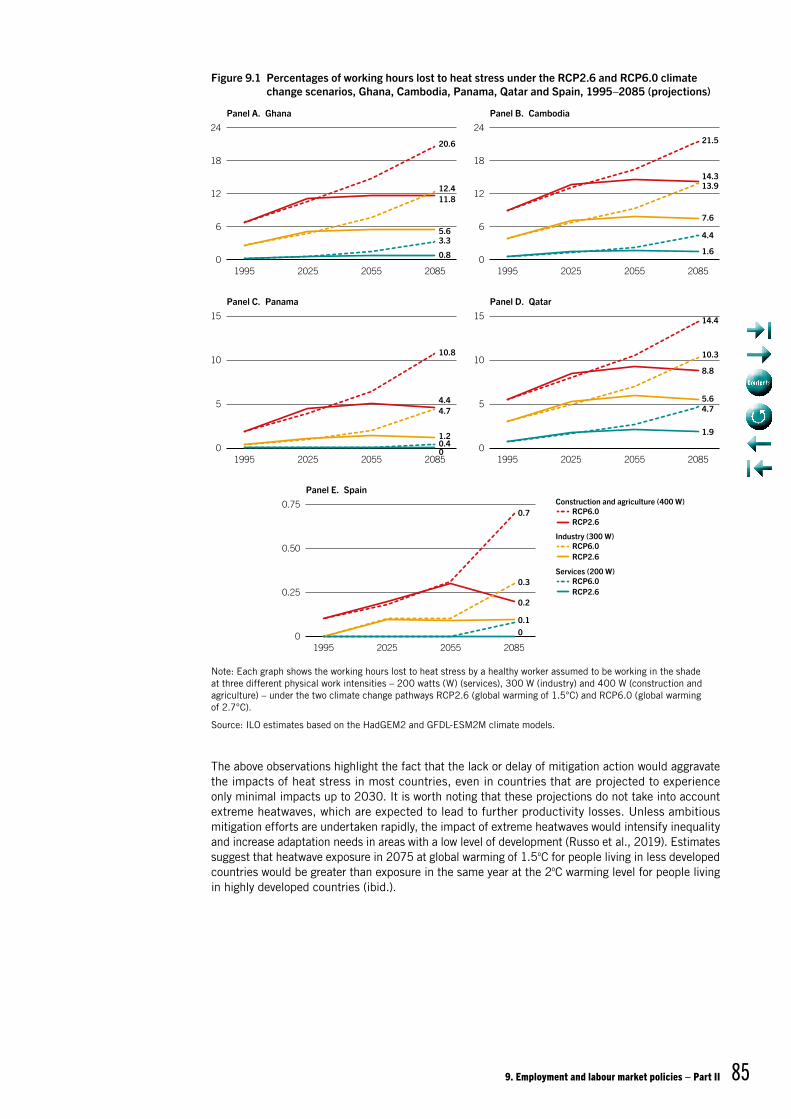
9. Employment and labour market policies – Part II 85
The above observations highlight the fact that the lack or delay of mitigation action would aggravate the impacts of heat stress in most countries, even in countries that are projected to experience only minimal impacts up to 2030. It is worth noting that these projections do not take into account extreme heatwaves, which are expected to lead to further productivity losses. Unless ambitious mitigation efforts are undertaken rapidly, the impact of extreme heatwaves would intensify inequality and increase adaptation needs in areas with a low level of development (Russo et al., 2019). Estimates suggest that heatwave exposure in 2075 at global warming of 1.5oC for people living in less developed countries would be greater than exposure in the same year at the 2oC warming level for people living in highly developed countries (ibid.).
Note: Each graph shows the working hours lost to heat stress by a healthy worker assumed to be working in the shade at three different physical work intensities – 200 watts (W) (services), 300 W (industry) and 400 W (construction and agriculture) – under the two climate change pathways RCP2.6 (global warming of 1.5°C) and RCP6.0 (global warming of 2.7°C).
Source: ILO estimates based on the HadGEM2 and GFDL-ESM2M climate models.
Figure 9.1 Percentages of working hours lost to heat stress under the RCP2.6 and RCP6.0 climate change scenarios, Ghana, Cambodia, Panama, Qatar and Spain, 1995–2085 (projections)
1995 2055 20852025
Panel E. Spain
0
0.25
0.50
0.75
1995 2055 20852025
Panel A. Ghana
0
6
12
18
24
1995 2055 20852025
Panel B. Cambodia
0
6
12
18
24
1995 2055 20852025
Panel C. Panama
0
5
10
15
1995 2055 20852025
Panel D. Qatar
0
5
10
15
RCP6.0RCP2.6
Construction and agriculture (400 W)
RCP6.0RCP2.6
Services (200 W)
RCP6.0RCP2.6
Industry (300 W)
20.6
12.411.8
5.63.3
0.8
10.8
4.44.7
1.20.40
0
0.7
0.3
0.2
0.1
14.4
10.3
8.8
5.64.7
1.9
14.3
7.6
1.6
21.5
13.9
4.4
Working on a warmer planet: The impact of heat stress on labour productivity and decent work86
9.3 Employment opportunities resulting from mitigation efforts
In addition to improving work capacity and working conditions through the reduction of climate change impacts, mitigation also creates jobs. Advancing towards a green economy can create a net employment gain at the global level (ILO, 2018b). This transition involves structural changes in a variety of sectors, including energy, transport, agriculture and construction.
Taking measures in the energy sector to limit global warming by the end of the century to 2°C above pre-industrial levels could generate a net total of around 18 million new jobs worldwide by 2030, resulting specifically from the creation of 24 million new jobs and the loss of around 6 million existing jobs (ibid.). These estimates assume a combination of changes, including a shift towards renewable energy sources and greater energy efficiency, and the widespread adoption of electric vehicles. Because such changes create new jobs, reallocate jobs, and also destroy existing jobs in certain sec-tors, policy interventions by governments are required to ensure that the transition is just (ibid.). To leverage the employment opportunities of climate action, complementary policies should be adopted in such areas as industrial development, skills development, social dialogue and social protection. Such policies would create employment opportunities and corresponding value chains in sectors such as sustainable energy, while also protecting those workers who are expected to lose out as a result of the “green transition” (ibid.).
Employment policies can actively support labour supply and labour demand in sectors of the economy that contribute to climate change mitigation. On the supply side, skills development policies and vocational education and training systems geared towards green industries would facilitate mitigation activities. On the demand side, policies to encourage the development of green businesses would promote expansion of the mitigation industry and stimulate labour demand (ibid.). Social protection policies facilitate labour market adjustments, while public employment programmes can create jobs for those outside or at the margins of the labour force, specifically in activities that contribute to climate change mitigation, such as afforestation and reforestation, carbon sequestration and soil management (ibid.).
In view of the job creation potential of mitigation measures, delaying or taking no action to reduce GHG emissions and their accumulation would result in additional opportunity costs for economies and societies. Delaying the implementation of further mitigation efforts to cover the years beyond 2030 would make it more difficult to achieve the longer-term transition towards low GHG emission levels; it would also narrow the range of options available for limiting global warming to 1.5°C above pre-industrial levels (IPCC, 2018).
87
ConclusionThis report has examined the extent to which heat stress affects labour productivity, measured in terms of working hours, in virtually every country in the world. Globally, an estimated 1.4 per cent of total working hours were lost in 1995 owing to heat stress, representing around 35 million full-time jobs worldwide. As a result of the temperature increases caused by climate change, it is projected that the percentage of total working hours lost will rise to 2.2 per cent in 2030 – a productivity loss equivalent to 80 million full-time jobs. Of the 20 subregions analysed, four are particularly vulnerable and are expected to suffer losses close to or above 3 per cent in 2030: Southern Asia, Western Africa, South-East Asia and Central Africa. By contrast, North America and all the subregions of Europe are not significantly affected by heat stress. The difference in productivity losses between the subregions most affected by heat stress and those affected to a lesser extent is even greater if one considers in-sun temperatures. Action taken today to limit global warming by the end of the century to 1.5°C (the RCP2.6 climate change pathway), or at least to 2.7°C (the RCP6.0 pathway), will determine the extent of future labour productivity losses. The sectoral composition of employment – in particular, the shares of agriculture and construction in total employment – also has a strong influence on the extent of productivity losses due to heat stress.
Areas with high vulnerability to heat stress tend also to be characterized by a lack of decent work. Thus, working poverty rates in Central Africa, Western Africa, Southern Asia and South-East Asia – the four subregions most affected by productivity losses due to heat stress – were, respectively, around 50, 40, 15 and 5 per cent in 2015. Heat stress is more common in agriculture and construction because of the physical nature of the work and also because it is usually carried out outdoors. These two sectors also tend to have higher levels of informality, which means that agricultural and construction workers are less likely to have access to health care and other forms of social protection against workplace accidents and injuries, including those produced by heat stress. Moreover, heat stress can act as a push factor for migration, prompting people to leave rural areas in quest of better prospects in their countries’ cities or abroad. The impact of heat stress could also exacerbate existing gender inequalities in the world of work, notably by worsening the working conditions of the many women employed in subsistence agriculture, and of men on construction sites. In sub-Saharan Africa, agriculture employs 12.2 million women, who make up 50.2 per cent of total employment in that sector, while men make up over 80 per cent of total employment in the construction sector (ILO, 2018c).
Efforts to limit global warming can help significantly to prevent further increases in heat stress levels. Since projected temperature increases up to 2030 depend largely on the accumulation of past GHG emissions, the world of work is already having to adapt to heat stress. The challenges identified in this report point to the urgent need to understand better how such adaptation might be achieved. In particular, focusing on vulnerable groups of workers and on the countries most affected by heat stress would help to identify specific priority actions that should be undertaken by governments and by employers’ and workers’ organizations.
The following policy areas and institutional arrangements are particularly important when seeking to tackle the challenges faced by the world of work as a result of heat stress:
y Countries should consider ratifying and implementing relevant international labour standards in order to ensure decent working conditions for workers and businesses affected by heat stress;
y Governments should adopt regulations laying down maximum temperatures to which workers may be exposed at work, and provide for specific measures to protect workers from high temperatures;
y Infrastructure-related measures, such as building standards, should be adopted to enhance the protection of indoor workers;
y The fact that heat stress is a driver of migration needs to be recognized in regulatory frameworks established to ensure safe migration;
y Social protection systems, including the provision of social insurance and social assistance, can help workers and their families (particularly in developing countries) to adapt to the consequences of heat stress;
y Whether at the level of individual companies, economic sectors or the country as a whole, social dialogue, as a key part of the institutional framework for policy-making and policy implementation, can ensure that the impact of heat stress on working conditions is addressed effectively.
89
This appendix explains the methodology used to estimate the percentage of potential working hours lost owing to the impact of heat stress on work intensity, in the absence of any other adaptation measure. Table 2.2 in Chapter 2 presented a summary of the seven steps performed to derive such estimates; these steps are described in detail below.
Step 1. Selection of climate data
In order to analyse global temperature change, climate models typically divide the world into small geographical areas. A standard approach is to designate land areas using grid cells with a spatial resolution of 0.5° latitude × 0.5° longitude, or 50 km × 50 km, at the equator, and of around 25 km × 50 km in the northern and southern parts of the world (at 45° latitude). For each grid cell, climate variables, such as temperature and humidity, are estimated using climate models. This yields approximately 67,420 grid cells filled with climate data that serve as the basis for the analysis of current and future climate change.
Thirty-year averages of climate variables are used because the climate science community regards 30 years as the minimum time interval over which a long-term climate trend, as opposed to weather or extreme events, can be demonstrated (WMO, 2018).
On the basis of climate data collected from the 1980s onwards, we made projections into the long-term future, up to 2099. The average state of the climate was calculated for 1995, 2025, 2055 and 2085, which are the midpoints of successive 30-year periods (except for the last of these periods, which spans 29 years). For example, the projected climate data for 2085 draw on the average pro-jected temperatures and humidity for each grid cell between 2071 and 2099. Historical climate data for the period 1980–2009 (midpoint 1995) were used as the baseline.
For projections of climate variables, the IPCC has drawn on 25 different models for its most recent assessments (IPCC, 2013, 2014a and 2014b). Out of these we selected two models providing high- and low-end climate projections.1 The average of the two models was used to avoid having to calculate the impact of heat stress under all the various climate change scenarios that have been proposed. This average is very close to the average of the 25 IPCC models (“ensemble mean”) that is used in estimates of global temperature change.
With regard to the impact of climate change policy, we made use of two scenarios for future GHG emissions called RCPs (Warszawski et al., 2014). The RCP2.6 scenario envisages a mean global temperature increase of 1.5°C by the end of the century and is used in this report as the scenario representative of strong climate action following the conclusion of the Paris Agreement in 2015. The RCP6.0 scenario also envisages the implementation of proposed climate change policies, but it predicts a mean global temperature increase of 2.7°C by the end of the century. The projected temperature changes are very similar under both RCPs for the short period up to 2030 (an increase of approximately 1.3°C in each case); it is thereafter that stark differences appear.
1. The two models in question are HadGEM2-ES, whose name is based on that of the Met Office Hadley Centre for Climate Science and Services in Reading, United Kingdom (Martin et al., 2011), and GFDL-ESM2M, whose name is based on that of the Geophysical Fluid Dynamics Laboratory in Princeton, New Jersey, United States (Dunne et al., 2012 and 2013).
Appendix IDetailed methodology
Working on a warmer planet: The impact of heat stress on labour productivity and decent work90
Step 2. Derivation of monthly heat stress index (WBGT) for each small geographical area
In determining the heat-related health risks for workers we took note of the ILO’s Occupational Safety and Health Recommendation, 1981 (No. 164), which recommends that measures should be taken, inter alia, in the fields of “temperature, humidity and movement of air in the workplace”.
In order to calculate the health risks of heat stress we used one of the most common heat stress indices in occupational health, namely the wet bulb globe temperature (WBGT), which is measured in degrees Celsius. The WBGT was specifically designed for work activity assessments and is calculated on the basis of temperature (°C), humidity (dew point in °C), air movement (wind speed) and radiated heat (primarily from the sun) (Parsons, 2014). We calculate the daily distributions of WBGT (maximum and mean) for the projected data.
Step 3. Estimation of hourly WBGT distributions
We used data on temperature and humidity from the climate models to calculate monthly mean tem-perature and WBGT, and also the monthly average of the daily maximum temperature and WBGT. These values were used to estimate the typical hourly distribution of heat levels in each grid cell from 6 a.m. to 6 p.m. by applying the “4+4+4 method”. In this method, heat levels during 4 hours per day are assumed to be close to the maximum WBGT value, and heat levels during 4 hours per day to be close to the mean WBGT value (early morning and early evening); heat levels during the remaining 4 hours of a day with 12 hours of daylight are assumed to lie halfway between the mean WBGT and the maximum WBGT.
We assumed air movement over the skin of 1 metre per second (the speed at which arms or legs move when working), and also that work is carried out in the shade or indoors without air conditioning. The reason why we assumed agricultural and construction work to be carried out in the shade is that, in our view, work in the sun becomes increasingly impossible and that, as a minimum, workers in these sectors will adapt by avoiding full sun exposure as much as possible. In addition, a comparison of the number of sunny or cloudy days during the hottest months in tropical countries reveals that around 40 per cent of days are cloudy rather than sunny. It is possible to adjust for work in the sun by adding 2°C to the in-shade WBGT. For a comparison between in-sun and in-shade estimations, see Appendix II.
Step 4. Estimation of employment data for each small geographical area by applying national estimates of employment-to-population ratios for employment sectors to population data for that area
We used population data from Columbia University’s Gridded Population of the World data set,2 which is based on United Nations population estimates and on assessments of age distribution from the International Institute for Applied Systems Analysis (Lutz, Butz and KC, 2014). These data were grouped into grid cells sized 0.5° x 0.5° (approximately 50 km x 50 km at the equator) to match the climate data grid. (The population of grid cells straddling two or more countries was calculated on the basis of the land area occupied by each country within the cell.) Thus, for each country and year in our analysis we used internationally accepted estimates of population sizes.
The data on employment-to-population ratios for agriculture, construction, industry and services at the national and subregional levels came from the ILOSTAT database.
The national estimates of employment-to-population ratios (ages 15 and older) were then applied to the population data (ages 15 and older) for each grid cell pertaining to the country being analysed.
Step 5. Derivation of relationship between heat exposure and physiological response
In addition to the WBGT, which is a purely exogenous variable of temperature, humidity, wind speed and solar radiation given by the natural environment, heat stress for workers can also be determined in terms of the level of physical work intensity. In order to derive approximate exposure–response relationships between heat stress and labour, we combined epidemiological data (Wyndham, 1969; Sahu, Sett and Kjellstrom, 2013) with recommendations from the International Organization for Standardization (ISO) related to the ergonomics of the thermal environment and occupational health.
Earlier analyses drew only on the ISO 7243:1989 standard (ISO, 1989), which indicates work inten-sity levels (metabolic rate) that should be avoided at different WBGT levels so that core body tem-perature does not increase above 38°C, and to prevent clinical health effects at higher temperature
2. See http://sedac.ciesin.columbia.edu/.
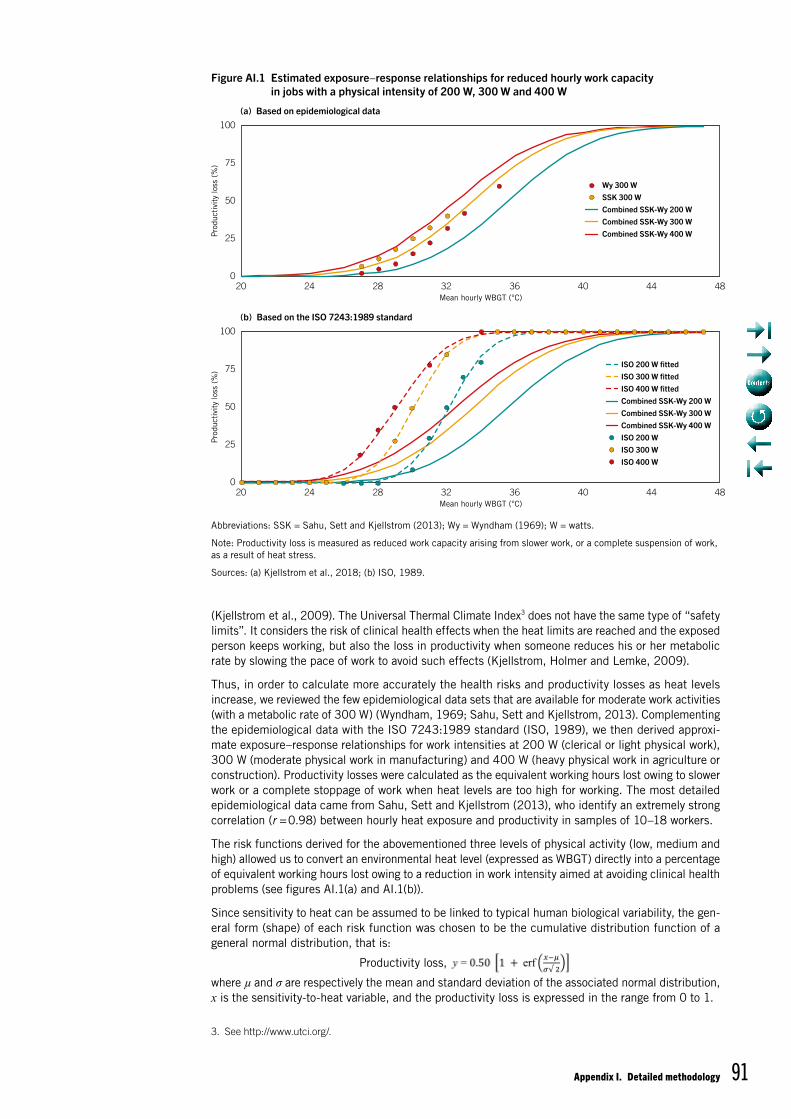
Appendix I. Detailed methodology 91
(Kjellstrom et al., 2009). The Universal Thermal Climate Index3 does not have the same type of “safety limits”. It considers the risk of clinical health effects when the heat limits are reached and the exposed person keeps working, but also the loss in productivity when someone reduces his or her metabolic rate by slowing the pace of work to avoid such effects (Kjellstrom, Holmer and Lemke, 2009).
Thus, in order to calculate more accurately the health risks and productivity losses as heat levels increase, we reviewed the few epidemiological data sets that are available for moderate work activities (with a metabolic rate of 300 W) (Wyndham, 1969; Sahu, Sett and Kjellstrom, 2013). Complementing the epidemiological data with the ISO 7243:1989 standard (ISO, 1989), we then derived approxi-mate exposure–response relationships for work intensities at 200 W (clerical or light physical work), 300 W (moderate physical work in manufacturing) and 400 W (heavy physical work in agriculture or construction). Productivity losses were calculated as the equivalent working hours lost owing to slower work or a complete stoppage of work when heat levels are too high for working. The most detailed epidemiological data came from Sahu, Sett and Kjellstrom (2013), who identify an extremely strong correlation (r = 0.98) between hourly heat exposure and productivity in samples of 10–18 workers.
The risk functions derived for the abovementioned three levels of physical activity (low, medium and high) allowed us to convert an environmental heat level (expressed as WBGT) directly into a percentage of equivalent working hours lost owing to a reduction in work intensity aimed at avoiding clinical health problems (see figures AI.1(a) and AI.1(b)).
Since sensitivity to heat can be assumed to be linked to typical human biological variability, the gen-eral form (shape) of each risk function was chosen to be the cumulative distribution function of a general normal distribution, that is:
Productivity loss,
where µ and σ are respectively the mean and standard deviation of the associated normal distribution, x is the sensitivity-to-heat variable, and the productivity loss is expressed in the range from 0 to 1.
3. See http://www.utci.org/.
Abbreviations: SSK = Sahu, Sett and Kjellstrom (2013); Wy = Wyndham (1969); W = watts.
Note: Productivity loss is measured as reduced work capacity arising from slower work, or a complete suspension of work, as a result of heat stress.
Sources: (a) Kjellstrom et al., 2018; (b) ISO, 1989.
Figure AI.1 Estimated exposure–response relationships for reduced hourly work capacity in jobs with a physical intensity of 200 W, 300 W and 400 W
25
50
75
020 24 28
Mean hourly WBGT (°C)
Pro
duct
ivit
y lo
ss (
%)
32 36 40 44 48
100
(a) Based on epidemiological data
25
50
75
0
Mean hourly WBGT (°C)
Pro
duct
ivit
y lo
ss (
%)
100
(b) Based on the ISO 7243:1989 standard
20 24 28 32 36 40 44 48
Wy 300 WSSK 300 WCombined SSK-Wy 200 WCombined SSK-Wy 300 WCombined SSK-Wy 400 W
ISO 200 W fittedISO 300 W fittedISO 400 W fittedCombined SSK-Wy 200 WCombined SSK-Wy 300 WCombined SSK-Wy 400 WISO 200 W
ISO 400 WISO 300 W
J
J J J
J
J
J
J
J
J
J
J
J
J
JJ
JJJ
J
J
J
J
J
J
J
J
JJ
JJ
J
J J J J J J
J
J
J
J J J J J J J J J J J J J
Working on a warmer planet: The impact of heat stress on labour productivity and decent work92
The abovementioned risk functions were fitted to the two data sets available: the epidemiological data (300 W) and the ISO data (1989) (200 W, 300 W, 400 W). We then used the difference between the means of the three curves fitted to the ISO data to extrapolate the two risk curves (200 W and 400 W) for the epidemiological data (see figure AI.1(a) for the fitted epidemiological 300 W and synthesized 200 W and 400 W risk curves, and figure AI.1(b) for the fitted ISO 200 W, 300 W, 400 W risk curves).
Figure AI.1(a) shows the fitted curve for a work intensity of 300 W overlaid with the data points from the two epidemiological studies (Wyndham, 1969; Sahu, Sett and Kjellstrom, 2013) combined, together with the 200 W and 400 W curves synthesized from the fitted 300 W function and the difference between the means of the fitted ISO 200 W, 300 W and 400 W curves.
The curve fitted to the data from the two epidemiological studies (figure AI.1(a)) indicates that up to around 24–26°C workers do not slow down or suffer a loss of work capacity. However, above that WBGT level, workers slow down and reduce their hourly output rapidly, with the productivity loss increasing exponentially up to around 33–34°C, at which level 50 per cent of work capacity is lost for a worker working at a physical intensity of 300 W. This means that at a temperature of 33–34°C, the worker produces only half as much in an hour as he or she would have produced in the absence of heat stress, resulting in the equivalent of half a working hour lost. At a WBGT above 38°C, work starts to become impossible if no adaptation measure (e.g. air conditioning) is applied, and the heat level may eventually even result in heatstroke or death of the worker. If such extreme heat is due to the work being carried out in the sun, moving into the shade is a simple way of reducing heat stress.
Step 6. Calculation of working hours lost per worker for each level of physical intensity in each small geographical area
Using the hourly distribution of WBGT during each day of the year and the exposure–response rela-tionships for each level of physical intensity derived in step 5, we calculated the number of potential working hours lost for each small geographical area during daylight. The number of working hours lost per worker is thus based on the number of potential working hours lost during daylight work (all work is assumed to take place during the hours of daylight). In any given year there are 4,320 potential daylight working hours, and we estimate each country’s loss of working hours due to heat stress as the percentage of potential hours of work lost relative to potential hours of work during daylight.
A particular feature of the human body, which needs to be taken into account, is that it takes at least 6 minutes before the core body temperature reaches an intolerable 39°C. Thus, no matter what the conditions, some work is always possible. Accordingly, we assumed that above 39°C only 90 per cent of work time is lost, since for 10 per cent of the time (i.e. 6 minutes out of 60) work can still be performed. Also, when working continuously, it is necessary to take “mini-breaks” to stretch, go to the toilet, or simply relax. In our analysis we therefore assumed that 10 per cent of work time is used for breaks.
Step 7. Calculation of total working hours lost by country and subregion
We combined the results obtained in step 6 with data on the employment-to-population ratios (ages 15 and older) for agriculture (work intensity level: 400 W), construction (400 W), industry (300 W) and services (200 W). We then calculated how many potential working hours would be lost owing to heat for each of the 67,420 small geographical areas (grid cells). The total loss of working hours in a particular country or subregion was calculated by adding up all the grid cells in that country or subregion.
Given the large populations of several subregions and because the calculated percentages of hot days at a very hot level are based on mathematical functions, relatively large values of working hours lost can result from these calculations. To avoid overestimating the hours lost to heat stress, we trimmed the mathematical functions at 1 per cent, thereby obtaining conservative estimates, which are more appropriate for temperate regions in particular.
Because of uncertainties in all the projections for future climate trends, population trends and adap-tation possibilities, in addition to uncertainties in the distribution of individual heat sensitivity, it was not possible to compute precise confidence intervals for the outcome variables. We used the range of estimates of heat level change in different climate models (lowest to highest temperature estimates) as an indicator of uncertainty.
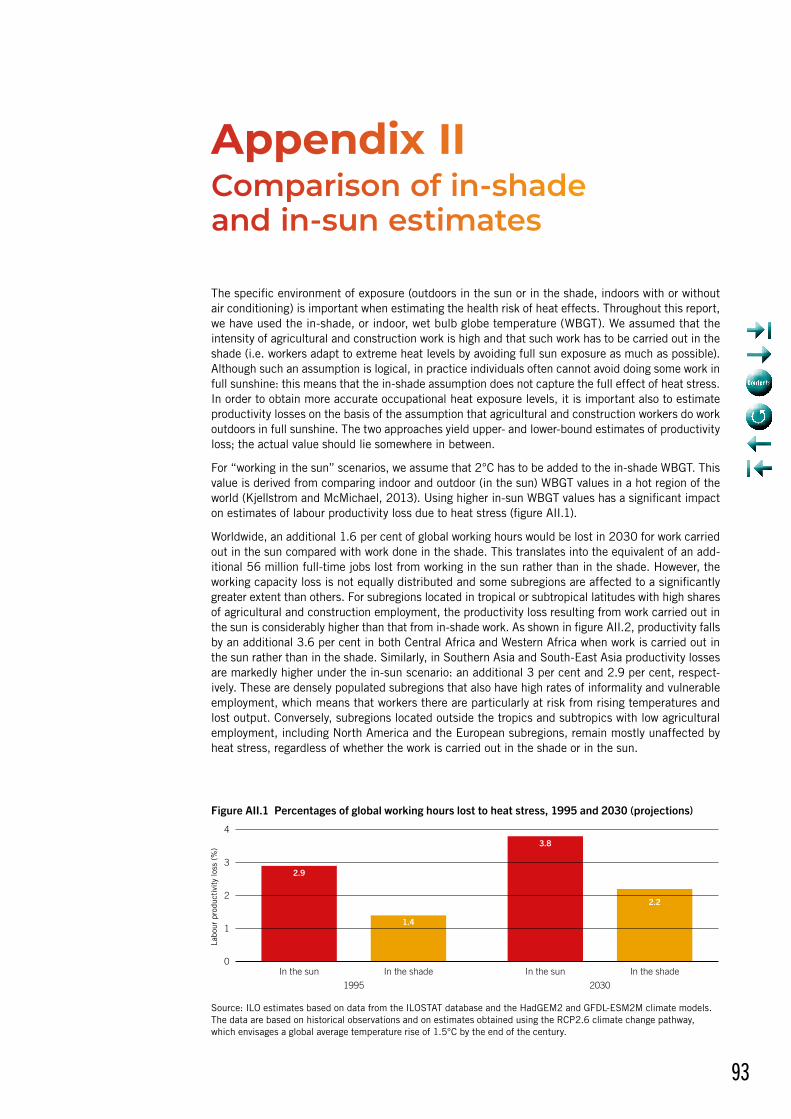
93
The specific environment of exposure (outdoors in the sun or in the shade, indoors with or without air conditioning) is important when estimating the health risk of heat effects. Throughout this report, we have used the in-shade, or indoor, wet bulb globe temperature (WBGT). We assumed that the intensity of agricultural and construction work is high and that such work has to be carried out in the shade (i.e. workers adapt to extreme heat levels by avoiding full sun exposure as much as possible). Although such an assumption is logical, in practice individuals often cannot avoid doing some work in full sunshine: this means that the in-shade assumption does not capture the full effect of heat stress. In order to obtain more accurate occupational heat exposure levels, it is important also to estimate productivity losses on the basis of the assumption that agricultural and construction workers do work outdoors in full sunshine. The two approaches yield upper- and lower-bound estimates of productivity loss; the actual value should lie somewhere in between.
For “working in the sun” scenarios, we assume that 2°C has to be added to the in-shade WBGT. This value is derived from comparing indoor and outdoor (in the sun) WBGT values in a hot region of the world (Kjellstrom and McMichael, 2013). Using higher in-sun WBGT values has a significant impact on estimates of labour productivity loss due to heat stress (figure AII.1).
Worldwide, an additional 1.6 per cent of global working hours would be lost in 2030 for work carried out in the sun compared with work done in the shade. This translates into the equivalent of an add-itional 56 million full-time jobs lost from working in the sun rather than in the shade. However, the working capacity loss is not equally distributed and some subregions are affected to a significantly greater extent than others. For subregions located in tropical or subtropical latitudes with high shares of agricultural and construction employment, the productivity loss resulting from work carried out in the sun is considerably higher than that from in-shade work. As shown in figure AII.2, productivity falls by an additional 3.6 per cent in both Central Africa and Western Africa when work is carried out in the sun rather than in the shade. Similarly, in Southern Asia and South-East Asia productivity losses are markedly higher under the in-sun scenario: an additional 3 per cent and 2.9 per cent, respect-ively. These are densely populated subregions that also have high rates of informality and vulnerable employment, which means that workers there are particularly at risk from rising temperatures and lost output. Conversely, subregions located outside the tropics and subtropics with low agricultural employment, including North America and the European subregions, remain mostly unaffected by heat stress, regardless of whether the work is carried out in the shade or in the sun.
Appendix IIComparison of in-shade and in-sun estimates
Source: ILO estimates based on data from the ILOSTAT database and the HadGEM2 and GFDL-ESM2M climate models. The data are based on historical observations and on estimates obtained using the RCP2.6 climate change pathway, which envisages a global average temperature rise of 1.5°C by the end of the century.
Figure AII.1 Percentages of global working hours lost to heat stress, 1995 and 2030 (projections)
Labo
ur p
rodu
ctiv
ity
loss
(%
)
In the sun In the shade
1995
In the sun In the shade
2030
2.9
1.4
3.8
2.2
0
1
2
3
4
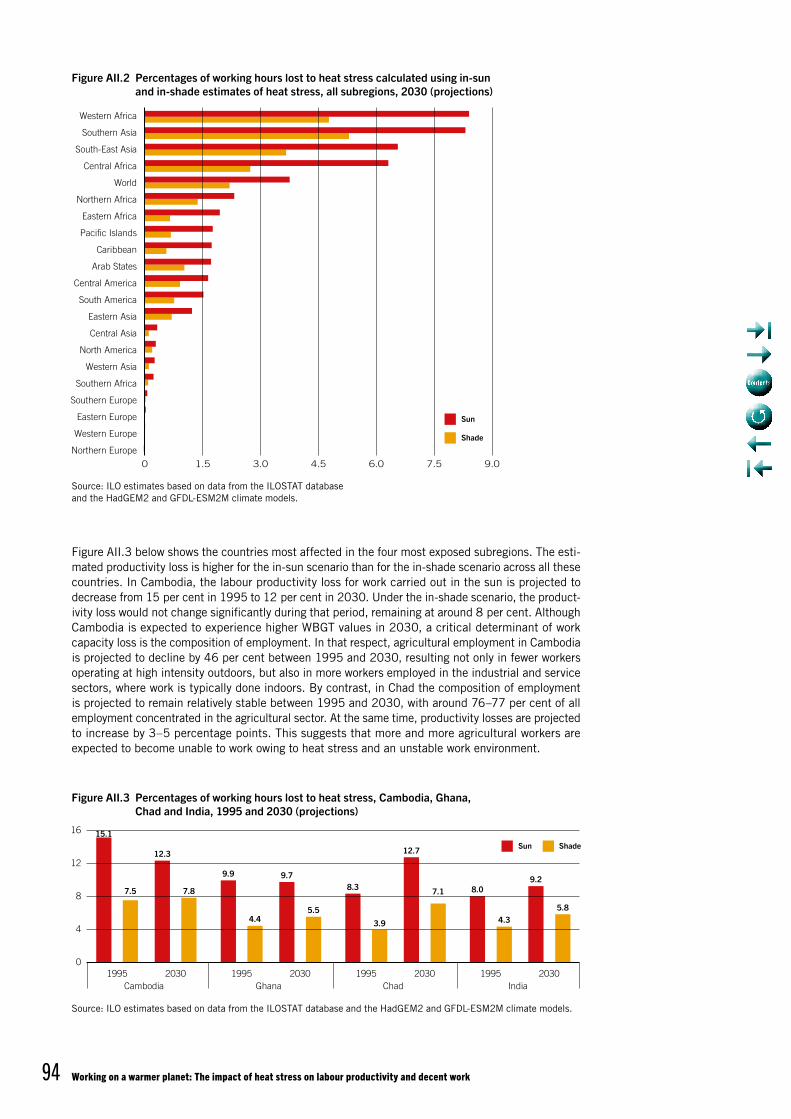
Working on a warmer planet: The impact of heat stress on labour productivity and decent work94
Figure AII.3 below shows the countries most affected in the four most exposed subregions. The esti-mated productivity loss is higher for the in-sun scenario than for the in-shade scenario across all these countries. In Cambodia, the labour productivity loss for work carried out in the sun is projected to decrease from 15 per cent in 1995 to 12 per cent in 2030. Under the in-shade scenario, the product-ivity loss would not change significantly during that period, remaining at around 8 per cent. Although Cambodia is expected to experience higher WBGT values in 2030, a critical determinant of work capacity loss is the composition of employment. In that respect, agricultural employment in Cambodia is projected to decline by 46 per cent between 1995 and 2030, resulting not only in fewer workers operating at high intensity outdoors, but also in more workers employed in the industrial and service sectors, where work is typically done indoors. By contrast, in Chad the composition of employment is projected to remain relatively stable between 1995 and 2030, with around 76–77 per cent of all employment concentrated in the agricultural sector. At the same time, productivity losses are projected to increase by 3–5 percentage points. This suggests that more and more agricultural workers are expected to become unable to work owing to heat stress and an unstable work environment.
Source: ILO estimates based on data from the ILOSTAT database and the HadGEM2 and GFDL-ESM2M climate models.
Source: ILO estimates based on data from the ILOSTAT database and the HadGEM2 and GFDL-ESM2M climate models.
Figure AII.2 Percentages of working hours lost to heat stress calculated using in-sun and in-shade estimates of heat stress, all subregions, 2030 (projections)
Figure AII.3 Percentages of working hours lost to heat stress, Cambodia, Ghana, Chad and India, 1995 and 2030 (projections)
Northern Europe
Western Europe
Eastern Europe
Southern Europe
Southern Africa
Western Asia
North America
Central Asia
Eastern Asia
South America
Central America
Arab States
Caribbean
Pacific Islands
Eastern Africa
Northern Africa
World
Central Africa
South-East Asia
Southern Asia
Western Africa
9.01.5 3.0 4.5 7.56.0
Sun
Shade
0
15.1
7.5
12.3
7.8
9.9
4.4
9.7
5.5
8.3
3.9
12.7
7.1 8.0
4.3
9.2
5.8
01995 2030 1995 2030 1995
Cambodia Ghana Chad India2030 1995 2030
4
8
12
16
Sun Shade
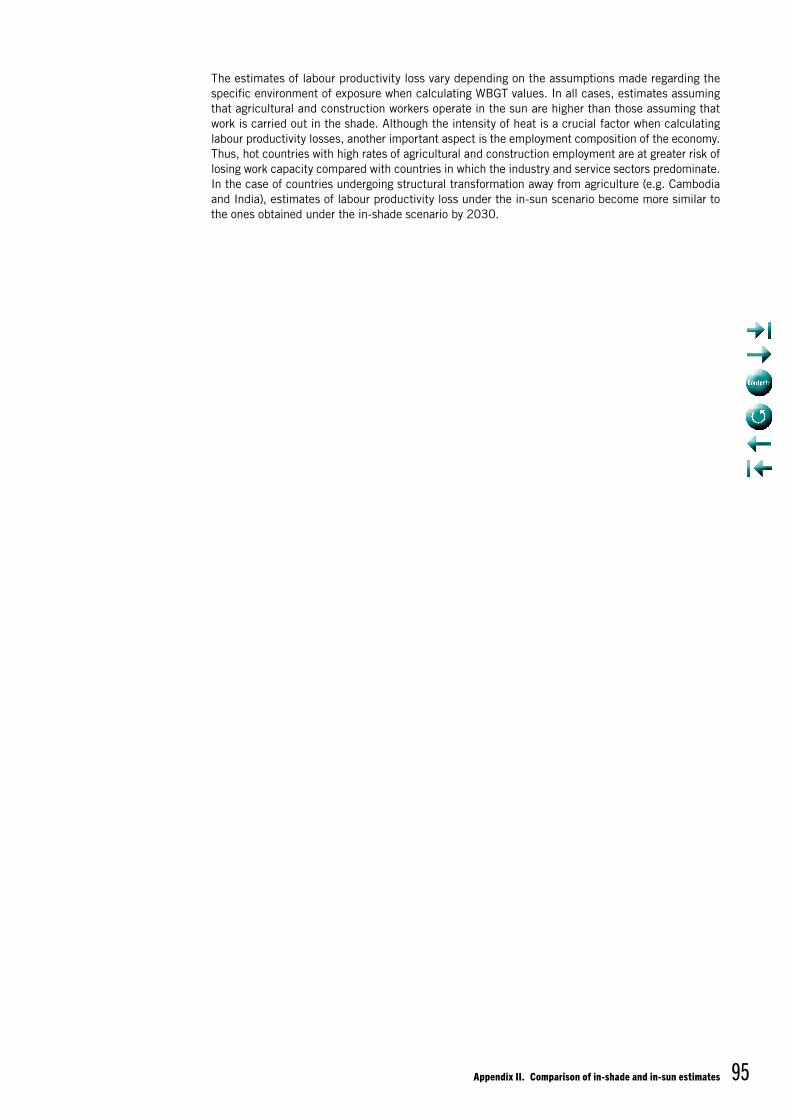
Appendix II. Comparison of in-shade and in-sun estimates 95
The estimates of labour productivity loss vary depending on the assumptions made regarding the specific environment of exposure when calculating WBGT values. In all cases, estimates assuming that agricultural and construction workers operate in the sun are higher than those assuming that work is carried out in the shade. Although the intensity of heat is a crucial factor when calculating labour productivity losses, another important aspect is the employment composition of the economy. Thus, hot countries with high rates of agricultural and construction employment are at greater risk of losing work capacity compared with countries in which the industry and service sectors predominate. In the case of countries undergoing structural transformation away from agriculture (e.g. Cambodia and India), estimates of labour productivity loss under the in-sun scenario become more similar to the ones obtained under the in-shade scenario by 2030.
97
ADB (Asian Development Bank); ILO. 2016. Bangladesh: Looking beyond garments – Employment diagnostic study (Mandaluyong City).
Azongo, D.K.; Awine, T.; Wak, G.; Binka, F.N.; Oduro, A.R. 2012. “A time series analysis of weather variability and all-cause mortality in the Kasena-Nankana districts of northern Ghana 1995 – 2010”, in Global Health Action, Vol. 5, pp. 14–22.
Barrios, S.; Bertinelli, L.; Strobl, E. 2006. “Climatic change and rural–urban migration: The case of sub-Saharan Africa”, in Journal of Urban Economics, Vol. 60, No. 3, pp. 357–371.
Beniston, M.; Stephenson, D.B.; Christensen, O.B.; Ferro, C.A.T.; Frei, C.; Goyette, S.; Halsnaes, K.; et al. 2007. “Future extreme events in European climate: An exploration of regional climate model projections”, in Climatic Change, Vol. 81, Suppl. 1, pp. 71–95.
Bernard, T.E. 1999. “Heat stress and protective clothing: An emerging approach from the United States”, in Annals of Occupational Hygiene, Vol. 43, No. 5, pp. 321–327.
Bhargava, A.; Lakmini, S.; Bhargava, S. 2017. “Urban heat island effect: Its relevance in urban planning”, in Journal of Biodiversity and Endangered Species, Vol. 5, No. 1, pp. 187–191.
Bi, P.; Williams, S.; Loughnan, M.; Lloyd, G.; Hansen, A.; Kjellstrom, T.; Dear, K.; Saniotis, A. 2011. “The effects of extreme heat on human mortality and morbidity in Australia: Implications for public health”, in Asia Pacific Journal of Public Health, Vol. 23, Suppl. 2, pp. 27S–36S.
Bohra-Mishra, P.; Oppenheimer, M.; Hsiang, S.M. 2014. “Nonlinear permanent migration response to climatic variations but minimal response to disasters”, in Proceedings of the National Academy of Sciences, Vol. 111, No. 27, pp. 9780–9785.
Burke, M.; Hsiang, S.M.; Miguel, E. 2015. “Global non-linear effect of temperature on economic production”, in Nature, Vol. 527, No. 7577, pp. 235–239.
Cai, R.; Feng, S.; Oppenheimer, M.; Pytlikova, M. 2016. “Climate variability and international migration: The importance of the agricultural linkage”, in Journal of Environmental Economics and Management, Vol. 79, pp. 135–151.
Cal/OSHA (California Division of Occupational Safety and Health). 2006. California Code of Regulations, Title 8, Section 3395 (“Heat illness prevention”).
Campese, V.M. 2016. “The Mesoamerican nephropathy: A regional epidemic of chronic kidney disease?”, in Nephrology Dialysis Transplantation, Vol. 31, No. 3, pp. 335–336.
Cattaneo, C.; Peri, G. 2016. “The migration response to increasing temperatures”, in Journal of Development Economics, Vol. 122, pp. 127–146.
Chandran, R. 2016. “Bonded laborers in India brick kilns slowly learn they have rights”. Available at: www.reuters.com [20 Nov. 2018].
City of Ballarat. 2016. Greening Ballarat: A green-blue city action plan (Ballarat).
Clemens, M.A. 2014. Does development reduce migration?, CGD Working Paper No. 359 (Washington, DC, Center for Global Development).
CNV International. 2015. Working conditions in the sugar industry in Guatemala: Field research on the situation of sugar cane cutters and transporters (Utrecht, CNV International and Central American Institute for Social Studies).
Costa, H.; Floater, G.; Hooyberghs, H.; Verbeke, S.; De Ridder, K. 2016. Climate change, heat stress and labour productivity: A cost methodology for city economies, Working Paper No. 248 (London, Grantham Research Institute on Climate Change and the Environment).
Bibliography
Working on a warmer planet: The impact of heat stress on labour productivity and decent work98
Coutts, A.M.; Beringer, J.; Tapper, N.J. 2007. “Impact of increasing urban density on local climate: Spatial and temporal variations in the surface energy balance in Melbourne, Australia”, in Journal of Applied Meteorology and Climatology, Vol. 46, No. 4, pp. 477–493.
Crocombe, N.G. 2014. “Building a new future: The 2022 FIFA World Cup as a potential catalyst for labor reform in Qatar”, in Suffolk Transnational Law Review, Vol. 37, No. 1, p. 33.
Crowe, J.; Wesseling, C.; Solano, B.R.; Umaña, M.P.; Ramírez, A.R.; Kjellstrom, T.; Morales, D.; Nilsson, M. 2013. “Heat exposure in sugarcane harvesters in Costa Rica”, in American Journal of Industrial Medicine, Vol. 56, No. 10, pp. 1157–1164.
—; Nilsson, M.; Kjellstrom, T.; Wesseling, C. 2015. “Heat-related symptoms in sugarcane harvesters”, in American Journal of Industrial Medicine, Vol. 58, No. 5, pp. 541–548.
Dao, T.M.J.; Do, A.N.; Nguyen, H.P.; Dang, T.P.; Vu, T.N.; Few, R.; Winkels, A. 2013. Heat stress and adaptive capacity of low-income outdoor workers and their families in the city of Da Nang, Vietnam (London, International Institute for Environment and Development).
Dapi, L.N.; Rocklöv, J.; Nguefack-Tsague, G.; Tetanye, E.; Kjellstrom, T. 2010. “Heat impact on schoolchildren in Cameroon, Africa: Potential health threat from climate change”, in Global Health Action, Vol. 3, No. 1.
DARA; Climate Vulnerable Forum. 2012. Climate Vulnerability Monitor, 2nd edition: A guide to the cold calculus of a hot planet (DARA).
Diboulo, E.; Sié, A.; Rocklöv, J.; Niamba, L.; Yé, M.; Bagagnan, C.; Sauerborn, R. 2012. “Weather and mortality: A 10 year retrospective analysis of the Nouna Health and Demographic Surveillance System, Burkina Faso”, in Global Health Action, Vol. 5, pp. 6–13.
Dunne, J.P.; John, J.G.; Adcroft, A.J.; Griffies, S.M.; Hallberg, R.W.; Shevliakova, E.; Stouffer, R.J.; et al. 2012. “GFDL’s ESM2 global coupled climate–carbon Earth System Models. Part I: Physical formulation and baseline simulation characteristics”, in Journal of Climate, Vol. 25, No. 19, pp. 6646–6665.
—; John, J.G.; Shevliakova, E.; Stouffer, R.J.; Krasting, J.P.; Malyshev, S.L.; Milly, P.C.D.; et al. 2013. “GFDL’s ESM2 global coupled climate–carbon Earth System Models. Part II: Carbon system formulation and baseline simulation characteristics”, in Journal of Climate, Vol. 26, No. 7, pp. 2247–2267.
Eckstein, D.; Künzel, V.; Schäfer, L. 2017. Global Climate Risk Index 2018: Who suffers most from extreme weather events? Weather-related loss events in 2016 and 1997 to 2016 (Bonn, Germanwatch).
EEA (European Environment Agency). 2012. Climate change, impacts and vulnerability in Europe 2012: An indicator-based report (Copenhagen).
Egondi, T.; Kyobutungi, C.; Kovats, S.; Muindi, K.; Ettarh, R.; Rocklöv, J. 2012. “Time-series analysis of weather and mortality patterns in Nairobi’s informal settlements”, in Global Health Action, Vol. 5, No. 1, pp. 23–32.
EHS (Princeton University Office of Environmental Health and Safety). 2018. Heat stress facts (Princeton University).
ESCWA (United Nations Economic and Social Commission for Western Asia); Arab Center for the Studies of Arid Zones and Dry Lands (ACSAD) of the League of Arab States; FAO; Deutsche Gesellschaft für Internationale Zusammenarbeit GmbH (GIZ); League of Arab States; Swedish Meteorological and Hydrological Institute (SMHI); UN Environment; UNESCO Office in Cairo; United Nations Office for Disaster Risk Reduction (UNISDR); United Nations University Institute for Water, Environment and Health (UNU-INWEH); WMO. 2017. Arab climate change assessment report (Beirut, ESCWA).
Estrada, F.; Botzen, W.J.W.; Tol, R.S.J. 2017. “A global economic assessment of city policies to reduce climate change impacts”, in Nature Climate Change, Vol. 7, No. 6, pp. 403–406.
Fahed, A.K.; Ozkaymak, M.; Ahmed, S. 2018. “Impacts of heat exposure on workers’ health and performance at steel plant in Turkey”, in Engineering Science and Technology, an International Journal, Vol. 21, No. 4, pp. 745–752.
Fleischer, N.L.; Tiesman, H.M.; Sumitani, J.; Mize, T.; Amarnath, K.K.; Bayakly, A.R.; Murphy, M.W. 2013. “Public health impact of heat-related illness among migrant farmworkers”, in American Journal of Preventive Medicine, Vol. 44, No. 3, pp. 199–206.
Flouris, A.D.; Dinas, P.C.; Ioannou, L.G.; Nybo, L.; Havenith, G.; Kenny, G.P.; Kjellstrom, T. 2018. “Workers’ health and productivity under occupational heat strain: A systematic review and meta-analysis”, in The Lancet Planetary Health, Vol. 2, No. 12, pp. e521–e531.
Bibliography 99
Gallup, J.L.; Sachs, J.D.; Mellinger, A.D. 1999. “Geography and economic development”, in International Regional Science Review, Vol. 22, No. 2, pp. 179–232.
Gedzelman, S.D.; Austin, S.; Cermak, R.; Stefano, N.; Partridge, S.; Quesenberry, S.; Robinson, D.A. 2003. “Mesoscale aspects of the urban heat island around New York City”, in Theoretical and Applied Climatology, Vol. 75, Nos 1–2, pp. 29–42.
Golbabaei, F.; Monazzam, M.R.; Aval, M.Y.; Allahyari, T.; Taban, E.; Shendi, M.R.A. 2016. “Investigation of heat stress and heat strain in outdoor workers: A case study in Iran”, in Journal of Paramedical Sciences, Vol. 7, No. 4, pp. 30–38.
Gray, C.; Wise, E. 2016. “Country-specific effects of climate variability on human migration”, in Climatic Change, Vol. 135, No. 3–4, pp. 555–568.
Haider, K.; Anis, K. 2015. “Heat wave death toll rises to 2,000 in Pakistan’s financial hub”, 24 June. Available at: www.bloomberg.com [20 Nov. 2018].
Hancock, P.A.; Ross, J.M.; Szalma, J.L. 2007. “A meta-analysis of performance response under thermal stressors”, in Human Factors, Vol. 49, No. 5, pp. 851–877.
Heidari, H.; Golbabaei, F.; Shamsipour, A.; Rahimi Forushani, A.; Gaeini, A. 2015. “Outdoor occupational environments and heat stress in Iran”, in Journal of Environmental Health Science and Engineering, Vol. 13, No. 1, pp. 48–56.
ILO (International Labour Office/Organization). 2001a. Guidelines on occupational safety and health management systems, ILO-OSH 2001 (Geneva).
—. 2001b. Ambient factors in the workplace. An ILO code of practice (Geneva).
—. 2009. General survey concerning the Occupational Safety and Health Convention, 1981 (No. 155), the Occupational Safety and Health Recommendation, 1981 (No. 164), and the Protocol of 2002 to the Occupational Safety and Health Convention, 1981, Report III (Part 1B), International Labour Conference, 98th Session, Geneva, 2009 (Geneva).
—. 2010. Code of practice on safety and health in agriculture (Geneva).
—. 2014. World Social Protection Report 2014/15: Building economic recovery, inclusive development and social justice (Geneva).
—. 2015. Guidelines for a just transition towards environmentally sustainable economies and societies for all (Geneva).
—. 2017a. World Social Protection Report 2017–19: Universal social protection to achieve the Sustainable Development Goals (Geneva).
—. 2017b. Common interests, shared goals: Promoting decent work from Asia and Africa to the Middle East, background paper to the Interregional Consultation on Labour Migration and Mobility from Asia and Africa to the Middle East, Beirut, 4–5 Oct.
—. 2017c. Addressing governance challenges in a changing labour migration landscape, Report IV, International Labour Conference, 106th Session, Geneva, 2017 (Geneva).
—. 2017d. World Employment and Social Outlook 2017: Sustainable enterprises and jobs – Formal enterprises and decent work (Geneva).
—. 2017e. Technical cooperation programme between Qatar and the ILO. Available at: https://www.ilo.org/beirut/projects/WCMS_620621/lang--en/index.htm [20 Nov. 2018].
—. 2017f. Occupational safety and health in the oil and gas industry in selected sub-Saharan African countries, paper discussed at the Sub-Saharan African Tripartite Workshop on Occupational Safety and Health in the Oil and Gas Industry, Maputo, 17–18 May (Geneva).
—. 2018a. The employment impact of climate change adaptation: Input document for the G20 Climate Sustainability Working Group (Geneva).
—. 2018b. World Employment and Social Outlook 2018: Greening with jobs (Geneva).
—. 2018c. World Employment and Social Outlook: Trends 2018 (Geneva).
—. 2018d. Women and men in the informal economy: A statistical picture. Third edition (Geneva).
—. 2018e. Labour migration facts and figures: Arab States. Available at: https://www.ilo.org/beirut/areasofwork/labour-migration/lang--en/index.htm [20 Nov. 2018].
—. 2018f. Improved labour migration governance programme. Available at: https://www.ilo.org/beirut/projects/WCMS_430384/lang--en/index.htm [21 Jan. 2019].
—. 2019. Safety and health at the heart of the future of work: Building on 100 years of experience (Geneva).
Working on a warmer planet: The impact of heat stress on labour productivity and decent work100
IMF (International Monetary Fund). 2017. Seeking sustainable growth: Short-term recovery, long-term challenges (Washington, DC), Oct.
Imran, H.M.; Kala, J.; Ng, A.W.M.; Muthukumaran, S. 2018. “Effectiveness of green and cool roofs in mitigating urban heat island effects during a heatwave event in the city of Melbourne in southeast Australia”, in Journal of Cleaner Production, Vol. 197, pp. 393–405.
IOM (International Organization for Migration). 2017. Extreme heat and migration (Geneva).
IPCC (Intergovernmental Panel on Climate Change). 2007. Climate Change 2007: Synthesis Report. Contribution of Working Groups I, II and III to the Fourth Assessment Report of the Intergovernmental Panel on Climate Change (Geneva).
—. 2013. Climate Change 2013: The physical science basis. Contribution of Working Group I to the Fifth Assessment Report of the Intergovernmental Panel on Climate Change (New York, NY, Cambridge University Press).
—. 2014a. Climate Change 2014: Impacts, adaptation, and vulnerability. Contribution of Working Group II to the Fifth Assessment Report of the Intergovernmental Panel on Climate Change (New York, NY, Cambridge University Press).
—. 2014b. Climate Change 2014: Mitigation of climate change. Contribution of Working Group III to the Fifth Assessment Report of the Intergovernmental Panel on Climate Change (New York, NY, Cambridge University Press).
—. 2018. Global warming of 1.5°C (Geneva).
ISO (International Organization for Standardization). 1989. Hot environments: Estimation of the heat stress on working man, based on the WBGT (wet bulb globe temperature) index, ISO 7243:1989 (Geneva).
—. 2017. Ergonomics of the thermal environment: Assessment of heat stress using the WBGT (wet bulb globe temperature) index, ISO 7243:2017 (Geneva).
Jackson, L.L.; Rosenberg, H.R. 2010. “Preventing heat-related illness among agricultural workers”, in Journal of Agromedicine, Vol. 15, No. 3, pp. 200–215.
Joshi, S.; Simkhada, P.; Prescott, G.J. 2011. “Health problems of Nepalese migrants working in three Gulf countries”, in BMC International Health and Human Rights, Vol. 11, No. 1, pp. 3–12.
Kaur, N. 2017. “Ahmedabad: Cool roofs initiative with 5th Heat Action Plan”, 11 Apr. Available at: www.nrdc.org [20 Nov. 2018].
Kjellström, E.; Nikulin, G.; Hansson, U.; Strandberg, G.; Ullerstig, A. 2011. “21st century changes in the European climate: Uncertainties derived from an ensemble of regional climate model simulations”, in Tellus A, Vol. 63, No. 1, pp. 24–40.
Kjellstrom, T.; Kovats, R.S.; Lloyd, S.J.; Holt, T.; Tol, R.S. 2009. “The direct impact of climate change on regional labor productivity”, in Archives of Environmental and Occupational Health, Vol. 64, No. 4, pp. 217–227.
—; Holmer, I.; Lemke, B. 2009. “Workplace heat stress, health and productivity: An increasing challenge for low and middle-income countries during climate change”, in Global Health Action, Vol. 2, No. 1.
—; Lemke, B.; Otto, M. 2013. “Mapping occupational heat exposure and effects in South-East Asia: Ongoing time trends 1980–2009 and future estimates to 2050”, in Industrial Health, Vol. 51, No. 1, pp. 56–67.
—; McMichael, A.J. 2013. “Climate change threats to population health and well-being: The imperative of protective solutions that will last”, in Global Health Action, Vol. 6, No. 1.
—; Briggs, D.; Freyberg, C.; Lemke, B.; Otto, M.; Hyatt, O. 2016. “Heat, human performance, and occupational health: A key issue for the assessment of global climate change impacts”, in Annual Review of Public Health, Vol. 37, pp. 97–112.
—; Freyberg, C.; Lemke, B.; Otto, M.; Briggs, D. 2018. “Estimating population heat exposure and impacts on working people in conjunction with climate change”, in International Journal of Biometeorology, Vol. 62, No. 3, pp. 291–306.
Langkulsen, U.; Vichit-Vadakan, N.; Taptagaporn, S. 2010. “Health impact of climate change on occupational health and productivity in Thailand”, in Global Health Action, Vol. 3, No. 1.
Laws, R.L.; Brooks, D.R.; Amador, J.J.; Weiner, D.E.; Kaufman, J.S.; Ramírez-Rubio, O.; Riefkohl, A.; et al. 2015. “Changes in kidney function among Nicaraguan sugarcane workers”, in International Journal of Occupational and Environmental Health, Vol. 21, No. 3, pp. 241–250.
Bibliography 101
Lundgren-Kownacki, K.; Kjellberg, S.M.; Gooch, P.; Dabaieh, M.; Anandh, L.; Venugopal, V. 2018. “Climate change-induced heat risks for migrant populations working at brick kilns in India: A transdisciplinary approach”, in International Journal of Biometeorology, Vol. 62, No. 3, pp. 347–358.
Lutz, W.; Butz, W.P.; KC, S. (eds). 2014. World population and human capital in the twenty-first century (Oxford and New York, NY, Oxford University Press).
Martin, G.M.; Bellouin, N.; Collins, W.J.; Culverwell, I.D.; Halloran, P.R.; Hardiman, S.C.; Hinton, T.J.; et al. 2011. “The HadGEM2 family of Met Office Unified Model climate configurations”, in Geoscientific Model Development, Vol. 4, No. 3, pp. 723–757.
Martínez-Solanas, É.; López-Ruiz, M.; Wellenius, G.A.; Gasparrini, A.; Sunyer, J.; Benavides, F.G.; Basagaña, X. 2018. “Evaluation of the impact of ambient temperatures on occupational injuries in Spain”, in Environmental Health Perspectives, Vol. 126, No. 6.
Mastrorillo, M.; Licker, R.; Bohra-Mishra, P.; Fagiolo, G.; Estes, L.D.; Oppenheimer, M. 2016. “The influence of climate variability on internal migration flows in South Africa”, in Global Environmental Change, Vol. 39, pp. 155–169.
Mathee, A.; Oba, J.; Rose, A. 2010. “Climate change impacts on working people (the HOTHAPS initiative): Findings of the South African pilot study”, in Global Health Action, Vol. 3.
McGregor, G.R.; Bessemoulin, P.; Ebi, K.; Menne, B. (eds). 2015. Heatwaves and health: Guidance on warning-system development (Geneva, WMO and World Health Organization).
McIver, L.; Kim, R.; Woodward, A.; Hales, S.; Spickett, J.; Katscherian, D.; Hashizume, M.; et al. 2016. “Health impacts of climate change in Pacific island countries: A regional assessment of vulnerabilities and adaptation priorities”, in Environmental Health Perspectives, Vol. 124, No. 11, pp. 1707–1714.
Medina, L.; Schneider, F. 2018. Shadow economies around the world: What did we learn over the last 20 years?, IMF Working Paper No. 18/17 (Washington, DC, International Monetary Fund).
Mehmood, A.; Maung, Z.; Consunji, R.J.; El-Menyar, A.; Peralta, R.; Al-Thani, H.; Hyder, A.A. 2018. “Work related injuries in Qatar: A framework for prevention and control”, in Journal of Occupational Medicine and Toxicology, Vol. 13, No. 1, pp. 29–38.
Mendaci, M. 2016. “Remboursement des arrêts de travail dus à la canicule: Une première mondiale” [Compensation for work stoppages due to hot spells: A world first], in El Moudjahid, 7 May. Available at: http://www.elmoudjahid.com/fr/actualites/93989 [20 Nov. 2018].
Middel, A.; Chhetri, N. 2014. City of Phoenix Cool Urban Spaces Project – Urban forestry and cool roofs: Assessment of heat mitigation strategies in Phoenix (Arizona State University).
Missirian, A.; Schlenker, W. 2017. “Asylum applications respond to temperature fluctuations”, in Science, Vol. 358, No. 6370, pp. 1610–1614.
MOH (Ministry of Health, Viet Nam). 2002. Decision promulgating 21 labor hygiene standards, 05 principles and 07 labor hygiene measurements, Decision No. 3733/2002/QD-BYT (Hanoi).
Montt, G.; Luu, T. 2018. Does conservation agriculture change labour requirements? Evidence of sustainable intensification in sub-Saharan Africa, ILO Research Department Working Paper No. 35 (Geneva, ILO).
Moyce, S.; Mitchell, D.; Armitage, T.; Tancredi, D.; Joseph, J.; Schenker, M. 2017. “Heat strain, volume depletion and kidney function in California agricultural workers”, in Occupational and Environmental Medicine, Vol. 74, No. 6, pp. 402–409.
Mueller, V.; Gray, C.; Kosec, K. 2014. “Heat stress increases long-term human migration in rural Pakistan”, in Nature Climate Change, Vol. 4, pp. 182–185.
Muhammad, F. 2018. “Saudi Arabia: Government launches occupational health and safety inspections”, 5 July. Available at: www-business-humanrights.org [20 Nov. 2018].
Ncube, F.; Kanda, A. 2018. “Current status and the future of occupational safety and health legislation in low- and middle-income countries”, in Safety and Health at Work, Vol. 9, No. 4, pp. 365–371.
Nerbass, F.B.; Pecoits-Filho, R.; Clark, W.F.; Sontrop, J.M.; McIntyre, C.W.; Moist, L. 2017. “Occupational heat stress and kidney health: From farms to factories”, in Kidney International Reports, Vol. 2, No. 6, pp. 998–1008.
Ngwenya, B.; Oosthuizen, J.; Cross, M.; Frimpong, K. 2018a. “Heat stress and adaptation strategies of outdoors workers in the city of Bulawayo, Zimbabwe”, in Journal of Community Medicine and Public Health Care, Vol. 5, No. 1.
Working on a warmer planet: The impact of heat stress on labour productivity and decent work102
—; Oosthuizen, J.; Cross, M.; Frimpong, K.; Chaibva, C.N. 2018b. “A review of heat stress policies in the context of climate change and its impacts on outdoor workers: Evidence from Zimbabwe”, in International Journal of Social Ecology and Sustainable Development, Vol. 9, No. 1, pp. 1–11.
NIOSH (National Institute for Occupational Safety and Health, United States). 2016. Criteria for a recommended standard: Occupational exposure to heat and hot environments – Revised criteria 2016 (Cincinnati, OH, US Department of Health and Human Services, Centers for Disease Control and Prevention, National Institute for Occupational Safety and Health).
Norton, B.A.; Coutts, A.M.; Livesley, S.J.; Harris, R.J.; Hunter, A.M.; Williams, N.S.G. 2015. “Planning for cooler cities: A framework to prioritise green infrastructure to mitigate high temperatures in urban landscapes”, in Landscape and Urban Planning, Vol. 134, pp. 127–138.
Notley, S.R.; Flouris, A.D.; Kenny, G.P. 2018. “On the use of wearable physiological monitors to assess heat strain during occupational heat stress”, in Applied Physiology, Nutrition, and Metabolism, Vol. 43, No. 9, pp. 869–881.
Ocampo, J.A.; Rada, C.; Taylor, L. 2009. Growth and policy in developing countries: A structuralist approach (New York, NY, Columbia University Press).
Opitz-Stapleton, S. 2014. Da Nang, Vietnam: Climate change impacts on heat stress by 2050 (Hanoi, Institute for Social and Environmental Transition-International).
OSHAD (Abu Dhabi Occupational Safety and Health Center). 2018. Safety in Heat program. Available at: https://www.oshad.ae/safetyinheat/en/index.php [20 Nov. 2018].
Parsons, K. 2003. Human thermal environments: The effects of hot, moderate, and cold environments on human health, comfort, and performance, 2nd ed. (New York, NY, CRC Press).
—. 2014. Human thermal environments: The effects of hot, moderate, and cold environments on human health, comfort, and performance, 3rd ed. (New York, NY, CRC Press).
Patricola, C.M.; Cook, K.H. 2010. “Northern African climate at the end of the twenty-first century: An integrated application of regional and global climate models”, in Climate Dynamics, Vol. 35, No. 1, pp. 193–212.
Pogačar, T.; Casanueva, A.; Kozjek, K.; Ciuha, U.; Mekjavić, I.B.; Kajfež Bogataj, L.; Črepinšek, Z. 2018. “The effect of hot days on occupational heat stress in the manufacturing industry: Implications for workers’ well-being and productivity”, in International Journal of Biometeorology, Vol. 62, No. 7, pp. 1251–1264.
QDVC (Qatari Diar/VINCI Construction); VINCI; BWI (Building and Wood Workers’ International). 2017. Framework agreement between QDVC – VINCI – BWI (Doha).
Rahman, K.; Gorelick, S.M.; Dennedy-Frank, P.J.; Yoon, J.; Rajaratnam, B. 2015. “Declining rainfall and regional variability changes in Jordan”, in Water Resources Research, Vol. 51, No. 5, pp. 3828–3835.
Razzaghmanesh, M.; Beecham, S.; Salemi, T. 2016. “The role of green roofs in mitigating urban heat island effects in the metropolitan area of Adelaide, South Australia”, in Urban Forestry and Urban Greening, Vol. 15, pp. 89–102.
Russo, S.; Sillmann, J.; Sippel, S.; Barcikowska, M.J.; Ghisetti, C.; Smid, M.; O’Neill, B. 2019. “Half a degree and rapid socioeconomic development matter for heatwave risk”, in Nature Communications, Vol. 10.
Sahu, S.; Sett, M.; Kjellstrom, T. 2013. “Heat exposure, cardiovascular stress and work productivity in rice harvesters in India: Implications for a climate change future”, in Industrial Health, Vol. 51, No. 4, pp. 424–431.
Salazar-Xirinachs, J.M.; Nübler, I.; Kozul-Wright, R. (eds). 2014. Transforming economies: Making industrial policy work for growth, jobs and development (Geneva, ILO).
Sawka, M.N.; Périard, J.D.; Racinais, S. 2016. “Heat acclimatization to improve athletic performance in warm-hot environments”, Jan. Available at: www.gssiweb.org [20 Nov. 2018].
Schär, C.; Jendritzky, G. 2004. “Climate change: Hot news from summer 2003”, in Nature, Vol. 432, No. 7017, pp. 559–560.
Sett, M.; Sahu, S. 2014. “Effects of occupational heat exposure on female brick workers in West Bengal, India”, in Global Health Action, Vol. 7, No. 1.
Singapore Government. 2018. Skyrise Greenery Incentive Scheme. Available at: www.nparks.gov.sg [20 Nov. 2018].
Sönmez, S.; Apostolopoulos, Y.; Tran, D.; Rentrope, S. 2011. “Human rights and health disparities for migrant workers in the UAE”, in Health and Human Rights, Vol. 13, No. 2, pp. E17–35.
Bibliography 103
Spector, J.T.; Krenz, J.; Blank, K.N. 2015. “Risk factors for heat-related illness in Washington crop workers”, in Journal of Agromedicine, Vol. 20, No. 3, pp. 349–359.
—; Sheffield, P.E. 2014. “Re-evaluating occupational heat stress in a changing climate”, in The Annals of Occupational Hygiene, Vol. 58, No. 8, pp. 936–942.
Staal Wästerlund, D. 2018. Managing heat in agricultural work: Increasing worker safety and productivity by controlling heat exposure, Forestry Working Paper No. 1 (Rome, Food and Agriculture Organization of the United Nations).
Steeneveld, G.J.; Koopmans, S.; Heusinkveld, B.G.; Theeuwes, N.E. 2014. “Refreshing the role of open water surfaces on mitigating the maximum urban heat island effect”, in Landscape and Urban Planning, Vol. 121, pp. 92–96.
Tanarhte, M.; Hadjinicolaou, P.; Lelieveld, J. 2012. “Intercomparison of temperature and precipitation data sets based on observations in the Mediterranean and the Middle East”, in Journal of Geophysical Research: Atmospheres, Vol. 117, No. D12.
Tawatsupa, B.; Yiengprugsawan, V.; Kjellstrom, T.; Berecki-Gisolf, J.; Seubsman, S.A.; Sleigh, A. 2013. “Association between heat stress and occupational injury among Thai workers: Findings of the Thai Cohort Study”, in Industrial Health, Vol. 51, No. 1, pp. 34–46.
TUC (Trades Union Congress). 2009. Changing work in a changing climate: Adaptation to climate change in the UK – New research on implications for employment (London).
Umar, M.A.; Saeed, F. 2018. The role of heat stress in migration decisions: A case study of Faisalabad (Islamabad, Sustainable Development Policy Institute).
UNDP (United Nations Development Programme). 2016. Climate change and labour: Impacts of heat in the workplace (Geneva).
UNEP (United Nations Environment Programme). 2003. Impacts of summer 2003 heat wave in Europe, Environment Alert Bulletin (Nairobi).
UNFCCC (United Nations Framework Convention on Climate Change). 2015. Paris Agreement (Paris).
Vivid Economics. 2017. Impacts of higher temperatures on labour productivity and value for money adaptation: Lessons from five DFID priority country case studies (London).
Vizy, E.K.; Cook, K.H. 2012. “Mid-twenty-first-century changes in extreme events over northern and tropical Africa”, in Journal of Climate, Vol. 25, No. 17, pp. 5748–5767.
Warszawski, L.; Frieler, K.; Huber, V.; Piontek, F.; Serdeczny, O.; Schewe, J. 2014. “The Inter-Sectoral Impact Model Intercomparison Project (ISI–MIP): Project framework”, in Proceedings of the National Academy of Sciences, Vol. 111, No. 9, pp. 3228–3232.
Washington State Legislature. 2012. Washington Administrative Code, Chapter 296-307: Safety standards for agriculture (Olympia). Available at: http://apps.leg.wa.gov/WAC/default.aspx?cite=296-307 [20 Nov. 2018].
Watkins, R.; Littlefair, P.; Kolokotroni, M.; Palmer, J. 2002. “The London heat island: Surface and air temperature measurements in a park and street gorges”, in ASHRAE Transactions, Vol. 108, pp. 419–427.
Watts, N.; Amann, M.; Arnell, N.; Ayeb-Karlsson, S.; Belesova, K.; Berry, H.; Bouley, T.; et al. 2018. “The 2018 report of the Lancet Countdown on health and climate change: Shaping the health of nations for centuries to come”, in The Lancet, Vol. 392, No. 10163, pp. 2479–2514.
Wells, J. 2017. Exploratory study of good policies in the protection of construction workers in the Middle East (Beirut, ILO Regional Office for Arab States).
WMO (World Meteorological Organization). 2018. Frequently asked questions on climate. Available at: http://www.wmo.int/pages/prog/wcp/ccl/faq/faq_doc_en.html [20 Nov. 2018].
Wyndham, C.H. 1969. “Adaptation to heat and cold”, in Environmental Research, Vol. 2, No. 5, pp. 442–469.
Zamanian, Z.; Sedaghat, Z.; Hemehrezaee, M.; Khajehnasiri, F. 2017. “Evaluation of environmental heat stress on physiological parameters”, in Journal of Environmental Health Science and Engineering, Vol. 15.
Zander, K.K.; Botzen, W.J.W.; Oppermann, E.; Kjellstrom, T.; Garnett, S.T. 2015. “Heat stress causes substantial labour productivity loss in Australia”, in Nature Climate Change, Vol. 5, No. 7, pp. 647–651.
Zhang, X.; Aguilar, E.; Sensoy, S.; Melkonyan, H.; Tagiyeva, U.; Ahmed, N.; Kutaladze, N.; et al. 2005. “Trends in Middle East climate extreme indices from 1950 to 2003”, in Journal of Geophysical Research: Atmospheres, Vol. 110, No. D22.
Wor
king
on
a w
arm
er p
lane
t
T
he im
pact
of
heat
str
ess
on la
bour
pro
duct
ivit
y an
d de
cent
wor
k
The phenomenon of heat stress refers to heat received in excess of that which the body can tolerate without physiological impairment. It is one of the major consequences of global warming. In 2030, the equivalent of more than 2 per cent of total working hours worldwide is projected to be lost, either because it is too hot to work or because workers
have to work at a slower pace. In its findings, this report shows the impact of heat stress on productivity and
decent work for virtually all countries in the world. It also presents innovative solutions
based on social dialogue to promote occupational safety and health for the
most vulnerable groups of workers.