Embed Size (px)
Citation preview
WORKING IN PARTNERSHIP: ENABLING SOCIAL MOBILITY IN HIGHER EDUCATION The final report of the Social Mobility Advisory Group

1
FOREWORD
Universities transform lives. Going to university leads to new ways of seeing the
world, to new horizons and networks, and to significantly enhanced job
opportunities. But not everyone benefits in the same way. Fewer students from
socially and economically disadvantaged backgrounds go to university, and when
they do they tend not to do as well as their more privileged peers. The influence of
background continues long after graduation.
A student’s race, gender and disability may also affect their experience. Although
overall students from black and minority ethnic backgrounds have high rates of
participation at university, this varies regionally and between institutions, and also
between different racial groups. Male and female students tend to choose different
subjects, and more women than men go to university. Compared to their peers,
graduate outcomes are not as good for black and minority ethnic students, nor for
disabled students.
Universities have long worked hard to remedy the impact of disadvantage, and they
have made progress with extensive, ambitious and innovative programmes. But
differences remain, and are stark.
The Social Mobility Advisory Group was set up in October 2015, at the request of Jo
Johnson MP, Minister of State for Universities and Science, with the aim of
identifying practical ways to address inequality in higher education. The Advisory
Group has considered the evidence and drawn together recommendations as to ways
forward, acknowledging that there will be no simple solutions to embedded social
inequality that passes from generation to generation. No one organisation or sector
can resolve such deep-rooted inequalities. Instead, the extensive work that
universities have been carrying out over many years needs to be built on, and
collaborations and partnerships extended. Change will be incremental.
Some consistent themes have emerged, not least the need for a rigorously evidence-
based approach to social mobility. It is too easy to draw mistaken conclusions based
on out-of-date information or old-fashioned assumptions. Evaluation is essential to
inform and shape future work. In a world where a student’s future is shaped by the
choices that they make, particularly in relation to what university to attend and what
course to study, all students need effective information, advice and guidance. We also
need to move away from the perception that people only have one chance for
university study at the age of 18. For many people from disadvantaged backgrounds,
going to university later in life will be the only opportunity they have. Now, more
than ever before, the UK needs more highly skilled graduates of all ages, and mature
learners have to be part of the solution.
Most importantly of all, sustained change can only be achieved through collaboration
and partnership. Universities need to continue working closely with schools and
colleges in a range of different ways, given the very strong correlation between a
pupil’s prior attainment at school and their outcomes at and beyond university.
Working with employers is also critical. It is no good for a student to graduate with
2
flying colours if they cannot get a job. Students’ unions, who have a deep
understanding of the opportunities and barriers that students face, must be involved.
These are complex issues and they will affect different universities in different ways.
Universities in the UK are profoundly diverse, and any meaningful response will need
to reflect the individual university’s geographical location and circumstances.
The Advisory Group’s recommendations are only a beginning. Universities UK will
work with its members, and with schools, employers, students’ unions, the third
sector and other partners, to take forward the recommendations.
Thanks are due to members of the Advisory Group, and those involved in the
Reference Groups, for their considerable insight and expertise in shaping this report.
Nicola Dandridge
Chief Executive, Universities UK
3
CONTENTS
EXECUTIVE SUMMARY ................................................................................................. 4
INTRODUCTION ......................................................................................................... 10
1. WHAT THE EVIDENCE TELLS US ................................................................................ 14
2. WORKING IN PARTNERSHIP .................................................................................... 26
3. POLICY AND A CHANGING HIGHER EDUCATION LANDSCAPE ...................................... 43
4. HIGHER EDUCATION .............................................................................................. 55
5. CONCLUDING REMARKS AND RECOMMENDATIONS .................................................. 85
ANNEXES
ANNEXE A: SOCIAL MOBILITY IN HIGHER EDUCATION: A SUMMARY OF CURRENT
CHALLENGES ............................................................................................................ 92
ANNEXE B: A REVIEW OF THE EVIDENCE OF HOW YOUTH SOCIAL ACTION CAN BOOST SOCIAL
MOBILITY INTO, AND AFTER UNIVERSITY .................................................................... 116
ANNEXE C: SOCIAL MOBILITY ADVISORY GROUP AND REFERENCE GROUP MEMBERS .... 119
4
EXECUTIVE SUMMARY
INTRODUCTION
In October 2015, Universities UK was invited by the Minister of State for Universities
and Science, Jo Johnson MP, to provide advice on how universities in England could
build on their contribution to social mobility. Universities UK was asked to form an
advisory group to focus efforts on improving educational and career outcomes for
students from disadvantaged backgrounds, those with a disability, as well as those
from black, minority and ethnic backgrounds. The focus of the report is England.
Universities recognise their role in improving social mobility. However, the sector
does not operate in isolation. There is an overwhelming correlation between a
student’s experience at school, and their outcomes at university. The role of
employers is also critical in terms of graduate outcomes, for young and mature
students alike. Schools, colleges and employers all need to be part of the solution.
There are also many charities which play an import role as a broker to support
universities in widening access and engaging with employers. Partnership working
and improved collaboration at every level is a theme that pervades the report.
Exploring patterns of disadvantage inevitably involves generic characterisations of
social groups, for instance in relation to socio-economic status, race, gender or
disability. These characteristics overlap and, at the heart of widening participation
and success, each student is an individual. Effective responses must take account of
both the generic and the individual, and these two approaches to identifying and
responding to disadvantage are reflected in the terms of the report.
Throughout its work, the Advisory Group has directed its focus towards the entire
student journey, from application to university, to experience at university and then
graduate outcomes, whether postgraduate education or employment.
THE EVIDENCE
Based on extensive analysis, evidence gathering and input from experts and
practitioners the Advisory Group has grounded its findings and recommendations in
the evidence.
The report starts by summarising the evidence as to where disadvantage lies. It
demonstrates that socio-economic disadvantage continues to be the most significant
driver of inequality in terms of access to and outcomes from higher education.
Eighteen year-olds from the most advantaged groups remain 2.4 times more likely to
enter university than their disadvantaged peers, and 6.3 times more likely to attend
one of the most selective institutions in the UK1. Having graduated from university,
students from disadvantaged backgrounds are less likely to go into professional jobs,
and if they do they are likely to be paid less2.
1 UCAS (2015) End of Cycle report 2015 2 HEFCE (2015) Differences in employment outcomes: Equality and diversity characteristics, IFS (2016) How English domiciled graduate earnings vary with gender, institution attended, subject and socio-economic background
5
The data also reveals the pervasive gap in degree attainment and labour market
outcomes between ethnic groups and between disabled and non-disabled students.
Research by HEFCE3 found that in 2013–14 there was an unexplained difference of
15 percentage points between the proportions of white and BME graduates achieving
a first or upper second degree, and an unexplained gap of three percentage points
between the proportions of disabled and non-disabled graduates doing the same.
HEFCE also found4 that graduates from almost all BME groups were less likely than
white graduates to go into employment after graduation, with an unexplained
difference of over seven percentage points for Chinese and black African graduates
and with the gaps in the proportions going onto professional employment actually
increasing over time. The differences in the proportion of disabled students going
into employment ranged from two to three percentage points immediately after
study, and again gaps in the proportions going into professional employment grew
over time.
Age poses different challenges, including the importance of the availability of
opportunities to study flexibly. Mature students also need to be part of the solution.
This is not only important in terms of promoting social mobility, but critical in
relation to economic growth and enhancing productivity.
Although the report primarily refers to undergraduates, addressing the inequalities in
access at the postgraduate level is also important, particularly as there is a gap of two
percentage points between the proportion of graduates from disadvantaged and
advantaged backgrounds who go on to postgraduate study.
The existence of ‘cold spots’ where higher education participation is low illustrates
the complex and important relationship between person and place. Effective
responses to inequality in higher education must therefore be grounded in localities
or regions.
PARTNERSHIP AND COLLABORATION
Prior attainment at school has a significant influence on the higher education
outcomes for young people, with research for BIS5 finding that GCSE attainment was
the strongest predictor of whether pupils went on to higher education. This reinforces
the importance of universities working collaboratively across the education sector.
The report highlights the many forms this collaboration takes, the impact this has
already made and how these partnerships can be improved. The merger of higher
education teaching into the Department for Education presents an unparalleled
opportunity for supporting this process. The report also notes the important, often
undervalued, role of the charitable sector in acting as a broker for outreach and
graduate employability.
Information, advice and guidance (IAG) play a central role in shaping students
choices. Students from more privileged backgrounds benefit from effective IAG from
their schools, their parents and broader networks. This is often absent, or less
3 HEFCE (2015) Differences in degree outcomes: The effect of subject and student characteristics 4 HEFCE (2015) Differences in employment outcomes: Equality and diversity characteristics 5 BIS (2015) Socio-economic, ethnic and gender differences in higher education
6
effective, for students from more disadvantaged backgrounds who may not have the
same cultural capital at home and through their networks. The quality of IAG in state
schools is also often patchy, reinforcing disadvantage for state school pupils. In an
increasingly differentiated sector where student choice shapes outcomes, it will be
critical to ensure that IAG is broadly coherent and joined-up between schools,
colleges, universities, charities and employers. IAG for mature students is largely
non-existent. The report therefore recommends improving IAG relating to
opportunities for mature students, including information on the increasing diversity
of routes both into and through higher education and the role of higher and degree
level apprenticeships.
The report highlights the critical role of employers for improving social mobility,
given the mass of evidence which points to socio-economic background still being the
most important factor in determining a graduate’s career – often irrespective of the
university attended. There is a need to enhance collaborative activity between the
higher education sector and employers, particularly with small and medium
enterprises, with more needing to be done to improve the inclusivity of recruitment
practices, including the monitoring and publication of recruitment data, especially
from underrepresented groups, and sharing effective practice and interventions.
POLICY AND THE CHANGING HIGHER EDUCATION LANDSCAPE
The environment in which universities work has a significant impact on social
mobility. The role of government policy, for instance in relation to funding,
regulation and increased competition between higher education institutions, impacts
on social mobility, as do Local Enterprise Partnerships, local government, the media
and university league tables. The report notes the importance of national structures
aligning with the new funding models, acknowledging that the creation of the Office
for Students, working with the sector, provides an opportunity to develop a clearer
and more joined-up national approach for tackling the priorities identified in the
report.
INSTITUTIONAL PRACTICE
The sector is committed to tackling social mobility and inequality. There are
numerous examples of serious and innovative initiatives across the country.
However, the report also reveals that there is more still to do, particularly in widening
participation for under-represented groups and solving the attainment gap in
graduate outcomes and employment.
In part this will involve enhanced collaboration with schools, with different forms of
collaboration reflecting an institution’s strengths and mission and the particular
needs of the locality or region. It may also require wider use of contextual admissions
processes in which universities identify an applicant’s potential as well as their prior
attainment in determining admissions. More still needs to be done to ensure that
contextual admissions are better understood by potential applicants and the wider
public, and more generally to identify and share good practice across the sector.
7
The report describes the importance of developing an institution-wide approach to
addressing the differences in degree attainment between different ethnic groups and
between disabled and non-disabled students. The evidence clearly reveals that there
is no single solution and a variety of approaches need to be adopted with
interventions and strategies of necessity varying from institution to institution.
Activity that is already under way needs to be built on in terms of developing an
inclusive curriculum as well as addressing wider issues such as the culture of a
university and the diversity of the staff population. Resources already available in the
sector, and the impact that these tools are securing, need to be evaluated and more
widely shared across the sector.
The evidence also demonstrated that there are a range of interventions that could
help address differences in graduate outcomes. These include collaborations with
employers on the development of degrees, the embedding of employability into the
curriculum, and the provision of opportunities for students to engage in social action,
volunteering or participation in outward mobility programmes. University careers’
services are also integral to brokering links with employers, for instance in facilitating
work experience including internships and placements.
In summary, more effective evaluation of policies and interventions is needed across
all parts of the student lifecycle, with an emphasis on interventions that maximise
outcomes. To support this, the report recommends the establishment of an ‘Evidence
and Impact Exchange’ that would systematically evaluate and promote the evidence
relating to higher education’s role in supporting social mobility. It would also support
the dissemination of data to help build greater strategic coherence and coordination,
as well as greater use of evidence to inform policy, funding and regulation,
institutional decision making, and the effective use of resources.
CONCLUSIONS AND RECOMMENDATIONS
The recommendations in the report reflect the fact that change can only be achieved
if the education sector, government, employers, students’ unions and the charitable
sector, all work together in a more collaborative way to provide greater coordination
and coherence at a policy, regional and institutional level. To facilitate this, better
and more consistent use of data will be required and a greater priority accorded to
effective communications, particularly to students (young and mature). More
effective evaluation of policies and interventions is also required and a focus on ‘what
works’ underpinned by a robust and systematic use of the evidence.
The recommendations summarised below reflect the fact that the sector is diverse,
with different challenges, missions and strategies. The evidence shows that ensuring
that institutions have the flexibility to respond to different local regional and national
circumstances within the changing funding and regulatory environment will be
critical if faster progress is to be achieved.
8
The establishment of an independent ‘Evidence and Impact Exchange’ to
systematically evaluate and promote the evidence relating to the role of higher
education in supporting social mobility and to support the sharing of data
from schools through to employers. This will help build greater strategic
coherence and coordination between all parties and allow for more effective
targeting of interventions at each stage of the student lifecycle.
A greater focus on outreach activities by universities, colleges and employers
to support attainment in schools. This should be supported by a systematic
review of the evidence on the impact and effectiveness of these interventions
by the Evidence and Impact Exchange.
Further consideration to be given to developing, strengthening and expanding
universities links with schools. The form this takes will depend on
institutional mission and local circumstances and should include an
evaluation of impact.
Higher education institutions to monitor their admissions, retention,
attainment, transition to postgraduate study and graduate employment data
to identify where there may be gaps, particularly in relation to race, socio-
economic status, gender and disability, and to explore how these gaps can be
addressed. This could include using higher education sector frameworks
already in place.
The expansion of datasets to enable universities to assess their work on social
mobility, including the development of a shared basket of indicators in
relation to socio-economic disadvantage.
Greater use of contextual data to inform offer-making, supported by the
identification and sharing of good practice.
The development of a directory of charitable third sector organisations across
the country to enhance school, college, university and employer collaboration.
Greater coordination of information and advice across schools, universities
and employers, particularly in terms of the impact of subject choice and the
qualifications taken at school and graduate careers.
Universities UK to work with government to develop a more robust approach
to information, advice and guidance, including greater alignment between
government and higher education sector communications around social
mobility and higher education. To include raising awareness of the different
routes into and through higher education and the promotion of the value of
lifelong learning and the value of part-time study.
Universities UK to work with employers and other local partners including
9
Local Enterprise Partnerships and the new Metro Mayors to tackle
disadvantage at a regional level. This will include monitoring and publication
of data on the recruitment of underrepresented groups by graduate
employers.
Universities to work with league table providers to understand the potential
impact of league tables on social mobility.
NEXT STEPS
This report is as an initial assessment of social mobility in higher education. It
identifies a number of areas for action as well as specific recommendations for
different stakeholders as set out in chapter 5. Following the publication of the report,
Universities UK will work with the sector and with partners to implement the
recommendations. A report on the progress made against the recommendations will
be published by Universities UK by the end of 2017.
10
INTRODUCTION
1. Social mobility describes people’s ability to improve on their own family social
position or their own current status through opportunities provided in their
society. Along with schools, employers and the charitable sector, higher
education has an important role to play in providing and promoting those
opportunities.
2. The Social Mobility Advisory Group was established in response to a letter from
the Minister of State for Universities and Science, Jo Johnson MP, dated 7
October 2015. The letter asked the Advisory Group to identify action to:
Increase the number of students from disadvantaged and under-represented
backgrounds entering higher education
Increase the number of black and minority ethnic (BME) students and white
boys entering higher education
Improve degree attainment and graduate outcomes for BME students
Reduce barriers for disabled students so they can fully participate in higher
education and achieve strong outcomes. The Minister particularly flagged
the experience of students experiencing mental health difficulties
Consider how the role of data can support social mobility objectives, and
evaluate the impact of progress towards these objectives.
3. These are significant and important challenges. Progress across these areas will
ensure higher education continues to play a critical role in creating opportunity
for all.
4. The Advisory Group’s work coincides with a period of considerable change for
students and universities. Higher education continues to expand and diversify,
presenting new opportunities and pathways to higher level skills and
employment. We have seen changes to the funding for higher education, with
students now making a considerable contribution to the overall costs of their
studies. This means that there is an increasing focus on the value and benefit
derived from going to university. The Higher Education and Research Bill is set
to reconfigure the functions and responsibilities of the Higher Education
Funding Council for England (HEFCE) and the Office for Fair Access (OFFA),
both of which have played critical roles in supporting and promoting social
mobility, and merging them into the Office for Students (OfS). Funding to
support widening access and participation is being reduced and there is a greater
emphasis on institutions supporting this through fee income. A new prime
minister and cabinet are in post, with new priorities, including an enhanced
focus on seeking social mobility, social justice6 and education reform.
Responsibility for students has been transferred to the Department for
Education, presenting an opportunity to align policy across schools, colleges and
6 Statement from Prime Minister Theresa May, 13 July 2016 https://www.gov.uk/government/speeches/statement-from-the-new-prime-minister-theresa-may. Alongside this, the Prime Minister has launched an audit which will show how public services treat different from different backgrounds. https://www.gov.uk/government/news/prime-minister-orders-government-audit-to-tackle-racial-disparities-in-public-service-outcomes
11
higher education. The EU referendum has also raised difficult questions about
social cohesion within the United Kingdom, with universities positioned to play a
potentially central role within their communities in addressing some of the
divisions revealed by the referendum vote.
5. This changing and sometimes uncertain context presents a number of challenges
for universities, but also a unique opportunity to take a fresh look at some of the
historical systems, structures and approaches to identify where changes can be
made to support further progress.
6. In doing this it is important to build on the substantial progress made to date. The
higher education sector has a long history of supporting social mobility and
social cohesion. A commitment by universities to engage with all students who
have the ability and desire to engage in university study notwithstanding their
background and personal characteristics is integral to their missions and
identities. All institutions will also have a deep-rooted belief in the
transformative nature of education. More recently there has been a stronger
competitive drive for universities to recruit students, so it also makes sense from
many universities’ perspective to ensure that all students with the ability and
desire to study at university, can do so. Restricting the field of recruitment is
unlikely to be a viable approach either in strategic or competitive terms.
7. The last ten years have seen a substantial expansion of higher education’s work to
encourage and support participation by students from disadvantaged
backgrounds. This includes the development of new routes into and through
higher education, including through degree apprenticeships, the creation of
extensive partnerships and collaborations with both primary and secondary
schools, the sponsoring of academies, university technology colleges and free
schools, as well as working collaboratively with the charitable sector and
employers. Outreach programmes and activities are extensive, and frequently
imaginative and innovative. Once at university, that support continues with
programmes and activities that provide academic assistance, as well as practical
advice and guidance in terms of accessing the many wider benefits that
universities offer from work placements, opportunities to engage in social action
and volunteering to studying abroad. Increasingly the focus is on graduate
employability which is a priority for many students. This report has sought to
capture some of that activity and identify what works well, and proposes
recommendations for reforms and activities that can support further progress.
8. The specific objectives set out in the minister’s letter are important. This report
goes further and examines the contribution that higher education can and does
make in terms of providing opportunities for the half a million mature students
who may have been unable to study earlier, and career-changers wishing to
reskill or upskill, often on a part-time basis, later in life. This is not only
important in terms of promoting social mobility, but critical in relation to
economic growth and enhancing productivity. In a globally competitive
economy, with an older workforce that will potentially be working longer, success
depends on developing skills and unlocking talent wherever that may be and at
12
whatever age. Between 2014 and 2024, it has been estimated that 72% of all
newly created jobs and 51% of all jobs, will require graduate level skills7 – and
they cannot all be filled by young graduates.
9. A priority for this report has been to ground its findings and recommendations in
the evidence, both in terms of identifying the scale of the challenge and where
the priorities for action lie. Chapter 1 sets out a summary of the evidence,
describes what the data tells us and what the priorities should be. Universities do
not operate in isolation, and their work has to be seen alongside the work being
done for instance by schools, further education colleges, employers and the
charitable sector. Chapter 2 looks at what these different organisations do and
how they interact with each other. Chapter 3 examines a number of higher
education specific issues, including government policy and the influence of
deregulation and the market on social mobility. Chapter 4 looks in detail at what
the higher education sector is doing and where the opportunities for
improvement are, and Chapter 5 concludes with the recommendations. These are
included in bold within the main body of the report. In addition to the specific
recommendations there are a number of actions set out in the report, primarily
aimed at Universities UK, which will be taken forward. Universities UK will also
play a central role in supporting its members and working with other
stakeholders to implement the recommendations. A report on the progress
made against the recommendations will be published by Universities UK by the
end of 2017.
10. Finally, it is important to stress that this work has inevitably involved generic
characterisations in terms of socio-economic status, race, gender and disability.
These definitions, primarily reflecting legal or social characterisations, are
important because they reveal patterns of disadvantage affecting certain groups
of people that would be lost if individuals were assessed in isolation. However,
the definitions do not reflect self-determined cultural identities, and students
from certain backgrounds or with certain personal identities do not of course all
behave in the same way nor make the same choices. Indeed, at the heart of the
widening participation and success agenda is the individual student, regardless
of their background. This report seeks to engage with both approaches,
considering both the patterns of disadvantage affecting certain groups while also
recognising that each student is an individual.
PROCESS
11. Since the Advisory Group was established it has met three times, on 5 February
2016, 10 May 2016 and 17 June 2016. An Academic Reference Group and
Practitioners’ Reference Group, established to support the Advisory Group’s
work, have each met three times. Roundtables have also been held with
employers, schools and alternative providers. The outcomes of these discussions
are reflected in the report. Extensive engagement has also taken place with a
number of stakeholders and higher education institutions.
7 UK Commission for Employment and Skills (2016) Working Futures 2014 to 2024

13
12. This report is primarily concerned with higher education in England. However,
engagement with institutions and stakeholders in the devolved administrations
has been important, not least to ensure the cross border implication of any
recommendations beyond England are recognised and considered.
13. The full list of those involved in the Advisory Group, the Academic Reference and
Practitioners’ Groups and the roundtable discussions can be found at Annexe C.
We would like to thank all of those that have taken time to contribute to this
report for the significant expertise, experience and knowledge provided.
14
1. WHAT THE EVIDENCE TELLS US
14. A student’s decision to go to university, the way they engage with and experience
higher education, as well as their outcomes and employment prospects will be
influenced by a number of factors. For young students this will particularly
depend on their prior experience and attainment at school. For mature students
their choices, experiences and outcomes will depend on a whole range of factors
primarily relating to their personal and economic circumstances, and often the
availability of accessible part-time study. The aggregated impact of all these
individual choices, experiences and outcomes reveal, however, significant
differences according to socio-economic background, race and disability.
15. This chapter sets out what the evidence tells us about disadvantage. The evidence
points to substantially different outcomes for students from different social and
economic backgrounds throughout the student lifecycle, and for black and
minority ethnic (BME) students and students with disabilities in terms of
graduate outcomes in particular.
16. It is vital to understand what the evidence tells us about these aggregated
differences across the student lifecycle and where disadvantage lies. Unless these
differences are properly understood, universities are unlikely to be able to
provide an effective environment for the individual student that takes proper
account of their background and characteristics, to ensure that they can fulfil
their potential.
17. Historically, the focus of widening participation and social mobility has tended to
be on access, the assumption being that once at university disadvantage will
automatically level out. However, there is a growing acknowledgement that
disadvantage is present throughout university and reflected in graduate
outcomes. Further, the recent and substantial expansion of student and graduate
numbers, a tougher graduate employment market, and the impact of graduate
loan repayments, mean that the focus is inevitably shifting to graduate outcomes,
particularly in terms of employment.
18. Much of the evidence on access draws upon UCAS data8. This means that it
primarily covers those who apply for and accept a full-time undergraduate place
through UCAS, rather than actual enrolments in higher education. UCAS data is
also more likely to cover young applicants than those aged 21 and over.
SOCIO-ECONOMIC/CLASS BACKGROUND
19. The consistently most disadvantaged group in terms of higher education
participation and access is those students from disadvantaged backgrounds.
8 This is because the focus is on the likelihood of participation as opposed to those who actually enrol in higher education. Information on enrolments is provided by the Higher Education Statistics Agency (HESA). The latest data available is for the academic year 2014–15.

15
20. Definitions of disadvantage are contested and complex. In terms of widening
participation, the measure most commonly used in the higher education sector is
Participation of Local Areas (POLAR) data. POLAR is a measure of relative
rather than absolute disadvantage, and defines disadvantage by reference to
participation in higher education rather than, for instance, family income or
other measures more clearly linked to socio-economic status. The measure
classifies census wards into five groups based on the proportion of 18-year-olds
who enter higher education aged 18 or 19 years old. Quintile 1 is the lowest
participation group, and quintile 5 the highest. POLAR3 is the latest iteration.
21. POLAR is used to inform targeting and to support analysis of widening
participation activities by universities and by other sector stakeholders. These
include the Higher Education Statistics Agency (HESA), which uses it as part of
its UK Performance Indicators (UKPI) analysis of widening participation at UK
universities, and the Office for Fair Access (OFFA), which publishes the UKPI
analysis as part of its annual institutional self-assessment and commentary.
POLAR was created by the Higher Education Funding Council for England
(HEFCE), which uses it to calculate its widening participation funding
allocations.
22. As an area-based measure, POLAR does have its limitations: it does not align
with the definitions of disadvantage used, for instance, in schools or by
employers and although the classification is found to correlate with other
measures of disadvantage, in many cases the correlation is not as strong as might
be assumed. For example, there are several wards which have among the highest
young higher education participation rates but are classed by other measures as
being more disadvantaged than some wards which have average young higher
education participation rates9. Nonetheless, POLAR is widely recognised and
continues to provide a useful tool for capturing the multi-dimensional aspects of
socio-economic disadvantage across different higher education data sources.
POLAR also closely correlates with other measures of socio-economic
disadvantage, including the complex multivariate analysis developed by the
Institute for Fiscal Studies (IFS) as part of a recent report for the (then)
Department for Business, Innovation and Skills (BIS)10. It is therefore the
measure used in this report. Notwithstanding this, however, our discussions with
practitioners and schools indicates POLAR on its own is regarded as too blunt an
instrument to inform the sector’s work on social mobility. In view of this the
Advisory Group recommends the creation of a basket of indicators
shared across the sector to measure disadvantage in applicants and
students using both population-based and individual indicators.
These would sit alongside other data which institutions may wish to
use e.g. course specific data. Consideration should also be given to
how universities can be supported to monitor their own student body
using these indicators and how these compare with the indicators
9 (HEFCE) Further information on POLAR3: an analysis of geography, disadvantage and entrants to higher education http://www.hefce.ac.uk/pubs/year/2014/201401/ 10 HEFCE (2014) Further information on POLAR3: An analysis of geography, disadvantage and entrants to higher education; BIS (2015) Socio-economic, ethnic and gender differences in HE participation
16
used by schools and employers. The Practitioners’ Reference Group
(PRG11) will evolve into a community of practice and will support this
task. We believe that this would be of significant benefit to institutions and
policy makers in understanding and responding effectively to the challenges of
participation by disadvantaged groups.
23. Entry rates to higher education for pupils from disadvantaged backgrounds as
measured by POLAR3 are lower than those for advantaged pupils. In 2015, 18.5%
of 18-year-olds from England in quintile 1 (the least advantaged group) accepted
offers to study on a full-time undergraduate programme via UCAS, compared to
44.9% in quintile 5 (the most advantaged)12. That means that 18-year-olds in
quintile 5 are 2.4 times more likely to enter higher education than 18-year-olds
in quintile 1. The latest figures from UCAS during Clearing suggest that a similar
gap will remain in 201613.
24. Students from disadvantaged backgrounds are also significantly less likely to
attend high tariff institutions or courses. Access to high tariff institutions or
courses is often termed ‘fair access’14. In 2015, data from the UCAS end of cycle
report showed that 3.3% of 18-year-olds from quintile 1 accepted offers to study
full-time undergraduate programmes at high tariff institutions, compared to
20.7% for pupils from quintile 515.
25. Having entered higher education, people from lower socio-economic
backgrounds are more likely to drop out than those from more advantaged
backgrounds. Although the UK-wide non-continuation rates16 for both
disadvantaged and more advantaged students rose in the latest year for which we
have data (2013–14) following longer-term reductions, the rate for more
advantaged students rose by less (6% proportionally compared to 13% for
POLAR3 quintile 1); the England-only rates for disadvantaged students have
been stable for the past two years. In 2013–14 young disadvantaged entrants
were 1.4 times more likely to drop out than those from a disadvantaged
background.
26. Those from disadvantaged backgrounds appear to continue to be disadvantaged
when it comes to degree attainment and employment outcomes. HEFCE found
an unexplained gap of three percentage points in the proportions of 2013–14
graduates from quintile 1 obtaining a first or upper second class degree,
11 This is a group of higher education expert practitioners and members of the charitable sector which was originally established by the Advisory Group to provide support in addressing the challenges set out in chapter 1. This group will work with UUK to support the implementation of the recommendations and other activities determined by the Advisory Group. 12 UCAS (2015) End of Cycle Report 2015 13 UCAS (2016) Daily Clearing analysis 2016 https://www.ucas.com/corporate/data-and-analysis/ucas-undergraduate-releases/daily-clearing-analysis-2016 14 Although fair access is generally considered to mean access to highly selective institutions it is important to note that there are highly selective courses across many higher education institutions. Widening participation refers to the much more extensive issue of able students who never progress onto higher education. 15 UCAS (2015) End of Cycle Report 2015 16 HESA (2016) UKPIs: Non-continuation rates (table T3b)
17
compared to quintile 5 graduates17. They also found18 that 2010–11 graduates
from disadvantaged backgrounds were less likely to go on to professional
employment.
27. The Institute for Fiscal Studies (IFS) report, How English domiciled graduate
earnings vary with gender, institution attended, subject and socio-economic
background (April 2016), emphasises still further how important parental
background is in terms of graduate outcomes.
28. Disadvantaged students, defined by reference to numbers living in low-
participation neighbourhoods, are not a homogenous group, and there are
various intersecting characteristics which compound the disadvantage. In
particular, gender, ethnicity, and regional location (eg rural and coastal areas as
opposed to metropolitan and London areas) also have a bearing.
GENDER
29. Men have lower participation rates, retention, degree attainment, and
progression than their female counterparts. Women are more likely than men to
apply for and enter higher education via UCAS and the gap between the sexes has
grown in recent years, with women now 36% more likely to apply for and 35%
more likely to enter higher education via UCAS than men. Looking at the student
body, women made up 57% of UK undergraduates at English higher education
institutions in 2014–15, and 58% of first years.
30. As with place, analysis suggests that gender can compound other categories of
disadvantage. Differences in attainment at school between the sexes are
important in explaining this. Girls make up a larger proportion of those entering
A-level exams, despite there being fewer girls than boys in the 18-year-old
population, and achieve higher grades. 54.5% of girls’ A-level entries were graded
A* to B in 2016, compared to 50.9% of boys’19.
31. A 2015 BIS study20 suggests that prior attainment explains the difference in
participation by boys and girls, and that once it is controlled for, boys are slightly
more likely than girls of a similar background to attend university, including the
most selective institutions. The problems for boys from lower socio-economic
groups are magnified by differences in subject choice by boys and girls. Four of
the five subject areas with the highest proportions of students from POLAR3
quintile 1 in HESA’s UKPIs for 2014–1521 are large and have significantly more
women than men, particularly at undergraduate level (education, mass
communications, creative arts and law).
17 HEFCE (2015) Differences in degree outcomes: The effect of subject and student characteristics 18 HEFCE (2016) Differences in employment outcomes: Comparison of 2008–09 and 2010–11 first degree graduates 19 Joint Council for Qualifications CIC (2016) Provisional GCE A Level Results – June 2016 20 BIS (2015), Socio-economic, ethnic and gender differences in HE participation 21 HESA (2016) UKPIs: Widening participation of under-represented groups (table sp6)
18
32. There are also differences in gender in terms of employment outcomes. The
recently published analysis by HEFCE22 which looks at the differences in
employment outcomes for two cohorts of first degree graduates, 2008–09 and
2010–11, shows that in both cohorts white female graduates had higher overall
employment rates, yet male graduates had higher professional employment rates
six and 40 months after graduation. Although female graduates are more likely
to be in work, analysis of the HESA Destinations of Leavers from Higher
Education salary data shows that female graduates earn considerably less than
male graduates regardless of subject choice23.
STUDENTS FROM BLACK AND MINORITY ETHNIC BACKGROUNDS
33. BME as a definition is widely recognised and used to identify patterns of
marginalisation and segregation caused by attitudes toward an individual’s
ethnicity. We recognise the limitations of this definition, particularly the
assumption that minority ethnic students are a homogenous group. Where
possible, this report presents data disaggregated by more detailed ethnic groups
in addition to data consolidating BME students as a group.
34. Overall, young BME higher education participation rates are higher than those of
their young white peers. Research for BIS found that this was also true at the
most selective (high tariff) institutions, except for pupils from black Caribbean
and black other groups24. This is reinforced by UCAS analysis25 which found that
the entry rate for black 18-year-olds to higher tariff providers in 2015 was 5.6%,
compared to 8.1% for the white group, with other ethnic groups having higher
rates of entry than both the black and white cohorts. This analysis also found
that the pattern of these entry rates by ethnic group closely reflects the pattern of
entry rates by A-level attainment at ABB+.
35. Despite generally high participation rates the representation of students from
ethnic minorities does vary across ethnic group. For example, Chinese 18-year-
olds have much higher entry rates than all other ethnic groups under UCAS’s
analysis. Representation also varies by place and institution type, with a higher
proportion of the BME undergraduate body based at low tariff institutions and
institutions in London and the West Midlands than elsewhere in the UK26. It is
also worth noting that both BIS research27 and experimental statistics for
HESA28 suggest that there are higher proportions of BME students at alternative
providers than at publicly-funded providers.
22 HEFCE (2016) Differences in employment outcomes: Comparison of 2008-09 and 2010-11 first degree graduates http://www.hefce.ac.uk/pubs/year/2016/201618/ 23 The Visible Hand in Economics (25 July 2015) The male wage premium http://www.tvhe.co.nz/2015/07/25/the-male-wage-premium/ 24 BIS (2015) Socio-economic, ethnic and gender differences in HE participation, and UCAS (2015) End of Cycle report. In this instance ‘black other’ means with non-Caribbean or African heritage. 25 UCAS (2015) End of cycle report 26 HEFCE analysis of HESA (2016) student record 27 BIS (2016) Understanding the market of alternative higher education providers and their students in 2014 28 HESA (2016) Experimental SFR 235
19
36. There has been concern expressed by some researchers, the government, and
media commentators that unconscious bias about applicants’ ethnicity may
influence offer-making by institutions. While it should be noted that institutions
do not receive data on the ethnicity of an applicant via UCAS until the applicant
has a confirmed place with that institution, it is possible that inferences about
applicants’ ethnicity could be made, for example by their name or by school
attended. UCAS’s recent report on unconscious bias in admissions29 surveyed the
available evidence base and concluded that there did not appear to be evidence of
systemic bias in offer-making and, discerning whether unconscious bias is at
play, is by its very nature, complex. We return to this issue in more detail in the
section on admissions in chapter 4.
37. Once in higher education some BME groups also appear to have lower than
expected retention rates, although these do vary by subject and ethnic group30.
HEFCE’s analysis of the latest non-continuation rates shows that students from
black and mixed heritage are between 1 and 2.6 percentage points more likely to
drop out than would be expected given their other characteristics31.
38. The largest gaps for BME students are in their degree attainment. When HEFCE
examined degree outcomes for 2006–07 entrants, they found that all BME
groups (black, Chinese, Indian, other Asian and other/unknown) were less likely
than would be expected to obtain first or upper-second class degrees, with the
gap over ten percentage points for black students and around eight percentage
points for other Asian students32. HEFCE’s later analysis of degree outcomes by
entry qualifications found an unexplained gap of 15 percentage points between
white and BME graduates in 2013–14, similar to the observed difference of 16
percentage points. The gaps ranged from five percentage points for graduates
with four As at A-level, to 18 percentage points for graduates with non-A-level
entry qualifications33.
39. Employment outcomes for BME students are also poor. HEFCE analysis found
that graduates from almost all BME groups were less likely than white graduates
to go on to employment or further study six months after graduating. Once
controlled for student characteristics, the biggest gaps were for graduates from
Chinese and black African backgrounds, both of whom were over seven
percentage points less likely to be employed than would be expected if they were
white. Graduates from Pakistani backgrounds were also over six percentage
points less likely to be in employment.
29 UCAS (2016) https://www.ucas.com/corporate/news-and-key-documents/news/ucas-unconscious-bias-report-2016 30 Higher Education Academy (2014) Undergraduate retention and attainment across the disciplines 31 HEFCE (2015) ‘Non-continuation rates: Trends and profiles’ http://www.hefce.ac.uk/analysis/ncr/nhe/ 32 HEFCE (2013) Higher education and beyond: Outcomes from full-time first degree study. Although HEFCE did not control for differential participation rates across ethnic groups, separate analysis by Universities UK suggests that the gap remains even when these are controlled for. In this context, other Asian means not Bangladeshi, Indian or Pakistani. 33 HEFCE (2015) Differences in degree outcomes: The effect of subject and student characteristics
20
40. The gaps tended to be smaller for professional employment, but graduates from
both Bangladeshi and black African backgrounds were more than six percentage
points less likely to be in professional employment than would be expected if
they were white. Forty months after graduation many of the gaps in professional
employment rates increased, with graduates with Pakistani, black Caribbean and
black African heritage all having professional employment rates over eight
percentage points below what would be expected, and graduates with
Bangladeshi heritage having a gap of nearly seven percentage points34.
STUDENTS FROM WHITE BACKGROUNDS
41. White groups have the lowest overall higher education participation rates of all
ethnic groups. There is a particularly negative synergy between socio-economic
background and ethnicity when it comes to participation in higher education by
white working class boys and girls. Research for BIS35 suggests that white British
pupils in the two lowest socio-economic groups (using their own rich measure of
socio-economic status) have lower rates of participation in higher education than
any other group. This was also highlighted by Prime Minister Theresa May as a
key area of concern in her first speech as Prime Minister36.
42. There has also been some suggestion that there is a specific problem with white
working-class boys, or white boys more generally, accessing higher education.
Analysis by UCAS37 of higher education participation of 18-year-old state school
pupils in the POLAR3 quintile 3 by sex, ethnicity, and free school meal status;
and of 18-year-old state school pupils who received free school meals by POLAR3
quintile suggests that, under both measures, white boys from the most
disadvantaged groups have the lowest entry rates to higher education (below
10%). In both cases, however, they are closely followed by disadvantaged white
girls (8% and 13% on the different measures) and mixed-race boys (11% and 14%
on the different measures), who make up the second and third lowest entry rates.
The absolute difference between disadvantaged white boys and girls is also lower
than the difference between the sexes for any other ethnic and socio-economic
group (the proportional difference is larger, but this is largely because of the very
low bases in both cases).
43. It is clear that there is an issue with the participation rate of white boys from the
lowest socio-economic groups. But there is also an issue of a similar magnitude
with disadvantaged white girls and mixed race boys. In all three cases, part of
this issue will be driven by low prior attainment: all three groups have low
average performance at GCSE, with GCSE performance a strong predictor of
entry to higher education.
34 HEFCE (2015) Differences in employment outcomes: Equality and diversity characteristics 35 BIS (2015) Socio-economic ethnic and gender differences in higher education 36 https://www.gov.uk/government/speeches/statement-from-the-new-prime-minister-theresa-may 37 UCAS (2015) End of Cycle Report 2015
21
DISABLED STUDENTS
44. The number of first year undergraduate students reporting a disability in
England has increased from just over 43,200 in 2007–08 to just over 56,000 in
2014–1538. Students reporting a disability, particularly those not in receipt of the
Disabled Students’ Allowance (DSA), have lower degree attainment and
progression into employment compared to those not reporting a disability.
45. There are gaps between the proportion of declared disabled and non-disabled
students who obtain first and upper second class degrees. HEFCE found an
unexplained gap of three percentage points in the proportions of 2013–14
graduates with disabilities obtaining a first or upper second39. Its earlier analysis
by DSA status found that disabled graduates not in receipt of the DSA were three
percentage points less likely than would be expected to get a top degree
classification, while the likelihood that those in receipt of the DSA was in line
with what was expected40. These gaps carry through to employment outcomes,
where HEFCE found that disabled students were between 1.9 (for those not
receiving the DSA) and 3.2 percentage points (for those receiving the DSA) less
likely to be in employment or further study six months after graduation than
non-disabled students with the same characteristics.
46. Interestingly, HEFCE found no immediate gap in professional employment
rates, but found that 40 months after graduation gaps had opened up. Those who
received the DSA were 3.1 percentage points less likely to be in professional
employment than their non-disabled peers, while disabled graduates who had
not received the DSA were 3.5 percentage points less likely to be in professional
employment. This is in a broader context of poor disability employment rates
nationally, with Scope noting41 that the gap between disabled and non-disabled
employment rates has been broadly static, at around 30%, for over a decade.
47. The Advisory Group was asked to look specifically at the experience of students
with a mental health condition. Data from the Equality Challenge Unit (ECU)42
shows that there has been a significant and rapid growth in the number of
students presenting with a mental health condition. Its 2015 statistical report43
shows that since 2007–08 the proportion of disabled students disclosing a
mental health condition increased from 5.9% to 12.8% in 2013–14 (from 0.4% to
1.3% of the entire student population). Research commissioned in 2015 by
HEFCE for its review of provision and support for disabled students44 showed
that this increase varied significantly across the sector, with some institutions
reporting no change and others reporting an increase of 4.5%. Variation also
38 HESA (multiple years) Student Record 39 HEFCE (2015) Differences in degree outcomes: The effect of subject and student characteristics 40 HEFCE (2013) Higher education and beyond: Outcomes from full-time first degree study 41 Scope (2014) A million futures: halving the disability employment gap 42 The Equality Challenge Unit works to further and support equality and diversity for staff and students in higher education institutions across the UK and in colleges in Scotland. It provides a central resource of advice and guidance for the sector. Further information is available at http://www.ecu.ac.uk/ 43 ECU (2015) Equality in higher education: statistical report 2014. Part 2: Students 44 HEFCE (2015) Understanding provision for students with mental health problems and intensive support needs. Report to HEFCE by the Institute for Employment Studies (IES) and Researching Equity, Access and Partnership (REAP)
22
occurred by type of institution, with higher numbers reported at specialist
institutions and the lowest at institutions with medium tariff requirements.
Research45 has also shown that some mature students who have a disability (or a
long-term health problem) are only able to study part time because they need
flexibility to meet their personal study needs. This reinforces the importance of
the availability of flexible and part-time provision.
MATURE STUDENTS
48. In relation to all these categories of disadvantage, it is important to consider the
position of older students alongside that of school leavers. Higher education is
not just about 18-year-olds coming straight from school or college. Indeed, for
large numbers of people, access to higher education and to its transformative
effects may only be feasible later in life. Many mature students, particularly those
aged 25 and above, come from disadvantaged backgrounds and a large number
are from minority ethnic groups.
49. Over the last six years there has been a significant and continuing decline in
mature and part-time participation. Undergraduates aged over 25 fell by 37%
between 2009–10 and 2014–15, and part-time entrants fell by 50% in the same
period. In response to this significant fall, in 2013 Universities UK published a
review of part-time higher education which looked into this decline and
identified areas for action, as well as the areas where more information was
needed to inform policy decisions46. In 2015 Universities UK established an
independent Student Funding Panel to assess the impact of the student funding
system in England on students. This also included potential options for reform of
part-time funding received through a call for evidence including ensuring equity
in maintenance support provided to full-time and part-time students and
restoring loans to access and public funding for Equivalent or Lower
Qualifications (ELQ)47. As we show in chapter 3 the government has since
announced plans to introduce maintenance loans for part-time students and has
further relaxed the ELQ policy with eligibility for tuition fee loans extended to
part-time.
50. To leave mature students out of consideration of social mobility risks effectively
excluding a large proportion of the population. Focusing on older students will
also help to meet wider national policy objectives such as up-skilling the
workforce to satisfy demands for high level skills and improving productivity.
Mature students often wish to study part time (they may lack the time to
undertake full-time study, lack geographical mobility or be more debt adverse
than younger students) so it is important to ensure the nationwide provision of
45 Butcher J (2015) ‘Shoe-horned and side-lined’? Challenges for part-time learners in the new HE landscape, Higher Education Academy https://www.heacademy.ac.uk/resource/shoe-horned-and-side-lined-challenges-part-time-learners-new-he-landscape 46 http://www.universitiesuk.ac.uk/policy-and-analysis/reports/Documents/2013/power-of-part-time.pdf 47 Students studying in higher education are assessed to see whether they are looking to study at the same level to a qualification they already hold or at a lower level to a qualification they already hold. Students categorised as studying for an ELQ may be charged a tuition fee rate that is higher than the standard published rates. This is because in 2008 the government announced that it would no longer provide funding to support universities teaching students who were classed as ELQ status.
23
high quality part-time study opportunities. The inclusion of older students in
efforts to improve social mobility would therefore be good policy, and would help
achieve goals of increasing the number of students from under-represented
backgrounds more generally.
POSTGRADUATE STUDENTS
51. The inequalities evident at undergraduate level can also be seen at postgraduate
level on the basis of social class, gender and ethnicity. There are also differences
in immediate transition to postgraduate study by first degree institution. Rates
are substantially higher in research-intensive universities. Analysis by HEFCE48
shows how participation in postgraduate study, one year after graduation, varies
by quintile, with 5.3% of quintile 1 2013–14 graduates moving into postgraduate
taught study compared to 7.5% of quintile 5 students. These differences are
reversed for transition onto ‘other postgraduate’ study – that is, courses with
certificates, diplomas or for credit – rather than Masters or research
qualifications. Graduates from quintile 1 are between 1 and 2 percentage points
more likely to obtain these types of qualifications than graduates from quintile 5.
52. The same analysis showed differences in progression for other groups. In the
year after they graduated, 7.1% of male 2013–14 graduates began postgraduate
taught courses compared to 6.1% of female graduates from the same year, and
2.1% of male graduates began postgraduate research courses compared to 1.0%
of female graduates. 6.3% of UK-domiciled white 2013–14 qualifiers were
studying postgraduate taught courses within a year of graduation, compared to
7.1% of UK-domiciled BME students. However, notwithstanding more BME
students undertaking postgraduate taught courses, they were less likely to
transition to postgraduate research (1.0% BME compared to 1.9% white).
53. A number of professional and ‘graduate-level’ jobs now require a postgraduate
qualification. Making sure that there is equal opportunity to access postgraduate
study is therefore an important mechanism for improving employment outcomes
for underrepresented groups. In addition, engaging in postgraduate study
provides an important pathway to undertaking postgraduate research, with
postgraduate researchers being likely to form a large part of the next generation
of the academic staff cohort within universities. Improving this flow through to
the postgraduate research population will also assist in making sure that
universities’ staff profiles better reflect the diversity of the student cohort.
MULTIPLE CHARACTERISTICS
54. While this section has categorised students according to their backgrounds or the
broadly-defined equality characteristics (that is gender, ethnicity or declared
disability), many of these characteristics overlap, for instance in relation to age
and ethnicity, or gender and economic disadvantage (often termed
‘intersectionality’). In its End of Cycle Report 2015, UCAS highlighted the
importance of considering multiple equality characteristics in order to gain a
48 HEFCE (2016) Transitions into postgraduate study, 2002–2013-14
24
more in-depth understanding of underrepresentation and disadvantage in higher
education. So while the average entry rate for 18-year-olds from POLAR quintile
3 who attended a state school was 28%, the entry rate for the subset of quintile 3
students who were white, male and received free school meals was just 9%. In the
same report UCAS proposed a statistical method to track equality across multiple
characteristics and reported some results using this classification. The
importance of looking at the intersectionality of characteristics as a tool to
support effective targeting of initiatives across the student lifecycle is reinforced
by OFFA in its latest guidance49 on access agreements.
PLACE
55. There is also evidence which suggests that the relationship between geography
and social mobility is important. It is a relationship that is being increasingly
acknowledged, particularly as a consequence of HEFCE’s research in this area.
Most recently it has identified areas where the level of young participation in
higher education is either higher or lower than expected given levels of
attainment at GSCE50.
56. Many universities see themselves as anchor institutions within their local
community, working with local and regional partners to promote economic,
social and cultural regeneration. In the past, social mobility has been analysed at
national or individual institutional level, with responses tending to follow those
polarities. However, increasingly the focus is on regional responses, with
universities working with partners in their regions to develop sustained
initiatives that align with broader regional agendas (see paragraphs 244-247).
57. The role of place and region must therefore form part of the social mobility
agenda for higher education. That said, mature students in areas without access
to higher education are unlikely to be geographically mobile and may only be
able to access higher education through part-time study or distance learning,
highlighting again the need for the availability of an attractive, inclusive part-
time offer.
SUMMARY OF THE PRIORITIES BASED ON THE EVIDENCE
58. In summary, the evidence suggests that socio-economic disadvantage
has more persistent and far-reaching impact on access to and
outcomes from higher education than any other student
characteristic. It affects entry to university, particularly to high tariff
institutions and courses, across the range of measures: fair access, retention,
degree outcomes, and progression to postgraduate study and/or to graduate
employment.
59. In considering students from disadvantaged backgrounds, the evidence
suggests there should be a particular focus on access for white working-
49 https://www.offa.org.uk/wp-content/uploads/2016/02/strategic-access-agreement-guidance.pdf 50 HEFCE (2016) Gaps in young participation in higher education http://www.hefce.ac.uk/analysis/yp/gaps/

25
class men, though noting that white working-class women and those from a
mixed race background are not that far behind. There is also a strong correlation
between gender, disadvantage and prior attainment.
60. In relation to BME students the focus should be on improving their
progression through higher education and into the labour market.
Specific attention should be paid to improving retention rates for all non-
white ethnic groups (apart from students of Chinese ethnicity), reducing
the gap in degree attainment between ethnic groups, particularly for
black students and Asian students51, and improving employment rates –
particularly long-term professional employment rates – for students with black,
Bangladeshi and Pakistani heritage.
61. For those students with disabilities, the focus must be on increasing
graduate outcomes, employment rates, and particularly long-term
professional employment rates. Specific consideration should be given to
students presenting with a mental health condition.
62. Age poses different challenges. The priority should be to increase the
numbers of mature students going to university, and ensuring the
availability of opportunities to study flexibly, particularly part time. It is also
important that government takes older students into account when
making policy.
63. The inequalities evident at undergraduate level can also be seen at
postgraduate level on the basis of social class, gender and ethnicity. There are
also differences in immediate transition to postgraduate study by first degree
institution. There should be equal opportunities to access postgraduate
study irrespective of background.
51 However, it is important to note here that although Chinese and Indian students achieve above the sector adjusted average for achieving a degree they are below the benchmark for achieving a first or upper second class degree. (HEFCE (2013) HE and beyond: Outcomes from first-time first degree study
26
2. WORKING IN PARTNERSHIP
64. The higher education sector does not operate in isolation. Universities admit
students whose qualifications – and expectations52 – are shaped by many people
and organisations, most obviously for younger students by their experiences and
attainment at school. Students may also have had their experience shaped by a
further education college or alternative provider, and many will have been
supported by a charity in accessing higher education. When students graduate,
decisions about whom to employ, into what role and on what career pathway,
will be determined in large part by employers.
65. This chapter examines the significant role played by different parties in
informing the decisions that students make about university, their prior
attainment, the outcomes they achieve, and the jobs they secure when leaving
university. It also makes specific reference to how these parties and the higher
education sector, working collaboratively, can support a more coordinated
approach to social mobility which will be important in addressing the challenges
set out in chapter 1. The significant opportunities presented by policy-making for
schools, further education colleges and higher education coming together within
one government department are also highlighted.
SCHOOLS
66. Schools have a critical role to play in improving social mobility. The report,
Cracking the Code: how schools can improve social mobility by the Social
Mobility and Child Poverty Commission53, illustrates what schools are currently
doing to support social mobility, and the steps taken by highly effective schools
to support young people from disadvantaged backgrounds. These include:
using the Pupil Premium more strategically
building a culture of high expectations and inclusivity
a continual focus on the quality of teaching
tailored strategies to engage parents
preparing students for all aspects of life, not just exams
67. There is also evidence that shows that some schools have delivered dramatic
changes in educational outcomes for young people. For example in London, the
London Councils report The higher education journey of young London
residents54 (July 2015) shows that disadvantaged young people now perform
better than in any other region in England. They are 38% more likely to get five
good GCSEs, including English and maths, than children elsewhere.
52 We specifically use the word ‘expectations here’ – as does the DfE in the 2016 latest Schools White Paper – as the evidence shows that there is generally no poverty of aspiration among young people. 53 Social Mobility and Child Poverty Commission (2014) Cracking the code: how schools can improve social mobility 54 Storan J, Tindell G and Weeden, S (2015). The higher education journey of young London residents. London Councils
27
PRIOR ATTAINMENT
68. There is a close correlation between attainment at school and university
experience and success at university. This correlation is strong in relation to
participation for students from socio-economically disadvantaged backgrounds
and BME students, particularly in terms of entry to high tariff institutions and
courses. The importance of raising standards across all schools and addressing
the attainment gap between advantaged and disadvantaged pupils has already
been recognised by the Department for Education (DfE) in its recent Schools
White Paper, Education Excellence Everywhere55. This paper shows how the
attainment gap opens early and widens, particularly at secondary levels, and
urges schools to prioritise closing that gap. The focus on raising attainment at
school was reiterated by Prime Minister Theresa May in her first speech56 on
education policy.
69. Research for BIS suggests that low prior attainment is entirely responsible for
the gap between male and female participation in higher education, and is
responsible for most of the gap between advantaged and disadvantaged pupils57.
The same research found that GCSE results58 are more indicative of higher
education participation than A-levels, BTECs59 and other level 3 qualifications.
Although GCSE attainment is a good predictor of future higher education
participation, as we note in paragraph 55, research by the Higher Education
Funding Council of England (HEFCE) shows that differences also occur in higher
education participation across different places. This suggests that while GCSE
attainment is the most powerful predictor, it is not the only explanatory factor
for higher education participation – reiterating the importance of a place-based
approach to social mobility.
70. The research for BIS also highlighted the lower school attainment of pupils
eligible for free school meals, particularly boys and those from certain ethnic
groups. Only 42% of pupils eligible for free school meals achieve five or more A*
to C grades including English and maths at GCSE compared to 70% of all other
pupils, and only 10% of them achieve the English Baccalaureate60. The
proportion of pupils eligible for free school meals who achieve five or more A* to
C grades at GCSE is particularly low – below 30% – in the case of white boys,
55 DfE (2016) Education Excellence Everywhere, Schools White Paper https://www.gov.uk/government/publications/educational-excellence-everywhere 56 https://www.gov.uk/government/speeches/britain-the-great-meritocracy-prime-ministers-speech 57 BIS (2015) Socio-economic, ethnic and gender differences in higher education participation 58 Department for Education (2016) GCSE and equivalent results in England 2014/15 (Revised) 59 BTECs (Business and Technology Education Council) belong to a group of qualifications known as Applied General qualifications. These qualifications provide learning in a vocational area rather than for a single occupation, for example applied science, business or sport, and enable learners to develop transferable knowledge and schools. Initially these qualifications were not considered a definitive route into higher education, however, in recent years this has changed, due in part to the government policy of raising the participation age for education and training to 18. For further information see UCAS’s publication Progression Pathways (2016) https://www.ucas.com/advisers/guides-and-resources/qualification-reform/progression-pathways 60 This is a performance measure for schools, awarded when a pupil secures a grade C or above in English, mathematics, history or geography, the sciences, and a language. It is also notable that high-attaining disadvantaged pupils are significantly less likely to enter the Ebacc than other high attainers, with 59% entering compared with 73% of other high attainers (Department for Employment figures, August 2016)

28
black boys with non-African heritage, boys with mixed white and black
Caribbean heritage, and girls from the traveller and Roma communities.
Collaboration between schools, colleges and universities
71. The close correlation between attainment at level 3 and university success
reinforces the importance of universities working collaboratively with schools to
help raise attainment. Many higher education institutions have already
developed increasingly deep relationships with schools, ranging from outreach
activities to supporting schools in the local community to sponsoring academies,
free schools and university technical colleges (UTCs). We highlight the range of
outreach activities in chapter 4 but focus here on higher education-school
interaction, the impact this has made and how these partnerships can be
improved.
72. Almost ten years ago (2007) Universities UK surveyed61 all universities in
England on how they engaged with, and supported, schools and colleges, to see
‘what works’ and how engagement could be improved. We had a 100% response
which resulted in a wealth of evidence demonstrating that there was a wide
spectrum of engagement. Beyond widening participation and outreach activities
this included activities relating to student progression and transition to higher
education, to curriculum enrichment and support, to teaching and learning
styles, subject specialism, training of the school and college workforce,
governance support and direct partnerships with schools including sponsorship.
From this research it was clear that the rationale for engagement varied, with
institutions adopting different approaches reflecting their diverse missions and
different local circumstances. We concluded that there was ‘no one size fits all’
and that any attempt to prescribe certain forms of engagement in preference
could stifle the innovation and activity that was going on.
73. Since this survey the number of universities entering into sponsorship
arrangements with schools has increased considerably. Research by HEFCE62
indicates that there are now around 60 higher education institutions involved in
sponsorship relationships with around 150 schools. Likewise, the research into
the nature and scale of universities’ involvement in these schools, also found that
motivations for sponsoring schools varied, and so did the ways in which
engagement took place.
74. Sponsorship of schools by universities has been highlighted in Theresa May’s
speech on education policy63 and is included in a recent consultation from the
DfE, Schools that work for everyone64. This report does not cover the detail of
these specific proposals. However, as a general principle any new proposals
61 Higher education engagement with schools and colleges: partnership development http://www.universitiesuk.ac.uk/policy-and-analysis/reports/Documents/2009/engagement-schools-colleges.pdf 62 http://www.hefce.ac.uk/workprovide/schools/ 63 https://www.gov.uk/government/speeches/britain-the-great-meritocracy-prime-ministers-speech 64 The consultation proposes that higher education institutions wishing to charge a fee above £6,000 pa should be required to either establish a new school or sponsor an academy. https://consult.education.gov.uk/school-frameworks/schools-that-work-for-everyone
29
should allow universities the flexibility to consider the evidence and target
funding in a way that works best for the school and students to help raise
attainment. It is also important to acknowledge the wide-ranging collaborative
partnerships that have been developed across higher and further education, and
schools to support the progression of students, alongside the measures to
improve attainment set out in the Green Paper.
75. The HEFCE analysis also explored the impact of sponsorship on pupils’
attainment. This showed that GCSE and equivalent data for the schools
sponsored by a university had improved over time to meet the sector average,
like other sponsor-led academies. This is noteworthy as many of the schools that
were sponsored faced challenges with attainment. However, the research also
showed that GCSE attainment levels remained static, suggesting that the changes
were due to improved attainment in other level 2 qualifications.
76. We welcome the current work by HEFCE to look at the longer-term impact of
sponsorship, especially on academic performance in the schools and progression
on to higher education and its plan to provide universities with a tool-kit to help
them identify the key factors to consider when developing such arrangements.
Building on this work we recommend a systematic review of the
evidence on the effectiveness of activities undertaken by higher
education institutions and employers to support the raising of
attainment in schools. This should be undertaken by the new
Evidence and Impact Exchange proposed later in our
recommendations (see paragraph 236). Research by the National
Coordinating Centre for Public Engagement on school and university
partnerships is also relevant here by highlighting what makes an effective
engagement for universities and pupils65.
77. The Advisory Group’s discussion with schools highlighted that the ending of the
collaborative planning framework afforded by Aimhigher and Lifelong Learning
Networks in 2011 had resulted in a lack of coordination in engagement between
the higher education and school sectors. Some schools and colleges receive many
offers of outreach and others, particularly in rural and coastal areas, receive
none. In response to this, HEFCE’s collaborative outreach schemes, the National
Networks for Collaborative Outreach and (its most recent scheme) the National
Collaborative Outreach Programme (NCOP)66 should provide an important
mechanism for facilitating more coherent and coordinated partnership working
between all sectors.
65 This is an initiative funded by the research councils to support the enriching of the curriculum and to motivate young people to be excited about research and to raise their aspirations for further study and future lives. https://www.publicengagement.ac.uk/work-with-us/current-projects/school-university-partnerships-initiative 66 The NCOP is a four-year programme from 2017 to 2020, developed by HEFCE in response to the government’s ambition to double the proportion of students from disadvantaged backgrounds in higher education by 2020. It will support intensive outreach by consortia aimed at increasing participation in higher education in 997 wards where higher education participation rates are low overall, and lower than expected given Key Stage 4 GCSE (and equivalent) attainment levels. The model used to allocate NCOP funding is targeted and draws on HEFCE’s Gaps analysis: this includes gaps in participation based on (a) Key Stage 4 attainment only and (b) Key Stage 4 attainment and ethnicity (see Chapter 2). Funding for the programme will remain at £60 million per calendar year for the first two years.

30
78. The NCOPs are also well positioned to support a more coordinated transition
across different parts of the education system by encouraging broad local
partnerships of schools, colleges, universities, chambers of commerce, trade
unions, politicians and local authorities to form Raising Participation Action
Groups in areas where a young higher education participation rate is low and a
substantial participation gap exists.
79. Although about half of the HEFCE-funded higher education sector is involved in
sponsorship relationships, this only represents around 150 schools – a small
proportion of non-state-maintained schools. This raises the question of how
activity like this, and school-higher education engagement more broadly, can be
scaled up to ensure that no school is disadvantaged, particularly schools in areas
where there is no higher education provision. We recommend that higher
education institutions explore how different models of higher
education and school interaction can be further developed and scaled
up. Many, if not all, universities are already actively involved in
schools collaborations, including the provision of home-work clubs,
summer schools or teaching support. The form this takes will depend
on institutional strengths and local circumstances and may include
collaboration both with and outside NCOPs, for example with
successful charitable organisations.
Changes in qualifications and the school system
80. Since 2010 the government has implemented a series of changes to the school
system including new performance indicators and adjusted funding levels. (The
Institute for Fiscal Studies estimated in April 2016 that there would be at least a
7% real terms reduction in per-pupil spending between 2015–16 and 2019–2067.)
Qualifications are also undergoing significant reforms, and as we show in
paragraphs 82–83 there has been a significant shift in the types of qualifications
with which many young people are applying to university. Given these changes
are still being implemented it is not possible to say if, or how, these could impact
on participation in higher education. We suggest therefore that the DfE and
HEFCE should keep this under observation.
81. Reforms to A-levels have seen the decoupling of the AS from the A-level, so that
many English students will now apply to higher education without AS results.
For many disadvantaged applicants the AS has in the past shown the trajectory
of their progress since GCSE and as a result provided a basis on which
universities could offer them a place. It is not until September 2020 that
applicants from England will apply holding a full set of both reformed A-levels
and GCSEs. This means that universities can anticipate a much greater diversity
of qualifications held by applicants. The admissions environment is further
complicated by the divergence of A-levels and GCSEs across the UK and reforms
to vocational qualifications. UCAS and the Supporting Professionalism in
67 (2016) House of Commons Briefing Paper, No 06702, School funding in England. Current system and proposals for ‘fairer school funding’ www.parliament.uk/briefing-papers/SN06702.pdf
31
Admissions programme (SPA) are working with the higher education sector to
ensure that universities are aware of these reforms. Universities have already
begun responding to these changes by producing qualification reform statements
expressing their commitment to being flexible with schools and colleges during
this transition68.
Increase in take-up of vocational qualifications such as BTECs
82. Alongside the changes in A-levels, there has been an increase in the number of
students entering higher education from schools and colleges with vocational
qualifications, particularly BTECs69 or a portfolio of BTECs and A-levels.
Analysis by the Social Market Foundation70 found that between 2006 and 2014
the number of pupils completing BTECs rose from 45,000 to 150,000 and that
almost 100,000 (one in four) students entering university had a BTEC
qualification compared to just under 50,000 in 2008. The fastest growing route
of all was among students studying a combination of A-levels and BTECs. A
higher proportion of students with BTECs identify as BME than do those with
other qualifications. A higher proportion of first degree students who had
previously achieved a BTEC also come from low participation areas (18% of
BTEC qualifiers come from quintile 1 as opposed to 8% of A-level qualifiers and
13% of all first year, first degree, students in England), and report having parents
with no higher education experience71. Surveys with schools have suggested that
higher education institutions are likely to see a continued increase in the
numbers of students applying with BTECs,72 although 2015 admissions data
showed a fall in the number of BTEC applicants.
83. Understanding BTECs is important as not all courses, particularly in some high
tariff institutions, will be accessible with BTEC qualifications only, and some do
not accept BTECs at all. In addition, some applicants may need additional
support in making the transition to higher education. These changes require the
higher education sector, schools and students to have a better understanding of
the different qualification pathways and the implications for progression. This
will become even more important with the streamlining of the national system of
technical qualifications and the expansion in apprenticeships (see paragraphs
97–102). The work by the University Vocational Awards Council and UCAS to
68 https://www.ucas.com/advisers/guides-and-resources/qualification-reform 69 BTECs belong to Applied General qualifications, which provide learning in a vocational area rather than a single occupation, for example applied science or sport. There are a range of other vocational qualifications alongside BTECs in this category by other awarding organisations such as City and Guilds, and OCR. Alongside these are Tech Levels which are designed for students who have a clear idea about the occupation they wish to pursue. 70 Social Mobility Foundation (2016) Passports to Progress. How do vocational qualifications help young people in building their careers? Part One at http://www.smf.co.uk/wp-content/uploads/2016/07/Social-Market-Foundation-Passports-to-Progress-Vocational-Qualifications-Embargoed-0001-070716.pdf,. 71 Universities analysis of HESA (2016) Student record 72 The change to linear A-levels, the withdrawal of applied A-levels and the constraints of funding may result in more schools and colleges offering qualifications other than A-levels to a wider cohort of students. See the UCAS report on Progression Pathways published in January 2016 https://www.ucas.com/sites/default/files/progression-pathways-report-final-v2.pdf
32
identify the support needed to progress onto higher education from level 3
vocational qualifications will be particularly important here73.
School performance measures
84. Changes to measuring school performance are also relevant in terms of the
potential impact these may have on the subjects being offered by a school and
therefore available for potential applicants to higher education74. In August 2016
the DfE published the performance indicators75 to be used by schools in 2016–17.
The five headline measures are progress, attainment, progress in English and
maths, retention and destinations. The destination measure helpfully refers to
the number of students entering higher education. This is further broken down
into the number of students entering the ‘top third’ of higher education
institutions, the Russell Group and Oxford or Cambridge. We note that this focus
on specific parts of the higher education sector could detract from efforts to
ensure that students apply to the course and institution that best suits their
circumstances and ability.
Policy coherence across schools, colleges and universities
85. The recent move of higher education policy into the DfE provides significant new
opportunities for alignment of policy across schools, colleges and universities.
This could be particularly helpful in facilitating the alignment of data across all
sectors and within higher education. The move should also support a more
joined-up approach to collaboration between schools, colleges and universities.
Information, advice and guidance
86. Reforms to the school system and the development of a higher education market
(see chapter 3), highlight the importance of having effective information, advice
and guidance (IAG) available. This was reflected at the SMAG Schools’
Roundtable, along with concern at the current role and status of careers advice in
state schools. This issue partly arises from the consequences of the abolition of
the Connexions service, with responsibility for careers advice being transferred
to schools with support from the National Careers Service.
87. The lack of systematic provision of careers advice in schools has led to the
creation of the Careers and Enterprise Company76. This had been designed to
broker partnerships between schools, further education colleges and employers.
73 The UVAC, with the backing of Ofqual and UCAS, has set up a Higher Education and Awarding Organisation Vocational Qualifications Committee. This committee is looking at how to encourage the higher education sector to engage in the development of level 3 vocational qualifications. 74 From 2016, the English state school performance at key stage 4 (GCSE) is measured using a basket of measures. These include EBACC passes (passes at GCSE A*–C in English, maths, two sciences, a language, history or geography) and Attainment 8, that is an average standard reached in eight subjects (English and maths double weighted, three EBACC subjects, and three other subjects from a government-approved list). In light of these measures schools are incentivised to prioritise delivery of a minimum of English, maths, science (but only two qualifications), languages (but only one qualification) and either history or geography. 75 DfE (2016) School and college performance tables, Statement of Intent, August 2014 https://www.gov.uk/government/publications/school-and-college-performance-tables-2016-statement-of-intent 76 https://www.careersandenterprise.co.uk/
33
However, schools’ delegates suggested that further work was needed to develop a
greater coherence between all parties in the advice provided to pupils,
particularly in terms of graduate careers, the impact of subject choices, and the
qualifications taken at schools for entry to some higher education courses. To
facilitate this, Universities UK will engage directly with the Careers and
Enterprise Company to explore how coordination with the higher education
sector can be enhanced.
88. The difficulty for applicants to navigate their way through the wide range of data
sources available and knowing which source to use was also noted. Ensuring that
information is clearly signposted on websites and embedding careers advice into
outreach activities will help address this. We also suggest that HEFCE’s work on
public information77 should consider how this might be better streamlined so
that students and their families have a clearer idea of the best information
sources to use. Inevitably this particularly impacts on students from
disadvantaged backgrounds or those whose parents have not been to university,
and who may not have the same access to networks and information and
therefore need to access information via other channels such as institutional
websites.78
89. A lack of funding to support IAG was also an issue; this was thought to have
resulted in the compounding of inequalities, particularly in schools with lower
levels of funding (this is likely to be true in rural and coastal areas, which tend to
have lower levels of higher education participation more generally).
90. The absence of professional IAG, and of a careers service for 16- to 18-year-olds,
was reinforced in the latest report of the House of Lords Select Committee on
Social Mobility79 which called for a new gold standard in independent careers
advice which would move responsibility away from schools. This is to be
welcomed, together with the inclusion of benchmarks from the Gatsby Good
Career Guidance80 in the DfE statutory guidance to support schools and colleges
in implementing their careers advice duty.
91. The DfE in the Schools White Paper recognises the need to develop a strategy to
improve careers provision. We recommend that the new strategy on
careers provision ensures that joined-up and coherent careers advice
is delivered to young people in schools and colleges so that the post-
16 options are properly explained and not presented as mutually
exclusive. The higher education sector should be engaged in the
development of the strategy.
77 http://www.hefce.ac.uk/lt/roiconsult/ 78 In September 2016 a website Advancing Access http://www.advancingaccess.ac.uk/ was launched by the Russell Group to provide good practice examples and how-to guides for teachers and college staff helping pupils with post-16 subject choices and university decisions. 79http://www.publications.parliament.uk/pa/ld201516/ldselect/ldsocmob/120/120.pdf 80 http://www.gatsby.org.uk/uploads/education/reports/pdf/gatsby-sir-john-holman-good-career-guidance-2014.pdf
34
92. In summary, although it is not appropriate or feasible for universities to act as a
substitute for effective careers advice in schools, there is a clear and important
role for greater collaboration between schools and universities in the advice that
is given to students. This coordination between schools and universities could
have a specific focus on the experience of BME and disabled students, whose
graduate outcomes, as outlined in chapter 1, lag behind those of their peers. At
present, there is little evidence of coordination in careers advice between schools
and universities for these groups. The collaborative relationships maintained
since the closure of Aimhigher will support this process. HEFCE’s National
Collaborative Outreach Programme will also provide an important mechanism to
facilitate more strategic coordination of IAG across all parties.
93. Universities and schools engaged in teacher training should explore how each
route could have a component part that familiarises teachers with the widening
participation agenda and connects them with outreach providers. Universities
UK will consult with the DfE and other relevant bodies on how this can be taken
forward.
FURTHER EDUCATION COLLEGES
94. Further education colleges have an important role in access and widening
participation to higher education. They are important suppliers of higher
education students, as well as providing higher education courses, historically for
part-time, local and employer-supported students. All of these categories have a
high incidence of students from widening participation backgrounds.
95. Colleges supply a third of higher education students. Research from BIS81
indicates that 29% came from the most deprived neighborhoods in the country,
and 41% (160,395) of the 2011–12 tracked college cohorts were from the lowest
two POLAR quintile groups, representing the most educationally disadvantaged
areas in England.
96. Colleges, as a major supplier of students to higher education and through their
own higher education provision, therefore have an important role to play in
contributing to improving access to higher education and supporting the
government’s ambitions to make faster progress.
DIVERSE PATHWAYS TO HIGHER EDUCATION
97. Many students go to university with traditional GCSE and A-level qualifications
but many, particularly mature students, do not. Increasing numbers of students
are coming in to higher education through different routes, entering at different
times in their lives, choosing different modes of study and studying a broader
range of qualifications. Increasing the possibility for entrants to hold different
qualifications or to use prior experience as an entrance qualification offers a
further opening up of higher education, particularly for those excluded when
younger by educational disadvantage. Degree apprenticeships also have an
important role here, as do BTECs and other vocational qualifications, along with 81 BIS Research Paper 239 (2015) Progression of college students in England to Higher Education
35
Access to Higher Education qualifications82, foundation degrees and higher
national certificates (HNCs) and diplomas.
98. Enhancing the diversity of routes into higher education is good for social
mobility and good for meeting the country’s skills needs. The government’s
productivity plan stresses the importance to the UK economy of addressing
shortfalls in intermediate, advanced-professional and technical skills. The UK
higher education sector already has a strong interest in this agenda and has been
working with further education colleges at the local level to deliver vocational
qualifications. According to HESA data83, universities are currently the named
providers of 8,917 HNCs, 7,794 higher national diplomas and 51,138 foundation
degrees, with many of these delivered in partnership with further education
colleges.
99. Universities are also engaging with the delivery of degree apprenticeships. In a
very short space of time, around 40 universities have developed and are now
delivering degree apprenticeships. From no degree apprenticeships in 2014–15,
there are now over 2,000 starts84. In autumn 2016, Universities UK will conduct
a survey of its members on their approaches to degree apprenticeships. This will
provide a better understanding of the strategies, motivations, challenges and the
barriers universities face and will help inform future policy. These
apprenticeships will play a key role in cementing collaborations between
universities and businesses, boosting UK productivity, and providing a new
pathway into higher education and to a career. It is anticipated that work-based
models of learning such as higher and degree apprenticeships will continue to be
important in attracting different groups of students, particularly those who may
not previously have considered higher education as a route to employment.
100. Alongside apprenticeships the government has recently set out plans to deliver
a streamlined national system of technical qualifications to support young people
and adults into skilled employment.85 Each person at 16 will be given a choice
between an academic and a technical option, with a bridging provision to move
from one option to another. The technical option will be built around 15 routes to
skilled employment with standards being set by employers.
101. Although we endorse the intention to improve the quality and relevance of
qualifications and to improve the status of technical education, we are concerned
that the technical side only offers the possibility of higher and degree
apprenticeships. We believe universities should be able to engage with both
options and at all levels.
102. Information on these options, particularly the flexibility provided by the
bridging provision, must be integrated into information, advice and guidance in
the very early stages.
82 https://www.accesstohe.ac.uk/Pages/Default.aspx 83 HESA Student Record 2013–14 84 UUK (2016) Supply and demand for higher level skills 85 Post-16 Skills Plan https://www.gov.uk/government/publications/post-16-skills-plan-and-independent-report-on-technical-education
36
Information, advice and guidance for mature students
103. Improving IAG in schools and colleges – and between schools, colleges and
universities – is essential to improve the quality of decisions made by young
students. But it will do little to assist the choices made by mature students. A
properly functioning higher education market will require IAG provision that is
able to embrace and accurately reflect all students and not just those in a school
or college setting. This should include clearer information about loans and
financial support as well as the opportunities for flexible learning, including part-
time studying options, and how to apply in the absence of a central admissions
service for part time.
104. Many universities recognise skills and experience that an applicant may have
already gained in the workplace. This process is known as Accreditation of Prior
Experiential Learning (APEL)86; it can be particularly helpful for mature
applicants who have been out of formal education for a long time. To ensure
potential applicants are aware of this facility, institutions are encouraged to give
prominence to APEL on their websites.
ALTERNATIVE PROVIDERS
105. The 2012 reforms to remove barriers to entry for alternative higher education
providers were aimed at encouraging a level playing field for providers of all
types. These reforms have been developed in the 2016 White Paper and Higher
Education and Research Bill, to further open up the market to alternative
providers. There is no comprehensive data available from HESA so it is difficult
to estimate the size of the current student body at alternative providers. However,
from Student Loans Company data we know that in 2014 there were 37,559
registered students from England who accessed tuition fee loans for study at the
124 alternative providers with specific course designation based in England87.
106. The above numbers illustrate the breadth of provision by the non–publicly-
funded higher education sector. These range from very small, often specialist,
institutions, with fewer than 100 students, through to much larger and often
more generalist institutions which operate and function like public universities
with their own degree awarding powers and/or university title, and academic
infrastructure.
107. A 2016 BIS survey88 found that as many as 46%89 of students in privately
funded institutions were from BME groups, while data from the Student Loans
Company shows that students at alternative providers are more likely to come 86 APEL or Accreditation of Prior Experiential Learning is a process that enables an individual to receive formal recognition for skills and knowledge they already possess and which have not been previously assessed or awarded credit. 87 There are many more alternative providers of higher education who do not have designated status for their students to access support in terms of loans and grants. Research for BIS by IFF Research Ltd published in May 2016 identified some 732 alternative providers of higher education which served somewhere between 245,000 and 295,000 students as of spring 2014. 88 BIS (2016) Understanding the market of alternative higher education providers and their students in 2014 89 Recently released HESA data (HESA Experimental SFR 235 https://www.hesa.ac.uk/news/15-06-2016/sfr235-alternative-providers
37
from lower income backgrounds.90 This is reinforced by data from both the 2016
BIS/IFF report and the 2016 HESA reports which suggest that the student
population in alternative providers is predominately from a widening
participation background. In view of this, growth in their numbers and in the
number of students studying with them may have a positive impact on social
mobility.
108. A strong message from an Alternative Providers’ Roundtable held to inform
this report was that they believed, in many cases, that they were in a strong
position to provide diverse pathways into higher education in ways that
benefit students from disadvantaged backgrounds. They could also provide
smaller, local colleges and universities with specific facilities or course design
to enable more vulnerable learners to feel safe and supported, such as one to
one teaching and flexible pathways through education allowing students to
step in and out of degree courses when they need to.
109. Alternative providers were also able to offer students flexible course
pathways towards degree qualifications, as opposed to exit awards should a
student wish to leave their course before obtaining a degree. The most recent
HESA data suggests that alternative providers offer more flexible routes to
degrees with 40% of the students in the HESA sample undertaking HND or
HNC courses, and this increases to 50% for those who were not undertaking a
‘First Degree’.
110. Both of these factors have significant impact on the retention rates at
alternative providers as defined by the HESA non-continuation metric. As we
move towards a new regulatory environment for higher education it will be
important to ensure that there is a continued focus on promoting, supporting
and monitoring participation and retention. Independent Higher Education91,
the representative body for alternative providers, is working with government
and sector organisations to ensure that regulations and data around retention
better encourage the flexibility that widening participation students’ need to
achieve social mobility.
111. It will be important that any changes to the regulatory environment ensure
that different routes into and through higher education can be supported and
encouraged, and that student choice is protected. An awareness of the support
needed for those from disadvantaged backgrounds to succeed is also
critical. This will involve further consideration of issues such as whether and
how alternative providers may access public support for social mobility
through the Student Opportunity Fund and the way retention data is used
within the context of a new regulatory framework.
112. We recommend that the Practitioners’ Reference Group should
explore the flexible pathways and transitions between schools,
90 In 2012–13, 77% of students at alternative providers were eligible for the full maintenance grant compared to 43% at public providers. 91 Independent Higher Education http://independenthe.com/
38
colleges, alternative providers and universities with better data to
articulate the transition at each stage.
CHARITIES AND THE THIRD SECTOR
113. There are many charities working either exclusively or in part to address social
mobility in higher education, seeing higher education as one of the best levers
available to address wider social disadvantage. The charitable or ‘third’ sector
acts as a broker to support universities in widening access and in linking
universities with employers at the other end of the student lifecycle.
114. Many charities have a regional focus, with a number working in London and the
south east. Sometimes these organisations are associated with particular groups
of universities, and can focus on addressing social mobility in a particular
professional area, for instance supporting disadvantaged or BME graduates into
professional careers. As such, these organisations have a critical role to play in
supporting the delivery of the priorities as set out in chapter 1. There is currently
no directory or list of all educational charities. Knowing what these are, where
they are located and their reach will be important in supporting a more
coordinated approach between charities, schools, colleges and universities. This
information will also be useful to those engaged with HEFCE’s National
Collaborative Outreach Programme (NCOPs) in exploring whether more could be
done to link charities with NCOPs. We therefore recommend that the
Practitioners’ Reference Group, working with the charitable sector,
should develop a map of charitable sector activities. This will help
efforts to raise attainment to be scaled up in ‘cold spots’ in conjunction with the
NCOP funding bids.
115. Alongside charitable sector activities, there are some innovative initiatives
looking at how outcomes-based commissioning can support social mobility,
particularly on a regional basis. The impact that these initiatives can have
deserves close consideration in the context of evaluating how central funds can
be allocated most effectively. It is proposed that the potential impact of such
models of outcomes-based commissioning should be considered by the Evidence
and Impact Exchange we recommend later in the report, and examples of
successful initiatives promoted by the exchange (see section on evaluation and
impact paragraphs 233–238).
EMPLOYERS
116. This section of the report and its recommendations have been significantly
informed by discussions at a roundtable with a group of employers (see Annexe
C). This meeting was arranged by the Advisory Group to capture a broader range
of views on employers’ graduate recruitment practices and how collaboration
with the higher education sector could be enhanced.
39
117. As shown in chapter 192 graduate outcomes are substantially influenced by
student background. This is partly to do with ‘push’ factors: there is evidence that
students from lower socio-economic groups are less likely to engage in
opportunities outside of the curriculum that boost employability (for example,
internships, extracurricular activities and opportunities to work / study abroad).
However, there are also ‘pull’ factors associated with employers’ practices that
affect these data.93 This is problematic for universities because they cannot easily
influence the decisions that employers make as to whom to recruit and at what
salary. There is also evidence of a strong bias from certain employers to engage
with and recruit from high tariff universities, which typically have a lower
proportion of students from lower-socio-economic groups. This is illustrated in
Figure 1 below.
Figure 1: Visits by top employers to universities campuses94
Source: University of Leicester in progress report by the Independent Reviewer on
Social Mobility and Child Poverty, 2012
118. While universities have a responsibility to support the progression of students
from under-represented groups, employers also have an important role to play,
not least in ensuring that their practices do not risk undermining the efforts in
the education sector. Collaborative working with universities will play an
important role in enhancing social mobility. Indeed, many employers are now
taking steps to ensure that their graduate recruitment policies are inclusive. This
not only helps ensure that their graduate intake is more representative of the
communities they serve, it also supports their own corporate social responsibility
agendas.
119. The recent Bridge Group report, Inspiring policy: graduate outcomes and
social mobility95, describes how employers are beginning to adopt a more
92 HEFCE (2016) Differences in employment outcomes: Comparison of 2008-09 and 2010-11 first degree graduates http://www.hefce.ac.uk/pubs/year/2016/201618/ 93 The Bridge Group (2016) Inspiring Policy: Graduate outcomes and Social Mobility http://www.thebridgegroup.org.uk/wp-content/uploads/2015/08/BG-Employability-Report-FINAL.pdf 94 www.gov.uk/government/uploads/system/uploads/attachment_data/file/80188/Higher-Education.pdf
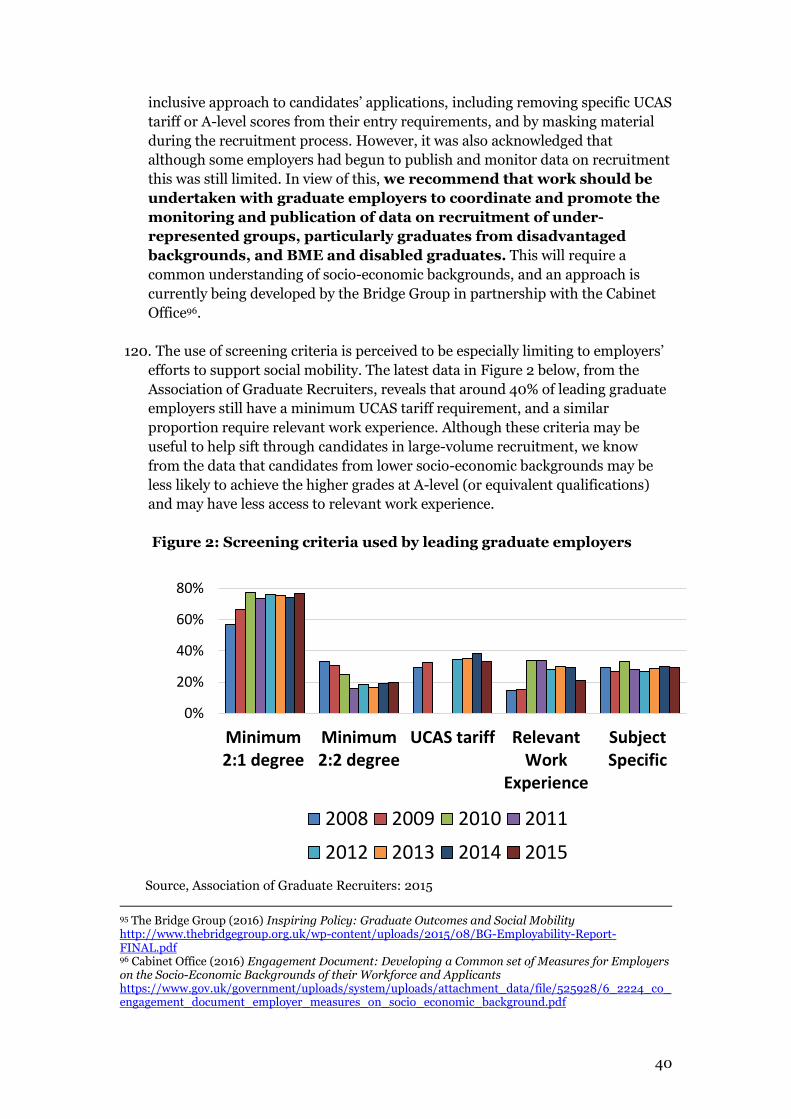
40
inclusive approach to candidates’ applications, including removing specific UCAS
tariff or A-level scores from their entry requirements, and by masking material
during the recruitment process. However, it was also acknowledged that
although some employers had begun to publish and monitor data on recruitment
this was still limited. In view of this, we recommend that work should be
undertaken with graduate employers to coordinate and promote the
monitoring and publication of data on recruitment of under-
represented groups, particularly graduates from disadvantaged
backgrounds, and BME and disabled graduates. This will require a
common understanding of socio-economic backgrounds, and an approach is
currently being developed by the Bridge Group in partnership with the Cabinet
Office96.
120. The use of screening criteria is perceived to be especially limiting to employers’
efforts to support social mobility. The latest data in Figure 2 below, from the
Association of Graduate Recruiters, reveals that around 40% of leading graduate
employers still have a minimum UCAS tariff requirement, and a similar
proportion require relevant work experience. Although these criteria may be
useful to help sift through candidates in large-volume recruitment, we know
from the data that candidates from lower socio-economic backgrounds may be
less likely to achieve the higher grades at A-level (or equivalent qualifications)
and may have less access to relevant work experience.
Figure 2: Screening criteria used by leading graduate employers
Source, Association of Graduate Recruiters: 2015
95 The Bridge Group (2016) Inspiring Policy: Graduate Outcomes and Social Mobility http://www.thebridgegroup.org.uk/wp-content/uploads/2015/08/BG-Employability-Report-FINAL.pdf 96 Cabinet Office (2016) Engagement Document: Developing a Common set of Measures for Employers on the Socio-Economic Backgrounds of their Workforce and Applicants https://www.gov.uk/government/uploads/system/uploads/attachment_data/file/525928/6_2224_co_engagement_document_employer_measures_on_socio_economic_background.pdf
0%
20%
40%
60%
80%
Minimum2:1 degree
Minimum2:2 degree
UCAS tariff RelevantWork
Experience
SubjectSpecific
2008 2009 2010 2011
2012 2013 2014 2015
41
121. How employers engage with students on higher education campuses was also
raised at our roundtable discussion. Employers were aware that in delivering
recruitment events at an institution they were only able to reach self-selected
students. Although this practice is to be encouraged, employers were also keen to
explore how these engagement opportunities could reach a wider range of
students, including those from lower socio-economic groups, who may be less
likely to opt into such events that are typically held in the evening or could be off
campus. In view of this the Advisory Group supports the recommendation by the
Bridge Group in its research into socio-economic diversity in the Fast Stream97
that employers should, where possible and desirable, engage academically with
students, delivering workshops, case studies, and co-delivering seminars and
lectures. This form of engagement would enable a more diverse audience to be
reached and is likely to be more impactful in terms of encouraging students who
may not have previously considered applying.
122. To support the sharing of good practice in recruitment we recommend that
consideration is given to exploring how best to share the evidence on
effective practice and evaluation of interventions and outcomes,
potentially by linking into the new Evidence and Impact Exchange
proposed later in our recommendations (see paragraph 236) as well as
options for benchmarking performance. This will require employers to take a
more robust approach to monitoring candidates’ socio-economic backgrounds
and to ensuring evaluation and transparency in recruitment practices.
123. We recommend better coordination of outreach activities between
employers and between employers and universities. This could
include the promotion of sector-specific collaboration models and
career advice. This was highlighted in our employers’ roundtable and could
involve coordination of activities and coordination in terms of how to measure
impact and evaluation. It could also include better feedback loops from graduate
employers to higher education institutions about the employability skills of
graduates from disadvantaged backgrounds, and where more support was
needed, along with better coordination of careers advice between universities
and employers. This feedback should include evidence about where candidates
are not successful in the selection process, such that specific interventions can be
designed to address this. Consideration could also be given to supporting and
promoting sector-specific collaborative models to deliver more effective
outreach, for instance as with PRIME (for the legal profession) or Access
Accountancy (for accountancy).
124. Given the significance of small and medium enterprises (SMEs) in the UK
labour market as a destination for graduates, we recommend that
Universities UK, working with employers and their representative
bodies, should explore how universities can support SMEs and other
97 https://www.gov.uk/government/publications/socio-economic-diversity-in-the-fast-stream-the-bridge-report
42
employers through a regional approach to tackling disadvantage.
This should include engaging with regional structures such as Local
Enterprise Partnerships and City Deals, and the broader role
universities play in their local communities.
125. There was interest from employers in exploring how they and universities could
improve collaboration more broadly. To support this Universities UK
through its work with its members and employers, will explore how
to increase and enhance the links between employers and the
curriculum and the student experience, through activities such as
placements, internships and mentoring as well as new models of
delivery and partnerships such as degree apprenticeships. This could
build on the evidence of employability activities set out in access agreements and
the evidence obtained from Universities UK’s Skills Review98, which will explore
collaboration between universities and employers in more detail.
126. The employers who participated in our roundtable discussion were keen to
continue working with Universities UK and GuildHE and agreed that the
roundtable should evolve into an Employers’ Forum which would act as the
mechanism for taking this work forward.
98 UUK’s Skills Review issued a call for evidence in September 2016. This sought feedback from employers on skills and employability strategies, the value of work experience, addressing the mismatch of skills, and the most effective approaches to supporting skills development and securing employment. For more information see http://www.universitiesuk.ac.uk/policy-and-analysis/Pages/review-of-skills.aspx
43
3. POLICY AND A CHANGING HIGHER EDUCATION
LANDSCAPE
127. The last chapter focused primarily on the wider environment and some of the
changes needed to ensure higher education is working effectively with partners
and is well placed to meet the challenging objectives identified in chapter 1. This
chapter examines some of the higher education-specific areas relating to the role
of competition, the developing market, government policy, funding and
regulation, the shift from grants to loans, and other external factors. It also
considers the actions needed to deliver a higher education system that allows
universities to contribute most fully to social mobility and to ensure that all
students are supported to achieve their full potential.
INCREASED STUDENT CHOICE AND THE DEVELOPMENT OF A HIGHER
EDUCATION MARKET
128. The reforms set out by the government in its 2011 White Paper and further
developed in its 2016 White Paper and the Higher Education and Research Bill
have been and continue to be significant, impacting on the perceptions and
behaviours of students and on institutional strategy and decision-making. This in
turn has implications for the contribution that higher education makes to social
mobility.
129. One of the most significant changes has been the removal of restrictions on the
overall numbers of students who can go to university. Removing artificial limits on
the numbers of students an institution can recruit has removed one potential
barrier to access. It has also offered opportunities to develop and meet demand for
more flexible and creative routes into and through higher education. However, as
we have already highlighted in chapter 2, for these opportunities to be fully
realised, effective provision of information, advice and guidance is required. This
should have the capacity to embrace and reflect the diversity of students – both
young and mature – and of institutions (see chapter 5 for recommendations on
information, advice and guidance).
130. The removal of student number controls has been one contributing factor to an
increase in competition between universities to attract domestic undergraduate
students. While there has been limited competition in terms of fee levels99,
institutions have aimed to maintain and in some cases increase their student
numbers (and therefore their market share and income) by100:
scrutinising the courses they offer to gain a better understanding of their
relative market position and the needs of the student population they attract
99 The former Office for Fair Trading found in 2014 that there were a number of reasons why tuition fees are concentrated around the level of the fee cap, including the increase in fees occurring simultaneously with a reduction in teaching funding, excess demand for university places overall, demand not being particularly price sensitive, and the potential for students to interpret lower fees as an indicator of lower quality. 100 Universities UK (2013) The funding environment for universities and Universities UK (2014) Trends in undergraduate recruitment
44
distinguishing their courses from those of other institutions, both nationally
and regionally, through marketing activities and advertising campaigns
developing offer-making strategies through examining the qualifications of
students, coordinating offer-making across the institution, introducing or
expanding the use of unconditional offers, making earlier offers, and
improving the speed with which offers are made
introducing financial and other incentives to attract students, and the use of
scholarships and bursaries
an increasing focus on outcomes, particularly graduate employment
measures, as part of the information set provided to students, and greater
collaboration with employers
improving the provision of information for students, from pre-application to
application, and then to post-entry stages; institutions have become more
conscious of the range of information students use to make their decisions,
including prospectuses, course listings sites (such as ucas.com, unistats,
Which?, whatuni), league tables, school visits, open days and higher education
fairs
131. Greater competition has acted as a driver for institutions to focus on recruiting
students from lower participation backgrounds, including students from
disadvantaged backgrounds. At the aggregate level this should mean that the
market is working with the grain of widening participation and to support social
mobility (see paragraphs 169–172 for progress in widening participation). At an
institutional level it may, however, also mean that a limited number of institutions
are recruiting larger numbers of students from disadvantaged backgrounds,
thereby narrowing rather than expanding their social mix. This is an area which
requires further monitoring and analysis by the Higher Education Funding
Council for England (HEFCE)/ the new Office for Students (OfS), but it is unlikely
that increased competition on its own will be able to achieve an increase in
progress in widening participation.
132. In addition, the ability of institutions to recruit and retain students will impact on
their overall income, which in turn will affect their ability to invest fee income in
widening access and student success activities.
133. Other consequences of increased competition include the potential disincentive
for collaboration between institutions, and potentially, at least for the time being,
an increasing focus on traditional three-year, full-time, on-campus first degree
provision101. Higher fees have also led to students becoming (understandably)
more demanding, which for some institutions has necessitated new approaches to
widening participation and support for students, including more flexible delivery
and teaching and learning tailored to the individual. There is also evidence that
greater exposure to market forces has led to an increased focus on evaluating
activities and providing evidence on the impact of university spending on
widening participation and student success.102
101 Student Funding Panel (2015) An analysis of the design, impact and options for reform of the student fees and loans system in England 102 OFFA (2016) Outcomes of access agreement monitoring for 2014–15

45
COORDINATION IN GOVERNMENT POLICY ON SOCIAL MOBILITY ACROSS
SCHOOLS, FURTHER AND HIGHER EDUCATION
134. Government policy on social mobility between schools, colleges and universities
has not been as effectively coordinated as it could be. This has led, for example, to
different definitions and indicators of disadvantage being used between the
Department for Education (DfE) and the former Department for Business,
Innovation and Skills (BIS), with the same student potentially being characterised
in two different ways as they progressed from school to university. The recent
changes to the machinery of government reforms, with responsibility for students
moving from BIS into DfE, presents an unparalleled opportunity to address this
issue.
FUNDING AND REGULATION
Sources of funding of widening access and student success
135. This section sets out the funding sources involved in supporting widening access
and student outcomes. This covers investment by institutions, and government
funding allocated to institutions as demonstrated in Figure 3. Details of the type of
activities and interventions are set out in chapter 4.
Figure 3: Sources of funding for widening participation and student
success in 2016
136. Changes to public spending and the 2010 reforms to higher education funding
significantly changed the role and scope of institutional spending and government
funding and how oversight of these two sources is maintained.
Access agreements
137. The reforms to higher education changed the composition of income institutions
receive, with an increase in fee levels for domestic undergraduate students
accompanied by reductions in teaching grants. In order to charge fees above
£6,000 a year, institutions were required to set out in access agreements the range
of support to under-represented groups that they intend to offer, both financial
46
and non-financial. This builds on the previous approach whereby access
agreements would show the proportion of fee income above basic levels that
institutions would invest in support measures, to be agreed with, and monitored
by, the Office for Fair Access (OFFA), and updated annually.
138. In 2011–12 universities in England spent £444.1 million on access agreements,
increasing to £725.4 million103 by 2014–15. This has since increased further, with
planned expenditure for 2017–18 access agreements standing at £833.5 million.104
As we move towards a steady state in the new funding system, expenditure is
expected to reach £3 billion for the four years from 2015–16 onwards (in cash
terms). This excludes the impact of inflationary increases in the fee cap which
would also provide cash, but not real terms, increases to total expenditure.
Teaching funding for widening access and successful student outcomes
139. Government grants to support widening access were until 2015–16 allocated to
institutions via student opportunity funding by HEFCE, which was intended to
help meet the extra costs associated with recruiting and retaining students from
under-represented groups, which cannot be met through income received from
tuition fees. In its 2015 spending review statement, the government announced
that this funding would reduce by up to half by 2019–20. Responding to the
reduction HEFCE held a consultation on how best to target the remaining funding.
This has resulted in an increase in funding for the National Collaborative Outreach
Programme (NCOP) from £30 million to £60 million in 2017–18 and the removal
of formulaic allocations for widening access for part-time and full-time students.
Support for disabled students will continue at the increased level (see paragraphs
153–155), but its investment in supporting student success will be targeted more
intensively on those institutions recruiting the highest proportions of at risk
students from disadvantaged backgrounds and part-time students. Given the
recent declines in the number of part-time students entering higher education it is
hoped that this investment will help support higher education institutions in
providing a viable part-time offer.
140. The need to commit to investment in widening access and student access (as well
as to non-financial measures) as part of access agreements has been a key driver
behind an overall increase in total funding. Increases in institutional investment
have more than offset the decrease in government grant funding via HEFCE.
Figure 4 shows that in 2015–16 £1.1 billion was spent in total, representing a 34%
increase in cash terms and 26% in real terms compared to 2011–12.
Shift in the balance of funding
143. The balance of funding has shifted, with investment from institutions increasing
by 62% and government grant funding decreasing by 0.2% since 2011–12. This has
resulted in a shift of the balance in investment from government grants to 34% in
2015–16 compared with 45% in 2011–12. In 2015–16, universities invested an
average of 25% of their additional fee income (the portion of fee above £6,000) on
103 OFFA (2016) Outcomes of access agreement monitoring for 2014-15 104 https://www.offa.org.uk/press-releases/2017-18-access-agreement-decisions/
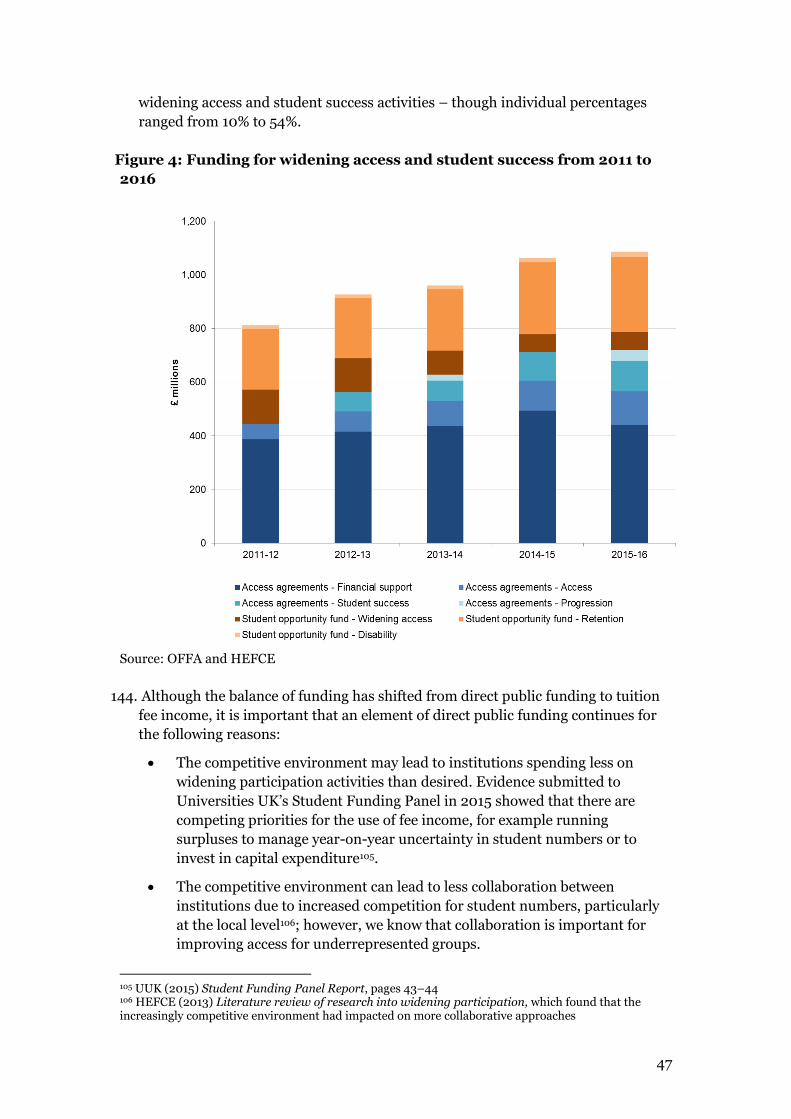
47
widening access and student success activities – though individual percentages
ranged from 10% to 54%.
Figure 4: Funding for widening access and student success from 2011 to
2016
Source: OFFA and HEFCE
144. Although the balance of funding has shifted from direct public funding to tuition
fee income, it is important that an element of direct public funding continues for
the following reasons:
The competitive environment may lead to institutions spending less on
widening participation activities than desired. Evidence submitted to
Universities UK’s Student Funding Panel in 2015 showed that there are
competing priorities for the use of fee income, for example running
surpluses to manage year-on-year uncertainty in student numbers or to
invest in capital expenditure105.
The competitive environment can lead to less collaboration between
institutions due to increased competition for student numbers, particularly
at the local level106; however, we know that collaboration is important for
improving access for underrepresented groups.
105 UUK (2015) Student Funding Panel Report, pages 43–44 106 HEFCE (2013) Literature review of research into widening participation, which found that the increasingly competitive environment had impacted on more collaborative approaches
48
Institutions that recruit a greater proportion of students from under-
represented groups face additional costs in supporting them. Student
success in higher education correlates closely with prior entry qualifications.
Students with lower ‘traditional’ qualifications (such as A-levels), or ‘non-
traditional’ qualifications (for instance vocational Level 3) or no formal entry
qualifications at all, are most at risk of withdrawing early from their studies
and not fulfilling their potential; as such these students may need more
support to achieve the best possible outcomes. This additional support,
which can include academic as well as pastoral support, incurs additional
costs for institutions. These institutions may also face financial constraints
in meeting these additional costs if they are unable to increase their fees to
the upper limit of the fee cap (for example, due to student demand).
145. While mainstreaming some types of activities can help to reduce the additional
costs associated with delivering support to under-represented groups, some
additional individual-level costs remain, such as in the provision of support for
disabled students. This includes the need to develop inclusive teaching and
learning environments and the investment needed to move to a social model of
disability (see paragraphs 153–155).
146. Alongside the reductions in public funding to support widening participation
activity, inflationary increases in the fee cap for institutions performing well in the
Teaching Excellence Framework (see paragraphs 157–162) will be introduced from
2017–18. This means that the balance of funding for widening participation
activities from public funding to fee income is likely to shift further over time. This
begs the question of how remaining public funding can be targeted most
effectively to support the success of students from under-represented groups
across their time at university. We believe there is a strong case for future funding
and regulation in this area to be more evidence led. An Evidence and Impact
Exchange, as proposed later in this report, could develop a robust evidence base
on priority areas of focus for widening participation and on the initiatives and
activities that are successful in supporting access.
147. Better evaluation of the impact of spending is needed to inform future investment
by both government and institutions. This is currently hampered by the split of
oversight of public and institutional widening participation funding between
HEFCE and OFFA. The creation of the OfS will create an opportunity to address
this. We return to evaluation and impact in chapter 4.
148. It will be important that the OfS works with the sector to develop a clearer,
joined-up national approach for tackling the priorities highlighted in this report
and the government’s ambitions for social mobility. To support this we encourage
higher education institutions to engage fully in the development of the OfS to
ensure that its functions will facilitate the greatest levels of progress against social
mobility ambitions.
49
SHIFTS IN FUNDING FROM GRANTS TO LOANS, AND THE INTRODUCTION OF
NEW LOANS
149. The previous paragraphs refer to changes to funding and the potential impact of
this on the work of institutions to promote social mobility. However, the
significant shift from grants to loans signalled in the 2015 Budget, the 2015
Autumn Statement and the 2016 Budget may impact on student behaviour. These
changes include:
the replacement of all undergraduate student maintenance grants with loans
from 2016–17, resulting in a £766 increase in overall maintenance support
for students with a household income of £25,000 or less at the cost of
increased loan debt
the replacement of grants for students studying nursing, midwifery and
allied health subjects with student loans from 2017–18, resulting in a 25%
increase in financial support available for living costs during study; at the
same time the government is removing the cap on the number of places
universities can offer in these subjects
the introduction of maintenance loans for part-time undergraduate students
from 2018–19, which it is estimated will benefit around 150,000 students a
year by 2020 and the further relaxation of the Equivalent or Lower
Qualifications policy with eligibility for tuition fee loans extended to part-
time students
the introduction of loans of up to £10,000 for postgraduate Masters courses
from 2016–17 and the development of a similar scheme to provide loans of
up to £25,000 for doctoral students from 2018–19
150. All of these changes will have separate, and also combined, effects on both
students and institutions in the delivery of activities in support of widening
participation. For students, the changes result in a significant increase in the level
of borrowing, taking into account the cumulative impact of taking out loans at
various levels of study107. Some evidence also suggests that those from low-income
backgrounds, ethnic minorities, female lone parents and mature student groups
are more debt averse108 than other student groups.
151. While the changes may mean increased levels of debt for some students, the
changes do provide increased overall support for living costs. For some groups,
such as those studying part-time or for postgraduate courses, this will result in the
availability of support for living costs where previously there was very little or
none available. This may encourage those who currently find support for living
costs a barrier – such as those with low incomes or childcare responsibilities109 –
to undertake part-time undergraduate study, or engage in postgraduate study.
The raising of the age limit on Masters loans to include more mature students is
welcome.
107 For example, students could potentially have loans for further education, undergraduate and postgraduate study leading to significant levels of debt that will need to be paid back concurrently. 108 BIS (2015) Equality analysis: Freezing the student loan repayment threshold 109 ibid

50
152. Although we know that previous major changes to state support for students, such
as the introduction of fee loans, did not have a negative impact on participation, it
is not possible to know how this shift from grant to loans may affect participation
among underrepresented groups. It will be important that HEFCE/OfS and DfE
monitor the impact of these changes closely.
GOVERNMENT POLICY ON DISABLED STUDENTS
153. In 2015 the government announced changes to its approach to allocating
Disabled Students’ Allowance (DSA) funding. The changes put a greater onus on
higher education institutions to fund support for disabled students, removing
DSA for certain types of non-medical help, specialist accommodation and costs
for various computer accessories. The aim was to move away from the medical
approach towards inclusive models of support. This was reinforced in the 2016
HEFCE grant letter, which identified the development of inclusive approaches to
supporting disabled students as a priority for HEFCE teaching funding.
154. In 2014–15 HEFCE carried out a review of the provision and support for
disabled students, focusing on support for students with specific learning
difficulties and students with mental health problems or intensive support
needs. Alongside differences in attainment outcomes as set out in chapter 1, the
review highlighted that institutions faced a number of additional challenges in
supporting disabled students. This included responding to the changes in DSAs;
the rapid rise in students reporting disabilities, particularly mental health issues;
moving to a social model of support110; working with external agencies and
increased pressure on resources – all at a time when institutions increasingly
need to fund widening participation activities from tuition fee income.
155. To support the sector in meeting these challenges, particularly the move towards
the social model of disability, HEFCE has increased funding for disabled
students from £20 million in 2015–16 to £40 million in 2016–17 and has
announced that this level of funding will be maintained for 2017–18. This will be
important in facilitating institutions to continue to invest in this area. We explore
how the sector is responding to these challenges in chapter 4.
POSTGRADUATE FUNDING POLICY
156. For 2016–17, HEFCE has allocated over £400 million in taught and research
postgraduate education. The current teaching funding model for taught
postgraduate education mirrors the undergraduate model and aims
to address areas where the money institutions receive through tuition fees alone
may be insufficient to meet all their costs. Since 2012–13, HEFCE has provided a
supplement of £1,100 for postgraduate taught students. The 2016–17 allocations
announced in March 2016 included around £164 million to support postgraduate
taught students. In order to support postgraduate taught students, particularly
those who would not otherwise progress to this level, HEFCE allocated £75
110 This emphasises that disability is caused by the way society is organised, rather than by a person’s impairment or difference and looks at ways of removing barriers that restrict life choices for disabled people.
51
million through the Postgraduate Support Scheme111 over the years 2014–15 and
2015–16. The first year funded a number of pilot projects and the second
distributed £50 million funding to higher education institutions via a formulaic
allocation. An evaluation of the first year by Paul Wakeling112 at the University of
York highlighted that funding was a key issue for many home masters students,
with two-thirds self-funding and noted that until the new loans for masters
students began in autumn 2016, there had been no ‘automatic’ funding available.
The outcomes of the evaluation of the 2015–16 scheme, due in spring 2017, will
be important in exploring whether the loans are sufficient to enable the most
disadvantaged students to participate and if the loans have widened access as
opposed to just increasing access.
THE TEACHING EXCELLENCE FRAMEWORK
157. The Teaching Excellence Framework (TEF), is due to be introduced in stages,
with a trial of the full assessment process introduced in academic year 2017–18.
It is being designed to ‘provide students with the information they need to judge
teaching quality’. In relation to social mobility the TEF aims to create ‘incentives
that reward institutions who do best at retention and progression of
disadvantaged students through their college years’. Institutions which are
successful in the TEF are able, should they wish, to maintain their fees in line
with inflation from academic year 2017–18.
158. Although students from disadvantaged groups often perform poorly in some of
the proposed TEF measures, it is suggested that the metrics for these groups will
be appropriately benchmarked. This will be supported by an approach that
allows for institutions to supplement the metrics with contextual and supporting
evidence, which can include evidence relevant to social mobility. It is essential
that this benchmarking is based on robust statistical models that have the
confidence of the sector. The basket of metrics should also be reviewed regularly.
For example, there is a growing body of evidence suggesting that the labour
market outcomes of disadvantaged students are poorer, even comparing students
taking the same subjects at the same institutions113. Thus any labour market
outcome indicator used in the TEF must not discourage institutions from
recruiting disadvantaged students.
159. As the TEF develops, close attention will also need to be given to the robustness
of statistical benchmarking of institutional performance based on subject mix
and student intake, approaches to splitting of metrics by student characteristics,
and the presentation of other contextual factors, such as local economic context.
It will be important to demonstrate that the final judgements on TEF ratings are
reached by the panel in a transparent and defensible way, using a set of robust
criteria which allow for and take into account diversity across the sector and the
different contexts in which institutions are operating. The diversity of
111 http://www.hefce.ac.uk/sas/PSS/ 112 Ibid. 113 Jack Britton, Lorraine Dearden, Neil Shephard and Anne Vignoles (2016) IFS Working Paper (W16/06) How English domiciled graduate earnings vary with gender, institution attended, subject and socio-economic background

52
pedagogical practice and missions should also be reflected in the qualitative
elements of the TEF.
160. The TEF ratings should also make a constructive contribution to student
decision making, including students from disadvantaged backgrounds. There
should be a process of testing how much weight students give to an institution’s
TEF rating against other influencing factors (such as fees, location, reputation,
course design etc) when making their decision on which institution to attend,
with supporting material explaining what the ratings mean.
161. The TEF should be evaluated in order to understand how it has influenced
student decision making and institutional recruitment and the impact on social
mobility and widening participation objectives. More specifically, the piloting of
discipline-level assessments (TEF 3) should not proceed until the lessons
regarding the costs and benefits of TEF 2 have been analysed.
162. Universities UK will continue to work closely with the DfE and the higher
education sector throughout the development of the TEF to ensure that it
supports students in making decisions and does not hamper institutions’ efforts
in supporting social mobility.
THE IMPACT OF LEAGUE TABLES
163. The effect of league table metrics on institutions’ behaviour has been raised
many times during the course of the Advisory Group’s work. Currently all of the
main national league tables – the Guardian University Guide, the Complete
University Guide, and The Sunday Times and The Times Good University Guide
– are based on assessments of undergraduate provision and are constructed from
publicly available data collected by HESA, HEFCE and other organisations. The
metrics used by these three league tables are shown in Table 1.
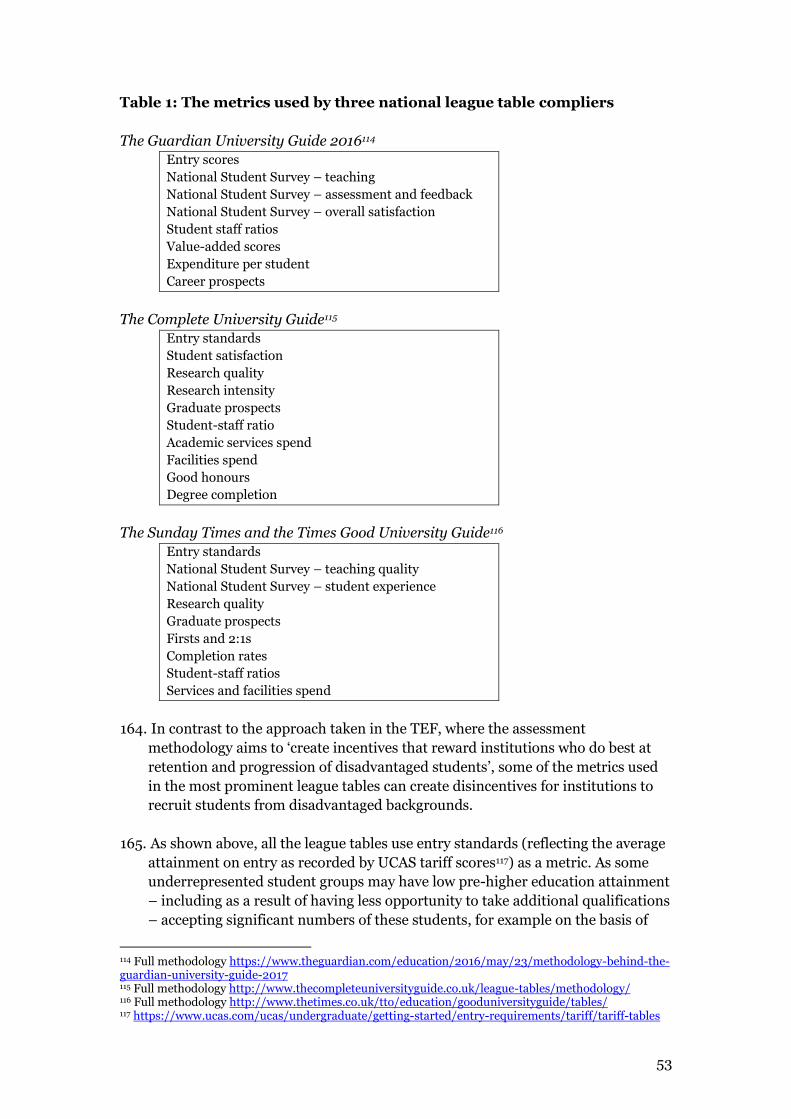
53
Table 1: The metrics used by three national league table compliers
The Guardian University Guide 2016114
Entry scores
National Student Survey – teaching
National Student Survey – assessment and feedback
National Student Survey – overall satisfaction
Student staff ratios
Value-added scores
Expenditure per student Career prospects
The Complete University Guide115
Entry standards
Student satisfaction
Research quality
Research intensity
Graduate prospects
Student-staff ratio
Academic services spend
Facilities spend
Good honours
Degree completion
The Sunday Times and the Times Good University Guide116
Entry standards
National Student Survey – teaching quality
National Student Survey – student experience
Research quality
Graduate prospects
Firsts and 2:1s
Completion rates
Student-staff ratios
Services and facilities spend
164. In contrast to the approach taken in the TEF, where the assessment
methodology aims to ‘create incentives that reward institutions who do best at
retention and progression of disadvantaged students’, some of the metrics used
in the most prominent league tables can create disincentives for institutions to
recruit students from disadvantaged backgrounds.
165. As shown above, all the league tables use entry standards (reflecting the average
attainment on entry as recorded by UCAS tariff scores117) as a metric. As some
underrepresented student groups may have low pre-higher education attainment
– including as a result of having less opportunity to take additional qualifications
– accepting significant numbers of these students, for example on the basis of
114 Full methodology https://www.theguardian.com/education/2016/may/23/methodology-behind-the-guardian-university-guide-2017 115 Full methodology http://www.thecompleteuniversityguide.co.uk/league-tables/methodology/ 116 Full methodology http://www.thetimes.co.uk/tto/education/gooduniversityguide/tables/ 117 https://www.ucas.com/ucas/undergraduate/getting-started/entry-requirements/tariff/tariff-tables
54
contextual data that the institution may have used, may result in a reduction in
the average entry tariff for an institution. This could have a knock-on negative
effect on the institution’s position in the league table and therefore mitigate
against accepting greater numbers of these students. Currently only The
Guardian includes a ‘value-added score’ which partially addresses this issue by
applying a greater weight to students with lower than average attainment who go
on to achieve a good outcome.
166. Chapter 1 of this report illustrated how some underrepresented student groups
may fare poorly in the job market after graduation, despite attending the same
university and studying the same subject as students from advantaged
backgrounds. Graduate prospects is also a metric used by all three league tables.
Thus, as above, the recruitment of disadvantaged students and students from
BME groups could impact on an institution’s performance in the league tables,
and could therefore act as a disincentive to recruiting these students.
167. In view of these concerns, Universities UK will arrange a roundtable
discussion with league table compilers, the higher education sector
and experts in the area to understand the potential for league tables
to impact on social mobility. These discussions could produce a
common set of principles and commitments to underpin the
development of league tables. How these tables are interpreted by
parents, students and schools is equally important and should also be
taken into account.
55
4. HIGHER EDUCATION
168. Higher education institutions and providers are diverse, with different
strategies, strengths, priorities and student cohorts. However, all institutions
have a strong commitment to addressing the challenges of social mobility. In this
chapter we set out how institutions are using investment in social mobility and
explore how the sector supports the student at each stage of the student lifecycle,
with case studies illustrating some of what they are doing. We then explore how
institutions, with government and the other parts of the education system, can
work together to improve social mobility.
PROGRESS SO FAR
169. There is always more that universities can do to support social mobility, but we
have seen considerable progress to date. Between 2009 and 2015 both the
proportion and the absolute number of young full-time undergraduate students
in England from the most disadvantaged group (POLAR3 quintile 1 increased, by
19% and 29%118 respectively, and university entry rates for this group increased
by 36%119. There have also been increases in the proportion (up by 47%) and
absolute number (up by 49%) of full-time undergraduates who self-report as
disabled. This may represent an opening up of higher education to those with
disabilities (though it may also be due to changes in student behaviour in terms
of declaring disabilities)120. There has also been a 14% increase in the number of
full-time UK undergraduates from black and minority ethnic (BME) groups at
English higher education institutions, with comparisons with the 2011 census
suggesting that all non-white ethnic groups are now well represented in the
sector121. Examples of the type of activities to support widening participation and
student success are set out in the text box below.
118 HESA (2008, 2016) UKPIs: Widening participation of under-represented groups (table T1a) 119 UCAS (2015) End of Cycle Report 2015 120 HESA (2016) Student Record 121 UUK analysis of Office for National Statistics (2011) Census: Aggregate Data http://infuse.ukdataservice.ac.uk
56
Examples of student support by universities
Outreach activities into schools, sometimes involving families, to
raise attainment and encourage participation and offer support
when making applications. These can involve student volunteers
as mentors and advisors in local primary and secondary schools
and to the parents of school children.
Development of partnerships with schools, including
sponsorship of schools and academies.
Activities to encourage participation and support student
success targeted at specific student groups, such as care leavers,
students estranged from their parents122, mature students,
refugees and asylum seekers.
The use of data by institutions outside of prior attainment. This
could include socio-economic background data, self-declared
information by the applicant (eg that they have been in care),
pre-applicant data from outreach and widening participation
activities, or background information provided in the
application.
Use of ‘open educational resources123’, in schools and elsewhere,
to support participation and student success once in higher
education.
Supporting the development of alternative pathways, for
example progression from further education to higher education
through articulated progression routes, the provision of
foundation years, etc.
Provision of information, advice and guidance to support
students entering and moving on to further study and
employment.
Provision of financial support to students, including disabled
students.
Activities to support the transition and retention of
undergraduates, for example partnering them with local
employers, with a particular focus on disadvantaged students,
student mentors, providing placements and work experience.
Provision of opportunities for social action and extracurricular
activities to support employability.
170. To deliver these activities, higher education institutions and others – including
government – have invested substantial resources, all of which have been critical
in contributing to the significant progress seen in social mobility. Details of the
scale and balance of funding are set out in chapter 3.
122 For further information on the portal available for adults estranged from their family see http://standalone.org.uk/about/ 123 'Open educational resources’ are teaching and learning materials that are freely available online for everyone to use, whether you are an instructor, student or self-learner.
57
171. It is worth noting that some of the interventions highlighted in the text box above
are likely to form part of a university’s broader commitment to improving the
quality of its teaching and learning, improving the wider student experience,
supporting growth at a local and regional level, and strengthening civic society.
Because of this, some activities may not necessarily be explicitly categorised as
targeted at supporting social mobility or addressing inequality. It is therefore
important that the work of institutions and providers in this area is seen as part
of a broader institutional strategy.
172. There are over 130 higher education institutions in England that report to the
Higher Education Statistics Agency (HESA), all of which operate in their own
particular setting with different aims and different goals – and therefore with
different widening participation, retention and progression issues. All of these
institutions will have a strong commitment to addressing the challenges of social
mobility but the way that they do this will differ. 124 One of the reasons why the
sector has been able to make progress on widening participation in recent years
is precisely that its diversity and range of missions allow institutions to respond
to different local, regional and national circumstances – and most importantly
respond to the increasingly diverse requirements of students.
DIVERSITY OF PROVISION
173. Universities offer a diverse range of provision offering all-important flexibility to
a broad range of students. The diversity of students entering higher education is
increasing: not all students are able or want to enter higher education at 18,
study full-time, or study for a degree. As such, higher education institutions are
adapting to students with different priorities and needs, including when and how
they learn, the experiences they want and the support they need. The text box
below illustrates the different ways in which higher education is delivered and
can be experienced. This diversity in provision is critical in ensuring that older
learners have the opportunity to participate.
Different delivery models within higher education
Different entry routes into higher education
More students are presenting with vocational qualifications such as BTECs or a
portfolio of vocational qualifications and A-levels.
The Access to Higher Education Diploma is an important qualification aimed at
providing a second chance for adults who left school without the qualifications
needed to access higher education.
Accreditation of Prior Experiential Learning (APEL) is an important entry route for
mature students who may have already gained skills through working.
Degree apprenticeships and work-based learning (WBL) routes are important for
those wishing to ‘learn and earn’.
124 The Uses and Impact of HEFCE funding for widening participation. Report to HEFCE by CFE and Edge Hill University
58
The timing of entry – multiple entry points
Some universities and alternative providers have multiple entry points and are open
for study most weeks of the year.
Length of study
This varies and can include two-year degrees and the ability to study flexibly, ie
taking modules and building up to a qualification.
The mode of study
This refers to those who wish to study more flexibly or part time. There are a number
of models for organising delivery of part-time learning:
- complete integration: part-time and full-time students learn together
- partial integration: part-time and full-time students learn together for a portion
of time
- no integration
Full-time and part-time learning and teaching can vary, for example this could take
place:
- in partnership with or at other educational institutions (this could be with a
further education or overseas college under validation or franchise
arrangements)
- at employers’ premises (ie work-based learning)
- electronically (ie through on-line distance learning. This could also include
combinations, eg a blended mode which combines on-line and face-to-face
learning and teaching)
Range of qualifications taken in higher education
Such as those below Level 6 on the FHEQ framework125 (foundation degrees,
diplomas, higher national diplomas). The UK higher education sector already has a
strong interest in this agenda and has been working with further education colleges
and alternative providers at the local level to deliver vocational qualifications.
According to HESA data126, universities are currently the named providers of 8,917
HNCs, 7,794 higher national diplomas and 51,138 foundation degrees, with many of
these delivered in partnership with further education colleges.
Higher and degree apprenticeships. Significant activity to develop and deliver
technical education is also under way across the higher education sector. This
includes bespoke courses for employers, skills masterclasses, and skills training
sessions.
125 For information on higher education frameworks see http://www.qaa.ac.uk/publications/information-and-guidance/publication?PubID=2718#.V_N4I_krIY0 126 HESA Student Record 2013–14
59
Higher education provision at further education colleges
Whereby a student is registered and taught at a further education college.
Franchised provision
Whereby a student is taught at a further education college but is registered at a
university.
WORKING IN PARTNERSHIP WITH STUDENTS AND STUDENTS’ UNIONS
174. The relationship between students’ unions and their universities is critical in
ensuring that strategies to widen participation and support student success meet
the changing needs of both new and potential students. We recognise that it is
important that unions and institutions work together to create a shared
understanding of where such strategies should focus. We recognise that no single
model of widening participation will meet the needs of every individual, and
acknowledge that this is both part of the challenge and part of the solution to
effective collaboration between students’ unions and universities.
175. The notion of ‘engaging students’ is heard frequently in higher education but it
can be interpreted in different ways. In this context it means encouraging active
participation, raising aspiration, generating a sense of belonging and wellbeing
within the university, and creating individuals who are better prepared to
contribute to and engage in the world around them when they graduate. Meeting
these goals requires constructive engagement between unions and institutions.
Students’ unions know their students, and are able to advocate on their behalf
and give an insight into the needs of students from many different backgrounds.
This knowledge can then inform institutional policy and ensure that this is based
on what will have the greatest benefit for those who need it most. We encourage
universities to continue to work with their students’ unions and build on the
excellent work that is already underway to support access and student support.
This should help ensure that widening participation work is truly co-produced,
appropriately targeted, and effectively recognises, reaches and gives voice to the
individuals it is designed to support.
OUTREACH
176. Universities commit significant investment to support outreach activities, as
demonstrated in 2017–18 access agreements127, where higher education
institutions committed £171.1 million on pre-entry activities to raise attainment
and aspirations (up from £149.5 million in 2016–17). The type of activity and
approach will vary according to an institution’s mission and the local agenda.
Examples of activities include:
outreach work in communities
homework clubs
127 https://www.offa.org.uk/press-releases/2017-18-access-agreement-decisions/
60
campus visits and taster days
mentoring and e-mentoring
student ambassadors
masterclasses
summer schools and activity in schools and colleges
conferences, study days, presentations, workshops, revision days etc
Case study: De Montfort University’s Square Mile Project
De Montfort University’s Square Mile project uses the university’s academic
expertise and student volunteers to provide free support to local primary
and secondary schools. This support ranges from mentoring in maths,
English and science, to providing speech therapy support and IT training for
parents and children. The project helps children in the local community to
improve their academic attainment, prepare them for university and,
perhaps most importantly, give them a sense of belonging to a university
community, helping to improve their access to and retention in higher
education.
The project also improves De Montfort students’ employability, giving them
skills which help them stand out when they graduate. Because many of the
Square Mile projects are embedded in degree programmes, they are open to
students from all backgrounds, helping to reduce some of the employment
gaps outlined in chapter 1.
Case study: University of Manchester Higher Partnership
Through the Greater Manchester Higher Partnership, the University of
Manchester has commissioned Brightside to deliver an online mentoring
intervention with a targeted group of young white male learners from lower
socio-economic groups across Greater Manchester in 2016. This project aims
to address the barriers which prevent white males from working-class
backgrounds from achieving their academic potential, and accessing higher
education and work-related experiences. Evaluation from this pilot will inform
development of future activities with this targeted cohort.
177. Although aspiration-raising activities can be helpful, in our discussions with
schools it was clear that raising aspirations was not generally an area of concern
– most pupils had aspirations to do well. Outreach work to support the raising of
expectations and to create a high expectations culture was generally considered
much more important.128
128 Interestingly, this mirrors the language used in the Schools White Paper ‘Education Excellence Everywhere’ and would imply that changing the language from ‘aspirations’ to ‘expectations’ would be more appropriate.
61
178. Schools also welcomed a much greater focus on outreach activities to support
the raising of attainment and standards, such as subject study days or even
bespoke subject-specific support. Given the importance of attainment as a lever
for enabling individuals to progress, an increasing focus by the higher education
sector on activities to support attainment and raising standards is important.
We recommend a greater focus on academically-based outreach
activities targeted at supporting attainment and raising standards
and university level skills. To support this we propose that the
Evidence and Impact Exchange should conduct a systematic review of
the evidence base.
179. This is particularly important for white working-class children, where research
by LKMco129 shows that low attainment at school accounts for much of the
problem of low participation in higher education. Ensuring sustained, targeted
outreach work that starts at primary school is critical if we are to improve access
for this group, along with ensuring that pupils are informed about their options
and know why higher education is relevant to pupils’ future plans.
180. If outreach activities are to be made more effective and scaled up, institutions
need to know what works, yet evidence in this area is currently limited. We
return later in this chapter to focus specifically on evaluation and impact. We
note, however, that the Office for Fair Access’s (OFFA)130 work, in conjunction
with the Sutton Trust, on evidencing the impact of outreach will be useful. So too
will the research by the Higher Education Funding Council of England
(HEFCE)131 to identify the impact of higher education-school interaction,
including the impact on pupil attainment and identifying evidenced methods of
raising attainment. The outcomes of this research will be able to be rolled-out
through the National Collaborative Outreach Programme (NCOP)132 as well as by
universities in the course of their normal outreach activities.
181. The championing of what works and sharing of good practice across the sector
will also be important. The new Evidence and Impact Exchange, proposed later
in this chapter, will provide an important vehicle to support this. Universities
UK will actively engage with HEFCE, OFFA and other bodies
including those in the charity sector, to promote improved and
expanded links with schools and to share effective practice and
improve the evidence of impact in this area.
129 The education and youth ‘think and action tank’ (2016) White working class boys and higher education: widening participation 130 OFFA (2016) Improving the evaluation of outreach https://www.offa.org.uk/publications/research-in-progress/improving-outreach-evaluation/ 131 HEFCE (2016) Schools sponsored by higher education http://www.hefce.ac.uk/workprovide/schools/analysis/ 132 This is a new programme by HEFCE which aims to increase the number of young people from disadvantaged backgrounds in higher education by 2020. It invites organisations to submit proposals for funds to work collaboratively on outreach programmes in specific local areas (see paragraph 77).
62
182. Schools were keen for outreach to be sustained and meaningful. The
requirement for consortia to set clear milestones and targets in their NCOP bids
will help here, but we recommend more sustained and coordinated early
engagement with pupils, particularly pre-GCSE and in primary schools. The
project led by Research Councils UK133 to explore partnerships between
universities and schools and colleges will also be important due to its focus on
embedding sustainable engagement.
183. As well as outreach targeted at young people, a much stronger focus on outreach
provision to target mature learners will be critical if the significant drop in
numbers of mature students choosing to go to university is to be reversed.
Universities do this already in a variety of ways: working with the local
community or engaging with faith groups, employers and trade unions; or
promoting short courses, offering modular and credit-based study pathways, and
using open educational resources. These activities can be helpful in re-engaging
prospective students with learning. Raising the visibility of opportunities for
credit-accruing work placements along with the availability of academic and
pastoral support and flexible study options could also be useful. Some
institutions have highlighted using alumni or older learners as ambassadors in
133 http://www.rcuk.ac.uk/pe/PartnershipsInitiative/
Case study: Reaching East, Reaching London
Continuum, the centre for widening participation policy studies based
at the University of East London (UEL), has been leading the
Reaching East, Reaching London collaborative project, funded by the
HEFCE under the National Networks for Collaborative Outreach
funding stream.
The project has developed an online map and data dashboard of all
state funded secondary schools in London and parts of Essex. The
dashboard is aimed at higher education outreach teams who need
contextual data on schools to use in their decision making processes
and to design specific outreach events. The dashboard map is based
on POLAR3 data and includes a wide variety of contextual data at
school level, including information about the school, free school
meals percentages, Key Stage 4 and Key Stage 5 achievement,
ethnicity, gender, English as a second language, numbers into higher
education, universities attended and outreach data collected from all
higher education institutions in London. The institutions involved in
these projects were UEL, University College London and Greenwich,
with Ravensbourne and Goldsmiths partnering in two smaller
projects.
Phase two of the project is now under way which includes a needs and
capacity analysis working closely with schools in East London to
develop a toolkit for outreach practitioners and schools.
63
pre-entry events as useful in encouraging mature learners. To incentivise
more outreach more research is needed to better understand the
results of outreach activity targeted at mature learners. We suggest
that this is taken forward by the new Evidence and Impact Exchange
(see paragraphs 233–238).
184. There is a clear risk that gains in undergraduate widening participation could be
annulled by widening inequalities at postgraduate level. Evidence from the
Wakeling report134 which sets out the findings from HEFCE’s £25 million pilot
Postgraduate Support Scheme in 2014-15 to improve progression to
postgraduate education found that there was latent and frustrated demand for
postgraduate taught study particularly for disadvantaged students. In addition,
the availability of targeted funding, particularly for student fees and living costs,
was shown to be critical for student success at postgraduate level. However,
finance alone was insufficient since it addressed only one particular point in the
much longer process of entry to post graduate taught study. Widening
participation activity involving information, advice and guidance was also
required. This should include the development of systematic programmes of
inreach (that is, where institutions provide information to their own
undergraduates) and outreach. This should also include better collaboration
between institutions and should focus on providing information, advice and
guidance, and identify ‘cold spots’ for postgraduate participation. Wakeling also
suggested that better data was required. This means improving the linkage of
existing data between first degree and postgraduate levels. It also requires
collecting more information on postgraduate students’ backgrounds and
circumstances.
ADMISSIONS PRACTICE
185. As indicated in chapter 2, in recent years higher education admissions have been
affected by the removal of the cap on student numbers and the introduction of
market reforms, combined with changes to policy on qualifications and
information, advice and guidance. Within this dynamic environment, higher
education institutions seek to ensure that their admissions systems are fair,
effective and transparent. They are assisted in doing this by the Supporting
Professionalism in Admissions programme (SPA)135.
Fair admissions
186. There are many decisions around the higher education admissions process
which are necessarily subjective; applicants, advisers and admissions staff all
make judgements in identifying the best match of student to university or college
course. Within these, all admissions decisions should be fair and not influenced
by an individual’s ethnicity, background or other intrinsic characteristics. To
support this, the sector has developed a set of principles to underpin fair
134 Programme analysis of HEFCE’s Postgraduate Support Scheme: Final report to ESRC and HEFCE http://www.hefce.ac.uk/pubs/rereports/Year/2015/pssfinal/ 135 This body was established by the sector to support the professionalisation of admissions in 2006. It is currently funded by UCAS.
64
admissions136. These have been in place since the Schwartz report, Fair
admissions to Higher Education: Recommendations for good practice, was
published in 2004 and are embedded in the Quality Assurance Agency for Higher
Education (QAA) Expectation for the recruitment, selection and admission of
students137. However, there is a challenge for a higher education sector that
wishes to target and promote access to higher education from under-represented
students, but which needs to avoid discrimination, positive or negative, within
admissions decisions. The SPA programme has produced a briefing on positive
action in admissions138 and other organisations, such as the Equality Challenge
Unit, are working with higher education institutions to support students from
protected characteristic groups into higher education. Although there is good
practice across much of the sector it is important that universities regularly
review and evaluate their admissions practice and investigate unexplained
differences in offer-making or admissions outcomes.
Offer rates
187. As highlighted in chapter 1, data released recently by UCAS covering
applications, offers and placed applicants by sex, area background and ethnic
group suggests that across all tariff groups and at an aggregate national level for
England, the offer rates for applicants from POLAR3 quintile 1 (the most
disadvantaged group) and for Asian and black applicants are slightly below what
would otherwise be expected, given the level of their predicted grades and the
general subject area of the course for which they are applying. At the same time
those for POLAR3 quintile 5 (the most advantaged group) and white applicants
are slightly above what would otherwise be expected. The differences are small,
with the gaps in the 2015 offer rates between 0.2 and 2.1 percentage points larger
than the expected variation across the three groups. UCAS suggests that there
may be factors which explain this such as the subjects studied and the grades
held by applicants. For example, UCAS’s calculations could only account for the
total level of predicted grades and the mix of predicted grades, or A-level or other
subjects, personal statements and references. UCAS states that it is not possible
to take these further factors into account without making assumptions about how
universities should offer from pooled averages from across the sector, something
which is not a good match to the differing academic offer making policies used by
institutions.
188. It should also be noted that UCAS has shown that the differences in offer-
making are too small to have a material impact on the differences seen in entry
rates. Nonetheless, it is important that institutions look at their own offer-
making to ensure that it follows good practice and minimises any risk of bias. It
may be that masking of some data by centralised admissions teams on
applications could help to ensure that all applicants are treated equally.
However, it should be noted that universities and colleges do not receive
information about an applicant’s ethnicity from UCAS until after the applicant
136 What is fair admissions? www.spa.ac.uk/resources/what-fair-admissions 122 QAA Quality Code part B2: Recruitment, Selection and Admission to Higher Education www.qaa.ac.uk/assuring-standards-and-quality/the-quality-code/quality-code-part-b 123 SPA Equality Briefing: Positive action in admissions www.spa.ac.uk/resources/positive-action
65
has been accepted for entry. A number of universities have projects underway to
examine this issue.139 This is an area which should be investigated further using
admissions data using the Administrative Data Research Network and when
findings from the projects already underway are published.
189. We also propose that within the existing work that HEFCE is undertaking to
provide greater clarity and transparency in published information, thought
should be given to how best to raise awareness of the range of actual attained
grades that candidates are admitted have. This allows candidates and their
advisers to better understand the requirements of a course. To have value, the
information would need to be available at the level of an individual degree
course.
190. We support the work already underway by institutions to ensure staff awareness
of the potential for bias in admissions and the need to take action. We encourage
all institutions to consider unconscious bias training for staff involved in
admissions. The guidance and good practice resources on unconscious bias by
SPA provide a valuable tool for institutions140, along with the module on good
practice being developed as part of SPA’s online toolkit141.
Contextualised admissions
191. In order to identify applicants who may have lower prior attainment as a result
of disadvantage rather than because of lower potential, many institutions make
use of contextual information and data. This enables an institution to assess an
applicant in the context of the circumstances in which their attainment has been
achieved142. Principles for the use of contextual data and information in
admissions143 were produced by SPA in consultation with the higher education
sector, schools and colleges and approved by the SPA Steering Group. They
provide a good practice reference point for the sector when considering or using
contextualised admissions, including decision-making.
192. Many universities use contextual data to inform choices about whether to invite
applicants to interview, make them an offer which may mean making a lower
offer for a place, or to inform a decision on an application. Institutions also use
contextual data to target outreach activities where they are most needed.
Contextualised admissions must be evidence-based, justifiable, valid and reliable
to ensure they add value to the admissions process. To support contexualised
admissions, UCAS via their Contextual Data Service144 provides additional
139 UCAS (2016) Unconscious Bias Report 2016 www.ucas.com/corporate/news-and-key-documents/news/ucas-unconscious-bias-report-2016 140 Resources are on the SPA website: www.spa.ac.uk/resources/unconscious-bias 141 www.spa.ac.uk/good-practice-toolkit 142 Contextual data includes educational, geo-demographic and socio-economic background data. It could also include broader data such as the university’s own data and research. Contextual information includes self-declared information by the applicant, such as having been in care, pre-applicant data from outreach and widening participation activities, or background information provided by the application. 143 See SPA website www.spa.ac.uk/resources/how-contextualised-admissions-used 144 See SPA (2016), Contextualised Admissions – Contextual data and information including the UCAS Contextual Data Service

66
information for institutions. Together this enables an institution to build up a
holistic picture of applicants.
193. Although much progress has been made in expanding the use of contextualised
admissions, understanding outside of higher education institutions is still
limited, meaning that applicants, their parents, guardians and teachers may not
be aware of the opportunities available to them. It is important that potential
applicants and advisers are aware of the data an institution uses, why they use it
and when they use it as part of the contextualised admissions process. This
should dispel perceptions that some people hold that higher education is an
unobtainable goal. Universities are encouraged to consider how to make
the use of contextual data better understood by potential applicants
and others and to use contextual data that is both transparent and
evidence-based. Where appropriate, institutions may wish to
consider the use of contextualised offer-making informed by SPA’s
advice. To support this process SPA should continue to identify, and
share, good practice in the use of contextual admissions.
194. The use of compact or articulation agreements with local schools and colleges
provides another vehicle for supporting progression to higher education. These
agreements guarantee applicants from these schools and colleges interviews, and
in some cases offers, for particular courses.
195. The ‘gold standard’ of information and data about an applicant is data that
relates directly to the individual. However, the data that is actually available to
admissions staff is often less granular, relating to household, school or
area/neighbourhood. This means that admissions staff cannot be certain that the
characteristics of (for example) the neighbourhood accurately reflect the
disadvantage experienced by the individual. To mitigate this risk, universities
Case study: King’s College London extended medical degree
As part of its commitment to widening access, King’s College London
offers an extended medical degree which opens up its medical degree to
pupils from non-selective state schools in London, Kent and the
Medway with BBB or above in their A-levels. Students take the first
stage of a medical degree over two years, rather than the usual one year,
allowing the first stage to be studied at a slower pace and with greater
student support.
The scheme has run since 2001 and more than 150 students have
successfully graduated. Each year King’s accepts another 50 and there
are more than 300 students currently studying on the programme. The
retention and success rates for the programme are high, despite the
challenges faced by non-traditional students, and 92% of entrants stay
and complete their degree.
A similar scheme is also run at the University of Southampton.
67
often combine data from several sources to reduce the likelihood of false
positives. The more information and data a higher education institution is able to
access, the more accurate their picture of the context in which an applicant has
studied, worked and lived. This not only informs an understanding of that
applicant’s academic achievements, but also their access to opportunities such as
work experience and extracurricular activities.
Mature students
196. Mature applicants often have different priorities and needs than the
predominantly young higher education undergraduate market, which, if not
addressed, may leave them feeling marginalised, increasing the risk they will
disengage from seeking entry to higher education. Mature applicants may, for
example, feel less able to engage in the full range of activities and the social
aspects of campus life, they may need more flexibility in arranging interviews
and visits around work commitments, they may have additional financial
concerns, or they may need more support around family commitments. They
may also be more interested in part-time or other more flexible options for
learning. It is important for higher education institutions to consider the needs
of mature students in their marketing, recruitment and student support, and for
careers advisers to be aware of the full range of options open to learners of all
ages, as referred to at paragraphs 103–104.
197. Currently many mature applicants enter higher education with a range of
qualifications including Access to Higher Education diplomas, higher national
certificates or diplomas. Sometimes applicants will enter without formal
qualifications; in which circumstances institutions use Accreditation of Prior
Experiential Learning (APEL), which is an official recognition of skills and
knowledge gained outside of a formal educational setting, and Accreditation of
Prior Learning (APL), which can be used to officially recognise part-completion
of formal courses. Access to Higher Education qualifications play an important
Case study: Part-time students: University of Leeds
Leeds’ Lifelong Learning Centre (LLC) has developed the JumpStart
course to give adults in the local community a taste of subjects studied
at university and to provide necessary information and support to
demystify and alleviate the fear of going to university. JumpStart has a
number of different entry routes – some have been working towards a
GCSE at college, some find out about it through word of mouth, and
others are referred by tutors at the LLC.
Part of the course is taught online, introducing students to this form of
learning. Feedback from participants has been positive, with reports of
increased confidence in academic study. In addition to this, the LLC has
run part-time foundation degrees that are aimed at adults in work who
are undertaking higher education qualifications for career
enhancement.
68
role, particularly in enabling mature learners to follow vocational pathways
(notably in social work, social studies, nursing and other subjects allied to
medicine), as well as in preparing individuals for the workplace. In view of this
we support the continued funding for validation of these qualifications by
HEFCE.
198. Ensuring that university admissions processes and entry requirements take
account of the diverse range of qualifications and routes by which students enter
higher education will be critical in ensuring that no students are disadvantaged,
especially as current reforms to post-16 academic and vocational qualifications
are embedded and as take-up of higher level apprenticeships increases. Open
access is a route which removes barriers, offering routes for students with low or
no qualifications.
IMPROVING STUDENT EXPERIENCE, RETENTION AND DEGREE OUTCOMES
199. Widening participation and access to higher education are not sufficient to
support social mobility; support for students to be successful in higher
education145 and beyond is also required. The percentage of UK-domiciled first
degree entrants not continuing into second year has remained steady, at around
seven per cent in 2012–13. Although this figure is low compared to other OECD
countries146 a more nuanced picture lies behind this, particularly when we
consider students with different characteristics. Likewise, research by HEFCE147
has shown that there are significant variations in degree outcome for students
145 This is known as retention and refers to completing a programme of study within a specific timeframe. 146 HEFCE analysis http://www.hefce.ac.uk/analysis/ncr/ 147 Higher education and beyond: outcomes from full-time first degree study (HEFCE 2013/15)
Case study: Brookes Bridges
Based in the most deprived areas of Oxfordshire and the
surrounding region, Oxford Brookes University’s ‘Brookes Bridges’
project up-skills and re-skills adults who have previously left formal
education and who are motivated to progress to further and higher
education.
The project offers short, community-based courses as a means of
progression into higher education and therefore employment.
Brookes Bridges has been extremely effective in targeting mature
learners: 93% of learners were aged over 21 when they participated,
66% of participants were the first in their families to go on to higher
education and 41% were from a BME background. An estimated
35% of participants entered formal education at level 3 or below
within six months of completing a Brookes Bridges programme.
Recent analysis has shown that 24% of Brookes Bridges
participants (2011–12 to 2014–15) have subsequently entered
higher education, with just over half of these enrolling at Oxford
Brookes.

69
from different ethnic backgrounds and for disabled students and across
disciplines. It is therefore not surprising that during the last few years there has
been an increase in investment by institutions in activities to support students to
succeed. For example, in the 2017–18 access agreements148 institutions
committed £185.7 million to retention and success, up from £148.4 million in
2016–17.
200. This has been mirrored by a focus from institutions and sector bodies on
exploring ‘what works’ to support retention and student success.
RETENTION
201. To date, there has been a strong consensus that engagement and a sense of
belonging are at the heart of successful retention and success.
Evidence obtained from the projects co-funded by the HEFCE and Paul Hamlyn
Foundation-funded programme What Works?: Student retention and success
programme149 found that to be effective, all interventions and activities should
nurture a culture of belonging for all students. Although the full findings from
this research will not be available until spring 2017, the emerging findings are
clear. Student belonging is achieved through:
• Meaningful interaction between staff and students to support the
development of knowledge, expectations and confidence to be successful.
• A higher education experience relevant to students’ interests and future
goals, recognising that this will differ depending on ethnicity,
background and age.
• Supportive peer relations. The importance of peer group support and
social integration was also demonstrated in a recent survey of students by
Unite Students150 which found that there were a number of factors
outside the academic environment which could contribute to student
wellbeing and retention. This included resilience and ‘life skills’ such as
planning, goal setting, self-management, the ability to recover from a
setback; access to social networks, student accommodation and external
support services as well as family support. What is particularly noticeable
in the table below is how the difference in the student experience varies
from social classes AB (the highest social class) to DE (the lowest).
148 https://www.offa.org.uk/press-releases/2017-18-access-agreement-decisions/ 149 Thomas L (2012) Building student engagement and belonging in Higher Education at a time of change: final report from the What Works? Student Retention and student success programme. London: Paul Hamlyn Foundation http://www.phf.org.uk/publications/works-student-retention-success-final-report/ 150 UNITE (2016) Unite Students Insight Report http://www.unite-students.com/about-us/insightreport
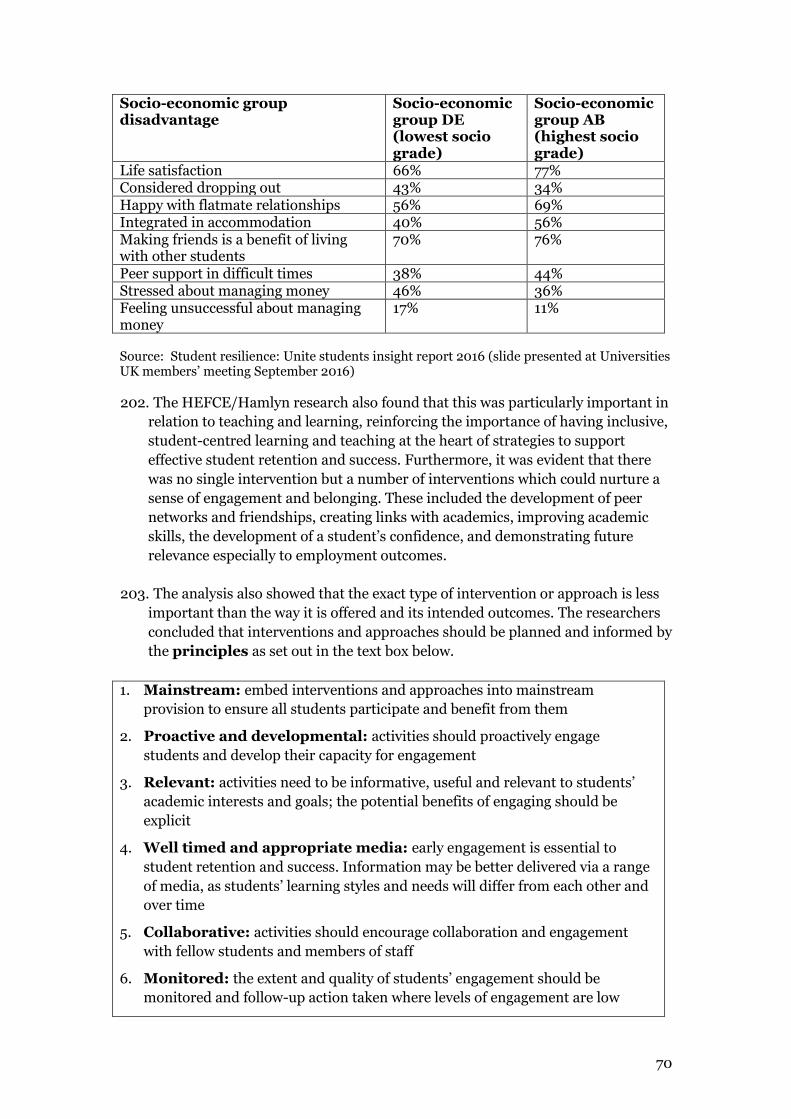
70
Socio-economic group disadvantage
Socio-economic group DE (lowest socio grade)
Socio-economic group AB (highest socio grade)
Life satisfaction 66% 77% Considered dropping out 43% 34% Happy with flatmate relationships 56% 69% Integrated in accommodation 40% 56% Making friends is a benefit of living with other students
70% 76%
Peer support in difficult times 38% 44% Stressed about managing money 46% 36% Feeling unsuccessful about managing money
17% 11%
Source: Student resilience: Unite students insight report 2016 (slide presented at Universities UK members’ meeting September 2016)
202. The HEFCE/Hamlyn research also found that this was particularly important in
relation to teaching and learning, reinforcing the importance of having inclusive,
student-centred learning and teaching at the heart of strategies to support
effective student retention and success. Furthermore, it was evident that there
was no single intervention but a number of interventions which could nurture a
sense of engagement and belonging. These included the development of peer
networks and friendships, creating links with academics, improving academic
skills, the development of a student’s confidence, and demonstrating future
relevance especially to employment outcomes.
203. The analysis also showed that the exact type of intervention or approach is less
important than the way it is offered and its intended outcomes. The researchers
concluded that interventions and approaches should be planned and informed by
the principles as set out in the text box below.
1. Mainstream: embed interventions and approaches into mainstream
provision to ensure all students participate and benefit from them
2. Proactive and developmental: activities should proactively engage
students and develop their capacity for engagement
3. Relevant: activities need to be informative, useful and relevant to students’
academic interests and goals; the potential benefits of engaging should be
explicit
4. Well timed and appropriate media: early engagement is essential to
student retention and success. Information may be better delivered via a range
of media, as students’ learning styles and needs will differ from each other and
over time
5. Collaborative: activities should encourage collaboration and engagement
with fellow students and members of staff
6. Monitored: the extent and quality of students’ engagement should be
monitored and follow-up action taken where levels of engagement are low
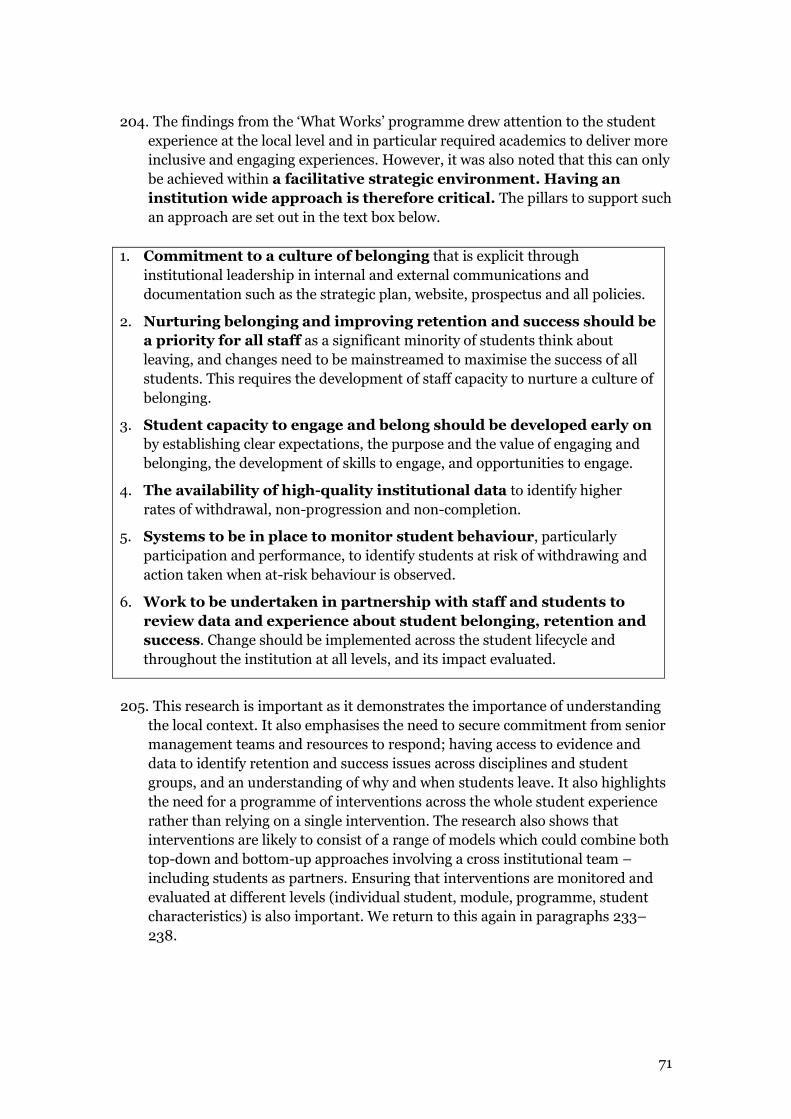
71
204. The findings from the ‘What Works’ programme drew attention to the student
experience at the local level and in particular required academics to deliver more
inclusive and engaging experiences. However, it was also noted that this can only
be achieved within a facilitative strategic environment. Having an
institution wide approach is therefore critical. The pillars to support such
an approach are set out in the text box below.
1. Commitment to a culture of belonging that is explicit through
institutional leadership in internal and external communications and
documentation such as the strategic plan, website, prospectus and all policies.
2. Nurturing belonging and improving retention and success should be
a priority for all staff as a significant minority of students think about
leaving, and changes need to be mainstreamed to maximise the success of all
students. This requires the development of staff capacity to nurture a culture of
belonging.
3. Student capacity to engage and belong should be developed early on
by establishing clear expectations, the purpose and the value of engaging and
belonging, the development of skills to engage, and opportunities to engage.
4. The availability of high-quality institutional data to identify higher
rates of withdrawal, non-progression and non-completion.
5. Systems to be in place to monitor student behaviour, particularly
participation and performance, to identify students at risk of withdrawing and
action taken when at-risk behaviour is observed.
6. Work to be undertaken in partnership with staff and students to
review data and experience about student belonging, retention and
success. Change should be implemented across the student lifecycle and
throughout the institution at all levels, and its impact evaluated.
205. This research is important as it demonstrates the importance of understanding
the local context. It also emphasises the need to secure commitment from senior
management teams and resources to respond; having access to evidence and
data to identify retention and success issues across disciplines and student
groups, and an understanding of why and when students leave. It also highlights
the need for a programme of interventions across the whole student experience
rather than relying on a single intervention. The research also shows that
interventions are likely to consist of a range of models which could combine both
top-down and bottom-up approaches involving a cross institutional team –
including students as partners. Ensuring that interventions are monitored and
evaluated at different levels (individual student, module, programme, student
characteristics) is also important. We return to this again in paragraphs 233–
238.
72
Degree outcomes
206. The influence of student characteristics also affects degree outcomes. This varies
across different groups; the largest gaps in attainment achieved are for BME
students. The research by HEFCE151 explored why this may be the case and
provides a valuable resource for institutions by highlighting ‘what works’ and the
types of interventions needed to address differential outcomes. It also recognises
that the actual approach and interventions required will vary depending on
institutional circumstances, mission and the make-up of the student population.
Nonetheless these provide an important reference point in addressing the
priorities identified in chapter 1.
Factors influencing degree attainment
The curricula, learning and teaching and assessment
practices – curricula should be co-developed in partnership with
students, relevant, and include user friendly learning, teaching and
assessment practices
Relationships between staff and students and among students
– having a sense of belonging was critical in supporting outcomes
Psychosocial and identity factors – students’ learning and
attainment was facilitated by ensuring students felt supported and
encouraged in their daily interactions within their institutions and with
staff
Differences in social, cultural and economic capital –recurring
differences in how students experience higher education, how they
network and how they draw on external support, and how their financial
situation could affect their experience and learning
207. The Higher Education Academy’s (HEA) undergraduate retention and
attainment across the disciplines report152 has also shown that the disciplinary
context is a factor; not only does the disciplinary context interact with student
characteristics, it can also exert an independent effect on both student retention
and attainment. Thus, some disciplines had retention rates of 93% while others
had rates of 99%. Similarly, attainment varied across disciplines, for example
subjects within the broad arts and humanities area (except for art and design) all
recorded higher rates of upper degrees than the sector as a whole. This points to
the need to better understand the curricula, cultures and practice at the
disciplinary level as well as how these interact with student characteristics.
151 HEFCE (2015) Causes in different student outcomes http://www.hefce.ac.uk/pubs/rereports/Year/2015/diffout/Title,104725,en.html 152 This report presents an analysis of data from the Higher Education Statistics Agency relating to undergraduate students participating in the academic year 2010 –11 and includes all students who were taking a degree in a single identifiable discipline. See HEA (2014) Undergraduate retention and attainment across disciplines, https://www.heacademy.ac.uk/resource/undergraduate-retention-and-attainment-across-disciplines, and HEA (2015), Undergraduate recruitment and attainment https://www.heacademy.ac.uk/resource/undergraduate-student-retention-and-attainment
73
208. Both the HEA and HEFCE’s findings illustrate the range of factors that can lead
to different attainment rates. The overarching message here is that addressing
attainment gaps is complex and there is no single solution. Different
interventions and strategies are needed. This includes the development of an
inclusive environment which promotes equality, opportunity and achievement
for all. Engaging students in this process is also critical, particularly in terms of
developing curricula and pedagogy.
Sector resources
209. To support this process we recommend that institutions consider the
range of frameworks that have already been developed for the sector.
This includes the series of frameworks153 developed by the Higher
Education Academy in collaboration with the sector and the equality
charters developed by the Equality Challenge Unit.
210. The Higher Education Academy frameworks series are evidence-based and
provide the higher education sector with a national reference point to enable the
institution to develop its own approach according to local circumstances as well
as benchmarking performance. The frameworks include toolkits154 which bring
together useful resources to enhance teaching practice and to improve student
learning outcomes.
211. The Equality Challenge Unit’s Race Equality Charter provides a framework
through which institutions identify and reflect on institutional and cultural
barriers standing in the way of minority ethnic staff and students. A particular
area of focus is student progression and attainment, which is an important
mechanism for supporting institutions in addressing gaps in retention and
outcomes155. The charter also provides a framework to support the delivery of an
institution-wide approach by covering curriculum design, professional and
support staff, and academic staff. Charters can also support institutions in
increasing the diversity of their staff profile. This is important given the
increasing diversity of students engaging in higher education.
153 The HEA Framework series for student success consist of seven frameworks (transforming assessment; embedding employability; student access, retention and attainment; internationalising higher education; flexible learning; student engagement through partnership; and student success; further information available at https://www.heacademy.ac.uk/frameworks-toolkits/frameworks 154 https://www.heacademy.ac.uk/frameworks-toolkits/welcome-hea-toolkits 155 Further information is available at http://www.ecu.ac.uk/equality-charters/race-equality-charter/
74
Case study: Kingston University and the Equality Challenge Unit Race
Equality Charter
Kingston University is one of the first institutions to be awarded the Race Equality
Charter for its ongoing commitment and active steps to improve race equality for
their staff and students. One of the reasons for the award was the university’s
groundbreaking work to address the BME attainment gap, making it an institutional
key performance indicator which the board of governors and senior management
team are accountable for and all staff are responsible for.
Kingston’s approach uses a value-added score, which takes account of a student’s
entry qualification and degree subject to predict an expected degree outcome based
on historical sector data. Scores are produced by ethnic group for the university as a
whole and for each faculty, school and course. These are then discussed with deans,
heads of school, course leads and at school and faculty away days so that everyone in
the organisation becomes comfortable discussing the attainment gap and is clear
about the relative performance of white and BME students on the courses. This has
helped the university to focus on the causes and potential solutions to improving the
attainment of BME students. The attainment gap has fallen from 30.4% in 2011–12
to 18.3% in 2014–15, a fall of 40% in three years.
212. HEFCE’s 2015 research highlighted the importance of evaluating interventions
and learning from others about what works. The HEA, in collaboration with
Kingston University, has done exactly that. By comparing how a number of
institutions have sought to address the attainment gap they have come up with a
number of key lessons learned. These reinforce the outcomes from the HEFCE
research regarding the need for a whole-institution approach and recognises
that, fundamentally, this has to be about changing organisational structure.
213. HEFCE’s research also showed that institutions varied in their awareness of
differential outcomes. The Advisory Group recommends that institutions
monitor and scrutinise their own retention and attainment data to
identify any gaps between student groups’ gender, race and disability
(at both undergraduate and postgraduate level). Where gaps exist
institutions should develop an action plan with metrics to measure
progress.156 Regular reporting of progress to the senior management team and
the governing body can also foster buy-in and commitment by senior leadership.
The work that is currently taking place in the field of student analytics157 and
student information systems will be important here.
214. As noted in chapter 2, students may enter higher education with a wide range
of qualifications such as BTECs or APEL. Some courses, particularly in high tariff
institutions, may not immediately lend themselves to students presenting with
these qualifications and experience. Where this is the case, to ensure that
156 This aligns with the conditions attached to the Teaching Excellence Framework. 157 Student analytics is defined by the Society for Learning Analytics Research as the measurement, collection, analysis and reporting of data about learners and their contexts, for the purposes of understanding and optimising learning and the environments in which it occurs.
75
students are able to access the curriculum, institutions may be required to
redesign introductory courses or review the delivery of transition and bridging
support in the first year or prior to the first year. Additional support may be
required throughout the degree to ensure that these students are able to engage
successfully throughout their course.
Using behavioural insights to support student success
215. Using behavioural insights to support student success is still very new in the
UK. However, this could provide a way to support students in their journey to
higher education, as has been demonstrated in the United States158. To explore
how this can work, King’s College London is working with the Behavioural
Insights Team at the Cabinet Office to document the experiences and
opportunities for widening participation students across the student lifecycle.
This will help the university to understand how students maximise their time at
university. By understanding what their most successful students do (termed
‘beneficial behaviours’) the university is able to share this practice with other
students as well as addressing ‘barrier behaviours’.
216. The second phase will involve designing and implementing ‘nudges’ to
encourage students to take up key opportunities and engage in the behaviours
that support a successful outcome. This will include text messaging and other
nudges at critical points in the student journey. We suggest that the outcomes of
this trail should be considered and disseminated via the Evidence and Impact
Exchange.
Support for disabled students
217. To further support disabled students Universities UK, in partnership with a
number of stakeholders159, has established a sector-led group, the Disabled
Students Sector Leadership Group. This group supports the sector in responding
to the changes in the Disabled Students’ Allowance (DSA) and to move towards
more inclusive practice. To support this process the group is developing guidance
which will be available in autumn 2017 and will:
articulate the strategic drivers and benefits of inclusive practice for
institutions and students and encourage institutional buy-in
identify key barriers to learning for disabled and non-disabled students
and explore how to address these
set out some short- and medium-term interventions and options for
achieving improved inclusivity
identify a set of principles for making reasonable adjustments
218. The Advisory Group welcomes the establishment of the group, and commends
its plans to the sector. These will provide a valuable resource to enhance
institutions’ own activities in this area. Furthermore, as we show later in this
158 The Better Make Room campaign uses text prompts and goal setting to help first generation students successfully transition to higher education, see https://bettermakeroom.org/ 159 This included GuildHE, the Association of Colleges, the NUS and the ECU.
76
section, the implementation of inclusive practice will also be important in
addressing the differential outcomes experienced by disabled students.
Mental health and wellbeing
219. The challenges set by the minister in chapter 1 make specific reference to
students with a mental health condition. This is not surprising given the latest
evidence collated by HEFCE160, which indicated a rapid rise in students reporting
disabilities – particularly a mental health condition. Between 2008–09 and
2012–13 there was a 130% increase in demand for university-provided student
mental health services. Related to this sharp growth in demand, there is a strong
public narrative of a crisis of mental health in our universities. A recent, well-
publicised NUS survey for the All-Party Parliamentary Group on Students
showed just under 80% of students experiencing mental health problems.
220. It is also important to look at student mental health within the broader context
of national wellbeing. The Five Year Forward View for Mental Health161 and
Future in Mind162 indicate a particular emphasis on mental health promotion
and prevention, early intervention and quick access to good quality care for
children and young people. However, with these declared strategic priorities
largely not yet translated into services commissioned for students, university
support services are reporting gaps in provision, long waiting times to access
NHS care and severe psychiatric illness referred back onto campus.
221. Although there are multiple public, private and charitable organisations seeking
to address these issues (including statutory NHS bodies and services, university
support services, students’ unions, activist charitable bodies and many others),
the scale of the issue suggests that there is more work to do. In view of this,
160 http://www.hefce.ac.uk/pubs/rereports/Year/2015/mh/Title,104768,en.html 161 https://www.england.nhs.uk/wp-content/uploads/2016/02/Mental-Health-Taskforce-FYFV-final.pdf 162 https://www.gov.uk/government/publications/improving-mental-health-services-for-young-people
Case study: Coventry University Maths Centre and Centre for
Academic Writing
Coventry University’s Maths Centre and Centre for Academic Writing
provide dedicated support to students with dyslexia or dyscalculia as part of
the university’s commitment to supporting disabled students throughout
their studies. In three years, continuation rates for disabled students have
risen by 6.7% to 90.8%, indicating that the programme is having an impact.
Other support for disabled students at the university includes a pre-entry
residential summer school for new students with disclosed disabilities, and
a social group for students on the autistic spectrum. The university’s
Welfare and Disabilities Office offers disability screening, faculty-based
learning support coordinators, specialist equipment loans, study support
drop-in sessions and disability awareness training for staff and students.
77
Universities UK has agreed to work with partners and stakeholders to develop
and promote a whole-university approach to mental wellbeing. The project will
gather evidence on prevalence and demand as well as the effectiveness of
interventions, develop case-studies on effective practice and develop a narrative
to support engagement and transformation.
The role of credit transfer in facilitating social mobility
222. The Advisory Group considered whether universities should adopt more flexible
approaches to credit earned by students during their courses and facilitate the
transfer of students between institutions. The argument made is that this could
aid social mobility, particularly for mature students. Students are already able to
transfer between higher education institutions, with decisions typically handled
on a case by case basis. While many institutions use an academic credit model,
ultimately the decision to accept academic credit is down to the receiving
institution and depends on a variety of factors, including the comparability of a
subject to the receiving programme and entry criteria.
223. The benefits to social mobility from encouraging a more flexible approach to
credit transfer are currently under-evaluated. It is not clear that there is
significant demand at present for a credit transfer system and transferring
between institutions can be disruptive to the continuity of a student’s studies
even where there is academic continuity between courses. This is likely to be
most pronounced for students from more disadvantaged backgrounds who study
locally and where changing to another institution in a different location may not
be possible.
224. Recognition of prior learning may present opportunities for more flexible
pathways into university study through recognition of accredited vocational
qualifications. As part of the discussions around its White Paper the government
initiated a call for evidence on credit transfer163. It will be important that the
higher education sector engages constructively with this to examine ways in which
credit transfer could be delivered and, most importantly, communicates the
options and opportunities to students.
GRADUATE OUTCOMES
225. Students increasingly report that one of the main reasons for choosing to go to
university is the fact that it will increase their chances of securing the job or
career that they want. However, as described in chapter 1, there are differences in
employment outcomes for graduates from different groups. This section looks at
activities to narrow the gap in employment outcomes from advantaged and
disadvantaged groups.
226. Universities have long undertaken extensive activity to support graduate
employability and workforce development. This has included working with
employers on the development of degrees, co-funded provision, embedding
163 ‘Accelerated Courses and Switching University or Degree: Call for Evidence’ https://bisgovuk.citizenspace.com/he/accelerated-courses-and-switching
78
employability within the curriculum, the provision of access to relevant work
experience and familiarity with the labour market, as well as promoting the value
of engagement in the wider student experience. This work has also been
supported by sector bodies such as the HEA, which has developed a framework
to help institutions systematically embed employability across the institution164.
227. University careers services clearly have a significant contribution to make in
terms of social mobility and graduate outcomes. For some students this will
focus on preparing for entry to the labour market. For others the focus will be on
support to progress, develop or change careers. Careers services also have an
important role to play in promoting graduate outcomes among students from
under-represented groups and to broker links with employers, particularly in
facilitating internships, placements and other opportunities for work experience.
At the employers’ roundtable it was reported that some employers from the small
and medium enterprise (SME) sector felt overlooked by careers services, whose
focus has been on working closely with large graduate recruiters. In view of the
increasing importance of SMEs in the labour market, strategies to develop links
with SMEs will become more important.
228. Alongside careers services, some university departments have begun to develop
activities that support employability among students and directly contribute to
teaching and learning in specific subject areas. This helps to raise students’
awareness of employment options and illustrates what is involved in particular
jobs. Engagement with academics can alsoinfluence students’ career choices.
Case study: University of Sussex First-Generation Scholars programme
The University of Sussex’s award-winning First Generation Scholars scheme (FGS)
programme provides a wide range of support and initiatives to increase
participation in higher education among under-represented groups.
The university works in target areas where there has traditionally been a low
progression rate into higher education across the south of England. As children
enter year 9, a variety of methods are used, including visits to the campus, summer
schools and events to engage children – and their parents – in higher education.
When at Sussex, FGS participants are supported throughout their studies with
numerous workshops and social programmes aimed at improving social mobility.
These students are also able to improve their employability skills through
internships and supported study abroad opportunities. For example, in the
summer several hundred FGS students take part in funded internships at home or
overseas, for example in China. Students are also offered the chance to participate
in paid research internships to explore the possibility of postgraduate study and a
research career.
164 See HEA Framework for embedding employability in higher education: https://www.heacademy.ac.uk/enhancement/frameworks/framework-embedding-employability-higher-education
79
The scheme has been extremely successful, with 90% of FGS students graduating
in 2015 and either moving into graduate-level employment or further study. This
was a higher percentage than among the graduate cohort overall.
229. There is much evidence which asserts that extracurricular activities,
volunteering165 and outward mobility programmes166 (see paragraphs 230–232)
can be helpful in improving the employability of students from disadvantaged
groups by developing the skills valued by employers such as communication,
team-working and leadership. However, as research by Professor Mary Stuart,
Vice-Chancellor of the University of Lincoln, has revealed, there are fewer
opportunities for those from less privileged backgrounds to benefit from such
opportunities. This is because many of these students have to work as well as
study or have caring responsibilities, and therefore may have less time available
to engage in extracurricular activities.
230. Partly in response to these issues, Universities UK, in partnership with the
National Union of Students, in 2015 published Breaking down the barriers to
youth social action and opportunities167. This report maps out the barriers
disadvantaged students may face arising from cultural and social differences and
includes a Social Action Higher Education Framework168 to support both
universities and students’ unions in removing barriers to social action. This was
followed by a roundtable discussion in 2016 with leaders in higher education and
employers resulting in the development of an action plan169 to embed and
increase social action across all UK universities. This included encouraging the
higher education sector to engage with the #iwill campaign170 which aims to
double the number of young people involved in meaningful social action by
2020. The increased emphasis on supporting character and resilience in the
secondary sector and the expansion of the National Citizen Service171 should also
be helpful in supporting students to prepare for adult life, including further study
and work. Annexe B, sets out the evidence of how youth social action can boost
social mobility into, and after, university.
231. Research by the UK Higher Education International Unit (now Universities UK
International) into outward student mobility demonstrates how international
experience can improve academic and employment outcomes for students172. The
165 Stuart M (2012) Mobility and Higher Education: The life experiences of first generation entrants in
higher education 166 UK Higher Education International Unit (2016), Gone International. The value of mobility http://www.universitiesuk.ac.uk/policy-and-analysis/reports/Pages/gone-international-2016-value-mobility.aspx 167 http://www.universitiesuk.ac.uk/policy-and-analysis/reports/Documents/2015/breaking-down-the-barriers.pdf 168 http://www.universitiesuk.ac.uk/policy-and-analysis/reports/Documents/2015/breaking-down-the-barriers.pdf 169 A report of the roundtable discussion and the action plan is available at http://www.universitiesuk.ac.uk/policy-and-analysis/reports/Pages/roundtable-on-social-action.aspx 170 Details on the #iwill campaign are available at http://www.iwill.org.uk/ 171 Information on the National Citizen service is available at http://www.ncsyes.co.uk/what-is-ncs 172 Gone International. The value of mobility (February 2016) http://www.universitiesuk.ac.uk/policy-and-analysis/reports/Pages/gone-international-2016-value-mobility.aspx
80
research demonstrates that UK-domiciled students who have been mobile are
less likely to be unemployed six months after graduation than their peers who
did not participate in a mobility programme. The differential in employment
outcomes is more noteworthy for graduates from disadvantaged or minority
ethnic backgrounds. Yet these groups – who derive the most benefit – are those
most underrepresented in mobility programmes. HESA data from 2014–15
shows that over 60% of mobile students come from the top two socio-economic
classifications and 82% are white173.
232. Working with both widening participation and international officers, the Go
International team at Universities UK International held a workshop to develop
an action plan to support universities in providing more opportunities for
students from less advantaged backgrounds to access international experiences
during their studies174 and to share examples of good practice. In view of the
benefits of this activity in enhancing outcomes for disadvantaged students, the
Advisory Group urges government to extend funding for these activities.
EVALUATION AND IMPACT
233. Universities make a significant commitment to outreach work and initiatives to
improve social mobility. In its recent Access agreement monitoring for 2014–15:
institutional evaluation, and equality and diversity report175, OFFA reported on
institutions’ work in evaluation of widening participation activity and financial
support in the most recent academic year. It found that 70% of institutions
actively evaluated their activities and programmes in 2014–15. OFFA also
highlights that the proportion of institutions reporting that they were at an
advanced stage of their evaluation had doubled since 2013–14, increasing from
7% to 14% in 2014–15. In this report, OFFA has also indicated that, while the
majority (79%) of institutions evaluated their financial support in 2014–15, fewer
than half (45%) evaluated their financial support by analysing the impact on
behaviour, such as access, retention and attainment figures. OFFA is continuing
to work with the sector to develop more robust and effective approaches.
234. Likewise, HEFCE continues to emphasise the importance of institutions
monitoring and evaluating the impact of interventions. Its research to explore
differential attainment and progression outcomes across different student
groups176 found that institutional interventions did not always work from an
evidence base. Furthermore, there were generally fewer evaluations of activities,
especially of long-term interventions. In view of this HEFCE has developed an
evaluation framework to support institutions in determining impact and
developing a more consistent approach across the sector. Figure 5 describes the
framework.
173 http://go.international.ac.uk/student-profiles-and-identities 174 Widening participation in student mobility programmes: http://go.international.ac.uk/widening-participation-student-mobility-programmes-workshop-resources 175 https://www.offa.org.uk/wp-content/uploads/2016/07/2016-05-Access-agreement-monitoring-for-2014-15-institutional-evaluation-and-equality-and-diversity.pdf 176 HEFCE (2015) Causes of differences in student outcomes http://www.hefce.ac.uk/pubs/rereports/Year/2015/diffout/Title,104725,en.html
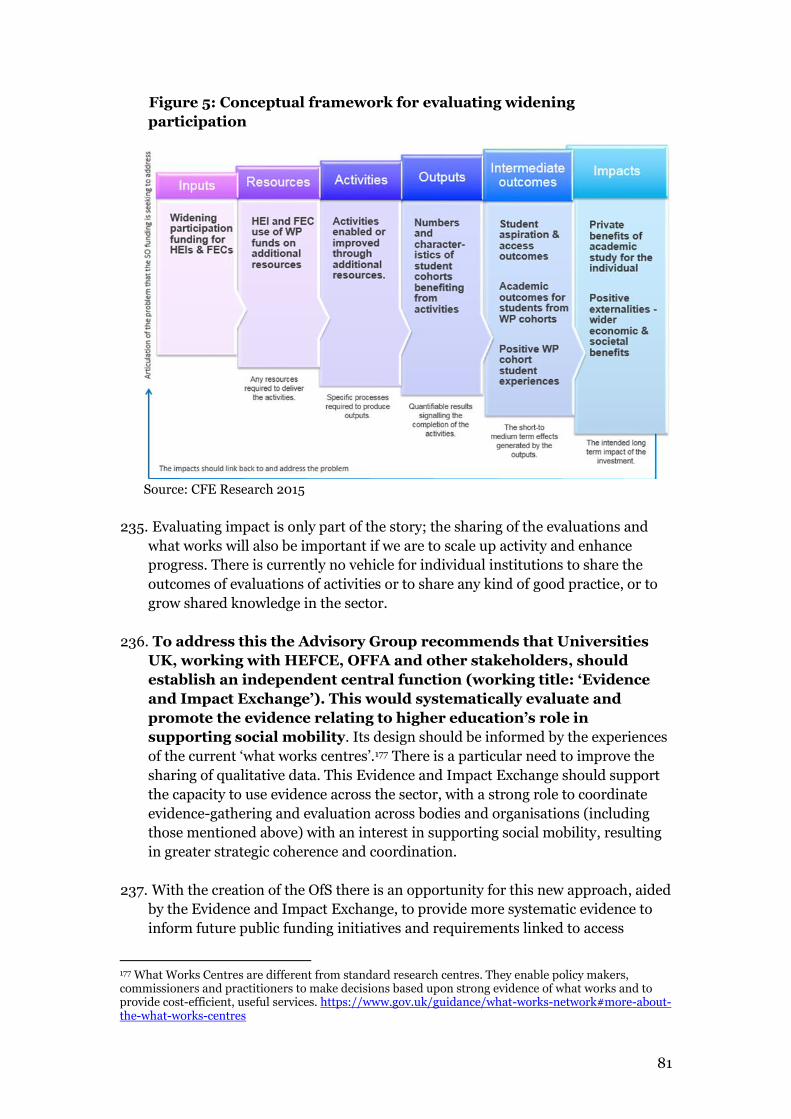
81
Figure 5: Conceptual framework for evaluating widening
participation
Source: CFE Research 2015
235. Evaluating impact is only part of the story; the sharing of the evaluations and
what works will also be important if we are to scale up activity and enhance
progress. There is currently no vehicle for individual institutions to share the
outcomes of evaluations of activities or to share any kind of good practice, or to
grow shared knowledge in the sector.
236. To address this the Advisory Group recommends that Universities
UK, working with HEFCE, OFFA and other stakeholders, should
establish an independent central function (working title: ‘Evidence
and Impact Exchange’). This would systematically evaluate and
promote the evidence relating to higher education’s role in
supporting social mobility. Its design should be informed by the experiences
of the current ‘what works centres’.177 There is a particular need to improve the
sharing of qualitative data. This Evidence and Impact Exchange should support
the capacity to use evidence across the sector, with a strong role to coordinate
evidence-gathering and evaluation across bodies and organisations (including
those mentioned above) with an interest in supporting social mobility, resulting
in greater strategic coherence and coordination.
237. With the creation of the OfS there is an opportunity for this new approach, aided
by the Evidence and Impact Exchange, to provide more systematic evidence to
inform future public funding initiatives and requirements linked to access
177 What Works Centres are different from standard research centres. They enable policy makers, commissioners and practitioners to make decisions based upon strong evidence of what works and to provide cost-efficient, useful services. https://www.gov.uk/guidance/what-works-network#more-about-the-what-works-centres
82
agreements. We believe there is a strong case for future funding and innovative
practice to support social mobility.
238. The alignment of the oversight of public and institutional funding between
HEFCE and OFFA in the OfS, alongside the development of a national evidence
framework, will also bring greater coherence to the sector’s work on widening
access and supporting successful outcomes. It will both improve evidence of
impact to enable assurance and accountability to government and the wider
public and help institutions to refine and improve their work.
Tracking of individuals
239. One area that has proved problematic in the past is tracking the progress of
individuals who have gone on university-sponsored outreach programmes.
However, this is now being addressed by the extension nationally of the HEFCE-
sponsored Higher Education Access Tracker (HEAT)178 programme. UCAS is also
developing a digital ID service to facilitate access to personal data from students
participating in widening participation activities where they consent to this; once
developed this service will enable universities to track participants on outreach
activities into and through higher education. In developing the digital ID service
we recommend that UCAS works with universities to devise a consent
statement for their digital ID services that will cover all outreach
programmes across the UK. This in turn will allow UCAS to provide
personal tracking data for those who consent alongside intervention
tracking data. This will support the sector in its evaluation of
outreach activities.
240. Improved analysis of prior attainment, including by student characteristics and
of progression rates will support the development of more effective widening
participation initiatives. We therefore recommend the better sharing of
data between schools, colleges and universities to allow each sector to
understand the trajectories of students and to target widening
participation activities more effectively. The move of higher
education into the DfE provides an ideal opportunity to deliver more
effective coordination and the sharing of data across the sectors.
Although we recognise that the methods used to address
disadvantage may continue to differ between the national school
system and the autonomous higher education sector, this should not
preclude better sharing of data in relation to prior attainment at both
level 2 and 3 (with a particular focus on the impact of socio-economic
disadvantage, ethnicity and disability). Neither should it impede
better coordination and a more consistent approach to data on
progression from level 3 qualifications to higher education.
178 The Higher Education Access Tracker (HEAT) is a monitoring and evaluation service tracking engagement in outreach activities and building evidence of future student achievement. https://www.highereducationaccesstracker.org.uk/login.aspx
83
WORKFORCE DEVELOPMENT
241. The growth in investment and activity in widening access work has been
relatively rapid, taking place over only the last 10 to 15 years. This growth has
outpaced the ability of the sector to put in place systematic professional
standards to underpin the delivery of this work and structured opportunities for
workforce development. Staff enter widening participation teams from diverse
routes and their progression through institutional hierarchies is unclear, while
the majority of academic staff have received little or no training on what
widening participation means and how it impacts on their work. The
development and professionalisation of the workforce is, like the effective use of
data and evidence-based practice, one of the key principles of improvements in
service delivery common to any policy area. Hence, it is crucial that greater
attention is paid to – and investment made in – enhancing the capabilities of
those working not just in schools, but also those in higher education at all levels
and in both the professional and academic areas.
242. Alongside sector bodies such as the HEA and the ECU there are a number of
professional networks, associations and charitable organisations including FACE
(Forum for Access and Continuing Education)179, Action on Access180, NEON181,
and the Higher Education Race Action Group182 that between them offer a
variety of professional development events and services to support the
development of practitioners working in widening participation and equality
and diversity, researchers and policy makers from across the higher education
sector.
243. The annual Universities UK and Action on Access Summit183 is now in its sixth
year. The summit offers a national platform to explore and debate widening
participation policy, practice and research, through plenary inputs and a wide
range of expert-led professional development workshops. Exploring how
academic staff can receive training in supporting the access, retention and
success of students from under-represented groups is also important. The launch
of a new programme184 to link widening participation practitioners and
academics by the OFFA, in partnership with Sheffield Hallam University and
the University of Newcastle, Australia, will support this process by encouraging
the sharing of what works, by bringing together practitioners and academic
mentors to develop and publish papers on successful initiatives in academic
journals.
179 Forum for Access and Continuing Education, http://www.f-a-c-e.org.uk/ 180 Action on Access, http://actiononaccess.org/ 181 NEON is the professional organisation for widening access to higher education in England, with over 80 organisational members including 57 higher education providers, http://www.educationopportunities.co.uk/ 182 http://www.ecu.ac.uk/wp-content/uploads/2014/10/HIGHER-EDUCATION-RACE-ACTION-GROUP-TOR-2012-2.pdf 183 Annual Access to HE Summit is organised in partnership between Universities UK and Action on Access. 184 https://www.offa.org.uk/press-releases/new-programme-link-wp-practitioners-academics/
84
UNIVERSITIES AND REGIONALISATION
244. In the past, social mobility has been analysed at national or individual
institutional level, with responses tending to follow those polarities. However,
increasingly the focus is on regional responses, with universities working with
partners in their regions, including Local Enterprise Partnerships, to develop
sustained initiatives that align with broader regional agendas. The NCOPs will
also be important here. This regional focus is relevant to the socio-economic and
ethnic mix of applicants to institutions, pre-higher education attainment, the
skills needs in the local economy and graduate employment possibilities. It also
aligns with recent government thinking on devolution to English regions and
cities and the instigation of metro mayors from 2017185. Some agreements in this
area have already been announced, such as City Deals186 and more are expected.
Universities have a key role as anchor institutions driving growth and meeting
skills needs; it is important that universities and colleges play a central role in
this agenda.
245. The government’s devolution agenda allows for more collaboration at a regional
level and could help to enhance collaboration between employers, higher
education institutions, schools, colleges and other stakeholders.
246. This focus on regionalisation aligns with work carried out by HEFCE and others
in relation to the role of place in social mobility.
247. The ability of people to be geographically mobile is also relevant. The concept of
the ‘local graduate’ is critical here, specifically people from backgrounds that may
restrict their mobility and who therefore are unlikely to travel far to work or
study. There may be lower economic returns in going to university for these
groups; however, there will be significant added value in the contribution they
make to their communities and local economies.
185 A metro mayor is the chair of a combined authority that has agreed to a Devolution Deal. Combined authorities are made up of several local authorities. Metro mayors will have powers and responsibilities to make strategic decisions across whole city regions in contrast to existing mayors or local council leaders that can only make decisions for, and on behalf, of their local authority. 186 Thirty-nine Local Enterprise Partnership (LEP) Local Growth deals (these were announced in 2014, 26 City Deals (these are agreements between government and a city) were announced between 2012 and 2013 in England, and ten devolution deals have been announced since 2014.
85
5. CONCLUDING REMARKS AND RECOMMENDATIONS
In this chapter we review the emerging themes from this report and make
recommendations to help address the areas of disadvantage identified in chapter 1.
DATA
The role of data is growing in significance, particularly in an environment where
student choice is so influential in determining outcomes. The effective use of data will
be an essential tool in driving future developments. Data is relevant to social mobility
because it underpins the effective information, advice and guidance that needs to be
provided to students and their families. Data provides the information needed by
universities and decision-makers to identify issues and then to respond to and
evaluate initiatives and policies. It is also critical in terms of introducing greater
accountability and transparency.
We therefore propose the following:
Recommendation 1
Notwithstanding that POLAR measures participation in higher education and not
disadvantage, it remains an essential tool, as a proxy, for understanding disadvantage
and is widely used by policy makers, researchers and institutions. However, in
discussion with higher education practitioners, schools and other bodies it is clear
that this is now regarded as too blunt an instrument on its own to inform the sector’s
work on social mobility. We therefore propose the creation of a basket of indicators
shared across the sector to measure disadvantage in applicants and students, using
both population-based and individual indicators. These would sit alongside other
data which institutions may wish to use, eg course-specific data. Consideration
should also be given to how the basket of indicators compares with measures of
disadvantage used by schools and employers. This is work that the Practitioners’
Reference Group has agreed to take forward. The Group will also explore how
universities can be supported to monitor their own student body as a whole using
these indicators.
Recommendation 2
Work should be undertaken with graduate employers to coordinate and promote
their monitoring and publication of data on recruitment of under-represented
groups, particularly graduates from disadvantaged backgrounds, and black and
minority ethnic and disabled graduates. This will require a common understanding of
socio-economic backgrounds, which is currently being developed by the Cabinet
Office in partnership with the Bridge Group: Developing a Common set of Measures
for Employers on the Socio-Economic Backgrounds of their Workforce and
Applicants187. This work should align with the work on POLAR identified above and
will be taken forward by the Employers’ Forum.
187 This process has engaged a large number of employers and academic experts and will be published in autumn 2016. https://www.gov.uk/government/uploads/system/uploads/attachment_data/file/525928/6_2224_co_engagement_document_employer_measures_on_socio_economic_background.pdf

86
Recommendation 3
There should be better sharing of data between schools, colleges, universities and
educational charities, to enable each sector to understand the trajectories of students
and to facilitate better targeting and coordination of widening participation activities.
The move of higher education into the Department for Education provides an ideal
opportunity to ensure more effective coordination and the sharing of data across the
sectors. We recognise that the methods used to address disadvantage may continue to
differ between the national school system and the autonomous higher education
sector. Nevertheless, this should not preclude better sharing of data in relation to
prior attainment at both level 2 and 3 (with a particular focus on the impact of socio-
economic disadvantage, ethnicity and disability), and a more consistent and
coordinated approach to data on progression from level 3 to higher education.
Recommendation 4
The Practitioners’ Reference Group should explore the range of flexible pathways and
transitions between schools, colleges, alternative providers and universities with
better data to articulate the transition at each stage.
Recommendation 5
In developing its digital ID service, UCAS should work with the sector to devise a
consent statement that would enable students engaged in outreach programmes
across the UK to share their progress. This will allow UCAS to provide personal
tracking data for those who consent alongside intervention tracking data.
EVALUATION AND UNDERSTANDING OF WHAT WORKS
Throughout the Advisory Group’s work and reflected in this report is a strong and
consistent message about the need for effective evaluation of policies and
interventions that support and promote the contribution of higher education to social
mobility. There needs to be a focus on ‘what works’, underpinned by a robust and
systematic use of the evidence, to inform policy and effective institutional decision
making. There have been positive moves in this direction in recent years, but it is
clear that more needs to be done if we are to address the inequalities set out in
chapter 1.
We therefore propose the following:
Recommendation 6
Universities UK, working with other stakeholders including the Higher Education
Funding Council for England and the Office for Fair Access, should establish an
independent central function (working title: ‘Evidence and Impact Exchange’) that
would systematically evaluate and promote the evidence relating to higher
education’s role in supporting social mobility. Its design should be informed by the
experiences of the current ‘what works centres’. There is a particular need to improve
the sharing of qualitative data; this function should also support the capacity to use
evidence across the sector, and throughout the UK, with a strong role to coordinate
87
evidence-gathering and evaluation across those bodies and organisations (including
those mentioned above) with an interest in supporting social mobility. This will bring
greater strategic coherence and coordination. This could also include the use of social
media to share innovative practice, such as an ‘education innovator’ podcast.
Recommendation 7
In view of the close correlation between attainment at school and university
experience and success, the Evidence and Impact Exchange should be used to
undertake a systematic review of the evidence on the effectiveness of activities
undertaken by higher education institutions and employers to support the raising of
attainment in schools. This links to recommendation 13(i).
Recommendation 8
To incentivise more outreach aimed at mature students, more research is needed to
understand the results of outreach activity targeted at mature students. We suggest
that this is taken forward by the Evidence and Impact Exchange.
INFORMATION, ADVICE AND GUIDANCE, AND COMMUNICATIONS
This report has identified information, advice and guidance (IAG) as critical in
supporting the decisions made by students in navigating pathways into higher
education and then deciding on their graduate outcomes. There are a number of
significant challenges across the current schools and post-16 landscape. We also
know that although universities deliver extensive activity to support employability,
graduate outcomes can differ according to a graduate’s background. The perception
that people have only one chance at the age of 18 needs to change, by promoting the
role of lifelong learning. The machinery of government changes which have seen
higher education move into the Department for Education create an unparalleled
opportunity for addressing these issues. Universities UK will work closely with the
department to support this.
We therefore propose the following:
Recommendation 9
The new Department for Education strategy on careers provision should ensure that
joined-up and coherent careers advice is delivered to young people in schools and
colleges so that the post-16 options are properly explained. The particular difficulties
experienced by BME, disadvantaged and disabled students should also be taken into
account. Higher education institutions and employers should be involved in the
development of the strategy to ensure coordinated advice and guidance that takes
account of graduate employment options. The higher education sector should also
continue to build information on graduate options into outreach activities and
activities throughout the student lifecycle.
Recommendation 10
Universities UK will work with government to develop a more robust approach to
IAG, including greater alignment between government and higher education sector
88
communications around social mobility and higher education. Although
responsibility for communications about higher education primarily rests with
universities, it is important there is consistency of messages from higher education
and government, particularly in terms of social mobility. This strategy should
particularly seek to:
(i) extend and promote the role and contribution of contextual data, and the
significance of prior attainment in admissions and fair access
(ii) enhance the awareness among students of different routes into higher
education, the range of courses, the graduate outcomes achieved in relation to
those courses, and the different modes of study (part time, online) available.
There should be a particular focus on encouraging up-skilling or reskilling of
mature students and the promotion of lifelong learning, along with the value
of part-time study.
Recommendation 11
Universities UK will work with the higher education sector and Vitae, an organisation
supporting the professional development of researchers, to improve information,
advice and careers guidance in relation to postgraduate study and research.
Consideration should also be given to exploring the development of systematic
programmes of inreach and outreach and identifying ‘cold spots’ for postgraduate
participation.
LEAGUE TABLES
The effect of league table metrics on institutions’ behaviour has been raised many
times during the course of the Advisory Group’s work, in that some metrics could
disincentivise action on social mobility.
We therefore propose the following:
Recommendation 12
Universities UK will arrange a roundtable discussion with league table compliers, the
higher education sector and experts in the area to gain a better understanding of the
potential impact of league tables on social mobility. These discussions could produce
a common set of principles and commitments to underpin the development of league
tables. How these tables are interpreted by parents, students and schools is equally
important and should also be taken into account.
INSTITUTIONAL PRACTICE
Although different institutions will adopt different strategies to address issues of
social mobility in a way that aligns with their own mission and priorities, evidence
obtained by the Advisory Group suggests that all institutions remain committed to
improving access and success for all students, whatever their backgrounds. This is
reflected in the progress that has been made over recent years. It is also clear that
significant challenges remain for some students, particularly for students from
89
disadvantaged backgrounds, students from black and minority ethnic groups and
disabled students. We make a number of recommendations to help institutions
address these challenges. Alongside this, the Practitioners’ Reference Group will
evolve into a Community of Practice Network to provide a forum for overseeing
progress.
We therefore propose the following:
Recommendation 13
Given that the primary barrier to participation in higher education and particularly
high tariff institutions for students from disadvantaged backgrounds is low prior
attainment, higher education institutions should review what more can be done to
support the raising of prior attainment.
This might include:
(i) A greater focus on academically based outreach activities, where appropriate,
targeted at supporting attainment and university level skills. This will be
supported by the systematic review of the evidence of these activities (see
recommendation 7).
(ii) The creation of a map of charitable sector activities to enhance school, college,
university and employer collaborations.
(iii) Higher education institutions to explore how different models of higher
education and school interaction can be further developed, strengthened and
scaled up. Many, if not all universities, are already actively involved in
collaborations with schools such as the provision of homework clubs, summer
schools or teaching support. The form this takes will depend on institutional
strengths and local circumstances and may include collaboration both with
and outside NCOPs, for example with successful charitable organisations.
Consideration should also be given to evaluating the difference that these
interactions make with schools.
(iv) Universities UK will actively engage with the Higher Education Funding
Council for England and the Office for Fair Access, the charitable sector and
other bodies across the UK to promote improved and expanded links with
schools and share effective practice, and to improve the evidence of impact in
this area.
(v) Higher education institutions are encouraged to consider how to make the use
of contextual data better understood by potential applicants and others and to
use contextual data that is both transparent and evidence-based. Where
appropriate institutions may wish to consider the use of contextualised offer-
making informed by advice from the Supporting Professionalism in
Admissions programme. To support this process, the Supporting
Professionalism in Admissions programme should continue to identify, and
share good practice, in the use of contextual admissions.
90
Recommendation 14
As well as breaking down barriers to higher education, students from different
backgrounds may need support to achieve their full potential. To this end we
recommend that higher education institutions:
(i) Monitor and scrutinise their admissions, retention, attainment, transition to
postgraduate study and graduate employment data to identify where there
may be gaps – particularly in relation to race, socio-economic status, gender
or disability – and explore how these gaps can be addressed.
(ii) Consider using frameworks that have already been established by the sector
such as the frameworks developed by the Higher Education Academy and the
Equality Challenge Unit’s Gender Equality Charter and the Race Equality
Charter. These will support institutions in implementing a whole-institutional
approach to differential outcomes involving students, academics and
professional staff working together, with support from senior leaders.
(iii) Review the guidance provided by the Disability Sector Leadership Group to
support delivery of inclusive practice and the move towards a social model of
disability (to be published at the end of October 2016).
GRADUATE OUTCOMES
Recommendation 15
Employers have an important role to play in promoting social mobility in graduate
outcomes. Universities UK will work with the Employers’ Forum to deliver the
following:
(i) Explore how best to share evidence on effective practice, and evaluation of
interventions and outcomes, such as recruitment practices and the use of
contextual data, potentially by linking into the proposed ‘Evidence and Impact
Exchange’
(ii) Support better coordination of outreach activities between employers, and
between employers and universities. This could include the promotion of
sector-specific collaborative models, and the provision of careers advice.
(iii) Given the significance of small and medium enterprises (SME) in the UK
labour market as a destination for graduates and the importance of the role of
universities and colleges in their local communities, review how universities
can engage with and support SMEs and other employers and regional
partners (such as the Local Enterprise Partnerships, City Deals and Metro
Mayors) to develop a regional approach to tackling disadvantage
(iv) Explore how universities can work with employers to enhance the links
between employers and the curriculum and the student experience through
activities such as placements, internships and mentoring as well as new
models of delivery and partnership such as degree apprenticeships.
91
NEXT STEPS
This report identifies a number of areas for action. Universities UK will work with the
higher education, schools, employers and charitable sectors to implement the
recommendations. This process will begin with an implementation plan which will be
developed and agreed with the parties involved. The focus of this report is England,
but social mobility is a priority shared across the UK. Universities UK will explore
synergies with activities and initiatives being taken forward in Scotland, Wales and
Northern Ireland. A report on the progress made against the recommendations will
be published by Universities UK at the end of 2017.
92
ANNEXE A: SOCIAL MOBILITY IN HIGHER EDUCATION: A
SUMMARY OF CURRENT CHALLENGES
Widening participation and ensuring fair access is an area of significant interest to
the higher education sector and universities are already committed to delivering
progress in these areas. In 2014–15 higher education institutions in England spent
£725.4 million of their tuition fee income on widening participation, in addition to
the £357 million allocated to them for this purpose by the Higher Education Funding
Council for England (HEFCE) under the Student Opportunity Fund. This is a
continuation of investment which higher education institutions and government have
been making for some time, and which has already had significant success in
widening access and increasing participation in higher education.
Between 2006 and 2015 the proportion of 18-year-olds from England in the most
disadvantaged group (POLAR3188 quintile 1) going on to full-time undergraduate
courses through UCAS increased by 65%, from 11.2% to 18.5%, and for those 18-year-
olds receiving free school meals the entry rate increased by 80% from 9.1% to
16.4%189. At the same time, both the proportion and the absolute number of young
full-time undergraduate students in England from the most disadvantaged group
have increased190.
There have also been impressive increases in the proportion and absolute number of
both full- and part-time undergraduates in receipt of the Disabled Students’
Allowance (DSA) over the same period, with the proportion of full-time
undergraduates receiving the DSA rising by 67% between 2006–07 and 2014–15 and
the proportion of part-time undergraduates receiving it rising by 135%191.
The number of full-time UK undergraduate students from black and minority ethnic
groups at English higher education institutions has also increased, rising by 16%
between 2007–08 and 2014–15. Comparison with data from the 2011 census on the
proportion of 18 to 29 year-olds in each ethnic group in the population also suggests
that students from non-white groups are well represented in English higher
education institutions, although they are not equally distributed. Non-continuation
rates are also continuing to fall for all ethnic groups, although some remain above
what would be expected given students’ other characteristics192. It is also worth
noting that this success has been achieved within a context where social mobility
across the UK more broadly has remained low as indicated by the research on social
mobility by Professor Stephen Machin et al193.
188 POLAR (Participation of Local Areas) is a widening participation measure which classifies census wards five groups, based on the proportion of 18-year-olds who enter higher education aged 18 or 19 years-old. The groups range from quintile 1 (areas with the lowest young participation) to quintile 5 (areas with the highest young participation). POLAR3 is the latest iteration of the measure, with 2015 the first year that UCAS have reported on it. 189 UCAS (2015), End of Cycle Report 2015 190 HESA (2008, 2016), UKPIs: Widening participation of under-represented groups (table T1a) 191 HESA (2008, 2016), UKPIs: Widening participation of students who are in receipt of DSA (table T7) 192 HEFCE (2016), Non-continuation rates: Trends and profiles, available from http://www.hefce.ac.uk/analysis/ncr/ 193 S. Machin, ’10 Years On: Britain’s Low Social Mobility Problem’, lecture, 10 December 2015.
93
However, despite these successes there is further to go, not least in widening access
to those from disadvantaged backgrounds and improving outcomes from higher
education for those from black and minority ethnic groups. The rest of this paper
outlines those challenges and potential methods for responding to those challenges
and in order to do this it uses broad categories to identify patterns of disadvantage.
We recognise that these are not always representative and that individual experiences
and behaviour will in some cases be different from this.
1: ACCESS TO HIGHER EDUCATION
State of play and current challenges
There is a variation in the rates at which different groups participate in higher
education on the basis of socio-economic status, ethnicity, region and gender. The
biggest gaps are for white students from the lowest socio-economic groups, with part
of the reason for the gap being low pre-higher education attainment.
Disadvantaged pupils
Definitions of disadvantage are contested and complex. The measure most commonly
used in the higher education sector, and used in this report is POLAR, a measure of
relative rather than absolute disadvantage, measuring participation in higher
education rather than, for instance, socio-economic status.
There has been some criticism of POLAR in recent years, primarily that as an area
based measure it will miss some variation in individual circumstances, but also that
its focus is too narrow. HEFCE has carried out an evaluation of POLAR3 (the latest
iteration of POLAR) which highlights a number of findings in relation to the
suitability of POLAR as a measure of disadvantage. These are set out below:
• Although POLAR correlates with other measures of disadvantage, for instance
those based on schools (school type or percentage claiming free school meals) or
those based on individual circumstances (free school meal claimant or school
attainment) the relationships are not perfect. The example often given is London
where areas with levels of high deprivation are not always grouped in quintile 1
and may therefore be overlooked when targeting disadvantaged students if using
POLAR only.
• The relationship between POLAR and other measures of disadvantage in
England highlights the need for a range of different measures to be used when
targeting disadvantaged students. This could include measures based on income
deprivation (such as the IDACI), individual-based measures (for example free
school meals status), school-based measures (school type) and other area-based
measures (the percentage of pupils on free school meals).
• POLAR also does not work well in areas with relatively high rates of
participation in higher education such as Scotland, because it is unable to
distinguish adequately between different groups. Consequently, Scotland does
94
not use POLAR and instead uses the Scottish IMD (Indices of Multiple
Deprivation) and NS-SEC.
Entry rates for disadvantaged pupils as measured by POLAR3 are lower than those
for advantaged pupils. In 2015, 18.5% of 18 year olds from England in quintile 1 (the
least advantaged) accepted offers to study full-time undergraduate programmes at a
UK university via UCAS, compared to 44.9% in quintile 5 (the most advantaged). The
entry rate for those in quintile 1 has risen in recent years and the gap between these
two rates has fallen, but it remains high. Those in quintile 5 are 2.4 times more likely
than those in quintile 1 to accept an offer to enter full-time higher education via
UCAS. The latest figures from UCAS during Clearing suggest that a similar gap will
remain in 2016194.
The most recent figures released by UCAS, in their 2015 End of Cycle report, suggest
that the rate of growth for quintile 1 entrants is slowing. Growth in the quintile 1
entry rate in 2014 was 8.5% whilst growth in 2015 was 3.9%, similar to growth in the
entry rates for quintiles 2, 3 and 4 (though higher than growth in quintile 5). UCAS
also introduced a new measure of inequality in their 2015 report looking at multiple
equality dimensions. Under this measure they found that a wider gap exists between
the most and least advantaged groups, and that growth in the least advantaged group
had slowed more than under POLAR3.
Recent research by the Institute for Fiscal Studies (IFS) for the former Department
for Business, Innovation and Skills (BIS)195 suggests that most (but not all) of the
difference between participation in higher education by socio-economic status can be
explained by prior attainment and other background characteristics (such as those
examined below). They place particular focus on attainment at GCSE, which had
more importance than attainment at key stage 5 in their analysis. However, a
statistically significant gap remained even when attainment and background
characteristics were controlled for.
Ethnic minorities
Using the 2011 census data on the proportion of 18 to 29 year-olds in each ethnic
group in the population, students from ethnic minority groups are well represented
in English and Welsh higher education institutions. UCAS analysis of the proportion
of 18-year-old former state school students entering full-time higher education
through UCAS suggests that the entry rates are lowest for pupils from the white
ethnic group196. The IFS’s research also suggests that pupils from all other ethnic
groups are significantly more likely than white British pupils to go on to higher
education.
194 UCAS (2016) Daily Clearing analysis 2016 https://www.ucas.com/corporate/data-and-analysis/ucas-undergraduate-releases/daily-clearing-analysis-2016 195 BIS (2015) Socio-economic, ethnic and gender differences in HE participation 196 Because these entry rates only cover former state school pupils and require UCAS to match up their data with another database (the National Pupil Database), they are likely to underrepresent the rate for white students, who (with students of Chinese, Indian and mixed heritage) have among the highest rate of private school attendance and, as the largest group, are most likely to be affected by the conservative matching between the databases.
95
However, the representation of students from ethnic minorities does vary across
ethnic group and Chinese 18-year-olds have much higher entry rates than all other
ethnic groups under UCAS’s analysis. Representation also varies by place and
institution type, with a higher proportion of the black and minority ethnic (BME)
undergraduate body based at low tariff institutions, and institutions in London and
the West Midlands, than elsewhere in the UK197. It is also worth noting that both BIS
research198 and experimental statistics for the Higher Education Statistics Agency
(HESA)199 suggests there are higher proportions of black and minority ethnic
students at alternative higher education providers than at publically-funded
providers.
Place
Higher education participation rates vary by place, with 2015 UCAS 18-year-old entry
rates200 varying by over 10 percentage points between English regions (from 38.6% in
London to 27.6% in the South West) and by far more between parliamentary
constituencies (from 14.5% in Bristol South to 56.4% in Richmond Park).
Research by the Sutton Trust201 and analysis by HEFCE202 suggest that place can
compound the issues of disadvantage, with entry rates for those in the most
disadvantaged groups varying depending on where they lived. HEFCE found that the
young (18 and 19 year-old) entry rates for those in quintile 1 varied across the UK
regions, with differences between the quintile 1 regional entry rates and the total
regional entry rates. For all 18-year-olds and for 18 and 19 year-olds in quintile 1
specifically, London has higher entry rates than the rest of the country203. However,
although for all 18-year-olds, the South East and East of England have the third and
fourth strongest entry rates in the nine English regions, they have the lowest entry
rates for those in quintile 1.
This is partly a legacy of differences in attainment at school in different parts of the
country as highlighted by the Sutton Trust in their report204, which found that pupils
from the West Midlands were least likely to go on to study at Key Stage 5. The Social
Market Foundation has also released research205 showing that inequalities between
English regions in pupil performance in exams at age 16 have, in some cases,
worsened since the 1980s, with Yorkshire, the Midlands and the North East
performing worst and London and the South East performing best.
197 HEFCE analysis of HESA (2016) student record 198 BIS (2016) Understanding the market of alternative higher education providers and their students in 2014 199 HESA (2016) Experimental SFR 235 200 UCAS (2015) End of Cycle Report 2015 201 Sutton Trust (2015), Background to Success: Differences in A-level entries by ethnicity, neighbourhood and gender 202 HEFCE (2013) Trends in young participation in higher education 203 For further analysis of what is happening in London please also see London Councils (2016) The higher education journey of young London residents 204 Sutton Trust (2015) Background to Success: Differences in A-level entries by ethnicity, neighbourhood and gender 205 Social Market Foundation (2016) Educational inequalities in England and Wales

96
However, it is not solely an issue of attainment. HEFCE analysis206 has found that in
some areas participation is below what would be expected given the level of GCSE
attainment (a key indicator for going on to higher education). These include areas in
South and East London, West Yorkshire and the West Midlands, suggesting that in
some cases these gaps are also not a result of a lack of local higher education
institutions. It is also worth noting that there are considerable differences in the
proportions and numbers of young people in quintile 1 across the regions, with the
largest proportion (a third) in the North East.
Sex
Women are more likely than men to apply for and enter higher education via UCAS
and the gap between the sexes has grown in recent years, with women now 36% more
likely to apply for207 and 35% more likely to enter208 higher education via UCAS than
men. This is true across all ethnic groups209, although the entry rate for men is
growing faster than that for women in all groups except those with white and mixed
heritage, suggesting that some work is being undertaken to address these gaps. It is
also true across other developed nations, with only Switzerland, Japan and Germany
having a higher proportion of male than female graduates from bachelor’s
programmes in 2013210.
As with place, analysis suggests that sex can compound issues of disadvantage. The
entry rate for those in quintile 1 varies considerably between the sexes, with 22.4% of
18-year-old women in quintile 1 accepting a higher education place via UCAS in 2015,
compared to 14.7% of the equivalent men. This gap has grown since 2014, with 18-
year-old women in quintile 1 now 52% more likely to accept a full-time place at
university via UCAS, rather than 48% more likely in 2014. It must be remembered
though that the proportional gap is affected by the low base (the gap between women
and men in the highest quintile is proportionally much lower at 23% but in absolute
terms is greater) and that although the entry rate for women in quintile 1 grew by
more than that for men between 2014 and 2015, the reverse was true between 2013
and 2014.
Differences in attainment at school between the sexes are important in explaining
this. Women make up a larger proportion of those entering A-level exams, despite
there being fewer women than men in the 18-year-old population, and achieve higher
grades (55.2% of girls’ A-level entries were graded A*-B in 2015, compared to 51.5%
of boys’211). The IFS’s work for BIS212 suggests that prior attainment explains the
difference between participation by boys and girls, and that once it is taken into
account boys are slightly more likely than girls of a similar background to attend
206 HEFCE (2015) Gaps in young participation in higher education http://www.hefce.ac.uk/analysis/yp/gaps/ 207 UCAS (2016) UK application rates by the January deadline: 2016 cycle 208 UCAS (2016) End of Cycle report. 209 UCAS (2016) End of Cycle report. 210 OECD (2015) Education at a glance 211 Department for Education (2016) Revised A level and other level 3 results in England, 2014/2015 212 BIS (2015) Socio-economic, ethnic and gender differences in HE participation
97
university, including the most selective institutions. They also note that the gap
between boys’ and girls’ attainment at school is falling slightly over time213.
The problems for boys from lower socio-economic groups are also likely to be
magnified by differences in subject choice by boys and girls. Four of the five subject
areas with the highest proportions of students from POLAR3 quintile 1 in HESA’s UK
Performance Indicators (UKPIs) for 2014–15214 are large and have significantly more
women than men, particularly at undergraduate level (education, mass
communications, creative arts and law). It is also worth noting that this is not a new
issue, and may actually be improving: the proportion of UK undergraduates who
were female fell from 59% in 2004–05 to 57% in 2014–15215.
Disadvantaged pupils by ethnicity
Entry rates also vary by ethnicity within socio-economic groups. The IFS’s research216
suggests that white British pupils in the two lowest socio-economic groups (using
their own rich measure of socio-economic group, though similar results were
produced when POLAR2 was used as a proxy) have lower rates of participation in
higher education than any other ethnic group. Once background characteristics and
prior attainment were controlled for in the lowest socio-economic group this gap
remained, although it was slightly smaller, and it appears to be growing over time.
This suggests that lower prior attainment on the part of white British pupils from the
lowest socio-economic group was part of the reason for the gap. However, there are
clearly other factors at play and their importance is increasing. The research also
suggests that the gap in higher education participation between socio-economic
groups is largest for white pupils.
There has been some suggestion that there is a specific problem with white working-
class boys, or white boys more generally, accessing higher education. UCAS have
undertaken analysis of higher education participation by ethnicity, sex and socio-
economic group, looking at 18-year-old state school pupils in the POLAR3 quintile 3
by sex, ethnicity, and free school meal status; and at 18-year-old state school pupils
who received free school meals by POLAR3 quintile217. Their analysis suggests that
under both measures white boys from the most disadvantaged groups have the lowest
entry rates to higher education (below 10%). In both cases, however, they are closely
followed by disadvantaged white girls (8% and 13% on the different measures) and
mixed race boys (11% and 14% on the different measures), who make up the second
and third lowest entry rates. The absolute difference between disadvantaged white
boys and girls is also lower than the difference between the sexes for any other ethnic
and socio-economic group (the proportional difference is larger, but this is largely
because of the very low bases in both cases).
213 The difference in point between girls and boys is now 5.4 points, down from 6.5 in 2010, or the difference between a C and a C+. Boys make up a larger proportion of the vocational studies group at key stage 5, but the gap between boys’ and girls’ results is much larger here and growing (girls’ average points score is 11.3 points ahead of boys’, up from 8.8 points in 2010). See Department for Education (2016), Revised A level and other level 3 results in England, 2014/2015 214 HESA (2015) UKPIs: Widening participation of under-represented groups (table SP6) 215 UUK analysis of HESA (multiple years), Student Record 216 BIS (2015) Socio-economic, ethnic and gender differences in HE participation 217 The analysis uses the same database as their analysis of entry rates by ethnicity alone discussed earlier, so remains likely to be underreporting white participation.
98
The caveats on the data used by UCAS notwithstanding, it is clear that there is an
issue with the participation rate of white boys from the lowest socio-economic
groups. But there is also an issue of a similar magnitude with disadvantaged white
girls and mixed race boys. In all three cases, part of this issue will be driven by low
prior attainment: all three groups have low average performance at GCSE, with GCSE
performance a strong predictor of entry to higher education.
However, it is not solely prior attainment which impacts here: black boys from a non-
African background in the free school meals group also have very low GCSE
attainment, and higher (though not high) entry rates. IFS researchers found that
when participation was looked at by ethnicity alone, there was a positive association
between higher participation and having English as an additional language. This
could suggest that more recent migrants have higher aspirations for their children.
There was also a positive association with living in London (outside of the additional
attainment of London pupils due to the ‘London schools’ effect’), which could be
linked to the number of universities in London and the tendency of students from
ethnic minorities to go to local universities.
Selective institutions
The entry rate for those from all disadvantaged groups is lowest at the most selective
institutions (those in the top third of institutions by average entrant tariff points).
Although there have been large headline increases in the entry rate to the most
selective institutions for those from POLAR3 quintile 1, they only rose above 3% in
2014 (reaching 3.3% in 2015) and remain 84% (17 percentage points) lower than the
entry rates for quintile 5 to the same institutions. OFFA has also examined218 this
issue, using a different measure of disadvantage (the proportion of young people who
have a parent with a higher education qualification at census ward level, with wards
grouped into quintiles) and found that participation by the most disadvantaged has
remained broadly similar since the 1990s.
The IFS research mentioned previously also suggests that pupils from all ethnic
minority groups are more likely than white British pupils to attend a selective
institution (though white British students make up a much larger proportion of
students at these institutions because of the larger numbers in the population at
large), and that this gap has grown to become significant over time. The gap between
white pupils and those from ethnic minorities at selective institutions is smaller,
however, than for overall participation in higher education, suggesting that pupils
from ethnic minorities are more likely to attend less selective institutions.
Both OFFA and the IFS acknowledge the role of prior attainment in the low
participation of disadvantaged pupils at selective institutions, with the IFS finding
that this has an even greater role than participation generally (particularly when key
stage 4 attainment is considered). OFFA argues that other factors, like encouraging
highly qualified applicants from disadvantaged backgrounds to apply to more
selective institutions, may also be important. In terms of ethnicity, however, the IFS
found that the gap between participation for white pupils and those from all other
218 OFFA (2014) Trends in young participation by student background and selectivity of institution
99
ethnic groups remain once prior attainment and background characteristics are
controlled for, suggesting that other factors are at play here.
Another consideration is offer-making by institutions. UCAS examined219 the higher
tariff institution offer rate for different applicant characteristics by grade profile and
course applied to against the average offer rate for those grade profiles and courses at
the October and January deadlines. In most cases the offer rate was in line with the
range of variation which would be expected, or a very small amount below this.
However, there was a slightly larger gap for applicants receiving free school meals
who had been predicted top grades.
The recent release by UCAS of data220 covering applications, offers and placed
applicants by sex, area background and ethnic group suggest across all tariff groups
and at an aggregate national level for England, the offer rates for applicants from
quintile 1 and for Asian and black applicants are slightly below what would otherwise
be expected, given the level of their predicted grade and the general subject area of
the course they are applying for. At the same time those for quintile 5 and white
applicants are slightly above what would otherwise be expected.
The differences are small and there may be legitimate reasons for them (UCAS
suggests that there may be factors which explain this such as the subjects studied and
the grades held by applicants. For example, UCAS’s calculations could only account
for the total level of predicted grades and the mix of predicted grades, or A-level or
other subjects, personal statements and references. UCAS states that it is not possible
to take these further factors into account without making assumptions about how
universities should offer from pooled averages from across the sector, something
which is not a good match to the differing academic offer making policies used by
institutions). It should also be noted that UCAS believe that the differences in offer-
making are too small to make a material impact to the differences seen in entry rates.
However, it is important that institutions look at an institutional level at their offer-
making to ensure that it follows best practice and is unbiased.
Mature students
It is less easy to produce accurate entry rates for mature students as the proportions
of those taking up undergraduate study each year will not reflect the proportion of
the population already holding higher education qualifications. From the HESA
student record221 we know that the number of full- and part-time undergraduates
aged over 25 fell by 37% between 2009–10 and 2014–15 so this is likely to be a
change in mature applicant behaviour rather than an increase in the number. Data
from the 2016 UCAS cycle222 suggests that although the number of mature applicants
for full-time undergraduate education through UCAS is falling, the proportion who
219 UCAS (2015) End of Cycle report 220 UCAS (2016) UCAS Undergraduate reports by sex, area background, and ethnic group https://www.ucas.com/corporate/data-and-analysis/ucas-undergraduate-releases/ucas-undergraduate-reports-sex-area 221 UUK analysis of HESA (multiple years), Student Record 222 UCAS (2016), 2016 cycle applicant figures – 30 June deadline and UCAS (2016) Daily Clearing analysis 2016 https://www.ucas.com/corporate/data-and-analysis/ucas-undergraduate-releases/daily-clearing-analysis-2016
100
are accepted is rising. It is too early to say whether this will impact on the numbers of
mature undergraduates starting courses.
Participation by mature students is important because mature undergraduates are
more likely to be from ethnic minority groups, particularly of black heritage, have
non-traditional or no entry qualifications, and to have a known disability. The
number of mature students are likely to have been affected by the falling number of
students on ‘other undergraduate’ courses (e.g. foundation degrees and certificates
and diplomas), as over-25s make up a higher proportion of these students.
Part-time students
The HESA student record223 also shows a fall in the number of part-time
undergraduate entrants between 2009–10 and 2014–15 of 50%. This is important
because part-time undergraduates are more likely to have no or low entrance
qualifications, meaning that part-time provision opens up access to those who have
been left out of higher education by prior attainment at school. Part-time students
are also more likely to be mature (although mature students are only more likely to
be part-time over the age of 30).
Analysis by the Independent Student Funding Panel established by Universities UK
in 2014 has shown that a number of factors have converged to create a particularly
challenging environment for part-time study in England224. The number of students
entering part-time study in recent years has been affected by the removal in 2008–09
of funding for students taking qualifications equivalent to or lower than ones which
they already had, and by reforms to undergraduate funding in 2012–13, including an
increase in fees following cuts to teaching grants and issues around eligibility for
tuition fee loans. At the same time the economic downturn has also caused a
reduction in the number of students able to self-fund part-time study, and a
reduction in the number of employers willing to support employees through part-
time study.
POTENTIAL METHODS OF RESPONDING TO THESE CHALLENGES
Existing research and analysis suggests that underrepresented students are more
likely to have lower prior attainment and different entry qualifications and entry
routes to higher education, including entering as part-time or mature students. It is
possible that the effects of this may be exacerbated over the next few years as
curriculum and qualification changes take effect across the country. Different schools
will respond to these changes in different ways (e.g. dropping AS levels, no longer
providing certain subjects) which may be affected by school and local authority
resources, further compounding issues of disadvantage and place. The changes are
also likely to make predicted grades less reliable.
All of this would suggest two possible areas for exploration:
223 UUK analysis of HESA (multiple years), Student Record 224 Student Funding Panel (2015) An analysis of the design, impact and options for reform of the student fees and loans system in England
101
improving awareness of all the possible routes into higher education, so all
potential students are aware of what is required and whether they are
currently on track
improving the ability of potential students to take advantage of these routes,
possibly by improving their attainment.
Both of these aims come under the provision of accessible information, advice and
guidance to potential students, and this is highlighted as key by OFFA and HEFCE’s
joint access and student strategy225. The increasing priority over this parliament for
new apprenticeships also highlights the importance of ensuring the availability of
high quality guidance and information on higher level apprenticeships.
There is some discussion about whether the provision of information, advice and
guidance should include the raising of underrepresented groups’ educational
aspirations. Work by the Joseph Rowntree Foundation226 suggests that at least in the
case of socio-economic disadvantage, pupil and parent aspiration is high, and may be
underestimated by teachers and other professionals. In their view it would be more
effective to focus more directly on improving attainment for these pupils and on
keeping aspirations on track.
One way of working towards improving both the awareness of potential learners of
the different routes into higher education and their ability to take up those
opportunities is through the links and partnerships universities have with schools,
colleges and other sectors with potential learners (e.g. employers). HEFCE have
established two programmes to try to encourage collaboration and partnerships
between schools, colleges, universities and the third sector in this area: the National
Networks for Collaborative Outreach227 (NNCOs), and the National Collaborative
Outreach Programme228 (NCOP). The NNCOs have received funding from January
2015 to December 2016 and bring together 200 universities and further education
colleges, with 4,300 secondary schools and colleges, in 35 local and three national
networks (one each for those looking to go to Oxford or Cambridge, for older students
looking to continue to or return to study, and for care leavers). The NCOP, which will
run from academic year 2016–17 to 2019–20, will support consortia of higher
education institutions, schools, colleges and third sector organisation to deliver
collaborative outreach in specific local areas with low higher education participation
or participation which is lower than expected given GCSE attainment levels.
The government has also recently announced229 its intention to require universities to
either open or sponsor schools in exchange for the right to raise their tuition fees, as
part of raising pre-higher education attainment.
Outside of attainment-raising, another possible way of increasing the ability of
underrepresented groups to enter higher education is the provision of supplementary
225 BIS (2014) National strategy for access and student success in higher education 226 Joseph Rowntree Foundation (2012), Can changing aspirations and attitudes impact on educational attainment? A review of interventions 227 For more information see http://www.hefce.ac.uk/sas/nnco/faq/ 228 For more information see http://www.hefce.ac.uk/sas/ncop/ 229 Department for Education (2016) Schools that work for everyone: Government consultation
102
admissions routes. International research for OFFA and HEFCE230 has suggested that
this has been particularly effective at improving access for underrepresented
students. Supplementary routes could include pre-entry access and foundation
courses delivered collaboratively by schools, colleges and higher education providers,
as well as alternative entry routes for adults to develop the skills of the workforce.
Some work has previously been done on this with Progression Agreements as part of
HEFCE’s previous Lifelong Learning Networks.
Higher Education Academy (HEA) analysis231 suggests that these were primarily
effective at building links between higher education institutions and colleges and
employers.
Consideration could also be given to focusing efforts on those areas identified by
HEFCE as currently having higher education participation rates below what would be
expected given their GCSE attainment.
It is important to note that evaluation of current outreach and widening participation
activity and interventions by institutions, although improving, remains limited.
Providing a robust evidence base is critical and both OFFA and HEFCE have done
work to support the development of effective monitoring and evaluation. HEFCE has
developed a conceptual framework for evaluating widening participation. They have
also provided funding for the rolling out of the Higher Education Access Tracker
(HEAT)232 across England, allowing individuals to be tracked following entry onto an
institution’s access, retention, success or progression programmes. OFFA has also
developed a project with the Sutton Trust to look at effective ways to evaluate
outreach which began in spring 2016.
2. RETENTION
State of play and current challenges
Whilst at university there are differences in the completion and success rates of
students on the basis of socio-economic status, ethnicity, gender, disability, and type
of study. These remain when adjusted to take account of entry qualifications, age and
subject of study. The biggest gaps are for students of black and other Asian (that is,
not Chinese or Indian) heritage and those from the lowest socio-economic groups as
measured by POLAR3.
Disadvantaged students
In 2013–14 the proportion of UK-wide young full-time first degree students from
POLAR3 quintile 1 who are no longer in higher education one year after entry (8.2%)
is two and a half percentage points higher than the proportion of students from the
230 Edge Hill University and CFE research (2013), International Research on the Effectiveness of Widening Participation 231 Higher Education Academy (2012) Promoting social mobility by creating pathways to the professions and vocational careers: the role of progression agreements 232 The Higher Education Access Tracker (HEAT) is a monitoring and evaluation service tracking engagement in outreach activities and building evidence of future student achievement. For more information, see https://www.highereducationaccesstracker.org.uk/login.aspx
103
other four POLAR3 quintiles no longer in higher education (5.7%)233. England-only
figures from 2003–04 to 2013-14 from HEFCE234 show the same pattern, with both
young and mature entrants from POLAR3 quintile 1 more likely to drop out of full-
time first degree study than those from more advantaged backgrounds. This
difference remained even when controlled for age, subject of study and entrance
qualifications, leaving those in POLAR3 quintile 1 alone in having an above sector-
adjusted average drop-out rate for young students, and a rising, above sector-
adjusted average non-continuation rate for mature students.
Although the UK-wide non-continuation rates235 for both disadvantaged and more
advantaged students rose in the latest year for which we have data (2013–14)
following longer-term reductions, the rate for more advantaged students rose by less
(6% proportionally compared to 13% for POLAR3 quintile 1); the England-only rates
for disadvantaged students have been stable for the past two years.
HEFCE research236 shows that the likelihood of leaving higher education in the year
following entry falls for each POLAR3 quintile, and that although there has been a
clear downward trajectory in non-continuation rates for all POLAR3 quintiles, the
gap between them has remained similar. It is also worth noting that the Social
Mobility and Child Poverty Commission identified in 2015237 that many of the
institutions with the biggest gaps in non-continuation rates between the most and
least advantaged, were also the most selective institutions.
HEFCE have also undertaken research238 into the proportion of entrants from each of
the POLAR3 quintiles going on to obtain degree qualifications. This mirrors the non-
continuation rates, with only 77% of those from quintile 1 going on to obtain a degree
qualification, compared to 85% of those in quintile 5. There is a clear upward
trajectory in the proportions obtaining degree qualification by POLAR quintile, with
the biggest percentage change between the proportions in quintile 1 and quintile 2.
This trajectory remains once the results are controlled for entry qualification, subject
of study, sex and ethnicity, although the gap between quintiles 1, 2 and 3 reduces.
Entrants from both quintiles 1 and 2 are significantly less likely than would otherwise
be expected, given their other characteristics, to obtain a degree.
Ethnic minority students
HEFCE’s England-only non-continuation rates show that of UK-domiciled entrants,
white entrants and those of Indian and Chinese heritage had the lowest non-
continuation rates, with entrants with black Caribbean, black other and black African
heritage having the highest rates. Once controlled for entry qualification, subject of
study and age, this changes slightly, with entrants of Bangladeshi, Chinese, Indian
and other Asian heritage less likely than would be expected to drop out given these
other characteristics, and white entrants having non-continuation rates in line with
233 HESA (2016) UKPIs: Non-continuation following year of entry (table T3b) 234 HEFCE (2016) Non-continuation rates: Trends and profiles http://www.hefce.ac.uk/analysis/ncr/ 235 HESA (2016) UKPIs: Non-continuation rates (table T3b) 236 Cited in BIS (2014) National strategy for access and student success in higher education 237 Social Mobility and Child Poverty Commission (2015), State of the Nation 2015: Social Mobility and Child Poverty in Great Britain 238 HEFCE (2013) Higher education and beyond: Outcomes from full-time first degree study
104
what would be expected. However, the non-continuation rates for entrants in all
three black groups are all above what would be expected and rising, as are those for
entrants in the mixed/other and Pakistani groups239.
HEFCE research240 has also shown differences between the proportion of entrants
from each ethnic group going on to obtain a degree qualification, with the highest
proportions coming from white entrants and those with Chinese and Indian heritage,
and the lowest proportion coming from entrants with black and other Asian heritage.
Once controlled for entry qualification, subject of study and sex, entrants with
Chinese and Indian heritage are more likely than would be expected to achieve degree
qualification, given their age, subject of study and entry qualifications. However,
those with black heritage are significantly less likely than would be expected to obtain
a degree, given these other characteristics. White entrants and those with other Asian
heritage have completion rates in line with what would be expected, given their other
characteristics.
Male students
In England a higher proportion of male than female full-time first degree entrants
leave higher education in their first year of study241. This difference remains when
controlled for entry qualification, subject of study and age, with male entrants more
likely than female entrants to drop out of higher education regardless of background.
However, the rates have got closer in recent years.
Male entrants to higher education are also significantly less likely than would
otherwise be expected to complete their degree, whilst female entrants are
significantly more likely to, suggesting that the fact of being male makes male
entrants less likely to obtain a degree, regardless of their background242.
Disabled students
HEFCE’s analysis of England-only non-continuation rates243 show a higher
proportion of entrants to full-time first degree study with disabilities leaving higher
education in their first year than those without a specified disability. This difference
remains once controlled for entry qualification, subject of study and sex, suggesting
that disabled students are more likely to drop out of higher education (this might also
be affected by the size of the group, with far fewer disabled students than non-
disabled students).
Earlier and more detailed analysis by HEFCE244 of the proportion of entrants who
complete their degrees gives a slightly different picture. A slightly higher proportion
of entrants receiving the DSA obtain degree qualifications than those entrants
without any disability at all, but the proportion of entrants with a disability who do
239 HEFCE (2016) Non-continuation rates: Trends and profiles http://www.hefce.ac.uk/analysis/ncr/nhe/ 240 HEFCE (2013) Higher education and beyond: Outcomes from full-time first degree study 241 HEFCE, Non-continuation rates: Trends and profiles http://www.hefce.ac.uk/analysis/ncr/nc/ 242 HEFCE (2013) Higher education and beyond: Outcomes from full-time first degree study 243 HEFCE (2016) Non-continuation rates: Trends and profiles http://www.hefce.ac.uk/analysis/ncr/nhe/ 244 HEFCE (2013) Higher education and beyond: Outcomes from full-time first degree study
105
not receive the DSA who go on to obtain a degree is lower than for both. When
adjusted for entry qualification, subject of study, sex and ethnicity, disabled students
in receipt of the DSA are more likely than would be expected to obtain a degree,
whilst those without the DSA are significantly less likely.
Mature students
The non-continuation rate for mature full-time first degree students245 is
considerably higher than that for young full-time first degree students (12.5% for first
time mature students compared to 6.0% for young students in 2013–14). HEFCE’s
England-only analysis246 shows that the highest non-continuation rates are for those
in the 21-24-year-old age group, followed by those aged 25 and over. Although once
these rates are controlled for entry qualification, subject of study and sex, only
students aged 19-20 and 21-24 are more likely than would otherwise be expected to
drop-out, the non-continuation rate for students aged 25 and over is increasing.
Mature students are most likely to leave higher education because of difficulty
balancing their studies with other commitments and because of financial difficulties.
Part-time students
The highest non-continuation rate is for part-time students, with 36.4% of part-time
first degree students leaving higher education two years after entry in 2012–13,
compared to the 7.2% of all full-time entrants who left after their first year. This rate
has barely changed since 2006–07, when it was 35.3%247.
There is a link between the retention of part-time students and the level of intensity
of their study: those studying at 30% of full-time or higher are more likely to remain
in higher education.
Other undergraduate students
The HESA student record248 shows that in 2014–15 students from POLAR3 quintile 1
made up a higher proportion of students taking other undergraduate courses
(foundation degrees, certificates and diplomas, etc.) rather than first degree study.
The non-continuation rates for these courses are higher than for first-degree study
and rose for both young and mature entrants in 2013–14 to reach 15.6% for young
entrants (compared to 6.0% for first degree entrants) and 12.9% for mature entrants
(compared to 11.8% for first degree entrants)249.
245 HESA (2016) UKPIs: Non-continuation following year of entry (table T3c) 246 HEFCE (2016) Non-continuation rates: Trends and profiles http://www.hefce.ac.uk/analysis/ncr/nhe/ 247 HESA (2016) UKPIs: Non-continuation following year of entry (tables T3a and T3e) 248 HESA (2016) HESA Student Record 249 HESA (2016) UKPIs: Non-continuation following year of entry (tables T3a and T3d)
106
POTENTIAL METHODS OF RESPONDING TO THESE CHALLENGES
Research undertaken by the Higher Education Academy250 (HEA) suggests that
almost a third of all students think about leaving higher education, primarily for
academic reasons (either not feeling that they are at the level required by their course
or that they made the wrong course choice). The reasons students gave for staying on
their course, however, were primarily social – about the support of friends (whether
based at their institution or networks from home) and family. This suggests three
areas to explore: how to ensure that applicants are given adequate information,
advice and guidance about their course; how to ensure that entrants are prepared
academically for their course before they start, perhaps through some form of
outreach activity; and how to develop student social and informal support networks,
to give them a sense of belonging.
One potential method of delivering improved information, advice and guidance to
applicants and ensuring that they are better prepared for the academic requirements
of their course is better outreach. It is important that the links built through the
collaborative outreach described above in part 1 are sustainable, and that the
collaborative element of any networks is not lost to competition as institutions
increasingly work on a recruitment rather than selection footing.
It has historically been more difficult to help students studying at institutions local to
their home, students who live at home, and part-time students to build networks and
a sense of belonging to an institution, as they spend less time at their institution and
are more likely to already have existing local networks outside of the institution. As
students from POLAR3 quintile 1, students from black and minority ethnic groups
and mature students are all likely to be in these groups, this will require particular
focus. Qualitative analysis by the HEA251 also identified social segregation along
ethnic lines amongst students, which could be another area of focus.
Peer mentoring and tutoring is a possible method of building social and informal
support networks for students who are more at risk of dropping out, both before
entry to and through their transition into higher education, and then during their
degree. Research by the HEA252 has suggested that interaction with higher education
students increases the confidence of potential leaners as well as improving
motivation and attainment, all of which may help to mitigate feelings of academic
inadequacy once at university. There has been insufficient research on the impact of
peer mentors once students have started higher education to be able to assess their
impact on retention, although anecdotal evidence suggests that the relationship is
beneficial for both mentor and mentee. There has also been little research on how to
match students to potential peer mentees.
250 Higher Education Academy (2012) The contribution of pre-entry interventions to student retention and success: A literature synthesis of the Widening Access, Student Retention and Success National Programme Archives 251 Higher Education Academy (2012) Black and minority ethnic student degree retention and attainment 252 Higher Education Academy (2012) The role of higher education students in widening access, retention and success: A literature synthesis of the Widening Access, Students Retention and Success National Programmes Archive
107
It is likely that measures to improve access would impact on student retention, so
interaction between these two should also be considered.
3. ATTAINMENT
STATE OF PLAY AND CURRENT CHALLENGES
There are also gaps in students’ outcomes from university study, with differences in
the degree classifications received by students on the basis of socio-economic status,
ethnicity, gender and disability. Again, these gaps remain when adjusted to take
account of other characteristics and are biggest for students of black and other Asian
heritage.
Disadvantaged students
HEFCE found253 that only 45% of entrants to higher education in POLAR3 quintile 1
go on to obtain a first or upper second class degree, compared to 58.6% in quintile 5.
There is a clear upward trajectory between the quintiles, with the lowest difference
between quintiles 2 and 3.
Once controlled for entry qualification, subject of study, sex and ethnicity the
trajectory remains, with quintile 1 and 2 students significantly less likely than would
be expected, given their other background characteristics, to obtain a first or upper
second class degree, and quintile 4 and 5 students significantly above what would be
expected of them. The largest gap is between quintile 1 students and their sector-
adjusted average254. HEFCE found an unexplained gap of three percentage points in
the proportions of 2013–14 graduates from quintile 1 obtaining a first or upper
second class degree, compared to quintile 5 graduates255.
Ethnic minority students
The largest gaps for BME students are in their degree attainment. In English higher
education institutions in 2014–15 58% of black and minority ethnic qualifying
students obtained first or upper second class degrees compared to 75% of white
students doing the same256. When HEFCE examined degree outcomes for 2006–07
entrants257, they found that all BME groups (using the categories black, Chinese,
Indian, other Asian and other/unknown) were less likely than would be expected
given their other characteristics to obtain first or upper-second class degrees, with
the gap over ten percentage points for black students and around eight percentage
points for other Asian students. Later analysis by HEFCE258 of degree outcomes by
entry qualifications found an unexplained gap of 15 percentage points between white
and BME graduates in 2013–14, similar to the observed difference of 16 percentage
253 HEFCE (2013) Higher education and beyond: Outcomes from full-time first degree study 254 HEFCE (2013) Higher education and beyond: Outcomes from full-time first degree study 255 HEFCE (2015) Differences in degree outcomes: The effect of subject and student characteristics 256 UUK analysis of the HESA Student Record (2016). 257 HEFCE (2013) Higher education and beyond: Outcomes from full-time first degree study. Although HEFCE did not control for differential participation rates across ethnic groups, separate analysis by Universities UK suggests that the gap remains even when these are controlled for. 258 HEFCE (2015) Differences in degree outcomes: The effect of subject and student characteristics
108
points. The gaps ranged from five percentage points for graduates with four As at A-
level, to 18 percentage points for graduates with non-A-level entry qualifications.
In recent years, degree attainment has improved across all ethnic groups, but the gap
between white and ethnic minority student attainment remains wide, particularly for
students of black heritage. HEA research259 suggests that BME student outcomes are
lower across the higher education sector, including at Russell Group institutions, but
that black and minority ethnic students do achieve higher grades at Russell Group
institutions.
Male students
There are also persistent gaps in the proportions of male and female students
obtaining first or upper second class degrees. In England in 2014–15, 70% of female
qualifying students obtained a first or upper second, compared to 66% of male
qualifying students. The gap is at upper second level, with the proportion of male
students obtaining first class degrees actually slightly higher than the proportion of
women doing so (22% compared to 21%).
HEFCE260 found that the gap remained once controlled for entry qualification,
subject of study and ethnicity with male entrants significantly less likely than would
be expected to obtain a first or upper second class degree, whilst women are
significantly more likely.
Disabled students
Across the UK the proportion of disabled students obtaining a first or upper second
class degree has risen, but they remain slightly less likely than non-disabled students
to do so whether or not they receive the DSA, with those disabled students who do
not receive the DSA least likely to obtain first or upper second class degrees. HEFCE
found an unexplained gap of three percentage points in the proportions of 2013–14
graduates with disabilities obtaining a first or 2.1261. Their earlier analysis by DSA
status found that disabled graduates not in receipt of the DSA were three percentage
points less likely than would be expected to get a top degree classification, whilst the
likelihood that those in receipt of the DSA would achieve a top classification was in
line with what was expected262.
Mature students
ECU analysis of the HESA student record showed that although mature students
across the UK are more likely than young entrants to obtain a first class degree (with
that likelihood going up by age), they are significantly less likely to obtain an upper
second class degree and are more likely to obtain 2.2 or third class or pass degree263.
The gap is widest in England, with 76% of young qualifying students obtaining a first
or upper second class degree, compared to 67% of mature qualifiers.
259 HEA (2012) Black and minority ethnic student degree retention and attainment 260 HEFCE (2015) Differences in degree outcomes: The effect of subject and student characteristics 261 HEFCE (2015) Differences in degree outcomes: The effect of subject and student characteristics 262 HEFCE (2013) Higher education and beyond: Outcomes from full-time first degree study 263 Equality Challenge Unit (2015) Equality in higher education: statistical report 2015, Part 2: students
109
However, analysis by HEFCE264 suggests that other characteristics are an important
factor in this gap, with the nine percentage point observed gap in graduates obtaining
a first or upper second class degree almost reversed when this is controlled for entry
qualifications.
Part-time students
Analysis by HEFCE265 of 2013–14 graduates found that 75% of full-time graduates
and 57% of part-time graduates achieving a first or upper second class degree. When
they controlled these results for entry qualifications and student characteristics the
gaps remained high, with between four and 15 percentage points difference
remaining depending on what those entry qualifications were.
POTENTIAL METHODS OF RESPONDING TO THESE CHALLENGES
Whilst some of the differences in degree attainment are linked to prior attainment
they cannot all be explained in this way, as the gaps continue once degree
qualifications have been controlled on the basis of student background characteristics
and entry qualifications. HEA analysis266 found multiple factors were at play in the
attainment gap but that learning and teaching practices within higher education,
both in terms of existing practices and how these were experienced by students, were
significant and should be considered on a strategic institutional basis.
Possible areas for exploration in terms of existing learning and teaching practices are:
curriculum development: ensuring that the curriculum is diverse and
inclusive
curriculum delivery: ensuring that teaching practices are varied and engage
all students
assessment and marking: ensuring that assessment and marking practices are
inclusive and do not disadvantage any particular student group
Possible areas for exploration in terms of how students currently experience learning
and teaching are:
student experience: how students with different background characteristics
experience the curriculum and teaching delivery
student relationships: how students with different background characteristics
relate to staff and each other, and how staff relate to students of different
backgrounds
student understanding: ensuring that students understand what is expected
and required of them academically, including on assessments, with particular
focus on assessment guidelines and marking
A further area to explore is whether particular student groups should receive targeted
support or whether this support should be ‘mainstreamed’, and, if the support is to be
‘mainstreamed’, how to ensure that students who require the most support receive it.
264 HEFCE (2015) Differences in degree outcomes: The effect of subject and student characteristics 265 HEFCE (2015) Differences in degree outcomes: The effect of subject and student characteristics 266 Higher Education Academy (2012) Black and minority ethnic student degree retention and attainment

110
Another clear area for exploration is the link between the DSA and student
achievement. Is it the DSA which enables disabled students receiving it to succeed in
line with expectations, or is there something specific to the group receiving the DSA
which makes them more likely to succeed? How can this effect be maintained once
significant changes are made to the DSA?
It is likely that measures to improve retention would also impact on student success,
so overlap between these two should also be considered.
4. PROGRESSION
STATE OF PLAY AND CURRENT CHALLENGES
There are also gaps in students’ outcomes from university study, with differences in
the rates of students going on to employment and further study on the basis of socio-
economic status, ethnicity, gender and disability, and particular differences in
graduate employment. Again, these gaps remain when adjusted to take account of
other characteristics and are biggest for students of black and Asian heritage.
Disadvantaged graduates
HEFCE examined267 employment rates for 2010–11 graduates and found that the gap
in employment rates between those from advantaged and disadvantaged
backgrounds were in line with what would be expected, given the graduates’ other
characteristics. However, they found a significant difference between the proportions
of disadvantaged graduates going on to professional employment268. Those in
quintile 1 were 4.3 percentage points less likely to go onto professional employment
than quintile 5 graduates once results were controlled for student characteristic. This
gap widened over time as well, so 40 months after graduation graduates from quintile
1 were 5.3 percentage points less likely to be in professional employment.
In addition to the gaps in the numbers of disadvantaged students going on to
professional employment, research by the London School of Economics for the Social
Mobility and Child Poverty Commission found that even those who did were paid less
than their advantaged peers269. This finding has been further highlighted by the IFS’s
2016 report on graduate earnings270. By linking HM Revenue and Customs (HMRC)
and Student Loans Company data, IFS researchers were able to show that graduates
from wealthy family backgrounds earn significantly more after graduation than those
from poorer backgrounds, even after completing the same degrees from the same
universities, and that these gaps were bigger for higher-paid graduates.
267 HEFCE (2016) Differences in employment outcomes: Comparison of 2008–09 and 2010–11 first degree graduates 268 There is no one definition of professional employment. The Standard Occupational Classification (SOC 2010) system features ten major categories of occupations. HESA terms all occupations that sit within major categories one (managers, directors and senior officials), two (professional occupations) and three (associate professional and technical occupations) ‘professional employment’. The former Department for Business, Innovation and Skills, in its Graduate Labour Market Statistics series of publications, labelled these ‘high skilled employment’. 269 London School of Economics (2015) Introducing the Class Ceiling: Social Mobility and Britain’s Elite Occupations 270 IFS (2016) How English domiciled graduate earnings vary with gender, institution attended, subject and socio-economic background
111
Separate analysis by HEFCE271 has also shown that although slightly higher
proportions of disadvantaged students intend to continue to postgraduate education
than their advantaged peers, almost 15% fewer of those that want to go do so. Those
that do are more likely to go on to ‘other postgraduate’ study (courses with
certificates and diplomas or for credit) rather than masters or PhD study272. This is
important as postgraduate qualifications are becomingly increasingly important in
the workplace and those with postgraduate degrees gain a significant wage
premium273.
Ethnic minority graduates
Students from BME groups have significantly worse employment outcomes than
white students. HEFCE analysis274 found that graduates from almost all BME
groups275 were less likely than white graduates to go on to employment or further
study six months after graduating. Once controlled for student characteristics, the
biggest gaps were for graduates from Chinese and black African backgrounds, both of
whom were more than seven percentage points less likely to be employed than would
be expected if they were white. Graduates from Pakistani backgrounds were also
more than six percentage points less likely to be in employment.
The gaps tended to be smaller for professional employment, but graduates from both
Bangladeshi and black African backgrounds were more than six percentage points
less likely to be in professional employment than would be expected if they were
white. Forty months after graduation many of the gaps in professional employment
rates increased, with graduates with Pakistani, black Caribbean and black African
heritage all having professional employment rates more than eight percentage points
below what would be expected, and graduates with Bangladeshi heritage having a gap
of nearly seven percentage points.
HEFCE analysis276 has also shown that, as with disadvantaged students, although a
higher proportion of black and minority ethnic students than white students intend
to move on to postgraduate study, a lower proportion of them go on to do so (a gap of
around 10 percentage points). HEFCE also found277 that BME students were more
likely than white students to go on to postgraduate taught study, but less likely to go
on to postgraduate research study. This may in part be due to the higher numbers of
BME students from London, as Londoners appear to be more likely to go on to taught
masters study. The analysis also showed gaps by ethnic groups within the BME
271 HEFCE (2015) Higher education in England 2015 272 HEFCE (2013) Trends in transition from first degree to postgraduate study: Qualifiers between 2002–03 and 2010–11 273 Sutton Trust (2013) The Postgraduate Premium: Revisiting Trends in Social Mobility and Educational Inequalities in Britain and America; BIS (2013), The Impact of University Degrees on the Lifecycle of Earnings: some further analysis 274 HEFCE (2016) Differences in employment outcomes: Comparison of 2008–09 and 2010–11 first degree graduates 275 The exception was those from ‘other black’ backgrounds (that is, not African or Caribbean backgrounds). 276 HEFCE (2015) Higher education in England 2015 277 HEFCE (2013) Trends in transition from first degree to postgraduate study: Qualifiers between 2002–03 and 2010–11
112
grouping. Students with Chinese, other Asian278 and black African heritage have high
rates of transition to postgraduate study, whilst those with black Caribbean heritage
have low transition rates, consistently below those of white students.
Male students
The employment outcomes of male graduates are an interesting case. HEFCE279
found that although male graduates of 2010–11 had a lower overall employment rate
six months after graduation than female graduates (87.0% compared to 91.2%), they
had a higher professional employment rate (64.3% compared to 59.6%). In both
cases, once controlled for student characteristics, the gaps were nearly four
percentage points. The gaps also remained 40 months after graduation, but had
reduced for the overall employment rate (the employment rate for men was 0.8
percentage points lower than expected). Analysis280 of the HESA Destinations of
Leavers of Higher Education salary data adds a further interesting perspective on
this, showing that although female graduates are more likely to be in work, they earn
considerably less than male graduates, regardless of subject choice.
HEFCE also found281 that men were more likely than women to progress to
postgraduate taught or research study, while women were more likely to progress to
other postgraduate study. This appears to hold true regardless of degree
classification, subject area and POLAR quintile.
Disabled students
The gaps found earlier in the lifecycle for disabled students appear to carry through
to employment outcomes. HEFCE found282 that disabled students were between 1.9
(for those not receiving the DSA) and 3.2 percentage points (for those receiving the
DSA) less likely to be in employment or further study six months after graduation
than non-disabled students with the same characteristics. Interestingly they found no
immediate gap in professional employment rates, but found that 40 months after
graduation, gaps had opened up. Those who received the DSA were 3.1 percentage
points less likely to be in professional employment than their non-disabled peers,
while disabled graduates who had not received the DSA were 3.5 percentage points
less likely to be in professional employment. This is in a broader context of poor
disability employment rates, with Scope noting283 that the gap between the disabled
and non-disabled employment rates has been broadly static at around 30% for over a
decade.
278 In this context, not Bangladeshi, Indian or Pakistani. 279 HEFCE (2016) Differences in employment outcomes: Comparison of 2008–09 and 2010–11 first degree graduates 280 The Visible Hand in Economics (25 July 2015) ‘The male wage premium’ http://www.tvhe.co.nz/2015/07/25/the-male-wage-premium/ 281 HEFCE (2013) Trends in transition from first degree to postgraduate study: Qualifiers between 2002–03 and 2010–11 282 HEFCE (2016) Briefing: Differences in employment outcomes http://www.hefce.ac.uk/analysis/employment/201011/ 283 Scope (2014) A million futures: halving the disability employment gap
113
HEFCE analysis284 has found no gap in the proportions of disabled students going on
to postgraduate research study, and a slightly higher proportion going on to
postgraduate taught study than their non-disabled peers.
POTENTIAL METHODS OF RESPONDING TO THESE CHALLENGES
On the issue of employability, existing research and analysis points to three clear
areas for exploration: raising aspirations and social capital for underrepresented
students; the provision of core employability skills as part of the curriculum,
including through work experience and placements; and graduate employer
recruitment practices. There is also a link back to the provision of information, advice
and guidance to applicants, as graduate outcomes differ significantly by subject.
Many institutions are already doing work on raising aspiration and social capital for
underrepresented students, including using alumni and employer mentors for
students in underrepresented groups and encouraging all students to take on extra-
curricular activities in order to develop broader workplace skills. This fits with work
going on in terms of access and retention, and is mentioned as a priority in the
Independent Reviewer on Social Mobility and Child Poverty’s 2012 progress
report285.
There is some debate on the impact of provision of employability skills as part of the
curriculum286. Some have argued that the shift to making curriculums ‘relevant’
rather than based on theory has exacerbated the inequalities between the student
experience at different institutions and different courses. Those writing on
employability, however, consistently emphasise the importance of embedding
employability in the curriculum.
There is some evidence287 to suggest that graduate employer recruitment practices
are entrenching the inequalities in higher education by focusing their efforts on a
small number of highly selective institutions, encouraging more advantaged pupils
who are already focused on gaining graduate employment to go to these institutions.
This reflects HEFCE’s analysis288 on student outcomes which suggested that entrants
to lower tariff institutions (those in the bottom third of institutions on entrant tariff
points) are less likely than would be expected, given their other characteristics, to
enter either employment or further study, or graduate employment or further study.
It is not clear what impact an increasing focus on recruiting graduates who have
already undertaken work experience for a company (32% of 2016’s entry-level
graduate roles are expected to be filled by graduates who have already worked for
their organisations, with nearly half of graduate recruiters stating that it was not
likely that they would recruit graduates who had no previous experience, regardless
HEFCE (2013) Trends in transition from first degree to postgraduate study: Qualifiers between 2002–03 and 2010–11 285 Independent Reviewer on Social Mobility and Child Poverty (2012) University Challenge: How Higher Education Can Advance Social Mobility 286 See King’s College London, ARC Network and The University of Manchester (2015), Causes of differences in student outcomes 287 The Bridge Group (2016) Inspiring Policy: Graduate Outcomes and Social Mobility; HEFCE (2015) Delivering opportunities for students and maximising their success: Evidence for policy and practice 2015–20; High Fliers Research (2016), The Graduate Market in 2016 288 HEFCE (2013) Higher education and beyond: Outcomes from full-time first degree study
114
of their academic achievements289) will have on graduate outcomes for
underrepresented groups. Some schemes have been created to help ensure that
underrepresented groups are able to gain access to work experience in top
professions, including PRIME290 (which works in law) and Access Accountancy291.
Graduate employers may also be entrenching inequalities introduced earlier in the
education system by requiring a minimum number of UCAS tariff points for
applicants. Two different surveys292 of the graduate recruitment market in 2013
found employers specifying minimum tariff points, with one finding that a quarter of
recruiters did and the other finding that 35% of recruiters did. However, some of the
largest graduate recruiters have since taken action on these points with some,
including PwC293 and Ernst & Young294 removing minimum UCAS tariff point scores
for applicants, and others, including Deloitte295 and Clifford Chance296, using
contextualised data to look at these measures in the round of applicant performance.
The Bridge Group297 and others have recommended the use of contextual data in
recruitment and a number of contextual data services have been developed to help
employers in this area. The Cabinet Office298 is also working with the Bridge Group to
develop a common set of measures for employers to understand the socio-economic
backgrounds of their staff body and recruitment pool.
Access to postgraduate study may also be entrenching the inequalities introduced
earlier in the education system. Research by HEFCE299 has shown that, in addition to
the differences identified in the section above, students at high tariff institutions are
substantially more likely to go on to postgraduate study within a year of graduating.
Although inequalities in access to postgraduate study appear to be smaller than at
undergraduate level, they are important for two reasons. Firstly, because research300
suggests that the postgraduate premium and demand for postgraduate employees are
both increasing. And secondly, because the academic staff of the future will be drawn,
at least in part, from current postgraduate students, and staff diversity is an
289 High Fliers Research (2016) The Graduate Market in 2016 290 See http://www.primecommitment.org/ 291 See http://www.accessaccountancy.org/ 292 High Fliers Research Graduate Market in 2013 and Association of Graduate Recruiters Graduate Recruitment Survey 2013, cited in HEFCE (2015) Delivering opportunities for students and maximising their success: Evidence for policy and practice 2015–20 293 See http://www.pwc.co.uk/careers/student/applying/ucas-tariff-changes.html 294 See http://www.ey.com/UK/en/Newsroom/News-releases/15-08-03---EY-transforms-its-recruitment-selection-process-for-graduates-undergraduates-and-school-leavers 295 See http://www2.deloitte.com/uk/en/pages/press-releases/articles/largest-british-business-to-adopt-contextualised-recruitment.html 296 See https://jobs.thelawyer.com/article/magic-circle-signs-up-to-contextual-recruitment-in-new-social-mobility-push/ 297 Bridge Group (2015) Good Practice in Contextual Recruitment 298 Cabinet Office (2016) Engagement Document: Developing a Common set of Measures for Employers on the Socio-Economic Backgrounds of their Workforce and Applicants. 299 HEFCE (2013) Trends in transition from first degree to postgraduate study: Qualifiers between 2002–03 and 2010–11 300 LSE Centre for Economic Performance (2011) CEP Discussion Paper No 1075 Rising Wage Inequality and Postgraduate Education
115
important part of developing an inclusive institution which recognises and supports
underrepresented groups301.
Until very recently there has been very limited consideration of diversity within
postgraduate entry. This is partly because the numbers going on to postgraduate
study remain relatively small and partly because postgraduate study is more diverse
and complex than undergraduate study. In addition to the differences in
postgraduate progression by student characteristic, there are differences by subject
discipline, different levels of qualification offering different possible outcomes,
considerable differences in student characteristics and intentions, and sparse and
varied funding.
Funding is a clear issue in the take-up of postgraduate study302. Although loans for
postgraduates will be introduced in autumn 2016, the impact of this is difficult to
predict and will need to be closely monitored. The loan has been designed to make a
contribution to costs rather than the full costs of study and it remains to be seen how
students without any other access to finance make up the gap between the £10,000
loan and their actual tuition fee and living costs.
In addition to funding, research has identified issues around the aspirations and
social capital of underrepresented student groups as a concern for postgraduate
progression, with a need for greater visibility of postgraduate education303; and the
importance of underrepresented students developing strong relationships with
staff304. The measures covered earlier in this paper will be important in addressing
these problems, and most particularly improvements to information, advice and
guidance to prospective postgraduate (and current undergraduate) students; and the
adoption of diverse and inclusive curriculum development, delivery and assessment.
301 See section 3.3.1.2 in King’s College London, ARC Network and The University of Manchester (2015) Causes of differences in student outcomes 302 See, for example, Paul Wakeling (2015) Programme Analysis of HEFCE’s Postgraduate Support Scheme: Final Report to ESRC and HEFCE 303 Wakeling (2015) op cit 304 King’s College London, ARC Network and The University of Manchester (2015) Causes of differences in student outcomes
116
ANNEXE B: A REVIEW OF THE EVIDENCE OF HOW YOUTH
SOCIAL ACTION CAN BOOST SOCIAL MOBILITY INTO, AND
AFTER UNIVERSITY
A REVIEW OF THE QUANTITATIVE AND QUALITATIVE EVIDENCE FROM ACROSS
THE #IWILL CAMPAIGN PARTNERS
When young people engage in social action, they develop the key skills and character
qualities that will set them up for work and life, while making a positive impact in
their communities. However, young people from less affluent backgrounds are
significantly less likely to be reaping these rewards of participating in social action
compared to their wealthier peers. Baseline data in 2014 showed that 51% of young
people from more affluent backgrounds and 31% of young people from less affluent
backgrounds participated in social action (Ipsos MORI 2014).
The #iwill campaign is led by over 600 organisations from across sectors who are all
dedicated to closing this socio-economic gap in participation, and in turn boosting
upwards social mobility of the UK’s most disadvantaged young people. Their
ambitious goal is to increase participation in youth social action among 10- to 20-
year-olds across the UK to over 60% by 2020.
Getting involved in social action helps young people directly and indirectly access
higher education, increase retention and performance at university, and boost their
future career opportunities. The following presents an overview of the evidence, both
qualitative and quantitative, that supports these statements and presents ideas on
how to further boost upwards social mobility through social action.
ACCESS TO UNIVERSITY
Getting involved in social action develops the character qualities and skills that are beneficial for young people as they access university in both personal statement writing and in interviews. The evidence:
● In 2016 the Behavioural Insights Team’s305 Random Controlled Trials found
that young people aged between 10 and 20 who took part in social action
activities in which the six quality principles of social action306 were embedded,
displayed significantly improved character qualities and skills. The trials
measured levels of empathy, cooperation, grit and resilience as well as
problem-solving skills, sense of community and educational attitudes. Across
305 The Behavioural Insights Team use insights from behavioural science to encourage people to make better choices for themselves and society. It is a social purpose company, jointly owned by the UK government, Nesta (the innovation charity) and their employees. Further information is available at http://www.behaviouralinsights.co.uk 306 The six principles are: embedded, progressive, youth led, challenging, socially impactful and reflective.
117
all six of these areas there was an uplift of between 6 and 16% when compared
with the control group (BIT 2016).307
● The same research found that in a mock job interview, young people who had
taken part in social action were more likely to be successful than those who
had not.
● In 2015, UCAS worked with #iwill partners to develop guidance for young
people on how to draw on their social action experience to write an effective
personal statement.
These soft skills prepare young people not only for university but also for the
workplace. Embedding social action in schools in areas of low social mobility will
maximise character building and soft skills development, therefore enhancing young
people’s personal statements and ability to access university, while also positively
impacting employability opportunities.
Social action participation can also boost attainment at school. #iwill
partner schools have woven social action into their school culture and curriculum and
report improvements in behaviour in the classroom, time management and
engagement in lessons. The 2014 National Citizen Service (NCS) evaluation308
demonstrated a link between participating in NCS and participants’ plans for
undertaking further education (5% increase, compared to a control group). These
case studies are particularly encouraging with regards to young people attending
schools in areas of low social mobility and increasing their chances of accessing
university.
STAYING ON AT UNIVERSITY AND ACHIEVING THE BEST POSSIBLE RESULT AT
THE END OF UNIVERSITY
Evidence suggests engaging in social action can help increase wellbeing,
helping young people not only access but also stay on at university. There
are countless pieces of evidence indicating a link between poor wellbeing and areas of
low social mobility. Research309 also shows better wellbeing increases the likelihood
of achieving academically (JRF 2011). For example, pupils with better emotional
wellbeing at the age of seven had a value-added key stage 2 score 2.46 points higher
than pupils with poorer emotional wellbeing (DfE). Participation in youth social
action is significantly associated with improved wellbeing (IPSOS Mori 2014310). A
Behavioural Insights Team study found that participants in the Citizenship
Foundation programme had levels of anxiety 22% lower than those in the control
group.
307 The Behavioural Insights Team in partnership with the Cabinet Office (2015) Evaluating Youth Social Action – Interim report http://www.behaviouralinsights.co.uk/publications/evaluating-youth-social-action/ 308 IPSOS Mori (2015) The National Citizen Service 2014 Evaluation https://www.ipsos-mori.com/researchpublications/publications/1784/National-Citizen-Service-2014-Evaluation.aspx 309 Joseph Roundtree Foundation (2015) Does income inequality cause health and social problems? https://www.jrf.org.uk/sites/default/files/jrf/migrated/files/inequality-income-social-problems-full.pdf 310 IPSOS Mori (2014) Youth social action in the UK-2014. A face-to-face survey for 10-20 year olds https://www.ipsos-mori.com/Assets/Docs/Publications/sri-ecf-youth-social-action-in-the-uk-2014.pdf
118
With students demanding more than just a degree from their university experience,
engaging in social action helps improve a student’s university experience and raises
student satisfaction levels, increases attainment at university and helps towards
achieving better results.
FUTURE CAREER OPTIONS
Social action increases young people’s networks, helping them develop
their future career options. Half of the poorest children are educated together in
just 20% of schools (DfE). We know that extending relationships and networks
positively influence social mobility. Studies show that young people who have been in
contact with four or more employers are nearly twice as likely to know what types of
skills they need to get the job they want (Inspiring the Future).
It is important to open up these networks at a young age throughout school. It is also
critical to maintain opportunities throughout university to help with future career
options.
A CIPD survey311 (2015) reported 67% of employers say candidates with social action
experience demonstrate better employability skills. In its Education and Skills survey,
the Confederation of British Industry (CBI) and Pearson found that a mere 24% of
employers count exam results as paramount when recruiting school or college
leavers, compared with a significant 85% who regard character and attitude as among
the most important things they look for.
The Career Colleges Trust released research312 showing that students themselves
think schools are too focused on exam results and are not preparing them enough for
the world of work. Lord Baker, founder of the Career Colleges Trust, described how
the research highlights the extent of the problem that the UK is facing: a huge skills
gap across many industries. He said, ‘If young people themselves are not feeling
prepared for work, employers will continue to struggle with the recruitment issues
that have become such a challenge for UK industry.’
For those students unable to find relevant work experience during university, or
unable to engage in unpaid work placements, social action allows them to develop key
employability skills that can help them immensely when applying for jobs after
university. Aside from developing character and compassion, engaging in social
action also signals to potential employers a young person’s proactive nature and their
ability to work in a variety of environments.
311 CIPD (2015) A guide for employers; how to unlock social action in recruitment, available at https://www.cipd.co.uk/binaries/talent-social-action-recruitment.pdf 312 http://careercolleges.org.uk/2015/08/19/young-people-do-not-feel-prepared-for-the-world-of-work/
119
ANNEXE C: SOCIAL MOBILITY ADVISORY GROUP AND REFERENCE GROUP MEMBERS
SOCIAL MOBILITY ADVISORY GROUP
• Nicola Dandridge (Chair), Chief Executive, Universities UK • Shirley Atkinson, Vice-Chancellor and Chief Executive, University of
Sunderland • Gaenor Bagley, Head of People, Community and Sustainability, PwC • Caroline Bicknell, Deputy Director of Higher Education, Department for
Education • Anne-Marie Canning, Director of Widening Participation (Student Lifecycle),
King's College London • Professor Joy Carter, Vice-Chancellor, University of Winchester, and chair of
GuildHE • Megan Dunn, President, National Union of Students (until May 2016) • Professor Les Ebdon, Director, Office for Fair Access • Allan Foulds, President, Association of School and College Leaders • Nicholas Glossop, Head of Inclusion and Learning Support, BPP University • Gerry Godley, Principal and Managing Director, Leeds College of Music • Peter Horrocks, Vice-Chancellor, The Open University • Omar Khan, Director, The Runnymede Trust • Professor Geoff Layer, Vice-Chancellor, University of Wolverhampton • Gary Loke, Head of Policy, Equality Challenge Unit • Steve McArdle, Chair of Post-16 and Higher Education, Association of School
and College Leaders and Assistant Head (Post-16) Durham Johnson School • Nona McDuff, Director of Equality, Diversity and Inclusion, Kingston
University and Chair of the Higher Education Race Action Group • Chris Millward, Director (Policy), Higher Education Funding Council for
England • Raphael Mokades, founder and Managing Director, Rare Recruitment • Mike Nicholson, Chair of the Higher Education Liaison Officers Association,
and Director of Student Recruitment and Admissions, University of Bath • Professor Sir Steve Smith, Chair of UCAS, and Vice-Chancellor and Chief
Executive, University of Exeter • Professor John Storan, Director of Continuum, Centre for Widening
Participation Policy Studies, University of East London • Professor Mary Stuart, Vice-Chancellor, University of Lincoln • Sorana Vieru, Vice-President (Higher Education), National Union of
Students, (from June 2016) • John Widdowson, Principal of New College Durham, and President of the
Association of Colleges
UNIVERSITIES UK SECRETARIAT
• Chris Hale, Director of Policy • Kate Jackson, Senior Political Affairs Officer • Eleanor Jubb, Policy Analyst
120
• Ian Morton, Campaigns Manager • Fiona Waye, Senior Policy Lead, Social Mobility, Equality and Diversity
ACADEMIC REFERENCE GROUP
• Professor Mary Stuart, Vice-Chancellor, University of Lincoln (Chair) • Jane Artess, Principal Research Fellow, University of Derby • Jo Blanden, Research Associate, Centre for Economic Performance, London
School of Economics and Political Science, and University of Surrey • Dr Vikki Boliver, Acting Deputy Head of School (Research), Senior Lecturer in
Sociology/Social Policy in the School of Applied Social Sciences, University of Durham
• Dr Mark Corver, Director of Analysis and Research, UCAS • Sam Friedman, Assistant Professor in Sociology, London School of Economics
and Political Science • Sarah Howls, Head of Widening Participation, Higher Education Funding
Council for England • Dr Steven Jones, Senior Lecturer, Manchester Institute of Education,
University of Manchester • Dr Daniel Laurison, Postdoctoral Fellow in the Sociology Department,
London School of Economics and Political Science • Professor Steven Machin, Centre for Economic Performance Research
Director and Programme Director Labour Markets – Education and Skills, Community, at the London School of Economics and Political Science
• Heidi Mirza, Professor of Race, Faith and Culture, Goldsmiths, University of London
• Dr Anna Mountford–Zimdars, Senior Lecturer in Higher Education, King’s College London
• Dr Gurnam Singh, Principal Lecturer in Social Work, Coventry University • Professor Liz Thomas, Edge Hill University • Professor Mike Savage, Martin White Professor of Sociology, Head of
Department, London School of Economics and Political Science • Professor Anna Vignoles, Professor of Education, Director of Research,
University of Cambridge • Dr Paul Wakeling, Senior Lecturer, University of York • Dr Gill Wyness, UCL Institute of Education
PRACTITIONERS’ REFERENCE GROUP
• Anne-Marie Canning, Director of Widening Participation, King's College London (Joint Chair)
• Mike Nicholson, Director of Student Recruitment and Admissions, University of Bath; Chair, Higher Education Liaison Officers Association (Joint Chair)
• John Adams, Vice-Principal, Wiltshire College • Oliver Cardinali, Policy and Public Affairs, Sutton Trust • Rachel Carr, Chief Executive and Co-Founder, IntoUniversity • Richard Gould, Chief Executive, Villiers Trust Educational Park • Janet Graham, Director, Supporting Professionalism in Admissions • Dr Joan O'Mahony, Academic Lead, Retention, Higher Education Academy
121
• Nona McDuff, Director of Equality, Diversity and Inclusion, Kingston University; Chair, Higher Education Race Action Group
• Nadira Mirza, Director of Student Success, University of Bradford and Universities Association of Lifelong Learning
• Josh Oware, Rare Recruitment and Target Oxbridge • Claire Owen, Policy Adviser, Medical Schools Council • Jenny North, Guidance Adviser, Birmingham Metropolitan College • Anand Shukla, Chief Executive, Brightside • Ian Sinker, Associate Dean (Academic Development and Innovation),
University of Cumbria • Dr Helen Thorne, Director of External Relations, UCAS • Alice Wilby, Director of UK Recruitment and Partnerships, Oxford Brookes
University • Chris Wilson, National Programme Director, The Scholars Programme, The
Brilliant Club
ATTENDANCE AT EMPLOYERS’ ROUNDTABLE
• Nicola Dandridge, Chief Executive, Universities UK (Chair) • Gaenor Bagley, Head of People, Community and Sustainability, PwC • Matt Baker, Attraction and Outreach Assistant Manager, Student
Recruitment, KPMG • Jennifer Beckwith, Policy Adviser (Employment Law and Diversity), CBI • Anna Birley, Corporate Adviser, Business in the Community • Elaine Boyes, Executive Director, AGCAS • Jane Clark, Group Head of Graduate Resourcing and Development, Barclays • Daniel Ellis, Partner, Baker & McKenzie • Dr Sam Friedman, Assistant Professor in Sociology, London School of
Economics and Political Science • Stephen Isherwood, Chief Executive, Association of Graduate Recruiters • Martha Jennings, Starting Out Manager, Sky • Sabrina Luisi, Head of Access Department (Acting Associate Director), Teach
First • Nik Miller, Director, The Bridge Group • Raphael Mokades, Founder and Managing Director, Rare Recruitment • Annie Peate, Policy Advisor, Education and Skills, Federation of Small
Businesses • Dan Richards, Recruiting Leader UK and Ireland, EY • Clare Sullivan, Corporate Responsibility Programme Manager, Deloitte LLP • Justine Thompson, Senior Inclusion and Diversity Manager, Baker &
McKenzie • Jackie Trench, Graduate Recruitment Manager, Clifford Chance LLP • Philip Wilson, Provost and Chief Executive, CSR Resourcing
122
ATTENDANCE AT SCHOOLS’ ROUNDTABLE
Nicola Dandridge, Chief Executive, Universities UK (Chair)
Dill Anstey, Vice Principal – Federation Sixth Form, Harris Federation
Amandip Bisel, Vice-Chair (Group Development), Higher Education Liaison
Officers Association
Professor Joy Carter, Vice-Chancellor, University of Winchester
Anthony Fitzpatrick, Higher Education Coordinator, St Paul’s Way Trust
School
Allan Foulds, President, Association of School and College Leaders
Hilary French, Co-Chair of Girls School Association/Headmasters’ and
Headmistresses’ Conference Joint Universities Committee
Steve McArdle, Assistant Head (Post-16), Durham Johnston School
Hannah McAuley, Head of University and Careers Success, Ark
James Skinner, Chief Executive, Grammar School Heads’ Association
ATTENDANCE AT ALTERNATIVE PROVIDERS’ ROUNDTABLE
Chris Hale, Director of Policy, Universities UK (Chair)
Professor Aldwyn Cooper, Vice-Chancellor and Principal, Regent’s University,
London
Joy Elliott-Bowman, Policy and Public Affairs Manager, Independent Higher
Education
John Fairhurst, Managing Director and Academic Principal, The London
School of Business and Management
Nicholas Glossop, Head of Inclusion and Learning Support, BPP University
Professor Haymo Thiel, Principal of the Anglo-European College of
Chiropractic
Paul Kirkham, Managing Director, The Institute of Contemporary Music
Performance
Paul Lockhart-Thomas, Director of Academic and Support Services,
Cambridge Ruskin International College
Raffaele Marcellino, Chief Academic Officer, SAE Institute
Alex Proudfoot, Chief Executive, Independent Higher Education
Sir Anthony Seldon, Vice-Chancellor, University of Buckingham
This publication has been produced by Universities UK (UUK), the representative organisation for the UK’s universities. Founded in 1918, its mission is to be the voice of universities in the UK, providing high quality leadership and support to its members to promote a successful and diverse higher education sector. With 135 members and offices in London, Cardiff (Universities Wales) and Edinburgh (Universities Scotland), it promotes the strength and success of UK universities nationally and internationally.
Woburn House, 20 Tavistock Square London WC1H 9HQ
Tel: +44 (0)20 7419 4111 Email: [email protected] Website: www.universitiesuk.ac.uk Twitter: @UniversitiesUK
To download this publication, or for the full list of Universities UK publications, visit www.universitiesuk.ac.uk
October 2016
ISBN: 978-1-84036-367-8