Embed Size (px)
Citation preview
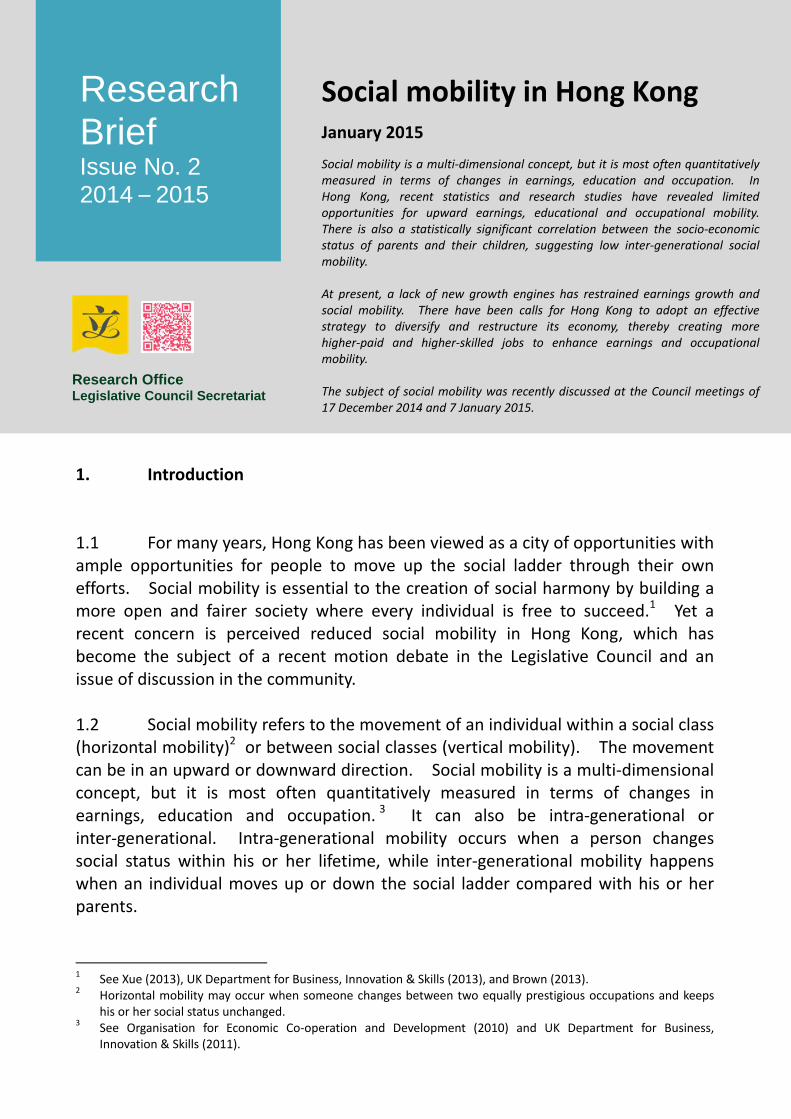
Research Brief Issue No. 2 2014 – 2015
Social mobility in Hong KongJanuary 2015
Social mobility is a multi‐dimensional concept, but it is most often quantitatively measured in terms of changes in earnings, education and occupation. In Hong Kong, recent statistics and research studies have revealed limited opportunities for upward earnings, educational and occupational mobility. There is also a statistically significant correlation between the socio‐economic status of parents and their children, suggesting low inter‐generational social mobility. At present, a lack of new growth engines has restrained earnings growth and social mobility. There have been calls for Hong Kong to adopt an effective strategy to diversify and restructure its economy, thereby creating more higher‐paid and higher‐skilled jobs to enhance earnings and occupational mobility. The subject of social mobility was recently discussed at the Council meetings of 17 December 2014 and 7 January 2015.
Research Office Legislative Council Secretariat
1. Introduction 1.1 For many years, Hong Kong has been viewed as a city of opportunities with ample opportunities for people to move up the social ladder through their own efforts. Social mobility is essential to the creation of social harmony by building a more open and fairer society where every individual is free to succeed.1 Yet a recent concern is perceived reduced social mobility in Hong Kong, which has become the subject of a recent motion debate in the Legislative Council and an issue of discussion in the community. 1.2 Social mobility refers to the movement of an individual within a social class (horizontal mobility)2 or between social classes (vertical mobility). The movement can be in an upward or downward direction. Social mobility is a multi‐dimensional concept, but it is most often quantitatively measured in terms of changes in earnings, education and occupation. 3 It can also be intra‐generational or inter‐generational. Intra‐generational mobility occurs when a person changes social status within his or her lifetime, while inter‐generational mobility happens when an individual moves up or down the social ladder compared with his or her parents.
1 See Xue (2013), UK Department for Business, Innovation & Skills (2013), and Brown (2013). 2 Horizontal mobility may occur when someone changes between two equally prestigious occupations and keeps
his or her social status unchanged. 3 See Organisation for Economic Co‐operation and Development (2010) and UK Department for Business,
Innovation & Skills (2011).
2
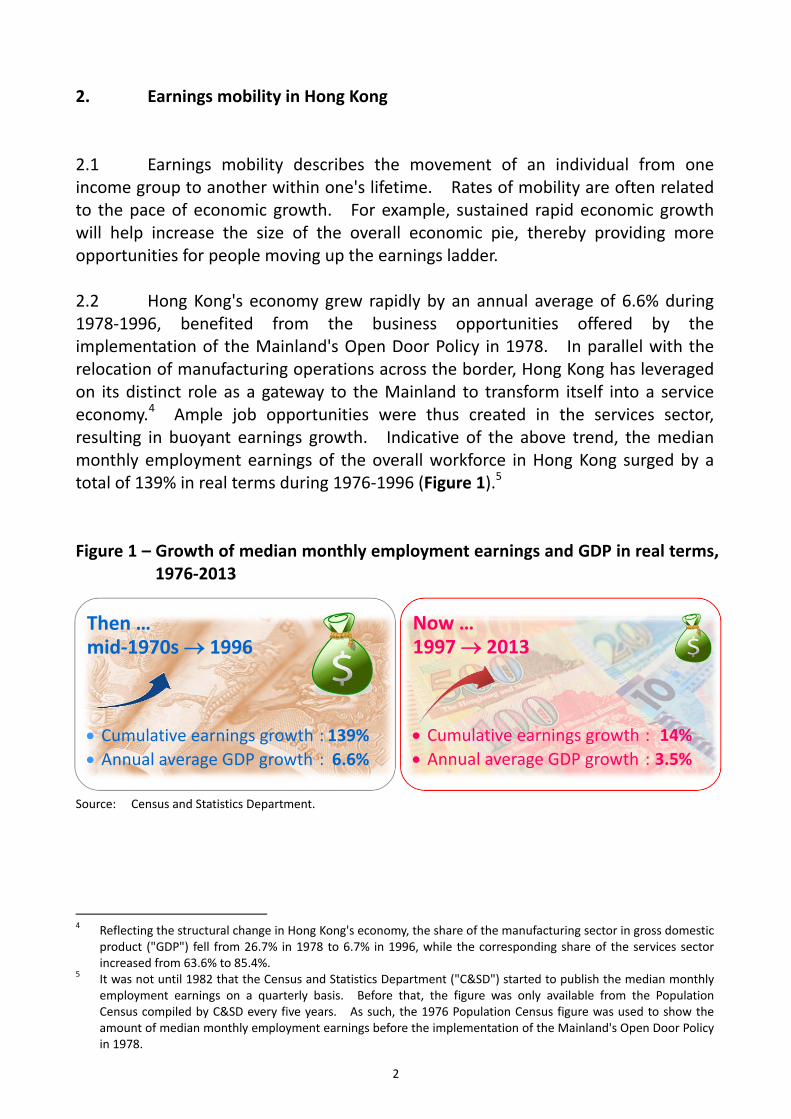
2. Earnings mobility in Hong Kong 2.1 Earnings mobility describes the movement of an individual from one income group to another within one's lifetime. Rates of mobility are often related to the pace of economic growth. For example, sustained rapid economic growth will help increase the size of the overall economic pie, thereby providing more opportunities for people moving up the earnings ladder. 2.2 Hong Kong's economy grew rapidly by an annual average of 6.6% during 1978‐1996, benefited from the business opportunities offered by the implementation of the Mainland's Open Door Policy in 1978. In parallel with the relocation of manufacturing operations across the border, Hong Kong has leveraged on its distinct role as a gateway to the Mainland to transform itself into a service economy.4 Ample job opportunities were thus created in the services sector, resulting in buoyant earnings growth. Indicative of the above trend, the median monthly employment earnings of the overall workforce in Hong Kong surged by a total of 139% in real terms during 1976‐1996 (Figure 1).5 Figure 1 – Growth of median monthly employment earnings and GDP in real terms,
1976‐2013
Source: Census and Statistics Department.
4 Reflecting the structural change in Hong Kong's economy, the share of the manufacturing sector in gross domestic
product ("GDP") fell from 26.7% in 1978 to 6.7% in 1996, while the corresponding share of the services sector increased from 63.6% to 85.4%.
5 It was not until 1982 that the Census and Statistics Department ("C&SD") started to publish the median monthly employment earnings on a quarterly basis. Before that, the figure was only available from the Population Census compiled by C&SD every five years. As such, the 1976 Population Census figure was used to show the amount of median monthly employment earnings before the implementation of the Mainland's Open Door Policy in 1978.
Then … mid‐1970s 1996 Cumulative earnings growth : 139%
Annual average GDP growth : 6.6%
Now …1997 2013 Cumulative earnings growth : 14%
Annual average GDP growth : 3.5%
3
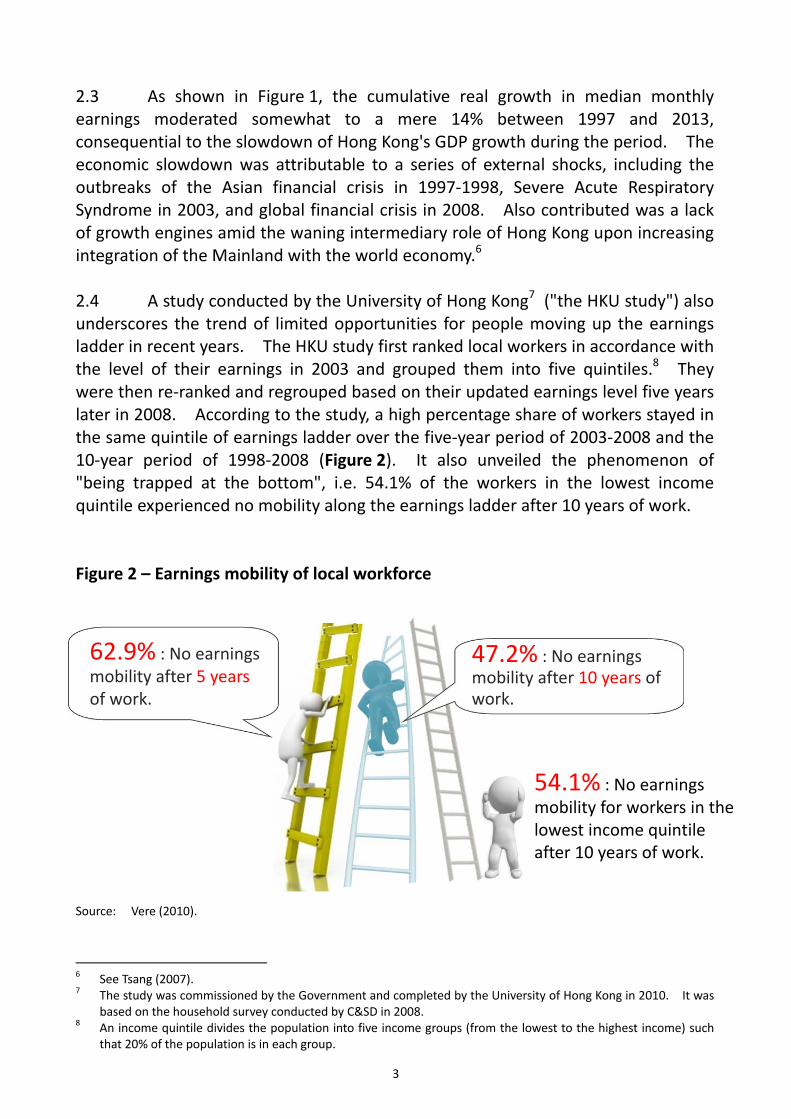
2.3 As shown in Figure 1, the cumulative real growth in median monthly earnings moderated somewhat to a mere 14% between 1997 and 2013, consequential to the slowdown of Hong Kong's GDP growth during the period. The economic slowdown was attributable to a series of external shocks, including the outbreaks of the Asian financial crisis in 1997‐1998, Severe Acute Respiratory Syndrome in 2003, and global financial crisis in 2008. Also contributed was a lack of growth engines amid the waning intermediary role of Hong Kong upon increasing integration of the Mainland with the world economy.6 2.4 A study conducted by the University of Hong Kong7 ("the HKU study") also underscores the trend of limited opportunities for people moving up the earnings ladder in recent years. The HKU study first ranked local workers in accordance with the level of their earnings in 2003 and grouped them into five quintiles.8 They were then re‐ranked and regrouped based on their updated earnings level five years later in 2008. According to the study, a high percentage share of workers stayed in the same quintile of earnings ladder over the five‐year period of 2003‐2008 and the 10‐year period of 1998‐2008 (Figure 2). It also unveiled the phenomenon of "being trapped at the bottom", i.e. 54.1% of the workers in the lowest income quintile experienced no mobility along the earnings ladder after 10 years of work. Figure 2 – Earnings mobility of local workforce Source: Vere (2010).
6 See Tsang (2007). 7 The study was commissioned by the Government and completed by the University of Hong Kong in 2010. It was
based on the household survey conducted by C&SD in 2008. 8 An income quintile divides the population into five income groups (from the lowest to the highest income) such
that 20% of the population is in each group.
62.9% : No earnings mobility after 5 years of work.
47.2% : No earnings mobility after 10 years ofwork.
54.1% : No earnings mobility for workers in the lowest income quintile after 10 years of work.
4
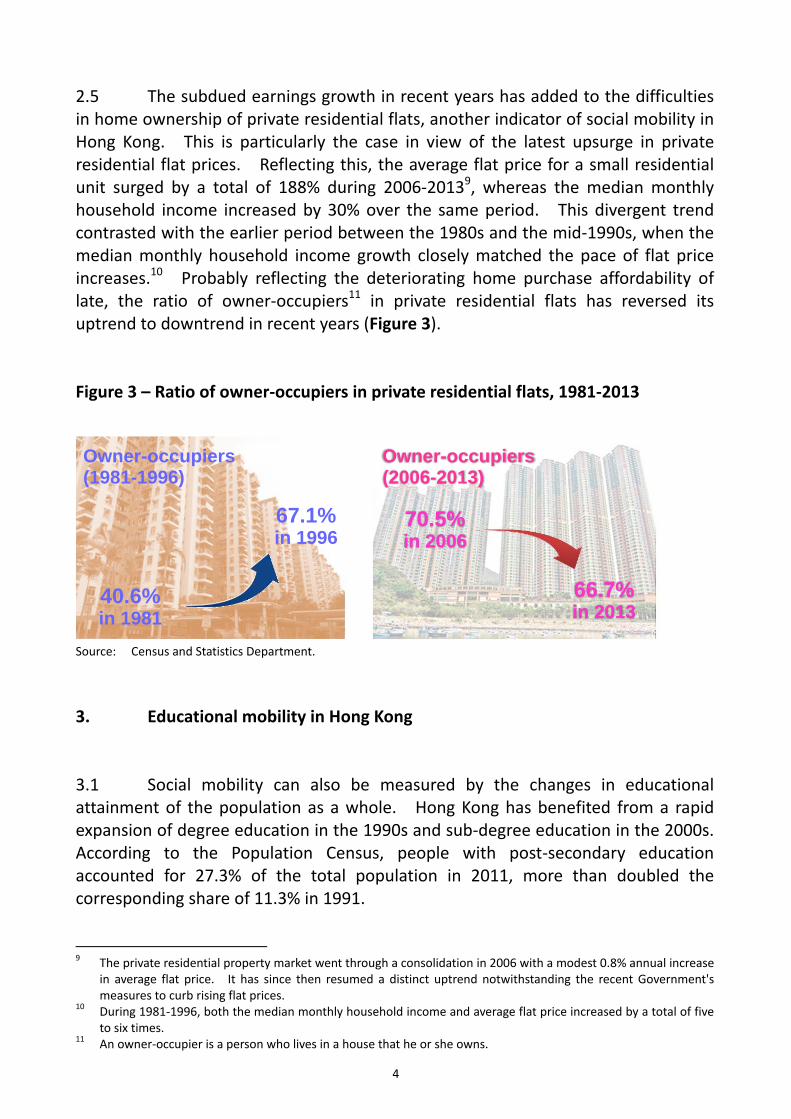
2.5 The subdued earnings growth in recent years has added to the difficulties in home ownership of private residential flats, another indicator of social mobility in Hong Kong. This is particularly the case in view of the latest upsurge in private residential flat prices. Reflecting this, the average flat price for a small residential unit surged by a total of 188% during 2006‐20139, whereas the median monthly household income increased by 30% over the same period. This divergent trend contrasted with the earlier period between the 1980s and the mid‐1990s, when the median monthly household income growth closely matched the pace of flat price increases.10 Probably reflecting the deteriorating home purchase affordability of late, the ratio of owner‐occupiers11 in private residential flats has reversed its uptrend to downtrend in recent years (Figure 3). Figure 3 – Ratio of owner‐occupiers in private residential flats, 1981‐2013
Source: Census and Statistics Department.
3. Educational mobility in Hong Kong 3.1 Social mobility can also be measured by the changes in educational attainment of the population as a whole. Hong Kong has benefited from a rapid expansion of degree education in the 1990s and sub‐degree education in the 2000s. According to the Population Census, people with post‐secondary education accounted for 27.3% of the total population in 2011, more than doubled the corresponding share of 11.3% in 1991.
9 The private residential property market went through a consolidation in 2006 with a modest 0.8% annual increase
in average flat price. It has since then resumed a distinct uptrend notwithstanding the recent Government's measures to curb rising flat prices.
10 During 1981‐1996, both the median monthly household income and average flat price increased by a total of five to six times.
11 An owner‐occupier is a person who lives in a house that he or she owns.
40.6% in 1981
67.1%in 1996
Owner-occupiers(1981-1996)
Owner-occupiers(2006-2013)
70.5%in 2006
66.7% in 2013
5
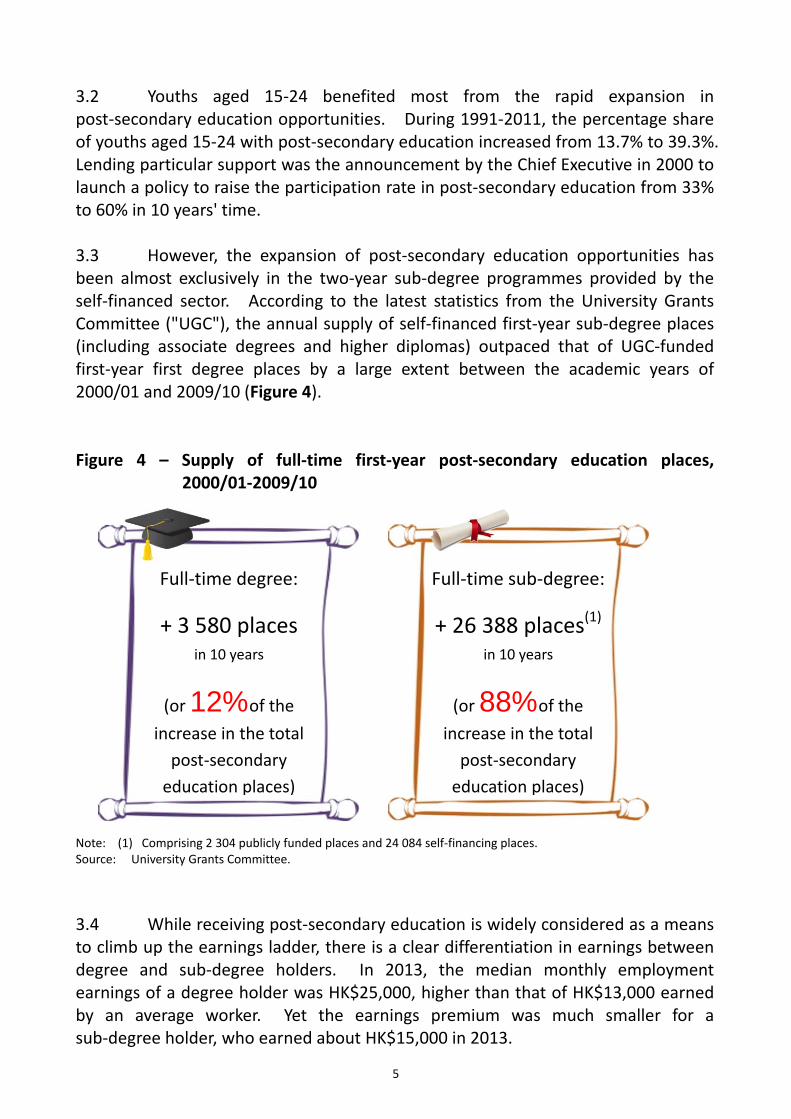
3.2 Youths aged 15‐24 benefited most from the rapid expansion in post‐secondary education opportunities. During 1991‐2011, the percentage share of youths aged 15‐24 with post‐secondary education increased from 13.7% to 39.3%. Lending particular support was the announcement by the Chief Executive in 2000 to launch a policy to raise the participation rate in post‐secondary education from 33% to 60% in 10 years' time. 3.3 However, the expansion of post‐secondary education opportunities has been almost exclusively in the two‐year sub‐degree programmes provided by the self‐financed sector. According to the latest statistics from the University Grants Committee ("UGC"), the annual supply of self‐financed first‐year sub‐degree places (including associate degrees and higher diplomas) outpaced that of UGC‐funded first‐year first degree places by a large extent between the academic years of 2000/01 and 2009/10 (Figure 4). Figure 4 – Supply of full‐time first‐year post‐secondary education places,
2000/01‐2009/10 Note: (1) Comprising 2 304 publicly funded places and 24 084 self‐financing places. Source: University Grants Committee.
3.4 While receiving post‐secondary education is widely considered as a means to climb up the earnings ladder, there is a clear differentiation in earnings between degree and sub‐degree holders. In 2013, the median monthly employment earnings of a degree holder was HK$25,000, higher than that of HK$13,000 earned by an average worker. Yet the earnings premium was much smaller for a sub‐degree holder, who earned about HK$15,000 in 2013.
Full‐time degree:
+ 3 580 places in 10 years
(or 12% of the
increase in the total
post‐secondary
education places)
Full‐time sub‐degree:
+ 26 388 places(1) in 10 years
(or 88% of the
increase in the total
post‐secondary
education places)
6
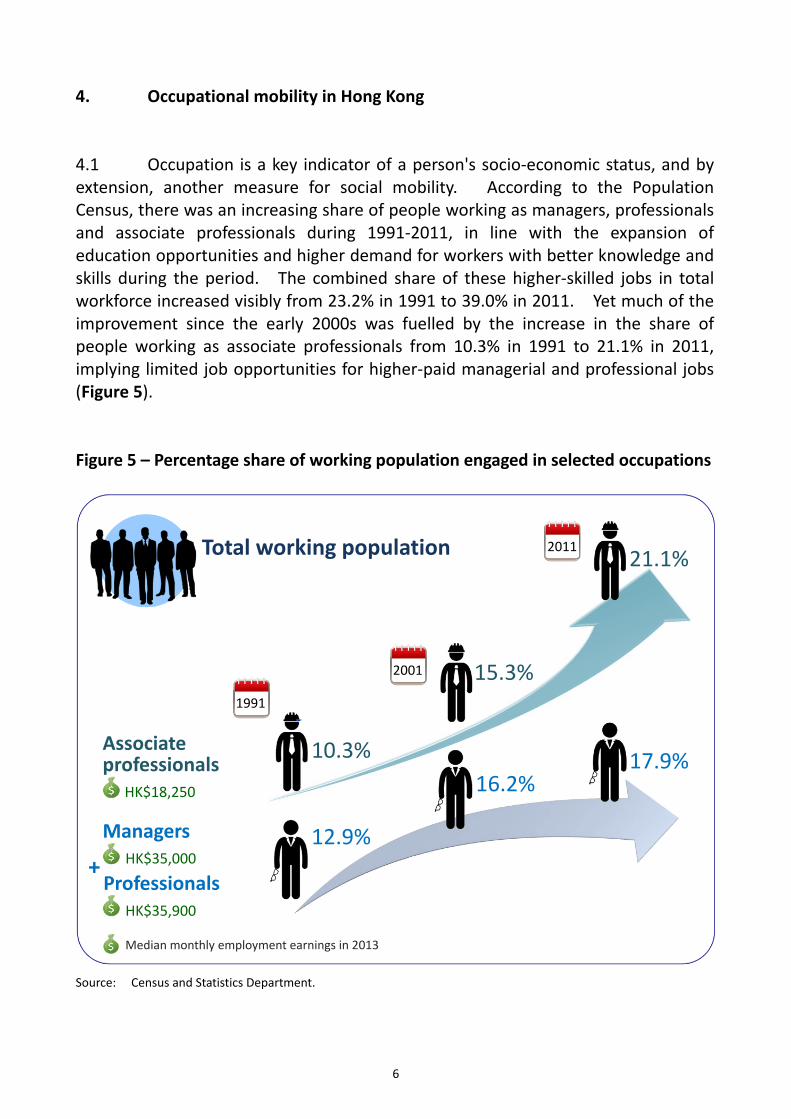
4. Occupational mobility in Hong Kong 4.1 Occupation is a key indicator of a person's socio‐economic status, and by extension, another measure for social mobility. According to the Population Census, there was an increasing share of people working as managers, professionals and associate professionals during 1991‐2011, in line with the expansion of education opportunities and higher demand for workers with better knowledge and skills during the period. The combined share of these higher‐skilled jobs in total workforce increased visibly from 23.2% in 1991 to 39.0% in 2011. Yet much of the improvement since the early 2000s was fuelled by the increase in the share of people working as associate professionals from 10.3% in 1991 to 21.1% in 2011, implying limited job opportunities for higher‐paid managerial and professional jobs (Figure 5). Figure 5 – Percentage share of working population engaged in selected occupations Source: Census and Statistics Department.
Associate professionals
Managers
HK$18,250
HK$35,000
Median monthly employment earnings in 2013
1991
2001
2011
10.3%
15.3%
21.1%
12.9%
16.2%17.9%
Total working population
Professionals HK$35,900
+
7
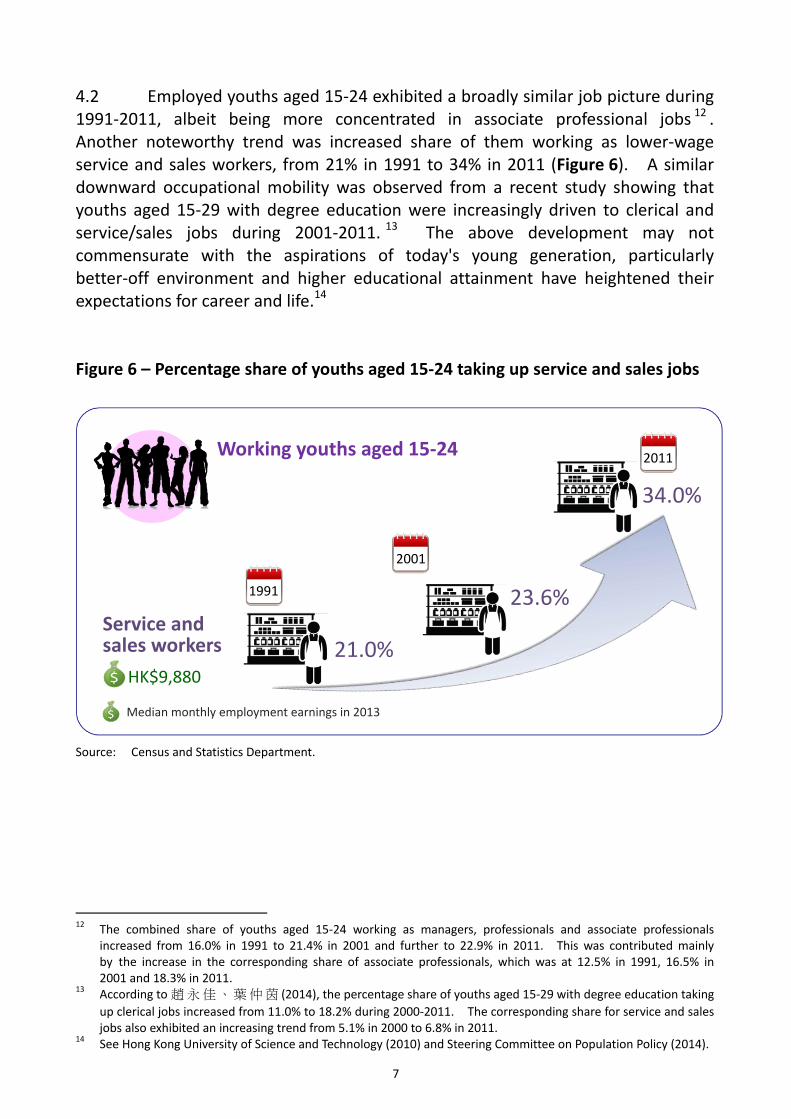
4.2 Employed youths aged 15‐24 exhibited a broadly similar job picture during 1991‐2011, albeit being more concentrated in associate professional jobs 12 . Another noteworthy trend was increased share of them working as lower‐wage service and sales workers, from 21% in 1991 to 34% in 2011 (Figure 6). A similar downward occupational mobility was observed from a recent study showing that youths aged 15‐29 with degree education were increasingly driven to clerical and service/sales jobs during 2001‐2011. 13 The above development may not commensurate with the aspirations of today's young generation, particularly better‐off environment and higher educational attainment have heightened their expectations for career and life.14 Figure 6 – Percentage share of youths aged 15‐24 taking up service and sales jobs Source: Census and Statistics Department.
12 The combined share of youths aged 15‐24 working as managers, professionals and associate professionals
increased from 16.0% in 1991 to 21.4% in 2001 and further to 22.9% in 2011. This was contributed mainly by the increase in the corresponding share of associate professionals, which was at 12.5% in 1991, 16.5% in 2001 and 18.3% in 2011.
13 According to趙永佳、葉仲茵 (2014), the percentage share of youths aged 15‐29 with degree education taking
up clerical jobs increased from 11.0% to 18.2% during 2000‐2011. The corresponding share for service and sales jobs also exhibited an increasing trend from 5.1% in 2000 to 6.8% in 2011.
14 See Hong Kong University of Science and Technology (2010) and Steering Committee on Population Policy (2014).
Service and sales workers
HK$9,880
1991
2001
2011
21.0%
23.6%
34.0%
Working youths aged 15‐24
Median monthly employment earnings in 2013
8
5. Inter‐generational social mobility in Hong Kong
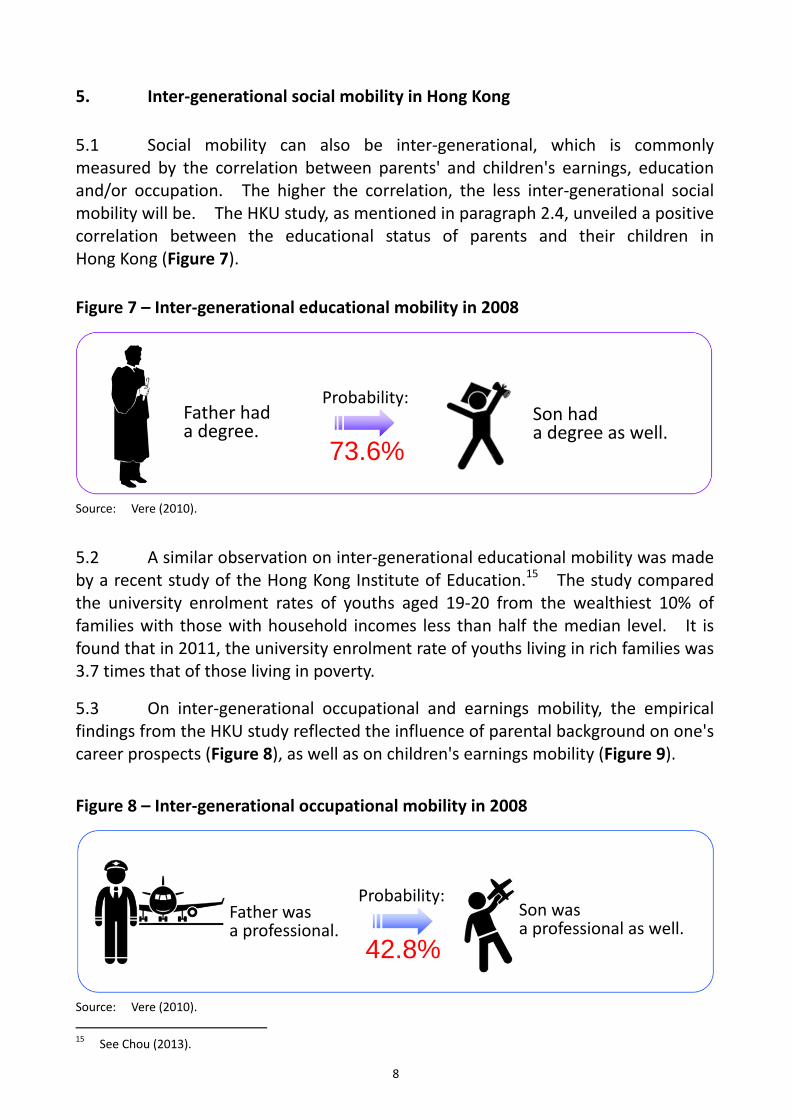
5.1 Social mobility can also be inter‐generational, which is commonly measured by the correlation between parents' and children's earnings, education and/or occupation. The higher the correlation, the less inter‐generational social mobility will be. The HKU study, as mentioned in paragraph 2.4, unveiled a positive correlation between the educational status of parents and their children in Hong Kong (Figure 7).
Figure 7 – Inter‐generational educational mobility in 2008 Source: Vere (2010).
5.2 A similar observation on inter‐generational educational mobility was made by a recent study of the Hong Kong Institute of Education.15 The study compared the university enrolment rates of youths aged 19‐20 from the wealthiest 10% of families with those with household incomes less than half the median level. It is found that in 2011, the university enrolment rate of youths living in rich families was 3.7 times that of those living in poverty.
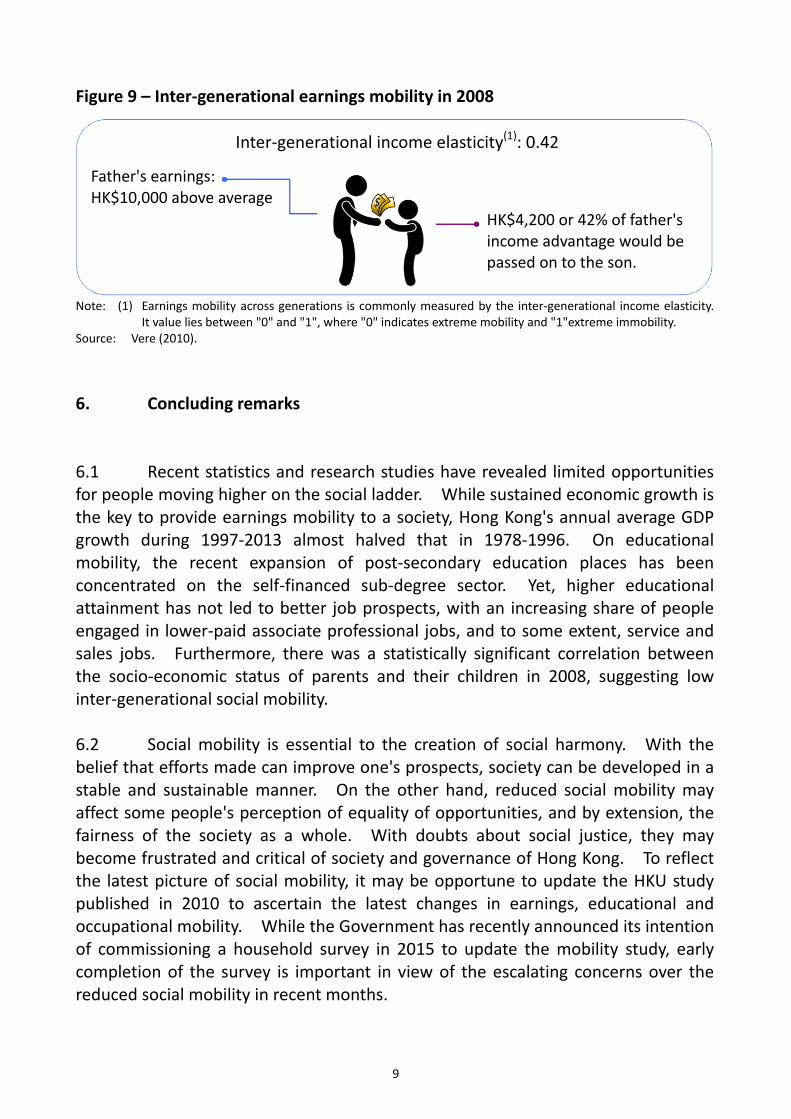
5.3 On inter‐generational occupational and earnings mobility, the empirical findings from the HKU study reflected the influence of parental background on one's career prospects (Figure 8), as well as on children's earnings mobility (Figure 9).
Figure 8 – Inter‐generational occupational mobility in 2008 Source: Vere (2010).
15 See Chou (2013).
Father had a degree.
Probability:
73.6% Son had a degree as well.
Father was a professional.
Probability:
42.8% Son was a professional as well.
9
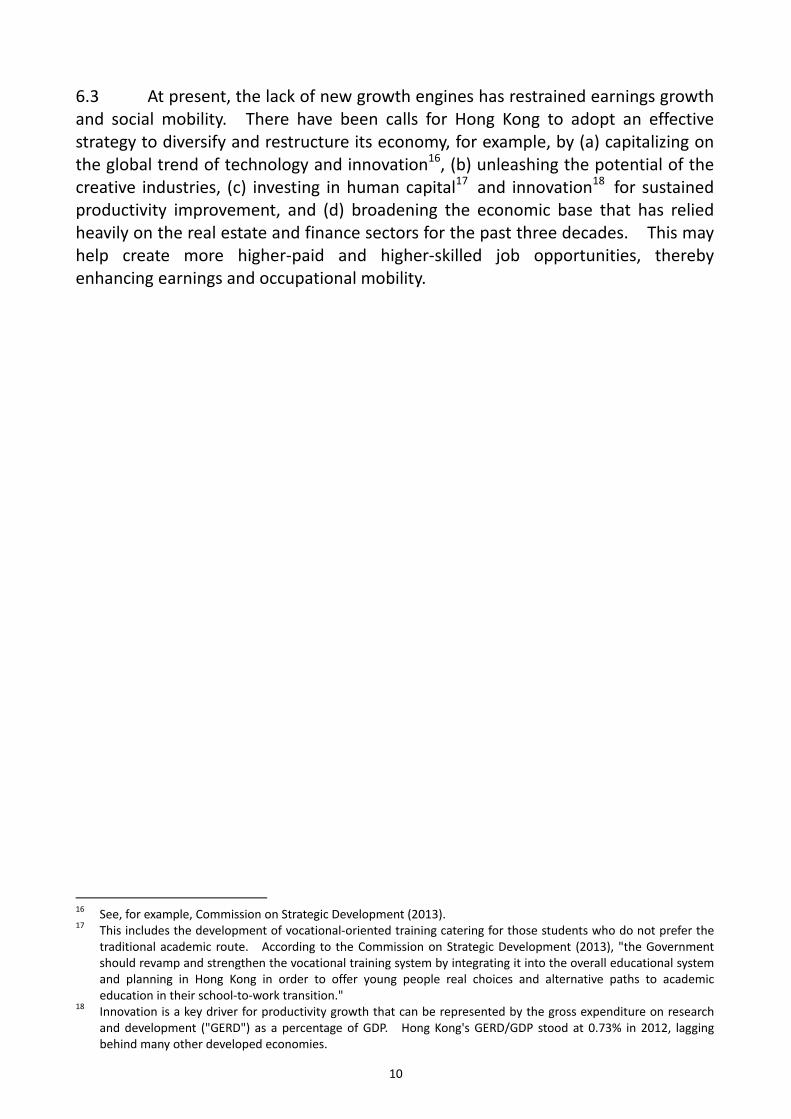
Figure 9 – Inter‐generational earnings mobility in 2008
Note: (1) Earnings mobility across generations is commonly measured by the inter‐generational income elasticity.
It value lies between "0" and "1", where "0" indicates extreme mobility and "1"extreme immobility. Source: Vere (2010).
6. Concluding remarks 6.1 Recent statistics and research studies have revealed limited opportunities for people moving higher on the social ladder. While sustained economic growth is the key to provide earnings mobility to a society, Hong Kong's annual average GDP growth during 1997‐2013 almost halved that in 1978‐1996. On educational mobility, the recent expansion of post‐secondary education places has been concentrated on the self‐financed sub‐degree sector. Yet, higher educational attainment has not led to better job prospects, with an increasing share of people engaged in lower‐paid associate professional jobs, and to some extent, service and sales jobs. Furthermore, there was a statistically significant correlation between the socio‐economic status of parents and their children in 2008, suggesting low inter‐generational social mobility. 6.2 Social mobility is essential to the creation of social harmony. With the belief that efforts made can improve one's prospects, society can be developed in a stable and sustainable manner. On the other hand, reduced social mobility may affect some people's perception of equality of opportunities, and by extension, the fairness of the society as a whole. With doubts about social justice, they may become frustrated and critical of society and governance of Hong Kong. To reflect the latest picture of social mobility, it may be opportune to update the HKU study published in 2010 to ascertain the latest changes in earnings, educational and occupational mobility. While the Government has recently announced its intention of commissioning a household survey in 2015 to update the mobility study, early completion of the survey is important in view of the escalating concerns over the reduced social mobility in recent months.
Father's earnings: HK$10,000 above average
HK$4,200 or 42% of father'sincome advantage would bepassed on to the son.
Inter‐generational income elasticity(1): 0.42
10
6.3 At present, the lack of new growth engines has restrained earnings growth and social mobility. There have been calls for Hong Kong to adopt an effective strategy to diversify and restructure its economy, for example, by (a) capitalizing on the global trend of technology and innovation16, (b) unleashing the potential of the creative industries, (c) investing in human capital17 and innovation18 for sustained productivity improvement, and (d) broadening the economic base that has relied heavily on the real estate and finance sectors for the past three decades. This may help create more higher‐paid and higher‐skilled job opportunities, thereby enhancing earnings and occupational mobility.
16 See, for example, Commission on Strategic Development (2013). 17 This includes the development of vocational‐oriented training catering for those students who do not prefer the
traditional academic route. According to the Commission on Strategic Development (2013), "the Government should revamp and strengthen the vocational training system by integrating it into the overall educational system and planning in Hong Kong in order to offer young people real choices and alternative paths to academic education in their school‐to‐work transition."
18 Innovation is a key driver for productivity growth that can be represented by the gross expenditure on research and development ("GERD") as a percentage of GDP. Hong Kong's GERD/GDP stood at 0.73% in 2012, lagging behind many other developed economies.
11
References
1. Bauhinia Foundation Research Centre. (2014) Level up! Let our youths reach for the sky. Available from: http://www.bauhinia.org/document/doc188cht.pdf [Accessed January 2015].
2. Brown, P. (2013) Education, opportunity and the prospects for social mobility. British Journal of Sociology of Education. Volume 34 (5‐6): 678‐700.
3. Census and Statistics Department. (2014) Population Census. Available from: http://www.censtatd.gov.hk/hkstat/sub/so170.jsp [Accessed January 2015].
4. Chou, K.L. (2013) Study by the Hong Kong Institute of Education – Widening disparity in higher education between the rich and the poor. Available from: http://www.ied.edu.hk/media/news.php?id=20130131&glang=tc [Accessed January 2015].
5. Commission on Strategic Development. (2013) Young People – Education, Employment and Development Opportunities. Available from: http://www.cpu.gov.hk/doc/en/commission_strategic_development/csd_1_2013e_without_Annex_F.pdf [Accessed January 2015].
6. Corak, M. (2013) Income inequality, equality of opportunity, and intergenerational Mobility. Available from: http://ftp.iza.org/dp7520.pdf [Accessed January 2015].
7. Hong Kong University of Science and Technology. (2010) Hong Kong's Post‐80s Generation: Profiles and Predicaments. Available from: http://www.cpu.gov.hk/doc/tc/research_reports/HK's%20Post%2080s%20Generation%20‐%20Profiles%20and%20Predicaments.pdf [Accessed January 2015].
8. Ip, C. & Chiu, S. (2013) The myth of income disparity in university education in Hong Kong and The riddle of disappearance of overseas students. Economic Journal. 11‐12 March 2013. [Accessed January 2015].
9. Organisation for Economic Co‐operation and Development. (2010) A family affair: Intergenerational social mobility across OECD countries. Available from: http://www.oecd.org/eco/growth/chapter%205%20gfg%202010.pdf [Accessed January 2015].
10. Rating and Valuation Department. (2014) Hong Kong Property Review. Available from: http://www.rvd.gov.hk/en/publications/hkpr_previous.html [Accessed January 2015].
11. Siu, A. & Wong R. (2007) The Asian financial crisis, deflation and structural change in Hong Kong. Available from: http://www.wangyujian.com/papers/chapters/21_The_Asian_Financial%20Crisis_Deflation_and_structural_change_in_HK.pdf [Accessed January 2015].
12
12. Steering Committee on Population Policy. (2014) Consultation Document: Thoughts for Hong Kong. Available from: http://www.hkpopulation.gov.hk/en/ [Accessed January 2015].
13. Torche, F. (2013) How do we characteristically measure and analyze intergenerational mobility? Available from: http://web.stanford.edu/group/scspi/_media/working_papers/torche_how‐do‐we‐measure.pdf [Accessed January 2015].
14. Tsang, S. (2007) The Hong Kong economy under asymmetric integration: structural transformation or dissolution. Available from http://www.sktsang.com/ArchiveIII/Tsang‐asymmetry‐2007.pdf [Accessed January 2015].
15. UK Department for Business, Innovation & Skills. (2011) Social Mobility: A Literature Survey. Available from: https://www.gov.uk/government/uploads/system/uploads/attachment_data/file/32111/11‐750‐social‐mobility‐literature‐review.pdf [Accessed January 2015].
16. UK Department for Business, Innovation & Skills. (2013) Improving social mobility to create a fairer society. Available from: https://www.gov.uk/government/policies/improving‐social‐mobility‐to‐create‐a‐fairer‐society [Accessed January 2015].
17. Vere, J. (2010) Special topic enquiry on earnings mobility. Available from: http://www.lwb.gov.hk/chi/other_info/Special%20Topic%20Enquiry%20on%20Earnings%20Mobility.pdf [Accessed January 2015].
18. Xue, J. (ed.) (2013) Growth with Inequality: An International Comparison on Income Distribution. Singapore, Scientific Publishing Co. Pte. Ltd.
19. 趙永佳、葉仲茵:《青年「下流」問題的虛與實》,《明報》,2014年 12月 5日。
Research Office Information Services Division Legislative Council Secretariat 12 January 2015 Tel: 2871 2110 ‐‐‐‐‐‐‐‐‐‐‐‐‐‐‐‐‐‐‐‐‐‐‐‐‐‐‐‐‐‐‐‐‐‐‐‐‐‐‐‐‐‐‐‐‐‐‐‐‐‐‐‐‐‐‐‐‐‐‐‐‐‐‐‐‐‐‐‐‐‐‐‐‐‐‐‐‐‐‐‐‐‐‐‐‐‐‐‐‐‐‐‐‐‐‐‐‐‐‐‐‐‐‐‐‐‐‐‐‐‐‐‐‐‐‐‐‐‐‐‐‐‐‐‐‐‐‐‐‐‐‐‐‐‐‐‐‐‐‐‐‐‐‐‐‐‐‐‐‐‐‐‐‐‐‐‐‐‐‐‐‐‐‐‐‐‐‐‐‐‐‐‐‐‐ Research Briefs are compiled for Members and Committees of the Legislative Council. They are not legal or other professional advice and shall not be relied on as such. Research Briefs are subject to copyright owned by The Legislative Council Commission (The Commission). The Commission permits accurate reproduction of Research Briefs for non‐commercial use in a manner not adversely affecting the Legislative Council, provided that acknowledgement is made stating the Research Office of the Legislative Council Secretariat as the source and one copy of the reproduction is sent to the Legislative Council Library. The paper number of this issue of Research Brief is RB02/14‐15.