Embed Size (px)
Citation preview
WORKING EFFECTIVELY WITH TODAY’S APPRAISERS
December 19, 2013Oscar WeiSenior Research Analyst
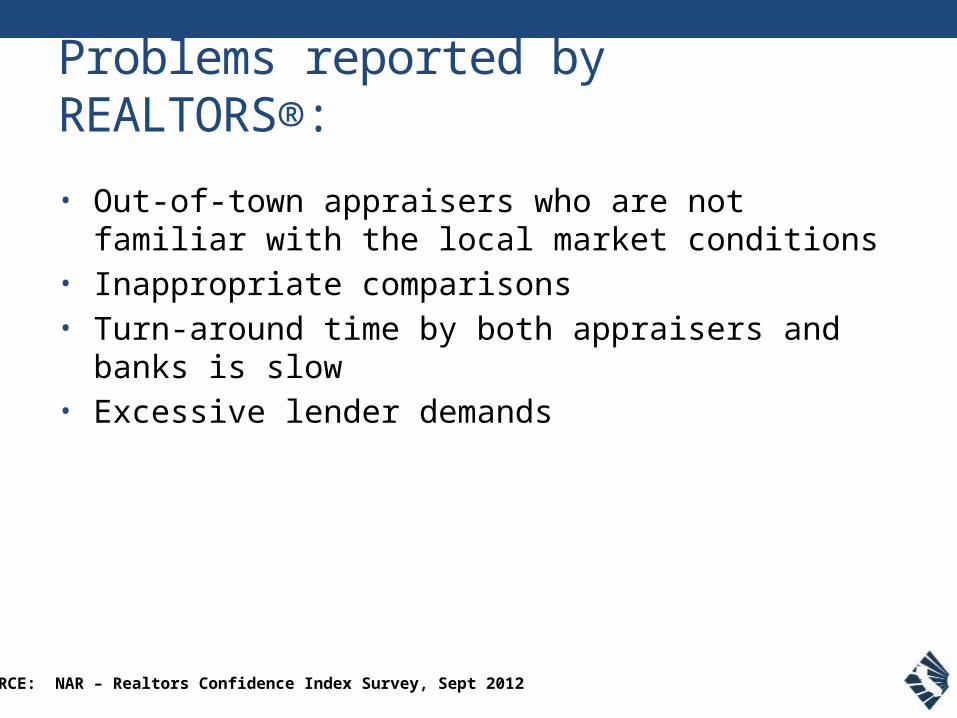
Problems reported by REALTORS®:
• Out-of-town appraisers who are not familiar with the local market conditions
• Inappropriate comparisons• Turn-around time by both appraisers and banks is
slow• Excessive lender demands
SOURCE: NAR – Realtors Confidence Index Survey, Sept 2012
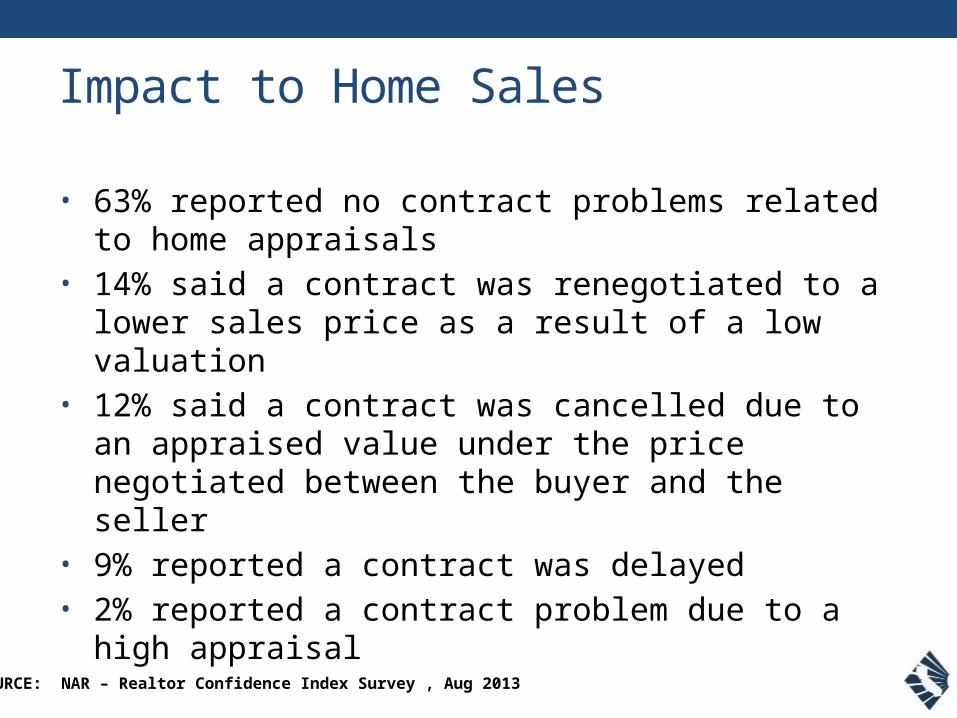
Impact to Home Sales
• 63% reported no contract problems related to home appraisals
• 14% said a contract was renegotiated to a lower sales price as a result of a low valuation
• 12% said a contract was cancelled due to an appraised value under the price negotiated between the buyer and the seller
• 9% reported a contract was delayed• 2% reported a contract problem due to a high
appraisal
SOURCE: NAR – Realtor Confidence Index Survey , Aug 2013
Survey Methodology
801 online surveys conducted in August 2013
Respondents: REALTORS® who closed a real estate transaction between August 2012 and August 2013
Sample error: 3.3% at 95% confidence interval
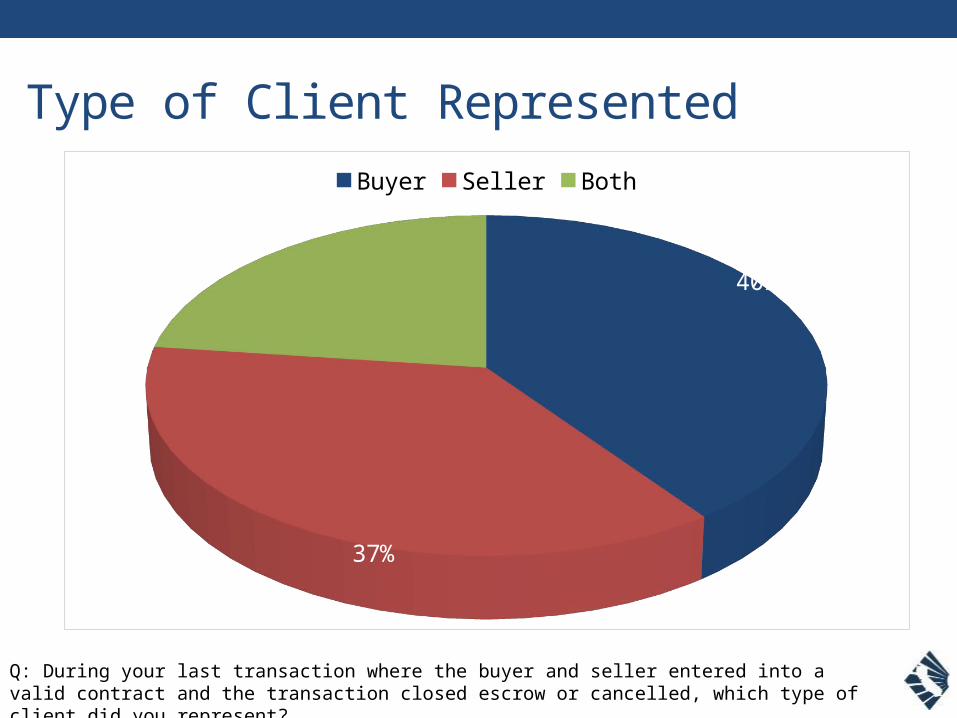
Type of Client Represented
Q: During your last transaction where the buyer and seller entered into a valid contract and the transaction closed escrow or cancelled, which type of client did you represent?
40%
37%
23%Buyer Seller Both
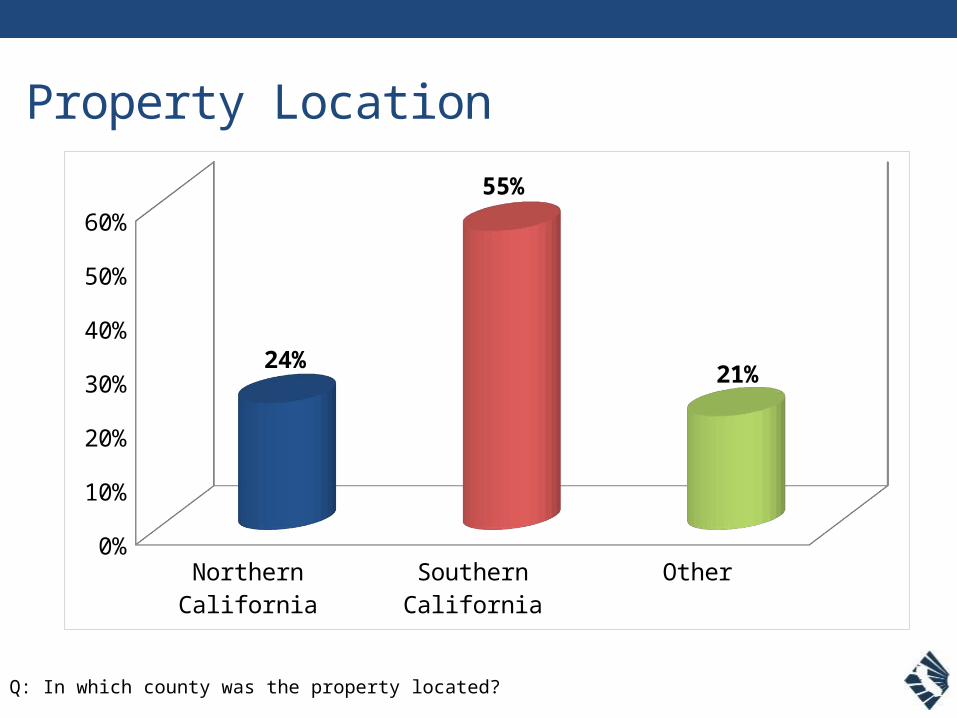
Property Location
Q: In which county was the property located?
North
ern
Califo
rnia
Sout
hern
Cal
iforn
ia
Other
0%10%20%30%40%50%60%
24%
55%
21%
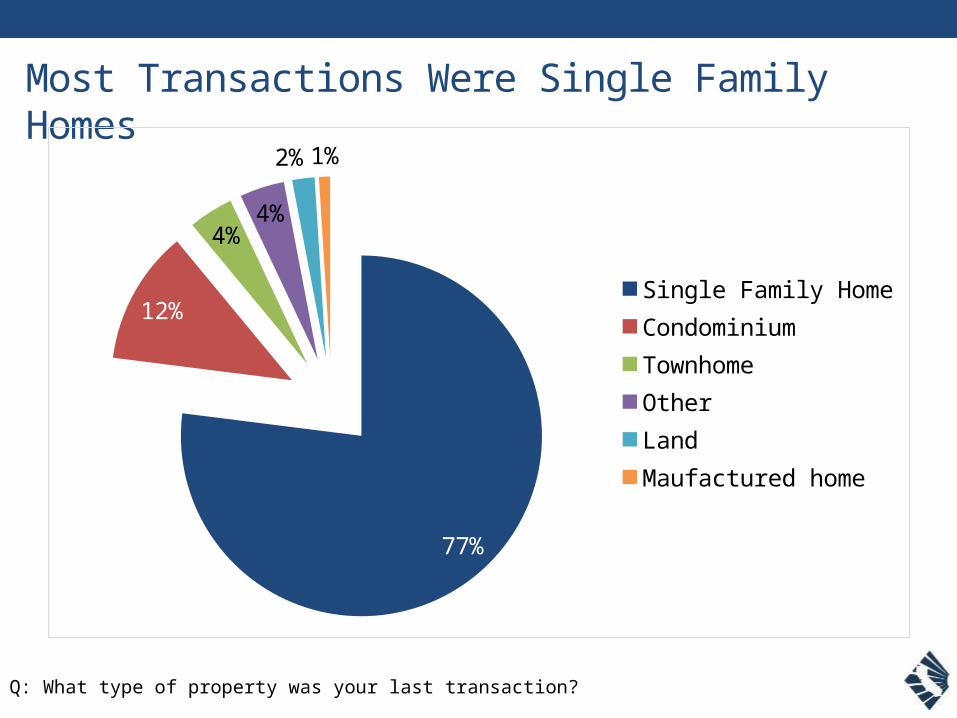
Most Transactions Were Single Family Homes
Q: What type of property was your last transaction?
77%
12%
4%
4% 2%1%
Single Family HomeCondominiumTownhomeOtherLand Maufactured home
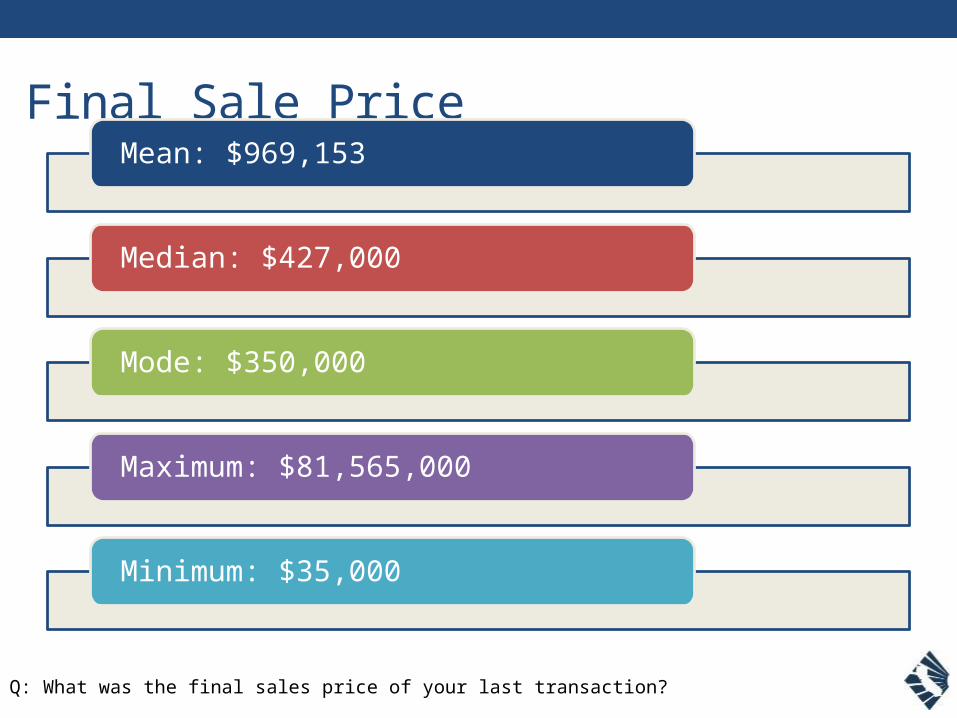
Final Sale Price
Q: What was the final sales price of your last transaction?
Mean: $969,153
Median: $427,000
Mode: $350,000
Maximum: $81,565,000
Minimum: $35,000
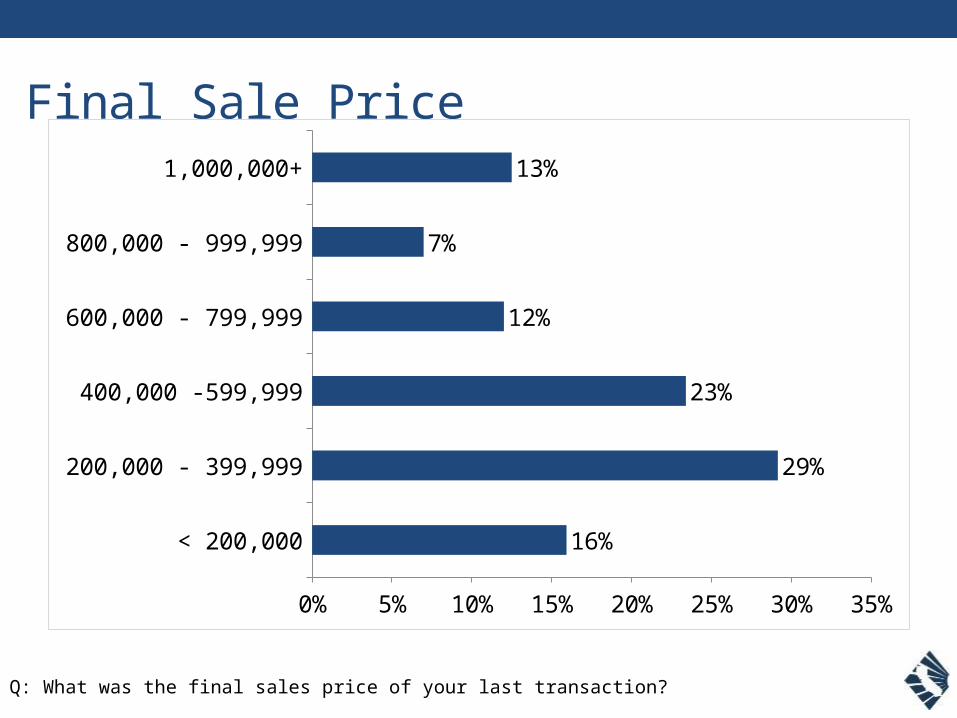
Final Sale Price
Q: What was the final sales price of your last transaction?
< 200,000
200,000 - 399,999
400,000 -599,999
600,000 - 799,999
800,000 - 999,999
1,000,000+
0% 5% 10% 15% 20% 25% 30% 35%
16%
29%
23%
12%
7%
13%
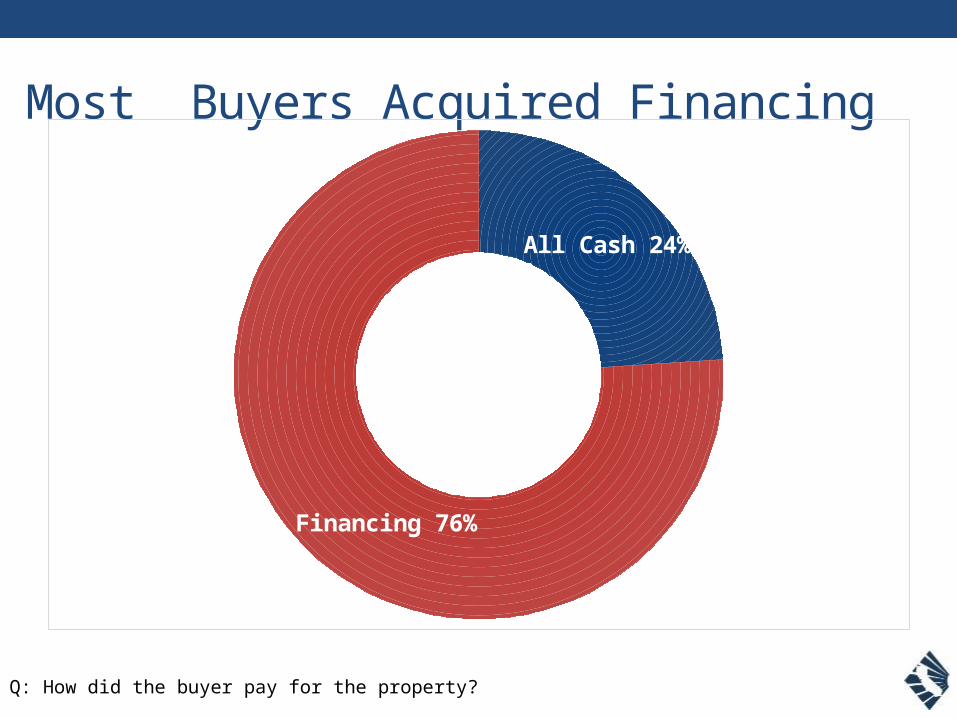
Most Buyers Acquired Financing
Q: How did the buyer pay for the property?
All Cash 24%
Financing 76%
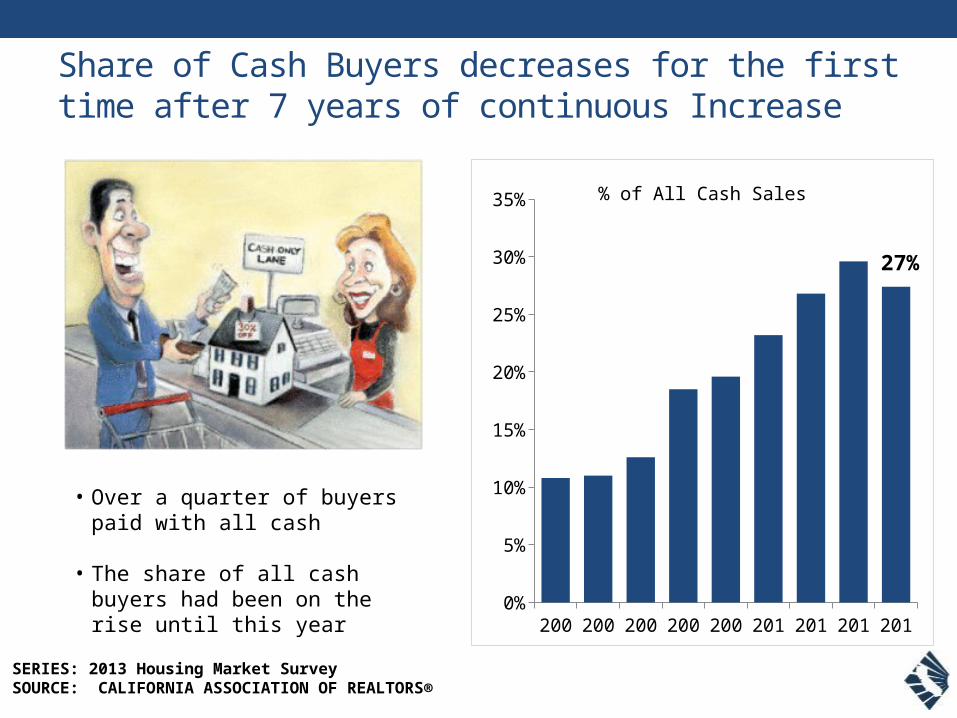
Share of Cash Buyers decreases for the first time after 7 years of continuous Increase
0%
5%
10%
15%
20%
25%
30%
35%
27%
% of All Cash Sales
• Over a quarter of buyers paid with all cash
• The share of all cash buyers had been on the rise until this year
SERIES: 2013 Housing Market SurveySOURCE: CALIFORNIA ASSOCIATION OF REALTORS®
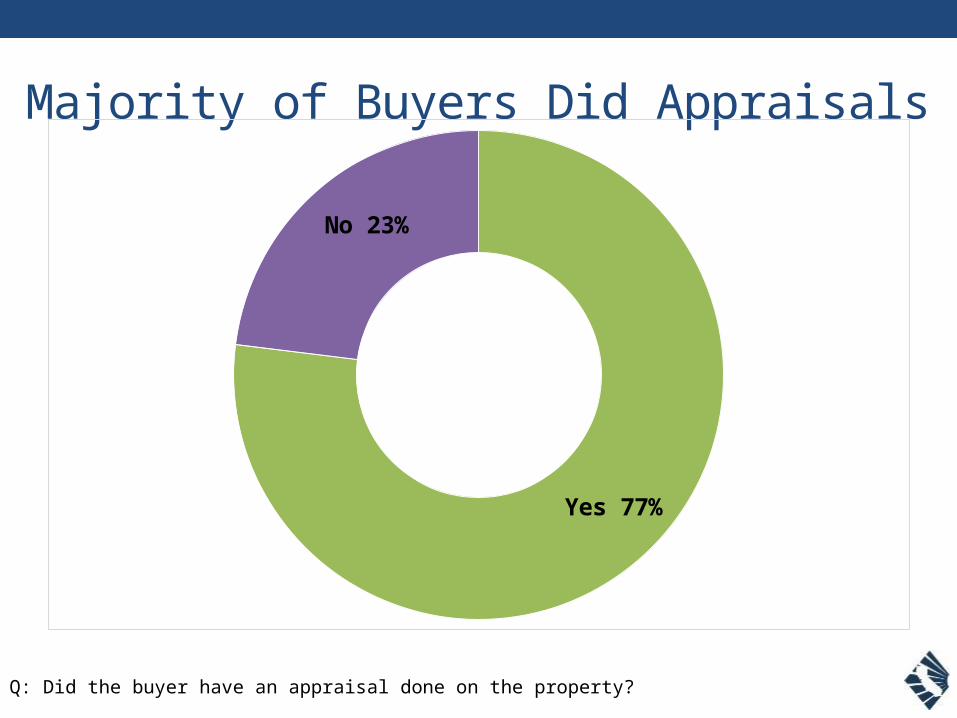
Majority of Buyers Did Appraisals
Q: Did the buyer have an appraisal done on the property?
Yes 77%
No 23%
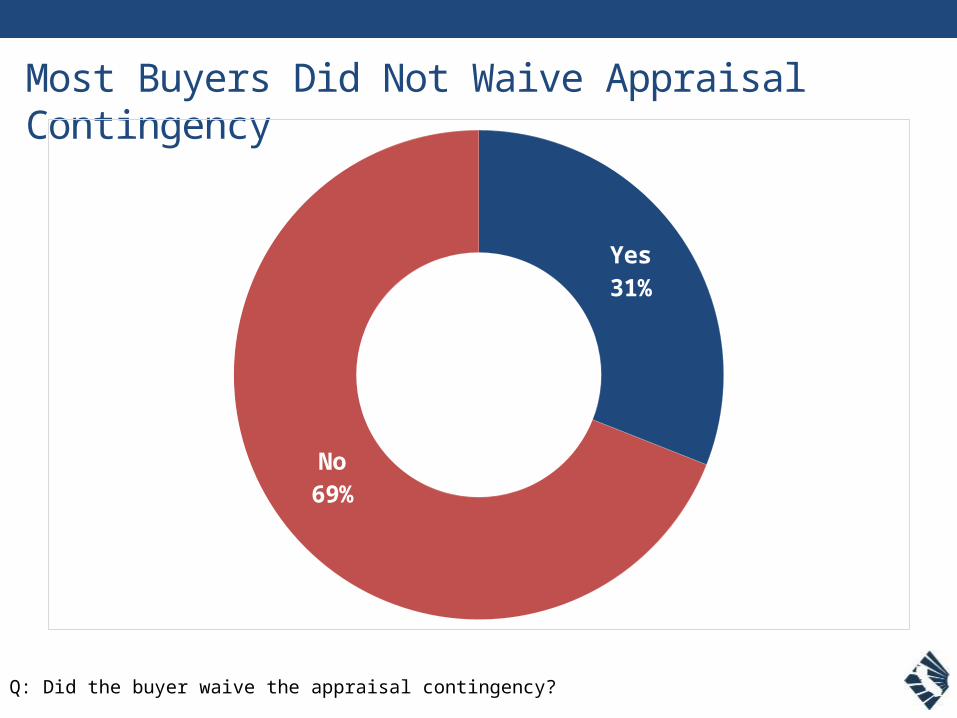
Most Buyers Did Not Waive Appraisal Contingency
Q: Did the buyer waive the appraisal contingency?
Yes31%
No69%
THE APPRAISAL
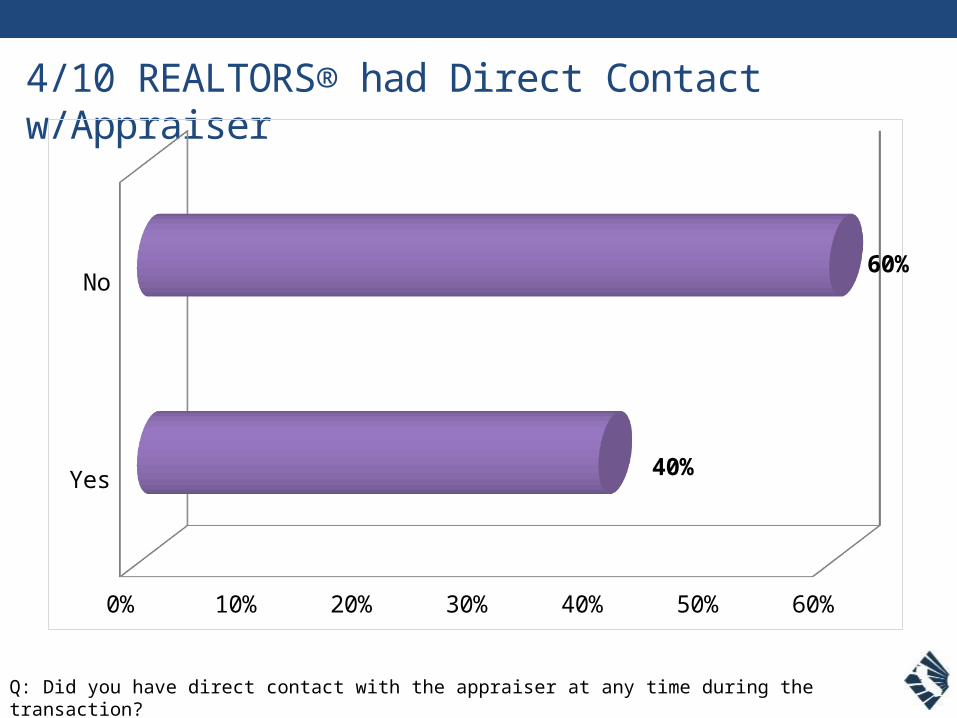
4/10 REALTORS® had Direct Contact w/Appraiser
Q: Did you have direct contact with the appraiser at any time during the transaction?
Yes
No
0% 10% 20% 30% 40% 50% 60%
40%
60%
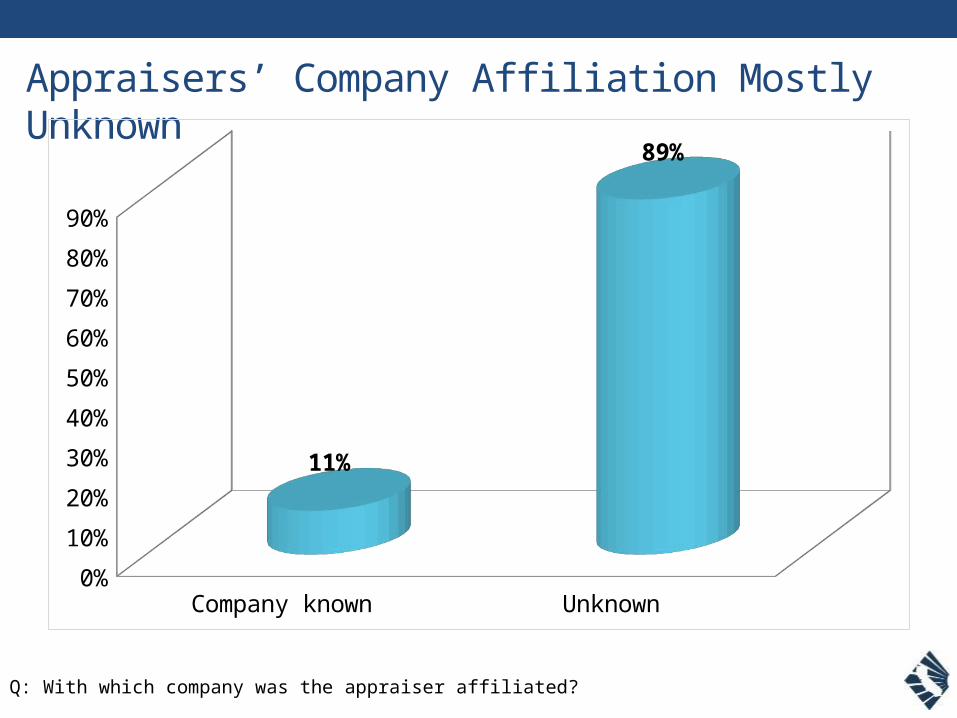
Appraisers’ Company Affiliation Mostly Unknown
Q: With which company was the appraiser affiliated?
Company known Unknown0%
10%
20%
30%
40%
50%
60%
70%
80%
90%
11%
89%
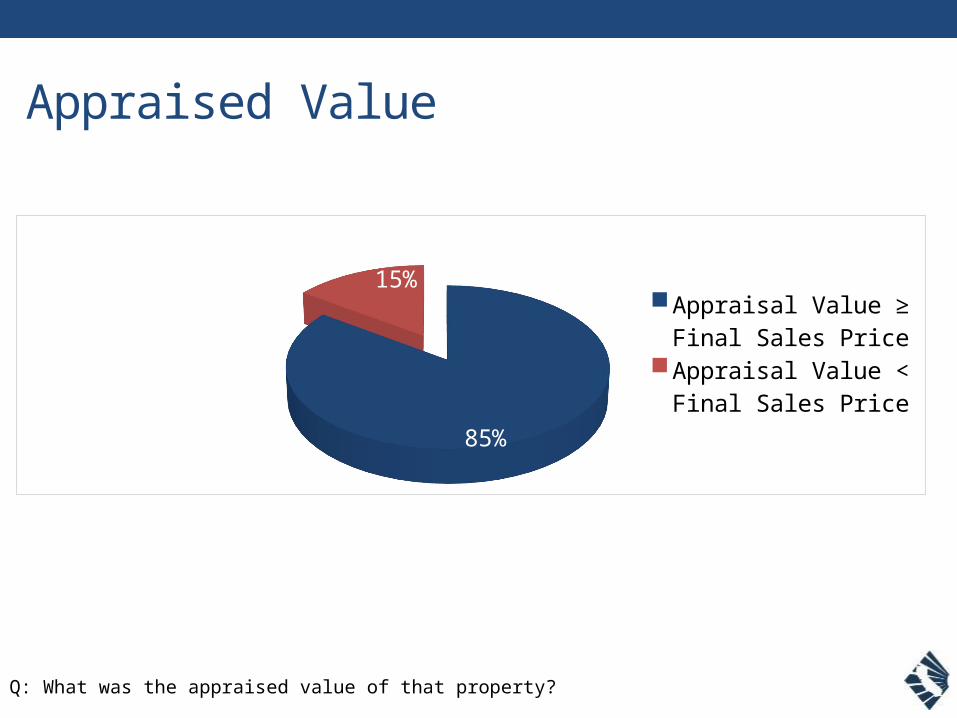
Appraised Value
Q: What was the appraised value of that property?
85%
15%Appraisal Value ≥ Final Sales PriceAppraisal Value < Final Sales Price
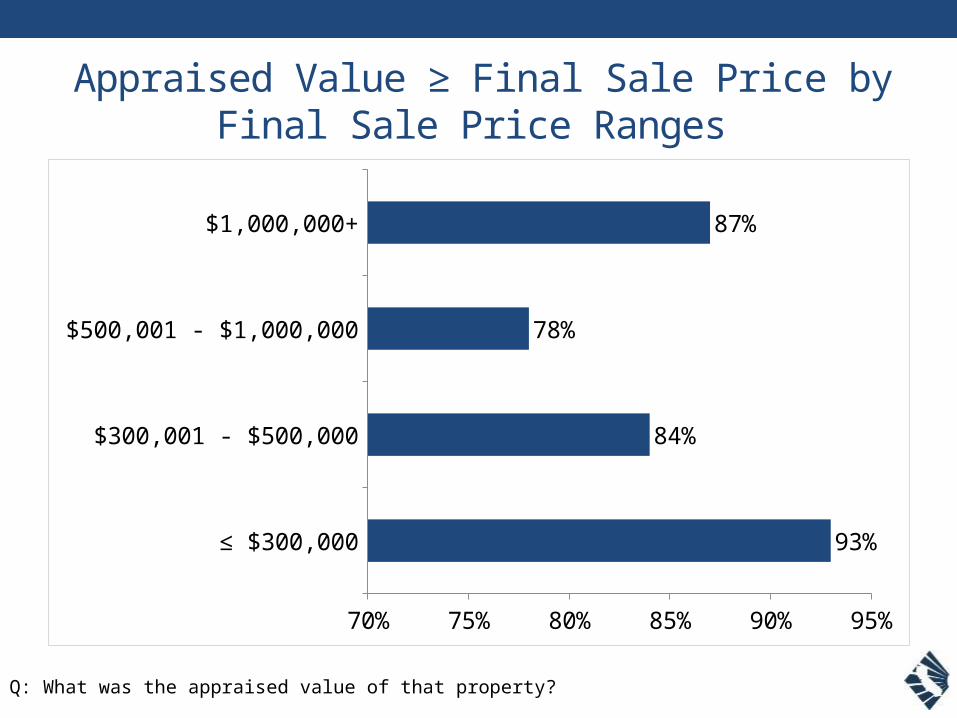
Appraised Value ≥ Final Sale Price by Final Sale Price Ranges
Q: What was the appraised value of that property?
≤ $300,000
$300,001 - $500,000
$500,001 - $1,000,000
$1,000,000+
70% 75% 80% 85% 90% 95%
93%
84%
78%
87%
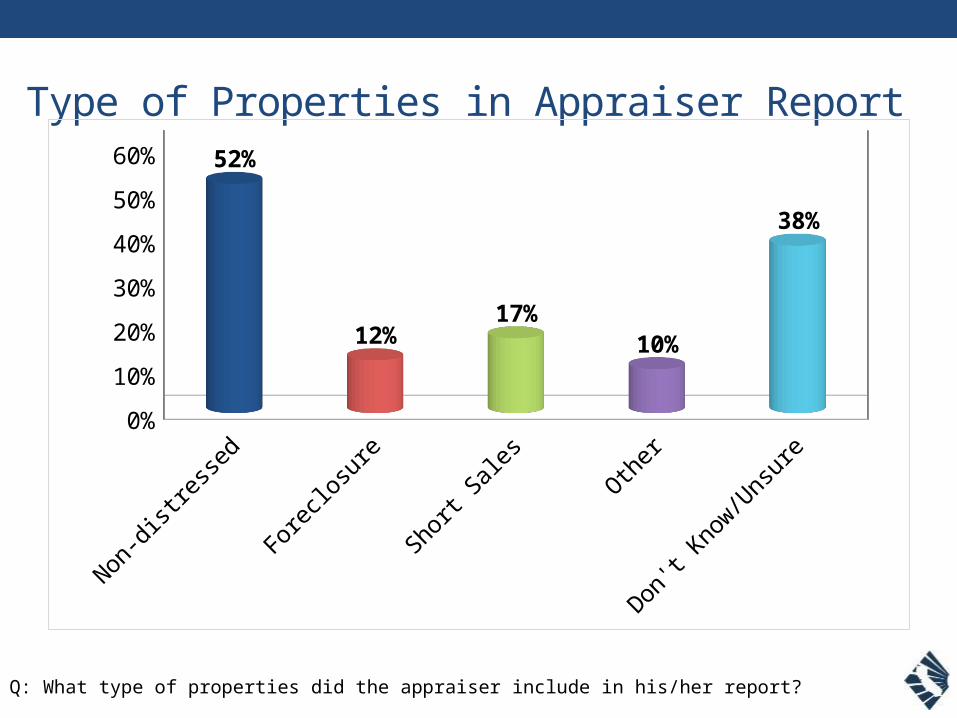
Type of Properties in Appraiser Report
Q: What type of properties did the appraiser include in his/her report?
Non-d
istre
ssed
Fore
clos
ure
Shor
t Sal
es
Other
Don't
Know
/Uns
ure
0%
10%
20%
30%
40%
50%
60% 52%
12%17%
10%
38%
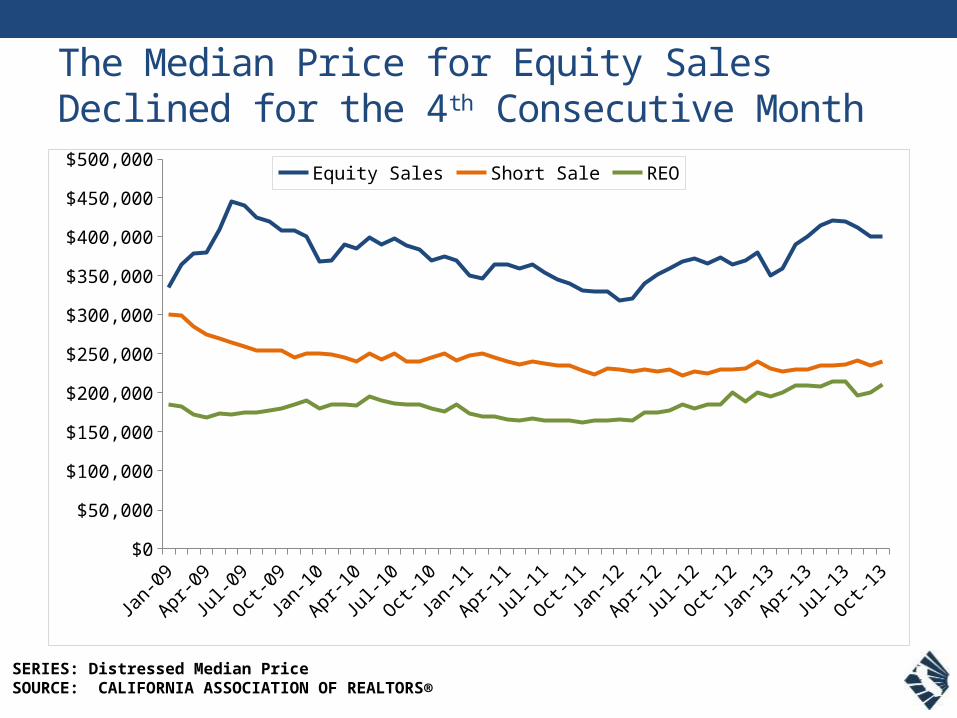
The Median Price for Equity Sales Declined for the 4th Consecutive Month
Jan-
09
Apr-0
9
Jul-0
9
Oct-0
9
Jan-
10
Apr-1
0
Jul-1
0
Oct-1
0
Jan-
11
Apr-1
1
Jul-1
1
Oct-1
1
Jan-
12
Apr-1
2
Jul-1
2
Oct-1
2
Jan-
13
Apr-1
3
Jul-1
3
Oct-1
3$0
$50,000
$100,000
$150,000
$200,000
$250,000
$300,000
$350,000
$400,000
$450,000
$500,000 Equity Sales Short Sale REO
SERIES: Distressed Median PriceSOURCE: CALIFORNIA ASSOCIATION OF REALTORS®
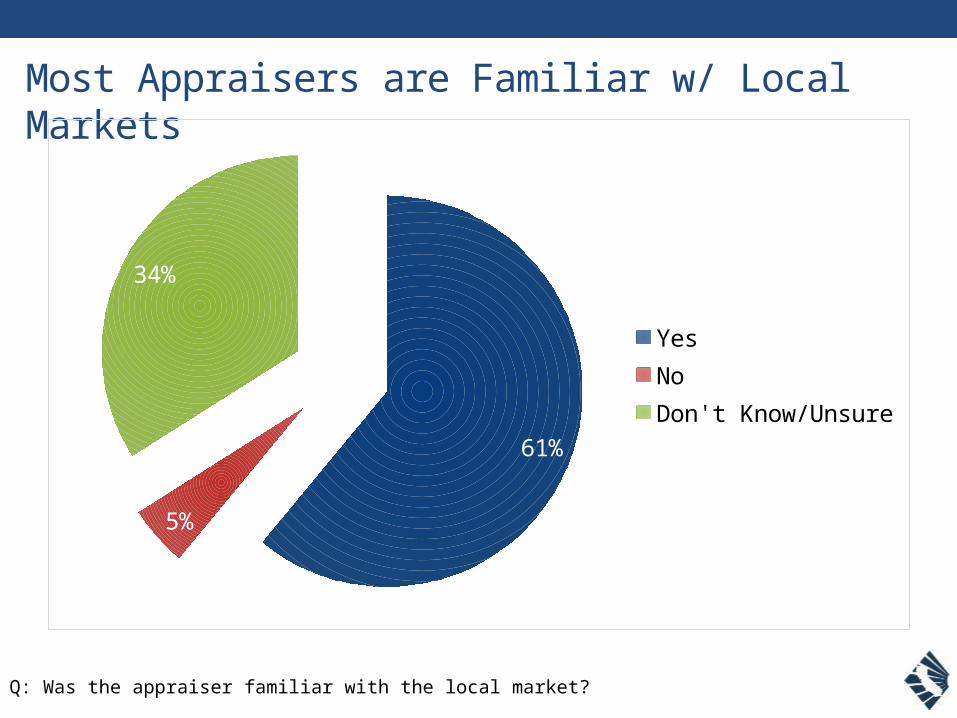
Most Appraisers are Familiar w/ Local Markets
Q: Was the appraiser familiar with the local market?
61%
5%
34%
YesNoDon't Know/Unsure
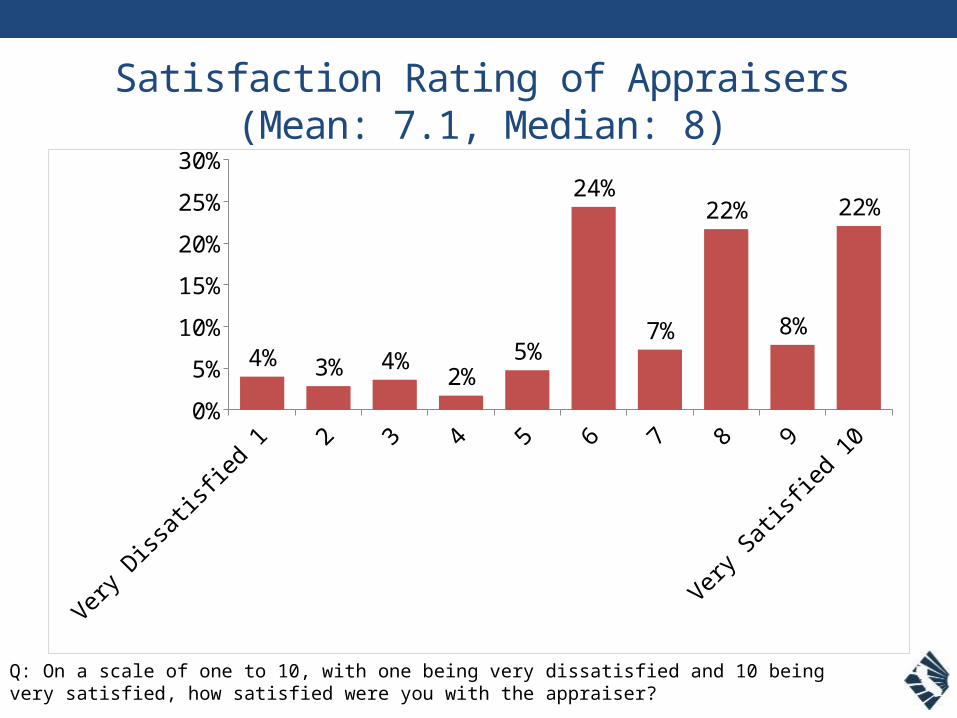
Satisfaction Rating of Appraisers(Mean: 7.1, Median: 8)
Q: On a scale of one to 10, with one being very dissatisfied and 10 being very satisfied, how satisfied were you with the appraiser?
Very
Dissa
tisfie
d 1 2 3 4 5 6 7 8 9
Very
Sat
isfie
d 10
0%
5%
10%
15%
20%
25%
30%
4% 3% 4%2%
5%
24%
7%
22%
8%
22%
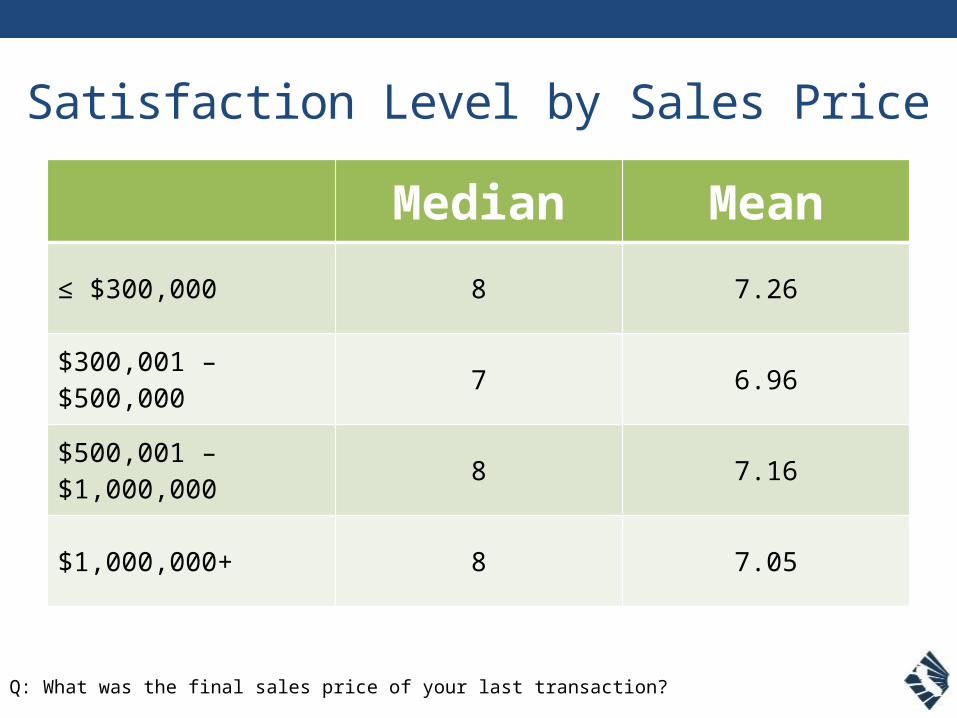
Satisfaction Level by Sales Price
Q: What was the final sales price of your last transaction?
Median Mean
≤ $300,000 8 7.26
$300,001 – $500,000 7 6.96
$500,001 – $1,000,000 8 7.16
$1,000,000+ 8 7.05
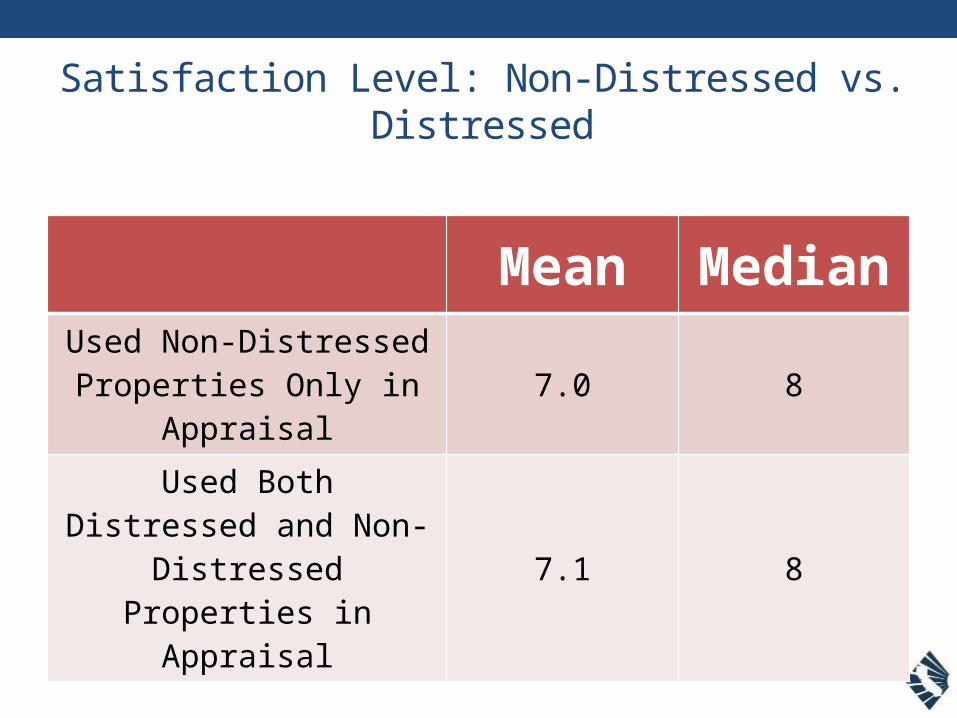
Satisfaction Level: Non-Distressed vs. Distressed
MeanMedia
nUsed Non-Distressed
Properties Only in Appraisal
7.0 8
Used Both Distressed and Non-Distressed
Properties in Appraisal7.1 8
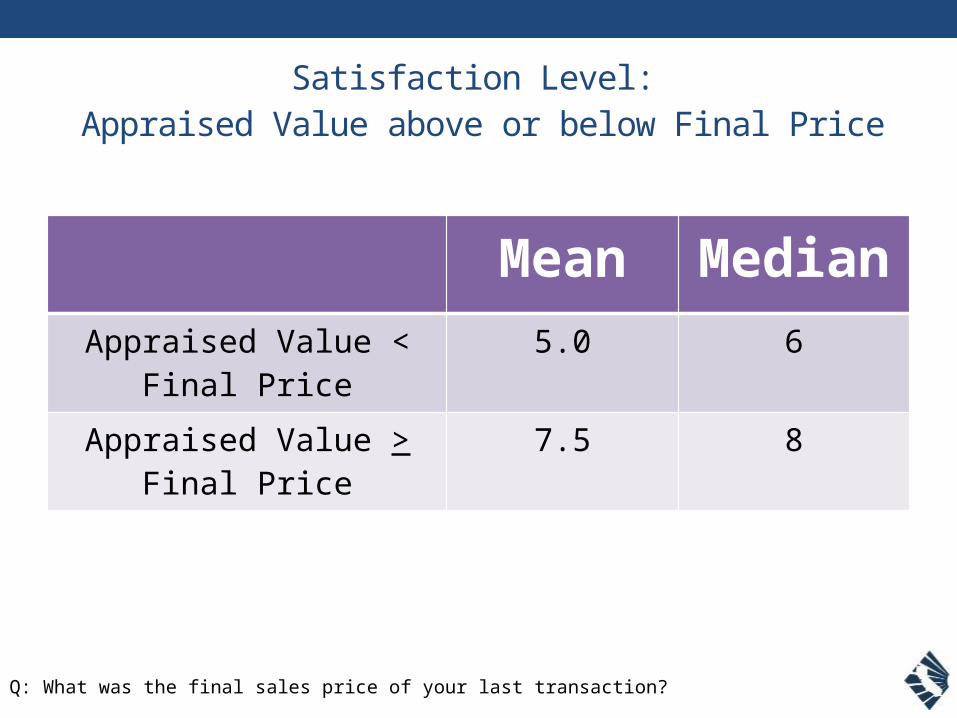
Satisfaction Level: Appraised Value above or below Final Price
Mean Median
Appraised Value < Final Price
5.0 6
Appraised Value > Final Price
7.5 8
Q: What was the final sales price of your last transaction?
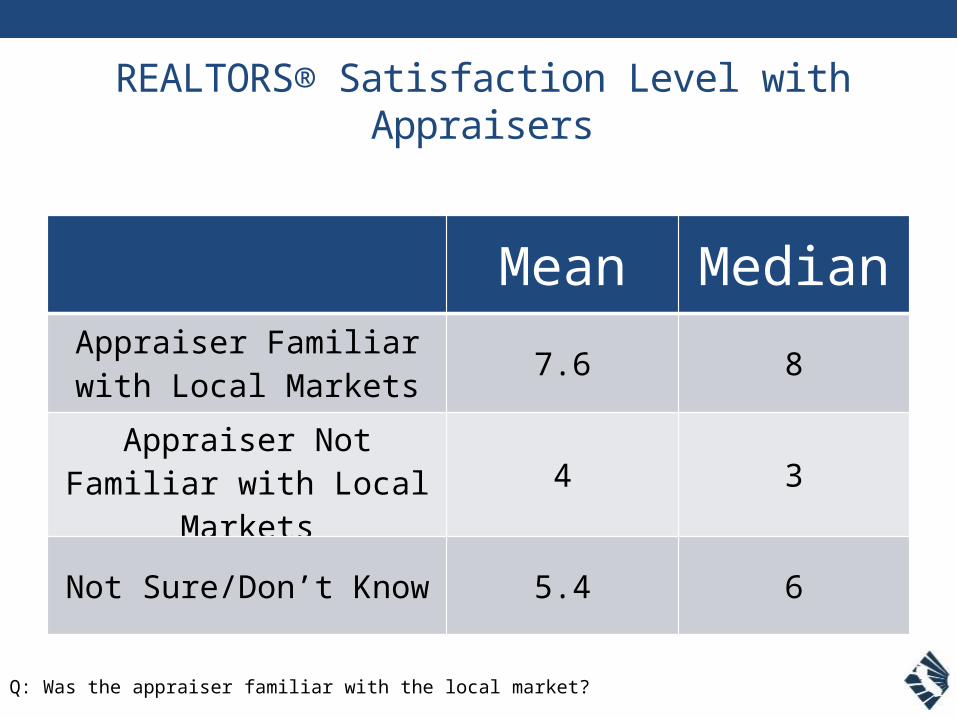
REALTORS® Satisfaction Level with Appraisers
Q: Was the appraiser familiar with the local market?
Mean MedianAppraiser Familiar with
Local Markets7.6 8
Appraiser Not Familiar with Local Markets
4 3
Not Sure/Don’t Know 5.4 6
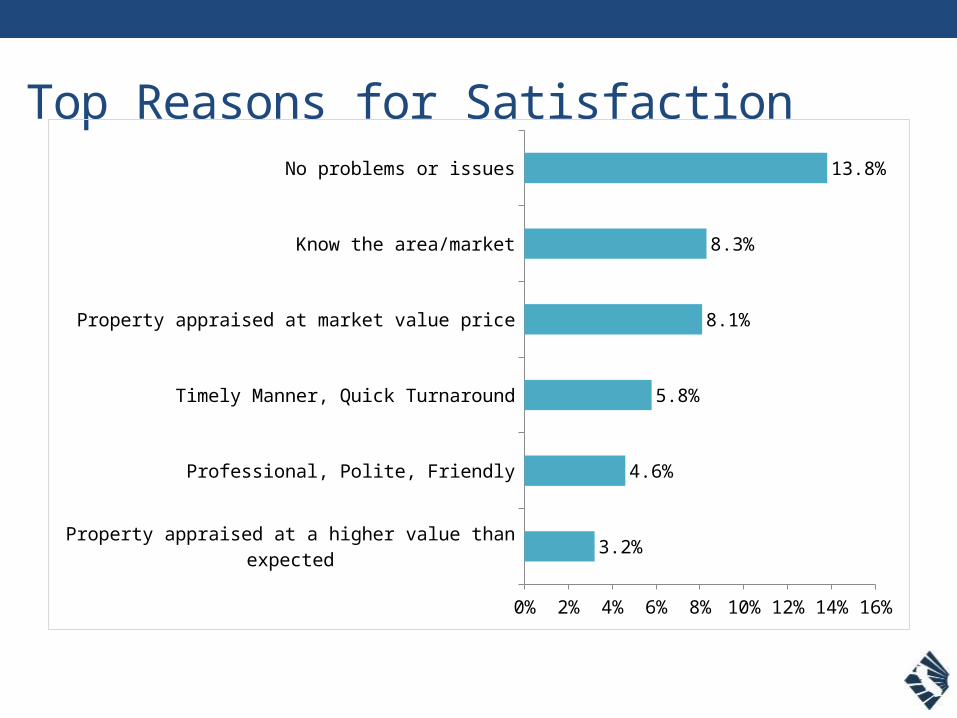
Top Reasons for Satisfaction
Property appraised at a higher value than expected
Professional, Polite, Friendly
Timely Manner, Quick Turnaround
Property appraised at market value price
Know the area/market
No problems or issues
0% 2% 4% 6% 8% 10%
12%
14%
16%
3.2%
4.6%
5.8%
8.1%
8.3%
13.8%
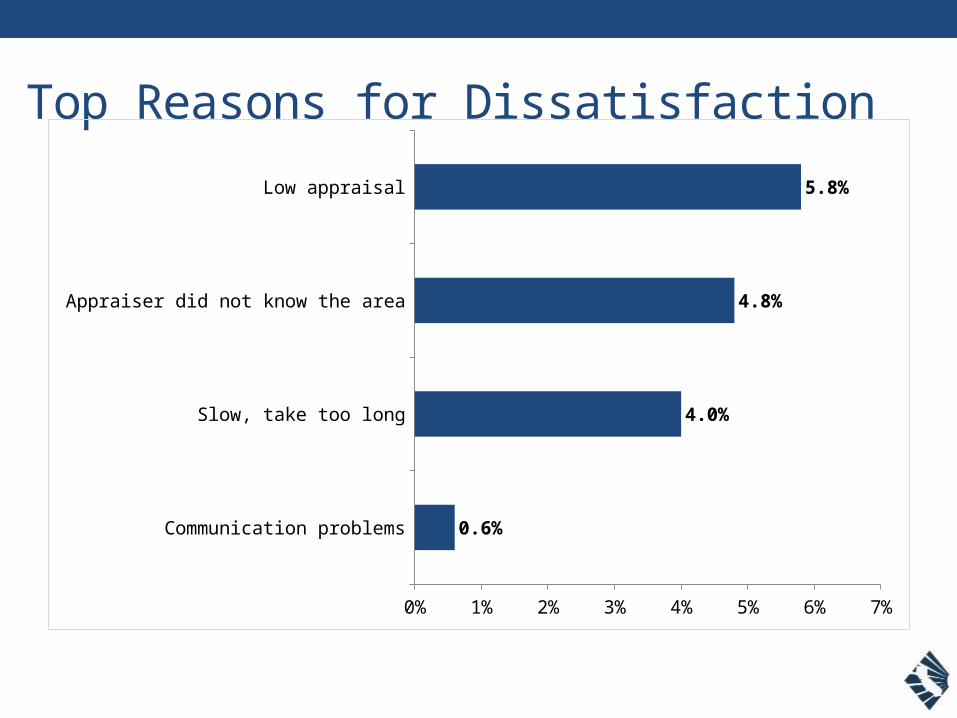
Top Reasons for Dissatisfaction
Communication problems
Slow, take too long
Appraiser did not know the area
Low appraisal
0% 1% 2% 3% 4% 5% 6% 7%
0.6%
4.0%
4.8%
5.8%

CLOSING REMARKS
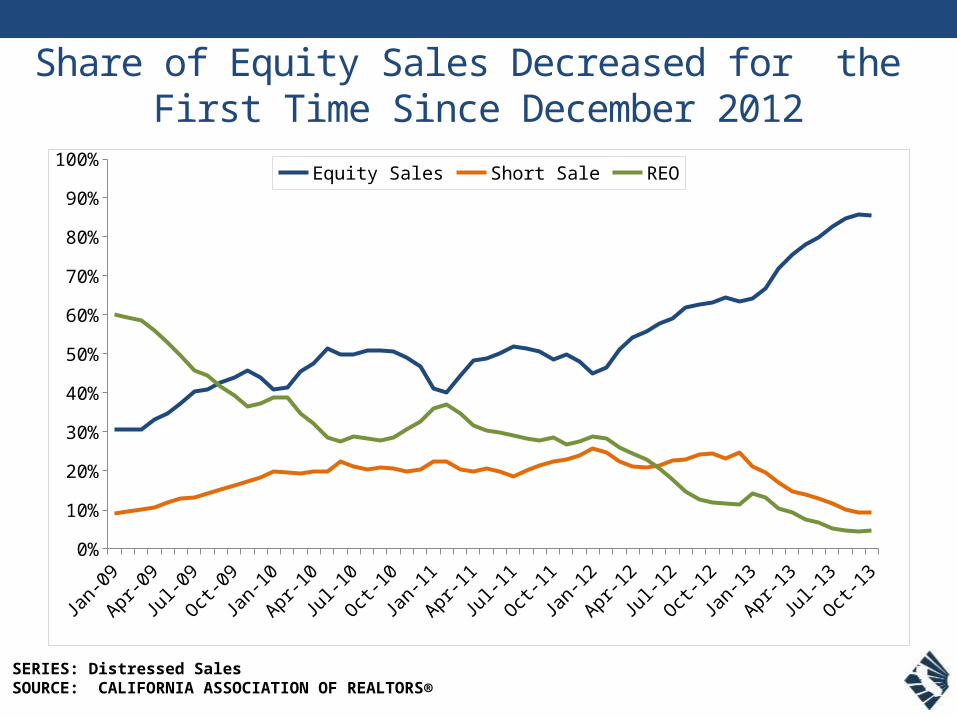
Share of Equity Sales Decreased for the First Time Since December 2012
Jan-
09
Apr-0
9
Jul-0
9
Oct-0
9
Jan-
10
Apr-1
0
Jul-1
0
Oct-1
0
Jan-
11
Apr-1
1
Jul-1
1
Oct-1
1
Jan-
12
Apr-1
2
Jul-1
2
Oct-1
2
Jan-
13
Apr-1
3
Jul-1
3
Oct-1
30%
10%
20%
30%
40%
50%
60%
70%
80%
90%
100% Equity Sales Short Sale REO
SERIES: Distressed SalesSOURCE: CALIFORNIA ASSOCIATION OF REALTORS®
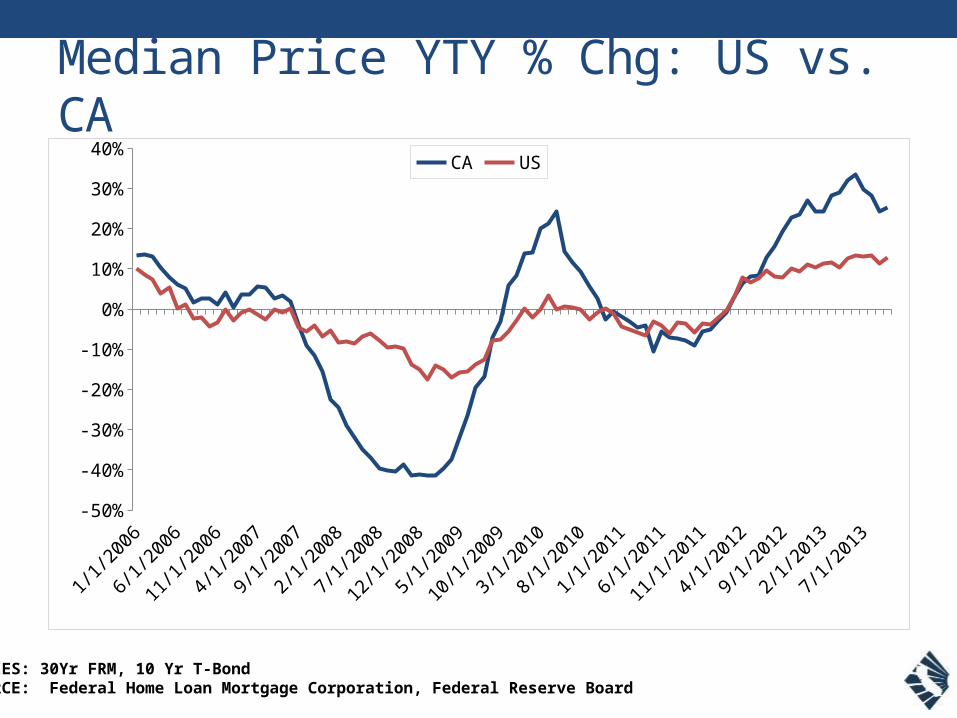
Median Price YTY % Chg: US vs. CA
Jan-
06
Jul-0
6
Jan-
07
Jul-0
7
Jan-
08
Jul-0
8
Jan-
09
Jul-0
9
Jan-
10
Jul-1
0
Jan-
11
Jul-1
1
Jan-
12
Jul-1
2
Jan-
13
Jul-1
3-50%
-40%
-30%
-20%
-10%
0%
10%
20%
30%
40% CA US
SERIES: 30Yr FRM, 10 Yr T-BondSOURCE: Federal Home Loan Mortgage Corporation, Federal Reserve Board
Issues with Home Appraisal Should Improve in 2014
• As more distressed properties are clear• Home prices continue to rise• Lending standards loosen up

“Understanding California’s Home Sellers”
Thursday, January 30, 20142:00 PM - 3:00 PM
To register:
http://tinyurl.com/SellerWeb
Join us for our next webinar…
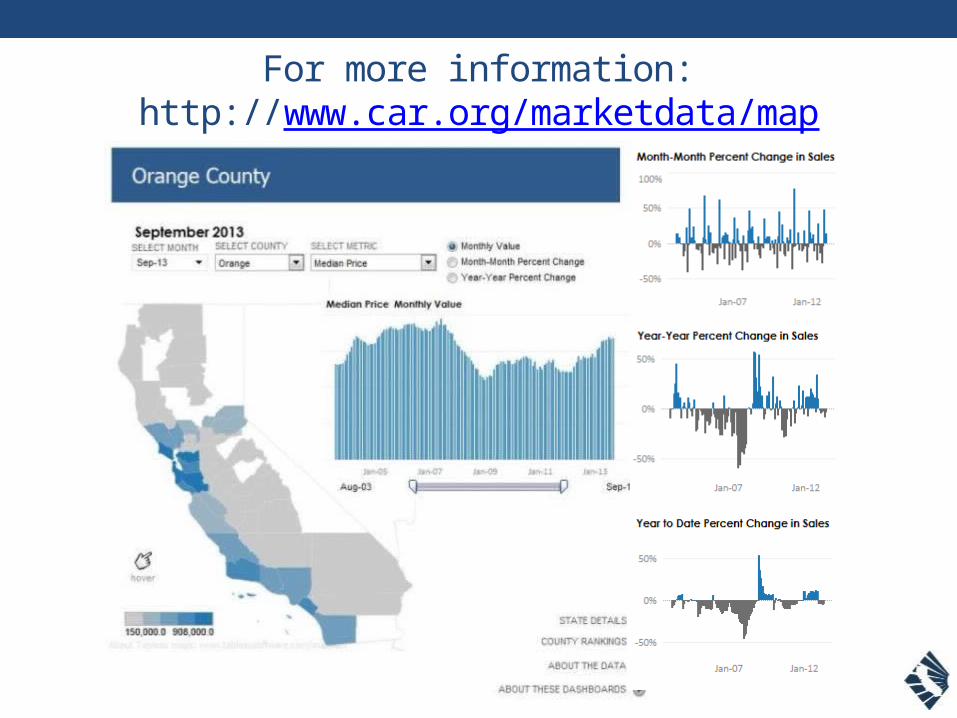
For more information:http://www.facebook.com/CARResearchGroup
For more information:http:// www.twitter.com/CARResearchInfo
C.A.R. Finance Helpline
Finance.car.org(213) 739-8383
Get one-on-one assistance with short sales, funding, REOs, Deeds in
Lieu, and closing transactions.
NEW
C.A.R.
Member
Benefit for
2013!