Embed Size (px)
Citation preview
“The Challenges of the Palestinian Economy in the Face of Political Pressure and the Repercussions of the Corona
Crisis”. The Third Conference of the Faculty of Economics and Social Sciences, An-Najah National University,
Sunday 11/4/2021
Working Capital Management and Firm Performance: The Case of Industrial
Corporations in Palestine
Islam Abdeljawad
Finance and Banking Department
An-Najah National University
Layth Dwaikat
Global United Insurance Company
and An-Najah National University
Abstract
This study aims to find the impact of working capital management on the financial performance
of industrial corporations in Palestine. We used a sample of 13 industrial firms that were listed
on the Palestine Securities Exchange for years 2002 to 2018. We used cash conversion cycle and
its components as independent variables and both return on assets and return on equity as
dependent variables. Moreover, since deferred checks are vital in commercial transactions in
Palestine, we tried to take into consideration the effect of including checks under collection and
deferred checks on performance. Eight panel econometric models were estimated. The study
found that the cash conversion cycle and firm size have a significant positive impact on the
profitability of industrial corporations, while leverage is significantly negative with profitability.
In addition, it was found that Palestinians firms maintain a sizable working capital which may be
due to a long cash conversion cycle (about nine months average) and to conservative policies due
to instable economic and political conditions. These findings are consistent with several previous
studies from other countries such as Jordan, Pakistan, India and Portugal.
Keywords: Working Capital, Cash Conversion Cycle, Return on Assets, Return on Equity,
Leverage.
1. Introduction Working capital management (WCM), the management of short term assets and liabilities, plays
an important role in the success of firms. If the company does not manage its working capital, it
may not meet its current obligations and reverting to external financing in this case may be
expensive. Most corporations have a huge amount of cash invested in working capital in addition
to partial financing of working capital by short-term debts (Uyar, 2009). Therefore, working
capital management is a very important component of firm’s financial management (Deloof,
2003). WCM focuses on managing current assets and liabilities and try to reach the optimal level
“The Challenges of the Palestinian Economy in the Face of Political Pressure and the Repercussions of the Corona
Crisis”. The Third Conference of the Faculty of Economics and Social Sciences, An-Najah National University,
Sunday 11/4/2021
2
of each component through managing cash, inventories, account receivables and payables
(Aregbeyen, 2013).
Working capital management has an important role in balancing between profitability and
liquidity risk and thus may affect the firm's value. Firms try, through WCM, to avoid failing on
debts and short term liabilities to avoid bankruptcy and getting out from the market. Profitability
is considered one of the vital goals that management try to achieve or else will stop. The ultimate
goal of the firm is to maximize shareholders wealth by increasing the value of their shares. This
can be achieved by generating high profits at a stated level of risk and taking into account its
ability to continue and expand and face future commitments (Deloof, 2003).
Even though much research about the impact of working capital management on firm’s
profitability and performance were undertaken, in both developed and developing countries
(Bieniasz, 2011), this study adds to the literature by examining the working capital management
and its impact on profitability in an extremely small underdeveloped markets. Specifically, it
examines the effect working capital management on Palestinian industrial firm’s performance.
This paper aims to study the impact of the annual cash conversion cycle and its components on
different financial performance indicators i.e. return on assets (ROA) and return on equity (ROE)
of industrial corporations operates in Palestine. The effect of the following WCM variables is
investigated: the annual cash conversion cycle, average collection period, inventory turnover,
average payment period. Moreover, since, checks are used to collect and pay amounts and dues
in Palestine, and these checks are used as credit instrument that due in the future i.e. they express
receivables or payables rather than cash. This study took into account these checks when
calculating cash conversion cycle and estimated all models with and without these checks.
A sample of 13 Palestinian industrial firms has been chosen. The data covers 17-years period
from 2002 to 2018 of companies listed on the Palestinian Security Exchange (PSE).
The industrial sector is one of the pillars of the Palestinian economy due to its multiple and
prominent contributions to the economic and social development, Despite the obstacles facing
the industrial sector, it has thrived recently and has positively impact the Palestinian exports. It is
the second largest sector in Palestine after services sector and represents 13.5% out of all firms in
Palestine and has a growth rate of 5% approximately. It also contributes 13% to the GDP. By the
end of 2018 the number of industrial corporations listed on PSE was 13. The sector has grown
rapidly during the twenty-first century and it is considered a major source for employment and
economic growth. So finding the impact of working capital management on the profitability of
Palestinian industrial sector is important for the firms to be able to understand the effect of WCM
on profitability and its value. It is helpful to both firms’ managers and economic policy makers.
The rest of this paper is structured as follows. Section 2 reviews previous theoretical and
empirical studies that deal with working capital management and financial performance. Section
“The Challenges of the Palestinian Economy in the Face of Political Pressure and the Repercussions of the Corona
Crisis”. The Third Conference of the Faculty of Economics and Social Sciences, An-Najah National University,
Sunday 11/4/2021
3
3 provides the research methodology, including the data, variables, and empirical models used to
complete this study. Section 4 and 5 provides the results and discussions for the impact of
working capital management on the financial performance of industrial corporations in Palestine.
Lastly, section 6 concludes this study and provides policy guidelines and proposals for further
research.
2. Literature Review
Much previous research studied the impact of working capital management on the financial
performance and profitability. Deloof (2003) has investigated the relationship between working
capital management and corporate profitability for a sample of 1009 large Belgian non-financial
firms for a period of 5 years and used several measures of working capital management
including number of days of account receivables, account payables and inventory. The results
indicated that companies with less number of days of account receivables and inventory are more
profitable. Padachi (2006) examined the trends in working capital management and its impact on
firm’s performance for a sample of 58 small manufacturing firms for a period of 5 years and
found a strong relationship between working capital and profitability measured by return on
assets. Raheman and Nasr (2007) found that cash conversion cycle has a negative impact on
profitability which means less cash conversion cycle is associated with higher profitability by
studying this relationship on 94 firms listed in Karachi stock exchange for a period of 6 years.
Juan García and Martinez (2007) examined the empirical evidence about the effect of working
capital management on the profitability of small and medium sized firms in Spain for a sample of
8,872 SMEs for 7 years and demonstrated that higher profitability can be achieved by reducing
firm’s number of days of account receivables and inventories. Moreover, shortening the cash
conversion cycle also improves the firm’s profitability. Also, Ramachandran and Janakiraman
(2009) analyzed the relationship between working capital management efficiency and earnings
before interest and taxes of the paper industry in India and indicated that days of account payable
has a significant negative relationship with EBIT. Deploying payments to suppliers improves the
EBIT. In USA, Gill, Biger and Mathur (2010) found a significant relationship between the cash
conversion cycle and profitability measured by gross operating profit. They state that managers
can generate profits by handling the cash conversion cycle correctly and keeping accounts
receivables at an optimal level.
Bieniasz and Gołaś (2011) investigated the effect of working capital management on the food
industry enterprises profitability and found that firms with shorter working capital cycles have
relatively higher rates of profitability. Sharma and Kumar (2011) examined the impact of
working capital on profitability of Indian firms for a sample of 263 non-financial firms listed in
Bombay stock exchange from 2000 to 2009 and the results reveal that working capital
management has positive impact on profitability where number of days in inventory and number
“The Challenges of the Palestinian Economy in the Face of Political Pressure and the Repercussions of the Corona
Crisis”. The Third Conference of the Faculty of Economics and Social Sciences, An-Najah National University,
Sunday 11/4/2021
4
of days account of payables are negatively correlated with the profitability and number of days
of account receivables and cash conversion cycle as a whole exhibits a positive relationship with
corporate profitability.
Vural and Çetenak (2012) studied the effect of working capital management and profitability for
a sample of 75 manufacturing firms listed on Istanbul stock exchange market for 8 years period
and found that there is a negative relationship between account receivables in days, cash
conversion cycle and profitability where leverage was used as a control variable and has a
negative relationship with firm value and profitability. Abuzayed (2012) investigated the effect
of working capital management and firm’s performance in emerging markets in a case of Jordan
and found that profitability is affected positively with the cash conversion cycle for the firms
listed in Amman stock exchange. Wesley, Musiega, Douglas and Atika (2013) studied the
relationship between working capital and financial performance of manufacturing firms listed on
the Nairobi securities exchange with a sample of 20 companies for a period of 5 years and found
that working capital proxies and control variables are significant to performance.
Awad and Jayyar (2013) studied the directional effect of working capital management and
liquidity on profitability and vice versa and found that there is a bidirectional causal relationship
between working capital and profitability and confirms the necessity of future research about the
directional relationship of components of working capital management and profitability.
Aregbeyen (2013) investigated empirically the effects of working capital management on the
profitability of a sample of 48 large manufacturing firms listed in the Nigerian stock exchange
for the period of 1993 to 2005 and results indicated that the firms have been inefficient with
WCM and caused significant reductions in profitability and concludes that improving the
efficiency of WCM is essential. They recommended that firms should shorten account payable
period, account receivables and inventory turnover in days to reduce their CCC. Pais and Gama
(2015) aimed to provide empirical evidence on the effects of working capital management and
the profitability of SMEs Portuguese firms and indicated that reduction in the inventories held
and in the number of days that firms take to settle their commercial liabilities and to collect
payments from customers are associated to higher corporate profitability. Shah and Gujar (2018)
investigated the impact of working capital management on profitability of a pharmaceutical and
chemical firms listed on Karachi stock for a sample of 25 firms and found that cash conversion
cycle has a positive impact on the profitability excepts days sales outstanding which is
insignificantly related to return on assets. When using in return on equity results shows that all
variables have insignificant positive relationship except for days of inventory outstanding which
has insignificant negative impact on profitability.
Mahmood, Han, Mubeen and Shahzad (2019) evaluated the moderating effects of firm size and
leverage on the working capital finance and profitability relationship among Chinese firms
during 2000 to 2017 applying the generalized method of moments GMM technique. The results
“The Challenges of the Palestinian Economy in the Face of Political Pressure and the Repercussions of the Corona
Crisis”. The Third Conference of the Faculty of Economics and Social Sciences, An-Najah National University,
Sunday 11/4/2021
5
revealed that the break-even point of the working capital profitability relationship for all
subgroups (small, large, low leverage and high leverage firms) shifts when firms expand or
leverage level change.
3. Sample and Variables
3.1 Sample Data are collected manually from annual reports of industrial corporations downloaded from the
Palestine Stock Exchange website for the seventeen years period from 2002 to 2018 based on the
availability of data. The final data set is balanced panel data because the majority of the
observation was available every time period. The final data set is 183 firm-year observations.
3.2 Variables Description
3.2.1 The Dependent Variables
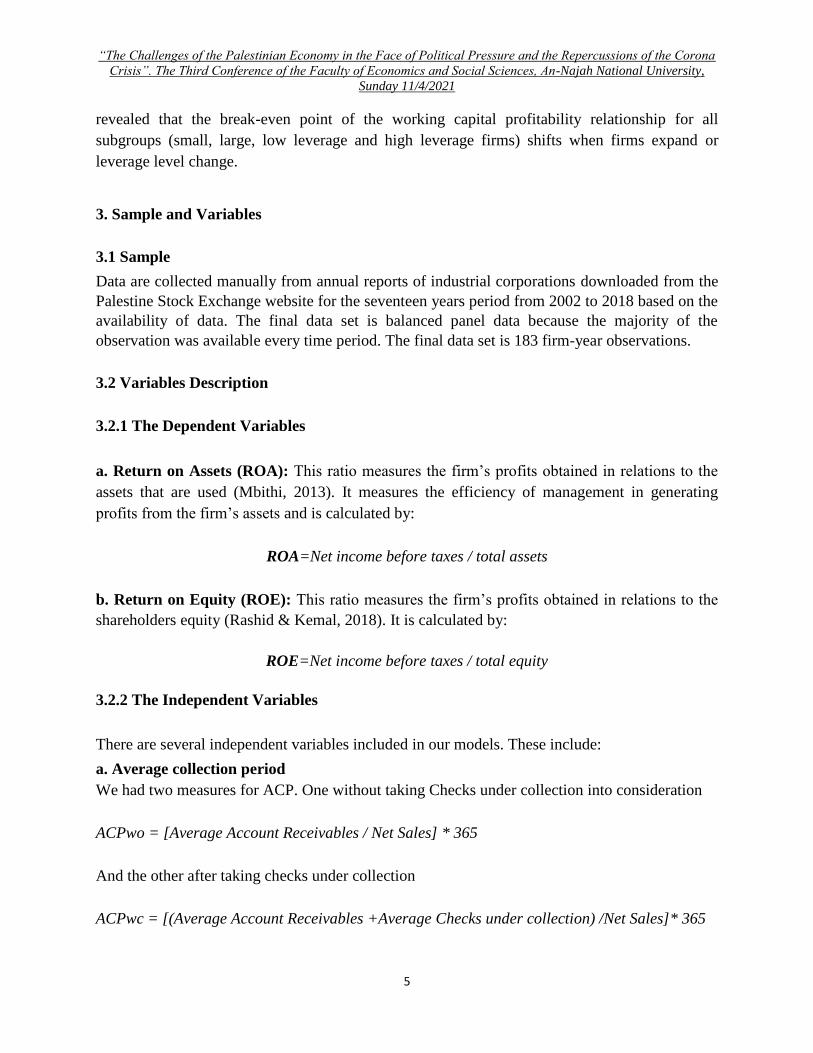
a. Return on Assets (ROA): This ratio measures the firm’s profits obtained in relations to the
assets that are used (Mbithi, 2013). It measures the efficiency of management in generating
profits from the firm’s assets and is calculated by:
ROA=Net income before taxes / total assets
b. Return on Equity (ROE): This ratio measures the firm’s profits obtained in relations to the
shareholders equity (Rashid & Kemal, 2018). It is calculated by:
ROE=Net income before taxes / total equity
3.2.2 The Independent Variables
There are several independent variables included in our models. These include: a. Average collection period
We had two measures for ACP. One without taking Checks under collection into consideration
ACPwo = [Average Account Receivables / Net Sales] * 365
And the other after taking checks under collection
ACPwc = [(Average Account Receivables +Average Checks under collection) /Net Sales]* 365
“The Challenges of the Palestinian Economy in the Face of Political Pressure and the Repercussions of the Corona
Crisis”. The Third Conference of the Faculty of Economics and Social Sciences, An-Najah National University,
Sunday 11/4/2021
6
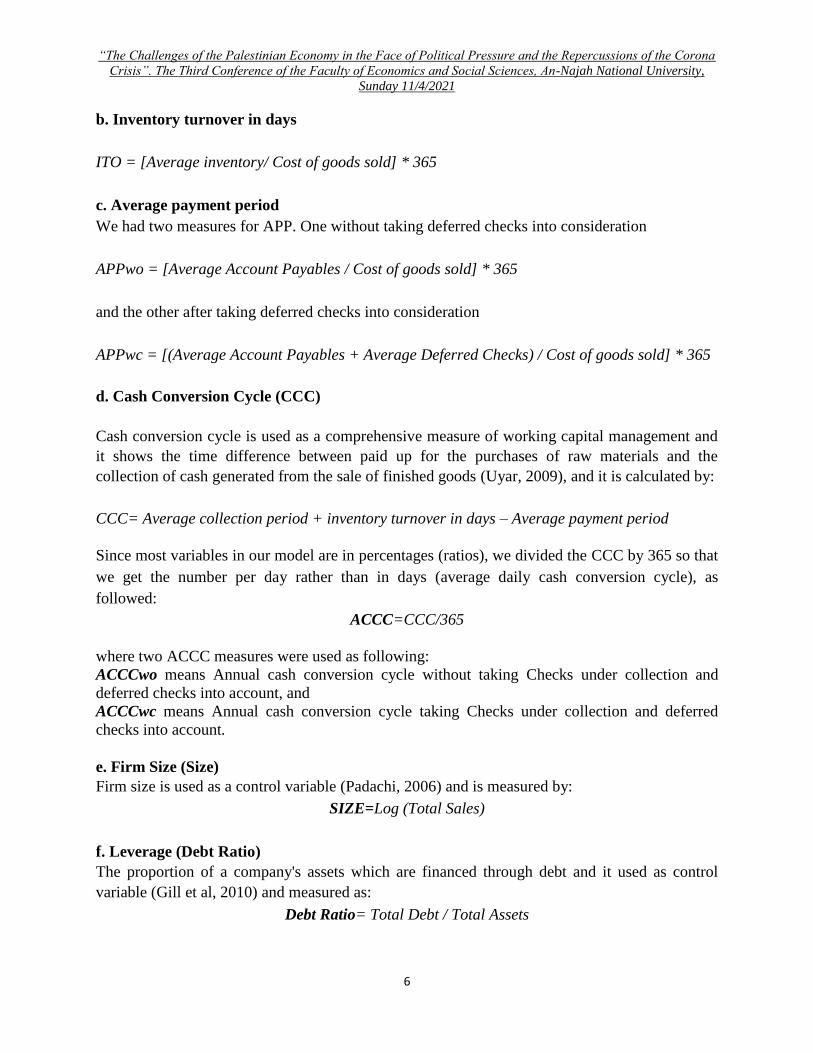
b. Inventory turnover in days
ITO = [Average inventory/ Cost of goods sold] * 365
c. Average payment period
We had two measures for APP. One without taking deferred checks into consideration
APPwo = [Average Account Payables / Cost of goods sold] * 365
and the other after taking deferred checks into consideration
APPwc = [(Average Account Payables + Average Deferred Checks) / Cost of goods sold] * 365
d. Cash Conversion Cycle (CCC)
Cash conversion cycle is used as a comprehensive measure of working capital management and
it shows the time difference between paid up for the purchases of raw materials and the
collection of cash generated from the sale of finished goods (Uyar, 2009), and it is calculated by:
CCC= Average collection period + inventory turnover in days – Average payment period
Since most variables in our model are in percentages (ratios), we divided the CCC by 365 so that
we get the number per day rather than in days (average daily cash conversion cycle), as
followed:
ACCC=CCC/365
where two ACCC measures were used as following:
ACCCwo means Annual cash conversion cycle without taking Checks under collection and
deferred checks into account, and
ACCCwc means Annual cash conversion cycle taking Checks under collection and deferred
checks into account.
e. Firm Size (Size)
Firm size is used as a control variable (Padachi, 2006) and is measured by: SIZE=Log (Total Sales)
f. Leverage (Debt Ratio)
The proportion of a company's assets which are financed through debt and it used as control
variable (Gill et al, 2010) and measured as:
Debt Ratio= Total Debt / Total Assets
“The Challenges of the Palestinian Economy in the Face of Political Pressure and the Repercussions of the Corona
Crisis”. The Third Conference of the Faculty of Economics and Social Sciences, An-Najah National University,
Sunday 11/4/2021
7
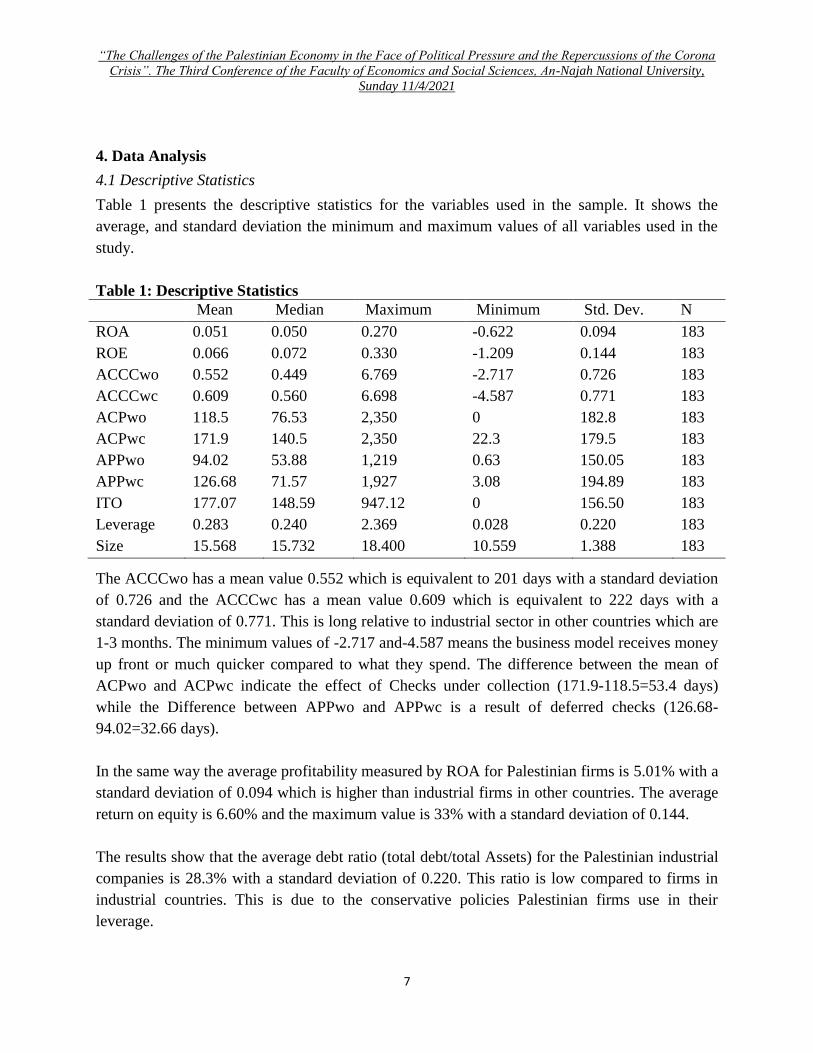
4. Data Analysis 4.1 Descriptive Statistics Table 1 presents the descriptive statistics for the variables used in the sample. It shows the
average, and standard deviation the minimum and maximum values of all variables used in the
study.
Table 1: Descriptive Statistics
Mean Median Maximum Minimum Std. Dev. N
ROA 0.051 0.050 0.270 -0.622 0.094 183
ROE 0.066 0.072 0.330 -1.209 0.144 183
ACCCwo 0.552 0.449 6.769 -2.717 0.726 183
ACCCwc 0.609 0.560 6.698 -4.587 0.771 183
ACPwo 118.5 76.53 2,350 0 182.8 183
ACPwc 171.9 140.5 2,350 22.3 179.5 183
APPwo 94.02 53.88 1,219 0.63 150.05 183
APPwc 126.68 71.57 1,927 3.08 194.89 183
ITO 177.07 148.59 947.12 0 156.50 183
Leverage 0.283 0.240 2.369 0.028 0.220 183
Size 15.568 15.732 18.400 10.559 1.388 183 The ACCCwo has a mean value 0.552 which is equivalent to 201 days with a standard deviation
of 0.726 and the ACCCwc has a mean value 0.609 which is equivalent to 222 days with a
standard deviation of 0.771. This is long relative to industrial sector in other countries which are
1-3 months. The minimum values of -2.717 and-4.587 means the business model receives money
up front or much quicker compared to what they spend. The difference between the mean of
ACPwo and ACPwc indicate the effect of Checks under collection (171.9-118.5=53.4 days)
while the Difference between APPwo and APPwc is a result of deferred checks (126.68-
94.02=32.66 days).
In the same way the average profitability measured by ROA for Palestinian firms is 5.01% with a
standard deviation of 0.094 which is higher than industrial firms in other countries. The average
return on equity is 6.60% and the maximum value is 33% with a standard deviation of 0.144.
The results show that the average debt ratio (total debt/total Assets) for the Palestinian industrial
companies is 28.3% with a standard deviation of 0.220. This ratio is low compared to firms in
industrial countries. This is due to the conservative policies Palestinian firms use in their
leverage.
“The Challenges of the Palestinian Economy in the Face of Political Pressure and the Repercussions of the Corona
Crisis”. The Third Conference of the Faculty of Economics and Social Sciences, An-Najah National University,
Sunday 11/4/2021
8
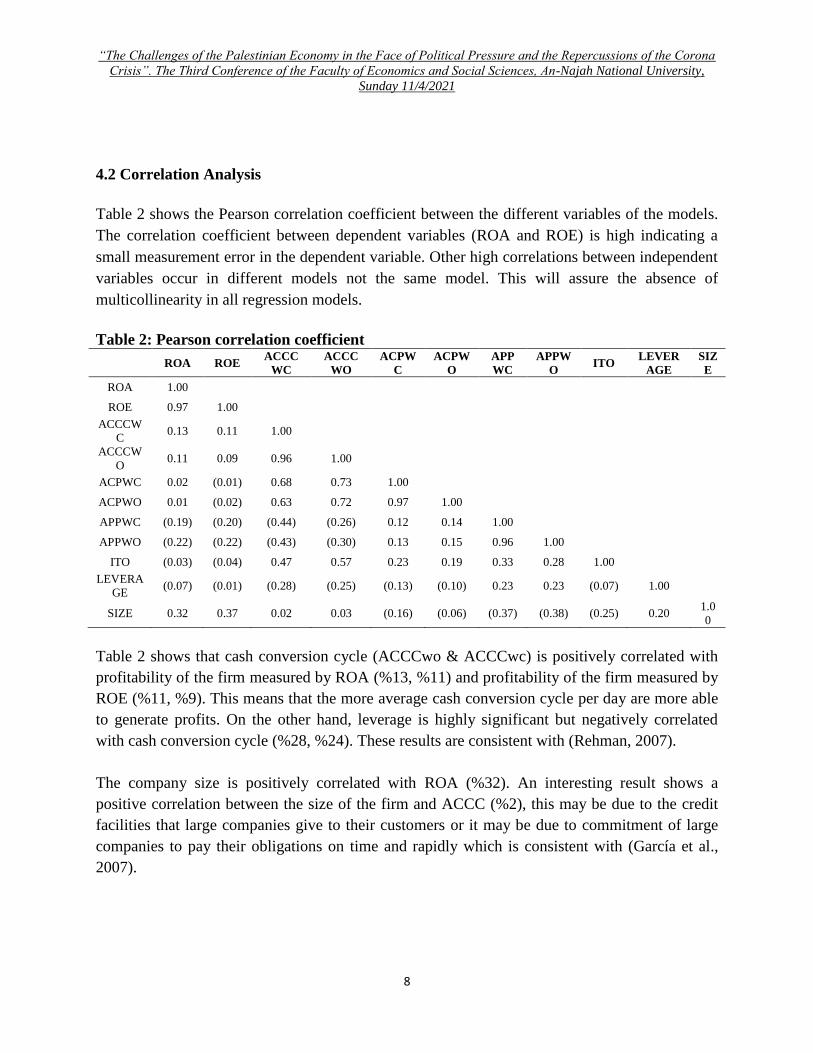
4.2 Correlation Analysis
Table 2 shows the Pearson correlation coefficient between the different variables of the models.
The correlation coefficient between dependent variables (ROA and ROE) is high indicating a
small measurement error in the dependent variable. Other high correlations between independent
variables occur in different models not the same model. This will assure the absence of
multicollinearity in all regression models.
Table 2: Pearson correlation coefficient
ROA ROE ACCC
WC
ACCC
WO
ACPW
C
ACPW
O
APP
WC
APPW
O ITO
LEVER
AGE
SIZ
E
ROA 1.00
ROE 0.97 1.00
ACCCW
C 0.13 0.11 1.00
ACCCW
O 0.11 0.09 0.96 1.00
ACPWC 0.02 (0.01) 0.68 0.73 1.00
ACPWO 0.01 (0.02) 0.63 0.72 0.97 1.00
APPWC (0.19) (0.20) (0.44) (0.26) 0.12 0.14 1.00
APPWO (0.22) (0.22) (0.43) (0.30) 0.13 0.15 0.96 1.00
ITO (0.03) (0.04) 0.47 0.57 0.23 0.19 0.33 0.28 1.00
LEVERA
GE (0.07) (0.01) (0.28) (0.25) (0.13) (0.10) 0.23 0.23 (0.07) 1.00
SIZE 0.32 0.37 0.02 0.03 (0.16) (0.06) (0.37) (0.38) (0.25) 0.20 1.0
0 Table 2 shows that cash conversion cycle (ACCCwo & ACCCwc) is positively correlated with
profitability of the firm measured by ROA (%13, %11) and profitability of the firm measured by
ROE (%11, %9). This means that the more average cash conversion cycle per day are more able
to generate profits. On the other hand, leverage is highly significant but negatively correlated
with cash conversion cycle (%28, %24). These results are consistent with (Rehman, 2007).
The company size is positively correlated with ROA (%32). An interesting result shows a
positive correlation between the size of the firm and ACCC (%2), this may be due to the credit
facilities that large companies give to their customers or it may be due to commitment of large
companies to pay their obligations on time and rapidly which is consistent with (García et al.,
2007).
“The Challenges of the Palestinian Economy in the Face of Political Pressure and the Repercussions of the Corona
Crisis”. The Third Conference of the Faculty of Economics and Social Sciences, An-Najah National University,
Sunday 11/4/2021
9
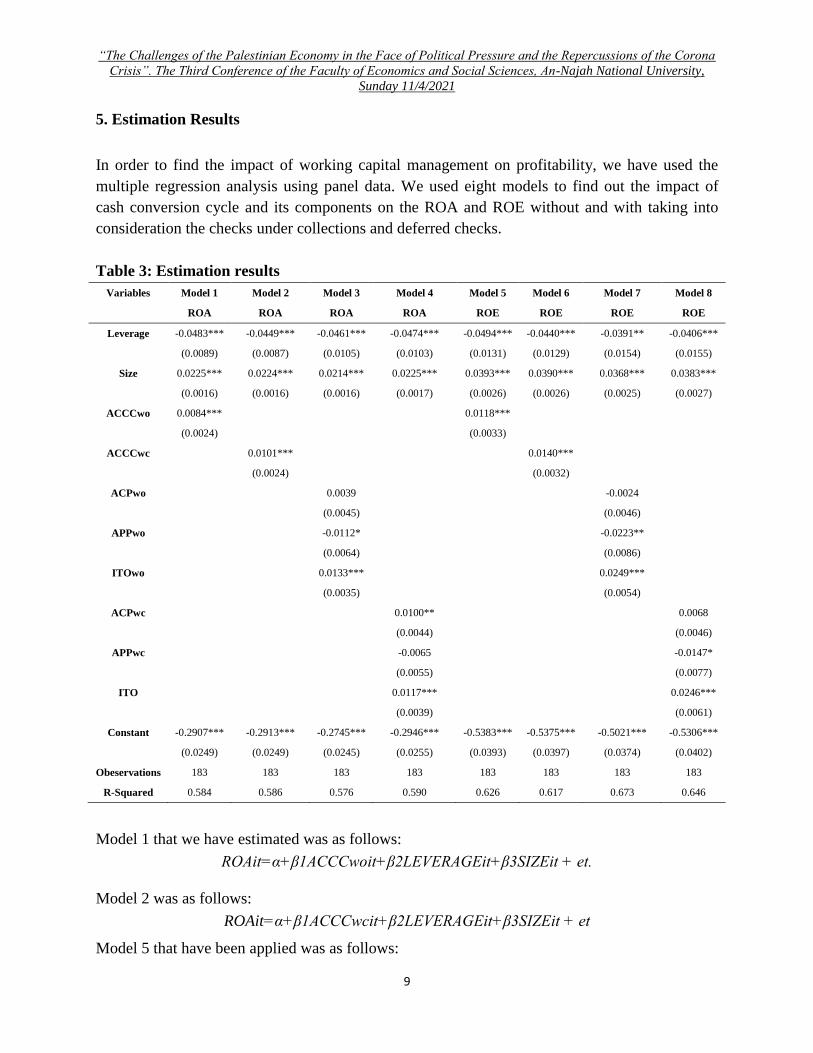
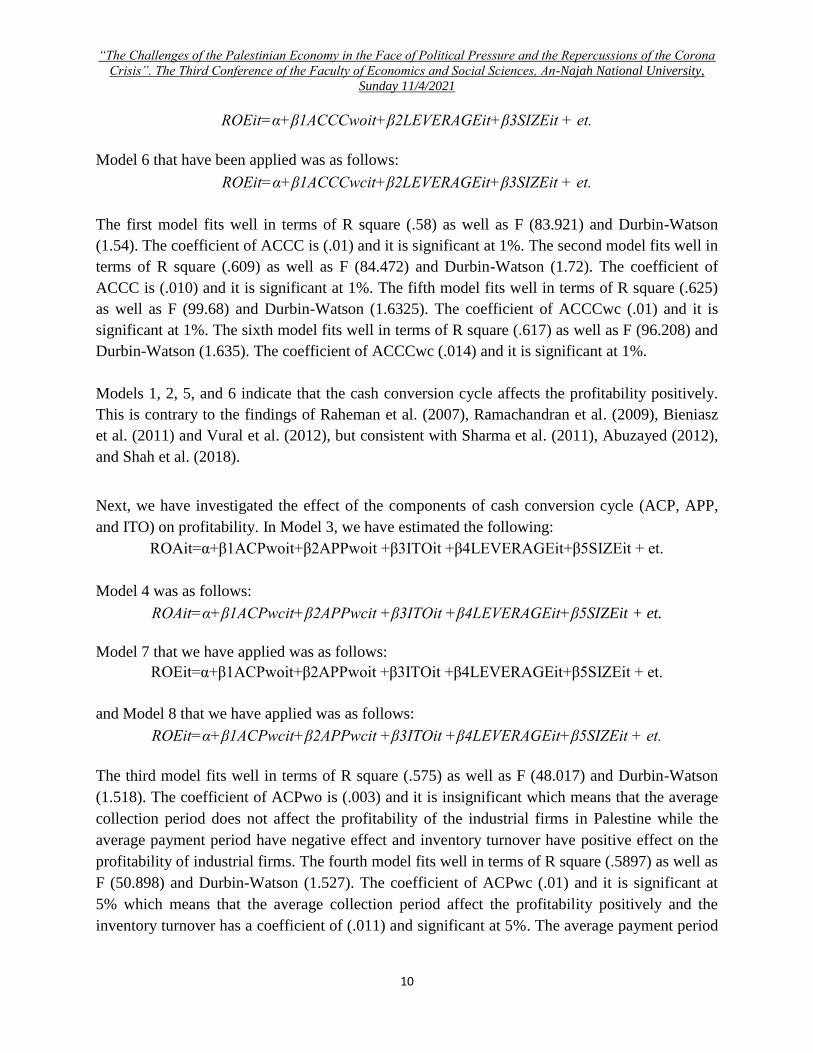
5. Estimation Results
In order to find the impact of working capital management on profitability, we have used the
multiple regression analysis using panel data. We used eight models to find out the impact of
cash conversion cycle and its components on the ROA and ROE without and with taking into
consideration the checks under collections and deferred checks.
Table 3: Estimation results
Variables Model 1 Model 2 Model 3 Model 4 Model 5 Model 6 Model 7 Model 8
ROA ROA ROA ROA ROE ROE ROE ROE
Leverage -0.0483*** -0.0449*** -0.0461*** -0.0474*** -0.0494*** -0.0440*** -0.0391** -0.0406***
(0.0089) (0.0087) (0.0105) (0.0103) (0.0131) (0.0129) (0.0154) (0.0155)
Size 0.0225*** 0.0224*** 0.0214*** 0.0225*** 0.0393*** 0.0390*** 0.0368*** 0.0383***
(0.0016) (0.0016) (0.0016) (0.0017) (0.0026) (0.0026) (0.0025) (0.0027)
ACCCwo 0.0084***
0.0118***
(0.0024)
(0.0033)
ACCCwc 0.0101***
0.0140***
(0.0024)
(0.0032)
ACPwo
0.0039
-0.0024
(0.0045)
(0.0046)
APPwo
-0.0112*
-0.0223**
(0.0064)
(0.0086)
ITOwo
0.0133***
0.0249***
(0.0035)
(0.0054)
ACPwc
0.0100**
0.0068
(0.0044)
(0.0046)
APPwc
-0.0065
-0.0147*
(0.0055)
(0.0077)
ITO
0.0117***
0.0246***
(0.0039)
(0.0061)
Constant -0.2907*** -0.2913*** -0.2745*** -0.2946*** -0.5383*** -0.5375*** -0.5021*** -0.5306***
(0.0249) (0.0249) (0.0245) (0.0255) (0.0393) (0.0397) (0.0374) (0.0402)
Obeservations 183 183 183 183 183 183 183 183
R-Squared 0.584 0.586 0.576 0.590 0.626 0.617 0.673 0.646
Model 1 that we have estimated was as follows:
ROAit=α+β1ACCCwoit+β2LEVERAGEit+β3SIZEit + et.
Model 2 was as follows:
ROAit=α+β1ACCCwcit+β2LEVERAGEit+β3SIZEit + et Model 5 that have been applied was as follows:
“The Challenges of the Palestinian Economy in the Face of Political Pressure and the Repercussions of the Corona
Crisis”. The Third Conference of the Faculty of Economics and Social Sciences, An-Najah National University,
Sunday 11/4/2021
10
ROEit=α+β1ACCCwoit+β2LEVERAGEit+β3SIZEit + et.
Model 6 that have been applied was as follows:
ROEit=α+β1ACCCwcit+β2LEVERAGEit+β3SIZEit + et.
The first model fits well in terms of R square (.58) as well as F (83.921) and Durbin-Watson
(1.54). The coefficient of ACCC is (.01) and it is significant at 1%. The second model fits well in
terms of R square (.609) as well as F (84.472) and Durbin-Watson (1.72). The coefficient of
ACCC is (.010) and it is significant at 1%. The fifth model fits well in terms of R square (.625)
as well as F (99.68) and Durbin-Watson (1.6325). The coefficient of ACCCwc (.01) and it is
significant at 1%. The sixth model fits well in terms of R square (.617) as well as F (96.208) and
Durbin-Watson (1.635). The coefficient of ACCCwc (.014) and it is significant at 1%.
Models 1, 2, 5, and 6 indicate that the cash conversion cycle affects the profitability positively.
This is contrary to the findings of Raheman et al. (2007), Ramachandran et al. (2009), Bieniasz
et al. (2011) and Vural et al. (2012), but consistent with Sharma et al. (2011), Abuzayed (2012),
and Shah et al. (2018).
Next, we have investigated the effect of the components of cash conversion cycle (ACP, APP,
and ITO) on profitability. In Model 3, we have estimated the following:
ROAit=α+β1ACPwoit+β2APPwoit +β3ITOit +β4LEVERAGEit+β5SIZEit + et.
Model 4 was as follows:
ROAit=α+β1ACPwcit+β2APPwcit +β3ITOit +β4LEVERAGEit+β5SIZEit + et.
Model 7 that we have applied was as follows:
ROEit=α+β1ACPwoit+β2APPwoit +β3ITOit +β4LEVERAGEit+β5SIZEit + et.
and Model 8 that we have applied was as follows:
ROEit=α+β1ACPwcit+β2APPwcit +β3ITOit +β4LEVERAGEit+β5SIZEit + et.
The third model fits well in terms of R square (.575) as well as F (48.017) and Durbin-Watson
(1.518). The coefficient of ACPwo is (.003) and it is insignificant which means that the average
collection period does not affect the profitability of the industrial firms in Palestine while the
average payment period have negative effect and inventory turnover have positive effect on the
profitability of industrial firms. The fourth model fits well in terms of R square (.5897) as well as
F (50.898) and Durbin-Watson (1.527). The coefficient of ACPwc (.01) and it is significant at
5% which means that the average collection period affect the profitability positively and the
inventory turnover has a coefficient of (.011) and significant at 5%. The average payment period
“The Challenges of the Palestinian Economy in the Face of Political Pressure and the Repercussions of the Corona
Crisis”. The Third Conference of the Faculty of Economics and Social Sciences, An-Najah National University,
Sunday 11/4/2021
11
has insignificant coefficient indicating no relationship between average payment period with
deferred checks and the profitability of industrial firms.
The seventh model fits very well in terms of R square (.6729) as well as F (72.823) and Durbin-
Watson (1.603). and the coefficient of ACPwo (-0.002) and it is insignificant at 10% which
means that the average collection period does not affect the profitability of industrial firms where
the average payment period have a negative relationship with the profitability and the inventory
turnover has a coefficient of (0.024) and it is significant at 1%. The eighth model fits very well in
terms of R square (.6461) as well as F (64.641) and Durbin-Watson (1.623). and the coefficient
of ACPwc (0.0067) and it is insignificant at 10% which means that the average collection period
does not affect the profitability of industrial firms where the average payment period have a
negative relationship with the profitability and the inventory turnover has a coefficient of (0.024)
and it is significant at 1%.
In general ACCC, ACP, and ITO have positive relationships with profitability and APP has
negative relationship with profitability. The two control variables were significant in all models.
The size variable is positive and the leverage variable is negative in all models consistent with
past literature. The results are consistent with Sharma et al. (2011), Abuzayed (2012), and Shah
et al. (2018). On the other hand, some of our findings contradict with some earlier studies on the
issue like Raheman et al. (2007), Ramachandran et al. (2009), Bieniasz et al. (2011) and Vural et
al. (2012) whom found that the CCC has a negative effect on the profitability.
6. Conclusions
This paper aimed to find the impact of working capital management on the financial performance
of the Palestinian industrial corporations. On the basis of the findings of this research, the results
indicated that cash conversion cycle has a positive and statistically significant effect on the
financial performance. The average collection period and the inventory turnover in days both
have positive effects on profitability as well. The average payment period has negative effect in
most models. The long period for cash conversion cycle which takes firms more than seven
months on average to convert raw materials into cash, explains high amount of working capital
in Palestinian firms. Thus, improving the cash conversion cycle would have positive effect on
firms’ profitability.
The small industrial sector and the small economy limited our ability to generalized results.
There is much research to be done about working capital in Palestine in the future. Since there
are few results that are in contradiction to some of the earlier studies, future research could
further explore the reasons for this contradiction. Moreover, further research can be conducted
on the same topic with different sectors and extending the years of the sample. Exploiting the
time dimension of the data with new econometrics methods is another suggestion for future
research.
“The Challenges of the Palestinian Economy in the Face of Political Pressure and the Repercussions of the Corona
Crisis”. The Third Conference of the Faculty of Economics and Social Sciences, An-Najah National University,
Sunday 11/4/2021
12
References
Abuzayed, B. (2012). Working capital management and firms’ performance in emerging
markets: the case of Jordan. International Journal of Managerial Finance, 8(2), 155-179.
Akoto, R. K., Awunyo-Vitor, D., & Angmor, P. L. (2013). Working capital management and
profitability: Evidence from Ghanaian listed manufacturing firms.
Aregbeyen, O. (2013). The effects of working capital management on the profitability of
Nigerian manufacturing firms. Journal of Business Economics and Management, 14(3),
.520-534
Awad, I., & Jayyar, F. (2013). Working capital management, liquidity and profitability of the
manufacturing sector in Palestine: Panel co-integration and causality.
Baños-Caballero, S., García-Teruel, P. J., & Martínez-Solano, P. (2012). How does working
capital management affect the profitability of Spanish SMEs?. Small Business
Economics, 39(2), 517-529.
Bieniasz, A., & Gołaś, Z. (2011). The influence of working capital management on the food
industry enterprises profitability. Contemporary Economics, 5(4), 68-81.
Çelik, R., Bilen, B., & Bilen, Ö. (2016). The Impacts of Changes in Macro-Economic Data on
Net Working Capital: The Case of Turkey's Industrial Sector. Procedia economics and
finance, 38, 122-134.
Deloof, M. (2003). Does working capital management affect profitability of Belgian firms?.
Journal of business finance & Accounting, 30(3‐4), 573-588.
Gill, A., Biger, N., & Mathur, N. (2010). The relationship between working capital management
and profitability: Evidence from the United States. Business and economics journal,
.1-9 ,(1)10
Juan García-Teruel, P., & Martinez-Solano, P. (2007). Effects of working capital management on
SME profitability. International Journal of managerial finance, 3(2), 164-177.
Lima, V., Martins, F. V., & Brandao, E. (2015). The management of working capital and
profitability of SMEs in the euro area. Available at SSRN 2704622.
Mahmood, F., Han, D., Ali, N., Mubeen, R., & Shahzad, U. (2019). Moderating Effects of Firm
Size and Leverage on the Working Capital Finance–Profitability Relationship: Evidence
from China. Sustainability, 11(7), 2029.
Mohamad, N. E. A. B., & Saad, N. B. M. (2010). Working capital management: The effect of
market valuation and profitability in Malaysia. International Journal of Business and
Management, 5(11), 140.
Niresh, J. A. (2012). Working capital management & financial performance of manufacturing
sector in Sri Lanka. European Journal of Business and Management, 4(15), 23-30.
“The Challenges of the Palestinian Economy in the Face of Political Pressure and the Repercussions of the Corona
Crisis”. The Third Conference of the Faculty of Economics and Social Sciences, An-Najah National University,
Sunday 11/4/2021
13
Padachi, K. (2006). Trends in working capital management and its impact on firms’
performance: an analysis of Mauritian small manufacturing firms. International Review
of business research papers, 2(2), 45-58.
Pais, M. A., & Gama, P. M. (2015). Working capital management and SMEs profitability:
Portuguese evidence. International Journal of Managerial Finance, 11(3), 341-358.
Raheman, A., & Nasr, M. (2007). Working capital management and profitability–case of
Pakistani firms. International review of business research papers, 3(1), 279-300.
Ramachandran, A., & Janakiraman, M. (2009). The relationship between working capital
management efficiency and EBIT. Managing Global Transitions, 7(1), 61.
Qazi, H. A., Shah, S. M. A., Abbas, Z., & Nadeem, T. (2011). Impact of working capital on
firm’s profitability. African Journal of Business Management, 5(27), 11005-11010.
Shah, B., Gujar, M. A., & Sohu, N. U. (2018). The impact of working capital management on
profitability: case study of pharmaceutical and chemical firms listed on Karachi stock
exchange. International Journal of Economics, Commerce and Management, 6(3), 200-
.220
Sharma, A. K., & Kumar, S. (2011). Effect of working capital management on firm profitability:
Empirical evidence from India. Global Business Review, 12(1), 159-173.
Tauringana, V., & Adjapong Afrifa, G. (2013). The relative importance of working capital
management and its components to SMEs' profitability. Journal of Small Business and
Enterprise Development, 20(3), 453-469.
Uyar, A. (2009). The relationship of cash conversion cycle with firm size and profitability: an
empirical investigation in Turkey. International Research Journal of Finance and
Economics, 24(2), 186-193.
Vahid, T. K., Elham, G., khosroshahi Mohsen, A., & Mohammadreza, E. (2012). Working
capital management and corporate performance: evidence from Iranian companies.
Procedia-Social and Behavioral Sciences, 62, 1313-1318.
Vural, G., Sökmen, A. G., & Çetenak, E. H. (2012). Affects of working capital management on
firm’s performance: evidence from Turkey. International Journal of Economics and
Financial Issues, 2(4), 488-495.
Wesley, O. N., Musiega, M. G., Douglas, M., & Atika, M. G. (2013). Working Capital
Management And Corporate Performance. Special Reference To Manufacturing Firms
On Nairobi Securities Exchange. International Journal of Innovative Research &
Development, 2, 177-183.
“The Challenges of the Palestinian Economy in the Face of Political Pressure and the Repercussions of the Corona
Crisis”. The Third Conference of the Faculty of Economics and Social Sciences, An-Najah National University,
Sunday 11/4/2021
14
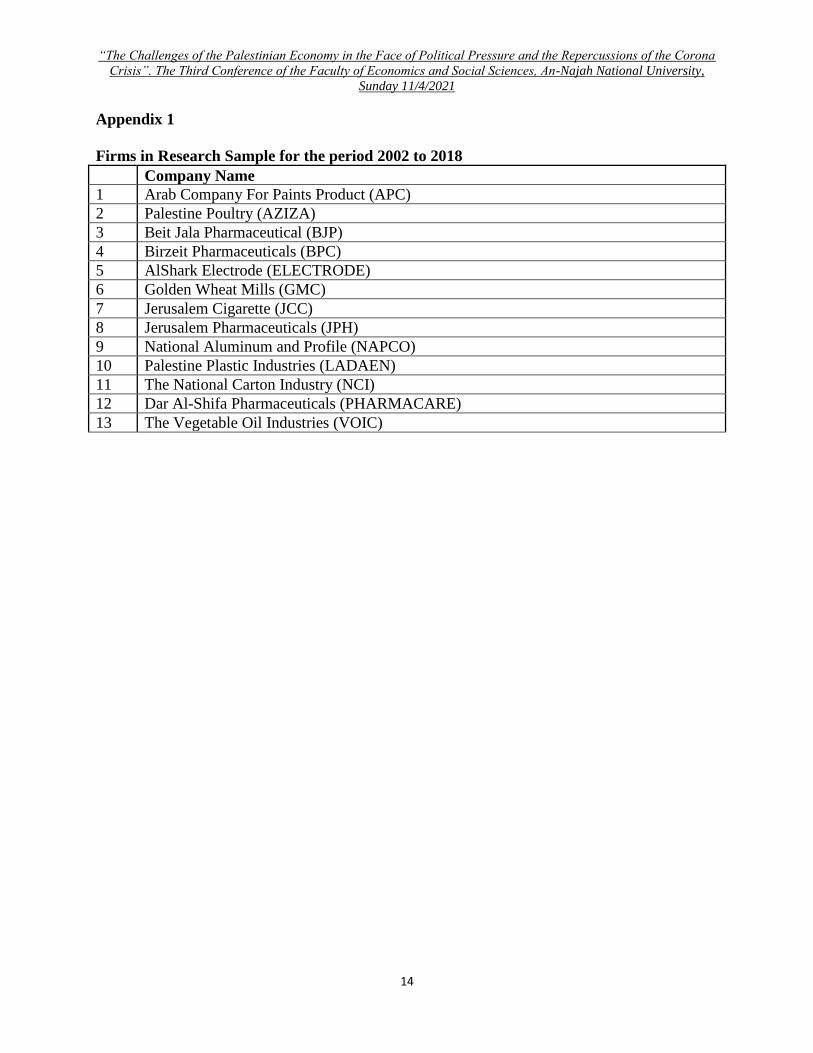
Appendix 1
Firms in Research Sample for the period 2002 to 2018
Company Name
1 Arab Company For Paints Product (APC)
2 Palestine Poultry (AZIZA)
3 Beit Jala Pharmaceutical (BJP)
4 Birzeit Pharmaceuticals (BPC)
5 AlShark Electrode (ELECTRODE)
6 Golden Wheat Mills (GMC)
7 Jerusalem Cigarette (JCC)
8 Jerusalem Pharmaceuticals (JPH)
9 National Aluminum and Profile (NAPCO)
10 Palestine Plastic Industries (LADAEN)
11 The National Carton Industry (NCI)
12 Dar Al-Shifa Pharmaceuticals (PHARMACARE)
13 The Vegetable Oil Industries (VOIC)