Embed Size (px)
Citation preview

THE IMPACT OF WORKING CAPITAL MANAGEMENT
ON FIRM PROFITABILITY IN DIFFERENT BUSINESS
CYCLES: EVIDENCE FROM FINLAND
Julius Enqvist1,*, Michael Graham2,**, Jussi Nikkinen3, ***
1 Nordea Bank, Finland
2School of Economics, Finance and Marketing
Royal Melbourne Institute of Technology University, Australia
3Department of Accounting and Finance
University of Vaasa, Finland
30 August 2013
* Address: E-mail address: [email protected] ** Address: E-mail address: [email protected] ***
Address: E-mail address: [email protected]

2
THE IMPACT OF WORKING CAPITAL MANAGEMENT
ON FIRM PROFITABILITY IN DIFFERENT BUSINESS
CYCLES: EVIDENCE FROM FINLAND
Abstract
The recent economic downturn of 2007-2008 has brought renewed focus on
working capital policies. In this paper we examine the role of business
cycles on the working capital-profitability relationship using a sample of
Finnish listed companies over an 18 year period. We find the impact of
business cycle on the working capital-profitability relationship is more
pronounced in economic downturns relative to economic booms. We
further show that the significance of efficient inventory management and
accounts receivables conversion periods increase during periods of
economic downturns. Our results demonstrate that active working capital
management matters and, thus, should be included in firms’ financial
planning.
JEL classification: G30, G31, G32
Keywords: Working capital; Business cycles; Profitability

3
1. Introduction
This paper investigates the effect of the business cycle on the link between
working capital, the difference between current assets and current liabilities,
and corporate performance. Efficient working capital management is
recognized as an important aspect of financial management practices in all
organizational forms. In acknowledgement of this importance, the CFO
Magazine publishes an annual study of corporate working capital management
performance in many countries. The extensive literature indicates that it
impacts directly on corporate liquidity (Kim, Mauer and Sherman 1998; and
Opler, Pinkowitz, Stulz, and Williamson 1999), profitability (e.g., Shin and
Soenen 1998; Deloof 2003; Lazaridis and Tryfonidis 2006), and solvency
(e.g., Berryman 1983; Peel and Wilson, 1994).
It is reasonable to assume that economy-wide fluctuations exogenous to the
operations of the firm play an important role in the demand for firms’
products and any financing decision. Korajczyk and Levy (2003), for
instance, suggest that firms time debt issuance based on economic
conditions. Also, given that retained earnings are a significant component
of working capital, business cycles can be said to affect all enterprises
financing source through its effect on economic growth and sales. For
example, when company sales weaken it engenders earning declines,
thereby, affecting an important source of working capital. The recent global
economic downturn with crimping consumer demand is an excellent

4
example of this. The crisis, characterized by plummeting sales, put a
squeeze on corporate revenues and profit margins, and subsequently,
working capital requirements. This has brought renewed focus on working
capital management at companies all over the world.
The literature on working capital, however, only includes a handful of
studies examining the impact of the business cycle on working capital. An
early study by Merville and Tavis (1973) examined the relationship
between firm working capital policies and business cycle. More recent
studies have investigated the degree to which firms’ reliance on bank
borrowing to finance working capital is cyclical (Einarsson and Marquis
2001), the significance of firms’ external dependence for financing needs
on the link between industry growth and business the cycle in the short term
(Braun and Larrian 2005), and the influence of business indicators on the
determinants of working capital management (Chiou, Cheng, and Wu
2006). These studies have independently linked working capital to
corporate profitability and the business cycle. No study, to the best of our
knowledge, has examined the simultaneous working capital-profitability
and business cycle effects. There is therefore a substantial gap in the
literature which this paper seeks to fill. Firms may have an optimal level of
working capital that maximizes their value. However, optimal levels may
change to reflect business conditions. Consequently, we contribute to the
literature by re-examining the relationship between working capital

5
management and corporate profitability by investigating the role business
cycle plays in this relationship.
We investigate this important relationship using a sample of firms listed on
the Helsinki Stock Exchange and an extended study period of 18 years,
between 1990 and 2008. Finnish firms tend to react strongly to changes in
the business cycle, a characteristic that can be observed from the volatility
of the Nasdaq OMX Helsinki stock index. The index usually declines
quickly in poor economic states, but also makes fast recoveries. Finland,
therefore, presents an excellent representative example of how the working
capital-profitability relationship may change in different economic states.
The choice of Finland is also significant as it also offers a representative
Nordic perspective of this important working capital-profitability
relationship. Hitherto no academic study has examined the working capital-
profitability relationship in the Nordic region, to the best of our knowledge.
Surveys on working capital management in the Nordic region carried out by
Danske Bank and Ernst & Young in 2009 show, however, that many
companies rated their working capital management performance as average,
with a growing focus on optimizing working capital in the future. The
surveys are, however, silent on how this average performance affected
profitability. This gives further impetus for our study.
6
Our results point to a number of interesting findings. First, we find that
firms can enhance their profitability by increasing working capital
efficiency. This is a significant result because many Nordic firms find it
hard to turn good policy intentions on working capital management into
reality (Ernst & Young 2009). Firms may gain by paying increasing
attention to efficient working capital practices. Our empirical finding,
therefore, should motivate firms to implement new work processes as a
matter of necessity. We also find that working capital management is
relatively more important in low economic states than in the economic
boom state, implying working capital management should be included in
firms’ financial planning. This finding corroborates evidence from the
survey results in the Nordic region. Specifically, the survey results by Ernst
& Young 2009 indicate that the largest potential for improvement in
working capital could be found within the optimization of internal
processes. This suggests that this area is not prioritized in times of business
growth which is typical of the general economic expansion periods and is
exposed in economic downturns.
Our empirical findings have practical usage especially in the event of the
recent financial crisis of 2007-2008 and the associated distressed state of
the global economy. The liquidity of many companies comes under intense
pressure and cash becomes a scarce resource due to the tight credit market
conditions and decreased demand around such periods. Evidently, this

7
condition accentuates the importance of efficient working capital practices.
Interestingly, a Europe-wide survey on working capital indicates that very
little has been done to significantly increase working capital efficiency
between 2004 and 2008, which includes the onset of the current financial
crisis (PwC 2009). The implications of our results for corporate liquidity
position and improving profitability highlights the importance of working
capital to companies, not only in times of distress, but as a daily routine.
The remainder of this paper is organized as follows: Section 2 presents a
brief review of the literature presents the hypotheses for empirical testing.
Sections 3 and 4 discuss data and models to be estimated. The empirical
results are presented in section 5 and section 6 concludes.
2. Related literature and hypotheses
2.1 Literature review
Many firms have invested significant amounts in working capital and a
number of studies have examined the determinants of this investment. For
example Kim, Mauer and Sherman (1998) and Opler, Pinkowitz, Stulz,
Williamson (1999), Chiou et al. (2006) and D’Mello, Krishnaswami and
Larkin (2008) find that the availability of external financing is a
determinant of liquidity. Thus restricted access to capital markets requires
firms to hold larger cash reserves. Other studies show that firms with

8
weaker corporate governance structures hold smaller cash reserves
(Harford, Mansi, and Maxwell 2008). Furthermore firms with excess cash
holding as well as weak shareholder rights undertake more acquisitions.
However there is a higher likelihood of value-decreasing acquisitions
(Harford 1999). Kieschnick and LaPlante (2012) provide evidence linking
working capital management to shareholder wealth. They find that the
incremental dollar invested in net operating capital is less valuable than the
incremental dollar held in cash for the average firm. The findings reported in
the paper further suggest that the valuation of the incremental dollar invested in
net operating working is significantly influenced by a firm’s future sales
expectations, its debt load, its financial constraints, and its bankruptcy risk.
Further the value of the incremental dollar extended in credit to one’s
customers has a greater effect on shareholder wealth than the incremental
dollar invested in inventories for the average firm. Taken together the results
indicate the significance of working capital management to the firm’s residual
claimants, and how financing impacts these effects.
A thin thread of the literature links business cycles to working capital. In a
theoretical model, Merville and Tavis (1973) posit that investment and
financing decisions relating to working capital should be made in chorus as
components of each impact on the optimal policies of the others. The
optimal working capital policy of the firm is, therefore, made within a
systems context, components of which are related spatially over time in a
chance-constrained format. Uncertainty in the wider business environment
9
directly affects the system. For example, short run demand fluctuations
disrupt anticipated incoming cash flows, and the collection of receivables
faces increased uncertainty. The model provides a structure enabling
corporate managers to solve complex inventory and credit policies for short
term financial planning.
In an empirical study, Einarsson and Marquis (2001) find that the degree to
which companies rely on bank financing to cover their working capital
requirements in the U.S. is countercyclical; it increases as the state of the
economy weakens. Furthermore, Braun and Larrain (2005) find that high
working capital requirements are a key determinant of a business’
dependence on external financing. They show that firms that are highly
dependent on external financing are more affected by recessions, and
should take more precautions in preparing for declines in the economic
environment, including ensuring a secure level of working capital reserves
during times of crisis. Additionally, Chiou et al. (2006) recognize the
importance of the state of the economy and includes business indicators in
their study of working capital determinants. They find a positive
relationship between business indicator and working capital requirements.
The relationship between profitability and working capital management in
various markets has also attracted intense interest. In a comprehensive
study, Shin and Soenen (1998) document a strong inverse relationship

10
between working capital efficiency and profitability across U.S. industries.
This inverse relationship is supported by Deloof (2003), Lazaridis and
Tryfonidis (2006), and Garcia-Teruel and Martinez-Solano (2007) for
Belgian non-financial firms, Greek listed firms, and Spanish small and
medium size enterprises (SME), respectively. There are, however,
significant divergences in the results relating to the effect of the various
components of working capital on profitability. For example, whereas
Deloof (2003) find a negative and statistically significant relationship
between account payable and profitability, Garcia-Teruel and Martinez-
Solano (2007) find no such measurable influences in a sample of Spanish
SMEs.
2.2 Hypotheses development
The cash conversion cycle (CCC), a useful and comprehensive measure of
working capital management, has been widely used in the literature (see for
example Deloof 2003; and Gill, Biger and Mathur 2010). The CCC,
measured in days, is the length of time between a company’s expenditure
for the procurement of raw materials and the collection of sales of finished
goods. We adopt this as our measure of working capital management in this
study. Previous studies have established a link between profitability and the
CCC in different countries and market segments.

11
Efficient working capital management practices aims to shorten the CCC to
optimize to levels that best suites the requirements of the specific company
(Hager 1976). A short CCC indicates quick collection of receivables and
delays in payments to suppliers. This is associated with profitability given
that it improves corporate efficiency in its use of working capital. Deloof
(2003), however, posits that low inventory levels, tight trade credit policies
and utilizing obtained trade credit as a means of financing can increase risks
of inventory stock-outs, decrease sales stimulants and increase accounts
payable costs by forgoing given cash discounts. Managers must, therefore,
always consider the tradeoff between liquidity and profitability when
managing working capital. A faster rise in the cost of higher investment in
working capital relative to the benefits of holding more inventories and/ or
granting trade credit to customers may lead to decrease in corporate
profitability. Deloof (2003), Wang (2002), Lazaridis and Tryfonidis (2006),
and Gill et al. (2010) all propose a negative relationship between the cash
conversion cycle and corporate profitability. Following this, we propose a
general hypothesis stating the expected negative relationship between the
cash conversion cycle and corporate profitability:
Hypothesis 1a: There is a negative relationship between the cash
conversion cycle and profitability.

12
The CCC has three components; account payable deferral period, accounts
receivable conversion period, and inventories conversion period. A firm can
minimize its CCC by independently optimizing each of the three
components. For example, accounts payable can be an inexpensive and
flexible source of financing for firms. A delay in payments to the firm’s
suppliers increases the accounts payable cycle, which effectively decreases
the length of the CCC and make working capital more efficient. Prior
studies suggest that this increased working capital efficiency translates in
increased profitability. On the other hand, excess inventories and longer
accounts receivable cycles increase the CCC, implying decreased efficiency
and profitability. The efficiency of working capital is, therefore, based on
the principle of speeding up cash collections and slowing down cash
disbursements. As a result, companies that operate with lean inventories
and collect their receivables quickly have shorter CCCs can be seen to be
more efficient, which impacts positively on profitability (Deloof 2003). As
indicated above, companies must, however, also take into consideration the
tradeoff between liquidity and profitability when deciding on their optimal
cash gap. Consequently, we also propose the following three hypotheses
relating the three components of CCC to profitability:
Hypothesis 2a: There is a positive relationship between the payables
deferral period and profitability.

13
Hypothesis 3a: There is a negative relationship between the receivables
conversion period and profitability.
Hypothesis 4a: There is a negative relationship between the inventory
conversion period and profitability.
The extant literature linking business cycles to working capital management
does not show how the different economic states’ impact on the
profitability-working capital relationship. Working capital assessments by
firms are mainly motivated by liquidity considerations. Changes in the
macroeconomy affect firm investments and how these are financed.
Recessions and economic crises put a premium on liquidity and pressure on
working capital positions. Korajczyk and Levy (2003), for instance, note
that financially constrained firms react differently to macroeconomic
uncertainty than financially unconstrained firms. This may be reflected in
poor economic or business states, where companies’ growth stutter and cash
flow constraints become apparent. Such period may reflect higher
likelihood of longer time periods for collecting accounts receivable and
increased inventories due to crimping sales. As a result, there is the need for
companies to maintain higher levels of working capital requirements to
function. This is recognized in the theoretical models of Einarsson and
Marquis (2001) and Braun and Larrain (2005). Furthermore Fernandez-
Corugedo, McMahon, Millard, and Lukasz (2011) develop a dynamic

14
stochastic general equilibrium (DSGE) model that shows how economic
shock leads to adjustment of working capital positions by firms.
Due to the increased challenges in poor states of the economy, we
hypothesize that working capital management should be of greater
significance with respect to profitability in economic downturns.
Furthermore as demand and fixed capital investments improve during a
booming economy, we hypothesize that the relationship between working
capital and profitability would be less significant in improved economic
climates. Accordingly, we adjust hypotheses 1a-4a to reflect this pattern in
the following way:
Hypothesis 1b: The significance of the relationship between the cash
conversion cycle and profitability increases during economic downturns.
Hypothesis 1c: The significance of the relationship between the cash
conversion cycle and profitability decreases during economic booms.
Hypothesis 2b: The significance of the relationship between the account
payables deferral period and profitability increases during economic
downturns.

15
Hypothesis 2c: The significance of the relationship between the account
payables deferral period and profitability decreases during economic
booms.
Hypothesis 3b: The significance of the relationship between the account
receivables conversion period and profitability increases during economic
downturns.
Hypothesis 3c: The significance of the relationship between the account
receivables conversion period and profitability decreases during economic
booms.
Hypothesis 4b: The significance of the relationship between the inventory
conversion period and profitability increases during economic downturns.
Hypothesis 4c: The significance of the relationship between the inventory
conversion period and profitability decreases during economic booms.
3. Data environment and variables description
The firm level data used in this paper consists of the income statement and
balance sheet information of all listed companies on the Nasdaq OMX
Helsinki stock exchange between the years 1990 and 2008. The data is
16
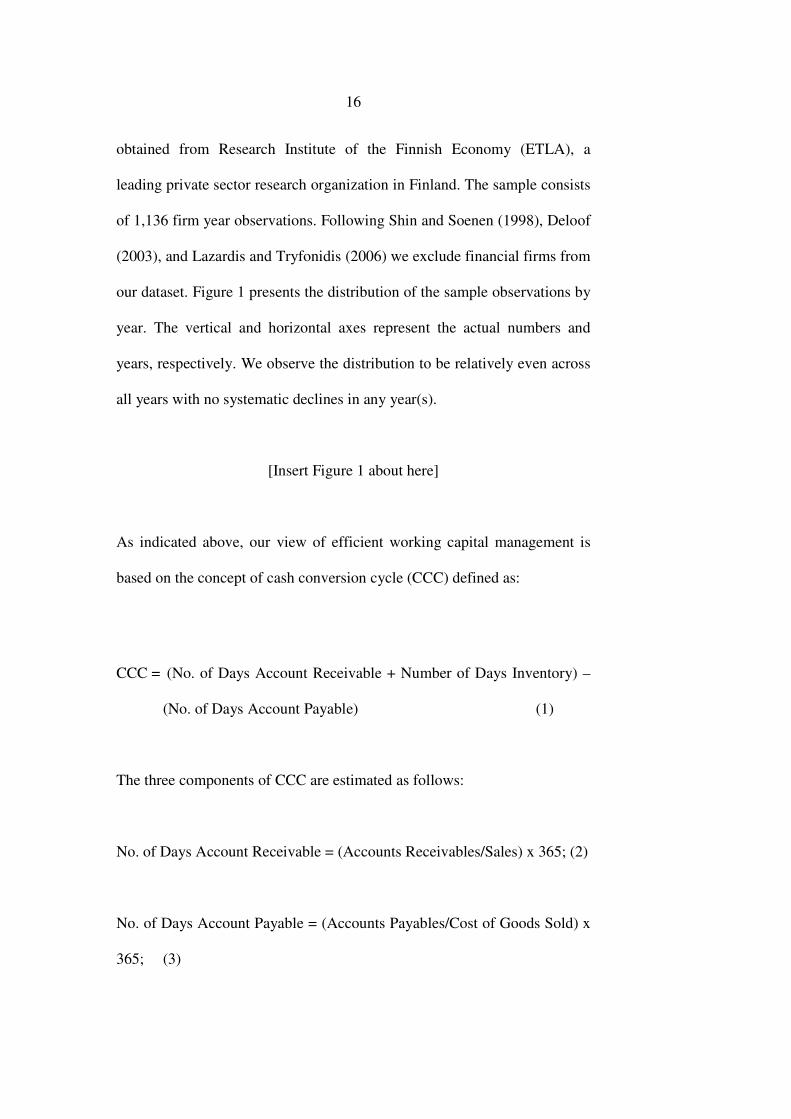
obtained from Research Institute of the Finnish Economy (ETLA), a
leading private sector research organization in Finland. The sample consists
of 1,136 firm year observations. Following Shin and Soenen (1998), Deloof
(2003), and Lazardis and Tryfonidis (2006) we exclude financial firms from
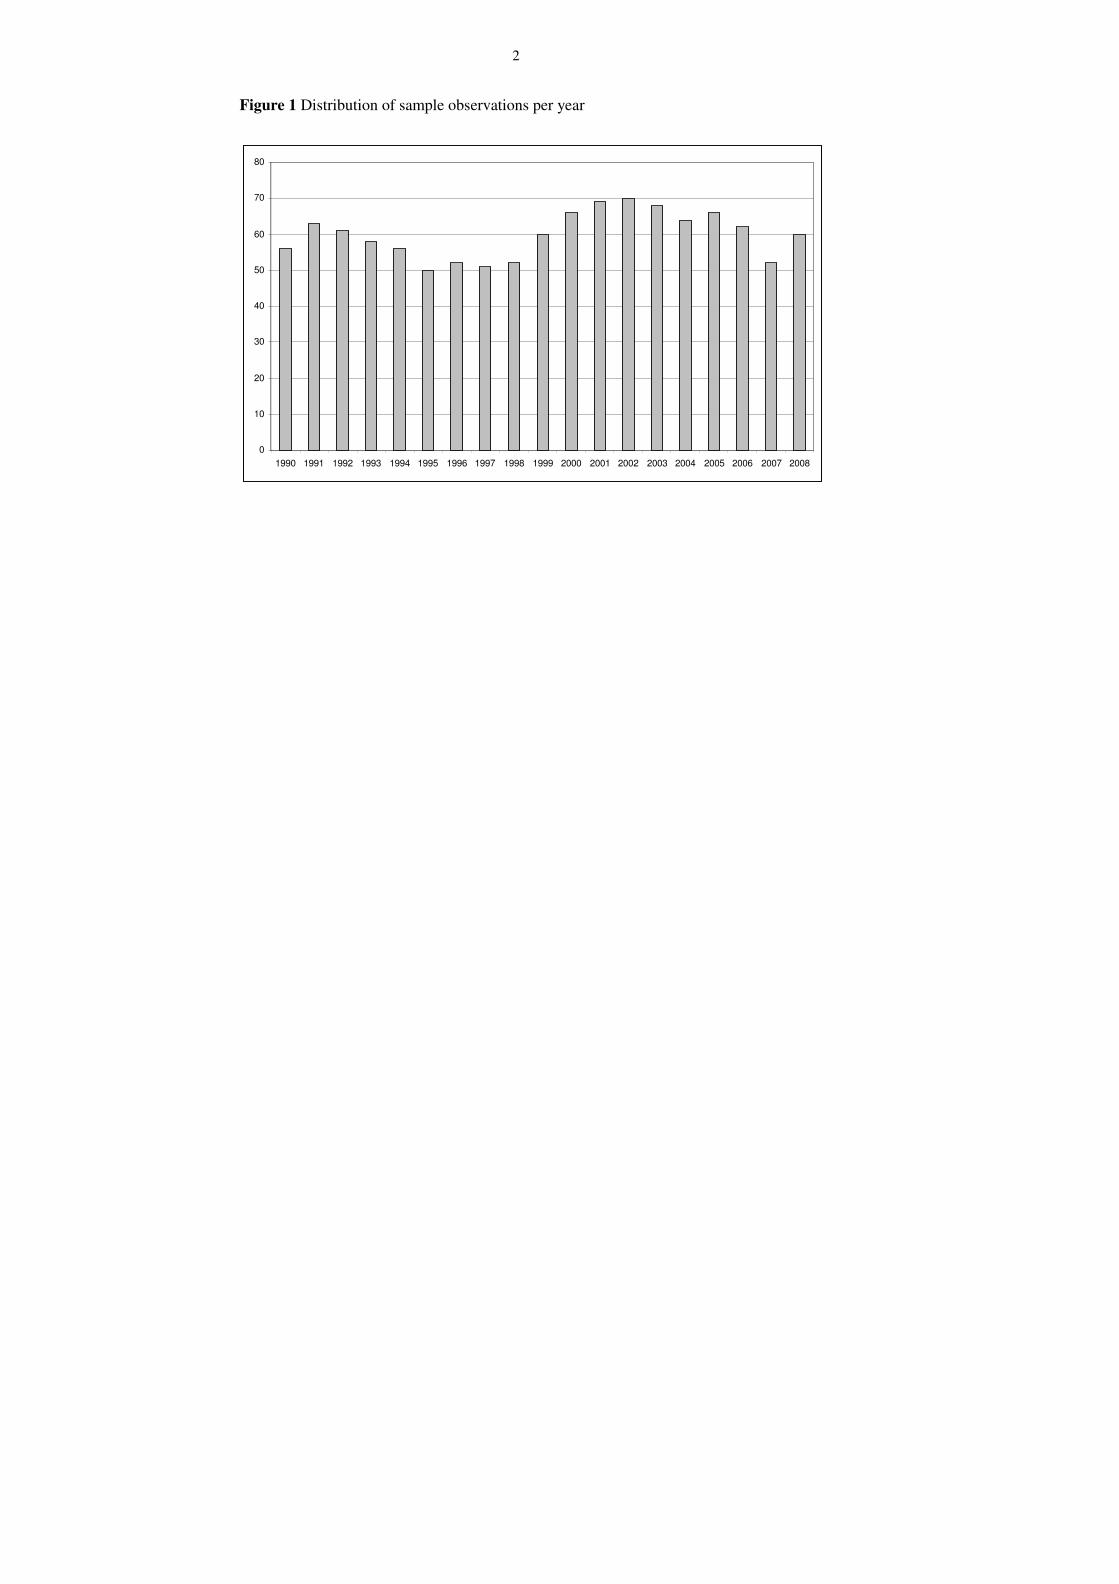
our dataset. Figure 1 presents the distribution of the sample observations by
year. The vertical and horizontal axes represent the actual numbers and
years, respectively. We observe the distribution to be relatively even across
all years with no systematic declines in any year(s).
[Insert Figure 1 about here]
As indicated above, our view of efficient working capital management is
based on the concept of cash conversion cycle (CCC) defined as:
CCC = (No. of Days Account Receivable + Number of Days Inventory) –
(No. of Days Account Payable) (1)
The three components of CCC are estimated as follows:
No. of Days Account Receivable = (Accounts Receivables/Sales) x 365; (2)
No. of Days Account Payable = (Accounts Payables/Cost of Goods Sold) x
365; (3)

17
No. of Days Inventory = (Inventory/Cost of Goods Sold) x 365 (4)
Using CCC is advantageous as it recognizes the life expectancies of
working capital components as well as the fact that production, distribution
and collection are not instantaneous and synchronized processes but come
with a time lag (Richards and Laughlin 1980). Also the CCC serves as a
better predictor of future cash flows than static liquidity ratios (Kamath
1989). Consequently many other recent studies have adopted the CCC (see
e.g., Wang 2002; Deloof 2003; Lazardis and Tryfonidis 2006; Garcia-
Teruel & Martinez-Solano 2007 and Gill et al. 2010).
Following Lancaster, and Stevens (1996), Wang (2002), Jose, and Garcia-
Teruel and Martinez-Solano (2007), we use the return on assets (ROA),
measured as the ratio of net income to total assets, as a proxy for company
profitability. The ROA concentrates on measuring the company’s overall
profitability and, as pointed out by Barber and Lyon (1996), is not obscured
by special items or affected by the capital structure of the firm. We also
utilize an alternative measure of profitability, gross operating income
(GOI), calculated as the ratio of sales (adjusted for cost of goods sold) to
the difference between total assets and financial assets. Whiles ROA can be
considered an overall indicator of profitability, GOI measures operational
performance. Hence we are also able to directly associate with the success

18
or failure of operational activities of the firm with CCC, which is also an
operating variable (Lazaridis and Tryfonidis 2006).
We include several control variables known to affect firm profitability in
the models to be estimated. We control for company size (natural logarithm
of sales), current ratio (current assets/current liabilities), and debt ratio
(short-term loans + long-term loans)/total assets), (see e.g., Deloof 2003;
Lazaridis and Tryfonidis 2006; and Azadegan and Pai 2008),
The reference to business cycles relate to the irregular fluctuations in
economic activity, measured by real GDP, in the long term development of
the economy. We infer the different economic states in the following way:
First we estimate the annual GDP changes over the 19 year period (1990-
2008) utilized in this study. Then we segment the data into 5 year periods to
specify the different stages of the economy. Poor economic states are
defined by the five years during the 19 year study period which showed the
worst performance (i.e., change in Finnish real GDP), whiles prosperous
states of the economy are reflected by the five years showing higher GDP
growth. We include dummy variables which take binary values to indicate
these business conditions. These dummy variables are used reflect the
importance of working capital components in the two different states of the
economy which are then compared to results from the entire study period.
GDP data for Finland is publicly available and retrieved from the Statistics
19
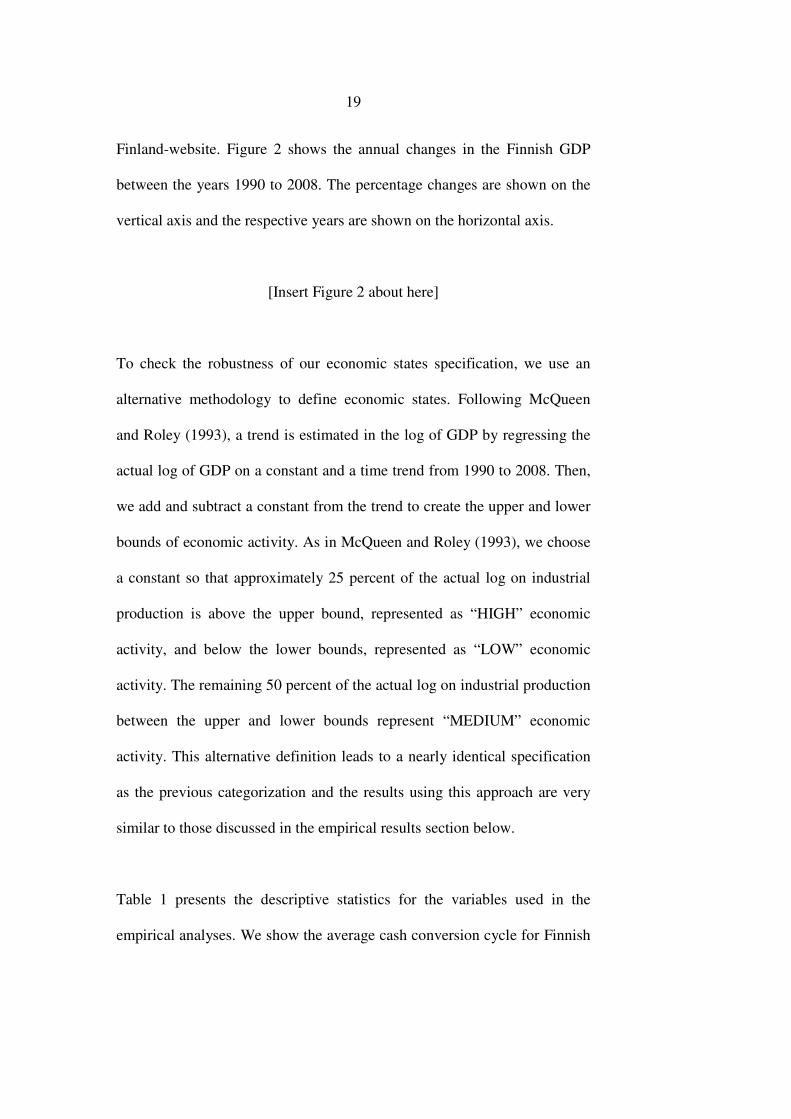
Finland-website. Figure 2 shows the annual changes in the Finnish GDP
between the years 1990 to 2008. The percentage changes are shown on the
vertical axis and the respective years are shown on the horizontal axis.
[Insert Figure 2 about here]
To check the robustness of our economic states specification, we use an
alternative methodology to define economic states. Following McQueen
and Roley (1993), a trend is estimated in the log of GDP by regressing the
actual log of GDP on a constant and a time trend from 1990 to 2008. Then,
we add and subtract a constant from the trend to create the upper and lower
bounds of economic activity. As in McQueen and Roley (1993), we choose
a constant so that approximately 25 percent of the actual log on industrial
production is above the upper bound, represented as “HIGH” economic
activity, and below the lower bounds, represented as “LOW” economic
activity. The remaining 50 percent of the actual log on industrial production
between the upper and lower bounds represent “MEDIUM” economic
activity. This alternative definition leads to a nearly identical specification
as the previous categorization and the results using this approach are very
similar to those discussed in the empirical results section below.
Table 1 presents the descriptive statistics for the variables used in the
empirical analyses. We show the average cash conversion cycle for Finnish
20
firms to be 108.8 days, which is considerably higher that of Spanish SMEs
(76.3 days) and large Belgian companies (44.5 days), but lower than the
average CCC of listed companies on the Athens Stock Exchange (189 days)
(see Deloof 2003; Lazaridis and Tryfonidis 2006; and Garcia-Teruel and
Martinez-Solano 2007). There is, however, considerable variation in the
CCC for Finnish firms with a range of 408.8 days. The average accounts
payables deferral, average inventory, and accounts receivables conversion
periods are 56.4 days, 117.6 days, and 47.6 days respectively. The mean
inventory for Finnish companies is distinctly higher relative to U.S. (78)
and Belgian (46.62) firms (see Gill et al. 2010; Deloof 2003) but lower than
Greek firms (see Lazaridis and Tryfonidis 2006). We also detect a mean
ROA value of 8.4% for Finnish firms. This exceeds the average value of
7.9% reported for Spanish SMEs (Garcia-Teruel and Martinez-Solano
2007). Furthermore, gross operating income is on average 101% of [total
assets and financial assets] which in excess of the 12.2% documented for
Belgian firms (Deloof 2003).
In an average Finnish listed company, 55.3% of the company’s assets are
financed with debt. Finnish companies also record an average sales figure
of 5.8 million and the average current ratio is 1.59.
[Insert Table 1 about here]
21
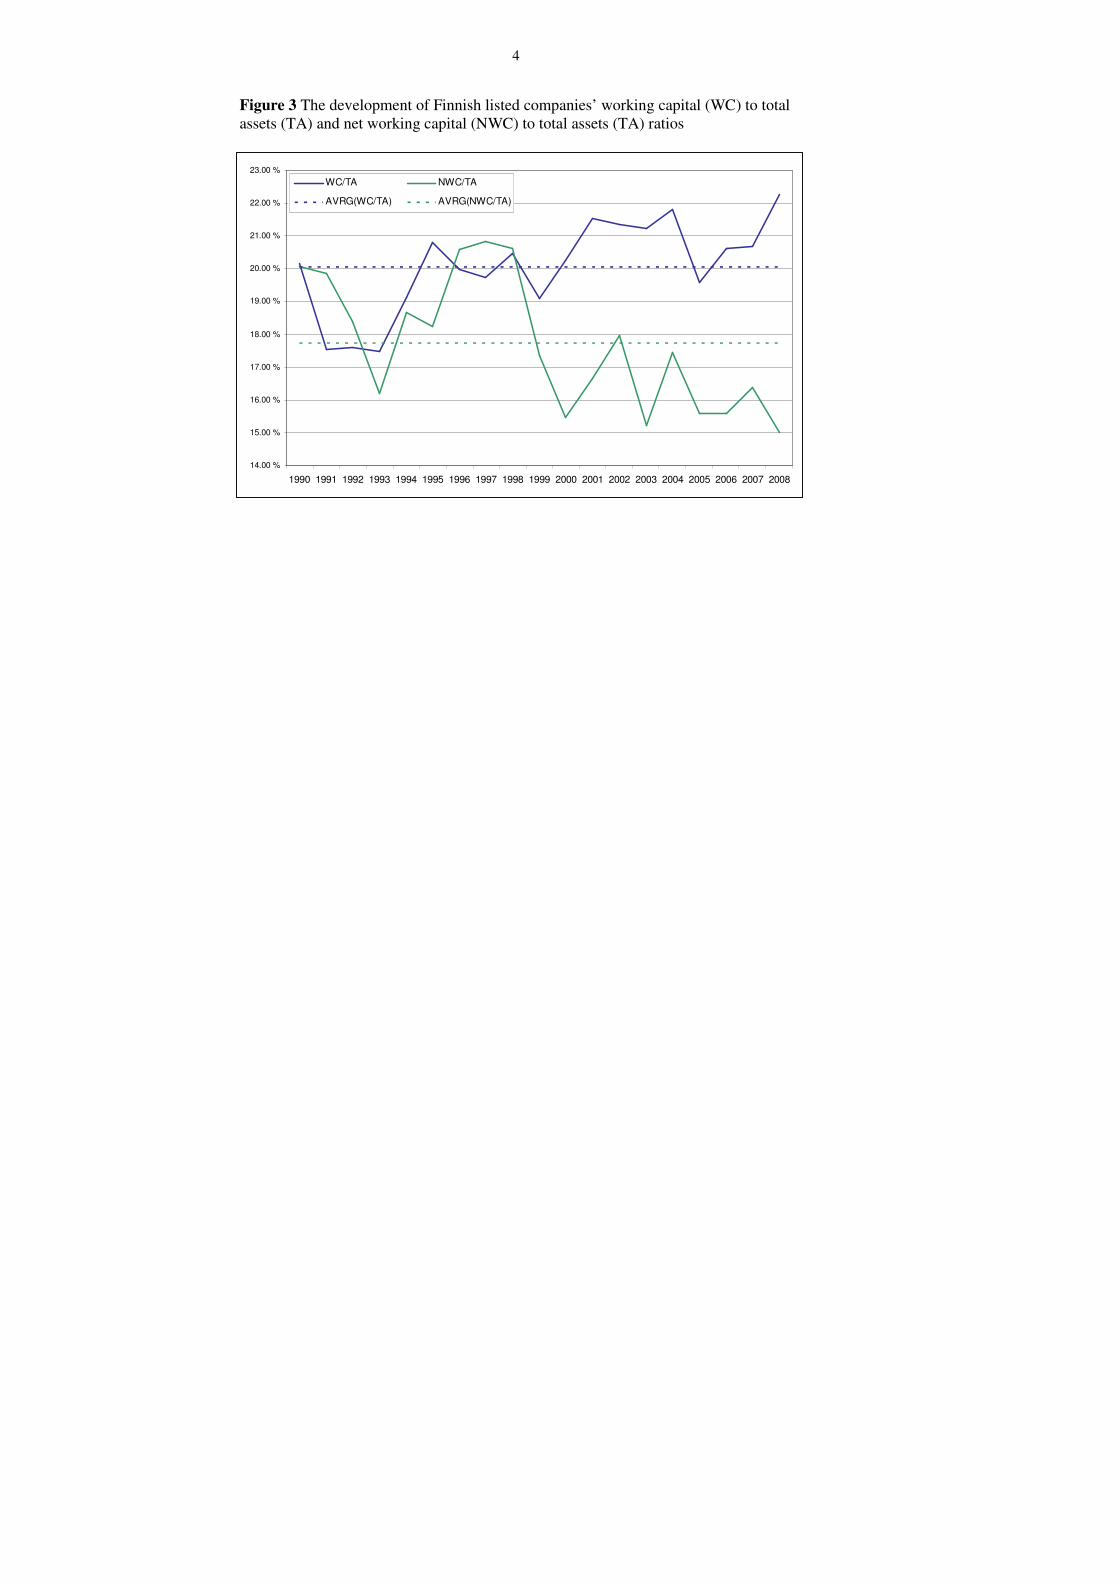
Figure 3 depicts the development of the working capital and net working
capital ratios of Finnish listed companies between 1990 and 2008. Total
assets and years are represented on the vertical and horizontal axes,
respectively. The average values of the working capital-total assets and net
working capital and total assets ratios are depicted by the broken horizontal
lines. The Figure shows that average working capital levels represented a
fifth of total assets, while net working capital represented almost 18 percent
of total assets.
[Insert Figure 3 about here]
In Table 2, we present the pairwise correlations between all pairs of firm
variables used in this study. We have segmented in the correlation into three
in accordance with our categorization of the economic states: correlations in
normal, boom, and downturn period. The CCC, in normal and boom
periods (downturn), is shown to correlate positively (negatively) with
profitability. The correlations between the components of CCC and
profitability and show both ROA and GOI to have a negative correlation
with accounts payable in all economic states, implying less profitable firms
wait longer to pay their bills. This also indicates that the longer firms wait
to clear their accounts payable the more detrimental the effect on corporate
profitability. Inventory generally shows positive (negative) correlations
with the two profitability measures in the normal and boom (downturn)

22
periods. Account receivable generally correlates positively with
profitability.
The control variables, debt and sales (current ratio), are negatively
(positively) correlated with the two measures of profitability in the three
economic states. Simple correlation analysis could, however, be misleading
due to the temporal instability of such correlation coefficients.
[Insert Table 2 about here]
4. Models
Following the structures of the models previously applied by Deloof (2003)
and Lazaridis and Tryfonidis (2006), we estimate the following regression
model to examine the effects of the CCC on corporate profitability:
(5)
where ityProfitabil is measured by return on assets (ROA) and gross
operating income (GOI); CCC is the cash conversion cycle; CR is current
ratio; DEBT is debt Ratio; SALES is the natural logarithm of sales; D1 is the
uCCCDCCCD
DDSALESDEBTCRCCCityProfitabil
+++
++++++=
)*2()*1(
21
87
6543210
ββ
βββββββ

23
recession dummy variable; D2 is the boom dummy variable; and u is an
error term. We include industry dummies in estimating equation (5).
We re-estimate equation (5) to examine the effect of the three components
of CCC on the two profitability measures. That is, we substitute CCC with
the accounts payable deferral period, the accounts receivable conversion
period, and inventory conversion period and re-estimate equation (5) in
subsequent models. With respect to possible multicollinearity, the analysis
of variance inflation factors (VIF) indicates that the multicollinearity
problem is not present in the regression equations (see e.g., Judge, Hill,
Griffiths, Lütkepohl and Lee 1988, 868-871). We use White (1980)
heteroscedasticity-consistent covariance matrix in all the estimated models.
5. Results
Tables 3 and 4 report results of the regression models investigating the
relationship between working capital management and corporate
profitability. The cash conversion cycle and its three individual components
are independently regressed against the two measures of profitability. The
effect of the business cycle is taken into consideration in each regression
model by including dummy variables for the respective economic states.
The relevant measure of profitability is ROA in Table 3, whereas
profitability is measured by GOI in Table 4. In both Tables, results of
24
estimating four (4) regression models are presented. We discuss the results
contained in both tables together.
Model (1) in Tables 3 and 4 analyzes the relationship between profitability
and the CCC. We find a negative a statistically significant relationship
between CCC and ROA and CCC and GOI, thereby, providing support for
hypothesis 1a. This result is in line with previous studies (Deloof 2003;
Garcia-Teruel & Matrinez-Solano 2007; Lazaridis and Tryfonidis 2006; and
Gill et al. 2010) and implies that companies can boost their profitability by
increasing working capital efficiency, i.e., minimizing CCC.
The empirical results also lend some support for the assertion that the
business cycle affects the profitability-working capital management
relationship. The interactive dummy variable (D1*CCC) which depicts the
performance of the CCC in poor states of the economy is negatively related
to profitability and statistically significant at the 1% level, thereby
providing support for hypothesis 1b. This implies that the overall
significance of the CCC on profitability is greater in poor economic states.
However there is no statistically significant evidence to suggest that the
CCC-profitability relationship departs from the norm during more
prosperous economic states.

25
Model 2 in Tables 3 and 4 examines the influence of account payable
deferral period on profitability. Consistent with the correlation analysis, the
results show a negative and significant relationship between account
payable deferral period and the GOI, implying less profitable firms wait
longer to pay their bills. This negative result suggests that shorter AP cycles
enhance profitability in firms and rejects hypothesis 2a which predicts a
positive relationship between account payable deferral period and
profitability. It can be inferred from the results that more profitable Finnish
companies utilize cash discounts on payables and do not use accounts
payable trade credit as a source of financing. These results differ from that
reported for Greek and U.S. listed companies. Lazaridis and Tryfonidis
(2006) find that where more profitable firms had longer AP cycles and Gill
et al. (2010) show no relationship between AP and profitability. This also
indicates that there are country specific aspects to working capital
efficiency even among listed companies.
The economic states do not appear to exert any measurable influence on the
profitability-account payable relationship. The absence of significant results
suggests that the importance of accounts payable in relation to profitability
does not vary according to the stage of the business cycle.
We next examine the relationship between the accounts receivable
conversion period and profitability. The results reported (Model 3 in Tables

26
3 and 4) show a negative but statistically insignificant relationship between
AR and profitability, thereby rejecting hypothesis 3a. The results, however,
show that in poor economic states the aggregate relationship between AR
and ROA is significantly negative, implying that during economic
downturns less profitable firms extend their accounts receivable conversion
periods. We infer that Finnish firms increase incentives for sales by
extending more trade credit to buyers, which increases the firm’s accounts
receivable conversion period. The evidence presented support hypothesis 3b
which states that the significance of AR increases during economic
downturns. There is no evidence to support the assertion of a change in AR
significance during a boom economic state.
The empirical evidence on the relationship between profitability and the
inventories conversion period (INV) is provided by model 4 in Tables 3 and
4. The results support prior evidence of a negative and statistically
significant relationship between inventories and corporate profitability. The
coefficients of both profitability measure, ROA and GOI, are statistically
significant implying that by increasing the efficiency of inventories and
minimizing inventory conversion periods, Finnish companies can achieve
higher profitability levels. This provides empirical support for hypothesis
4a. The negative and statistically significantly coefficient of the interactive
dummy variable (D1*INV) in Table 4 provides evidence in support of
hypothesis 4b. That is, in poor economic states, the significance of the

27
negative relationship between INV and GOI increases. However economic
boom periods do not affect the significance of the relationship between
inventories and profitability. The result of the interactive boom dummies
for inventories imply that the role of managing inventories in prosperous
economic times is not as important as during economic downturns.
For the most part the relationships regarding ROA and the control variables
are similar to the relationships between the control variables and operating
profit, GOI. The relationship between the current ratio (CR) and
profitability is found to be positive and statistically significant for all of the
first four regressions, which indicates that firm’s can increase profitability
by improving their margin of liquidity. The amount of leverage a company
uses in its operations (DEBT) is generally negative but only statistically
significant when profitability is measured by ROA. Firm size is also
negatively related to profitability.
The dummy variables D1 and D2 reflect changes in profitability in different
stages of the business cycle. The recession dummy (D1) is generally
significant and negative models estimated. This underlines the fact that
corporate profitability is significantly lower during economic downturns.
We also find some evidence to suggest that companies show higher return
on assets rates during more prosperous economic times. The dummy for
28
prosperous economic periods (D2) is positive and statistically significant in
Table 3.
6. Conclusions
Working capital, the difference between current assets and current
liabilities, is used to fund a business’ daily operations due to the time lag
between buying raw materials for production and receiving funds from the
sale of the final product. With vast amounts invested in working capital, it
can be expected that the management of these assets would significantly
affect the profitability of a company. Consequently, companies strive to
achieve optimize levels of working capital by paying bills as late as
possible, turning over inventories quickly, and collecting on account
receivables quickly. The optimal level, though, may vary to reflect business
conditions. This study examines the role business cycle plays in the
working capital-corporate profitability relationship using a sample of
Finnish listed companies from years 1990 to 2008.
We utilize the cash conversion cycle (CCC), defined as the length of time
between a company’s expenditure for the procurement of raw materials and
the collection of sales of finished goods, as our measure of working capital.
We further make use of 2 measures of profitability, return on assets and
gross operating income. We document a negative relationship between cash

29
conversion cycle and corporate profitability. Our results also show that
companies can achieve higher profitability levels by managing inventories
efficiently and lowering accounts receivable collection times. Furthermore
shorter account payable cycles enhance corporate profitability. These
results, which largely mirror findings from other countries, indicate
effective management of firm’s total working capital as well as its
individual components has a significant effect on corporate profitability
levels.
Our results also show that economic conditions exhibit measurable
influences on the working capital-profitability relationship. The low
economic state is generally found to have negative effects on corporate
profitability. In particular, we find that the impact of efficient working
capital (CCC) on operational profitability increases in economic downturns.
We also find that the impact of efficient inventory management and
accounts receivables conversion periods, subsets of CCC, on profitability
increase in economic downturns.
Overall the results indicate that investing in working capital processes and
incorporating working capital efficiency into everyday routines is essential
for corporate profitability. As a result, firms should include working capital
management in their financial planning processes.

30
References
Azadegan, A., and Pai, D. (2008). Industrial awards as manifests of business performance: An Empirical Assessment. Journal of
Purchasing and Supply Management 14 (3), pp. 149-159. Barber, B. M., Lyon, J. D. (1996). Detecting abnormal operating
performance: The empirical power and specification of test statistics. Journal of Financial Economics 41 (3), pp. 359-399.
Berryman, J. (1983). Small business failure and bankruptcy, A Survey of
the literature, European Small Business Journal 1 (4), pp.47-59. Braun, M. and Larrain, B. (2005). Finance and the business cycle:
International, inter-industry evidence. Journal of Finance 60 (3), pp. 1097-1128.
Chiou, J. R., Cheng L., and Wu, H. W. (2006). The determinants of
working capital management. Journal of American Academy of
Business 10 (1), Cambridge, pp. 149-155. D’Mello, R., Krishnaswami, S., and Larkin, P. J. (2008). Determinants of
corporate cash holdings: Evidence from spin-offs. Journal of Banking
and Finance 32 (7), pp. 1209-1220. Danske Bank (2009). Working Capital Management 2009 - A Survey of
Nordic companies. [online] [Cited January 21st 2010]. Available online: <URL: http://www.danskebank.com/en-uk/about-us/news archives/Documents/Report%20Working%20Capital_ENG-2009.pdf>
Deloof, M. (2003). Does working capital management affect profitability of
Belgian firms? Journal of Business Finance & Accounting 30 (4), pp. 573-587.
Einarsson, T., and Marquis, M. H. (2001). Bank intermediation over the
business Cycle. Journal of Money, Credit and Banking 33 (4), pp. 876-899.
Ernst & Young (2009). All Tied Up - Working Capital Management Report
2009. [online] [Cited 14th of January 2010] Available Online: <URL: http://www.ey.com/Publication/vwLUAssets/TAS_Working_capital_management_report_2009/$File/TAS_Working_capital_management_report_2009.pdf>

31
Fernandez-Corugedo, E., McMahon, M., Millard, S., and Lukasz R. (2011).
Understanding macroeconomic effects of working capital in the United Kingdom, Bank of England Working Paper No. 422.
Garcia-Teruel, P. J., and Martinez-Solano, P. (2007). Effects of working
capital management on SME Profitability. International Journal of
Managerial Finance 3 (2), pp. 164-177. Gill, A., Biger N., and Mathur, N. (2010). The relationship between
working capital management and profitability: evidence from the United States. Business and Economics Journal 10, pp. 1-9.
Gilson, R., and Roe, M. (1993). Understanding the Japanese keiretsu: overlaps between corporate governance and industrial organisation. Yale Law Journal 102, pp. 871-906.
Harford, J. (1999). Corporate cash reserves and acquisitions. Journal of
Finance 54, pp. 1969–1997. Harford, J., Mansi, S., and Maxwell, W., (2008). Corporate governance and
firm cash holdings, Journal of Financial Economics 87 (3), 535-555. Hager, H. C. (1976). Cash management and the cash conversion cycle.
Management Accounting 57 (9), pp. 19-21. Jose, M. L., Lancaster, C., and Stevens, J. L. (1996). Corporate returns and
cash conversion cycles. Journal of Economics and Finance 20 (1), pp. 33-46.
Judge, G., R. C. Hill, W. E. Griffiths, and H. Lütkepohl, T-C. Lee. 1988.
Introduction to the Theory and Practice of Econometrics. New York: Wiley.
Kamath, R. (1989). How useful are Common Liquidity Measures? Journal
of Cash Management 9 (1), pp. 24-28. Kieschnick, Robert L., Laplante, Mark and Moussawi, Rabih, Working
Capital Management and Shareholder Wealth (April 27, 2012). Available at SSRN: http://ssrn.com/abstract=1431165 or http://dx.doi.org/10.2139/ssrn.1431165
Kim, C. S., Mauer, D. C., and Sherman, A. E. (1998). The determinants of
corporate liquidity: Theory and evidence. Journal of Financial and
Quantitative Analysis 33 (3), pp. 335-359.

32
Korajczyk RA, Levy A. 2003. Capital structure choice: macroeconomic conditions and financial constraints. Journal of Financial Economics 68(1), 75–109.
Lazaridis, I., and Tryfonidis, D. (2006). Relationship between working
capital management and profitability of listed companies on the Athens Stock Exchange. Journal of Financial Management &
Analysis 19 (1), pp. 26-35. Merville L. J., and Tavis, L. A. (1973). Optimal working capital
management policies: A Chance-Constrained Programming Approach. Journal of Financial and Quantitative Analysis 8 (1), pp. 47-59.
Opler, T., Pinkowitz, L., Stulz, R., and Williamson, R., (1999). The
determinants and implications of corporate cash holdings. Journal of
Financial Economics 52, pp. 3–46. Peel, M. J., and Wilson, N (1994). Working capital and financial
management practices in the Small Firm sector. International Small
Business Journal 14 (2), pp. 52-68. PricewaterhouseCoopers (2009). European Working Capital Study 2009.
October 2009. Roe, M. (1994). Strong mergers, weak owners: the political roots of
American corporate finance. Princeton University Press, Princeton, NJ.
Richards, V. D., and Laughlin, E. J. (1980). A cash conversion cycle
approach to liquidity management. Financial Management 9 (1), pp. 32-38.
Shin, H. H., and Soenen, L. (1998). Efficiency of working capital and
corporate profitability. Financial Practice and Education 8 (2), pp. 37-45.
Wang, Y. J. (2002). Liquidity management, operating performance and
corporate value: Evidence from Japan and Taiwan. Journal of
Multinational Financial Management 12 (2), pp. 159-169. White, H. (1980). A heteroskedasticity-consistent covariance matrix
estimator and a direct test for heteroskedasticity. Econometrica 48, pp. 817-838.

33
Table 1. Descriptive statistics
Variable Mean Median Std Dev Min Max
A. Working Capital Management
Cash Conversion Cycle 108.810 100.623 88.794 -85.569 494.408
Account Payable 56.366 53.400 25.530 0.000 159.000
Account Receivable 47.573 47.000 20.543 0.000 109.000
Inventory 117.603 101.712 79.858 0.647 492.608
B. Profitability Measures
Return on Assets 0.084 0.079 0.071 -0.167 0.334 Gross Operating Income
to non-financial assets 1.012 0.852 0.573 0.087 3.166
C. Control Variables
Current Ratio 1.589 1.500 0.623 0.300 3.900
Sales 5.872 5.644 1.619 2.312 9.619
Debt 0.553 0.557 0.149 0.152 0.974
Notes: Descriptive statistics for firm level variable for Finnish firms from the years 1990 to 2008, for a total number of 1136 observations.

34
Table 2. Correlations of key variables during the normal, boom and downturn periods
ROA GOI CCC AP AR INV CR DEBT SALES
ROA
GOI 0.250
(0.000)
CCC 0.032 0.098
(0.456) (0.021)
AP -0.068 -0.084 -0.182
(0.109) (0.049) (0.000)
AR -0.022 0.061 0.386 0.303
(0.604) (0.153) (0.000) (0.000)
INV 0.019 0.067 0.953 0.036 0.267
(0.650) (0.116) (0.000) (0.397) (0.000)
CR 0.298 0.221 0.300 -0.131 0.194 0.241
(0.000) (0.000) (0.000) (0.002) (0.000) (0.000)
DEBT -0.320 -0.052 0.012 0.112 0.060 0.033 -0.411
(0.000) (0.217) (0.784) (0.008) (0.161) (0.438) (0.000)
SALES -0.150 -0.289 -0.159 0.052 0.059 -0.175 -0.294 0.066
(0.000) (0.000) (0.000) (0.224) (0.164) (0.000) (0.000) (0.118)
ROA 0.436 0.118 -0.070 0.041 0.097 0.285 -0.340 -0.178
(0.000) (0.047) (0.237) (0.496) (0.102) (0.000) (0.000) (0.003)
GOI 0.478 0.048 -0.017 0.088 0.024 0.175 -0.080 -0.255
(0.000) (0.417) (0.773) (0.140) (0.683) (0.003) (0.180) (0.000)
CCC -0.042 -0.157 -0.139 0.468 0.944 0.281 0.072 -0.129
(0.465) (0.007) (0.020) (0.000) (0.000) (0.000) (0.226) (0.031)
AP -0.048 0.035 -0.128 0.255 0.109 -0.215 -0.030 -0.062
(0.409) (0.545) (0.027) (0.000) (0.067) (0.000) (0.613) (0.300)
AR 0.035 0.043 0.548 0.144 0.336 0.090 0.106 0.053
(0.552) (0.461) (0.000) (0.013) (0.000) (0.131) (0.075) (0.372)
INV -0.071 -0.175 0.946 0.133 0.413 0.218 0.042 -0.179
(0.221) (0.002) (0.000) (0.022) (0.000) (0.000) (0.483) (0.003)
CR 0.107 0.165 0.102 -0.127 -0.064 0.090 -0.477 -0.288
(0.066) (0.004) (0.079) (0.029) (0.270) (0.120) (0.000) (0.000)
DEBT -0.187 -0.184 0.035 0.174 0.166 0.052 -0.495 0.116

35
(0.001) (0.002) (0.551) (0.003) (0.004) (0.367) (0.000) (0.051)
SALES 0.006 -0.222 -0.124 -0.110 0.001 -0.173 -0.299 0.187
(0.918) (0.000) (0.033) (0.058) (0.987) (0.003) (0.000) (0.001)
Notes: Pearson correlation coefficients for the key variables, for a total number of 1136 observations. ROA is return on assets; GOI is gross operating income; CCC is cash conversion cycle; AP is accounts payable deferral period; AR is accounts receivable conversion period; INV is inventory conversion period; CR is current ratio; DEBT is debt ratio; SALES is natural logarithm of sales; OI is natural logarithm of operating income; and GROWTH is growth rate measured by annual sales growth. *, **, *** denote the 10%, 5% and 1 % significance levels, respectively. Normal, lower – recession, higher boom

Table 3. The relation of ROA with the working capital management and business cycle
Coefficient Estimate
Expected sign (1) (2) (3) (4)
Intercept 14.256*** 14.179*** 14.034*** 14.605***
D1 - -1.903*** -1.872*** -1.931*** -1.861***
D2 + 1.848*** 1.913*** 1.905*** 1.858***
CCC - -0.009***
(D1*CCC) - -0.004
(D2*CCC) + 0.009
AP + -0.013
(D1*AP) + 0.008
(D2*AP) - -0.009
AR - -0.016
(D1*AR) - -0.001
(D2*AR) + -0.018
INV - -0.010***
(D1*INV) - -0.006***
(D2*INV) + 0.008
CR 1.936*** 1.668*** 1.772*** 1.866***
DEBT -9.272*** -9.642*** -9.489*** -9.203***
SALES -0.142 -0.13 -0.114 -0.168
Adj. R2 0.23 0.22 0.22 0.23
F-value 11.66 11.21 11.23 11.72
p-value 0.0000 0.0000 0.0000 0.0000
The table reports results from estimating the following regression model from the years 1990 to 2008, for a total number of 1136 observations:
where profitability is measured by return on assets (ROA). CCC is cash conversion cycle; AP is accounts payable deferral period; AR is accounts receivable conversion period; INV is inventory conversion period; CR is current ratio; DEBT is debt Ratio; SALES is the natural logarithm of sales; and D1 and D2 are economic downturn and economic boom dummy variables, respectively. The models are estimated with industry dummies. The White (1980) heteroscedasticity-consistent covariance matrix is used.
*, **, *** denote the 10%, 5% and 1 % significance levels, respectively.
uCCCDCCCDDDSALESDEBTCRCCCityProfitabil +++++++++= )*2()*1(21 876543210 βββββββββ

1
Table 4. The relation of GOI with the working capital management and business
cycle
Coefficient Estimate
Expected sign (1) (2) (3) (4)
Intercept 137.179*** 146.530*** 130.149*** 143.206***
D1 - -27.895*** -26.160*** -28.089*** -27.441***
D2 + -4.658 -4.117 -4.487 -4.707
CCC - - 0.037***
(CCC*D1) - -0.126***
(CCC*D2) + -0.010
AP + -0.264***
(AP*D1) + 0.094
(AP*D2) - 0.085
AR - -0.032
(AR*D1) - -0.157**
(AR*D2) + -0.149
INV - -0.066**
(INV*D1) - -0.149***
(INV*D2) + -0.021
CR 11.405*** 9.193*** 9.988*** 11.307***
DEBT -3.735 -3.803 -5.097 -2.529
SALES -3.23*** -3.140*** -3.194*** -3.598***
Adj. R2 0.38 0.37 0.37 0.39
F-value 22.78 22.19 21.67 23.57
p-value 0.0000 0.0000 0.0000 0.0000
The table reports results from estimating the following regression model from the years 1990 to 2008, for a total number of 1136 observations:
where profitability is measured by gross operating income (GOI). CCC is cash conversion cycle; AP is accounts payable deferral period; AR is accounts receivable conversion period; INV is inventory conversion period; CR is current ratio; DEBT is debt Ratio; SALES is the natural logarithm of sales; and D1 and D2 are economic downturn and economic boom dummy variables, respectively. The models are estimated with industry dummies. The White (1980) heteroscedasticity-consistent covariance matrix is used.
*, **, *** denote the 10%, 5% and 1 % significance levels, respectively
uCCCDCCCDDDSALESDEBTCRCCCityProfitabil +++++++++= )*2()*1(21 876543210 βββββββββ
2
Figure 1 Distribution of sample observations per year
0
10
20
30
40
50
60
70
80
1990 1991 1992 1993 1994 1995 1996 1997 1998 1999 2000 2001 2002 2003 2004 2005 2006 2007 2008

3
Figure 2 Changes in Finnish Annual GDP
-7.00 %
-6.00 %
-5.00 %
-4.00 %
-3.00 %
-2.00 %
-1.00 %
0.00 %
1.00 %
2.00 %
3.00 %
4.00 %
5.00 %
6.00 %
7.00 %
1990
1991
1992
1993
1994
1995
1996
1997
1998
1999
2000
2001
2002
2003
2004
2005
2006
2007
2008
4
Figure 3 The development of Finnish listed companies’ working capital (WC) to total assets (TA) and net working capital (NWC) to total assets (TA) ratios
14.00 %
15.00 %
16.00 %
17.00 %
18.00 %
19.00 %
20.00 %
21.00 %
22.00 %
23.00 %
1990 1991 1992 1993 1994 1995 1996 1997 1998 1999 2000 2001 2002 2003 2004 2005 2006 2007 2008
WC/TA NWC/TA
AVRG(WC/TA) AVRG(NWC/TA)