Embed Size (px)
Citation preview

Hawaii’s Workforce
A look at Characteristics by Industry
Department of Business, Economic Development and Tourism
December 2010
2 | P a g e H a w a i i ’ s W o r k f o r c e
December 2010 Department of Business, Economic Development & Tourism
This report was produced by the Research and Economic Analysis Division of the Hawaii Department of Business, Economic Development & Tourism, Dr. Eugene Tian, Acting Division Head. Data, analysis and narrative report were developed by Dr. Ming Zhang, Economist of the Economic Information Staff; with the assistance of Robert Shore and David Young.
Hawaii Department of Business, Economic Development & Tourism
December 2010
H a w a i i ’ s W o r k f o r c e P a g e | 3
Department of Business, Economic Development & Tourism December 2010
Table of Contents
EXECUTIVE SUMMARY 4
HAWAII WORKFORCE PROFILE BY INDUSTRY 7
Introduction 7
Aging of the Workforce 8
Women and Hawaii’s Workforce 10
Education and the Workforce 12
Part‐Time Workers 14
The Seasonal Workforce 16
Race and the Workforce 18
Income by Industry 19
CROSS TRENDS: GENDER, AGING, INCOME, EDUCATION & ETHNICITY 22
Gender & Income 22
Gender & Education 23
Gender & Aging of the Workforce 24
Incomes, Education, Aging and Ethnicity 24
CONCLUSIONS 29
APPENDIX: DETAILED DATA 30
4 | P a g e H a w a i i ’ s W o r k f o r c e
December 2010 Department of Business, Economic Development & Tourism
Executive Summary
Research over recent years has helped call attention to a number of trends that are beginning to impact the economy and public policy such as the aging of the workforce, changing education levels and the progress of women and minorities in the labor force, among others. However, much of this research has been at the broad level of the economy as a whole and has left questions about how these trends are reflected in the individual industry sectors of the economy.
To investigate these trends at the industry level, DBEDT has mined a data base from the U.S. Census Bureau called the American Community Survey (ACS). This has resulted in information about how major trends in aging, education, gender and other factors are impacting important sectors of Hawaii’s economy.
In 2008, there were about 646,000 people in Hawaii’s civilian labor force. This represented a participation rate of 63% of all adult residents 18 years and above. More than 620,000 of those in the labor force, (96%) were employed, while 26,000, (4%) were unemployed. Most of the employed persons (96%) were wage and salary workers, with the balance either self employed or proprietors. Since 2008, the recent recession has resulted in a shrinkage of the Labor Force and rise in the unemployment rate. However, the industry profiles and characteristics revealed by the ACS data and summarized below have probably not changed significantly.
Aging of the Workforce
About 44% of all workers were over 45 years of age or older in 2008, having either reached or approaching retirement age.
The younger workers (age 18‐44) accounted for 56% of the state’s workforce. Over the years, workforce participation rates for younger workers peaked at about 70% between the late 1960s and early 1980s as the baby‐boomer generation entered the labor market.
The proportion of younger workers began to decline in the early 1990s as baby boomers began to enter their mid 40s.
The last of the boomers reached their mid 40s in 2009 and with older boomers beginning to retire, the proportion of younger workers may begin rising in the coming years.
Women in the Labor Force
Women accounted for 48% of the state’s over‐18 workforce in 2008. Women were more likely to work in education, healthcare, wholesale‐retail sectors while men dominated in construction, transportation, and manufacturing sectors.
Women’s workforce participation rates were in the low 30%s in the 1960s, but increased steadily to the mid‐40%s by the 1980s, and have since stabilized in the high‐40%s. On average, women tend to have higher education level, but earn less than men.
Although they usually enter workforce at the same age, a portion of women tend to leave labor market during childbearing years and return later on.
There also has been a trend for women to retire and leave the workforce earlier than men.
Education and the Workforce
Nearly 60% of the workforce had some amount of post secondary education in 2008 and half of those workers were at or above the bachelor’s degree level.
H a w a i i ’ s W o r k f o r c e P a g e | 5
Department of Business, Economic Development & Tourism December 2010
The remaining 40% of the workforce were high school graduates or below in terms of education.
The percentage of college educated was in the 20%s in the 1960s. The percentage climbed into the 40%s by the 1980s and in the 1990s surpassed the percentage of those with high school credentials or below. The percent of post secondary educated workers has been stable at about 60% over the past decade.
Income Distribution
Roughly 37% of the state’s workforce had incomes under the Hawaii self‐sufficiency income level ($26,828 for an individual in 2008) and 15% were under the poverty level ($11,960 in 2008).
About 24% of the workforce made over the 2006 benchmark, $50,000 income, often considered the threshold for high income work (which actually required income of $54,759 in 2008 dollars).
Among Hawaii’s industrial sectors, energy and utilities, professional services, postal service, and information sectors had the highest percentages of workers earning at or above the high income level.
Accommodations, financial, government and transportation sectors had high percentages of worker earnings above state’s self‐sufficiency income standard but less than the high‐income benchmark.
Personal services, food services, food processing, rental and wholesale‐retail sectors had high percentages of workers with incomes above the federal poverty threshold but less than the state self‐sufficiency income standard.
Domestic work, agriculture, art and recreation sectors had high percentage of worker earnings below the federal poverty threshold.
The PartTime and Seasonal Workforce
About 81% of the workforce 18 years and up were employed full‐time at work (at least 35 hrs. per week), meaning that 19% were under‐employed in terms of hours worked.
A higher, 93% of the workforce were employed for the entire year, while 7% experienced some periods seasonal unemployment.
Over the years these percentages have fluctuated but have been stable over the last decade.
Race and the Workforce
Overall, Asians accounted for 47% of the state’s workforce over age 18 in 2008, whites 29 %, Native Hawaiians 8% and the other races accounted 17%.
Whites and Asians in the workforce were the highest educated. Those two groups tended to enter the workforce later than Native Hawaiians and other races but stay longer.
Conclusions
The aging of the workforce suggests that industries should be planning for higher replacement needs and a more competitive environment for new labor force entrants over the next two decades. Government, education, accommodations and real estate sectors should be the most
6 | P a g e H a w a i i ’ s W o r k f o r c e
December 2010 Department of Business, Economic Development & Tourism
concerned about the turnover in their respective workforces over the next 20 years due to the higher proportion of older workers.
The change in the mix of industries towards services, in which women make up a substantial proportion of total workers, has helped to accelerate the overall increase of women in the workforce.
Native Hawaiians had the lowest overall income, with Asians second and Whites with the highest incomes overall in 2008. This finding mirrors education levels among ethnic groups, suggesting that improving educational attainment among Native Hawaiians, Asians and other non‐White ethnic/racial groups could be a major factor in addressing the income disparities.

H a w a i i ’ s W o r k f o r c e P a g e | 7
Department of Business, Economic Development & Tourism December 2010
Hawaii’s Workforce Profile
Introduction
For some years now, researchers have been tracking a number of important demographic and economic trends, such as the aging of the workforce, changing education levels and the progress of women and minorities in the labor force, to cite a few. This research has helped call attention to a number of trends that are beginning to impact the economy and public policy. For instance, the aging of the workforce is beginning to require more and more replacement workers in addition to workers needed to fill new jobs in the economy. Also, workers with only a high school education or less face more limited career opportunities than those with some amount of post‐secondary training. And, of course, the role of women in the workforce has grown substantially over the years.
But much of this research has been at the level of the economy as a whole. What is not as well understood is how these trends are reflected in the individual industry sectors of the economy. For instance, is labor turnover due to retirements more severe in particular industries? What areas of the economy now require predominantly college training? And, is the infusion of women and minorities into the economy uniform or concentrated in particular sectors?
Until recently, the data needed to address these more focused questions was available to only the major Federal statistics agencies and not very frequently at that. However, the situation has changed over the last several years with the development of a new survey program through the U.S. Census Bureau. The American Community Survey (ACS), as it is called, is an annual survey conducted by the Census Bureau in every State and county, and even for Native Hawaiian Homes Land in Hawaii. It provides critical economic, social, demographic, and housing information every year.
Moreover, the database for that survey has been made available to the public in a form called the Public Use Microdata Sample File (PUMS). This data set is available for the major industry sectors of the economy and allows researchers to drill down deeper into the economy and explore the impact of aging, education, ethnicity, earning and other socioeconomic and demographic factors at broad industry levels. It is a large data base and requires specialized database software to manipulate, but can be run on just about any modern desktop computer. In late 2009, the Census Bureau released an updated PUMS file with data through 2008.
The ACS PUMS data allows the workforce to be profiled in nearly 30 major industry sectors of Hawaii’s economy. DBEDT has used this updated PUMS file to develop a better and more up‐to‐date understanding of the Hawaii workforce, particularly in important sectors of the economy. This report combines information mined from 2008 PUMS data, with some complementary information from the Bureau of Labor Statistics (BLS), Current Population Survey (CPS) 1977‐2009 to glean an understanding of changes that have taken place in the trends over time.
For the longer trend, this study used the Current Population Survey (CPS) data. CPS is a monthly survey of about 50,000 households nationwide conducted by the Bureau of Labor Statistics (BLS). The survey has been conducted for more than 50 years, and it is the primary source of information on the labor force characteristics of the civilian non‐institutional population age 16 and over.
8 | P a g e H a w a i i ’ s W o r k f o r c e
December 2010 Department of Business, Economic Development & Tourism
Data extracted from the ACS PUMS and CPS were for the employed civilian labor force aged 18 and above with positive earnings (wage, salary or self‐employment business income).
For reference, there were about 646,000 people in Hawaii’s Labor Force in 2008. This represented a participation rate of 63% of all adult residents 18 years and above. More than 620,000 of those in the Labor force, (96%) were employed, while 26,000, (4%) were unemployed. Most of the employed persons (96%) were wage and salary workers, with the balance either self employed or proprietors.
The year 2008 was a high watermark for the labor force and employment. Since then, the recession has resulted in lower employment, some shrinkage of the total Labor Force and more unemployed workers. However, the industry profiles and characteristics revealed by the ACS data and summarized below have probably not changed significantly.
Aging of the Workforce
The first of the post World War II baby boom generation (born between 1946 and 1964) became eligible for early retirement under social security in 2008. Baby boomer retirements will accelerate over the next two decades and will not subside until the last of the boomers reach full social security retirement age of 67 in the year 2031. Over that time period the workforce will undergo significant turnover, which will be more or less rapid depending on the industry.
In 2008, 44% of all workers were 45 years of age or older, about 268,000 in number. This means that young workers (age 18‐44) accounted for only about 56% of the state’s workforce in 2008 or 335,000 workers. Over the next 20 years we can expect most of the older workers to retire, on average more than 13,000 per year. Their places in the workforce will be filled from the current workers in the 18‐44 year old group. Those workers will, in turn, need to be replaced by new workforce entrants of roughly an equal number, plus additional numbers needed to accommodate overall growth in the workforce as the economy expands. Evan at a modest growth rate, economic expansion will likely add demand for an additional 10,000+ new workers per year. Added to replacement needs this is an expectation of roughly 23,000 new workers needed in the economy each year on average. Compared with this need, the number of Hawaii residents turning workforce age will likely be only around 15,000 to 16,000 per year over the next decade.1
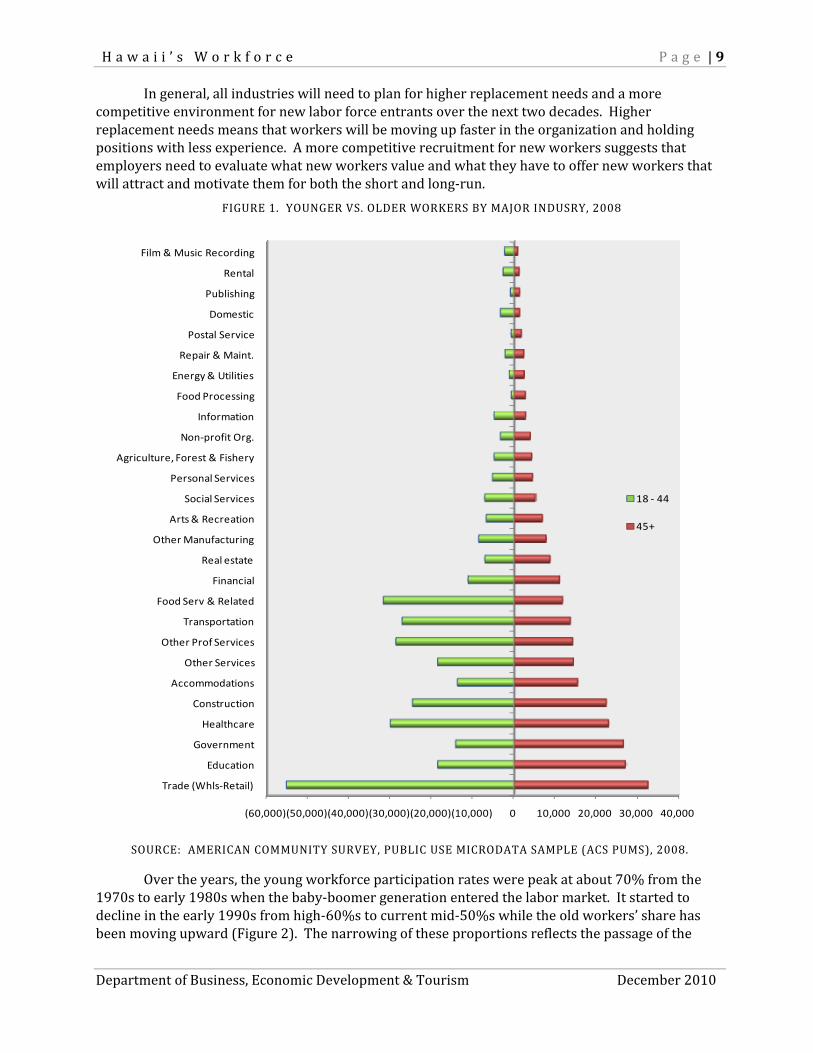
How will the impact of this labor shortage be felt by industry? Generally the smaller the proportion of older workers, the less impact an industry will feel in terms of turnover due to retirements. Looking at the distribution of workers by age and industry shows the sectors that may be impacted more or less than others by baby boom retirements. As shown in Figure 1, young workers were more likely to work in wholesale‐retail, healthcare, construction, transportation, food service, information and other professional services sectors while the older workers were more concentrated in education, government, accommodations, and real estate sectors. Young workers outweighed older workers two‐to‐one in wholesale‐retail, transportation, food service, and other professional services; while the old workers outweighed the young workers two‐to‐one in education and government sectors.
It would appear then, that government, education, accommodations and real estate should be most concerned about the turnover in their respective workforces over the next 20 years. Other industries such as trade, transportation and food service will be less impacted by the loss of older workers, but must still be aware that recruitment of younger workers for growth and replacement will see stiffer competition from other industries.
1 DBEDT, State of Hawaii Data Book 2009, Table 1.31. Based on the average number of residents aged 10 to 19 in 2009.
H a w a i i ’ s W o r k f o r c e P a g e | 9
Department of Business, Economic Development & Tourism December 2010
In general, all industries will need to plan for higher replacement needs and a more competitive environment for new labor force entrants over the next two decades. Higher replacement needs means that workers will be moving up faster in the organization and holding positions with less experience. A more competitive recruitment for new workers suggests that employers need to evaluate what new workers value and what they have to offer new workers that will attract and motivate them for both the short and long‐run.
FIGURE 1. YOUNGER VS. OLDER WORKERS BY MAJOR INDUSRY, 2008
SOURCE: AMERICAN COMMUNITY SURVEY, PUBLIC USE MICRODATA SAMPLE (ACS PUMS), 2008.
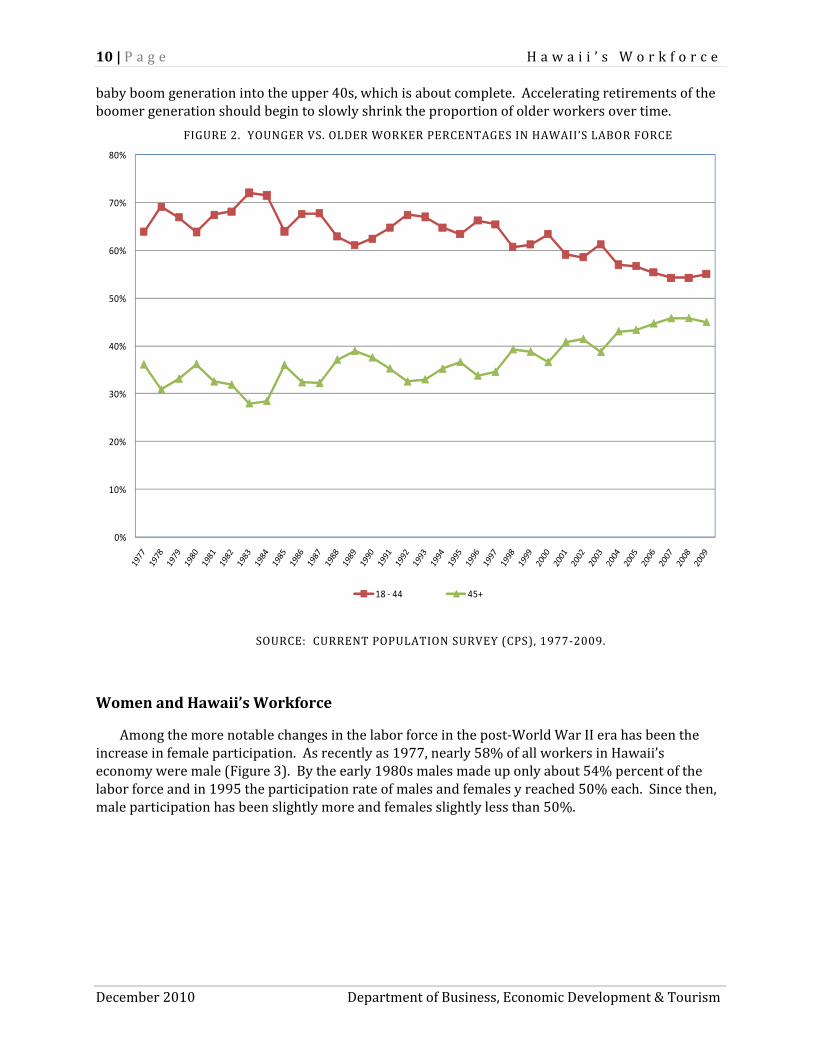
Over the years, the young workforce participation rates were peak at about 70% from the 1970s to early 1980s when the baby‐boomer generation entered the labor market. It started to decline in the early 1990s from high‐60%s to current mid‐50%s while the old workers’ share has been moving upward (Figure 2). The narrowing of these proportions reflects the passage of the
(60,000)(50,000)(40,000)(30,000)(20,000)(10,000) 0 10,000 20,000 30,000 40,000
Trade (Whls‐Retail)
Education
Government
Healthcare
Construction
Accommodations
Other Services
Other Prof Services
Transportation
Food Serv & Related
Financial
Real estate
Other Manufacturing
Arts & Recreation
Social Services
Personal Services
Agriculture, Forest & Fishery
Non‐profit Org.
Information
Food Processing
Energy & Utilities
Repair & Maint.
Postal Service
Domestic
Publishing
Rental
Film & Music Recording
18 ‐ 44
45+
10 | P a g e H a w a i i ’ s W o r k f o r c e
December 2010 Department of Business, Economic Development & Tourism
baby boom generation into the upper 40s, which is about complete. Accelerating retirements of the boomer generation should begin to slowly shrink the proportion of older workers over time.
FIGURE 2. YOUNGER VS. OLDER WORKER PERCENTAGES IN HAWAII’S LABOR FORCE
SOURCE: CURRENT POPULATION SURVEY (CPS), 1977‐2009.
Women and Hawaii’s Workforce
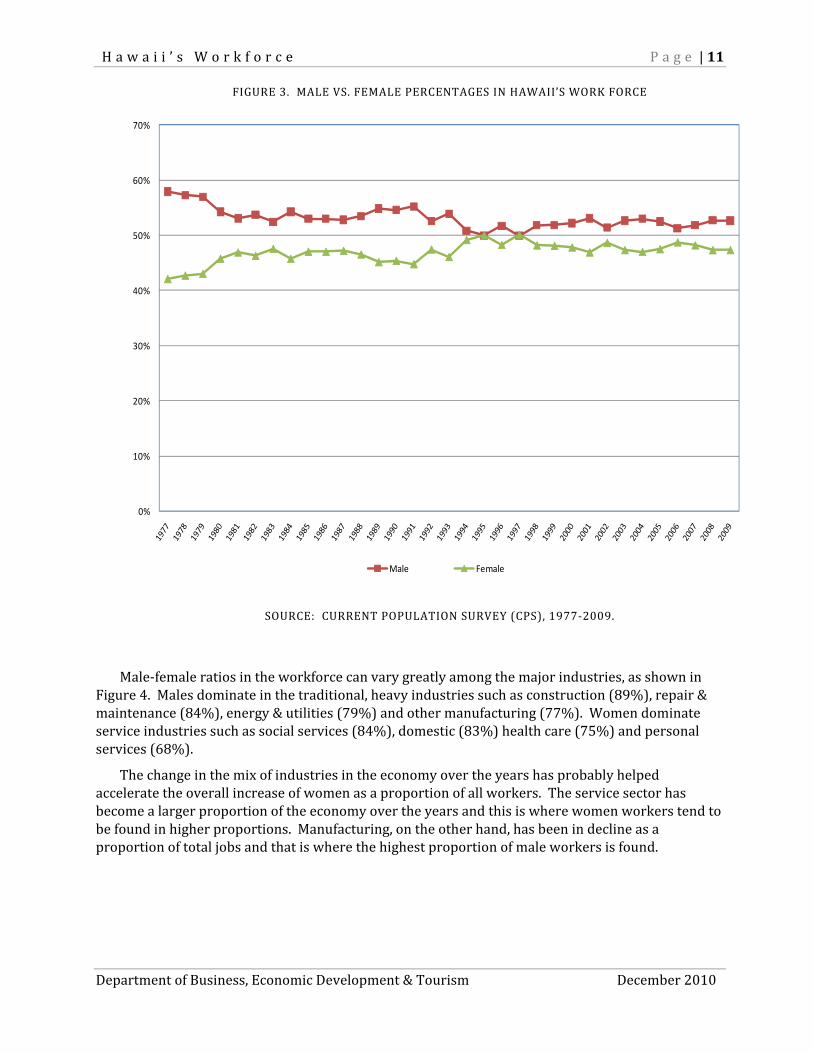
Among the more notable changes in the labor force in the post‐World War II era has been the increase in female participation. As recently as 1977, nearly 58% of all workers in Hawaii’s economy were male (Figure 3). By the early 1980s males made up only about 54% percent of the labor force and in 1995 the participation rate of males and females y reached 50% each. Since then, male participation has been slightly more and females slightly less than 50%.
0%
10%
20%
30%
40%
50%
60%
70%
80%
18 ‐ 44 45+
H a w a i i ’ s W o r k f o r c e P a g e | 11
Department of Business, Economic Development & Tourism December 2010
FIGURE 3. MALE VS. FEMALE PERCENTAGES IN HAWAII’S WORK FORCE
SOURCE: CURRENT POPULATION SURVEY (CPS), 1977‐2009.
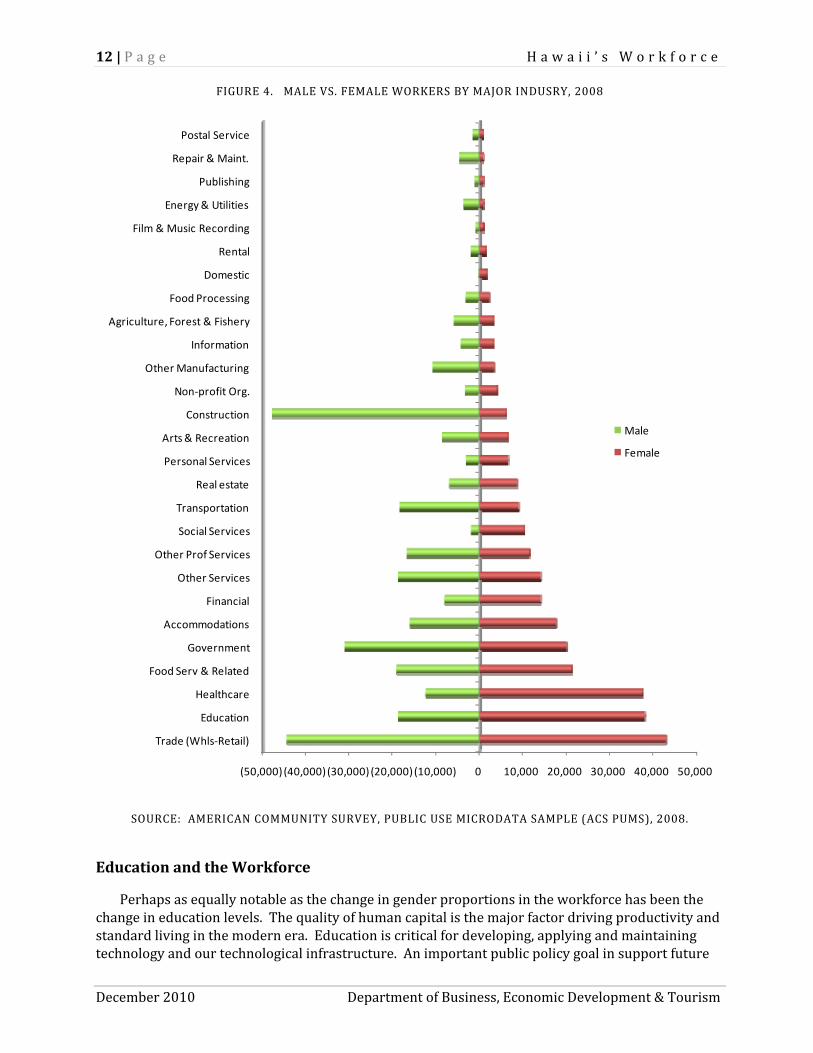
Male‐female ratios in the workforce can vary greatly among the major industries, as shown in Figure 4. Males dominate in the traditional, heavy industries such as construction (89%), repair & maintenance (84%), energy & utilities (79%) and other manufacturing (77%). Women dominate service industries such as social services (84%), domestic (83%) health care (75%) and personal services (68%).
The change in the mix of industries in the economy over the years has probably helped accelerate the overall increase of women as a proportion of all workers. The service sector has become a larger proportion of the economy over the years and this is where women workers tend to be found in higher proportions. Manufacturing, on the other hand, has been in decline as a proportion of total jobs and that is where the highest proportion of male workers is found.
0%
10%
20%
30%
40%
50%
60%
70%
Male Female
12 | P a g e H a w a i i ’ s W o r k f o r c e
December 2010 Department of Business, Economic Development & Tourism
FIGURE 4. MALE VS. FEMALE WORKERS BY MAJOR INDUSRY, 2008
SOURCE: AMERICAN COMMUNITY SURVEY, PUBLIC USE MICRODATA SAMPLE (ACS PUMS), 2008.
Education and the Workforce
Perhaps as equally notable as the change in gender proportions in the workforce has been the change in education levels. The quality of human capital is the major factor driving productivity and standard living in the modern era. Education is critical for developing, applying and maintaining technology and our technological infrastructure. An important public policy goal in support future
(50,000)(40,000)(30,000) (20,000)(10,000) 0 10,000 20,000 30,000 40,000 50,000
Trade (Whls‐Retail)
Education
Healthcare
Food Serv & Related
Government
Accommodations
Financial
Other Services
Other Prof Services
Social Services
Transportation
Real estate
Personal Services
Arts & Recreation
Construction
Non‐profit Org.
Other Manufacturing
Information
Agriculture, Forest & Fishery
Food Processing
Domestic
Rental
Film & Music Recording
Energy & Utilities
Publishing
Repair & Maint.
Postal Service
Male
Female
H a w a i i ’ s W o r k f o r c e P a g e | 13
Department of Business, Economic Development & Tourism December 2010
economic growth is to increase the proportion of residents with post‐secondary educational experience and credentials, including associate, bachelors and post graduate degrees.
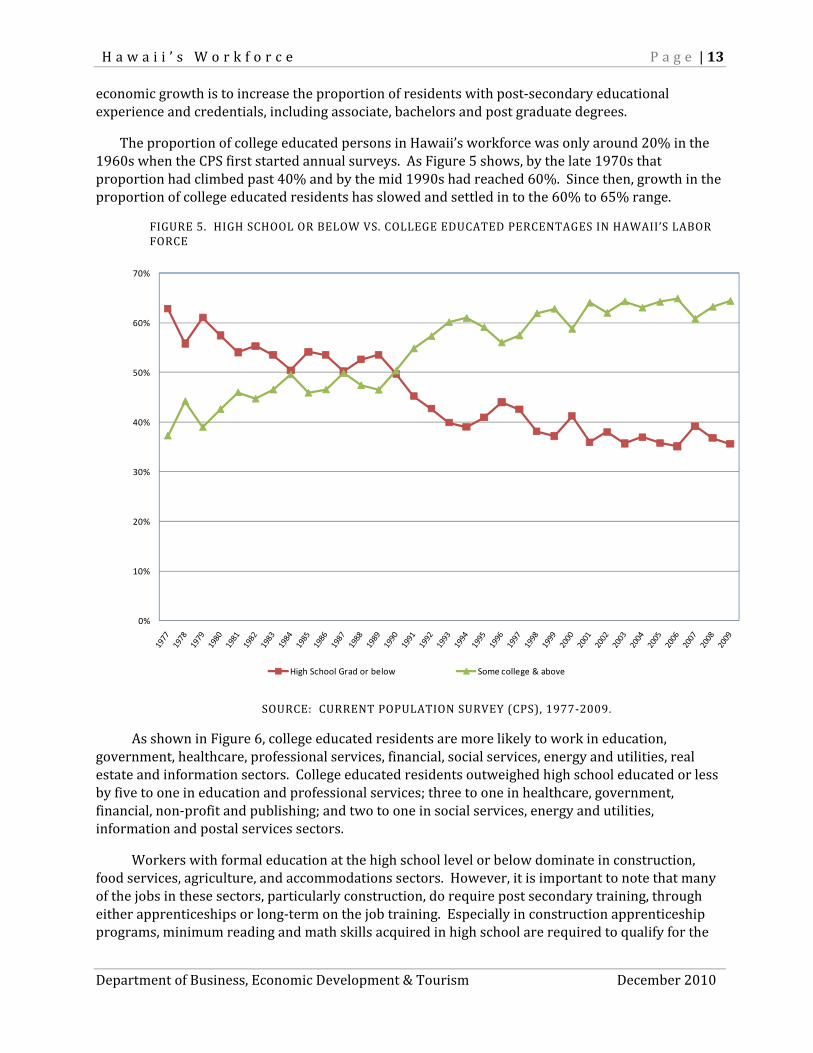
The proportion of college educated persons in Hawaii’s workforce was only around 20% in the 1960s when the CPS first started annual surveys. As Figure 5 shows, by the late 1970s that proportion had climbed past 40% and by the mid 1990s had reached 60%. Since then, growth in the proportion of college educated residents has slowed and settled in to the 60% to 65% range.
FIGURE 5. HIGH SCHOOL OR BELOW VS. COLLEGE EDUCATED PERCENTAGES IN HAWAII’S LABOR FORCE
SOURCE: CURRENT POPULATION SURVEY (CPS), 1977‐2009.
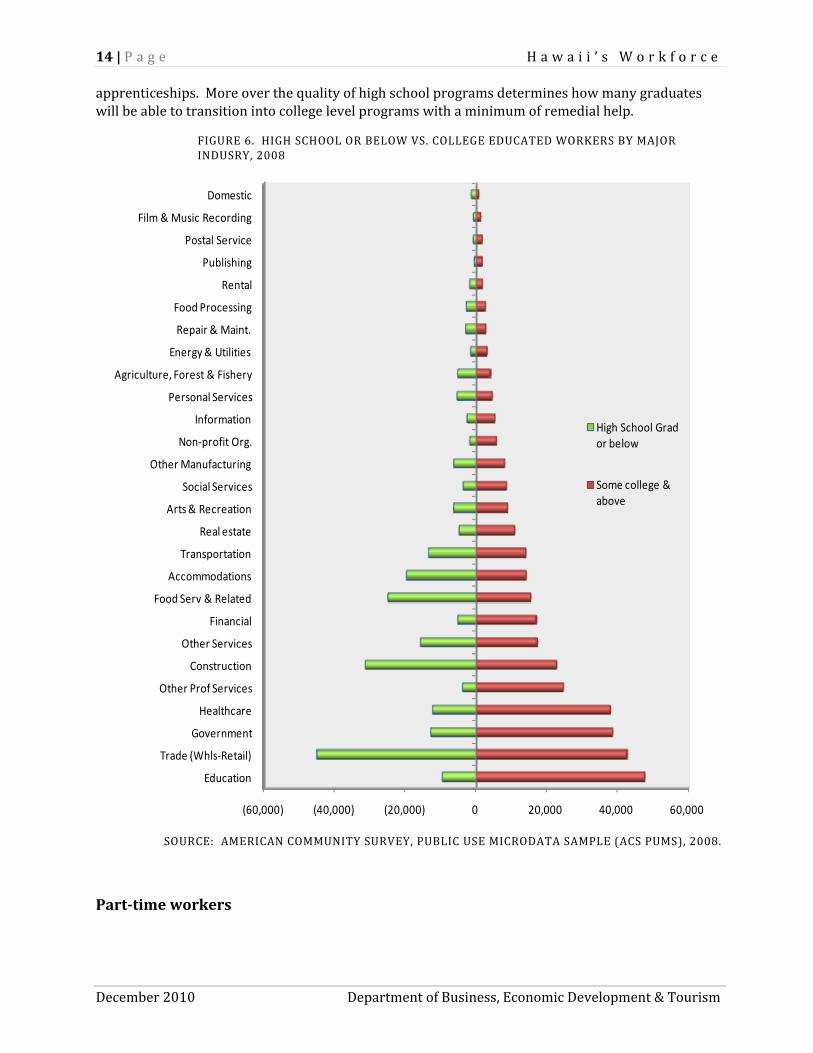
As shown in Figure 6, college educated residents are more likely to work in education, government, healthcare, professional services, financial, social services, energy and utilities, real estate and information sectors. College educated residents outweighed high school educated or less by five to one in education and professional services; three to one in healthcare, government, financial, non‐profit and publishing; and two to one in social services, energy and utilities, information and postal services sectors.
Workers with formal education at the high school level or below dominate in construction, food services, agriculture, and accommodations sectors. However, it is important to note that many of the jobs in these sectors, particularly construction, do require post secondary training, through either apprenticeships or long‐term on the job training. Especially in construction apprenticeship programs, minimum reading and math skills acquired in high school are required to qualify for the
0%
10%
20%
30%
40%
50%
60%
70%
High School Grad or below Some college & above
14 | P a g e H a w a i i ’ s W o r k f o r c e
December 2010 Department of Business, Economic Development & Tourism
apprenticeships. More over the quality of high school programs determines how many graduates will be able to transition into college level programs with a minimum of remedial help.
FIGURE 6. HIGH SCHOOL OR BELOW VS. COLLEGE EDUCATED WORKERS BY MAJOR INDUSRY, 2008
SOURCE: AMERICAN COMMUNITY SURVEY, PUBLIC USE MICRODATA SAMPLE (ACS PUMS), 2008.
Parttime workers
(60,000) (40,000) (20,000) 0 20,000 40,000 60,000
Education
Trade (Whls‐Retail)
Government
Healthcare
Other Prof Services
Construction
Other Services
Financial
Food Serv & Related
Accommodations
Transportation
Real estate
Arts & Recreation
Social Services
Other Manufacturing
Non‐profit Org.
Information
Personal Services
Agriculture, Forest & Fishery
Energy & Utilities
Repair & Maint.
Food Processing
Rental
Publishing
Postal Service
Film & Music Recording
Domestic
High School Grad or below
Some college & above
H a w a i i ’ s W o r k f o r c e P a g e | 15
Department of Business, Economic Development & Tourism December 2010
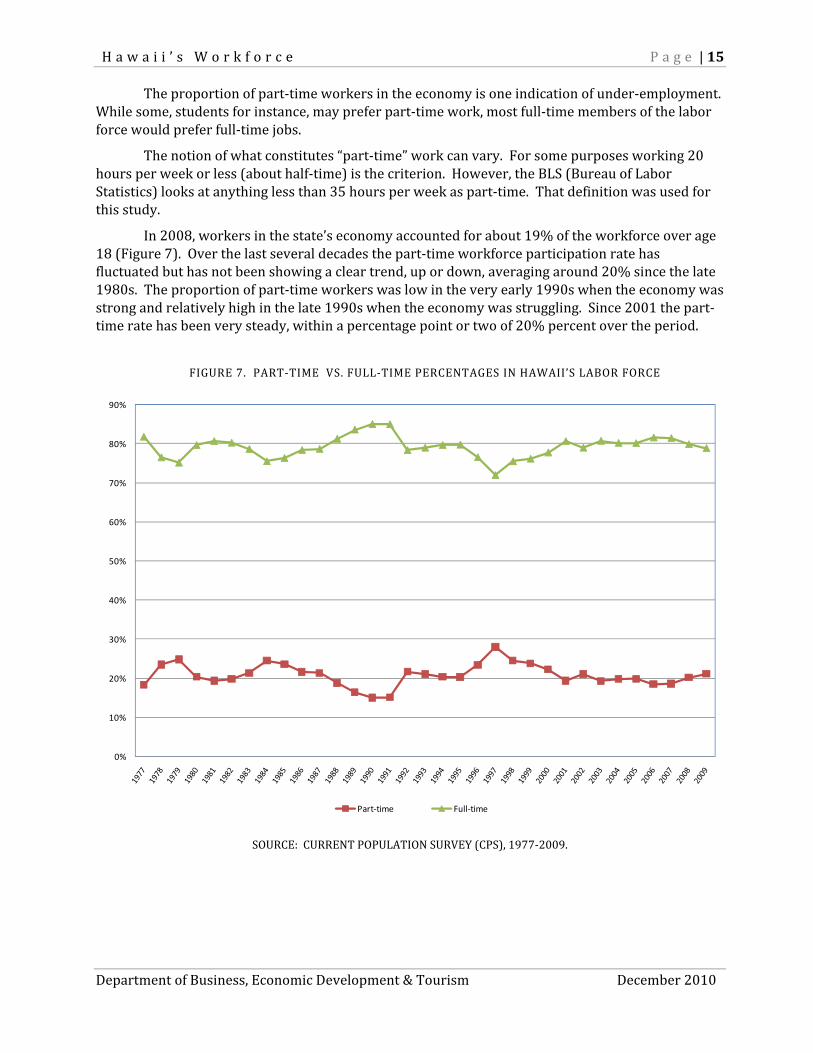
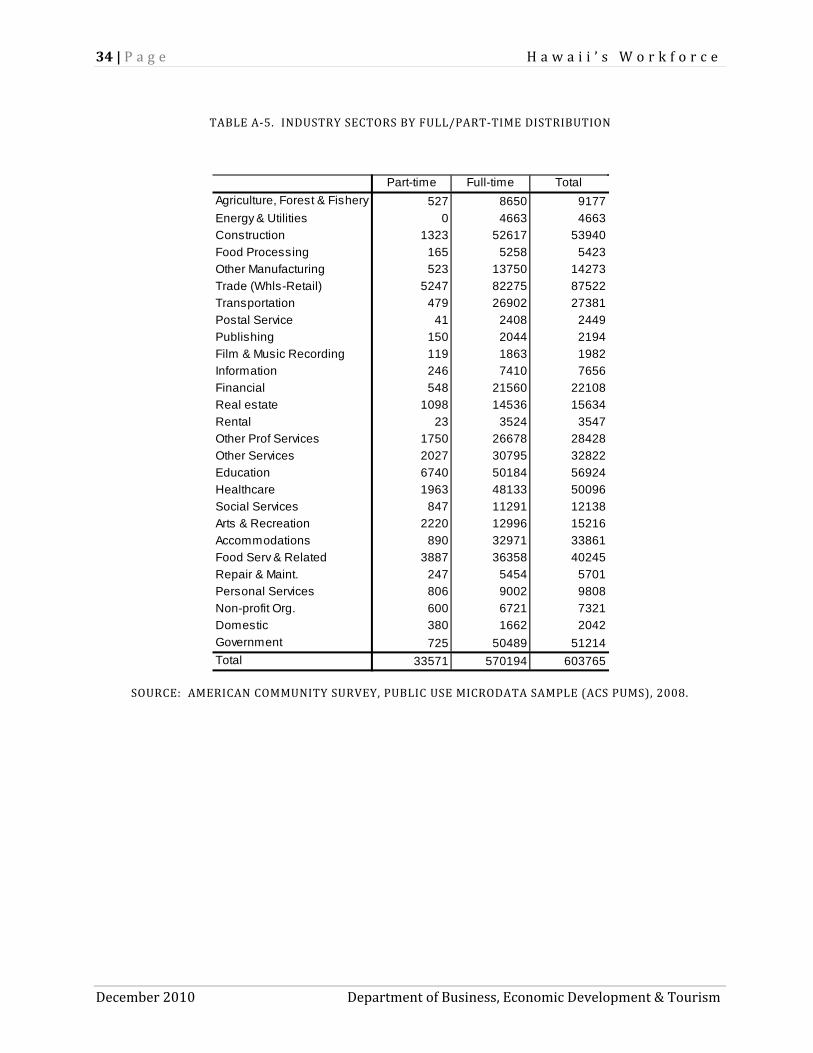
The proportion of part‐time workers in the economy is one indication of under‐employment. While some, students for instance, may prefer part‐time work, most full‐time members of the labor force would prefer full‐time jobs.
The notion of what constitutes “part‐time” work can vary. For some purposes working 20 hours per week or less (about half‐time) is the criterion. However, the BLS (Bureau of Labor Statistics) looks at anything less than 35 hours per week as part‐time. That definition was used for this study.
In 2008, workers in the state’s economy accounted for about 19% of the workforce over age 18 (Figure 7). Over the last several decades the part‐time workforce participation rate has fluctuated but has not been showing a clear trend, up or down, averaging around 20% since the late 1980s. The proportion of part‐time workers was low in the very early 1990s when the economy was strong and relatively high in the late 1990s when the economy was struggling. Since 2001 the part‐time rate has been very steady, within a percentage point or two of 20% percent over the period.
FIGURE 7. PART‐TIME VS. FULL‐TIME PERCENTAGES IN HAWAII’S LABOR FORCE
SOURCE: CURRENT POPULATION SURVEY (CPS), 1977‐2009.
0%
10%
20%
30%
40%
50%
60%
70%
80%
90%
Part‐time Full‐time
16 | P a g e H a w a i i ’ s W o r k f o r c e
December 2010 Department of Business, Economic Development & Tourism
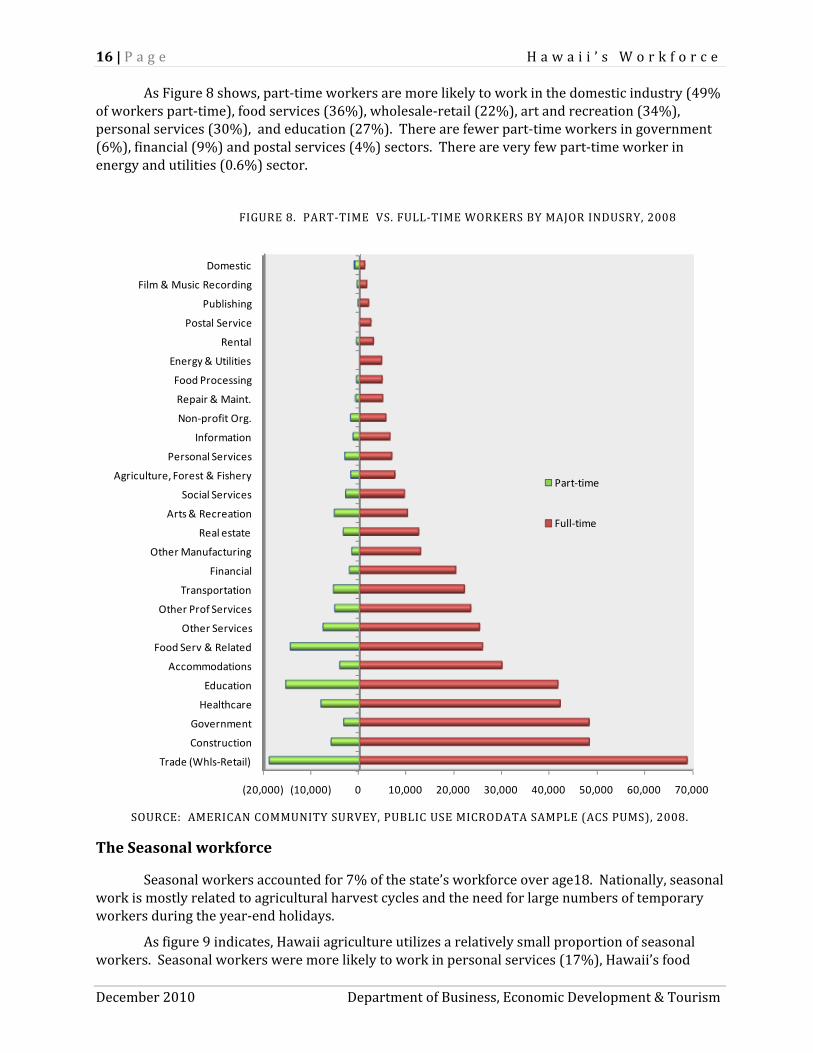
As Figure 8 shows, part‐time workers are more likely to work in the domestic industry (49% of workers part‐time), food services (36%), wholesale‐retail (22%), art and recreation (34%), personal services (30%), and education (27%). There are fewer part‐time workers in government (6%), financial (9%) and postal services (4%) sectors. There are very few part‐time worker in energy and utilities (0.6%) sector.
FIGURE 8. PART‐TIME VS. FULL‐TIME WORKERS BY MAJOR INDUSRY, 2008
SOURCE: AMERICAN COMMUNITY SURVEY, PUBLIC USE MICRODATA SAMPLE (ACS PUMS), 2008.
The Seasonal workforce
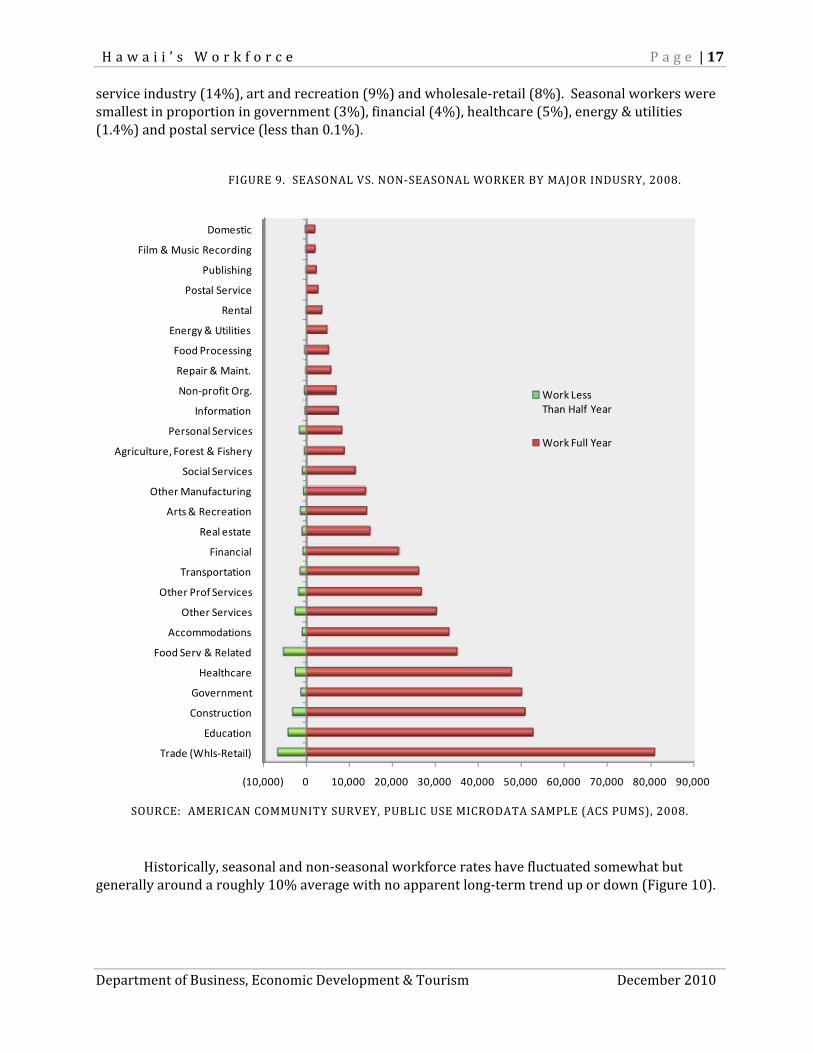
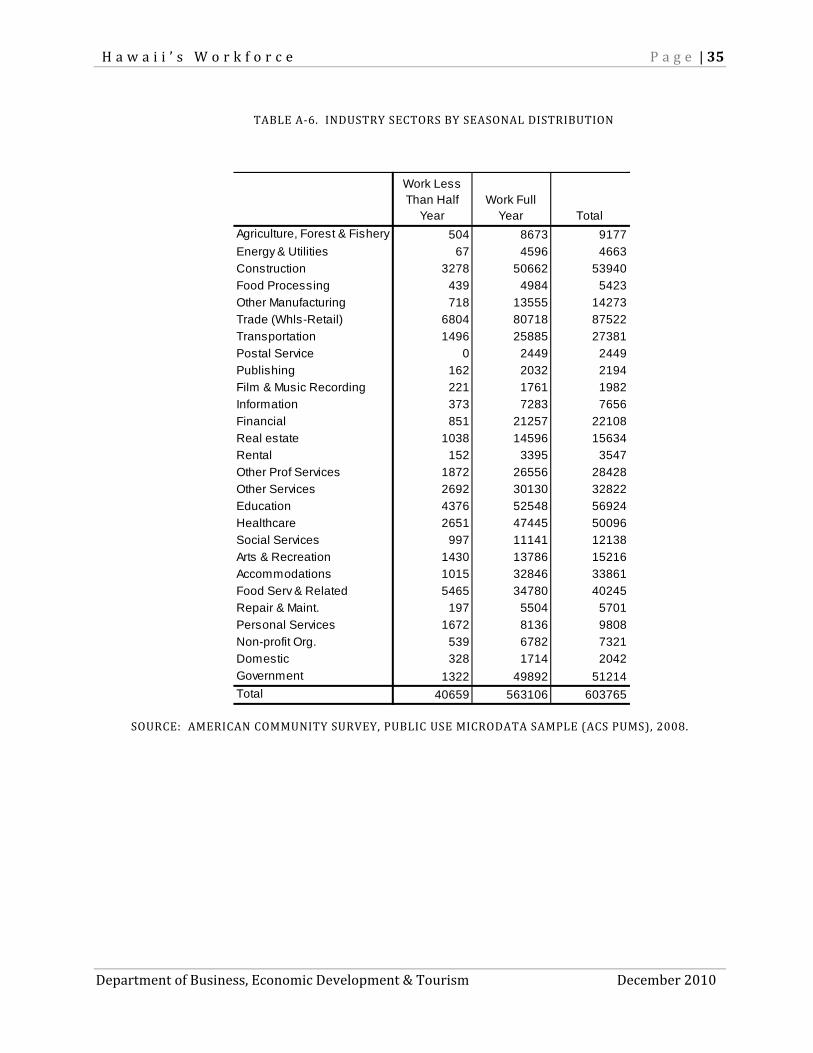
Seasonal workers accounted for 7% of the state’s workforce over age18. Nationally, seasonal work is mostly related to agricultural harvest cycles and the need for large numbers of temporary workers during the year‐end holidays.
As figure 9 indicates, Hawaii agriculture utilizes a relatively small proportion of seasonal workers. Seasonal workers were more likely to work in personal services (17%), Hawaii’s food
(20,000) (10,000) 0 10,000 20,000 30,000 40,000 50,000 60,000 70,000
Trade (Whls‐Retail)
Construction
Government
Healthcare
Education
Accommodations
Food Serv & Related
Other Services
Other Prof Services
Transportation
Financial
Other Manufacturing
Real estate
Arts & Recreation
Social Services
Agriculture, Forest & Fishery
Personal Services
Information
Non‐profit Org.
Repair & Maint.
Food Processing
Energy & Utilities
Rental
Postal Service
Publishing
Film & Music Recording
Domestic
Part‐time
Full‐time
H a w a i i ’ s W o r k f o r c e P a g e | 17
Department of Business, Economic Development & Tourism December 2010
service industry (14%), art and recreation (9%) and wholesale‐retail (8%). Seasonal workers were smallest in proportion in government (3%), financial (4%), healthcare (5%), energy & utilities (1.4%) and postal service (less than 0.1%).
FIGURE 9. SEASONAL VS. NON‐SEASONAL WORKER BY MAJOR INDUSRY, 2008.
SOURCE: AMERICAN COMMUNITY SURVEY, PUBLIC USE MICRODATA SAMPLE (ACS PUMS), 2008.
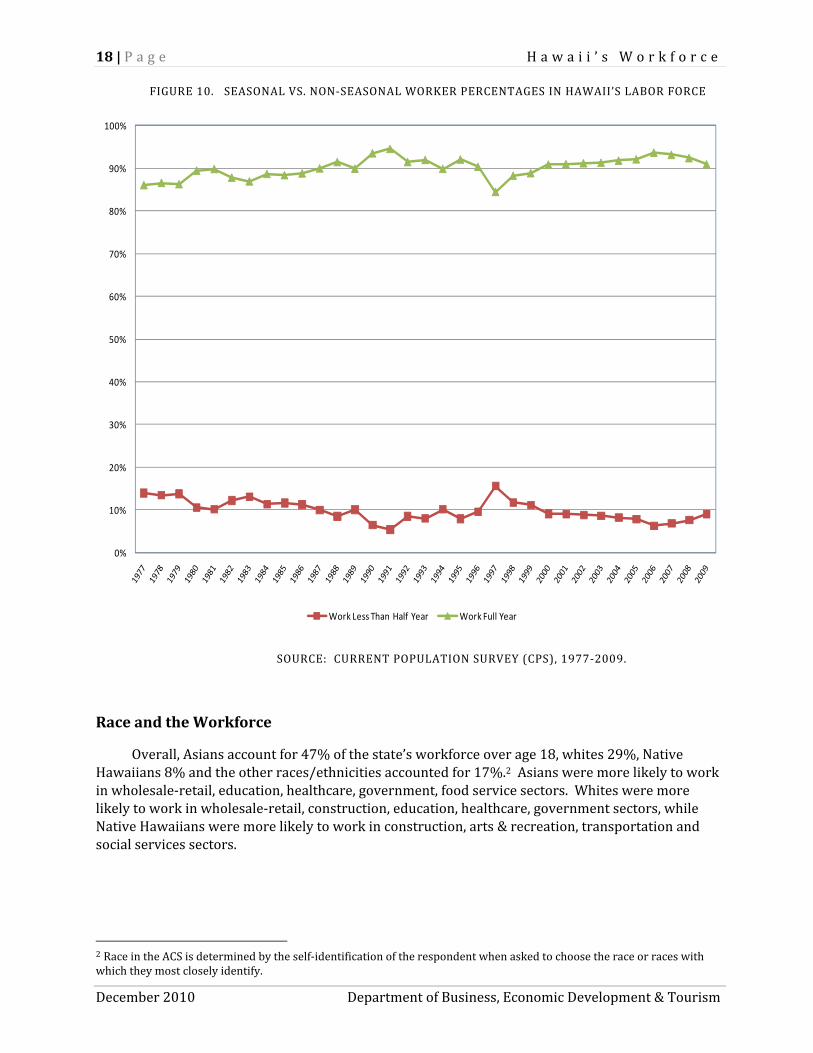
Historically, seasonal and non‐seasonal workforce rates have fluctuated somewhat but generally around a roughly 10% average with no apparent long‐term trend up or down (Figure 10).
(10,000) 0 10,000 20,000 30,000 40,000 50,000 60,000 70,000 80,000 90,000
Trade (Whls‐Retail)
Education
Construction
Government
Healthcare
Food Serv & Related
Accommodations
Other Services
Other Prof Services
Transportation
Financial
Real estate
Arts & Recreation
Other Manufacturing
Social Services
Agriculture, Forest & Fishery
Personal Services
Information
Non‐profit Org.
Repair & Maint.
Food Processing
Energy & Utilities
Rental
Postal Service
Publishing
Film & Music Recording
Domestic
Work Less Than Half Year
Work Full Year
18 | P a g e H a w a i i ’ s W o r k f o r c e
December 2010 Department of Business, Economic Development & Tourism
FIGURE 10. SEASONAL VS. NON‐SEASONAL WORKER PERCENTAGES IN HAWAII’S LABOR FORCE
SOURCE: CURRENT POPULATION SURVEY (CPS), 1977‐2009.
Race and the Workforce
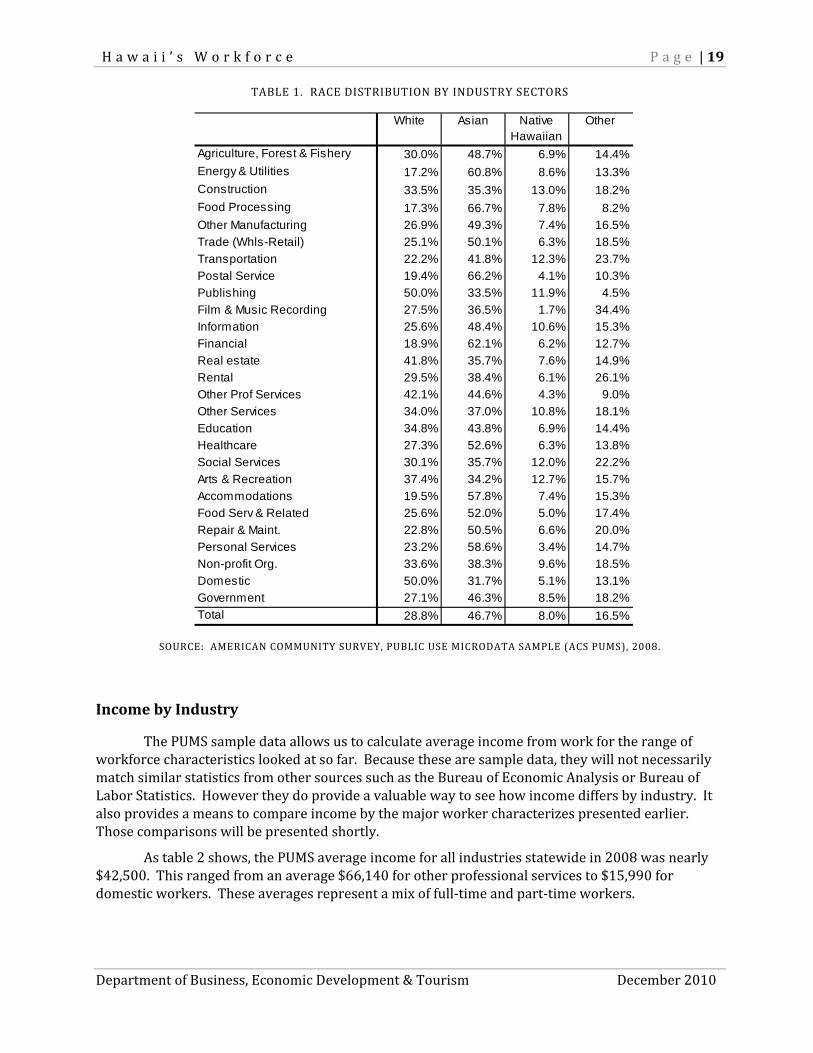
Overall, Asians account for 47% of the state’s workforce over age 18, whites 29%, Native Hawaiians 8% and the other races/ethnicities accounted for 17%.2 Asians were more likely to work in wholesale‐retail, education, healthcare, government, food service sectors. Whites were more likely to work in wholesale‐retail, construction, education, healthcare, government sectors, while Native Hawaiians were more likely to work in construction, arts & recreation, transportation and social services sectors.
2 Race in the ACS is determined by the self‐identification of the respondent when asked to choose the race or races with which they most closely identify.
0%
10%
20%
30%
40%
50%
60%
70%
80%
90%
100%
Work Less Than Half Year Work Full Year
H a w a i i ’ s W o r k f o r c e P a g e | 19
Department of Business, Economic Development & Tourism December 2010
TABLE 1. RACE DISTRIBUTION BY INDUSTRY SECTORS
SOURCE: AMERICAN COMMUNITY SURVEY, PUBLIC USE MICRODATA SAMPLE (ACS PUMS), 2008.
Income by Industry
The PUMS sample data allows us to calculate average income from work for the range of workforce characteristics looked at so far. Because these are sample data, they will not necessarily match similar statistics from other sources such as the Bureau of Economic Analysis or Bureau of Labor Statistics. However they do provide a valuable way to see how income differs by industry. It also provides a means to compare income by the major worker characterizes presented earlier. Those comparisons will be presented shortly.
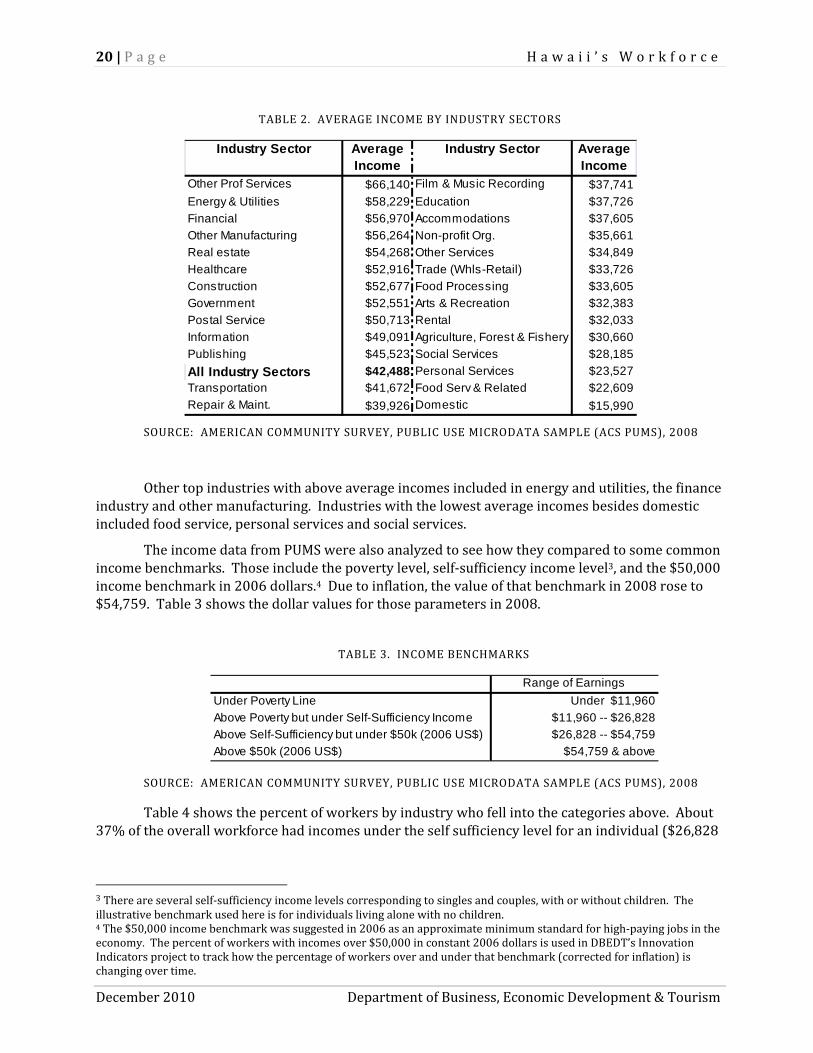
As table 2 shows, the PUMS average income for all industries statewide in 2008 was nearly $42,500. This ranged from an average $66,140 for other professional services to $15,990 for domestic workers. These averages represent a mix of full‐time and part‐time workers.
White Asian Native Hawaiian
Other
Agriculture, Forest & Fishery 30.0% 48.7% 6.9% 14.4%
Energy & Utilities 17.2% 60.8% 8.6% 13.3%
Construction 33.5% 35.3% 13.0% 18.2%
Food Processing 17.3% 66.7% 7.8% 8.2%
Other Manufacturing 26.9% 49.3% 7.4% 16.5%
Trade (Whls-Retail) 25.1% 50.1% 6.3% 18.5%
Transportation 22.2% 41.8% 12.3% 23.7%
Postal Service 19.4% 66.2% 4.1% 10.3%
Publishing 50.0% 33.5% 11.9% 4.5%
Film & Music Recording 27.5% 36.5% 1.7% 34.4%
Information 25.6% 48.4% 10.6% 15.3%
Financial 18.9% 62.1% 6.2% 12.7%
Real estate 41.8% 35.7% 7.6% 14.9%
Rental 29.5% 38.4% 6.1% 26.1%
Other Prof Services 42.1% 44.6% 4.3% 9.0%
Other Services 34.0% 37.0% 10.8% 18.1%
Education 34.8% 43.8% 6.9% 14.4%
Healthcare 27.3% 52.6% 6.3% 13.8%
Social Services 30.1% 35.7% 12.0% 22.2%
Arts & Recreation 37.4% 34.2% 12.7% 15.7%
Accommodations 19.5% 57.8% 7.4% 15.3%
Food Serv & Related 25.6% 52.0% 5.0% 17.4%
Repair & Maint. 22.8% 50.5% 6.6% 20.0%
Personal Services 23.2% 58.6% 3.4% 14.7%
Non-profit Org. 33.6% 38.3% 9.6% 18.5%
Domestic 50.0% 31.7% 5.1% 13.1%
Government 27.1% 46.3% 8.5% 18.2%
Total 28.8% 46.7% 8.0% 16.5%
20 | P a g e H a w a i i ’ s W o r k f o r c e
December 2010 Department of Business, Economic Development & Tourism
TABLE 2. AVERAGE INCOME BY INDUSTRY SECTORS
SOURCE: AMERICAN COMMUNITY SURVEY, PUBLIC USE MICRODATA SAMPLE (ACS PUMS), 2008
Other top industries with above average incomes included in energy and utilities, the finance industry and other manufacturing. Industries with the lowest average incomes besides domestic included food service, personal services and social services.
The income data from PUMS were also analyzed to see how they compared to some common income benchmarks. Those include the poverty level, self‐sufficiency income level3, and the $50,000 income benchmark in 2006 dollars.4 Due to inflation, the value of that benchmark in 2008 rose to $54,759. Table 3 shows the dollar values for those parameters in 2008.
TABLE 3. INCOME BENCHMARKS
SOURCE: AMERICAN COMMUNITY SURVEY, PUBLIC USE MICRODATA SAMPLE (ACS PUMS), 2008
Table 4 shows the percent of workers by industry who fell into the categories above. About 37% of the overall workforce had incomes under the self sufficiency level for an individual ($26,828
3 There are several self‐sufficiency income levels corresponding to singles and couples, with or without children. The illustrative benchmark used here is for individuals living alone with no children. 4 The $50,000 income benchmark was suggested in 2006 as an approximate minimum standard for high‐paying jobs in the economy. The percent of workers with incomes over $50,000 in constant 2006 dollars is used in DBEDT’s Innovation Indicators project to track how the percentage of workers over and under that benchmark (corrected for inflation) is changing over time.
Industry Sector Average Income
Industry Sector Average Income
Other Prof Services $66,140 Film & Music Recording $37,741
Energy & Utilities $58,229 Education $37,726
Financial $56,970 Accommodations $37,605
Other Manufacturing $56,264 Non-profit Org. $35,661
Real estate $54,268 Other Services $34,849
Healthcare $52,916 Trade (Whls-Retail) $33,726
Construction $52,677 Food Processing $33,605
Government $52,551 Arts & Recreation $32,383
Postal Service $50,713 Rental $32,033
Information $49,091 Agriculture, Forest & Fishery $30,660
Publishing $45,523 Social Services $28,185
All Industry Sectors $42,488 Personal Services $23,527
Transportation $41,672 Food Serv & Related $22,609
Repair & Maint. $39,926 Domestic $15,990
Range of Earnings
Under Poverty Line Under $11,960
Above Poverty but under Self-Sufficiency Income $11,960 -- $26,828
Above Self-Sufficiency but under $50k (2006 US$) $26,828 -- $54,759
Above $50k (2006 US$) $54,759 & above
H a w a i i ’ s W o r k f o r c e P a g e | 21
Department of Business, Economic Development & Tourism December 2010
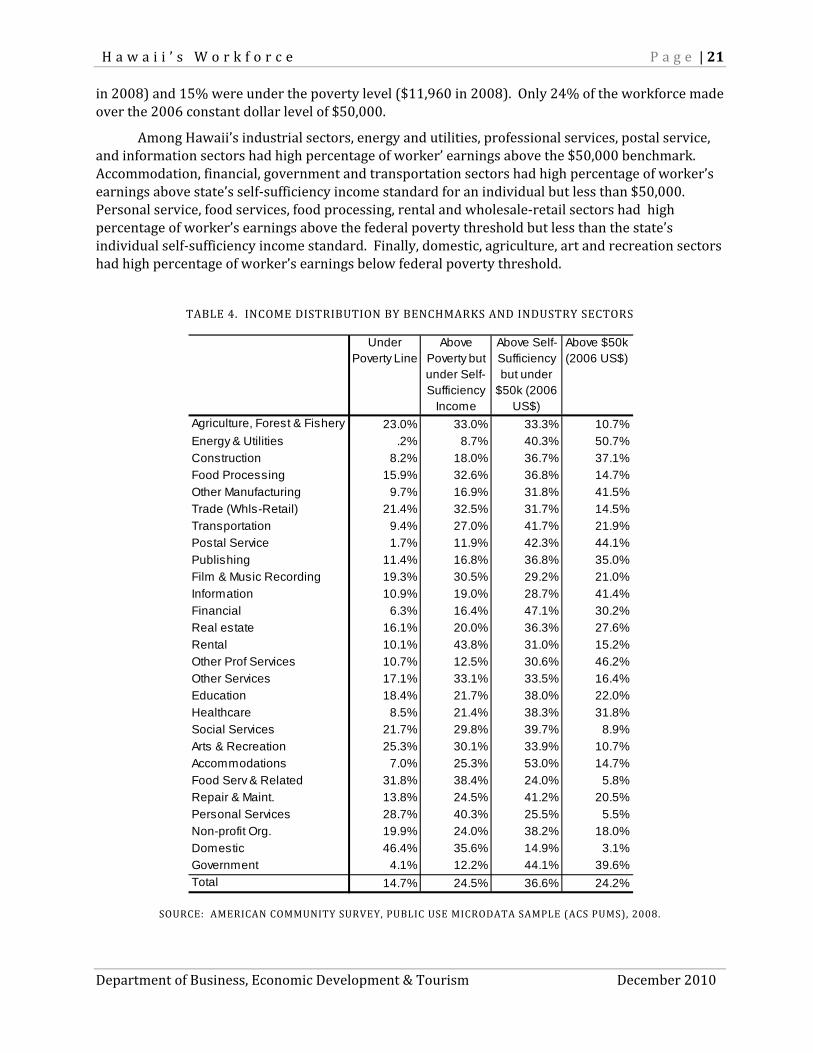
in 2008) and 15% were under the poverty level ($11,960 in 2008). Only 24% of the workforce made over the 2006 constant dollar level of $50,000.
Among Hawaii’s industrial sectors, energy and utilities, professional services, postal service, and information sectors had high percentage of worker’ earnings above the $50,000 benchmark. Accommodation, financial, government and transportation sectors had high percentage of worker’s earnings above state’s self‐sufficiency income standard for an individual but less than $50,000. Personal service, food services, food processing, rental and wholesale‐retail sectors had high percentage of worker’s earnings above the federal poverty threshold but less than the state’s individual self‐sufficiency income standard. Finally, domestic, agriculture, art and recreation sectors had high percentage of worker’s earnings below federal poverty threshold.
TABLE 4. INCOME DISTRIBUTION BY BENCHMARKS AND INDUSTRY SECTORS
SOURCE: AMERICAN COMMUNITY SURVEY, PUBLIC USE MICRODATA SAMPLE (ACS PUMS), 2008.
Under Poverty Line
Above Poverty but under Self-Sufficiency
Income
Above Self-Sufficiency but under
$50k (2006 US$)
Above $50k (2006 US$)
Agriculture, Forest & Fishery 23.0% 33.0% 33.3% 10.7%
Energy & Utilities .2% 8.7% 40.3% 50.7%
Construction 8.2% 18.0% 36.7% 37.1%
Food Processing 15.9% 32.6% 36.8% 14.7%
Other Manufacturing 9.7% 16.9% 31.8% 41.5%
Trade (Whls-Retail) 21.4% 32.5% 31.7% 14.5%
Transportation 9.4% 27.0% 41.7% 21.9%
Postal Service 1.7% 11.9% 42.3% 44.1%
Publishing 11.4% 16.8% 36.8% 35.0%
Film & Music Recording 19.3% 30.5% 29.2% 21.0%
Information 10.9% 19.0% 28.7% 41.4%
Financial 6.3% 16.4% 47.1% 30.2%
Real estate 16.1% 20.0% 36.3% 27.6%
Rental 10.1% 43.8% 31.0% 15.2%
Other Prof Services 10.7% 12.5% 30.6% 46.2%
Other Services 17.1% 33.1% 33.5% 16.4%
Education 18.4% 21.7% 38.0% 22.0%
Healthcare 8.5% 21.4% 38.3% 31.8%
Social Services 21.7% 29.8% 39.7% 8.9%
Arts & Recreation 25.3% 30.1% 33.9% 10.7%
Accommodations 7.0% 25.3% 53.0% 14.7%
Food Serv & Related 31.8% 38.4% 24.0% 5.8%
Repair & Maint. 13.8% 24.5% 41.2% 20.5%
Personal Services 28.7% 40.3% 25.5% 5.5%
Non-profit Org. 19.9% 24.0% 38.2% 18.0%
Domestic 46.4% 35.6% 14.9% 3.1%
Government 4.1% 12.2% 44.1% 39.6%
Total 14.7% 24.5% 36.6% 24.2%
22 | P a g e H a w a i i ’ s W o r k f o r c e
December 2010 Department of Business, Economic Development & Tourism
Cross Trends: Gender, Aging, Income, Education and Ethnicity
In addition to looking at industries, the PUMS data allows us to look at a number of issues of interest.
Gender and Income
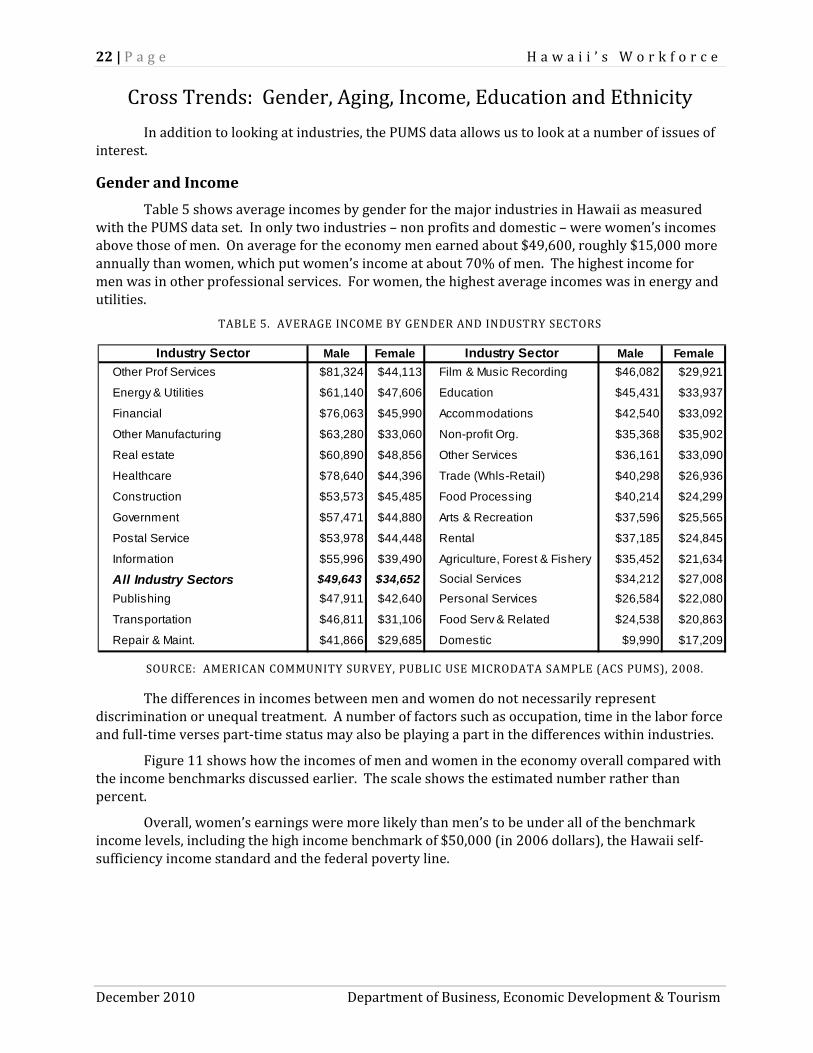
Table 5 shows average incomes by gender for the major industries in Hawaii as measured with the PUMS data set. In only two industries – non profits and domestic – were women’s incomes above those of men. On average for the economy men earned about $49,600, roughly $15,000 more annually than women, which put women’s income at about 70% of men. The highest income for men was in other professional services. For women, the highest average incomes was in energy and utilities.
TABLE 5. AVERAGE INCOME BY GENDER AND INDUSTRY SECTORS
SOURCE: AMERICAN COMMUNITY SURVEY, PUBLIC USE MICRODATA SAMPLE (ACS PUMS), 2008.
The differences in incomes between men and women do not necessarily represent discrimination or unequal treatment. A number of factors such as occupation, time in the labor force and full‐time verses part‐time status may also be playing a part in the differences within industries.
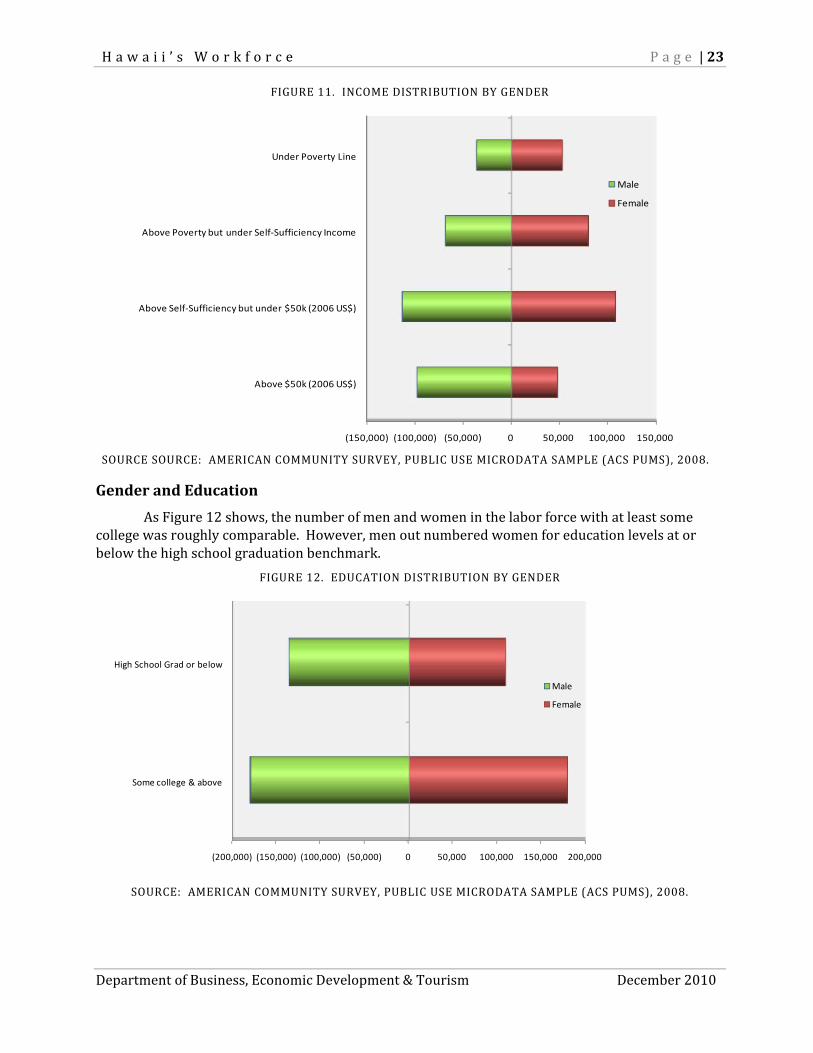
Figure 11 shows how the incomes of men and women in the economy overall compared with the income benchmarks discussed earlier. The scale shows the estimated number rather than percent.
Overall, women’s earnings were more likely than men’s to be under all of the benchmark income levels, including the high income benchmark of $50,000 (in 2006 dollars), the Hawaii self‐sufficiency income standard and the federal poverty line.
Industry Sector Male Female Industry Sector Male Female
Other Prof Services $81,324 $44,113 Film & Music Recording $46,082 $29,921
Energy & Utilities $61,140 $47,606 Education $45,431 $33,937
Financial $76,063 $45,990 Accommodations $42,540 $33,092
Other Manufacturing $63,280 $33,060 Non-profit Org. $35,368 $35,902
Real estate $60,890 $48,856 Other Services $36,161 $33,090
Healthcare $78,640 $44,396 Trade (Whls-Retail) $40,298 $26,936
Construction $53,573 $45,485 Food Processing $40,214 $24,299
Government $57,471 $44,880 Arts & Recreation $37,596 $25,565
Postal Service $53,978 $44,448 Rental $37,185 $24,845
Information $55,996 $39,490 Agriculture, Forest & Fishery $35,452 $21,634
All Industry Sectors $49,643 $34,652 Social Services $34,212 $27,008
Publishing $47,911 $42,640 Personal Services $26,584 $22,080
Transportation $46,811 $31,106 Food Serv & Related $24,538 $20,863
Repair & Maint. $41,866 $29,685 Domestic $9,990 $17,209
H a w a i i ’ s W o r k f o r c e P a g e | 23
Department of Business, Economic Development & Tourism December 2010
FIGURE 11. INCOME DISTRIBUTION BY GENDER
SOURCE SOURCE: AMERICAN COMMUNITY SURVEY, PUBLIC USE MICRODATA SAMPLE (ACS PUMS), 2008.
Gender and Education
As Figure 12 shows, the number of men and women in the labor force with at least some college was roughly comparable. However, men out numbered women for education levels at or below the high school graduation benchmark.
FIGURE 12. EDUCATION DISTRIBUTION BY GENDER
SOURCE: AMERICAN COMMUNITY SURVEY, PUBLIC USE MICRODATA SAMPLE (ACS PUMS), 2008.
(150,000) (100,000) (50,000) 0 50,000 100,000 150,000
Above $50k (2006 US$)
Above Self‐Sufficiency but under $50k (2006 US$)
Above Poverty but under Self‐Sufficiency Income
Under Poverty Line
Male
Female
(200,000) (150,000) (100,000) (50,000) 0 50,000 100,000 150,000 200,000
Some college & above
High School Grad or below
Male
Female
24 | P a g e H a w a i i ’ s W o r k f o r c e
December 2010 Department of Business, Economic Development & Tourism
Gender and the Aging of the Workforce
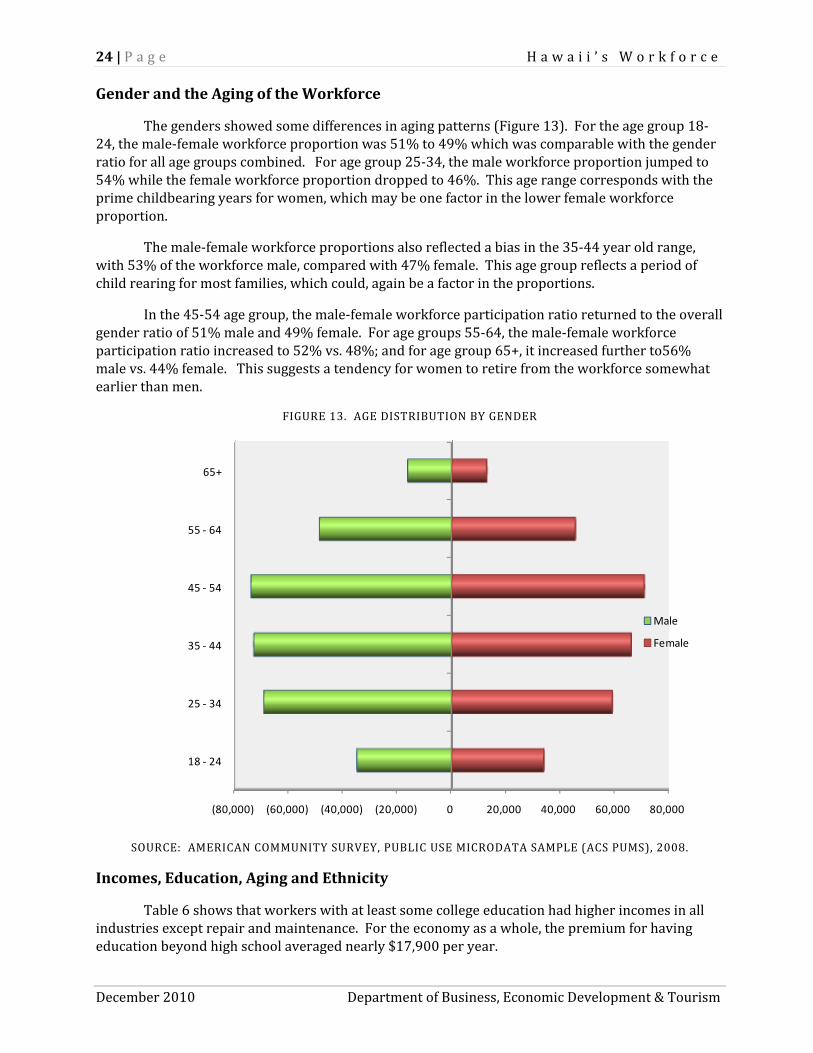
The genders showed some differences in aging patterns (Figure 13). For the age group 18‐24, the male‐female workforce proportion was 51% to 49% which was comparable with the gender ratio for all age groups combined. For age group 25‐34, the male workforce proportion jumped to 54% while the female workforce proportion dropped to 46%. This age range corresponds with the prime childbearing years for women, which may be one factor in the lower female workforce proportion.
The male‐female workforce proportions also reflected a bias in the 35‐44 year old range, with 53% of the workforce male, compared with 47% female. This age group reflects a period of child rearing for most families, which could, again be a factor in the proportions.
In the 45‐54 age group, the male‐female workforce participation ratio returned to the overall gender ratio of 51% male and 49% female. For age groups 55‐64, the male‐female workforce participation ratio increased to 52% vs. 48%; and for age group 65+, it increased further to56% male vs. 44% female. This suggests a tendency for women to retire from the workforce somewhat earlier than men.
FIGURE 13. AGE DISTRIBUTION BY GENDER
SOURCE: AMERICAN COMMUNITY SURVEY, PUBLIC USE MICRODATA SAMPLE (ACS PUMS), 2008.
Incomes, Education, Aging and Ethnicity
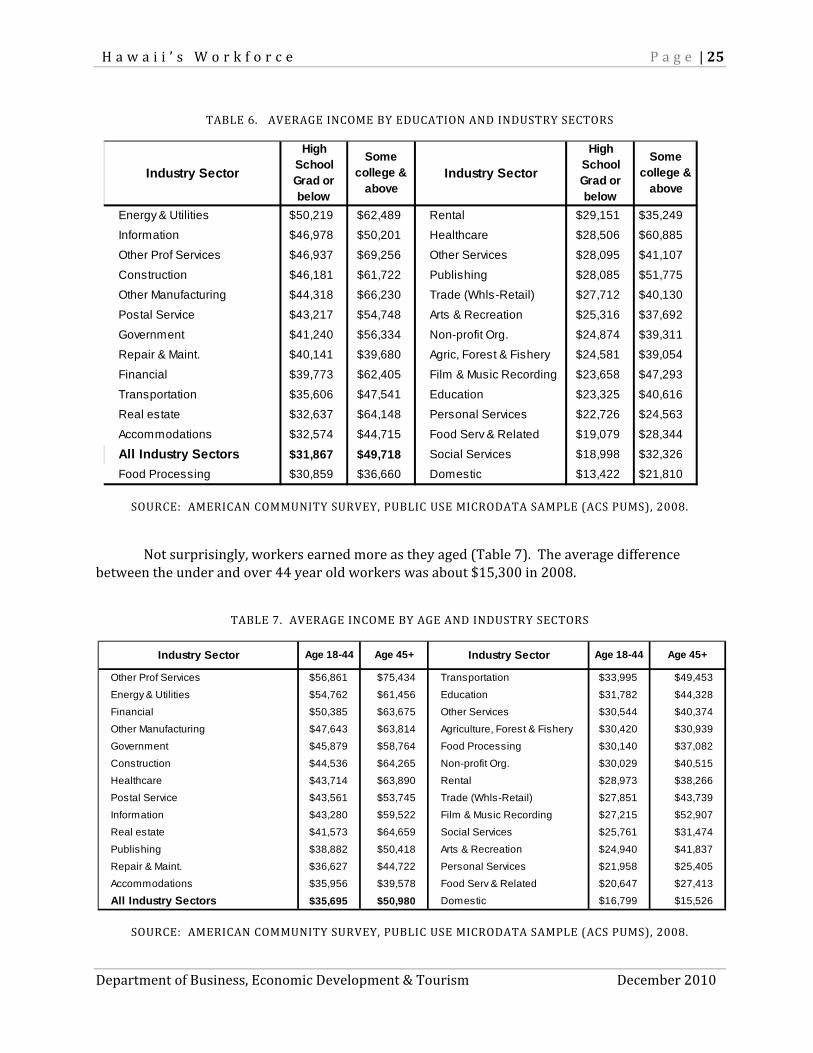
Table 6 shows that workers with at least some college education had higher incomes in all industries except repair and maintenance. For the economy as a whole, the premium for having education beyond high school averaged nearly $17,900 per year.
(80,000) (60,000) (40,000) (20,000) 0 20,000 40,000 60,000 80,000
18 ‐ 24
25 ‐ 34
35 ‐ 44
45 ‐ 54
55 ‐ 64
65+
Male
Female
H a w a i i ’ s W o r k f o r c e P a g e | 25
Department of Business, Economic Development & Tourism December 2010
TABLE 6. AVERAGE INCOME BY EDUCATION AND INDUSTRY SECTORS
SOURCE: AMERICAN COMMUNITY SURVEY, PUBLIC USE MICRODATA SAMPLE (ACS PUMS), 2008.
Not surprisingly, workers earned more as they aged (Table 7). The average difference
between the under and over 44 year old workers was about $15,300 in 2008.
TABLE 7. AVERAGE INCOME BY AGE AND INDUSTRY SECTORS
SOURCE: AMERICAN COMMUNITY SURVEY, PUBLIC USE MICRODATA SAMPLE (ACS PUMS), 2008.
Industry Sector
High School Grad or below
Some college &
aboveIndustry Sector
High School Grad or below
Some college &
above
Energy & Utilities $50,219 $62,489 Rental $29,151 $35,249
Information $46,978 $50,201 Healthcare $28,506 $60,885
Other Prof Services $46,937 $69,256 Other Services $28,095 $41,107
Construction $46,181 $61,722 Publishing $28,085 $51,775
Other Manufacturing $44,318 $66,230 Trade (Whls-Retail) $27,712 $40,130
Postal Service $43,217 $54,748 Arts & Recreation $25,316 $37,692
Government $41,240 $56,334 Non-profit Org. $24,874 $39,311
Repair & Maint. $40,141 $39,680 Agric, Forest & Fishery $24,581 $39,054
Financial $39,773 $62,405 Film & Music Recording $23,658 $47,293
Transportation $35,606 $47,541 Education $23,325 $40,616
Real estate $32,637 $64,148 Personal Services $22,726 $24,563
Accommodations $32,574 $44,715 Food Serv & Related $19,079 $28,344
All Industry Sectors $31,867 $49,718 Social Services $18,998 $32,326
Food Processing $30,859 $36,660 Domestic $13,422 $21,810
Industry Sector Age 18-44 Age 45+ Industry Sector Age 18-44 Age 45+
Other Prof Services $56,861 $75,434 Transportation $33,995 $49,453
Energy & Utilities $54,762 $61,456 Education $31,782 $44,328
Financial $50,385 $63,675 Other Services $30,544 $40,374
Other Manufacturing $47,643 $63,814 Agriculture, Forest & Fishery $30,420 $30,939
Government $45,879 $58,764 Food Processing $30,140 $37,082
Construction $44,536 $64,265 Non-profit Org. $30,029 $40,515
Healthcare $43,714 $63,890 Rental $28,973 $38,266
Postal Service $43,561 $53,745 Trade (Whls-Retail) $27,851 $43,739
Information $43,280 $59,522 Film & Music Recording $27,215 $52,907
Real estate $41,573 $64,659 Social Services $25,761 $31,474
Publishing $38,882 $50,418 Arts & Recreation $24,940 $41,837
Repair & Maint. $36,627 $44,722 Personal Services $21,958 $25,405
Accommodations $35,956 $39,578 Food Serv & Related $20,647 $27,413
All Industry Sectors $35,695 $50,980 Domestic $16,799 $15,526
26 | P a g e H a w a i i ’ s W o r k f o r c e
December 2010 Department of Business, Economic Development & Tourism
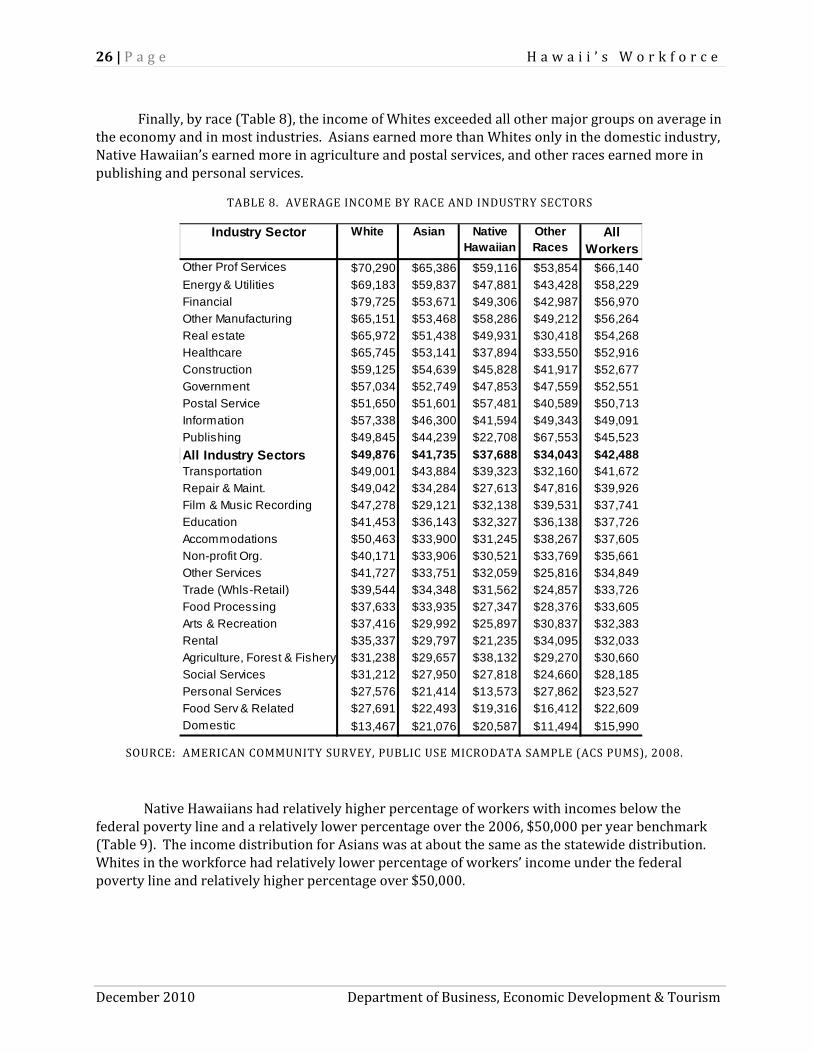
Finally, by race (Table 8), the income of Whites exceeded all other major groups on average in the economy and in most industries. Asians earned more than Whites only in the domestic industry, Native Hawaiian’s earned more in agriculture and postal services, and other races earned more in publishing and personal services.
TABLE 8. AVERAGE INCOME BY RACE AND INDUSTRY SECTORS
SOURCE: AMERICAN COMMUNITY SURVEY, PUBLIC USE MICRODATA SAMPLE (ACS PUMS), 2008.
Native Hawaiians had relatively higher percentage of workers with incomes below the federal poverty line and a relatively lower percentage over the 2006, $50,000 per year benchmark (Table 9). The income distribution for Asians was at about the same as the statewide distribution. Whites in the workforce had relatively lower percentage of workers’ income under the federal poverty line and relatively higher percentage over $50,000.
Industry Sector White Asian Native Hawaiian
Other Races
All Workers
Other Prof Services $70,290 $65,386 $59,116 $53,854 $66,140
Energy & Utilities $69,183 $59,837 $47,881 $43,428 $58,229
Financial $79,725 $53,671 $49,306 $42,987 $56,970
Other Manufacturing $65,151 $53,468 $58,286 $49,212 $56,264
Real estate $65,972 $51,438 $49,931 $30,418 $54,268
Healthcare $65,745 $53,141 $37,894 $33,550 $52,916
Construction $59,125 $54,639 $45,828 $41,917 $52,677
Government $57,034 $52,749 $47,853 $47,559 $52,551
Postal Service $51,650 $51,601 $57,481 $40,589 $50,713
Information $57,338 $46,300 $41,594 $49,343 $49,091
Publishing $49,845 $44,239 $22,708 $67,553 $45,523
All Industry Sectors $49,876 $41,735 $37,688 $34,043 $42,488Transportation $49,001 $43,884 $39,323 $32,160 $41,672
Repair & Maint. $49,042 $34,284 $27,613 $47,816 $39,926
Film & Music Recording $47,278 $29,121 $32,138 $39,531 $37,741
Education $41,453 $36,143 $32,327 $36,138 $37,726
Accommodations $50,463 $33,900 $31,245 $38,267 $37,605
Non-profit Org. $40,171 $33,906 $30,521 $33,769 $35,661
Other Services $41,727 $33,751 $32,059 $25,816 $34,849
Trade (Whls-Retail) $39,544 $34,348 $31,562 $24,857 $33,726
Food Processing $37,633 $33,935 $27,347 $28,376 $33,605
Arts & Recreation $37,416 $29,992 $25,897 $30,837 $32,383
Rental $35,337 $29,797 $21,235 $34,095 $32,033
Agriculture, Forest & Fishery $31,238 $29,657 $38,132 $29,270 $30,660
Social Services $31,212 $27,950 $27,818 $24,660 $28,185
Personal Services $27,576 $21,414 $13,573 $27,862 $23,527
Food Serv & Related $27,691 $22,493 $19,316 $16,412 $22,609
Domestic $13,467 $21,076 $20,587 $11,494 $15,990
H a w a i i ’ s W o r k f o r c e P a g e | 27
Department of Business, Economic Development & Tourism December 2010
TABLE 9. AVERAGE INCOME BY RACE AND INCOME BENCHMARKS
SOURCE: AMERICAN COMMUNITY SURVEY, PUBLIC USE MICRODATA SAMPLE (ACS PUMS), 2008.
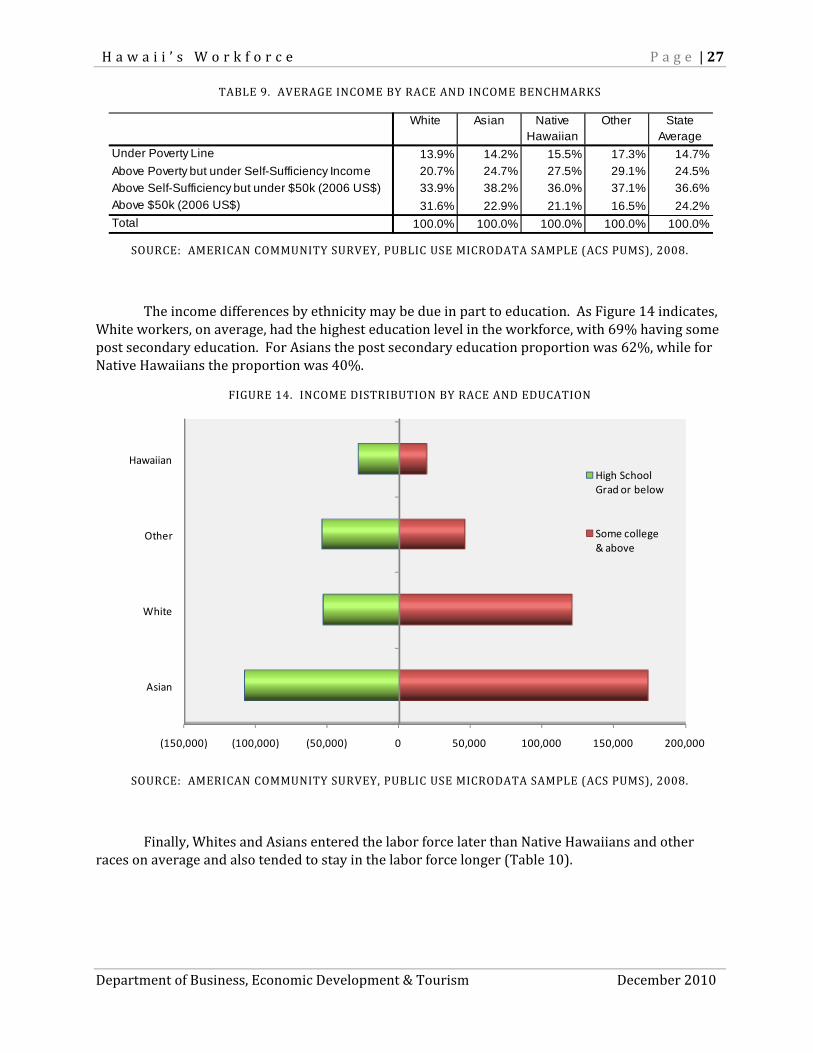
The income differences by ethnicity may be due in part to education. As Figure 14 indicates, White workers, on average, had the highest education level in the workforce, with 69% having some post secondary education. For Asians the post secondary education proportion was 62%, while for Native Hawaiians the proportion was 40%.
FIGURE 14. INCOME DISTRIBUTION BY RACE AND EDUCATION
SOURCE: AMERICAN COMMUNITY SURVEY, PUBLIC USE MICRODATA SAMPLE (ACS PUMS), 2008.
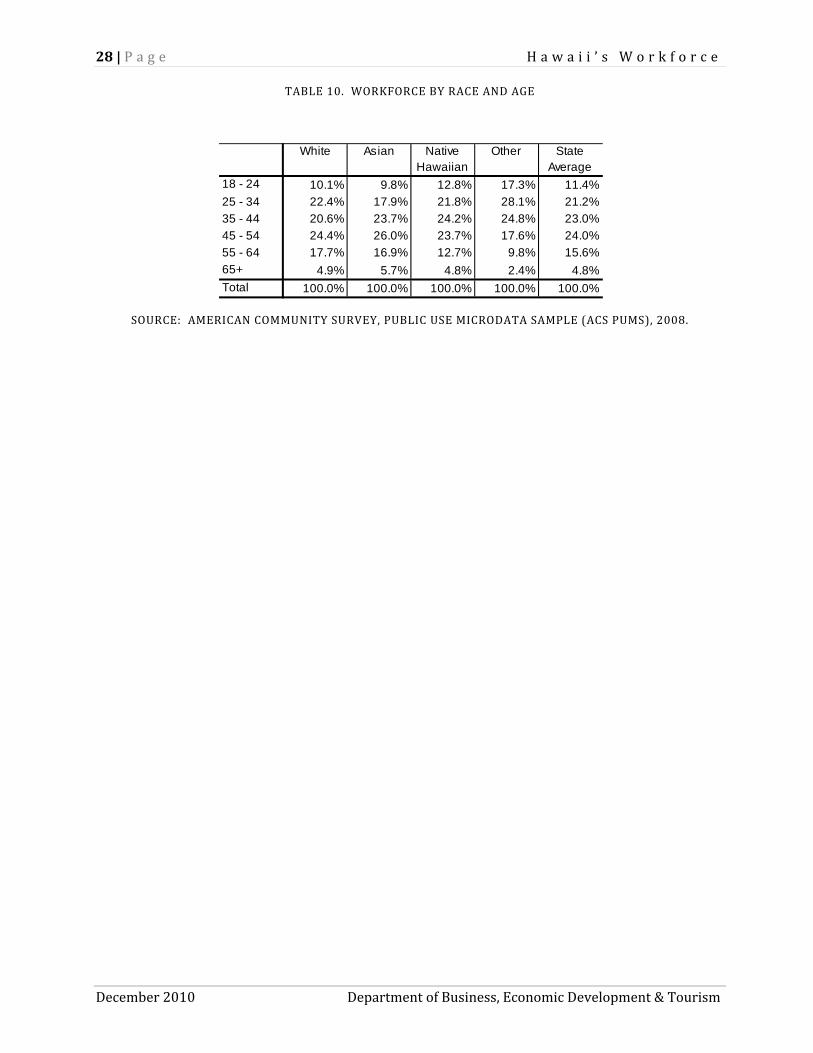
Finally, Whites and Asians entered the labor force later than Native Hawaiians and other races on average and also tended to stay in the labor force longer (Table 10).
White Asian Native Hawaiian
Other State Average
Under Poverty Line 13.9% 14.2% 15.5% 17.3% 14.7%
Above Poverty but under Self-Sufficiency Income 20.7% 24.7% 27.5% 29.1% 24.5%
Above Self-Sufficiency but under $50k (2006 US$) 33.9% 38.2% 36.0% 37.1% 36.6%
Above $50k (2006 US$) 31.6% 22.9% 21.1% 16.5% 24.2%
Total 100.0% 100.0% 100.0% 100.0% 100.0%
(150,000) (100,000) (50,000) 0 50,000 100,000 150,000 200,000
Asian
White
Other
Hawaiian
High School Grad or below
Some college & above
28 | P a g e H a w a i i ’ s W o r k f o r c e
December 2010 Department of Business, Economic Development & Tourism
TABLE 10. WORKFORCE BY RACE AND AGE
SOURCE: AMERICAN COMMUNITY SURVEY, PUBLIC USE MICRODATA SAMPLE (ACS PUMS), 2008.
White Asian Native Hawaiian
Other State Average
18 - 24 10.1% 9.8% 12.8% 17.3% 11.4%
25 - 34 22.4% 17.9% 21.8% 28.1% 21.2%
35 - 44 20.6% 23.7% 24.2% 24.8% 23.0%
45 - 54 24.4% 26.0% 23.7% 17.6% 24.0%
55 - 64 17.7% 16.9% 12.7% 9.8% 15.6%
65+ 4.9% 5.7% 4.8% 2.4% 4.8%
Total 100.0% 100.0% 100.0% 100.0% 100.0%
H a w a i i ’ s W o r k f o r c e P a g e | 29
Department of Business, Economic Development & Tourism December 2010
Conclusions
This study has utilized the Census Bureau’s PUMS data set for Hawaii in 2008 to highlight a range of workforce characteristics by industry. It also presented some limited cross tab information relating to the characteristics themselves, such as income by gender, education by ethnicity, etc.
The data present a snapshot in time for 2008 and represent a benchmark for similar studies in future years that can help show trends for these characteristics. Future work will be particularly helpful in tracking the progress of women and minorities in terms of industries and income levels.
But while the study does not show trends, it does highlight a number of important characteristics of the labor force by industry and suggest some factors to monitor.
The aging of the workforce suggests that industries should be planning for higher replacement needs and a more competitive environment for new labor force entrants over the next two decades. Government, education, accommodations and real estate should be exceptionally concerned about the turnover in their respective workforces over the next 20 years due to the higher proportion of older workers. Other industries such as trade, transportation and food service will be less impacted by the loss of older workers, but must still be aware that recruitment of younger workers for growth and replacement will see stiffer competition from other industries.
The mix of industries in which women make up a substantial proportion of total workers has helped to accelerate the overall increase in women’s proportion of all workers. The service sector has become a larger proportion of the economy over the years and this is where women workers tend to be found in higher proportions. Manufacturing, on the other hand, has been in decline as a proportion of total jobs and that is where the highest proportion of male workers is typically found.
Native Hawaiians had the lowest overall income, with Asians second and Whites with the highest. The same order was found when looking at ethnicity and education, with Native Hawaiians having the lowest percentage of education beyond high school and Whites having the highest. There may be many factors behind the income finding, but the correlation with education levels is a strong suggestion that improving educational attainment among Native Hawaiians, Asians and other non‐White ethnic/racial groups will matter greatly if this disparity is to be remedied.
30 | P a g e H a w a i i ’ s W o r k f o r c e
December 2010 Department of Business, Economic Development & Tourism
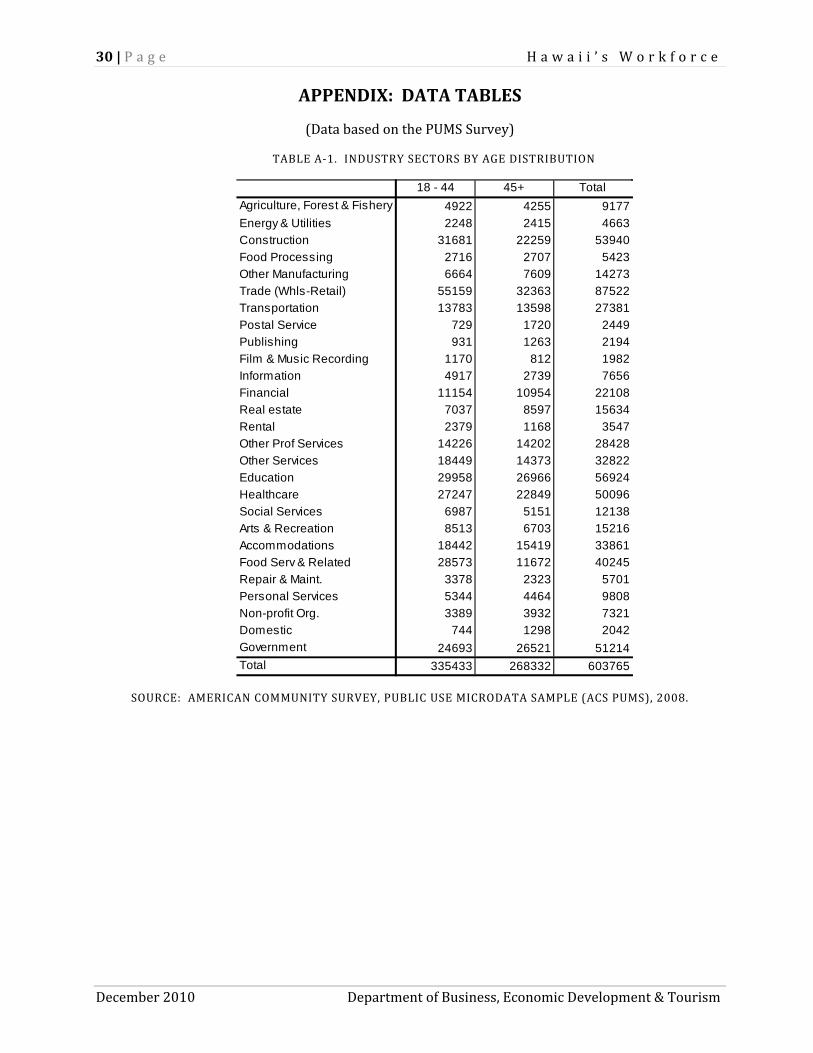
APPENDIX: DATA TABLES
(Data based on the PUMS Survey)
TABLE A‐1. INDUSTRY SECTORS BY AGE DISTRIBUTION
SOURCE: AMERICAN COMMUNITY SURVEY, PUBLIC USE MICRODATA SAMPLE (ACS PUMS), 2008.
18 - 44 45+ Total
Agriculture, Forest & Fishery 4922 4255 9177
Energy & Utilities 2248 2415 4663
Construction 31681 22259 53940
Food Processing 2716 2707 5423
Other Manufacturing 6664 7609 14273
Trade (Whls-Retail) 55159 32363 87522
Transportation 13783 13598 27381
Postal Service 729 1720 2449
Publishing 931 1263 2194
Film & Music Recording 1170 812 1982
Information 4917 2739 7656
Financial 11154 10954 22108
Real estate 7037 8597 15634
Rental 2379 1168 3547
Other Prof Services 14226 14202 28428
Other Services 18449 14373 32822
Education 29958 26966 56924
Healthcare 27247 22849 50096
Social Services 6987 5151 12138
Arts & Recreation 8513 6703 15216
Accommodations 18442 15419 33861
Food Serv & Related 28573 11672 40245
Repair & Maint. 3378 2323 5701
Personal Services 5344 4464 9808
Non-profit Org. 3389 3932 7321
Domestic 744 1298 2042
Government 24693 26521 51214
Total 335433 268332 603765
H a w a i i ’ s W o r k f o r c e P a g e | 31
Department of Business, Economic Development & Tourism December 2010
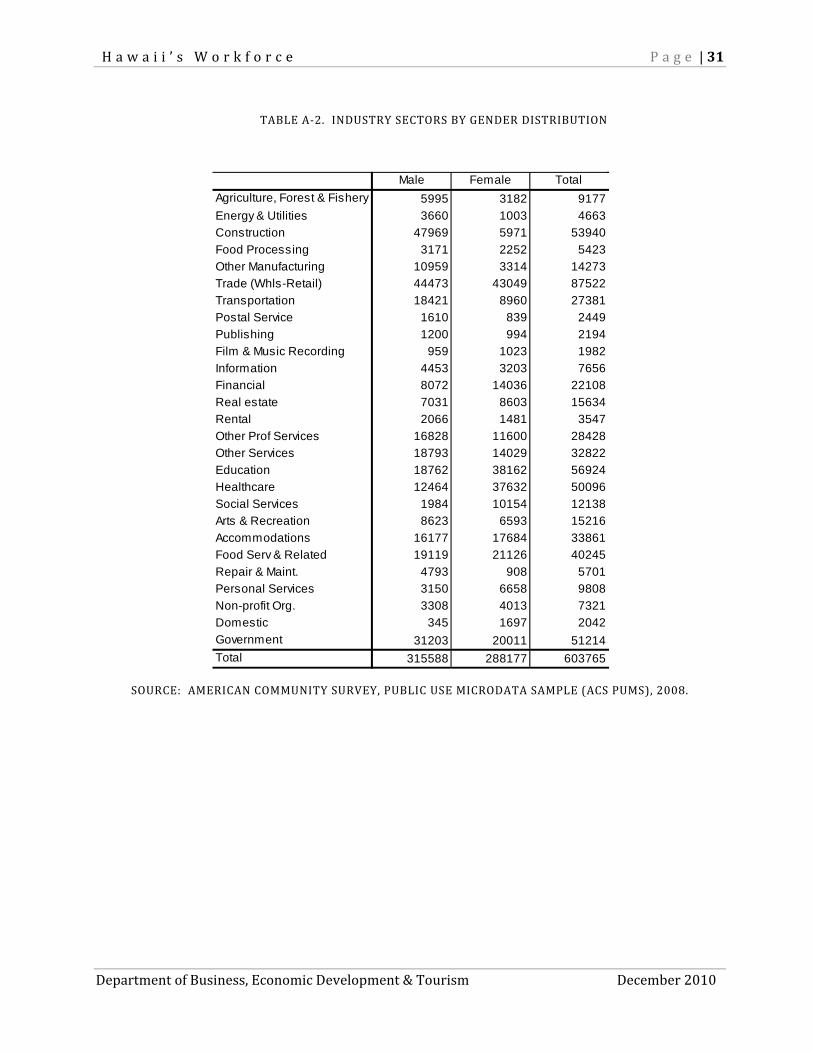
TABLE A‐2. INDUSTRY SECTORS BY GENDER DISTRIBUTION
SOURCE: AMERICAN COMMUNITY SURVEY, PUBLIC USE MICRODATA SAMPLE (ACS PUMS), 2008.
Male Female Total
Agriculture, Forest & Fishery 5995 3182 9177
Energy & Utilities 3660 1003 4663
Construction 47969 5971 53940
Food Processing 3171 2252 5423
Other Manufacturing 10959 3314 14273
Trade (Whls-Retail) 44473 43049 87522
Transportation 18421 8960 27381
Postal Service 1610 839 2449
Publishing 1200 994 2194
Film & Music Recording 959 1023 1982
Information 4453 3203 7656
Financial 8072 14036 22108
Real estate 7031 8603 15634
Rental 2066 1481 3547
Other Prof Services 16828 11600 28428
Other Services 18793 14029 32822
Education 18762 38162 56924
Healthcare 12464 37632 50096
Social Services 1984 10154 12138
Arts & Recreation 8623 6593 15216
Accommodations 16177 17684 33861
Food Serv & Related 19119 21126 40245
Repair & Maint. 4793 908 5701
Personal Services 3150 6658 9808
Non-profit Org. 3308 4013 7321
Domestic 345 1697 2042
Government 31203 20011 51214
Total 315588 288177 603765
32 | P a g e H a w a i i ’ s W o r k f o r c e
December 2010 Department of Business, Economic Development & Tourism
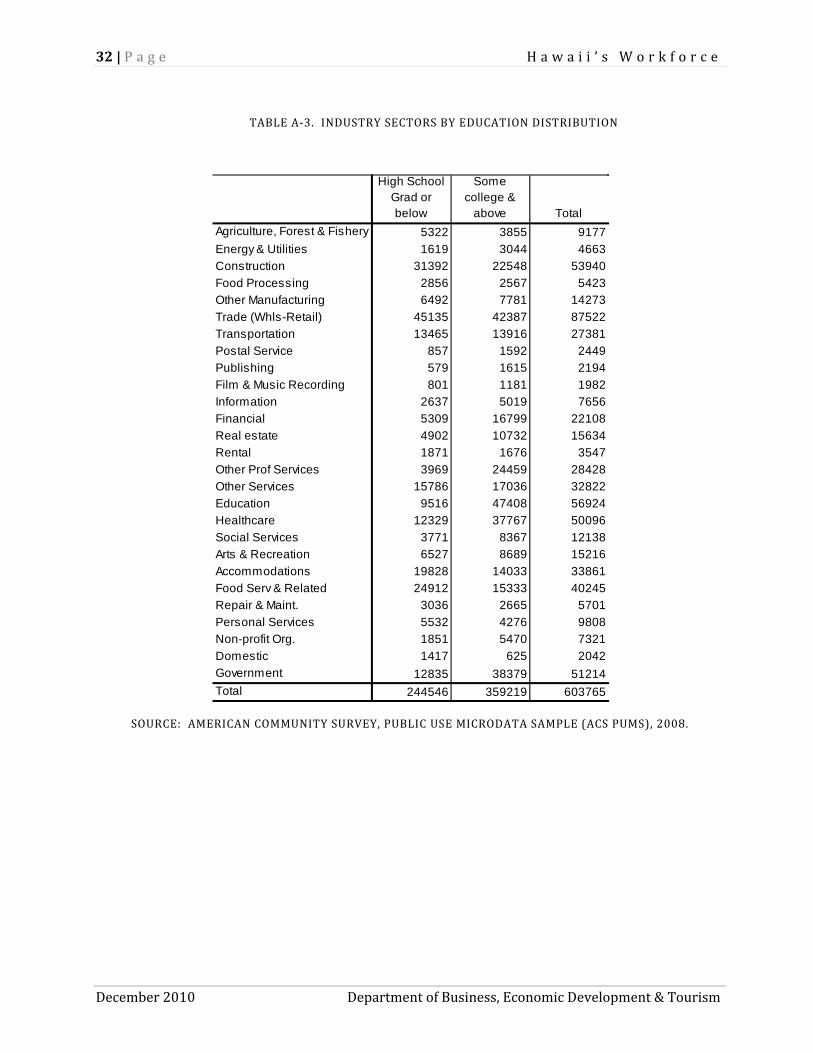
TABLE A‐3. INDUSTRY SECTORS BY EDUCATION DISTRIBUTION
SOURCE: AMERICAN COMMUNITY SURVEY, PUBLIC USE MICRODATA SAMPLE (ACS PUMS), 2008.
High School Grad or below
Some college &
above Total
Agriculture, Forest & Fishery 5322 3855 9177
Energy & Utilities 1619 3044 4663
Construction 31392 22548 53940
Food Processing 2856 2567 5423
Other Manufacturing 6492 7781 14273
Trade (Whls-Retail) 45135 42387 87522
Transportation 13465 13916 27381
Postal Service 857 1592 2449
Publishing 579 1615 2194
Film & Music Recording 801 1181 1982
Information 2637 5019 7656
Financial 5309 16799 22108
Real estate 4902 10732 15634
Rental 1871 1676 3547
Other Prof Services 3969 24459 28428
Other Services 15786 17036 32822
Education 9516 47408 56924
Healthcare 12329 37767 50096
Social Services 3771 8367 12138
Arts & Recreation 6527 8689 15216
Accommodations 19828 14033 33861
Food Serv & Related 24912 15333 40245
Repair & Maint. 3036 2665 5701
Personal Services 5532 4276 9808
Non-profit Org. 1851 5470 7321
Domestic 1417 625 2042
Government 12835 38379 51214
Total 244546 359219 603765
H a w a i i ’ s W o r k f o r c e P a g e | 33
Department of Business, Economic Development & Tourism December 2010
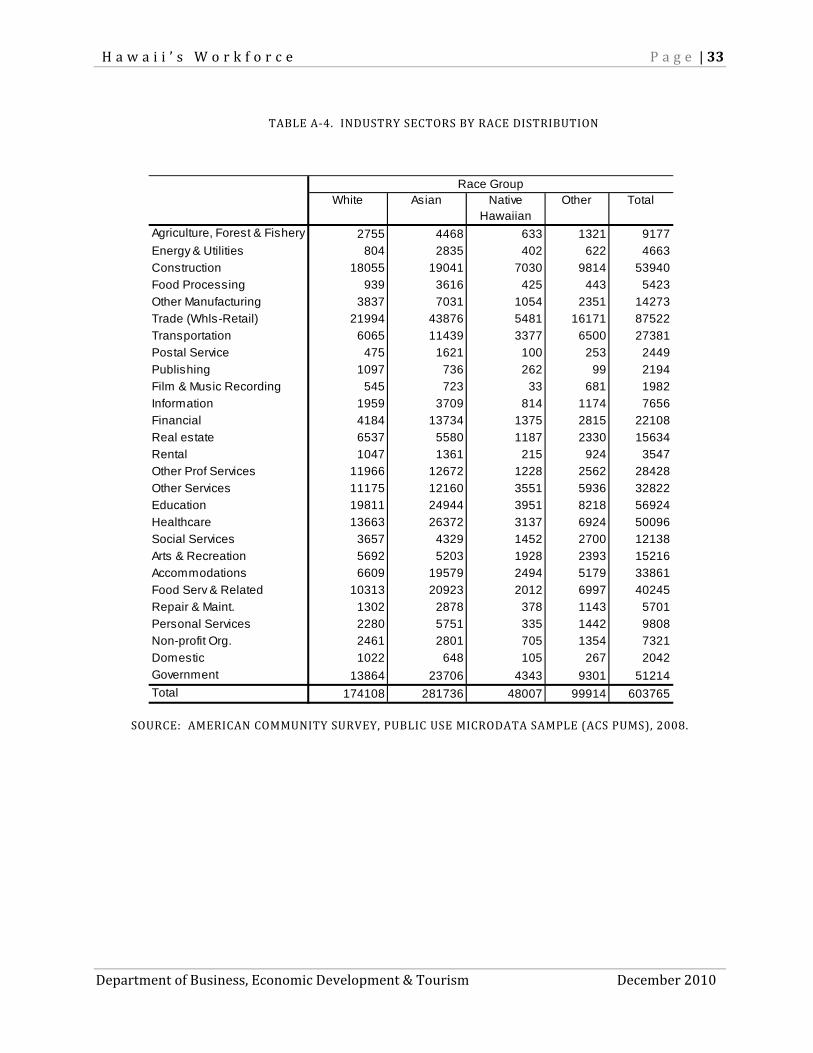
TABLE A‐4. INDUSTRY SECTORS BY RACE DISTRIBUTION
SOURCE: AMERICAN COMMUNITY SURVEY, PUBLIC USE MICRODATA SAMPLE (ACS PUMS), 2008.
White Asian Native Hawaiian
Other Total
Agriculture, Forest & Fishery 2755 4468 633 1321 9177
Energy & Utilities 804 2835 402 622 4663
Construction 18055 19041 7030 9814 53940
Food Processing 939 3616 425 443 5423
Other Manufacturing 3837 7031 1054 2351 14273
Trade (Whls-Retail) 21994 43876 5481 16171 87522
Transportation 6065 11439 3377 6500 27381
Postal Service 475 1621 100 253 2449
Publishing 1097 736 262 99 2194
Film & Music Recording 545 723 33 681 1982
Information 1959 3709 814 1174 7656
Financial 4184 13734 1375 2815 22108
Real estate 6537 5580 1187 2330 15634
Rental 1047 1361 215 924 3547
Other Prof Services 11966 12672 1228 2562 28428
Other Services 11175 12160 3551 5936 32822
Education 19811 24944 3951 8218 56924
Healthcare 13663 26372 3137 6924 50096
Social Services 3657 4329 1452 2700 12138
Arts & Recreation 5692 5203 1928 2393 15216
Accommodations 6609 19579 2494 5179 33861
Food Serv & Related 10313 20923 2012 6997 40245
Repair & Maint. 1302 2878 378 1143 5701
Personal Services 2280 5751 335 1442 9808
Non-profit Org. 2461 2801 705 1354 7321
Domestic 1022 648 105 267 2042
Government 13864 23706 4343 9301 51214
Total 174108 281736 48007 99914 603765
Race Group
34 | P a g e H a w a i i ’ s W o r k f o r c e
December 2010 Department of Business, Economic Development & Tourism
TABLE A‐5. INDUSTRY SECTORS BY FULL/PART‐TIME DISTRIBUTION
SOURCE: AMERICAN COMMUNITY SURVEY, PUBLIC USE MICRODATA SAMPLE (ACS PUMS), 2008.
Part-time Full-time Total
Agriculture, Forest & Fishery 527 8650 9177
Energy & Utilities 0 4663 4663
Construction 1323 52617 53940
Food Processing 165 5258 5423
Other Manufacturing 523 13750 14273
Trade (Whls-Retail) 5247 82275 87522
Transportation 479 26902 27381
Postal Service 41 2408 2449
Publishing 150 2044 2194
Film & Music Recording 119 1863 1982
Information 246 7410 7656
Financial 548 21560 22108
Real estate 1098 14536 15634
Rental 23 3524 3547
Other Prof Services 1750 26678 28428
Other Services 2027 30795 32822
Education 6740 50184 56924
Healthcare 1963 48133 50096
Social Services 847 11291 12138
Arts & Recreation 2220 12996 15216
Accommodations 890 32971 33861
Food Serv & Related 3887 36358 40245
Repair & Maint. 247 5454 5701
Personal Services 806 9002 9808
Non-profit Org. 600 6721 7321
Domestic 380 1662 2042
Government 725 50489 51214
Total 33571 570194 603765
H a w a i i ’ s W o r k f o r c e P a g e | 35
Department of Business, Economic Development & Tourism December 2010
TABLE A‐6. INDUSTRY SECTORS BY SEASONAL DISTRIBUTION
SOURCE: AMERICAN COMMUNITY SURVEY, PUBLIC USE MICRODATA SAMPLE (ACS PUMS), 2008.
Work Less Than Half
YearWork Full
Year Total
Agriculture, Forest & Fishery 504 8673 9177
Energy & Utilities 67 4596 4663
Construction 3278 50662 53940
Food Processing 439 4984 5423
Other Manufacturing 718 13555 14273
Trade (Whls-Retail) 6804 80718 87522
Transportation 1496 25885 27381
Postal Service 0 2449 2449
Publishing 162 2032 2194
Film & Music Recording 221 1761 1982
Information 373 7283 7656
Financial 851 21257 22108
Real estate 1038 14596 15634
Rental 152 3395 3547
Other Prof Services 1872 26556 28428
Other Services 2692 30130 32822
Education 4376 52548 56924
Healthcare 2651 47445 50096
Social Services 997 11141 12138
Arts & Recreation 1430 13786 15216
Accommodations 1015 32846 33861
Food Serv & Related 5465 34780 40245
Repair & Maint. 197 5504 5701
Personal Services 1672 8136 9808
Non-profit Org. 539 6782 7321
Domestic 328 1714 2042
Government 1322 49892 51214
Total 40659 563106 603765
36 | P a g e H a w a i i ’ s W o r k f o r c e
December 2010 Department of Business, Economic Development & Tourism
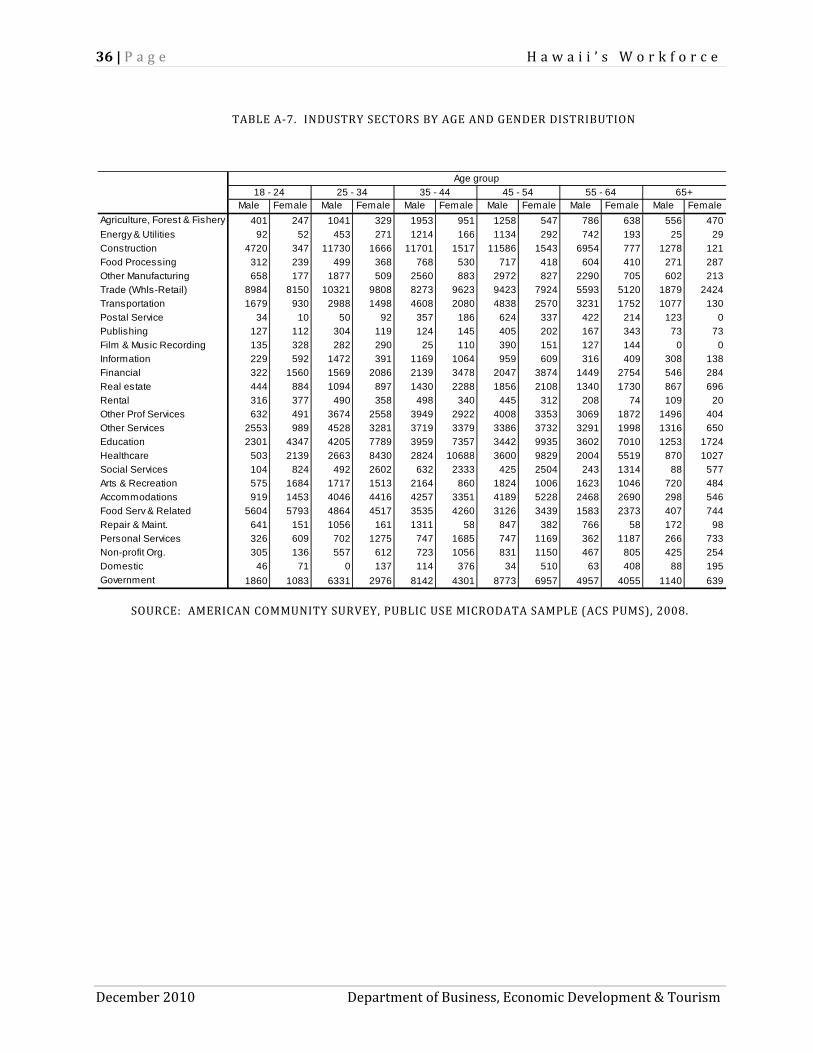
TABLE A‐7. INDUSTRY SECTORS BY AGE AND GENDER DISTRIBUTION
SOURCE: AMERICAN COMMUNITY SURVEY, PUBLIC USE MICRODATA SAMPLE (ACS PUMS), 2008.
Male Female Male Female Male Female Male Female Male Female Male Female
Agriculture, Forest & Fishery 401 247 1041 329 1953 951 1258 547 786 638 556 470
Energy & Utilities 92 52 453 271 1214 166 1134 292 742 193 25 29
Construction 4720 347 11730 1666 11701 1517 11586 1543 6954 777 1278 121
Food Processing 312 239 499 368 768 530 717 418 604 410 271 287
Other Manufacturing 658 177 1877 509 2560 883 2972 827 2290 705 602 213
Trade (Whls-Retail) 8984 8150 10321 9808 8273 9623 9423 7924 5593 5120 1879 2424
Transportation 1679 930 2988 1498 4608 2080 4838 2570 3231 1752 1077 130
Postal Service 34 10 50 92 357 186 624 337 422 214 123 0
Publishing 127 112 304 119 124 145 405 202 167 343 73 73
Film & Music Recording 135 328 282 290 25 110 390 151 127 144 0 0
Information 229 592 1472 391 1169 1064 959 609 316 409 308 138
Financial 322 1560 1569 2086 2139 3478 2047 3874 1449 2754 546 284
Real estate 444 884 1094 897 1430 2288 1856 2108 1340 1730 867 696
Rental 316 377 490 358 498 340 445 312 208 74 109 20
Other Prof Services 632 491 3674 2558 3949 2922 4008 3353 3069 1872 1496 404
Other Services 2553 989 4528 3281 3719 3379 3386 3732 3291 1998 1316 650
Education 2301 4347 4205 7789 3959 7357 3442 9935 3602 7010 1253 1724
Healthcare 503 2139 2663 8430 2824 10688 3600 9829 2004 5519 870 1027
Social Services 104 824 492 2602 632 2333 425 2504 243 1314 88 577
Arts & Recreation 575 1684 1717 1513 2164 860 1824 1006 1623 1046 720 484
Accommodations 919 1453 4046 4416 4257 3351 4189 5228 2468 2690 298 546
Food Serv & Related 5604 5793 4864 4517 3535 4260 3126 3439 1583 2373 407 744
Repair & Maint. 641 151 1056 161 1311 58 847 382 766 58 172 98
Personal Services 326 609 702 1275 747 1685 747 1169 362 1187 266 733
Non-profit Org. 305 136 557 612 723 1056 831 1150 467 805 425 254
Domestic 46 71 0 137 114 376 34 510 63 408 88 195
Government 1860 1083 6331 2976 8142 4301 8773 6957 4957 4055 1140 639
Age group
18 - 24 25 - 34 35 - 44 45 - 54 55 - 64 65+
H a w a i i ’ s W o r k f o r c e P a g e | 37
Department of Business, Economic Development & Tourism December 2010
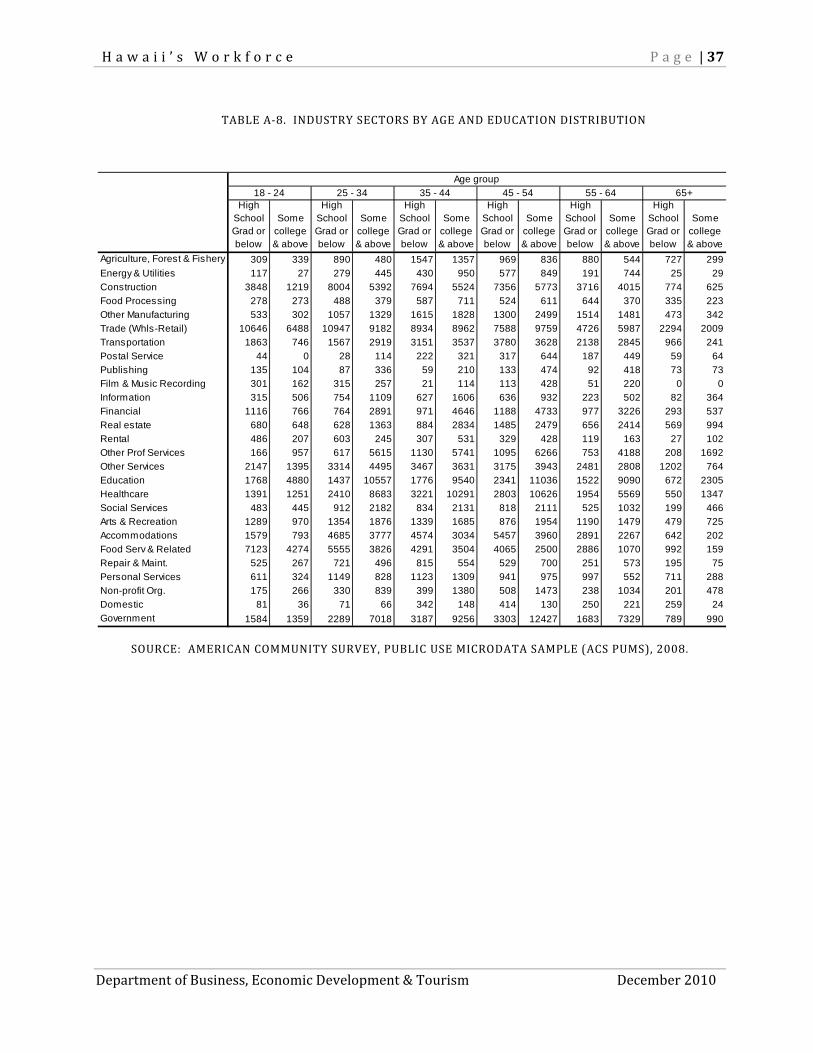
TABLE A‐8. INDUSTRY SECTORS BY AGE AND EDUCATION DISTRIBUTION
SOURCE: AMERICAN COMMUNITY SURVEY, PUBLIC USE MICRODATA SAMPLE (ACS PUMS), 2008.
High School Grad or below
Some college & above
High School Grad or below
Some college & above
High School Grad or below
Some college & above
High School Grad or below
Some college & above
High School Grad or below
Some college & above
High School Grad or below
Some college & above
Agriculture, Forest & Fishery 309 339 890 480 1547 1357 969 836 880 544 727 299
Energy & Utilities 117 27 279 445 430 950 577 849 191 744 25 29
Construction 3848 1219 8004 5392 7694 5524 7356 5773 3716 4015 774 625
Food Processing 278 273 488 379 587 711 524 611 644 370 335 223
Other Manufacturing 533 302 1057 1329 1615 1828 1300 2499 1514 1481 473 342
Trade (Whls-Retail) 10646 6488 10947 9182 8934 8962 7588 9759 4726 5987 2294 2009
Transportation 1863 746 1567 2919 3151 3537 3780 3628 2138 2845 966 241
Postal Service 44 0 28 114 222 321 317 644 187 449 59 64
Publishing 135 104 87 336 59 210 133 474 92 418 73 73
Film & Music Recording 301 162 315 257 21 114 113 428 51 220 0 0
Information 315 506 754 1109 627 1606 636 932 223 502 82 364
Financial 1116 766 764 2891 971 4646 1188 4733 977 3226 293 537
Real estate 680 648 628 1363 884 2834 1485 2479 656 2414 569 994
Rental 486 207 603 245 307 531 329 428 119 163 27 102
Other Prof Services 166 957 617 5615 1130 5741 1095 6266 753 4188 208 1692
Other Services 2147 1395 3314 4495 3467 3631 3175 3943 2481 2808 1202 764
Education 1768 4880 1437 10557 1776 9540 2341 11036 1522 9090 672 2305
Healthcare 1391 1251 2410 8683 3221 10291 2803 10626 1954 5569 550 1347
Social Services 483 445 912 2182 834 2131 818 2111 525 1032 199 466
Arts & Recreation 1289 970 1354 1876 1339 1685 876 1954 1190 1479 479 725
Accommodations 1579 793 4685 3777 4574 3034 5457 3960 2891 2267 642 202
Food Serv & Related 7123 4274 5555 3826 4291 3504 4065 2500 2886 1070 992 159
Repair & Maint. 525 267 721 496 815 554 529 700 251 573 195 75
Personal Services 611 324 1149 828 1123 1309 941 975 997 552 711 288
Non-profit Org. 175 266 330 839 399 1380 508 1473 238 1034 201 478
Domestic 81 36 71 66 342 148 414 130 250 221 259 24
Government 1584 1359 2289 7018 3187 9256 3303 12427 1683 7329 789 990
Age group
18 - 24 25 - 34 35 - 44 45 - 54 55 - 64 65+
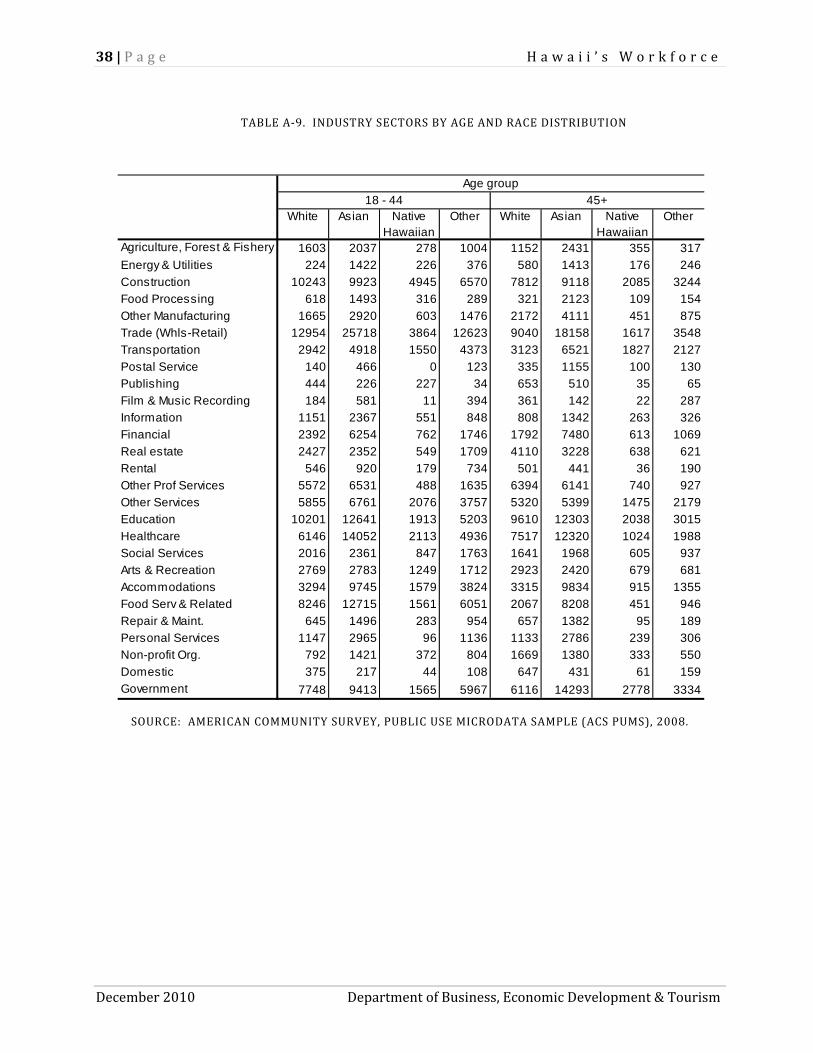
38 | P a g e H a w a i i ’ s W o r k f o r c e
December 2010 Department of Business, Economic Development & Tourism
TABLE A‐9. INDUSTRY SECTORS BY AGE AND RACE DISTRIBUTION
SOURCE: AMERICAN COMMUNITY SURVEY, PUBLIC USE MICRODATA SAMPLE (ACS PUMS), 2008.
White Asian Native Hawaiian
Other White Asian Native Hawaiian
Other
Agriculture, Forest & Fishery 1603 2037 278 1004 1152 2431 355 317
Energy & Utilities 224 1422 226 376 580 1413 176 246
Construction 10243 9923 4945 6570 7812 9118 2085 3244
Food Processing 618 1493 316 289 321 2123 109 154
Other Manufacturing 1665 2920 603 1476 2172 4111 451 875
Trade (Whls-Retail) 12954 25718 3864 12623 9040 18158 1617 3548
Transportation 2942 4918 1550 4373 3123 6521 1827 2127
Postal Service 140 466 0 123 335 1155 100 130
Publishing 444 226 227 34 653 510 35 65
Film & Music Recording 184 581 11 394 361 142 22 287
Information 1151 2367 551 848 808 1342 263 326
Financial 2392 6254 762 1746 1792 7480 613 1069
Real estate 2427 2352 549 1709 4110 3228 638 621
Rental 546 920 179 734 501 441 36 190
Other Prof Services 5572 6531 488 1635 6394 6141 740 927
Other Services 5855 6761 2076 3757 5320 5399 1475 2179
Education 10201 12641 1913 5203 9610 12303 2038 3015
Healthcare 6146 14052 2113 4936 7517 12320 1024 1988
Social Services 2016 2361 847 1763 1641 1968 605 937
Arts & Recreation 2769 2783 1249 1712 2923 2420 679 681
Accommodations 3294 9745 1579 3824 3315 9834 915 1355
Food Serv & Related 8246 12715 1561 6051 2067 8208 451 946
Repair & Maint. 645 1496 283 954 657 1382 95 189
Personal Services 1147 2965 96 1136 1133 2786 239 306
Non-profit Org. 792 1421 372 804 1669 1380 333 550
Domestic 375 217 44 108 647 431 61 159
Government 7748 9413 1565 5967 6116 14293 2778 3334
Age group
18 - 44 45+
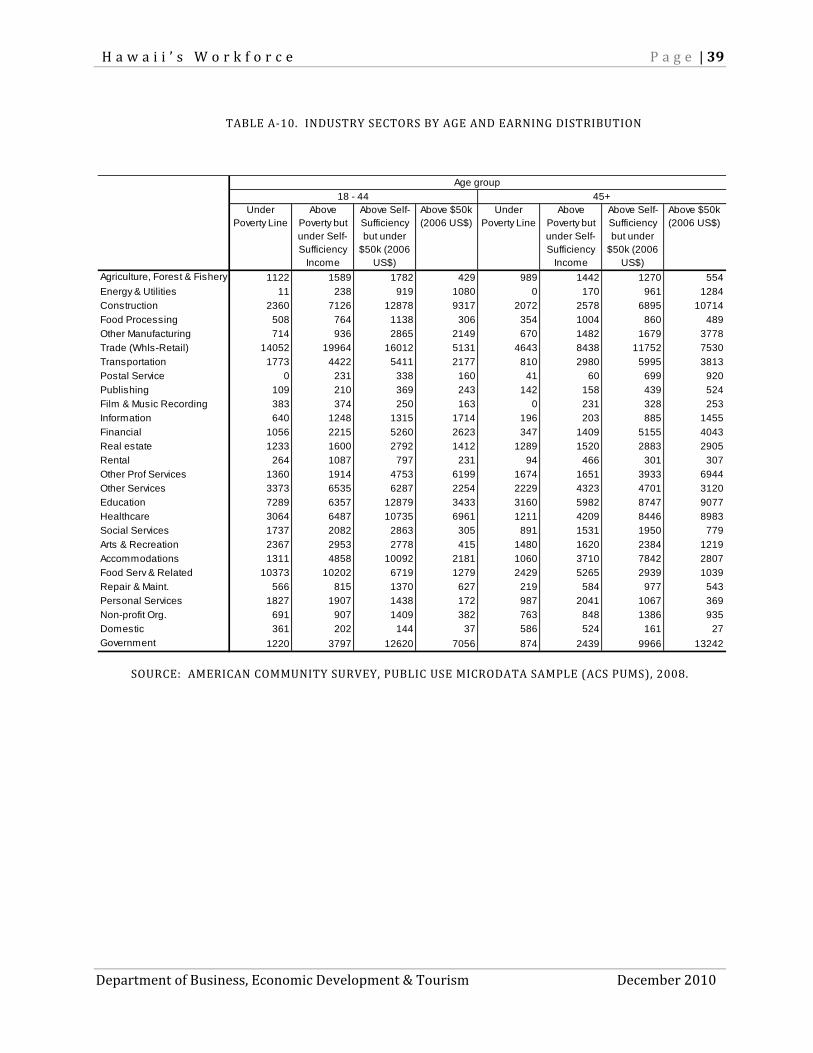
H a w a i i ’ s W o r k f o r c e P a g e | 39
Department of Business, Economic Development & Tourism December 2010
TABLE A‐10. INDUSTRY SECTORS BY AGE AND EARNING DISTRIBUTION
SOURCE: AMERICAN COMMUNITY SURVEY, PUBLIC USE MICRODATA SAMPLE (ACS PUMS), 2008.
Under Poverty Line
Above Poverty but under Self-Sufficiency
Income
Above Self-Sufficiency but under
$50k (2006 US$)
Above $50k (2006 US$)
Under Poverty Line
Above Poverty but under Self-Sufficiency
Income
Above Self-Sufficiency but under
$50k (2006 US$)
Above $50k (2006 US$)
Agriculture, Forest & Fishery 1122 1589 1782 429 989 1442 1270 554
Energy & Utilities 11 238 919 1080 0 170 961 1284
Construction 2360 7126 12878 9317 2072 2578 6895 10714
Food Processing 508 764 1138 306 354 1004 860 489
Other Manufacturing 714 936 2865 2149 670 1482 1679 3778
Trade (Whls-Retail) 14052 19964 16012 5131 4643 8438 11752 7530
Transportation 1773 4422 5411 2177 810 2980 5995 3813
Postal Service 0 231 338 160 41 60 699 920
Publishing 109 210 369 243 142 158 439 524
Film & Music Recording 383 374 250 163 0 231 328 253
Information 640 1248 1315 1714 196 203 885 1455
Financial 1056 2215 5260 2623 347 1409 5155 4043
Real estate 1233 1600 2792 1412 1289 1520 2883 2905
Rental 264 1087 797 231 94 466 301 307
Other Prof Services 1360 1914 4753 6199 1674 1651 3933 6944
Other Services 3373 6535 6287 2254 2229 4323 4701 3120
Education 7289 6357 12879 3433 3160 5982 8747 9077
Healthcare 3064 6487 10735 6961 1211 4209 8446 8983
Social Services 1737 2082 2863 305 891 1531 1950 779
Arts & Recreation 2367 2953 2778 415 1480 1620 2384 1219
Accommodations 1311 4858 10092 2181 1060 3710 7842 2807
Food Serv & Related 10373 10202 6719 1279 2429 5265 2939 1039
Repair & Maint. 566 815 1370 627 219 584 977 543
Personal Services 1827 1907 1438 172 987 2041 1067 369
Non-profit Org. 691 907 1409 382 763 848 1386 935
Domestic 361 202 144 37 586 524 161 27
Government 1220 3797 12620 7056 874 2439 9966 13242
Age group
18 - 44 45+
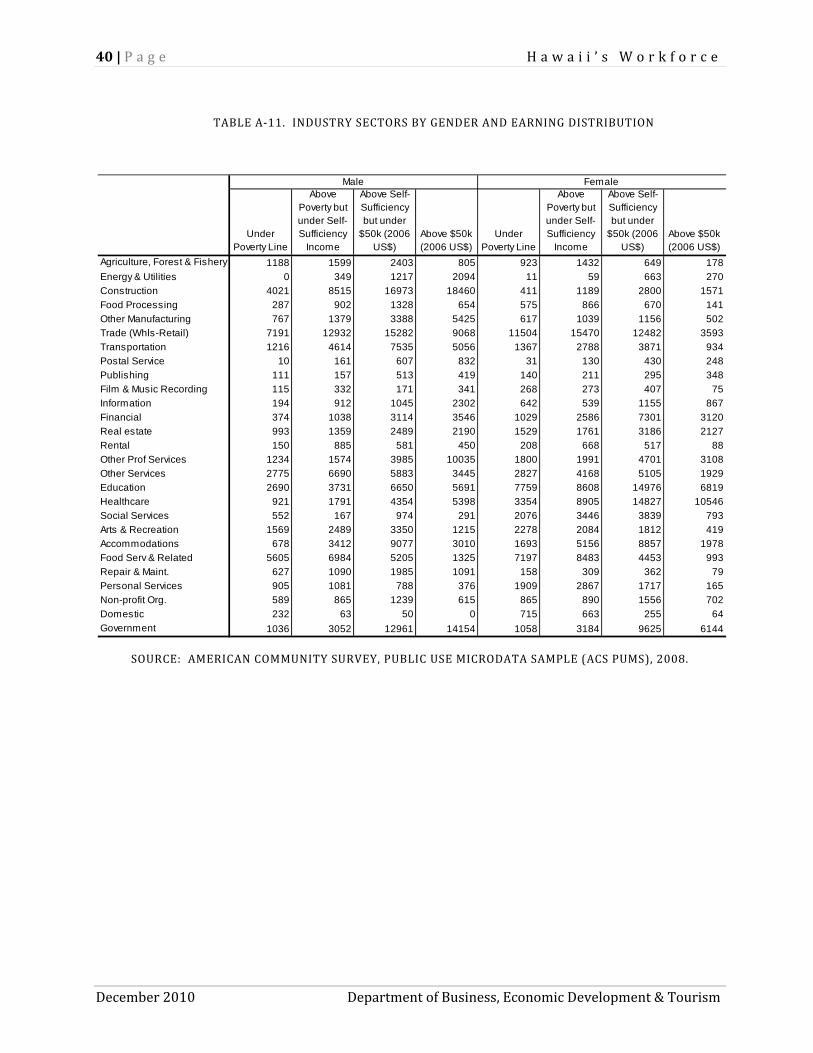
40 | P a g e H a w a i i ’ s W o r k f o r c e
December 2010 Department of Business, Economic Development & Tourism
TABLE A‐11. INDUSTRY SECTORS BY GENDER AND EARNING DISTRIBUTION
SOURCE: AMERICAN COMMUNITY SURVEY, PUBLIC USE MICRODATA SAMPLE (ACS PUMS), 2008.
Under Poverty Line
Above Poverty but under Self-Sufficiency
Income
Above Self-Sufficiency but under
$50k (2006 US$)
Above $50k (2006 US$)
Under Poverty Line
Above Poverty but under Self-Sufficiency
Income
Above Self-Sufficiency but under
$50k (2006 US$)
Above $50k (2006 US$)
Agriculture, Forest & Fishery 1188 1599 2403 805 923 1432 649 178
Energy & Utilities 0 349 1217 2094 11 59 663 270
Construction 4021 8515 16973 18460 411 1189 2800 1571
Food Processing 287 902 1328 654 575 866 670 141
Other Manufacturing 767 1379 3388 5425 617 1039 1156 502
Trade (Whls-Retail) 7191 12932 15282 9068 11504 15470 12482 3593
Transportation 1216 4614 7535 5056 1367 2788 3871 934
Postal Service 10 161 607 832 31 130 430 248
Publishing 111 157 513 419 140 211 295 348
Film & Music Recording 115 332 171 341 268 273 407 75
Information 194 912 1045 2302 642 539 1155 867
Financial 374 1038 3114 3546 1029 2586 7301 3120
Real estate 993 1359 2489 2190 1529 1761 3186 2127
Rental 150 885 581 450 208 668 517 88
Other Prof Services 1234 1574 3985 10035 1800 1991 4701 3108
Other Services 2775 6690 5883 3445 2827 4168 5105 1929
Education 2690 3731 6650 5691 7759 8608 14976 6819
Healthcare 921 1791 4354 5398 3354 8905 14827 10546
Social Services 552 167 974 291 2076 3446 3839 793
Arts & Recreation 1569 2489 3350 1215 2278 2084 1812 419
Accommodations 678 3412 9077 3010 1693 5156 8857 1978
Food Serv & Related 5605 6984 5205 1325 7197 8483 4453 993
Repair & Maint. 627 1090 1985 1091 158 309 362 79
Personal Services 905 1081 788 376 1909 2867 1717 165
Non-profit Org. 589 865 1239 615 865 890 1556 702
Domestic 232 63 50 0 715 663 255 64
Government 1036 3052 12961 14154 1058 3184 9625 6144
Male Female
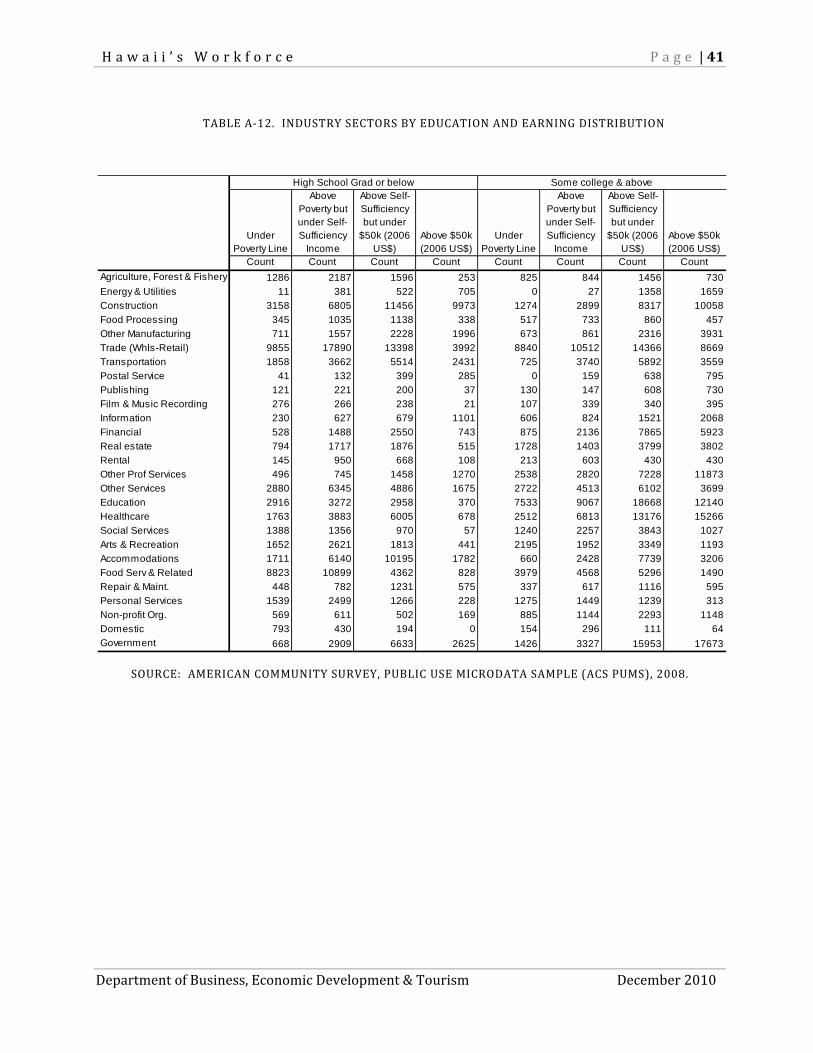
H a w a i i ’ s W o r k f o r c e P a g e | 41
Department of Business, Economic Development & Tourism December 2010
TABLE A‐12. INDUSTRY SECTORS BY EDUCATION AND EARNING DISTRIBUTION
SOURCE: AMERICAN COMMUNITY SURVEY, PUBLIC USE MICRODATA SAMPLE (ACS PUMS), 2008.
Under Poverty Line
Above Poverty but under Self-Sufficiency
Income
Above Self-Sufficiency but under
$50k (2006 US$)
Above $50k (2006 US$)
Under Poverty Line
Above Poverty but under Self-Sufficiency
Income
Above Self-Sufficiency but under
$50k (2006 US$)
Above $50k (2006 US$)
Count Count Count Count Count Count Count Count
Agriculture, Forest & Fishery 1286 2187 1596 253 825 844 1456 730
Energy & Utilities 11 381 522 705 0 27 1358 1659
Construction 3158 6805 11456 9973 1274 2899 8317 10058
Food Processing 345 1035 1138 338 517 733 860 457
Other Manufacturing 711 1557 2228 1996 673 861 2316 3931
Trade (Whls-Retail) 9855 17890 13398 3992 8840 10512 14366 8669
Transportation 1858 3662 5514 2431 725 3740 5892 3559
Postal Service 41 132 399 285 0 159 638 795
Publishing 121 221 200 37 130 147 608 730
Film & Music Recording 276 266 238 21 107 339 340 395
Information 230 627 679 1101 606 824 1521 2068
Financial 528 1488 2550 743 875 2136 7865 5923
Real estate 794 1717 1876 515 1728 1403 3799 3802
Rental 145 950 668 108 213 603 430 430
Other Prof Services 496 745 1458 1270 2538 2820 7228 11873
Other Services 2880 6345 4886 1675 2722 4513 6102 3699
Education 2916 3272 2958 370 7533 9067 18668 12140
Healthcare 1763 3883 6005 678 2512 6813 13176 15266
Social Services 1388 1356 970 57 1240 2257 3843 1027
Arts & Recreation 1652 2621 1813 441 2195 1952 3349 1193
Accommodations 1711 6140 10195 1782 660 2428 7739 3206
Food Serv & Related 8823 10899 4362 828 3979 4568 5296 1490
Repair & Maint. 448 782 1231 575 337 617 1116 595
Personal Services 1539 2499 1266 228 1275 1449 1239 313
Non-profit Org. 569 611 502 169 885 1144 2293 1148
Domestic 793 430 194 0 154 296 111 64
Government 668 2909 6633 2625 1426 3327 15953 17673
High School Grad or below Some college & above
42 | P a g e H a w a i i ’ s W o r k f o r c e
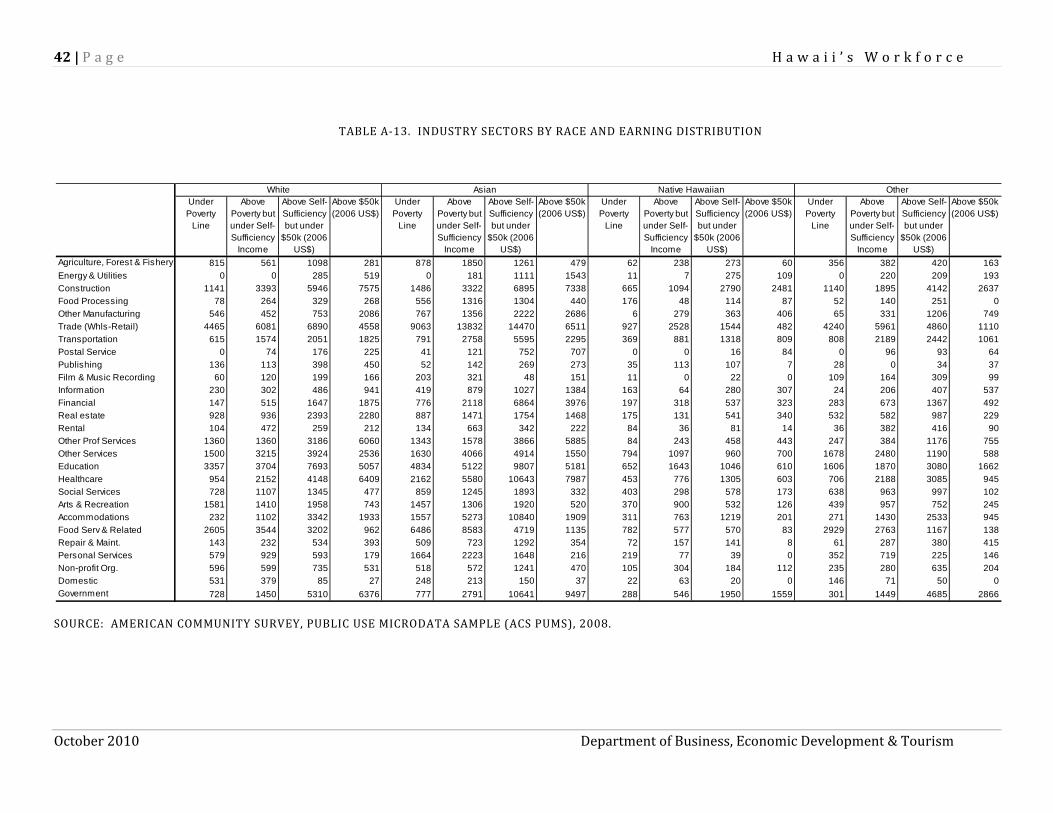
October 2010 Department of Business, Economic Development & Tourism
TABLE A‐13. INDUSTRY SECTORS BY RACE AND EARNING DISTRIBUTION
SOURCE: AMERICAN COMMUNITY SURVEY, PUBLIC USE MICRODATA SAMPLE (ACS PUMS), 2008.
Under Poverty
Line
Above Poverty but under Self-Sufficiency
Income
Above Self-Sufficiency but under
$50k (2006 US$)
Above $50k (2006 US$)
Under Poverty
Line
Above Poverty but under Self-Sufficiency
Income
Above Self-Sufficiency but under
$50k (2006 US$)
Above $50k (2006 US$)
Under Poverty
Line
Above Poverty but under Self-Sufficiency
Income
Above Self-Sufficiency but under
$50k (2006 US$)
Above $50k (2006 US$)
Under Poverty
Line
Above Poverty but under Self-Sufficiency
Income
Above Self-Sufficiency but under
$50k (2006 US$)
Above $50k (2006 US$)
Agriculture, Forest & Fishery 815 561 1098 281 878 1850 1261 479 62 238 273 60 356 382 420 163
Energy & Utilities 0 0 285 519 0 181 1111 1543 11 7 275 109 0 220 209 193
Construction 1141 3393 5946 7575 1486 3322 6895 7338 665 1094 2790 2481 1140 1895 4142 2637
Food Processing 78 264 329 268 556 1316 1304 440 176 48 114 87 52 140 251 0
Other Manufacturing 546 452 753 2086 767 1356 2222 2686 6 279 363 406 65 331 1206 749
Trade (Whls-Retail) 4465 6081 6890 4558 9063 13832 14470 6511 927 2528 1544 482 4240 5961 4860 1110
Transportation 615 1574 2051 1825 791 2758 5595 2295 369 881 1318 809 808 2189 2442 1061
Postal Service 0 74 176 225 41 121 752 707 0 0 16 84 0 96 93 64
Publishing 136 113 398 450 52 142 269 273 35 113 107 7 28 0 34 37
Film & Music Recording 60 120 199 166 203 321 48 151 11 0 22 0 109 164 309 99
Information 230 302 486 941 419 879 1027 1384 163 64 280 307 24 206 407 537
Financial 147 515 1647 1875 776 2118 6864 3976 197 318 537 323 283 673 1367 492
Real estate 928 936 2393 2280 887 1471 1754 1468 175 131 541 340 532 582 987 229
Rental 104 472 259 212 134 663 342 222 84 36 81 14 36 382 416 90
Other Prof Services 1360 1360 3186 6060 1343 1578 3866 5885 84 243 458 443 247 384 1176 755
Other Services 1500 3215 3924 2536 1630 4066 4914 1550 794 1097 960 700 1678 2480 1190 588
Education 3357 3704 7693 5057 4834 5122 9807 5181 652 1643 1046 610 1606 1870 3080 1662
Healthcare 954 2152 4148 6409 2162 5580 10643 7987 453 776 1305 603 706 2188 3085 945
Social Services 728 1107 1345 477 859 1245 1893 332 403 298 578 173 638 963 997 102
Arts & Recreation 1581 1410 1958 743 1457 1306 1920 520 370 900 532 126 439 957 752 245
Accommodations 232 1102 3342 1933 1557 5273 10840 1909 311 763 1219 201 271 1430 2533 945
Food Serv & Related 2605 3544 3202 962 6486 8583 4719 1135 782 577 570 83 2929 2763 1167 138
Repair & Maint. 143 232 534 393 509 723 1292 354 72 157 141 8 61 287 380 415
Personal Services 579 929 593 179 1664 2223 1648 216 219 77 39 0 352 719 225 146
Non-profit Org. 596 599 735 531 518 572 1241 470 105 304 184 112 235 280 635 204
Domestic 531 379 85 27 248 213 150 37 22 63 20 0 146 71 50 0
Government 728 1450 5310 6376 777 2791 10641 9497 288 546 1950 1559 301 1449 4685 2866
White Asian Native Hawaiian Other
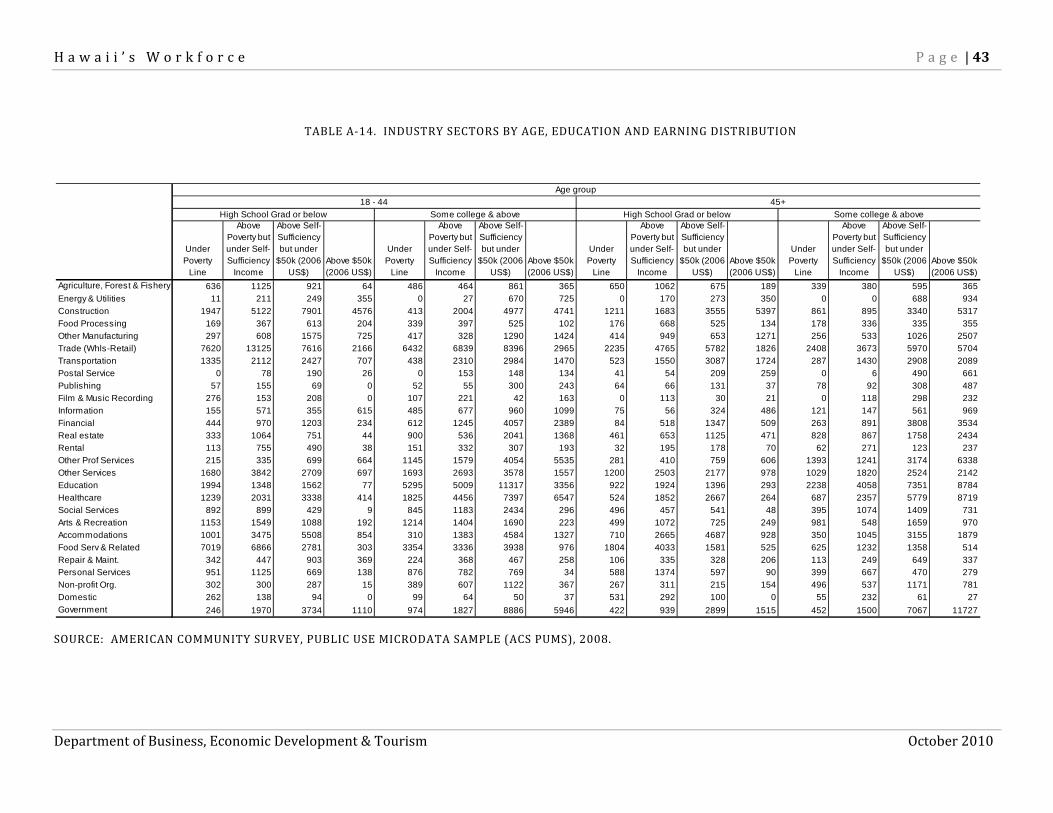
H a w a i i ’ s W o r k f o r c e P a g e | 43
Department of Business, Economic Development & Tourism October 2010
TABLE A‐14. INDUSTRY SECTORS BY AGE, EDUCATION AND EARNING DISTRIBUTION
SOURCE: AMERICAN COMMUNITY SURVEY, PUBLIC USE MICRODATA SAMPLE (ACS PUMS), 2008.
Under Poverty
Line
Above Poverty but under Self-Sufficiency
Income
Above Self-Sufficiency but under
$50k (2006 US$)
Above $50k (2006 US$)
Under Poverty
Line
Above Poverty but under Self-Sufficiency
Income
Above Self-Sufficiency but under
$50k (2006 US$)
Above $50k (2006 US$)
Under Poverty
Line
Above Poverty but under Self-Sufficiency
Income
Above Self-Sufficiency but under
$50k (2006 US$)
Above $50k (2006 US$)
Under Poverty
Line
Above Poverty but under Self-Sufficiency
Income
Above Self-Sufficiency but under
$50k (2006 US$)
Above $50k (2006 US$)
Agriculture, Forest & Fishery 636 1125 921 64 486 464 861 365 650 1062 675 189 339 380 595 365
Energy & Utilities 11 211 249 355 0 27 670 725 0 170 273 350 0 0 688 934
Construction 1947 5122 7901 4576 413 2004 4977 4741 1211 1683 3555 5397 861 895 3340 5317
Food Processing 169 367 613 204 339 397 525 102 176 668 525 134 178 336 335 355
Other Manufacturing 297 608 1575 725 417 328 1290 1424 414 949 653 1271 256 533 1026 2507
Trade (Whls-Retail) 7620 13125 7616 2166 6432 6839 8396 2965 2235 4765 5782 1826 2408 3673 5970 5704
Transportation 1335 2112 2427 707 438 2310 2984 1470 523 1550 3087 1724 287 1430 2908 2089
Postal Service 0 78 190 26 0 153 148 134 41 54 209 259 0 6 490 661
Publishing 57 155 69 0 52 55 300 243 64 66 131 37 78 92 308 487
Film & Music Recording 276 153 208 0 107 221 42 163 0 113 30 21 0 118 298 232
Information 155 571 355 615 485 677 960 1099 75 56 324 486 121 147 561 969
Financial 444 970 1203 234 612 1245 4057 2389 84 518 1347 509 263 891 3808 3534
Real estate 333 1064 751 44 900 536 2041 1368 461 653 1125 471 828 867 1758 2434
Rental 113 755 490 38 151 332 307 193 32 195 178 70 62 271 123 237
Other Prof Services 215 335 699 664 1145 1579 4054 5535 281 410 759 606 1393 1241 3174 6338
Other Services 1680 3842 2709 697 1693 2693 3578 1557 1200 2503 2177 978 1029 1820 2524 2142
Education 1994 1348 1562 77 5295 5009 11317 3356 922 1924 1396 293 2238 4058 7351 8784
Healthcare 1239 2031 3338 414 1825 4456 7397 6547 524 1852 2667 264 687 2357 5779 8719
Social Services 892 899 429 9 845 1183 2434 296 496 457 541 48 395 1074 1409 731
Arts & Recreation 1153 1549 1088 192 1214 1404 1690 223 499 1072 725 249 981 548 1659 970
Accommodations 1001 3475 5508 854 310 1383 4584 1327 710 2665 4687 928 350 1045 3155 1879
Food Serv & Related 7019 6866 2781 303 3354 3336 3938 976 1804 4033 1581 525 625 1232 1358 514
Repair & Maint. 342 447 903 369 224 368 467 258 106 335 328 206 113 249 649 337
Personal Services 951 1125 669 138 876 782 769 34 588 1374 597 90 399 667 470 279
Non-profit Org. 302 300 287 15 389 607 1122 367 267 311 215 154 496 537 1171 781
Domestic 262 138 94 0 99 64 50 37 531 292 100 0 55 232 61 27
Government 246 1970 3734 1110 974 1827 8886 5946 422 939 2899 1515 452 1500 7067 11727
High School Grad or below Some college & above High School Grad or below Some college & above
Age group
18 - 44 45+
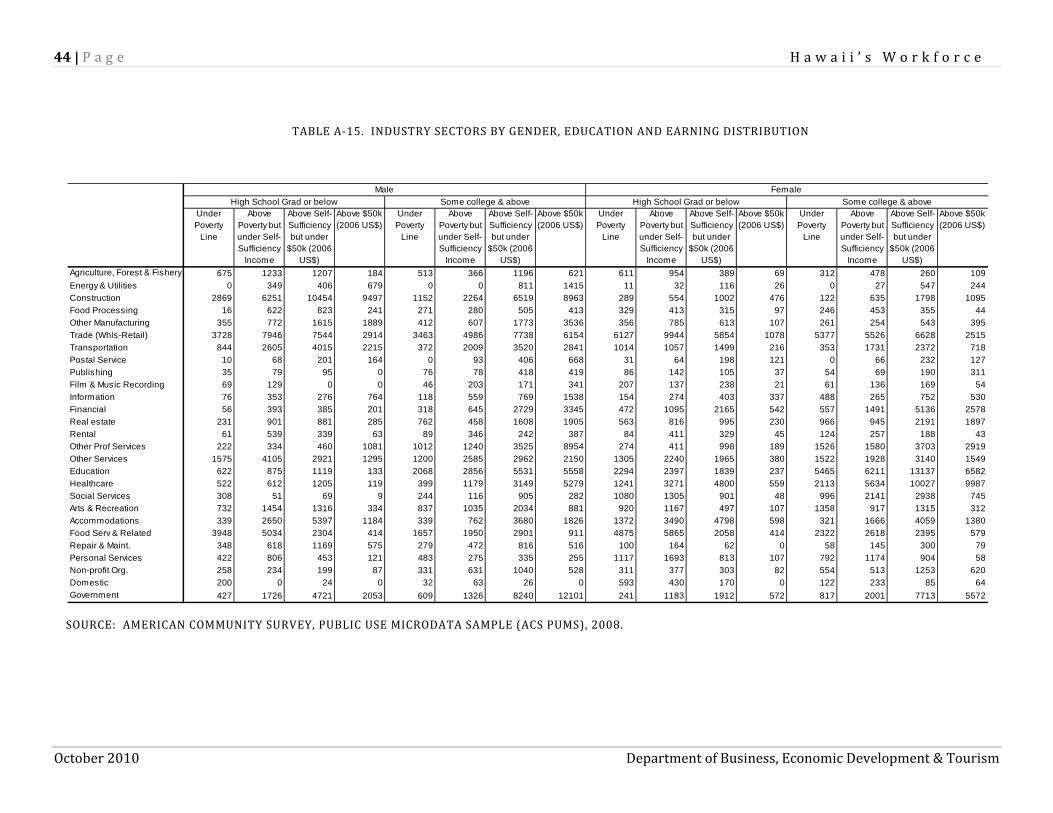
44 | P a g e H a w a i i ’ s W o r k f o r c e
October 2010 Department of Business, Economic Development & Tourism
TABLE A‐15. INDUSTRY SECTORS BY GENDER, EDUCATION AND EARNING DISTRIBUTION
SOURCE: AMERICAN COMMUNITY SURVEY, PUBLIC USE MICRODATA SAMPLE (ACS PUMS), 2008.
Under Poverty
Line
Above Poverty but under Self-Sufficiency
Income
Above Self-Sufficiency but under
$50k (2006 US$)
Above $50k (2006 US$)
Under Poverty
Line
Above Poverty but under Self-Sufficiency
Income
Above Self-Sufficiency but under
$50k (2006 US$)
Above $50k (2006 US$)
Under Poverty
Line
Above Poverty but under Self-Sufficiency
Income
Above Self-Sufficiency but under
$50k (2006 US$)
Above $50k (2006 US$)
Under Poverty
Line
Above Poverty but under Self-Sufficiency
Income
Above Self-Sufficiency but under
$50k (2006 US$)
Above $50k (2006 US$)
Agriculture, Forest & Fishery 675 1233 1207 184 513 366 1196 621 611 954 389 69 312 478 260 109
Energy & Utilities 0 349 406 679 0 0 811 1415 11 32 116 26 0 27 547 244
Construction 2869 6251 10454 9497 1152 2264 6519 8963 289 554 1002 476 122 635 1798 1095
Food Processing 16 622 823 241 271 280 505 413 329 413 315 97 246 453 355 44
Other Manufacturing 355 772 1615 1889 412 607 1773 3536 356 785 613 107 261 254 543 395
Trade (Whls-Retail) 3728 7946 7544 2914 3463 4986 7738 6154 6127 9944 5854 1078 5377 5526 6628 2515
Transportation 844 2605 4015 2215 372 2009 3520 2841 1014 1057 1499 216 353 1731 2372 718
Postal Service 10 68 201 164 0 93 406 668 31 64 198 121 0 66 232 127
Publishing 35 79 95 0 76 78 418 419 86 142 105 37 54 69 190 311
Film & Music Recording 69 129 0 0 46 203 171 341 207 137 238 21 61 136 169 54
Information 76 353 276 764 118 559 769 1538 154 274 403 337 488 265 752 530
Financial 56 393 385 201 318 645 2729 3345 472 1095 2165 542 557 1491 5136 2578
Real estate 231 901 881 285 762 458 1608 1905 563 816 995 230 966 945 2191 1897
Rental 61 539 339 63 89 346 242 387 84 411 329 45 124 257 188 43
Other Prof Services 222 334 460 1081 1012 1240 3525 8954 274 411 998 189 1526 1580 3703 2919
Other Services 1575 4105 2921 1295 1200 2585 2962 2150 1305 2240 1965 380 1522 1928 3140 1549
Education 622 875 1119 133 2068 2856 5531 5558 2294 2397 1839 237 5465 6211 13137 6582
Healthcare 522 612 1205 119 399 1179 3149 5279 1241 3271 4800 559 2113 5634 10027 9987
Social Services 308 51 69 9 244 116 905 282 1080 1305 901 48 996 2141 2938 745
Arts & Recreation 732 1454 1316 334 837 1035 2034 881 920 1167 497 107 1358 917 1315 312
Accommodations 339 2650 5397 1184 339 762 3680 1826 1372 3490 4798 598 321 1666 4059 1380
Food Serv & Related 3948 5034 2304 414 1657 1950 2901 911 4875 5865 2058 414 2322 2618 2395 579
Repair & Maint. 348 618 1169 575 279 472 816 516 100 164 62 0 58 145 300 79
Personal Services 422 806 453 121 483 275 335 255 1117 1693 813 107 792 1174 904 58
Non-profit Org. 258 234 199 87 331 631 1040 528 311 377 303 82 554 513 1253 620
Domestic 200 0 24 0 32 63 26 0 593 430 170 0 122 233 85 64
Government 427 1726 4721 2053 609 1326 8240 12101 241 1183 1912 572 817 2001 7713 5572
Male Female
High School Grad or below Some college & above High School Grad or below Some college & above