Embed Size (px)
Citation preview

Workers' Compensation D-Ratios, An Alternative Method of Estimation
by Howard C. Mahler, FCAS, MAAA
343
W O R K E R S ' C O M P E N S A T I O N D - R A T I O S ,
AN A L T E R N A T I V E M E T H O D O F E S T I M A T I O N
BY HOWARD C. MAHLER, FCAS, MAAA THE WORKERS' COMPENSATION RATING AND
INSPECTION BUREAU OF MASSACHUSETTS
A b s t r a c t
This paper presents a new method of estimating D-Ratios by class based on estimated average claim costs by class, that is being used in Massachusetts Workers' Compensation.
344
WORKERS' COMPENSATION D-RATIOS, AN ALTERNATIVE
METHOD OF ESTIMATION
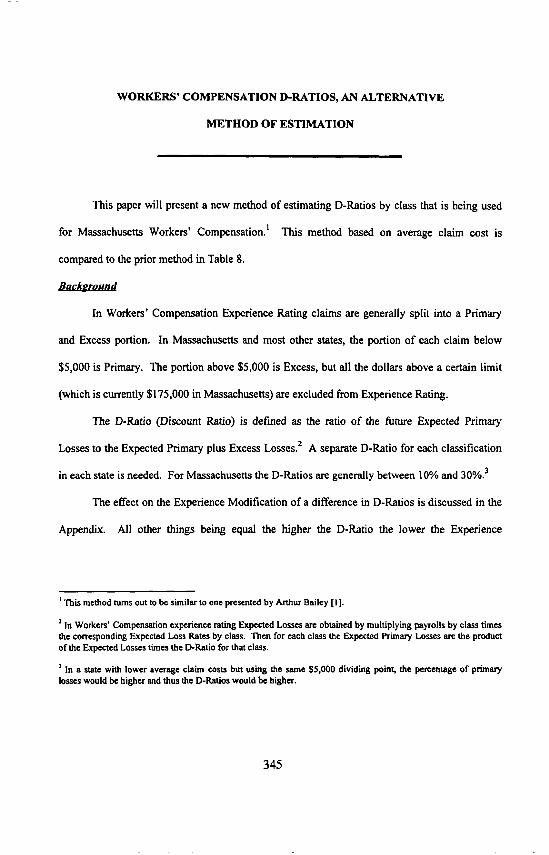
This paper will present a new method of estimating D-Ratios by class that is being used
for Massachusetts Workers' Compensation. l This method based on average claim cost is
compared to the prior method in Table 8.
Backeround
In Workers' Compensation Experience Rating claims are generally split into a Primary
and Excess portion. In Massachusetts and most other states, the portion of each claim below
$5,000 is Primary. The portion above $5,000 is Excess, but all the dollars above a certain limit
(which is currently $175,000 in Massachusetts) are excluded from Experience Rating.
The D-Ratio (Discount Ratio) is defined as the ratio of the future Expected Primary
Losses to the Expected Primary plus Excess Losses. 2 A separate D-Ratio for each classification
in each state is needed. For Massachusetts the D-Ratios are generally between 10% and 30%. 3
The effect on the Experience Modification of a difference in D-Ratios is discussed in the
Appendix. All other things being equal the higher the D-Ratio the lower the Experience
This method turns out to be similar to one presented by Arthur Bailey [1].
2 In Workers' Compensation experience rating Expected Losses are obtained by multiplying payrolls by class times the corresponding Expected Loss Rates by class. Then for each class the Expected Primary Losses are the product of the Expected Losses times the D-Ratio for that class.
J In a state with lower average claim costs but using the same $5,000 dividing point, the percentage of primary losses would be higher and thus the D-Ratios would be higher.
345
Modification. 4 In order to get an accurate Experience Modification one desires the best estimate
o f D-Ratios. 5
There are two basic problems in est imating D-Ratios. First, we are interested in the
expected ffi~lJ;ltm value. Therefore, we need to adjust the past data to reflect future conditions.
This is relatively routine and involves the usual severity trend and on-level factors for law
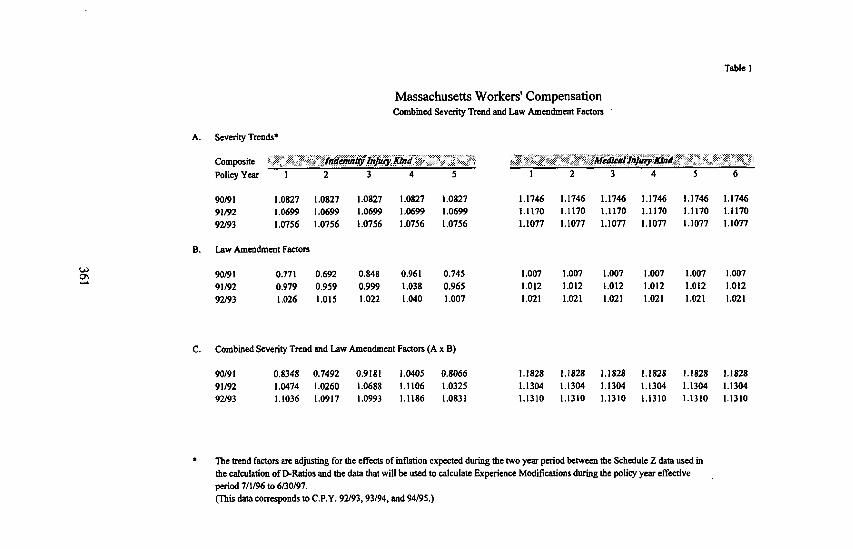
amendments used elsewhere in mtemaldng. 6 An example is shown in Table 1. Note that the
factors in Table 1 adjust the data 7 available at the time o f the rate indication to the expected level
o f the data that will be used to experience rate insureds during the policy effective per iod)
Ove~iew o f Methodoloev
This paper will focus on the second and more difficult problem. The volume o f data by
class in a state is insufficient in most cases to allow a good estimate o f the D-Ratio directly from
the data for that class.
However, one can work with the larger groupings. 9 Currently, there are five Industry
Crroups generally used for Workers ' Compensat ion for ratemaking: Manufacturing, Contracting,
4 A. I0 higher D-Ratio will result in a .04 to .07 lower Experience Modification, as discussed in the Appendix.
As well as the best estimate of other inpu~ such as Expected Loss Rates, credibilities, etc.
6 See for example Kallop [2] or Feldblum [3].
7 Unit Statistical Plsn data is usually compiled into a report called Schedule Z.
s Generally one would use three years of data to experience rate insureds. For example, during 1996 one would genenilly use 1994 at fast report, 1993 at second report, and 1992 at third report. At the time one was estimating D- Ratios for 1996, one might have available 1992 at fast report, 1991 at second report and 1990 at third report. In that case one would adjust the 1992 data at fast report to level expected for the 1994 data at fast report, etc.
9 Hazard Groups were u'ied, but the use of Induslry Groups did a better job of estimating D-Ratios. A major problem is that over 90% of the experience is concemrated in Hazard Groups 2 and 3.
3 4 6
Goods and Services, Office and Clerical, and Miscellaneous. In Massachuset ts (and states with a
similar or larger volume o f data ~°) each Industry Group has a sufficient amount o f data to
estimate its D-Ratio directly from the data. (See Table 2.)
The Construction Industry Group stands out from the other four as having a very
significantly lower D-Ratio. II Thus this breakdown splits out many o f the classes with the
lowest D-Ratios. Also, as will be seen, much o f the remaining variation within Industry Group
can be captured via relative average claim costs by class.
The methodology consists o f estimating the D-Ratio o f each class relative to the D-Ratio
o f its Industry Group. (These estimated relativities will be balanced to unity.) This relative D-
Ratio for each class will in turn be estimated from the relative average claim cost for that class.
Classes with higher than average severities will be estimated to have lower than average D-
Ratios. In other words, if the average claim size is larger, more o f the claim is excess and less is
primary.
Estimated Relative Average Claim Costs b_v Class
The estimated Relative Average Claim Costs by class are calculated based on the most
recent seven years o f Unit Statistical Plan data at second report. 12 Average Claim Costs are
calculated based on data excluding fatal, permanent total, and medical-only claims, as was used
,0 In states with very small amounts of data one could calculate a statewide D-Ratio and spread it to Industry Group based on the relativities over a longer period of time or in other states.
t, More large claims apparently lead to a smaller percent of primary losses.
,2 Second repon is the approximate average maturity of data used for experience rating. Unit Statistical Plan Data is submitted on every individual claim of size $2,000 or more. Evaluations are currently on a paid plus case reserve basis at the twst five reports. First report is I$ months from policy inception. Subsequent reports are at 12 month intervals.
347
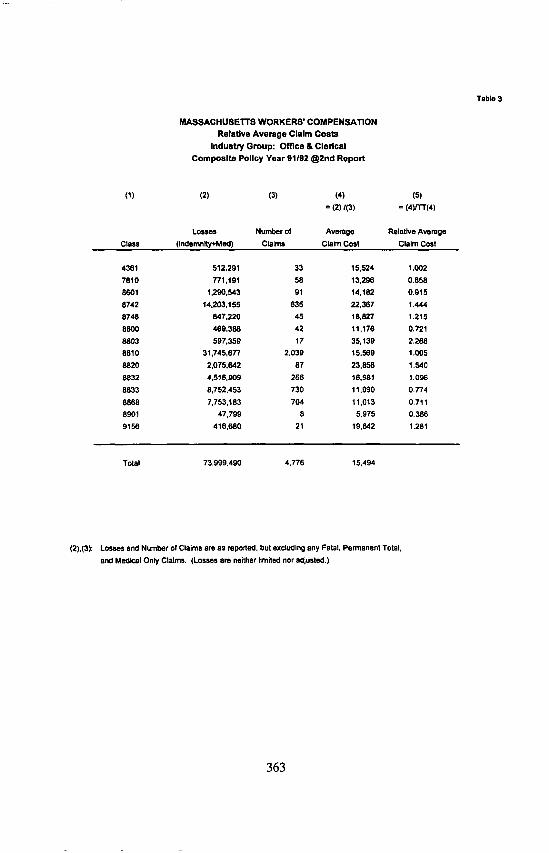
in the development of the model discussed subsequently. Table 3 is an example for the Office
and Clerical Industry Group for Composite Policy Year 91/92.13
For each year, for each Industry Group, the Relative Average Claim Cost for a class is the
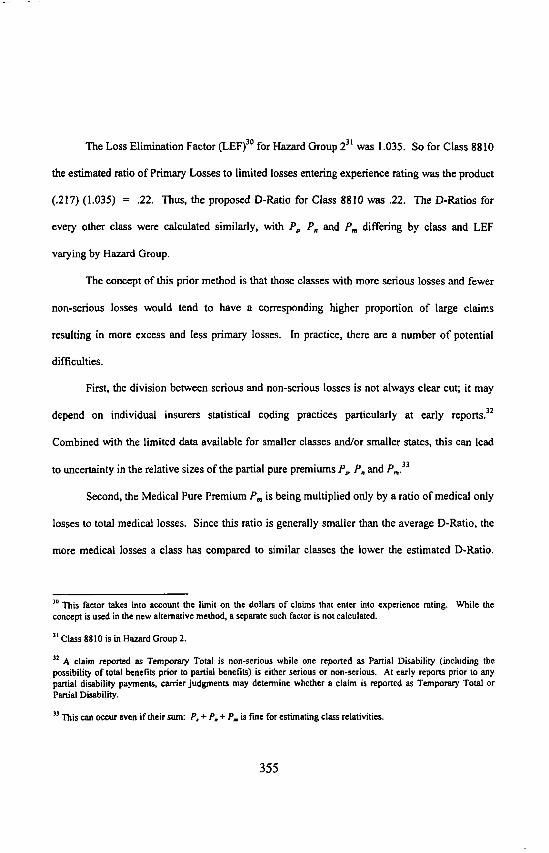
ratio of the Class Average Claim Cost to the Industry Group Average Claim Cost. Figure l
shows the results for two classes in the Office and Clerical Industry Group. For each class, the
seven years of Observed Relative Average Claim Costs are combined by taking a weighted
average using claim counts as weights. (See Table 4.)
However, there are only limited data for smaller classes. Therefore, Credibility has been
used to combine the Observed Relative Average Claim Cost by class with unity. (Unity
corresponds to the Industry Group average.) Credibility is taken equal to:
Jnumb~ of claims z = ~/ 2,500
A class with 2,500 or more claims is assigned a credibility of 1. The classical full
credibility criterion of 2,500 claims for severity was selected based on adjusting a criterion for
frequency of about i,000 claims by multiplying by the square of the coefficient of variation of
about 2.5.14 The results herein are relatively insensitive to the precise choice of the full
credibility criterion} 5 While a more "sophisticated" credibility method might have been
employed, in the author's opinion classical credibility is more than adequate for this particular
t~ Composite Policy Year 91/92 includes all experience on policies with effective dates between 7/I/91 and 6/30192.
'~ See Longley-Cook [4]. 1082 and 683 are common criterion for ~11 credibility for frequency mentioned by Longley-Cook. The Appendix of Longley-Cook's paper recommends multiplying by the square of the coefficient of variation to get a criterion 'for average claim costs. The observed square of the coefficient of variation for the severity for permanent partial and temporary total claims is about 2.5. The square of the coefficient of variation = varianceYmean 2.
Is For a discussion of this subject see Mah|er [5].
348
application, t6 The range o f estimated D-Ratios is so small that minor changes in the estimated
relative claim costs have relatively little final impact. 17
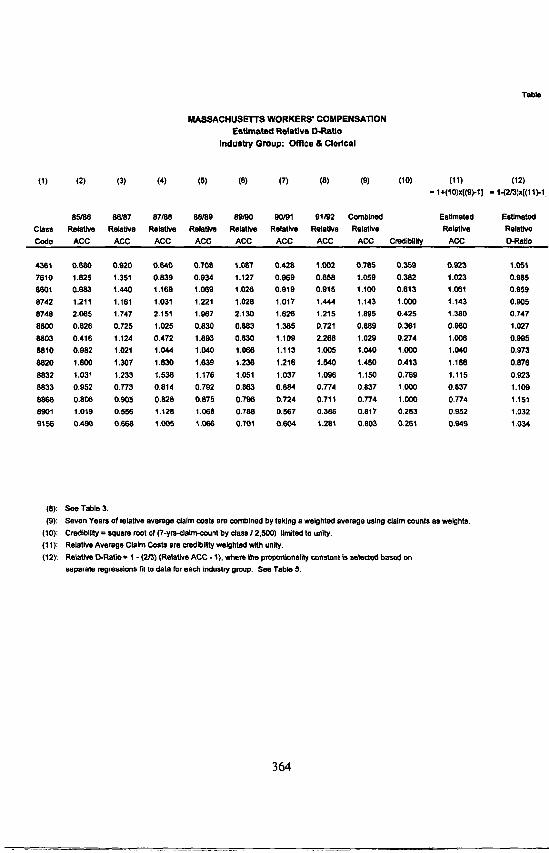
For example, the relative average claim costs by year for class 4361 are shown in Table 4.
There is sufficient fluctuation ffi'om year to year that any reasonable credibility method would
assign significantly less than full weight to this data. For example, suppose instead o f 35.9%
credibility, 20% credibility were assigned. The relative average claim cost would be .957 rather
than .923. The estimated relative D-Ratio would be 1.029 rather than 1.05 I. The resulting
estimated D-Ratio would be .24 rather than .25 as shown in Table 7. This difference is well
within the inherent error o f the whole estimation procedure.
The relative average claim cost is estimated for each class as seen in Column 11 o f
Table 4:
Estimated Relative Average Claim Cost = 1 + Z (Observed Relative Average Claim Cost - 1)
These estimated R.elative Average Claim Costs Is are then used in the model, that will be
described next, in order to derive estimated Relative D-Ratios. 19
Model o f Average Claim Cost vs. D-Ratio
As seen in Column 12 o f Table 4, within industry groups, the overall average D-Ratio is
spread to each classification using the following model:
~6 For a comparison of the practical impact of using classical credibility versus Bayesian/Btthlmann credibility see Mahler [5]. Mahler [6] discusses the use of different criteria to select optimal credibilities. Mahler [6] and Mahler [7] discuss the possible impact of shitting parameters over time. Taking into account the impact of shifting parameters over time here is a possible area of future research.
sT See the Appendix.
Is See Column (I I) of Table 4.
t9 See Column (12) of Table 4.
349
(Relative D-Ratio - 1) = (- 2/3) (Relative Average Claim Cost - 1)
The form of the model is based on the fact that larger claims contribute a smaller
percentage to primary losses than do smaller claims. For example, a $3,000 claim has 100% of
its losses as primary, while a $100,000 claim has 5/100 = 5% of its losses as primary. Thus
classes with higher than average claim sizes will be expected to have a smaller percent of their
losses as Primary, and therefore, have lower than average D-Ratios.
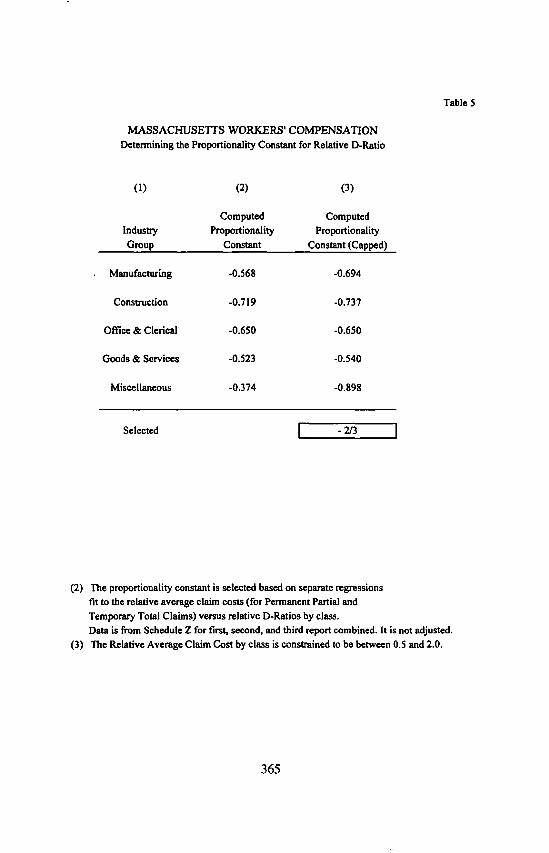
The particular coefficient used in the model was selected in Table 5, based on an
examination of the historical relationship between average claim costs and D-Ratios. 2°
Separately for each Industry Group weighted least squares regressions were performed on
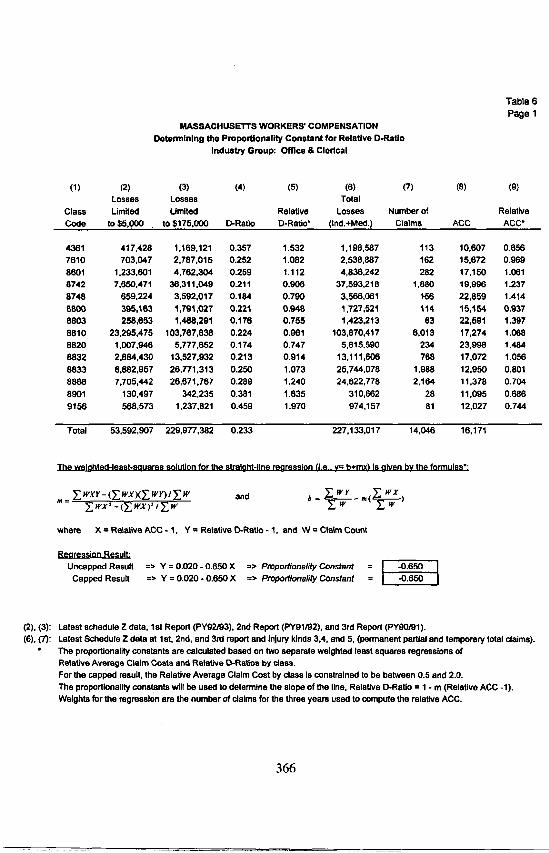
Relative Average Claim Costs and Relative D-Ratios by class. Table 6, Page 1 shows the Office
and Clerical Industry Group. 21
The most recent Unit Statistical Plan data (lst, 2nd, and 3rd report combined) by class is
used (without adjustment for law amendment or trend). An Observed D-Ratio is calculated in
Column 4 of Table 6 for each class as the ratio of Losses Limited to $5,000 to Losses Limited to
$175,000. The Relative D-Ratio in Column 5 of Table 6 for each class is the class D-Ratio
divided by the average for the Industry Group.
As was done previously, the Average Claim Cost by class is calculated for other than
fatal, permanent total, and medical-only claims. The fatal and permanent total claims are rare
~0 In s o m e sense the proportionality constant is a s eco nd us e of credibility. The proportionality constant measures how much o f a dev ia t ion from average one would expect in D-Ratio based on a certain deviation from the average severity.
2, Table 6, Pages 2 and 3 shows the similar calculation for the ConsU'uetion Industry Group.
350
and usually very large, and therefore would introduce undesirable random fluctl.lations. 22 The
medical-only claims are very numerous but due to their very small size, account for a very small
percent of total losses. 23 Based on the author's attempts to devise a method, apparently the
medical only claims mask the important differences between classes which would be expected to
lead to different D-Ratios.
Potentially valuable information has been '"thrown away" in the calculation of the relative
average claim costs by excluding fatal, permanent total and medical-only claims. However, the
resulting relative average claim costs by class showed a strong correlation with the relative D-
Ratios z4 by class. As in any actuarial computation, it would be possible to devise some way to
incorporate this additional information in some manner to some extent. This is an area of
potential future research, although given the small range of D-Ratios it is unlikely in the author's
opinion to have much practical impact. There is some advantage to simple practical methods that
work, without unnecessary technical refinements of no practical importance to the particular
application.
The Relative Average Claim Cost by class in Column 9 in Table 6 is the class Average
Claim Cost in Column 8 divided by the Industry Group Average Claim Cost. For purposes of the
regression, the Relative Average Claim Cost by class is constrained to be between 0.5 and 2.0.
u An alternative would have been to include fatal and permanent total claims, but to cap their size as is done for purposes of experience rating. In that case, the standard for full credibility of the observed relative average claim cost would be adjusted upwards.
z3 The medical onlys usually account for a significant proportion of primary lossesl
Which include the impact of claims of all injury kinds.
351
This prevents a small class with an extreme observed average claim cost over these three years,
from unduly influencing the regression results. 25
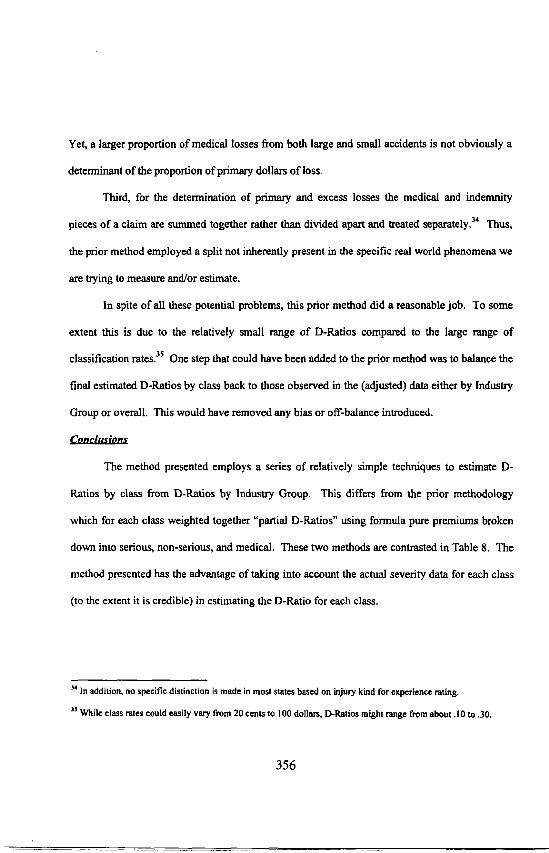
The weights used in the regression are the number o f claims by class in Column 7. Then
as stated previously, a weighted least squares regression between Relative Average Claim Costs
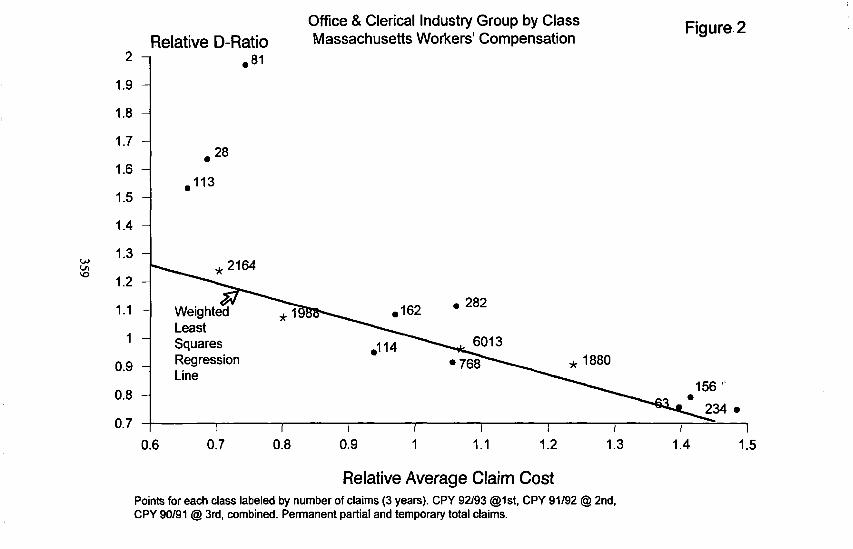
and Relative D-Ratios by class is performed separately for each Industry Group. Figure 2 shows
the regression for the Office and Clerical Industry Group.
These regressions yield five different estimates o f an appropriate proportionality constant
to be used in the model. As shown in Table 5, a single proportionality constant is selected within
the indicated range, z6 The choice o f a single proportionality constant is not a necessity for
application o f the method. That was the author 's judgment given the ability to only examine data
from one state over a limited period o f time. Given data from more states or more years a
different choice might have been made. In any case, each user o f the method could select
appropriate proportionality constants at this stage o f the procedure based on the available
information and his own judgment.
Then a Relative Average D-Ratio for each class in the Industry Group is calculated in
Column 12 o f Table 4, using the selected proportionality constant.
Table 7 shows the calculation o f the D-Ratios for these classes. The relative D-Ratios are
balanced to unity in Column 4 using the Expected Losses by class. In Column 5 the Indicated D-
As seen in Table 5, the results of capping were quite significant for the Miscellaneous Industry Group in this review.
26 A similar range was indicted in a prior review. However, there is considerable fluctuation in the slopes of the regressions. Performing similar regressions in additional states and over more periods of time might allow one to select different proportionality constants by Industry Group. Again, given the small range of D-Ratios, it is unclear how much impact such a refinement could have on the estimated D-Ratios.
352
Ratios by class are the product of the balanced relativity D-Ratio for each class times the
indicated D-Ratio for the Industry Group, in this case .2355 from Table 2 for the Office and
Clerical Group.
For class 8742 (Salespersons) its estimated relative claim cost is i.143, higher than
average for the Office and Clerical Group. This yields an estimated relative D-Ratio of
I - (2/3) (!.143 - I) = .905, lower than average for the Office and Clerical Group. After
balancing to unity the relative D-Ratio becomes .911. Then the estimated D-Ratio for class 8742
is (.911) (.2355) ~ .21.
Similarly, for every class its observed relative average claim cost will be used to estimate
its claim costs relative to its Industry Group. Then this in turn is used to estimate for each class
its relative average D-Ratio. Then the estimated D-Ratio for each class is the product of its
relative D-Ratio and the estimated D-Ratio for its Industry Group. Table 7 shows the final
estimated D-Ratios for each class in the Office and Clerical Industry Group. 27
Com_oarisqn to a Prior Method
The prior method used in Massachusetts was generally along the lines described in
Gillam [8], 28 although some of the details differed. As shown in Table 8 in the prior method one
calculated three "partial D-Ratios" as follows.
D (Serious) = Primary Serious Losses (Indemnity & Medical) Serious Indemnity Losses
D (Non - Serious) = Primary Non - Serious Losses (Indemnity & Medical) Non - Serious Indemnity Losses
27 Similar exhibits would be produced for the other four Indusu'y Groups.
See Pages 238-239, 249-251 of PCAS 1992.
353

D (Medical) = Medical Only Losses
Total Medical Losses
The above statewide partial D-Ratios were used to calculate the D-Ratios by using the
following formula:
D-Ratio = (P . ) (D, ) + (P . ) (D . ) + ( P . ) ( D . ) LEF, where p., p . , and p . p , + p . + P .
are the adopted partial pure premiums underlying the rate for a class for the serious, non-serious,
and medical losses, respectively; D~, D., and Dm are the statewide partial D-Ratios; and LEF is the
. . . . 2 9 appropnate loss elmunauon factor.
For example, in the filing for 1/1/95 Massachusetts Workers' Compensation rates, the
part ia l D -Ra t i os were:
D, = .089
O. = .521
Dm = .110
For example, for Class 8810 (Clerical Risks) the partial pure premiums from the
classification ratemaking process were
P, = .10 P. = .07 Pm = .08.
Thus, the estimated ratio of Primary Losses to Total Losses for this class was:
(30) ( .089) + (.07) (521) + (.08) (.110) = .217. .10 + .07 + .08
29 Loss Elimination Factors (LEFs) varied by hazard group. Multiplication by the LEF was necessary since actual losses used in individual risk experience ratings are limited. The LEF removed that portion of the pure premium which is excluded in the individual risk experience rating.
354
The Loss Elimination Factor (LEF) 3° for Hazard Group 231 was 1.035. So for Class 8810
the estimated ratio o f Primary Losses to limited losses entering experience rating was the product
(.217) (1.035) = .22. Thus, the proposed D-Ratio for Class 8810 was .22. The D-Ratios for
every other class were calculated similarly, with P~, P, and P,,, differing by class and LEF
varying by Hazard Group.
The concept o f this prior method is that those classes with more serious losses and fewer
non-serious losses would tend to have a corresponding higher proportion of large claims
resulting in more excess and less primary losses. In practice, there are a number o f potential
difficulties.
First, the division between serious and non-serious losses is not always clear cut; it may
depend on individual insurers statistical coding practices particularly at early reports. 32
Combined with the limited data available for smaller classes and/or smaller states, this can lead
to uncertainty in the relative sizes o f the partial pure premiums P~ P,, and Pro.J3
Second, the Medical Pure Premium Pm is being multiplied only by a ratio of medical only
losses to total medical losses. Since this ratio is generally smaller than the average D-Ratio, the
more medical losses a class has compared to similar classes the lower the estimated D-Ratio.
30 This factor takes into account the limit on the dollars of claims that enter into experience rating. While the concept is used in the new alternative method, a separate such factor is not calculated.
3t Class 8810 is in Hazard Group 2.
32 A claim reported as Temporary Total is non-serious while one reported as Partial Disability (including the possibility of total benefits prior to partial benefits) is either serious or non-serious. At early reports prior to any partial disability payments, carrier judgments may determine whether a claim is reported as Temporary Total or Partial Disability.
33 This can occur even if their sum: P, + P, + P, is fine for estimating class relativities.
355
Yet, a larger proportion of medical losses from both large and small accidents is not obviously a
determinant of the proportion of primary dollars of loss.
Third, for the determination of primary and excess losses the medical and indemnity
pieces of a claim are summed together rather than divided apart and treated separately. 34 Thus,
the prior method employed a split not inherently present in the specific real world phenomena we
are trying to measure and/or estimate.
In spite of all these potential problems, this prior method did a reasonable job. To some
extent this is due to the relatively small range of D-Ratios compared to the large range of
classification rates. 35 One step that could have been added to the prior method was to balance the
tinal estimated D-Ratios by class back to those observed in the (adjusted) data either by Industry
Group or overall. This would have removed any bias or off-balance introduced.
Conclusions
The method presented employs a series of relatively simple techniques to estimate D-
Ratios by class from D-Ratios by Industry Group. This differs from the prior methodology
which for each class weighted together "partial D-Ratios" using formula pure premiums broken
down into serious, non-serious, and medical. These two methods are contrasted in Table 8. The
method presented has the advantage of taking into account the actual severity data for each class
(to the extent it is credible) in estimating the D-Ratio for each class.
In addition, no specific distinction is made in most states based on injury kind for experience rating.
35 While class rates could easily vary from 20 cents to 100 dollars, D-Ratios might range flora about .10 to .30.
356
11]
[2]
[3 ]
[4]
[5]
[6]
[7]
[8]
(9]
R E F E R E N C E S
Bailey, Arthur L., "Workmen's Compensation D-Ratio Revision," PCAS XXXV, 1948, pp. 26-39.
gallop, Roy H., "A Current Look at Workers' Compensation Ratemaking," PC.AS LXII, 1975, pp. 62- 133.
Feldblum, Sholom, "Workers' Compensation Ratemaking (selected chapters)," CAS Forum, Special Edition including 1993 Ratemaking Call Papers, February 1993, pp. 24 I-312.
Longley-Cook, Laurence H., "An Introduction to Credibility Theory," PCAS XLIX, ! 962, p. 194.
Mahler, Howard C., "An Actuarial Note on Credibility Parameters," PCAS LXXIII, 1986, pp. 1-26.
Mahler, Howard C., "An Example of Credibility and Shitting Risk Parameters," PCAS LXXVII, 1990, pp. 7225-308.
Mahler, Howard C., "A Markov chaLn Model of Shifdng Risk Parameters," PCAS LXXXIV, 1997.
Gillam, William IL, "Workers' Compensation Experience Rating: What Every Actuary Should Know," PCAS LXXIX, 1992, pp. 215-254.
Mahler, Howard C., Discussion of Gillam: "Purametrizing the Workers' Compensation Experience Rating Plan," PC.AS LXXX, 1993, pp. 148-183.
357
OO
1.5
1.4
1.3
1.2
1.1
Example Classes from Office & Clerical Industry Group Figure 1 Relative Average Claim Costs Massachusetts Workers' Compensation
. . . . . . . . . . . . . . . . . . . . . . . . . . . . . . . . . . . . . . . . . . . . . . . . . . . . . . . . . . . . . . . . . . . . . . . . . . . . . . . . . . . . . . . . . . . . . . . . . . . . . . . .
Class ] . . . . . . . . . . . . . . . . . 1"X'-8742 (Salesperson) ~ . . . . . . . . . . . . . . . . . . . . . . . . . . . . . . . . . . . . . . . . . . . . . . . . . . . . . .
~ 8 8 6 8 (School Professional)
n
, 9 . . . . . . . . . . . . . . . . . • . . . . . . . . . . . . . . . . . . . . . . . . . . . . . . . . . . . . . . . . . . . . . . . . . . . . . . . . . . . . . . . . . . . . . . . . . . . . . . . . . . .
0.8 J . . . . . . . . . . . . . . . . . . . . . . . . . . . . . . . . . . . . . . . . . . . . . . . . . . . . . . . . . . . . . . . . . . . . • . . . . . . . . . . . . . . . . . . . . . . . . . . . . . . . . . .
0.7
0.6 I I t I I I I 85186 86187 87•88 88•89 89190 90/91 91192
Composite Policy Year (at 2nd report)
m
1.9-
1 .8-
1 .7-
1 .6-
1 .5-
1 .4-
1 .3-
1 . 2 - -
1.1
1
0.9
0.8
0.7
Relative D-Ratio •81
Office & Clerical Industry Group by Class Massachusetts Workers' Compensation
Figure 2
28
113
~ 6 0
162 • 282
13 Regression ="-~ o 7 6 8 ~ . 1880 Line ~ 156 "
• 234• f I I f f J I I I
0.6 0.7 0.8 0.9 1 1.1 1.2 1.3
Relative Average Claim Cost Points for each class labeled by number of claims (3 years), CPY 92/93 @1st, CPY 91/92 @ 2nd, CPY 90/91 @ 3rd. combined. Permanent partial and temporary total claims.
1.4 1.5
O~
Experience Rating Credibilities, Prima~ vs Excess Figure 3 Massachusetts Workers' Compensat ion
100% . . . . . . . . . . . . . . . . . . . . . . . . . . . . . . . . . . . . . . . . . . . . . . . . . . . . . . . . . . . . . . . . . . . . . . . . . . . . . . . . . . . . . . . . . . . . . . . . . . . . . . . . . . . I Credibilities ]
__t~ ' - Primary / . . . . . . . . . . . . . . . . . . . . . . . . . . . . . . . . . . . . . . . = _- : . . . . . . . . . =--=-...:- . . . . 900/o i ÷ Exces, / J , . . . . ' ' - " - ~ - 80% - - Primary - Excess
7O%
6O%
5O%
4 0 %
3O%
20%
10%
% . . . . . . . . . . . . . . . . . . . . . . . . . . . . . . . . . . . . . . . . . . . . . . . . . . . . . . . . . . . . . . . . . . . . . . . . . . . . . . . . . . . . . . . . . . . . . . . . . . . . . . . . . .
3 30 300 3000
Expected Annual Losses ($000)
Revised Experience Rating Plan, with g = 7
0~
Table 1
Massachusetts Workers' Compensation Combined Severity Trend and Law Amendment Factors "
A. Severity Trends*
Composite ~:!/~:::~:.:: i~!~.~Jt~'~ii0RtYltt]C~'~KIn#':~::i~::~"~:~::::~:~:~ Policy Year I 2 3 4 5
~i:~:i Ji~!~::~::~# ~ ~ M ~ . ~ 1.,¢/#i~l~/fi/'~ :i~!~:::':~:::::~i~:~:::!~:~.~.~ .... I 2 3 4 5 6
90/91 91/92 92/93
1.08227 1.0827 1.08227 1.0827 i.0827 1.0699 1.0699 1.0699 1.0699 1.0699 1.0756 1.0756 !.0756 1.0756 1.0756
1.1746 1.1746 1.1746 1.1746 !.1746 1.1746 1.1170 I.I170 1.1170 1.1170 1.1170 1.1170 !.1077 1.1077 1.1077 !.1077 1.1077 1.1077
B. Law Amendmant Factors
90/91 91/92 92/93
0.771 0.692 0.848 0.961 0.745 0.97/9 0.959 0.999 1.038 0.965 1.026 1.015 1.022 1.040 1.007
1.007 1.007 1.007 1.007 1.007 1.007 1.012 1.012 1.012 1.012 1.012 1.012 1.021 1.021 1.021 1.021 1.021 1.021
C. Combined Severity Trend and Law Amendment Factors (A x B)
90/9 I 91/92 92./93
0.8548 0.7492 0.9181 1.0405 0.8066 1.0474 1.0260 1.0688 1.1106 1.0325 1.1036 !.0917 1.0993 1.1186 1.0831
1.1828 1.1828 1.1828 1.1828 1.1828 1.1828 1.1304 1.1304 1.1304 1.1304 1.1304 1.1304 1.1310 1.1310 1.1310 1.1310 1.1310 1.1310
* The trend factors arc adjusting for the effects of inflation expected during the two year period between the Schedule Z data used in the calculation of D-Ratios and the data that will be used to calculate Experience Modifications during the policy year effective period 7/1196 to 6/330/97. (This data corresponds to C.P.Y. 92/93, 93194, and 94195.)
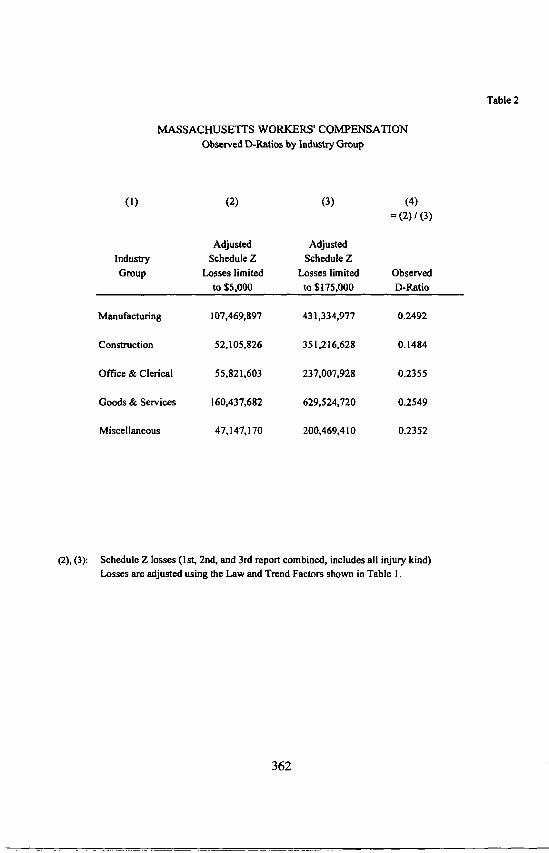
MASSACHUSET]'S WORKERS' COMPENSATION Observed D-Ratios by Industry Group
Table 2
(1) (2) (3) (4) = (2) / (3)
Adjusted Adjusted Industry Schedule Z Schedule Z Group Losses limited Losses limited Observed
to $5,000 to $175,000 D-Ratio
Manufacturing 107,469,897 431,334,977 0.2492
Construction 52,105,826 351,216,628 0.1484
Office & Clerical 55,821,603 237,007,928 0.2355
Goods & Services 160,437,682 629,524,720 0.2549
Miscellaneous 47,147,170 200,469,410 0.2352
(2), (3): Schedule Z losses (1 st, 2nd, and 3rd report combined, includes all injury kind) Losses are adjusted using the Law and Trend Factors shown in Table 1.
362
MASSACHUSEI"r8 WORKERS' COMPENSATION
Relative Average Claim Cos~
Industry Group: Office & Cledcal
Composite Policy Year 9t/92 ~2nd Report
(1) (2) (3) (4) (S)
= (2)•(3) =(4)/'1"1"(4)
Class
Losses Number o1 Average
(Indemnity+Mad) Claims Claim Cost
Relative Average
Claim Cost
Table 3
4361 512.291 33 15,524 1.002
7610 771,191 58 13,296 0.858
8601 1,290,543 91 14,182 0.915
8742 14,203.155 635 22,367 1.444
8748 847,220 45 18,827 1.215
8800 469.388 42 11,176 0.721
8803 597,359 17 35,139 2.2268 8810 31,745,677 2.039 15,569 1.005
8820 2,075.642 87 23,858 1.540
8832 4,516.909 266 15,981 1.096
8833 8,752,453 730 11.990 0.774
8868 7.753,t83 704 t 1,013 0,711
8901 47,799 8 5.975 0.386
9156 416,680 21 19.842 1.281
Total 73,999.490 4,776 15,494
(2),(3): Los,ms and Number of Claims are as reposed, but excluding any Fatal. Permanent Total,
and Medical Only Claims. (Losses are neither limited nor acljusted.)
363
MASSACHUSE'I ' rS WORKERS' COMPENSA'nON
Est lmst~: l Relat ive D-Rstlo
InduBby Group: Off ice & Clerical
(1) (2) (3) (4) (6) (6) (77) (8) (9) (10)
85/86 86/87 87188 88/89 89/90 90/91 91/92 Combined
Class Relative Relative RefaUve Relative Relative Relative Relative Relative
Code ACC ACC ACC ACC ACC ACC ACC ACC Credibility
(11) (12)
= 1+(10)x[(9)-1] * 1-{2/3)x[(11)-1
Estimated Estimated
Relative Relaffva
ACC D-RaUo
4361 0.680 0.920 0.640 0.708 1.087 0.428 1.002 0.785 0.359
7610 1.625 1.351 0.839 0.034 1.127 0.969 0.888 1.059 0.382 8601 0.983 1.440 1.169 1.069 1.026 0.919 0.015 1.100 0.613
8742 1.211 1.161 1.031 1.221 1.028 1.017 1.444 1.143 1.000
8748 2.065 1.747 2.151 1.967 2.130 1.626 1.215 1.895 0.425
8800 0.626 0.728 1.025 0.830 0.883 1.365 0.721 0.889 0.361
8803 0.416 1.124 0.472 1.893 0.830 1.109 2.266 1.029 0.274
8810 0.982 1.021 1.044 1.040 %066 1.113 t.005 1.040 1.000
8820 1.800 1.307 1.630 1.639 1.236 1.216 1.540 1.4,50 0.413
8832 1.031 1.233 1.536 1.178 1.051 1.037 1.096 1.150 0.769
8833 0.952 0.7'73 0.814 0.792 0.863 0.884 0.7"74 0.837 1.000
8868 0.806 0.908 0.828 0.678 0.796 0.724 0.711 0.77/4 1.000
8901 1.019 0.556 1.128 1.066 0.78.8 0.567 0.388 0.817 0.263
9156 0.490 0.668 1.005 1.066 0.701 0.604 1.261 0.803 0.261
0.023 1.051
1.023 0.985
1.061 0.959
1.143 0.905 1.380 0.747
0.960 1.027
1.008 0.995
1.040 0.073
1.188 0.878
1.115 0.923
0.837 1.109
0.774 1.151
0.952 1.032
0.949 1.034
(8): See Table 3.
(9): Seven Years of relative average claim costs are combined by taking • weighted average using claim counts as weights.
(10): Credibility = square root of (7-ym-.Jatm-count by class 1 2.500) limited to unity.
(11): Relative Average Claim Costs are uedibllity weighted with unity.
(12): Relative D-Rat~ = 1 - (2/3) (RetstJ've ACC - 1). where the. pmportlonat~ constant ~s setscted based on
separate regressions rffi to data for each Indust W group. See Table 5.
364
MASSACHUSETTS WORKERS' COMPENSATION Determining the Proportionality Constant for Relative D-Ratio
Table 5
(1) (2) (3)
Computed Computed Industry Proportionality Proportionality Group Constant Constant (Capped)
Manufacturing -0.568 -0.694
Construction -0.719 -0.737
Offi~ & Clerical -0.650 -0.650
Goods & Services -0.523 -0.540
Miscellaneous -0.374 -0.898
Selected [ - 2/3 [
(2) The proportionality constant is selected based on separate regressions fit to the relative average claim costs (for Permanent Partial and Temporary Total Claims) versus relative D-Ratios by class. Data is from Schedule Z for first, second, and third report combined. It is not adjusted.
(3) The Relative Average Claim Cost by class is constrained to be between 0.5 and 2.0.
365
MASSACHUSEI"fS WORKERS' COMPENSATION Determining the Proportionality Constant for RelaUve O-Ratio
Industry Group: Office & Cledoal
Table 6 Page 1
(1) (2) (3) (4) (5) (6) (7) Losses Losses Total
Class Limited Umited Relative Losses Number of Cede to $5,000 to $t75,000 D -Ra t i o D-Ratio ° (Ind.+Mad.) Claims
(8)
ACC
(9)
Relative ACC °
4361 417,428 1,169,121 0.357 1.532 1,198,587 113 10,607 7610 703,047 2,787,015 0.252 1 ,082 2,538,887 162 15,672 8601 1,233,601 4,762,304 0.259 1 .112 4,836,242 282 17,150 8742 7,650,471 50,311,049 0.211 0 .906 37,593,218 1,880 19,996 8748 659,224 3,592,017 0.184 0.790 3,566,061 1',56 22,859 8800 395,163 1,791,027 0.221 0.948 1,727,521 114 15,154 8803 258,653 1,468,291 0.176 0.755 1,423,213 63 22,591 8810 23,295,475 103,767,838 0.224 0.961 103,870,417 6,013 17,274 8 8 2 0 1 ,007,946 5,777,652 0.174 0 . 7 4 7 5,615,590 234 23,998 8832 2,884,430 13,5270932 0.213 0 .914 13,111,606 768 17,072 8833 6,682,957 26,771,313 0.250 1.073 25,744,078 1,988 12,950 8868 7,705,442 26,671,767 0.289 1,240 24,622,778 2,164 11,378 8901 130,497 342 ,235 0.381 1.635 310,662 28 11,095 9156 568,573 1,237,821 0.459 1.970 974,157 81 12,027
0.650 0.969 1.061 1.237 1.414 0.937 1.397 1.068 1.484 1.050 0.801 0.704 0.686 0.744
Total 53.592,907 229,977,382 0.233 227,133,017 14,046 16,171
The welohted-least-souares solution for the stmloht-line reoression fi.e., v= b+mx~ is aiven bv the formulas':
E w r E wx = Ewxr-(~wx×Ewr)/~w a n d b = -~--.(.-~-) = ~wx,_12wx), lZ w
where X = Relative ACC - 1, Y = Relative D-Ratio - 1, and W = Claim CouP, t
Reoression Result: Uncapped Result => Y = 0.020- 0,650 X => Proportionality Constant = I ..0.650 I
I I Capped Result => Y = 0.020 - 0.650 X => Proportionafity Constant = ..0.650
(2),(3): (6).~:
Latest schedule Z data, 1at Report (PY92J'93), 2nd Report (PY91/92), and 3rd Report (PY90/91). Latest Schedule Z data at 1st, 2nd, and 3rd report and injury kinds 3,4, and 5, (pan.anent partial and temporary total claims). The proportionality constants are calculated based on two separate weighted least squares regressions of Relative Avera9e Claim Costs and Relative D-Ratios by class. For the capped result, the Relative Average Claim Cost by class is constrained to be between 0.5 and 2.0. The proportionality constants will be used to determine the slope of the line, Relative D-Ratio = 1 - rn (Relative ACC -1). Weights for the regression are the number of claims for the three years used to compute the relative ACC.
366
MASSACHUSETTS WORKERS' COMPENSATION
Determining the Proportionality Constant for Relative D-Ratio
Industry Group: Consb'uctJon
(1) (2) (3) (4) (5) (6) (7) (8) (9) Losses Losses Total
Class ~mRed UmRed Relative Losses Number of Relative Code to $5.000 to $175.000 D-RaUo D-RatUo" (lnd.+Me,~.) Claims ACC ACC"
Table 6 Page 2
3~5 3~4 3726 ~20 5O22 ~37 5O4O
5057 5059 5O69
5102 51~ 51~ 5183 51~ 5190 5213 5215 5~1 52~ 5~3 5~8
~03 ~5437 5443 5445 5462 ~72 ~73
~79 548O ~91 5506 5~7 5508 55~ 5538 5~5 5547 5606 ~10 5645 ~51 5701 5703 5705 6OO3
0 0 0.000 0.000 0 0 290.960 1,356,389 0.215 1.463 1,338.905 73
2.021,485 10,603,943 0.191 1.299 9,381.940 519 473,608 3.361,013 0.141 0.959 3,539.978 99 184,446 710,580 0.260 1.769 688,540 44
1.890,905 18,396.114 0.103 0.701 18,147,377 473 59,546 878,054 0.068 0.463 872,591 12
282,117 2,423,818 0.116 0.789 2,464,765 61 179,242 1,832,777 0.098 0.667 2,065,949 45 197.854 2,806,431 0.071 0.483 2,766,448 47
0 0 0.000 0.000 0 0 348,074 2,560,599 0.136 0.925 2,548,968 80 418.689 2,866,815 0.146 0.g93 4.275,866 100 523,541 3,121.718 0.168 1.143 2,5,47.110 114
5,468,919 30.309,688 0.180 1.224 30,120,877 1,364 514,284 2,657,775 0.194 1.320 2,711.444 130
4,846.811 26,036,511 0.186 1.265 28.324,142 1,231 2,298.598 20,666,128 0.111 0.755 22.559.557 498
540,583 2,818,636 0.192 1.306 3,650,903 151 2,0,41,603 14,044,385 0.145 0.986 14,136,217 478
323.049 2,458.801 0.131 0,891 2,445,396 72 135,945 721,686 0,188 1.279 706,148 43 313,358 3,019,976 0.104 0.707 3.302,631 78 12,711 130,765 0.097 0.660 128,604 3
1,007.087 6,336.159 0.159 1.082 6,510,484 250 2,844,361 15,628.306 0.153 1.041 19,259,851 712
4,503 4.503 1.000 6.803 4,503 1 1,582,566 12,917.375 0.123 0.837 12.756,711 383
428.823 2,839.970 0.151 1.027 2,872,793 102 10,044 51.123 0.196 1.333 51,079 2 56,427 243,086 0.232 1.578 237,221 13
1.919,025 13,372.65,4 0.144 0.980 14.356.638 504 1,404,9~ 8,703,239 0.161 1.095 8,882,747 363
240.153 1.758,259 0.137 0.932 1,811,186 56 0 0 0.000 0.000 0 0
473.963 3,770,454 0.126 0.857 3,539,603 113 606,373 5,260.851 0.115 0.782 5,017,185 131
15.586 170,900 0.091 0.619 170.314 3 399.010 1,498.814 0.266 1.810 1,527.072 129
1,820,815 11.952,588 0.152 1.034 11,691,223 451 92.886 931,065 0.100 0.680 933.751 24
1,053,311 8,262.439 0.127 0.864 8,101.488 264 1,875,797 12,448,637 0.135 0.918 13,197,169 384
293,814 2 ,738,318 0.107 0.728 2,704,521 67 4,247,167 25,132,765 0.169 1.150 27,353,628 1,125
733,647 5,371,526 0.137 0.932 4,861,738 180 0 0 0.000 0.000 0 0
28,082 67,179 0.4t8 2.844 54,059 4 7,784 74,872 0.104 0.707 74,872 2
120,541 1,013,355 0.119 0.810 1,009,488 27
0 18,341 18,077 35,757 15,649 38.367 72,716 40,406 45,910 .58.881
0 31.837 42,759 22,343 22.083 20,857 23,009 45,300 24,178 29.574 33.964 18.422 42,341 42,868 26.042 27.050 4,503
33,307 28,165 25.540 18.248 28,485 24.415 32,343
0 31.324 38,299 56,771 11,838 25,923 36,906 30,687 34,368 40,366 24,314 27,010
0 13,515 37,436 37,388
0.000 0.645 0.836 1.258 0.550 1.350 2.558 1.421 1.815 2.071 0.000 1.120 1.504 0.786 0.77"7 0.734 0,809 1.593 0.850 1.040 1.195 0.578 1.489 1.508 0.916 0.952 0.158 1.172 0.991 0.898 0.642 I.~X~2 0~859 1.138 0.000 1.102 1.347 1.997 0.418 0.912 1.369 1.079 1.209 1.420 0.855 0.950 0.000 0.475 1.317 1.315
367
MASSACHUSE'f ' rS WORKERS' COMPENSATION
Determining the Proport ional i ty Constan t for Relative D-Ratio
Industry Group: Consb'uct lon
Table
Page
(1) (2) (3) (4) (5) (6) (7) (8) (9) Losses Losses Total
Class Limited Limited Relative Losses Number of RelatJve Code to $5,000 to $175,000 D-Ratio D-Ratio" (Ind.+Mad.) Claims ACC ACC"
6005 0 O O.000 0.000 0 O 0 6204 428,238 3,353,397 0.128 0.871 3,334,883 103 32,378 6217 2.835,335 22,451,780 0.126 0.857 23,588.377 628 37.581 6229 123,324 513,513 0.240 1.633 486,348 33 14,738 6233 147,313 1,319.626 0.112 0.762 1,394,680 29 48.092 6251 301,721 t ,808,839 0.167 1.136 1,558,398 46 33,878 6252 4,6,410 178,983 0.259 1.762 162.315 7 23.188 6306 346.744 3.057,488 0.113 0.769 3,324,338 -80 41.554 6319 459.265 3,943,188 0.116 0.789 4,298,717 108 39,803 6325 68,290 404,803 0.169 1.150 219,621 14 15.687 6400 190,150 1,031,940 0.184 1.252 993,606 53 18,747 7538 78,217 524,010 0.149 1.014 515,923 lg 27,154 7601 133,924 1.114,583 0.120 0.816 1,100,339 37 29,739 7855 33,647 569.450 0.059 0.401 565,803 6 94,301 8227 720,884 4.705,343 0.153 1.041 4,511,813 193 23,377 9530 0 0 O.000 O.000 0 O 0 9534 55,093 611.613 0.090 0.612 610,404 10 61,040 9545 24,015 32,868 0.731 4.973 26,532 7 3,790 9549 41,916 100,213 0.418 2.844 97,394 11 8.854 9552 227,315 1,298,740 0.175 1.190 1.284,387 57 22,533 9553 15,104 145,338 0.104 0.707 145,234 3 48,411
Total 50,709,904 344,496,754 0.147 353,900,770 12,449 28,428
The welehted-leaat-sauams solution for the straleht-IInA reomsalen (i.e.. v= b+mx'~ is oiven by the formulas*:
. = ~ w x Y - ( ~ w x ) ( ~ w r ) l ~ w and
WY ~ WX
where X = Relative ACC - 1, Y = Relative D-Ratio - 1, and W = Claim Count
R~rassloTI Resa~
Uncappod Result => Y = 0.057- 0.719 X =>Propodional/tyConstant=l-0.719 I Copped Result => Y - 0.057 - 0.737 X -> Proportionality Constant ,-0.737
(2), (3): Latest schedule Z data, 1st Report (PY92/93), 2nd Report (PY91/92), and 3rid Report (PY90/91).
(6), (7): Latest Schedule Z data at 1eL 2nd, and 3rd report and Injury kinds 3,4, and 5, (perrnanent partial and temporary total claims). The pmpo~onality constants am calculated based on two separate weighted least squama regressions of
Relative Average. Claim Costs and Reisthm D-Raaos by class.
For the capped result, the Relative Average Claim Cost by class is constrained to be between 0.5 and 2.0.
The proportionality constants will be used to detamnlne the elope of the line, Relathte D-Ratio = 1 - m (Relative ACC -1). We~hts for the ragrassl, on are ~ numt~r of cts|ms fo~ the three yaa~ used to compute the ratatNe ACC.
368
MASSACHUSE1TS WORKERS' COMPENSATION D-Ratios, Adjusted for Trend and Law Factors
Industry Group: Office & Cledcal D-Ratios Balanced to: 0.2358
Table 7
Phraseology
(1) (2) (3) (4) (5) Expected Estimated Balanced
Class Losses Relative Relative Indicated Code ($ million) D-Ratio D-RaUo D-Ratio
Photographer-All Emp-.CleficaI,Sales-& Dr 4361 Radio or TV Broadcast-All Emp,Clar-& Dr 7610
Engineer or Architect-Consulting 8601 Satesperson,Colleetor, Massenger-Outaida 8742 Auto Sales or Service Agcy-Saleaperson 8748
Mailing or Addressing Co.-& Clerical 8800 Auditor,Accountant,Etc-Tmvellng 8803 Cledcal Office Employees NOC 8810
Attomey-All Emp-CledcaI,Meesenger & Dr 8820 Physician.-.& Cledcal 8832
Hospital-Professional Employees 8833 School-Professional Emp & Cledcal 8868
Telephone/Telegraph Co-Office Emp & CI 8901 "rheatro-Players,Entertalnem,M usldans 9156
1.1 1.051 1.058 0.25 2.0 0.985 0.992 0.23 3.7 0.859 0.966 0.23 24.5 0.905 0.911 0.21 2.8 0.747 0,752 0.18 1.2 1.027 t .034 0.24 2.1 0.995 1.002 0.24 72.8 0.973 0.980 0.23 3.9 0.876 0.882 0.21 10.5 0.923 0.930 0.22 19.3 1.109 1.117 0.26 20.2 1.151 1.189 0.27 0.2 t .032 1.039 0.24 0.0 1.034 1.041 0.25
Weighted Average = 0.993 1.000 0.23
(2): Expected lo~.u~,s are the three years of payrolls Umee the Indicated Expected Loss Ratos. (3): From Table 4. (4): Relative D-Ratios are balanced to unity using the expected losses as weights, where
Balanced Relative D.Ratio = (Estimated Relative D-Patio) / (Estimated Relative D-Ratio Weighted Average) (5): Proposed D-Ratio = (Balanced Relative D-.Ratlo) x (leduatJy Group Observed D-Ratio)
Industry Group Observed D-Ratio is from Table 2.
369

ZAIK,E_Ii
O V E R V I E W OF T W O M E T H O D S O F . E S T I M A T I N G D - R A T I O S
Prior Massachusetts Method a n d / o r Gi l l am [8], P C A S 19921
Adjust the reported data for changes expected between the data available now and that to be used for experience rating in the future.
2. Calculate 3 Partial D-Ratios.
Serious Serious Primary Losses
Partial D - Ratio Serious Indemnity Losses
Non - Serious Non - Serious Primary Losses m
Partial D - Ratio Non - Serious Indemnity Losses
Medical Medical Only Losses
Partial D - Ratio Medical Losses
3. For each class take the estimated Serious, Non- Serious and Medical Partial Pure Premiums used to determine classification rate relativitias.
4. Weight the Partial D-Ratios from Step 2 using the Partial Pure Premiums from Step 3.
5. Adjust for the impact on the D-Ratio of those losses excluded from Experience Rating?
Current Massachusetts Method (Al terna t ive Method)
1. Adjust the reported data for changes expected between the data available now and that to be used for experience rating in the future.
2. Calculate D-Ratios by Industry Group. 2
3.
4.
Estimate Average Relative Claim Cost by Class within Industry Group.
Spread to each class the Average D-Ratio for each Industry Group from Step 2 using Relative Average Claim Costs in Step 3.
The National Council on Compensation Insurance has been updating their methodologies every few years. Details have changed and continue to change, but the over-all approach has remained the same.
The denominator of the D-Ratios is total losses minus those excluded from experience rating. The numerator is Primary Losses.
3 The denominator of the D-Ratios should be expected total losses minus those expected to be excluded from experience rating.
3 7 0

~g.EK~LO.IX
where:
Let the experience modification be given by:
M_ ( l - z.)E~ + z. A,+O-z,)e, +z, E
= (1 - Zp) O + Zp ( A / E ) + (1 - Z~) ( 1 - D) + Zx (As/E)
Ap = Actual Primary Losses
A x = Actual Excess Losses
Ep = Expected Primary Losses
Ex = Expected Excess Losses
E = E , + E ~
Zp = Primary Credibility
Z, = Excess Credibility
D = E, / (E , ,+E9 = E / ~
then for all the other inputs fixed, for a change in the D-Ratio the change in the experience
modification is
°--Y-= (1, z , ) - 0 - z~)=-(z, - z.) 0D
Thus, the sensitivity of the modification to the D-Ratio depends on the difference
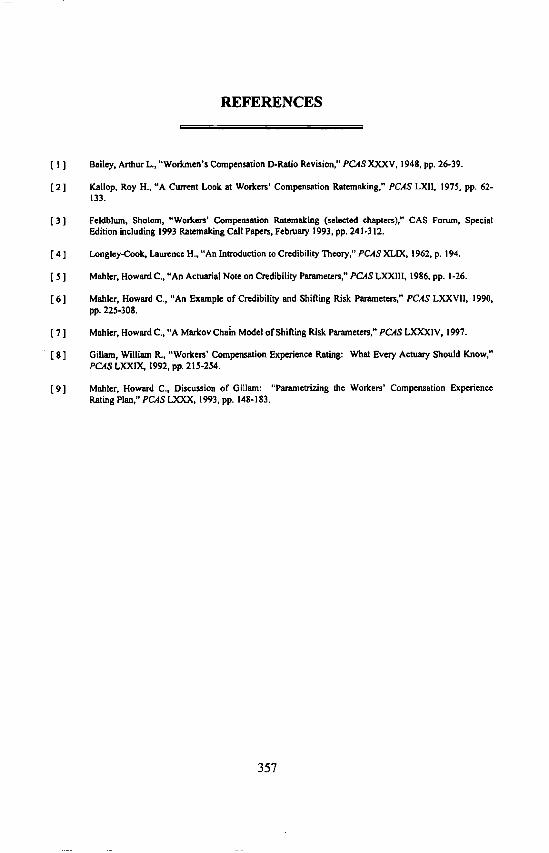
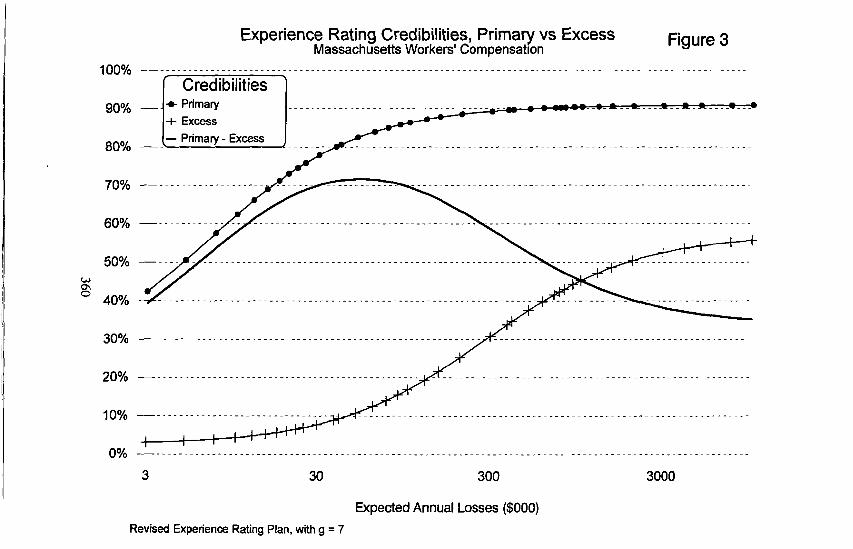
between Z v and Z,. Since Zp > Z , the larger D, the smaller the experience modification. Primary
371

Appendix
credibilities are usually 40*/0 to 70% higher than excess credibilities with the result varying by
size of risk. For example, for Massachusetts I the differences in credibility are shown in Figure 3.
Therefore, a .10 difference in D-Ratio (holding everything else equal) will produce
between a .04 and .07 difference in the Experience Modification depending on the size of the
insured. A very large difference in D-Ratios 2 produces only a relatively modest difference in the
Experience Modification. This is why D-Ratios are rounded to two decimal places. This is also
why detailed technical refinements to a methodology to estimate D-Ratios are unlikely to have
much practical impact.
Revised Experience Rating Plan with g = 7. See, for example, Mahler [9].
2 For example, in Massachusetts the D-Ratios range from about. I 0 to about .30.
372