Embed Size (px)
Citation preview

The Pennsylvania State University
The Graduate School
College of Education
WORKED EXAMPLES AND LEARNER-GENERATED REPRESENTATIONS: A
STUDY IN THE CALCULUS DOMAIN
A Thesis in
Educational Psychology
by
Charlyn Welch Shaw
© 2014 Charlyn Welch Shaw
Submitted in Partial Fulfillment
of the Requirements
for the Degree of
Master of Science
May 2014

ii
The thesis of Charlyn Welch Shaw was reviewed and approved* by the following:
Rayne A. Sperling
Associate Professor of Educational Psychology
Thesis Adviser
Peggy Van Meter
Associate Professor of Educational Psychology
Kathleen J. Bieschke
Professor of Counseling Psychology
Head of the Department of Educational Psychology, Counseling, and Special Education
*Signatures are on file in the Graduate School.

iii
Abstract: Research repeatedly demonstrates the effectiveness of pairing practice problems with
similar worked examples to improve student performance on problem-solving tasks.
However, missing from the research is how these “example-problem pairs” can be
designed to improve pervasive conceptual deficiencies in the calculus domain. The
current study addressed the effectiveness of example-problem pairs in the content area of
related rates. Of special interest were visual representations and student-generated
representations with worked examples on several outcome measures. A pre-posttest
experimental design was used with three conditions: conventional problem-solving (CP),
worked examples with mathematical representations (WE-M), and worked examples with
mathematical and visual representations (WE-V). Participants included undergraduate
students in introductory calculus courses. Findings did not reveal statistically significant
differences among the conditions on procedural performance, mental effort, conceptual
understanding, or drawing. However, further analyses suggested prior knowledge and
use of drawings were significant factors contributing to the effectiveness of the worked
example format. Limitations of the current study and suggestions for future research are
provided.
iv
TABLE OF CONTENTS
List of Tables ............................................................................................................................. v
List of Figures ........................................................................................................................... vi
Acknowledgements .................................................................................................................. vii
Chapter 1. INTRODUCTION ..................................................................................................... 1
Chapter 2. THE CURRENT STUDY ....................................................................................... 11
Chapter 3 METHODOLOGY .................................................................................................. 18
Chapter 4. RESULTS ................................................................................................................ 26
Chapter 5. DISCUSSION .......................................................................................................... 54
Appendix A: SECTION 1 OF 5: CONSENT FORM ................................................................. 44
Appendix B: SECTION 1 OF 5: DEMOGRAPHIC QUESTIONNAIRE ................................... 46
Appendix C: SECTION 1 OF 5: FORMULA SHEET ............................................................... 47
Appendix D: SECTION 2 OF 5: PRETEST .............................................................................. 48
Appendix E: SECTION 3 OF 5: INSTRUCTIONAL BOOKLET .............................................. 49
Appendix F: SECTION 4 OF 5: ACQUISITION TASK, CONDITION 1 .................................. 52
Appendix G: SECTION 4 OF 5: ACQUISITION TASK, CONDITION 2 ................................. 54
Appendix H: SECTION 4 OF 5: ACQUISITION TASK, CONDITION 3 ................................. 57
Appendix I: SECTION 5 OF 5: POSTTEST.............................................................................. 60
Bibliography ............................................................................................................................. 62

v
List of Tables
Table 1 Steps used in related rates problems .............................................................................. 14
Table 2 Means and standard deviations for pretest results by subscale ....................................... 28
Table 3 Results of the prestest measure by course ..................................................................... 28
Table 4 Distribution of the number of students within conditions by course ............................... 28
Table 5 Results of student procedural performance by condition ............................................... 29
Table 6 Means and standard deviations for the conceptual items on the posttest......................... 32
Table 7 Means and standard deviations for number of drawings by condition ............................ 34

vi
List of Figures
Figure 1 Student errors of changing rates and derivatives .......................................................... 16
Figure 2 Acquisition performance by condition and prior knowledge level ................................ 38
Figure 3 Posttest performance by condition and prior knowledge level ...................................... 39

vii
Acknowledgments
I would first like to express appreciation to my advisor, Dr. Rayne Sperling. She is an
exemplary researcher and mentor. This project would not have been possible without her
expertise and excitement. Likewise, I would like to thank Dr. Peggy Van Meter as the second
reader for this thesis. She truly inspires deeper learning.
I appreciate David Falvo and Peter Olszewski from the Behrend campus for allowing
their students to participate in this project. Their collaboration on the materials and their
enthusiasm for research were invaluable to this study. Dr. Rose Mary Zbiek also offered essential
mathematical expertise.
I would lastly like to thank my family for their unwavering support. My parents instilled
within me a love for lifelong learning and dedicated themselves to my education. I especially
appreciate my husband, Matt, for his patience, his encouragement, and for checking my math.

1
Chapter One
Introduction
Whether in the classroom or demonstrated in a textbook, math instruction often follows a
predictable pattern. New concepts and processes are introduced through instructional
explanations and demonstrated or modeled with a few worked examples. A series of practice
problems is then presented that solidifies understanding of content and skill in procedures (see
Larson, Hostetler, Edwards, & Heyd, 2001).
In comparison to this conventional problem-solving method, recent research has
uncovered greater learning outcomes through the extension of worked examples into the practice
phase, especially for novice learners. The combination of worked examples and practice
problems has been studied in many content areas such as physics (Ward & Sweller, 1990) and
chemistry (Biesinger & Crippen, 2010). However, upper-level mathematics courses, such as
calculus, have received little attention within this line of research.
Research on learning and instruction in calculus is critical as it is a required introductory
course to many STEM fields. For example, topics in calculus are used in mechanical
engineering, physics, chemistry, and even business. Using the cognitive load theory as a
framework, the current study extended the worked example research to the calculus domain to
discover if benefits from examples paired with problem-solving tasks transfer to this content
domain. The worked examples in the current research employed verbal, mathematical, and
schematic representations of related rates problems.
Cognitive Load Theory and the Worked Example Effect
According to Sweller’s cognitive load theory (Sweller, 1988), when learners face a
problem solving task there are three types of “load” imposed on their working memory. Intrinsic

2
load is the load within the material that must be experienced by a learner in order to construct an
accurate internal representation of the information (see Sweller, 2010; Sweller, Van Merrienboer,
& Paas, 1998). Extraneous load refers to the load caused by features within the instruction that
are irrelevant to the concepts to be learned (Sweller, 2010). This load interferes with the
processing and storage of pertinent information by directing a learner’s attention to unimportant
information in the material (Sweller et al., 1998).
While intrinsic and extraneous load relate to the content and instruction of the material,
germane load is the load that the learner dedicates to the intrinsic load of the material (Sweller et
al., 1998; Sweller, 2010). Effective instructional design, according to cognitive load theory,
reduces extraneous load and increases germane load (Chandler & Sweller, 1991). When there is
too much extraneous information within the material, limited working memory is taxed and
allocates fewer cognitive resources to the intrinsic load of the material, reducing the germane load
(Sweller & Chandler, 1994). In contrast, if there is less extraneous information, a learner will
have more resources dedicated to the intrinsic load, which results in an increase in germane load.
Research utilizing the cognitive load theory examined worked examples as an
instructional method. These existing studies frequently presented “example-problem (E-P) pairs”
This format presents a problem with given solution steps followed by a similar problem for the
learner to solve (see Atkinson, Renkl, & Merrill, 2003; Renkl, Atkinson, & Große, 2004; van
Gog, Kester, & Paas, 2011). Researchers consistently reported statistically significant differences
on learning outcomes between students who practice through example-problem pairs and those
who practice with only problem-solving tasks. The repeated superiority of performance by the
students exposed to worked examples is known as the “worked example effect” (Sweller, 2006).
This effect demonstrated that students not only perform better when learning from example-
problem pairs, but may do so in less time (Paas & Van Merrienboer, 1994; van Gog, Paas, & Van
Merrienboer, 2006; Zhu & Simon, 1987), and with fewer initial errors (Sweller & Cooper, 1985).
3
This suggested that worked examples are a more efficient form of instruction than traditional
problem-solving tasks.
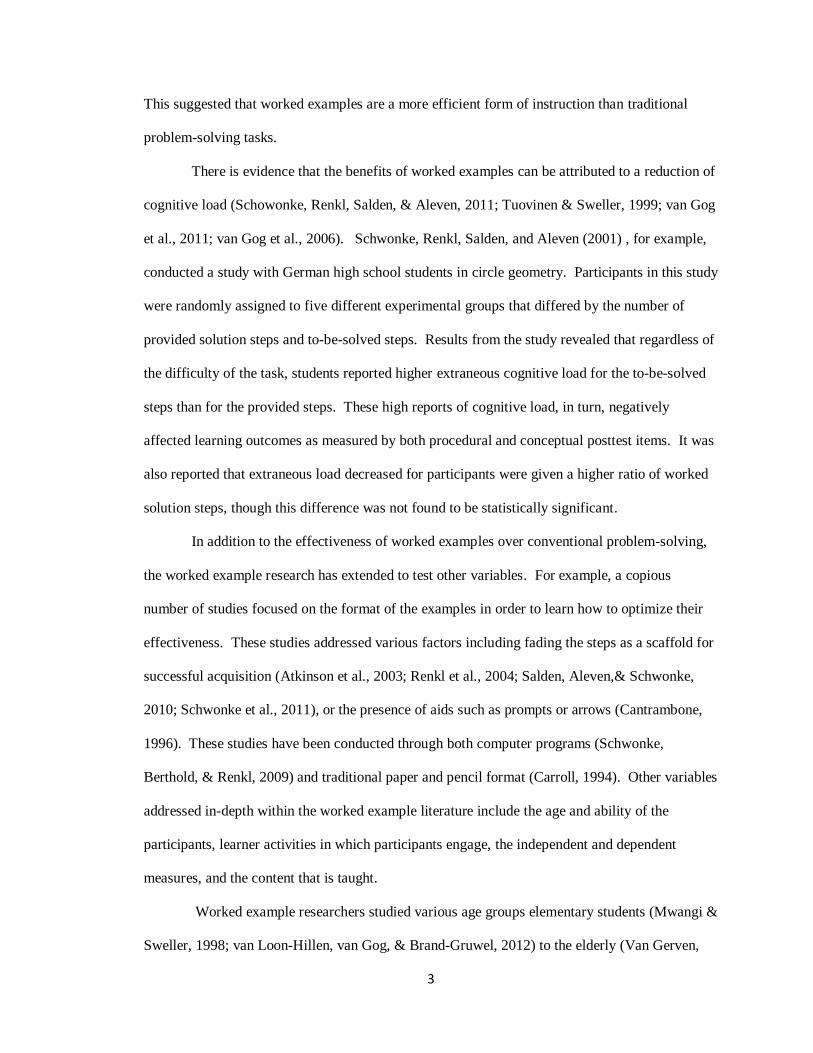
There is evidence that the benefits of worked examples can be attributed to a reduction of
cognitive load (Schowonke, Renkl, Salden, & Aleven, 2011; Tuovinen & Sweller, 1999; van Gog
et al., 2011; van Gog et al., 2006). Schwonke, Renkl, Salden, and Aleven (2001) , for example,
conducted a study with German high school students in circle geometry. Participants in this study
were randomly assigned to five different experimental groups that differed by the number of
provided solution steps and to-be-solved steps. Results from the study revealed that regardless of
the difficulty of the task, students reported higher extraneous cognitive load for the to-be-solved
steps than for the provided steps. These high reports of cognitive load, in turn, negatively
affected learning outcomes as measured by both procedural and conceptual posttest items. It was
also reported that extraneous load decreased for participants were given a higher ratio of worked
solution steps, though this difference was not found to be statistically significant.
In addition to the effectiveness of worked examples over conventional problem-solving,
the worked example research has extended to test other variables. For example, a copious
number of studies focused on the format of the examples in order to learn how to optimize their
effectiveness. These studies addressed various factors including fading the steps as a scaffold for
successful acquisition (Atkinson et al., 2003; Renkl et al., 2004; Salden, Aleven,& Schwonke,
2010; Schwonke et al., 2011), or the presence of aids such as prompts or arrows (Cantrambone,
1996). These studies have been conducted through both computer programs (Schwonke,
Berthold, & Renkl, 2009) and traditional paper and pencil format (Carroll, 1994). Other variables
addressed in-depth within the worked example literature include the age and ability of the
participants, learner activities in which participants engage, the independent and dependent
measures, and the content that is taught.
Worked example researchers studied various age groups elementary students (Mwangi &
Sweller, 1998; van Loon-Hillen, van Gog, & Brand-Gruwel, 2012) to the elderly (Van Gerven,

4
Paas, Van Merrienboer, Schmidt, 2002). University students were the most common participants
(Atkinson et al., 2003; Biesinger & Crippen, 2010; Große & Renkl, 2007; etc.). The participants
in these studies also included those with disabilities (Owen & Fuchs, 2002) and low-achieving
students (Carroll, 1994). Relatedly, results reported that those with lower prior knowledge tend
to benefit the most from example-problem pairs (Kalyuga, Chandler, Tuovinen, & Sweller,
2001).
Other studies, still, focused on the activities in which learners may engage to study
examples. For example Große and Renkl (2007) addressed identifying errors and Rittle-Johnson,
Star, and Durkin (2009) examined comparing examples. From these studies interesting findings
suggest that the interaction between worked example format and learner activities also contributes
to the effectiveness of the worked examples for increased learning outcomes when compared to
conventional problem-solving tasks.
Worked example research covered a range of outcome variables. As previously
described, performance and cognitive load data are frequently collected. Additionally, a few
studies designed outcome measures that distinguish between procedural and conceptual
performance. Using the NAEP (1988) as a guide, Martin (2000, described later in chapter 2 of
this paper) defined procedural knowledge as “the ability to note, select, and apply the appropriate
concrete, numerical, or symbolic procedures required to solve a problem” (p. 77). Conceptual
knowledge was “characterized by the ability to identify examples and non-examples of a concept;
to use, connect and interpret various conceptual representations; to know, apply, distinguish, and
integrate facts, definitions, and principles, and to interpret assumptions and relations in a
mathematical setting” (p. 77).
Procedural knowledge, in the worked example research was most often measured through
practice and posttest performance items (Schwonke, et al., 2009). Conceptual knowledge, on the
other hand, has been measured in various ways, including verbal selection items (Rittle-Johnson,
et al., 2009) or written explanations of rationale (Berthold, et al., 2009). Studies presented

5
evidence that worked examples may improve conceptual knowledge, but that these results may be
dependent upon other supports, such as self-explanation prompts (Berthold & Renkl, 2009;
Schwonke, Renkl, Krieg,Wittwer, & Aleven, 2009).
Although worked examples research is extensive, there are areas within the literature that
received little or no attention. These areas include calculus as a content area, multiple
representations as an instructional method, and learner-generated representations as a problem-
solving strategy. The purpose of the current study was to address gaps in the research to explore
the effects of worked examples and representations on calculus students’ procedural and
conceptual knowledge.
Calculus
Studies on worked examples were conducted in a wide range of highly-structured content
areas such as physics (Chi, Bassok, Lewis, Reimann, & Glaser, 1989; van Gog, Paas, Van
Merrienboer, 2008; Ward & Sweller, 1990) and chemistry (Biesinger & Crippen, 2010; Crippen,
Biesinger, Muis, & Orgill, 2009; Darabi, Nelson, & Paas, 2007). Mathematics, in general, was
frequently studied (e.g. Carroll, 1994; Kalyuga & Sweller, 2004). Strong evidence from these
studies suggested that worked examples can improve both procedural and conceptual outcomes in
mathematics (Rittle-Johnson et al., 2009; Schwonke, et al. 2009).
Though mathematics is studied frequently in this literature only one study was conducted
in the calculus domain. This course-long study, conducted by Miller (2010), focused on the
effects of student participation in supplemental calculus instruction in addition to regular class
instruction. This supplemental instruction utilized a “three-step” instructional approach during a
weekly out-of-class discussion. The three steps included (1) students studying a worked example
on a computer program, (2) students solving a similar problem with the class that was given by
the instructor, and then (3) students individually solving a problem similar to the previous worked
example and problem. Those students in the class that participated in this “three-step”

6
supplemental instruction received significantly higher posttest scores at the end of the semester
than those students who did not participate. Though Miller’s study utilized worked examples, it
focused on the success of the supplemental instruction in comparison to class instruction alone. It
did not directly examine the effects of worked examples in the calculus course.
The worked example effect in calculus instruction merits much more attention than it has
been given. Calculus is not only important for STEM fields, as previously mentioned, but it is a
content area in which a large number of students are known to struggle. In fact, Zimmerman
(1991) considered introductory calculus the most challenging mathematics course for
undergraduate students. Reports in the 1980s and 1990s indicated that over half of the students
enrolled in calculus either failed or dropped their course (Aspinwall & Miller, 1997; Ferrini-
Mundy & Graham, 1991).
Many scholars attributed the extensive failure in calculus to students’ inability to
conceptually understand fundamental calculus principles such as limits or derivatives (Aspinwall
& Miller 1997; Orton, 1983a; Orton, 1983b; see also Mahir, 2009). Even students who are
procedurally successful in calculus frequently demonstrate inadequate conceptual knowledge
(Orton, 1983a; Orton, 1983b). In contrast to its prerequisite courses, the fundamental principles
in calculus involve infinitesimal numbers and dynamic problem situations, both of which can be
difficult to represent mentally. Owing to this difficulty, experts recommended a widespread
reform of calculus instruction that included more visual representations in order to enhance
conceptual understanding (see Zimmerman & Cunningham, 1991).
The current study addressed the worked example effect in the calculus domain for both
procedural and conceptual knowledge outcomes. Given the recommendation for more visuals in
the calculus curriculum for conceptual understanding, the current study used traditional example-
problem pairs that contained only mathematical calculations as well as example-problem pairs
with embedded visual representations of the problem situation in the example.

7
Multiple Representations
A representation can be defined as a configuration that “stands for, symbolizes...or
represents something else” (see Goldin & Kaput, 1996, pg. 398). Internal representations
include mentally constructed representations while external representations include observable
physical configurations (Goldin, 1998; Goldin & Kaput, 1996). External representations often
include socially accepted systems such as mathematical notations or language (Goldin,1998) but
also comprise other formats such as text, pictures, diagrams, or even manipulatives (Marley &
Carbonneau, 2014).
Multiple types of representations may exist for a single concept. A function, for
example, is a central concept throughout mathematics and is commonly represented in four
different forms: graphical, algebraic, tabular, and verbal (Brenner, et al., 1997). Different
representations may reveal or conceal various features of a particular principle and, therefore,
influence a student’s conception of the principle and even elicit different thinking processes
(Parnafes & Disessa, 2004). How students conceive “rate,” for example, has been found to be
influenced by the type of representation of “function” to which they have been exposed (Herbert
& Pierce, 2011).
Students’ familiarity with multiple representations of a concept and their ability to work
with these multiple representations has been linked to their achievement (Panasuk, 2010) and
depth of conceptual understanding (Niemi, 1996; Panasuk, 2010; Panasuk & Beyranev, 2010) in
that topic area. These findings hold within the calculus domain. Villegas, Castro, and Gutiérrez
(2009), for example, conducted a case study with three calculus students who were asked to solve
optimization problems. Analysis of protocols from the students’ think aloud data revealed a
relation between students’ ability to work with, talk about, and translate between different
representations and their success in solving the problems.

8
The research literature on multiple representations in worked examples is limited in both
quantity and scope. Schwonke, Berthold, & Renkl (2009) used eye-gaze data to determine
difficulties students have when they learn from multiple representations. In their study, worked
examples were presented that utilized diagrammatic trees and arithmetical calculations to
represent probability calculation. A verbal problem stem was also presented. Results from the
gaze patterns suggested that deeper conceptual understanding was related to extensive visual
processing of the diagrams. The reverse was also found in that visual processing without
diagrams was negatively related to conceptual understanding.
Similarly, Berthold and colleagues (Berthold & Renkl, 2009; Berthold, Eysink, & Renkl,
2009) also used worked examples in probability calculation. Both of these two studies were
concerned with instructional aids that improved student learning from these worked examples.
Self-explanation prompts and other aids that helped students integrate the representations
significantly affected conceptual understanding as measured by open-ended explanation items.
However, these prompts appeared to impair procedural performance as measured by similar and
transfer items at posttest.
Learner-Generated Representations
Learner-generated drawing is “defined as a strategy in which learners construct
drawing(s) to achieve a learning goal” (Van Meter & Garner, 2005, p. 287). It is a strategy often
employed to learn from text and requires translation across verbal and visual representation types.
According to the generative theory of drawing construction, at least three cognitive processes are
involved during drawing construction. First, learners must select important information from the
verbal text and create a verbal representation of the content. Second, the learner uses this
representation to create a non-verbal representation. Last, the learner integrates the two
representations (Van Meter & Garner, 2005, see pps. 317-318).

9
Findings from several experiments support that students who utilize drawing as a strategy
to learn from text demonstrate improved learning outcomes over those students who do not
employ this strategy (Schwamborn, Mayer, Thillmann, Leopold, & Leuter, 2010; Van Meter,
2001; Van Meter, Aleksic, Schwartz & Garner, 2006). Conclusions from such research support
that drawing a representation is even more effective than mere study of an illustration. Many of
these studies were conducted in science domains, such as biology.
There is less existing research for drawing in learning mathematical concepts and
procedures. De Bock, Verschaffel, and Janssens (1998), for example, found that students who
were prompted to make a drawing of arithmetical word problems performed better than those
who did not draw representations of the problem, though this difference was not statistically
significant. Within the calculus domain, drawing research is most often conducted on
constructing or sketching graphs for derivatives (Asiala, Cottrill, Dubinsky, & Schwingendorf,
1997; Ubuz, 2007). The current research targets drawing as a problem-solving strategy of
students learning calculus problems that require differentiation.
Important to the current study is the distinction between pictorial and schematic
representations. Pictorial representations are those that highlight the appearance of an object or
scenario. While schematic representations are those that include information on relations between
elements (Hegarty & Kozhevnikov, 1999). In the instance of a cube, a pictorial representation
would demonstrate a picture or image of a cube while a schematic representation would include
basic information on its physical appearance and would include information on the important
elements such as the length of the sides or if the sides were perpendicular. Research indicates
that schematic representations are more effective for successful problem-solving than pictorial
representations (Edens & Potter, 2008).
In their review of learner-generated drawings, Van Meter and Garner (2005) defined
drawings as a representation intended to “look-like, or share a physical resemblance with the
object(s) that the drawing depicts” (p. 287). Schematic representations or diagrams were not

10
considered part of learner-generated drawing as they did not tend to focus on the physical
appearance of an object. The successful use of a learner-generated representation in the current
study would both a correct representation of the physical appearance as well as the schematic
elements. For example, one problem in the current study presents a scenario with a person flying
a kite (see Appendix F, page 53). This problem scenario utilizes three different lengths including
the diagonal, horizontal, and vertical distances between the person and the kite. To successfully
solve this problem, learners must recognize that the distances create a triangle and in order to find
the missing values, the Pythagorean Theorem must be used. An accurate representation, in this
case, would include the correct physical arrangement of the schematic elements within the
problem.
Previous research on drawing as a strategy suggested that it is most effective when
students are additionally provided instruction on how to draw accurately (Schwamborn et al.,
2010; Van Meter, 2001). In the current study, the nature of one of the research questions
addressed how the worked example format elicited spontaneous use of drawing. Therefore, no
drawing instruction or prompts to draw were provided.

11
Chapter 2
The Current Study
The current study focused on worked examples with representations of related rates
problems in the calculus domain. Specifically, the following research questions were addressed:
1. Are there differences in problem solving performance among students who learn from
either worked examples with both mathematical and visual representations (WE-V),
worked examples with mathematical representations only (WE-M), or conventional
problems without worked examples (CP)?
2. Are there differences in conceptual knowledge among students who learn from either
worked examples with mathematical and visual representations, worked examples with
mathematical representations only, or conventional problems?
3. Are there differences in reported cognitive load among students provided worked
examples with mathematical and visual representations, worked examples with
mathematical representations only, or conventional problems?
4. Do students who spontaneously use learner-generated representations outperform
students who do not?
5. Are there differences in the number of learner-generated representations among the
students who learn related rates from either worked examples with mathematical and
visual representations, worked examples with only mathematical representations, or
conventional problems?
It is expected, as previous research suggested (Orton, 1983b) that related rates problems
will be difficult for students to solve with only conventional problem-solving tasks. As such, it is

12
hypothesized that students who receive the conventional problems only without worked examples
will experience the highest reported cognitive load of the three conditions. This high cognitive
load will result in lower procedural performance and conceptual knowledge than the other two
groups.
The worked example effect is expected to be demonstrated by those students within the
worked example conditions. The presence of mathematical calculations will reduce student-
reported cognitive load, freeing more working memory space for the construction of an internal
representation of the material. This developed schema will result in greater procedural and
conceptual knowledge than the conventional problem group. The visual representations may
serve as an external representation that frees working memory space as well as. Students who
receive the worked examples with both mathematical and visual representations are projected to
outperform both of the other experimental conditions on procedural and conceptual measures.
It is also anticipated that students who spontaneously generate representations will
perform better on procedural learning outcomes. As theories of drawing suggested, learners who
engage in drawing as a strategy create and strengthen connections between verbal and visual
representations of the problems. Furthermore, when learners generate their own representations
for problems, they will have a more correct internal representation of the problem situation and
therefore, higher procedural performance. Relatedly, it is expected that the condition with both
visual and mathematical representations will encourage usage of the spontaneous drawing
strategy more than the other two conditions, another reason for an expected higher performance
from these students.
Related Rates
Related rates involve the relation among the rates of change of multiple variables within a
function and typically require implicit differentiation for successful solution. The following is an

13
example of a related rates problem and can also be found in the instructional booklet of the study
material (see Appendix E):
A stone dropped into a still pond sends out a circular ripple whose radius
increases at a constant rate of
. How rapidly is the area enclosed by the
ripple increasing when the radius is ?
In this example, the student must find the rate that an area changes at a certain point in
time. The notion of changing rates is unique to calculus courses. Where prerequisite algebra
courses might require a student to find what an area is, a related rates problem requires a student
to find how the area is changing at a certain moment in time. The dynamic nature of these types
of problems requires a more complex mental construct than a static situation used in algebra.
The topic of related rates matched the purposes of this study for several reasons. First, as
previously mentioned, little research has addressed worked examples that use calculus as the
content area. Related rates are an application of differentiation within the calculus domain and
are tasks that prove difficult for students to complete successfully. Past studies have exposed
general low performance on related rates problems (Martin, 2000; Orton, 1983b). In fact, Orton
(1983b) revealed that problems that involve rates of change were some of the most challenging
items for calculus students to complete both in high school and college.
Second, the high number of steps required to solve related rates problems introduces
constraints on learners’ processing. In addition to a high number of steps, these steps involve
interconnected “elements” or concepts. As Sweller (2010) suggested, tasks that involve several
concepts that require reference to each other increase intrinsic cognitive load. For example, the
number of variables, the average rates versus instantaneous rates, the direction of change of the
variables, as well as the process of differentiation, and the correct equation all must be conceived

14
in relation to each other for successful problem completion. The number of interconnected steps
makes these problems likely to result in high measures of reported cognitive load.
Table 1
Steps used in related rates problems.
Martin (2000) Current Study
1 “Sketch situation and label the sketch
with variables or constants.”
(Conceptual)
2 “Summarise the problem statement by
defining the variables and rates involved
in the problem (words to symbol
translation) and identifying the requested
information.” (Conceptual)
1 “Identify all known and unknown
variables in the given problem.”
3 “Identify the relevant geometric
equation.” (Procedural)
2 “Find an equation that relates the
variables together.”
4 “Implicitly differentiate the geometric
equation to transform a statement
relating measurements to a statement
relating rates.” (Procedural)
3 “Find the derivative of both sides of the
equation using implicit differentiation
with respect to t.”
5 “Substitute specific values of the
variables into the related-rates equation
and solve for the desired rate.”
(Procedural)
4 “Substitute the known variables into the
resulting equation from Step 3 and solve
for the unknown.”
6 “Interpret and report results.”
(Conceptual)
(7) “Solve an auxiliary geometry problem.”
(Varies)
(5) (Concurrent instruction tells students
that sometimes an extra calculation is
required and gives an example)
15
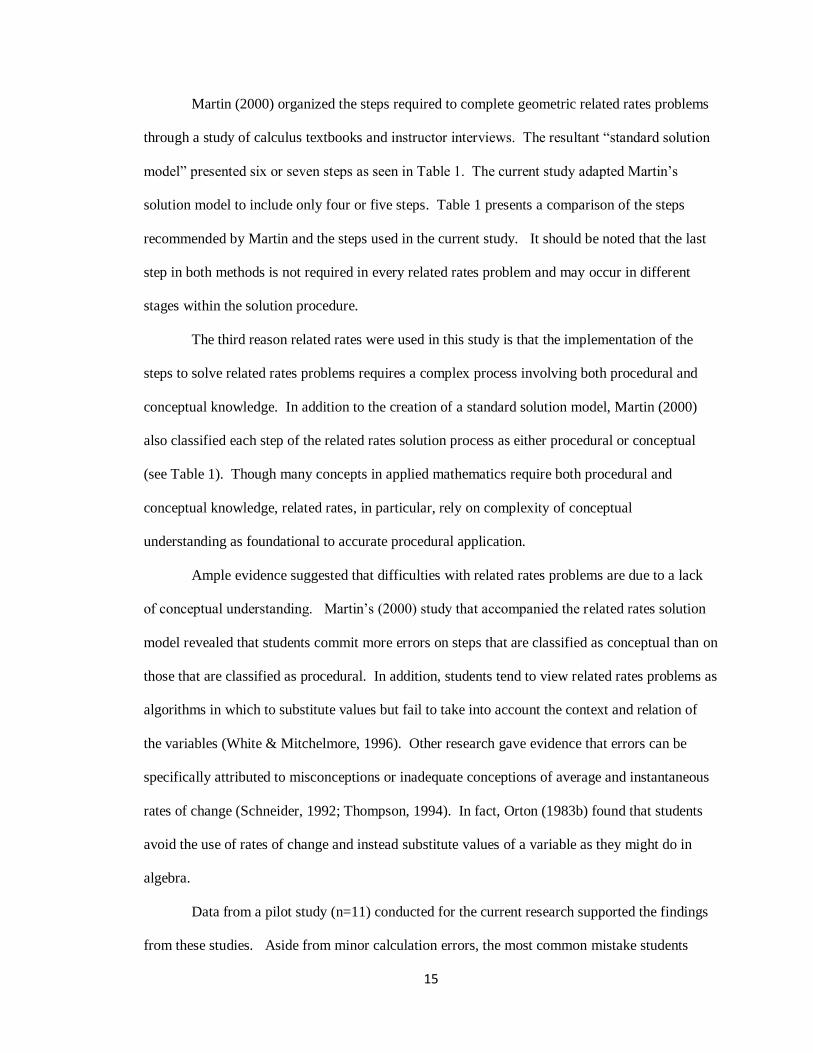
Martin (2000) organized the steps required to complete geometric related rates problems
through a study of calculus textbooks and instructor interviews. The resultant “standard solution
model” presented six or seven steps as seen in Table 1. The current study adapted Martin’s
solution model to include only four or five steps. Table 1 presents a comparison of the steps
recommended by Martin and the steps used in the current study. It should be noted that the last
step in both methods is not required in every related rates problem and may occur in different
stages within the solution procedure.
The third reason related rates were used in this study is that the implementation of the
steps to solve related rates problems requires a complex process involving both procedural and
conceptual knowledge. In addition to the creation of a standard solution model, Martin (2000)
also classified each step of the related rates solution process as either procedural or conceptual
(see Table 1). Though many concepts in applied mathematics require both procedural and
conceptual knowledge, related rates, in particular, rely on complexity of conceptual
understanding as foundational to accurate procedural application.
Ample evidence suggested that difficulties with related rates problems are due to a lack
of conceptual understanding. Martin’s (2000) study that accompanied the related rates solution
model revealed that students commit more errors on steps that are classified as conceptual than on
those that are classified as procedural. In addition, students tend to view related rates problems as
algorithms in which to substitute values but fail to take into account the context and relation of
the variables (White & Mitchelmore, 1996). Other research gave evidence that errors can be
specifically attributed to misconceptions or inadequate conceptions of average and instantaneous
rates of change (Schneider, 1992; Thompson, 1994). In fact, Orton (1983b) found that students
avoid the use of rates of change and instead substitute values of a variable as they might do in
algebra.
Data from a pilot study (n=11) conducted for the current research supported the findings
from these studies. Aside from minor calculation errors, the most common mistake students

16
made on these types of problems was misidentifying or misunderstanding a rate of change (see
Figure 1), a step classified as conceptual by Martin (see Martin’s (2000) Step 2 in Table 1).
Figure 1
Student errors of changing rates and derivatives.
Another common error that students from the pilot study committed was the failure to use
a derivative. Several of the pilot students simply substituted given values into a geometric
equation, even after they were instructed to use implicit differentiation to complete the problem
(see Figure 1). Though Martin declared the differentiation step was procedural, these student
errors also support the notion that students do not understand the concept of a derivative and its
use in related rates problems.
Furthermore, students in the pilot study were prompted in the posttest to explain why
derivatives were used in the related rates problems. Almost all participants, including those who

17
failed to use a derivative during problem-solving, provided a definition of a derivative with the
phrase “rate of change.” This suggested that even if students knew how to define a derivative,
many did not know when and why to use derivatives in related rates problems. This coincides
with Orton‘s (1983b) assertion that many students have a low-level understanding of derivatives
and fail to understand them conceptually.
The fourth reason for using related rates in the current study is that many related rates
problems are geometric in nature. Thus, it was expected that students might spontaneously use a
drawing strategy for problem solution, an additional focus of this research.

18
Chapter Three
Methodology
Design
The current study followed a pretest-posttest with a control group design. Participants
were randomly assigned to one of three experimental conditions. The first was a control
condition that required students to complete related rates problems without paired worked
examples. This condition resembled traditional practice and is also known as conventional
problem solving (CP). The second condition presented example-problem pairs with worked
examples that contained only a single representation, mathematical calculations (WE-M). The
third condition utilized worked examples that used multiple representations by presenting visual
representations along with the mathematical calculations (WE-V). These visual representations
were schematics of the geometric problem situation.
Participants
Participants were recruited in accord with approved procedures of the Penn State
University Office of Research Protections (Protocol ID #42960, see Appendix A) from two
introductory calculus courses (three classes) at a university in northwestern Pennsylvania. One of
the courses was a business calculus course while the other course was a technical calculus course.
The technical calculus instructor taught two sections of the same course, both of which
participated in the study. Students volunteered for the study and received 1% extra course credit
for their participation.
Originally 80 students participated in the study. Nine participants were removed from
further analysis because they failed to finish the posttest due to self-imposed time constraints. Of

19
the remaining 71 participants, 69% were male (n = 49), 67.6% (n = 48) identified themselves as
Caucasian and 76.1% (n = 54) reported English as their first language. The average reported age
was 19.1 years and 78.9% (n = 56) of the students reported they had first-year status with the
university. The high number of first-year students in the sample made it challenging to collect
accurate GPA data.
The demographic questionnaire also revealed that 56.3% (n = 40) of the students reported
that they had previously taken courses covering calculus, either in high school or during their
undergraduate education. The date of the study was arranged so that none of the students
received related rates in their current calculus course but all of the students received prerequisite
content including implicit differentiation.
Materials
The study materials included a consent form, demographic questionnaire, formula sheet,
pretest, instructional booklet, acquisition packet, and posttest. All materials were administered in
a paper-and-pencil format. Each part to the study was organized into numbered, sequential
sections. Each section had its own set of instructions for that portion of the study. The materials
were placed in an envelope with instructions for the general procedure for the entire study written
on the outside of the packet.
Demographic Questionnaire
The first section of the research materials included a consent form, demographic survey,
and a formula sheet. The demographic survey (Appendix B) asked students about their personal
background such as their age, race, academic standing, GPA, and gender. Also asked were
questions about their mathematics background. Participants were asked the number of
mathematics courses taken, their previous level of exposure to calculus content, and their
expected grades in the course.

20
Formula Sheet
To ensure that students who did not have formulas memorized were not at a
disadvantage, a formula sheet was available to students at all times during the study (see
Appendix C). The one-page sheet gave students all formulas required within the study including
areas, volumes, and surface areas of geometric shapes. The distance-rate-time formula and the
Pythagorean Theorem were also provided. Last to be included were basic rules of differentiation,
though implicit differentiation was not given on this sheet.
Pretest
The second section of the materials administered a pretest to the students. The 11-item
measure tested students’ prior knowledge in both algebra and calculus. The algebra items
required students to find the value of a variable in an equation and to find the area or volume of a
particular geometric shape. The calculus topics addressed the prerequisite skills required to
successfully understand and solve related rates problems—taking derivatives and using implicit
differentiation. Also included in the pretest were two simple related rates problems to account for
students who might already be able to successfully solve these types of problems. The pretest is
included in Appendix D.
Instructional Booklet
An instructional booklet and was next provided to all participants as the third section of
the study. It contained three pages on related rates and focused on both the conceptual
understanding as well as the procedure for successfully completing the problems (see Appendix
E). The instructional booklet was designed to represent typical instruction students are exposed
to in a textbook (e.g. Larson, et al., 2001). For example, the instruction began with a review of
the concept of a derivative and explained how derivatives are used in related rates problems.
Explanation also contrasted related rates problems to algebra problems that simply find the area

21
or volume of an object. Before explanation of the process of solving related rates problems,
implicit differentiation was reviewed with a short example.
After the general explanation of topic, the instructional booklet included the list of steps
to complete the related rates problems as given in Table 1. After presentation of the steps, the
booklet gave two worked examples of related rates problems. These worked examples were
designed to teach students to solve related rates problems at two levels of complexity. The first
example required four steps and the use of an area formula while the second worked example
required five steps and the use of a volume formula.
To scaffold procedural understanding throughout the instruction, the first example
included explicitly labeled steps that corresponded with the list given in the instructional booklet.
The second example did not include these labels. Written explanations were embedded within
the instructions that compared and contrasted the two examples. Neither of these examples gave
a visual representation of the problem, but included the mathematical calculations only.
Acquisition Task
The fourth section contained the acquisition task. Students were given a practice task
that included eight related rates problems presented in pairs. Each pair contained items that were
similar in structure and required number of steps, but differed in their surface features. For
example, in the first pair of items both problems required four steps and the use of an area
formula. However, the first item used the area of a square while the second gave a scenario using
a circle. The other pairs required the use of different formulas including volume, surface area,
and the Pythagorean Theorem. As the students worked through the problems, the pairs increased
in difficulty by the number of required steps to successful completion. The first three pairs
required four steps to completion and the final pair required five steps.
The presentation format of the acquisition items differed by condition and this
differentiation served as the independent variable in the experiment (see Appendices F, G, & H).

22
The control group was not given any solution steps throughout the task. In this condition,
students solved all eight problems. In contrast, the worked example groups were both given all
solution steps for the first item in each pair. The second item in each pair did not have any
solution steps given and participants in the worked example conditions were required to solve
these problems. The difference between the worked example groups was the number of
representations included in the worked example. Those students in the WE-M group received the
mathematical calculations in a format identical to the second worked example provided in the
instructional materials. Those in the WE-V group also received a visual representation of the
scenario in addition to the mathematical steps. These representations illustrated the problem
situation (see Appendix H). The visual representations included a diagram of the geometric
shape, labels that indicated parts of the shape (e.g. “s” for “side” or “h” for “height”), and arrows
to show where and in which direction the object was changing.
Cognitive load was assessed after each item by a 9-point Likert-type scale, similar to that
first introduced by Paas (1992). This measure, in previous research as well as the current study,
asked students to rate the perceived “mental effort” they expended while completing a task (for
more on the relation between mental effort and cognitive load see Sweller et al., 1998). When
previously tested among 16-18 year-old students, this scale was found to have a Cronbach’s alpha
of .90 (Paas, 1992). Since then, this scale has been used in numerous other studies with various
populations and domains (e.g. Boekhout, van Gog, van de Wiel, Gererds-Last, & Geraets, 2010;
Darabi, Nelson, & Paas, 2007; van Gog et al., 2011). In the current study, students were asked to
rate their perceived mental effort after each item, whether it was a problem-solving task or a
worked example.
23
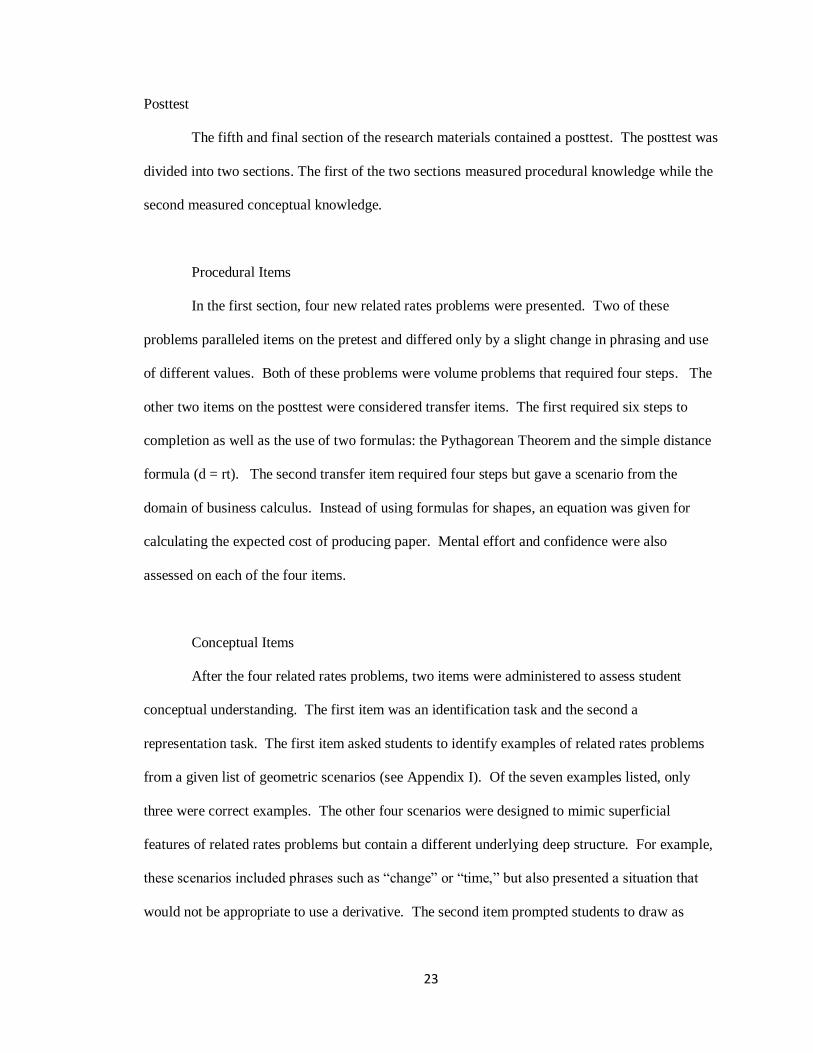
Posttest
The fifth and final section of the research materials contained a posttest. The posttest was
divided into two sections. The first of the two sections measured procedural knowledge while the
second measured conceptual knowledge.
Procedural Items
In the first section, four new related rates problems were presented. Two of these
problems paralleled items on the pretest and differed only by a slight change in phrasing and use
of different values. Both of these problems were volume problems that required four steps. The
other two items on the posttest were considered transfer items. The first required six steps to
completion as well as the use of two formulas: the Pythagorean Theorem and the simple distance
formula (d = rt). The second transfer item required four steps but gave a scenario from the
domain of business calculus. Instead of using formulas for shapes, an equation was given for
calculating the expected cost of producing paper. Mental effort and confidence were also
assessed on each of the four items.
Conceptual Items
After the four related rates problems, two items were administered to assess student
conceptual understanding. The first item was an identification task and the second a
representation task. The first item asked students to identify examples of related rates problems
from a given list of geometric scenarios (see Appendix I). Of the seven examples listed, only
three were correct examples. The other four scenarios were designed to mimic superficial
features of related rates problems but contain a different underlying deep structure. For example,
these scenarios included phrases such as “change” or “time,” but also presented a situation that
would not be appropriate to use a derivative. The second item prompted students to draw as
24
many “types” of representations for a given related rates problem. They were explicitly
instructed not to solve it.
These conceptual tasks were developed and then revised through consultation with a
mathematics education professor. Feedback on the original items resulted in only minor changes
from the original wording.
Procedure
The experiment was administered over a two-day period. Students were given windows
of time at which to participate. Start and end times were flexible and students completed the
work at their own individual pace. Students were allowed to sign up for an arrival time with
instructions to plan for at least one and a half hours to complete the materials. Participants were
randomly assigned to condition upon entry to the experimental setting. They were handed an
envelope that contained all materials with general instructions written on the outside of the
packet. The instructions were also explained to the students aloud to ensure they understood the
general procedure. Students were allowed to use a scientific calculator, but were not allowed to
use calculators with calculus or graphing functions.
Student participants first completed consent forms and the demographic items. During
the same section, a formula sheet was given with the instruction that they could use it at all times
throughout the study. Afterward, the participants completed the pretest, with instructions to do
their best and to skip those problems they could not complete only after trying their best.
Participants were then instructed to study the instructional booklet as they would a
textbook until they felt they understood the information well. They were also informed at that
time that the following task would include solving problems in the content area addressed within
the booklet. Further, they were informed that they would not be able to return to the instructional
explanations.
25
After students studied the instructional materials, they completed the acquisition task.
Those in the worked example conditions were instructed to study the worked example first until
they understood it before they attempted the paired problem-solving item. No students were
given prompts to draw during the acquisition task, but the instructions did encourage them to use
“any known strategy.” Students recorded their start and finish time for this task at the beginning
and end of the items.
Once the participants completed the practice problems and rated their mental effort and
confidence on those items, they immediately proceeded to the posttest. They were again
instructed to try their best and use any known strategy to complete the problems. Students were
prompted to enter a start time at the beginning and end of the 4 items. Time was not recorded for
the conceptual items. The study administrator monitored the students frequently to ensure
compliance to the research protocol.
Pilot Study
During the semester preceding the current study, 11 students enrolled in the business
calculus course at the same institution participated in a pilot study conducted to test the materials
and experimental procedure. Due to the small sample size obtained for the pilot, inferential
analyses of outcome data were not conducted. However, responses from the pilot study
confirmed the material was at the appropriate level for the students, the instructions and items
were understandable, and the measures were reliable.
Data from the pilot study resulted in a few changes to the research materials administered
in the current study. First, the order of the practice items changed so that the items were
presented in increased difficulty. Second, one item on the posttest was changed to better align
with the practice problems by the number of steps required. And third, the conceptual items were
altered to target deeper conceptual understanding. The original conceptual item for the pilot
materials consisted of open-ended questions that elicited student understanding of derivatives and

26
related rates. The responses for these items, however, did not produce enough variance among
students’ responses. Therefore the item format was modified to require students to instead
identify examples and nonexamples of related rates scenarios.

27
Chapter Four
Results
Pre-Analysis Considerations
Responses on the prestest were used to ensure there was a random distribution of
students. All items on the pretest were scored as simply correct or incorrect. Scales were created
from the data to include algebra, geometry, differentiation, implicit differentiation, and related
rates prior knowledge. One item on the pretest (Item 4) was discarded because of the negative
correlation with other items. This item was one of three that targeted differentiation (see
Appendix D). All other scales included two items.
The results for each of the scales of pretest items are provided by condition in Table 2.
The one-way ANOVA did not reveal a significant difference among conditions on any of the
pretest scales. The overall mean score on the two related rates items was 0.27 (SD = 0.65) out of
2 possible points. This indicates, as expected, student performance on related rates problems was
very low at pretest.
The differences between the technical and business calculus courses were also considered
when analyzing the pretest (see Table 3). A chi-square test (see Table 4) confirmed that the
distribution of the students in each course was equal among the conditions, ( (2, N = 71) = 4.25,
p = 0.120). The business calculus students received one more day of class instruction on implicit
differentiation than the technical calculus students before the study commenced. This difference
resulted in the business calculus scores to be significantly higher on this scale. There was also a
significant difference between the courses on the Geometry scale, though slight. No other
significant difference was found between the two courses at pretest. Course differences were
controlled as random assignment to condition was realized and tested as noted above and in Table
4.

28
Table 2
Means and standard deviations for pretest results by subscale.
Condition
Measure CP
(n = 24) WE-M (n = 25)
WE-V (n = 22)
F p
Algebra 1.13 (.68) 1.48 (.65) 1.36 (.73) 1.70 0.19
Geometry 1.17 (.82) 1.52 (.56) 1.50 (.60) 2.06 0.14
Differentiation 1.13 (.95) 1.48 (.96) 1.18 (.73) 2.00 0.14 Implicit
Differentiation 0.83 (.82) 0.80 (.71) 1.00 (.87) 0.41 0.66
Prerequisite Total
4.25 (2.07) 5.28 (2.01) 5.05 (2.07) 2.23 0.12
Related Rates 0.21 (.59) 0.28 (.68) 0.32 (.72) 0.16 0.85
Pretest Total 4.46 (2.28) 5.56 (2.38) 5.36 (2.42) 1.49 0.23
*Denotes statistically significant difference. Note: The maximum scores were: Prerequisite Total: 8; Pretest Total: 10; all
other scales: 2.
Table 3
Results of the pretest measures by course.
Course
Measure Technical
(n = 43)
Business
(n = 28)
t p
Algebra 1.33 (.71) 1.33 (.67) -0.05 0.964 Geometry 1.28 (.73) 1.59 (.57) -2.00* 0.050
Differentiation 1.28 (0.98) 1.25 (0.75) -0.69 0.494
Implicit Differentiation 0.67 (0.78) 1.19 (0.74) -2.76* 0.008 Prerequisite Total 4.56 (2.12) 5.32 (0.93) -2.01 0.049
Related Rates 0.30 (0.67) 0.22 (0.64) 0.50 0.620
Pretest Total 4.86 (2.57) 5.63 (2.00) -1.40 0.166
*Denotes statistical significance at the α=0.05 level.
Table 4
Distribution of the number of students within conditions by course.
Condition
Course CP WE-M WE-V Total
Technical 15 18 10 43
Business 9 7 12 28
Total 24 25 22 71

29
Research Question 1
The first research question asked, “Are there differences in problem solving performance
among students who learn from either worked examples with both mathematical and visual
representations, worked examples with mathematical representations only, or conventional
problems without worked examples?”
To answer this question, the paired items (2, 4, 6, and 8) on the acquisition task and the
four related rates items on the posttest were scored as either correct or incorrect. The dependent
measures used for procedural outcomes include the total paired items score on the acquisition
task, the total posttest score, the similar posttest scores and the transfer posttest score. One-way
ANCOVAs were conducted on each of these dependent variables by condition using the total
pretest score as a covariate.
Table 5 presents the descriptive statistics, F-statistics, and p-values resulting from the
analyses of the dependent variables. Across conditions, participants scored fairly low on all
procedural knowledge measures. Inferentially, no significant differences were found on any of
the dependent measures after controlling for students’ prior knowledge. This suggests that type
of worked example did not have a significant effect on procedural knowledge outcomes.
Table 5
Results of student procedural performance by condition.
Condition
F
CP (n=24)
WE-M (n=25)
WE-V (n=22)
p
Acquisition 0.75 (1.33) 1.28 (1.54) 1.18 (1.37) 0.24 0.789
Posttest -Similar 0.92 (0.88) 0.88 (0.88) 0.77 (0.69) 1.03 0.364 Posttest -Transfer 0.38 (0.77) 0.36 (0.70) 0.36 (0.58) 0.36 0.700
Posttest -Total 1.29 (1.43) 1.24 (1.42) 1.14 (1.23) 0.89 0.415
Note: The maximum scores for the measures are as follows: Acquisition Items: 4; Posttest
Similar and Posttest Transfer: 2, Total Posttest: 4.
*Denotes statistical significance at the α=.05 level.

30
Research Question 2
The second research question asked, “Are there differences in conceptual knowledge
among students who learn from either worked examples with mathematical and visual
representations, worked examples with mathematical representations only, or conventional
problems ?” For this question, the identification task and the representation task on the posttest
were used as conceptual measures. Table 6 reports results from these two items.
Identification Task
The first conceptual item, as described in the methods section, required students to
identify examples of related rates problems. The following equation was used to score this item.
According to this equation, a student who could correctly identify all three of the correct
responses and only the correct three would receive a score of 1. Of the 71 students that
completed the similar and transfer items on the posttest, six did not attempt the first conceptual
item and so were not used in the analyses.
In all, many students found the first conceptual item challenging, with only one student
receiving a perfect score. It was found that the WE-M group scored the highest on this item,
followed by the WE-V group and finally the CP group.
A closer analysis shows which types of errors were most commonly made on this item.
Across the three conditions, it was more likely that students over-selected the examples than
under-selected them. This was expected because the wording of the examples was designed to
focus on superficial features of related rates problems. Interestingly, the WE-V group tended to
make this overgeneralization error at a greater rate than the other groups.

31
Representation Task
The second conceptual item required students to create as many types of representations
as possible for a related rates problem without solving it. Initial evaluation of the student-
generated representations on this task revealed three types of representations--mathematical,
visual, and graphical. In this study “visual” representations included those that were schematic or
pictorial in nature but not those that were graphical.
It is important to note that graphical representations did not appear anywhere in the
materials. It is also important to note that the instructions on this task specifically stated to not
solve the problem that was presented, only represent it. Therefore, it is unclear if students
presented mathematical calculations as a representation or because they did not follow directions.
As visual and graphical representations were the focus of this study, mathematical representations
are not discussed in depth. There were 4 students who gave only a mathematical representation
and did not present a visual or graphical representation.
The student-generated representations were tallied by type. Many students drew more
than one representation, but no student drew two of the same type of representation. That is,
some students presented a schematic and mathematical representation, but no student presented
two different schematic representations. The number of representations a student generated,
therefore, equaled the number of types of representations a student drew.
Among all students, the most preferred type of representation was a visual representation.
A total of 53 students generated visual representations. The second type of representation most
commonly generated was a mathematical representation (n = 27). Graphical representations were
generated the least often with only 10 examples of this type of representation occurring among
the 71 students.
Of the three experimental conditions, students in the WE-V group generated the largest
mean number of representations. However, those in the WE-M group produced the highest mean

32
number of graphical representations. Interestingly, students in the control group tended to
provide more visual representations and total representations than the WE-M group.
In response to the second research question, there does not appear to be a difference in
students’ measured conceptual knowledge among the conditions as measured by outcomes on the
identification task. Outcomes on the representation task suggested; however, that experimental
conditions may influence the type of representation students generate for these problems.
Table 6
Means and standard deviations of the conceptual items on the posttest.
Condition
CP
(n = 24)
WE-M
(n = 25)
WE-V
(n = 22)
Conceptual Identification Task
False Examples Selected (Error) True Examples Not Selected (Error)
True Examples Selected
False Examples Not Selected
0.56 (0.18)
2.18 (1.22) 0.86 (0.83)
2.09 (0.87)
1.86 (1.25)
0.62 (0.18)
1.95 (1.13) 0.72 (0.88)
2.23 (0.92)
2.09 (1.06)
0.59 (0.16)
2.43 (1.03) 0.43 (0.60)
2.53 (0.68)
1.62 (0.97) Conceptual Representation Task
Mathematical Representations 0.36 (0.49) 0.32 (0.48) 0.50 (0.51)
Visual Representations 0.81 (0.39) 0.64 (0.49) 0.86 (0.35)
Graphical Representations 0.09 (0.29) 0.20 (0.41) 0.14 (0.35) Total Representations 1.27 (0.70) 1.16 (0.80) 1.50 (0.67)
Research Question 3
For the third research question it was asked, “Are there differences in reported cognitive
load among students provided worked examples with mathematical and visual representations,
worked examples with mathematical representations only, or conventional problems?
Consistent with previous research (Paas, 1992; etc.), cognitive load was measured by the
self-reported mental effort ratings on the acquisition and posttest. Only the paired items were
used in the analysis of the acquisition task, even though all students were prompted to report
mental effort on all acquisition task items. Reliability analyses of the mental effort rating scales

33
resulted in a Cronbach’s alpha of 0.88 for the acquisition scores. The mental effort rating scale
for the posttest resulted in a reliability of 0.66. This somewhat lower reliability score was
expected due to the presence of similar and transfer items.
One-way ANCOVAs analyzed the differences in students’ ratings among conditions with
the total pretest score as a covariate. No significant difference was found among the conditions
on the acquisition (F(2, 69) = 0.90, p = 0.41) or posttest tasks (F(2, 69) = 1.09, p =0.34). For
both the acquisition and posttest tasks, the CP group reported the highest average mental effort
(M = 6.21, SD = 1.80; M = 5.50, SD = 1.91) followed by the WE-V group (M = 6.18, SD = 1.25;
M = 5.13, SD = 1.20) and lastly, the WE-M condition (M = 5.49, SD = 1.77; M = 4.97, SD =
1.73).
In response to the third research question, contrary to expectations, these data did not
indicate a difference in the cognitive load reported by students among conditions.
Research Question 4
The fourth research question addressed differences in performance between students who
used a drawing strategy and those who did not. Specifically, the question asked, “Do students
who spontaneously use learner-generated representations outperform students who do not?”
To answer this question, learner-generated representations were scored as either present
or not on each of the acquisition items. The total number of drawings each student generated on
these problems was counted. The participants were divided across conditions into those who
drew at least once (n = 43) and those who did not generate any drawings (n = 28). An
independent t-test was conducted on total acquisition problem performance by these groups. A
statistically significant difference was found on practice problem performance (t(61) = -2.00, p =
0.050, d = 0.453) between those who that did draw (M = 1.35, SD = 1.51) and those who that did
not draw (M = 0.67, SD = 1.18). Those who generated drawings performed higher on the practice
problem performance.

34
Similar results were found when the same analysis was performed on the posttest
performance. Students were divided into a group that drew at least once on the posttest (n = 41)
and those that did not generate any drawings on this measure (n = 30). Again, a significant
difference (t(69) = -2.81, p < .01, d = 0.67) favored the performance of the students who drew at
least once (M = 1.59, SD = 1.48) over those who did not draw (M = 0.73, SD = 0.87).
Therefore, as expected, the use of student-generated representations did result in
significantly higher performance scores on both acquisition and posttest tasks.
Research Question 5
The fifth question asked if there was a significant difference among the conditions on the
number of drawings that were produced by the students. A one-way ANCOVA with total pretest
score as covariate failed to reveal a significant difference in the number of drawings among the
conditions on the practice problems (F(67,2) = 2.62, p = 0.08) or on the posttest (F(67, 2) = 2.21,
p = 0.12). Descriptive statistics for these measures are given in Table 7. On both measures, the
WE-V drew the most often, followed by the CP group and finally, the WE-M group.
Though drawing resulted in higher performance, the visually-oriented worked examples
failed to elicit this strategy more often than the other two groups.
Table 7
Means and standard deviations for number of drawings by condition.
Condition
CP
(n = 24)
WE-M
(n = 25)
WE-V
(n = 22)
Acquisition Drawings 0.67 (0.64) 0.56 (0.58) 1.05 (1.00)
Posttest Drawings 0.58 (0.50) 0.52 (0.59) 0.91 (0.87)
35
Chapter Five
Discussion
The purpose of this research was to explore the effect of visual representations embedded
into worked examples in comparison to worked examples with calculations only and traditional
practice problem tasks on students’ learning of calculus related rates. Areas of special interest
were procedural and conceptual knowledge, cognitive load, and student-generated
representations. The current study experienced several limitations but yet yielded many
interesting findings, both of which warrant future research on worked examples with multiple
representations in related rates.
Procedural and Conceptual Knowledge
The first and second research questions addressed procedural and conceptual learning
outcomes. Findings from previous research led to the expectation that the two worked examples
conditions would lead to a higher procedural performance. Furthermore, previous research
warranted an expectation that visual representations embedded within worked examples would
improve student conceptual knowledge (Berthold & Renkl, 2009). Findings from the current
study, however, indicated no significant differences on students’ conceptual or procedural
performance among the experimental conditions.
There are several possible reasons for failing to find a significant difference in students’
performance among the conditions on the procedural and conceptual measures. One limitation in
this study that may have contributed to the lack of significant results in several measures was a
small sample size. Power analyses from previous studies suggest a sample size of 818 is
desirable to indicate significant performance results in this study. To conduct this analysis, effect

36
sizes were extrapolated from previous research in worked examples that used multiple
representations and a similar number of conditions (Berthold, Eysink, & Renkl, 2009).
In addition to a small sample size, the results on the procedural and conceptual measures
hinted at a floor effect. Including the known difficulty of relate rates problems, consistent low
results in this study may be due to either poorly designed instruction in the instructional booklet
or students’ failure to study the instructions thoroughly. Future research might include controlled
instructional study time across conditions or an instructor-led training to ensure students receive
the adequate instruction to complete the problem solving tasks.
More importantly, the current study did not include means to ensure students used the
examples effectively. Previous studies suggest that the manner in which students use worked
examples contributes to resulting outcomes. For example, Carroll (1994) found that less
successful students frequently engaged in rote copying of examples and thereby reduced worked
examples to mere references. In contrast, high-performing students in his experiment studied the
worked examples first, and then completed the paired problems. Though the current study
instructed students to study the worked examples before attempting the paired problem, there was
no mechanism in place to guarantee students followed this procedure. While this may be
ecologically valid of true study behavior, it causes a challenge in examining the benefits and
results of worked examples, representations, and drawing on student learning of related rates.
Relatedly, additional research indicates the importance of self-explanation to receive
greater benefits from studying from worked examples. Chi and colleagues (1989) demonstrated
that students who performed higher on tasks involving worked example-problem pairs (“good”
students) self-explained the worked examples while the “poor” students (those who performed
lower) did not exhibit this behavior. This self-explanation effect was also demonstrated on
worked examples with multiple representations such as those found in the current study (Berthold
et al., 2009; Berthold & Renkl, 2009). Future research could test the benefit of required self-
explanation coupled with the current experimental conditions.

37
Most importantly, the students in the WE-V group may not have been given adequate
supports to integrate the representations to optimize learning from of these types of worked
examples. Relating aids and self-explanation prompts were found essential in previous research
on worked examples with multiple representations (Berthold et al., 2009; Berthold & Renkl,
2009).
Tarmizi and Sweller (1988) exemplified integration of representations through their study
of worked examples in geometry. They found that students who studied using a diagram with the
shape and angle information integrated into the same image experienced significantly higher
learning outcomes than those who studied from worked examples where the diagram and values
of angles were given in separate sources. The separate sources of information caused a split-
attention effect, which increased cognitive load and decreased performance. The purpose of the
current study was to discover the effect of the visual representations in related rates problems and
did not address supports for integration. The schematics that were presented contained minimal
information including only a few labels and arrows to indicate direction. Future research should
address further integration of the representations. For example, if more information, such the
values of variables ( and operators ( ⁄ is given within the visual
representation, is the benefit of studying with multiple representations recovered?
In addition to the research questions, there are a couple findings revealed in the
procedural performance data that merit further discussion. First, exploratory analyses that
targeted prior knowledge and performance give strong evidence for an expertise-reversal effect
(see Kalyuga, 2007; Kalyuga, Chandler, & Sweller, 1998; Kalyuga & Sweller, 2004). The
approximate highest (n = 24) and lowest (n = 22) thirds of the students at pretest were considered
to create a high and low prior knowledge groups. A two-way ANOVA demonstrated a significant
effect of prior knowledge on acquisition (F(1,46) = 10.87, p < .01) and posttest scores
(F(1,46)=11.85, p<.01). There was no effect of condition on the acquisition task (F(2,46) = 0.04,
38
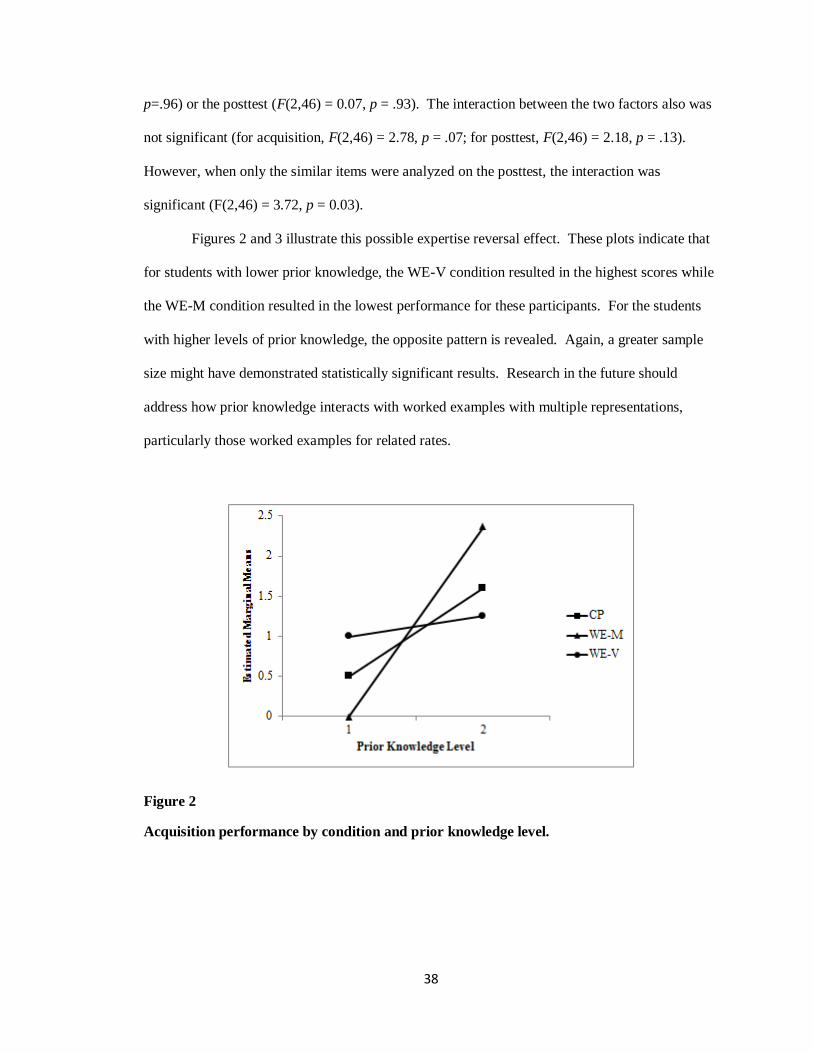
p=.96) or the posttest (F(2,46) = 0.07, p = .93). The interaction between the two factors also was
not significant (for acquisition, F(2,46) = 2.78, p = .07; for posttest, F(2,46) = 2.18, p = .13).
However, when only the similar items were analyzed on the posttest, the interaction was
significant (F(2,46) = 3.72, p = 0.03).
Figures 2 and 3 illustrate this possible expertise reversal effect. These plots indicate that
for students with lower prior knowledge, the WE-V condition resulted in the highest scores while
the WE-M condition resulted in the lowest performance for these participants. For the students
with higher levels of prior knowledge, the opposite pattern is revealed. Again, a greater sample
size might have demonstrated statistically significant results. Research in the future should
address how prior knowledge interacts with worked examples with multiple representations,
particularly those worked examples for related rates.
Figure 2
Acquisition performance by condition and prior knowledge level.

39
Figure 3
Posttest performance by condition and prior knowledge level.
The second finding that warrants attention is the nature of the representations on the
second conceptual item. Most students produced visual representations while very few (n =10)
produced graphical representations, even though the word “graph” was in the item prompt (see
Appendix I). Due to the high number of variables within related rates problems, a graphical
representation may not be helpful in problem solving. However, derivatives are typically taught
using graphical representations (Ubuz, 2007). A graphical representation of related rates,
therefore, may help in conceptual understanding of related rates problems. Future research
should explore how students are able to connect the related rates problems to the graphical
representations of derivatives and the effectiveness of this connection for conceptual knowledge.
Cognitive Load
The third research question posed if there would be a difference between the three
conditions on student-reported mental effort. It was hypothesized that the WE-V group would
experience the least amount of cognitive load because a visual representation was already

40
provided. This expectation was not met due to lack of significant differences among the groups
on this measure.
The current study suggested that there were no differences in students’ reported cognitive
load across the conditions. Given that integration of the representations improves learning
outcomes, it might be speculated that the students in the WE-V group experienced high cognitive
load because they were not given enough support to integrate the verbal, mathematical, and visual
representations of the problems. The lack of an integration aid gave these students more
information to study without reducing the intrinsic load. However, this does not explain why the
WE-V group did not report significantly higher cognitive load than the other groups if more
cognitive processes were required. Furthermore, reported cognitive load was analyzed on the
paired problems, which were all conventional problem-solving tasks that did not have multiple
representations that were given in the problem.
Future research should be conducted to not only determine if integrated worked examples
of related rates reduce reported cognitive load, but studies should also be designed to determine
the source of the load in these types of worked examples. Specifically, what features or aspects
within the worked examples cause the high cognitive load ratings? Is it one representation in
particular, or is the process of integration the cause for high cognitive load?
Student-Generated Representations
The fourth and fifth questions asked if students who drew outperformed those who did
not and if one condition elicited more student-generated drawings than the other groups. As
expected, significant differences were found between those who drew and those who did not draw
on both the acquisition task and posttest. The superior performance of those who drew in this
study suggests that the strategies students use to solve problems do influence performance,
possibly even more so than the type of worked example from which students study.

41
One purpose of this research was to determine if the presence of these visual
representations elicited a spontaneous drawing strategy more often than conventional worked
examples or problems. As such, the instructions in the current study did not prompt or require
students to sketch representations of the problem. Unexpectedly, there were not differences
among conditions on the number of drawings generated by the students. Therefore, drawing did
have a significant influence on performance, but visuals embedded within worked examples did
not increase the use of drawing as a strategy.
Though this finding was unexpected, it presents an observation for mathematics
instruction. The current research suggests that the mere presence of schematic representations
does not prompt students to use a drawing strategy any more than conventional problem-solving
tasks. Future research should be conducted to discover the conditions under which students use
the drawing strategy and when they find it the most effective.
It is possible that the use of student-generated drawings was affected by the type of item.
On the acquisition task, for example, across conditions students most often spontaneously
generated drawing on the last item (Item 8). This item was also the most difficult of the paired
items according to performance and mental effort scores. It is unclear from the current study if
the eighth item was more difficult because it was a five-step item (required the use of an
additional calculation), a Pythagorean theorem item, or because the problem did not specifically
state the geometric shape to be used as the other paired items did. Any of these reasons might
cause students to generate a visual representation of the problem. Similar drawing results were
demonstrated on the posttest, with most of the drawings appearing for the third item.
Additional research on the use of prompted and spontaneous drawing across different
types of problems should explore how the problem situation influences the effectiveness of
drawing as a problem-solving strategy. Specifically, when students are prompted or required to
draw on less difficult items, would this result in increased cognitive load and lower performance?
Also, are there problem scenarios for which certain types of drawings are more useful?

42
Noteworthy is the difference between the control group and the worked example group
with only mathematical representations on the number of student-generated representations. On
both the acquisition task and posttest, the control group drew more often than the worked
example group with mathematical representations, though the difference was slight. This pattern
was also shown in the second conceptual task where students were required to generate
representations. Though no conclusions can be drawn from the current data without statistically
significant results, one might speculate from these data that worked examples have the potential
to suppress spontaneous usage of problem-solving strategies. When a solution pattern is
provided, a learner could assume that all necessary information to solve the problem is given and
may be less likely to employ problem-solving strategies that are not evident in the example.
Furthermore, drawing accuracy was not addressed in this current study but has been
known to influence learning outcomes (Schwamborn, et al, 2010). Future research should also
address drawing accuracy in related rates problems. Do worked examples with embedded visual
representations aid in producing more accurate student-generated representations on the paired
problems, and perhaps greater performance? Also, as previously mentioned, some researchers
have suggested instruction on drawing as a strategy is helpful for successful problem solution.
Future studies can be conducted on how to instruct students to draw accurate representations.
Conclusion
The current study contributed to the existing research in several ways. First, this study
addressed the topic area of calculus, a subject that could benefit from research on worked
examples but given little previous research attention. In this study, the worked example effect did
not hold in the calculus domain. Second, the study resulted in data that demonstrates superior
performance for students who generate their own representations of related rates problems. This
effect has been found in other areas of research such as biology or other areas of mathematics but

43
was not yet found in this topic area. Third, data suggested that a possible expertise reversal effect
exists for the worked examples with visual representations.
From the current study, the visual representations embedded within example-problem
pairs did not produce greater procedural or conceptual knowledge in the area of related rates. Nor
did they reduce cognitive load or elicit more student-generated representations as the hypotheses
projected. However, prior knowledge and the use of student-generated representations did
influence successful problem-solving in this area. These findings warrant further investigation
into the interactivity of worked example format, prior knowledge, and student-generated
representations. Specifically, under what conditions do visual representations hinder students
with higher prior knowledge? Or, how does the nature of the task affect the use and effectiveness
of drawings on related rates problems?
Also important to study is the use of other types of representations for related rates
problems. As previously mentioned, different representational types can influence students’
conceptions of topics within mathematics (Panasuk, 2010). In the current study, schematic
representations were given as a visual representation of related rates problems. Arrows were used
in these schematics to depict the changing nature of the objects in the problems. Additionally,
few students generated a graphical representation of related rates. Further research should be
conducted on other elements within the schematic representations as well as other types of visual
representations such as graphs.
Another important issue is the possibly impaired usage of drawing for students who learn
by worked examples with only calculations. Though results were not significant in this study,
further research should examine this important observation. Worked examples may produce
greater performance results, as previous research suggests, but is this superior performance
obtained at the expense of stifling problem-solving strategies?
44
Appendix A
Section 1 of 5: Consent Form
Informed Consent Form for Social Science Research
The Pennsylvania State University
Title of Project:
Worked Examples and Learning Strategies: A Study in the Calculus Domain
Principal Investigator: Charlyn W. Shaw, Graduate Student
232 Cedar Building
University Park, PA 16802 [email protected]
Advisor: Dr. Rayne A. Sperling
232 Cedar Building University Park, PA 16802
1. Purpose of the Study: The purpose of this study is to explore the learning outcomes related
to different types of worked examples used in instructional materials.
2. Procedures to be followed: This study follows a pretest/post-test design. You will first be asked to complete initial forms including demographic information and a pretest. Following
the pretest, you will study an instructional sheet and complete problem-solving tasks. A post-
test will follow. Scientific calculators will be allowed (extras will be available). At a later time, your class grades and a following test score will also be requested from your professor.
3. Discomforts and Risks: There are no risks in participating in this research beyond those experienced in everyday life.
4. Benefits: You will be given an added 1% of your final grade for participation in this project.
You will also be allowed access to the materials used in this study that could be useful resources for studying in your course. Your responses are also beneficial to the research
community as they will help improve the instructional design of learning materials.
5. Duration: It will take at most 2 hours to complete this experiment.
6. Statement of Confidentiality: Your participation in this research is confidential. You will be asked to give your Penn State user ID at the beginning of the study to be able to report an
extra credit list to your professor. Once the class grades and test scores are received and an
extra credit list is given to the professor, identifying information will be removed from the
data collected. The data will be stored and secured at the Cedar building on the University Park campus in a locked file. The Pennsylvania State University’s Office for Research
Protections, the Institutional Review Board and the Office for Human Research Protections in
the Department of Health and Human Services may review records related to this research

45
study. In the event of a publication or presentation resulting from the research, no personally
identifiable information will be shared.
7. Right to Ask Questions: Please contact Charlyn Shaw at [email protected] with questions,
complaints or concerns about this research. You can also use this e-mail address if you feel
this study has harmed you. If you have any questions, concerns, problems about your rights as a research participant or would like to offer input, please contact The Pennsylvania State
University’s Office for Research Protections (ORP) at (814) 865-1775. The ORP cannot
answer questions about research procedures. Questions about research procedures can be answered by the research team.
8. Payment for participation: You will receive 1% extra on your MATH 110/140 final grade. If a student is unable to participate, an optional problem-solving booklet can also be
completed for this extra credit if requested. The problems will take an equivalent amount of
time to complete (approximately 2 hours).
9. Voluntary Participation: Your decision to be in this research is voluntary. You can stop at
any time. You do not have to answer any questions you do not want to answer. Refusal to
take part in or withdrawing from this study will involve no penalty or loss of benefits you would receive otherwise.
You must be 18 years of age or older to take part in this research study. If you agree to take part
in this research study and the information outlined above, please sign your name and indicate the
date below.
You will be given a copy of this consent form for your records.
_____________________________________________ _____________________
Participant Signature Date
_____________________________________________ _____________________
Person Obtaining Consent Date

46
Appendix B
Section 1 of 5: Demographic Questionnaire
PSU user-ID (example: xyz123):__________________
Gender: ________________ Age: ________ Race: _____________________________
Major: ____________________________
GPA: _________
Are you a native English speaker? Yes No
Year in College:
First-Year Sophmore Junior Senior Other
If “other,” please explain:
Math SAT :________ Verbal SAT:________ Total SAT:_________
If you took another test, such as the ACT, please indicate the test and score:___________
Current MATH course: MATH 083 MATH 110 MATH 140 MATH 140H
Current Instructor: Olszewski Falvo /Olsavsky Olsavsky Ong Other: ___
Have you taken this course previously? Yes No
Last test score in MATH 083/110/140:_________ (NOT letter grade)
Grade you expect to receive in this course: A B C D F
Grade typically achieved in a math course: A B C D F
Number of math-related courses have you taken after enrolling in college:__________ (DO count
current math courses this semester, including 083/110/140. Do NOT count a course twice if it
was repeated.)
Please list the courses and indicate the courses you are currently taking:
Did any of these courses cover calculus content? Yes No
If yes, please specify:
Math classes taken before enrolling in college: (Check all that apply)
_____Basic Math
_____Pre-Algebra
_____Geometry _____Algebra 1
_____Algebra 2
_____Trigonometry
_____Statistics
_____Pre-Calculus
_____Calculus _____Calculus AP
_____Other (please specify):___________

47
Appendix C
Section 1 of 5: Formula Sheet
*You may use this sheet during all sections of the study.
Volume and Surface Area Formulas
Shape Surface Area Volume
Rectangular prism
Cube
Right circular cylinder
Right circular cone
√
Sphere
Other Formulas
Pythagorean Theorem
Formula with distance, rate
and time
Basic Differentiation Rules
[ ]
[ ]
[ ]
[
]
[ ]
[ ]
[ ]
[| |]
| |
[ ]
[ ]
[ ]
[ ]
[ ]
[ ]
[ ]
[ ]

48
Appendix D
Section 2 of 5: Pretest
Directions: Please complete the following questions to the best of your ability. You are encouraged to use any known strategies to complete the problems but you will not be
allowed to ask any questions. Please show all work on the paper provided.
If you do not know how to solve an item, you may skip it. Please record the time you
start as well as the time you finish when prompted to do so. After you mark the finish
time, please do not return to work on the problems. When you are finished, turn your
paper over and continue to the next section.
*(Large space left after each item to show work.)
Start Time: _____:__________
1) Solve for :
2) If √ , find . 3) What is the volume of a sphere with ?
4) Use the product and chain rules to find when .
5) Find
by implicit differentiation:
6) What is the surface area of a cone with and ?
7) Solve for : 8) Air is being let out of a spherical balloon so that the radius decreases at a constant rate of
. At what rate is air being removed when the radius is ?
9) Use the quotient and chain rules to find when
.
10) Find
by implicit differentiation:
11) A cube is increasing in size by each of its sides increasing at a uniform rate of
. How
fast is the volume changing when each edge is ?
Finish Time: _____:__________

49
Appendix E
Section 3 of 5: Instructional Booklet
Directions: Record the start time then read the following information just as you would a textbook. Please study the materials until you feel like you understand them. You are
encouraged to use any known strategy to help you understand the information. You will
not be able to ask questions during this activity. The next section will include solving practice problems in the subject area covered in this booklet. When you feel you
understand the information, record the finish time and turn this section over before
continuing to the next. You will not be allowed to return to this section.
Start Time: _____:__________
Applications of Derivatives: Solving Related Rates Problems
Recall: A derivative is the slope of the tangent line for an equation at a certain point. Derivatives
tell at what rate a variable is changing in relation to another variable (i.e. the rate at
which “y” changes with respect to “x”).
Through this instruction, you will learn how to solve problems involving related rates of change.
Related rates problems deal with the relationship between two variables within an equation. In
other words, as one variable within an equation changes, how does it affect the rate of change of another variable within the same equation?
For example, a person is standing next to a lamppost. The light from the lamppost casts a shadow of the person on the ground. One could use algebra and geometry to calculate the length of the
person’s shadow. You would need the height of the person, the height of the lamppost and the
distance between the person and the lamppost.
What if the person began walking away from the lamppost? The person’s shadow would change
in length as he moved away. One can use calculus to determine how fast the length of his shadow
is changing as the person walks away.
It is important to note that the length of the shadow is not changing at a constant rate. After the
first three feet the shadow could be changing at a different rate than it would be six feet away from the lamppost. It is important to know at which point in time you are considering.
The following table gives more examples of the differences of the uses of algebra and calculus for
similar problems.
Scenario Sample Algebra Question Sample Related Rates
Question
A cone-shaped tank that is being filled with water.
What is the volume of the water in the tank when the
depth and radius are at a
certain point?
At what rate is the volume changing at a certain depth
and radius?
A thin, circular, sheet of metal
expands when heated.
What is the area of the sheet of
metal at a given radius?
At what rate is the area of the
sheet of metal changing at a
given radius?

50
Related rates problems are an application of derivatives. They use implicit differentiation to find
the derivative of an equation with respect to a certain variable, usually time, t.
Review: Use implicit differentiation to find the derivative of with respect to t.
[ ]
[ ]
[ ]
Once an equation is differentiated, the known values can be substituted into the equation. The
equation can then be solved for the unknown values. The following chart gives the steps to solving related rates problems. Following the chart, there are two provided examples.
Steps for Solving a Related Rates Problem
1. Identify all known and unknown variables in the given problem.
2. Find an equation that relates the variables together.
3. Find the derivative of both sides of the equation using implicit differentiation with
respect to t.
4. Substitute the known variables into the resulting equation from Step 3 and solve for the unknown.
Example 1
Circular Ripples in a Pond A stone dropped into a still pond sends out a circular ripple whose
radius increases at a constant rate of
. How rapidly is the area enclosed by the ripple
increasing when the radius is ?
Step 1: Identify the known and unknown variables in the given problem.
The rate of the change of the radius.
The rate of the change of the area. (Unknown)
The radius at time, t.
Step 2: Find an equation that relates the variables together.
The formula for the area of a circle.
Step 3: Find the derivative of both sides of the equation using implicit differentiation with respect to t.
[ ]
(
)
The derivative using implicit differentiation and the chain rule.

51
Step 4: Substitute the known variables into the resulting equation from Step 3 and solve for the
unknown.
(
)
When the radius is , the area is increasing at a rate of
.
Some related rates problems require the use of extra calculations to complete steps 3 or 4. This might even require using other formulas. Consider the following example and compare it to the
previous example.
Example 2
Conical Sand Pile Sand is falling off a conveyor and into a conical sand pile at a rate of
.
The diameter of the base of the cone is always three times the height. At what rate is the height
of the pile changing when the pile is high?
Step 1: Variables
Step 2: Equation
(
)
(
)
Steps 3&4: Derivation and Solution
[
]
(
)
In the previous example, there was more than one unknown variable. The volume formula was
the equation used to relate the variables together, but needed to be in terms of . The relation
between and was given and was substituted into the equation. Because the relation was constant (the diameter was always three times the height), it was inserted into the equation before
taking the derivative.
Finish Time: ______:____________

52
Appendix F
Section 4 of 5: Acquisition Task, Condition 1
Directions: The following packet contains four pages of related rates problems. Each page presents two problems that are similar to each other. Both problems are followed by two
short questions about the mental effort required to complete the problem and your
confidence in your answers.
You are encouraged to use any known strategy to solve the problems but you will not be
allowed to ask any questions. Please show all your work on the paper provided. Record the start and stop times when prompted to do so. When you are finished, turn this section
over and continue to the next section.
Note: While solving the problems, please remember to note the units and the sign of the rate of change (increasing is + and decreasing is - ).
*(Large space left after each problem to show work. Mental effort and confidence scale shown after workspace for every item)
Start Time: _____:__________
1. The sides of a square are increasing at a rate of
What is the rate of change in the
area of the square when one side measures ?
2. Oil spilled from a ruptured tanker spreads out in a circle whose area increases at a
constant rate of
. How fast is the radius of the spill increasing when the radius is
?
3. A ice cube in the shape of a cube is melting in such a way that each side is decreasing at a
rate of
. At what rate is the surface area of the ice cube changing when the side is
?
4. A sphere has a surface area that is increasing at a rate of
. At what rate is the radius
increasing when the radius is ?
5. A rectangular prism with a square base is increasing in volume by
. At the time
when the length of the side of the base is and the height is , the height is
increasing at
. If the base remains square, what is the change of the length of the
side at that time?

53
6. The radius of a right circular cylinder is increasing at a rate of
and the height is
decreasing at a rate of
. At what rate is the volume changing when the radius is
and the height is ?
7. A ladder is leaning against a wall. If the top of the ladder slides down the wall at
a rate of
, how fast will its base be moving away from the wall when the top is
above the ground?
8. A girl is flying a kite on a piece of string. The kite is above the ground and the
wind is blowing the kite horizontally away from her at
. At the time of
string has been let out, what rate must she let out the string to keep it flying at the same height?
Finish Time: _____:__________

54
Appendix G
Section 4 of 5: Acquisition Task, Condition 2
Directions: The following packet contains four pages of related rates problems. Each page presents two problems that are similar to each other. The first problem is a worked
example and the second is one you must solve. Both problems are followed by questions
about the mental effort you used to understand or complete the problem and/or your confidence in your answer. FIRST, study the worked example and answer the mental
effort question, THEN complete the second problem and answer the following questions.
You are encouraged to use any known strategy to solve the problems but you will not be
allowed to ask any questions. Please show all your work on the paper provided. Record
the start time and stop times when prompted to do so. When you are finished, turn this
section over and continue to the next section.
Note: While solving the problems, please remember to note the units and the sign of the rate of
change (increasing is + and decreasing is - ).
*(Large space left after each paired problem to show work. Mental effort scale shown after every
example and work space. Confidence scale shown after every workspace for odd-numbered
items)
Start Time: _____:__________
1. The sides of a square are increasing at a rate of
What is the rate of change in the
area of the square when one side measures ?
2. Oil spilled from a ruptured tanker spreads out in a circle whose area increases at a
constant rate of
. How fast is the radius of the spill increasing when the radius is
?

55
3. A ice cube in the shape of a cube is melting in such a way that each side is decreasing at a
rate of
. At what rate is the surface area of the ice cube changing when the side is
?
4. A sphere has a surface area that is increasing at a rate of
. At what rate is the radius
increasing when the radius is ?
5. A rectangular prism with a square base is increasing in volume by
. At the time
when the length of the side of the base is and the height is , the height is
increasing at
. If the base remains square, what is the change of the length of the
side at that time?
6. The radius of a right circular cylinder is increasing at a rate of
and the height is
decreasing at a rate of
. At what rate is the volume changing when the radius is
and the height is ?
7. A ladder is leaning against a wall. If the top of the ladder slides down the wall at
a rate of
, how fast will its base be moving away from the wall when the top is
above the ground?

56
8. A girl is flying a kite on a piece of string. The kite is above the ground and the
wind is blowing the kite horizontally away from her at
. At the time of
string has been let out, what rate must she let out the string to keep it flying at the same
height?
Finish Time: _____:__________

57
Appendix H
Section 4 of 5: Acquisition Task, Condition 3
Directions: The following packet contains four pages of related rates problems. Each page presents two problems that are similar to each other. The first problem is a worked
example and the second is one you must solve. Both problems are followed by questions
about the mental effort you used to understand or complete the problem and/or your confidence in your answer. FIRST, study the worked example and answer the mental
effort question, THEN complete the second problem and answer the following questions.
You are encouraged to use any known strategy to solve the problems but you will not be
allowed to ask any questions. Please show all your work on the paper provided. Record
the start time and stop times when prompted to do so. When you are finished, turn this
section over and continue to the next section.
Note: While solving the problems, please remember to note the units and the sign of the rate of
change (increasing is + and decreasing is - ).
*(Large space left after each paired problem to show work. Mental effort scale shown after every
example and work space. Confidence scale shown after every workspace for odd-numbered
items)
Start Time: _____:__________
1. The sides of a square are increasing at a rate of
What is the rate of change in the
area of the square when one side measures ?
2. Oil spilled from a ruptured tanker spreads out in a circle whose area increases at a
constant rate of
. How fast is the radius of the spill increasing when the radius is
?
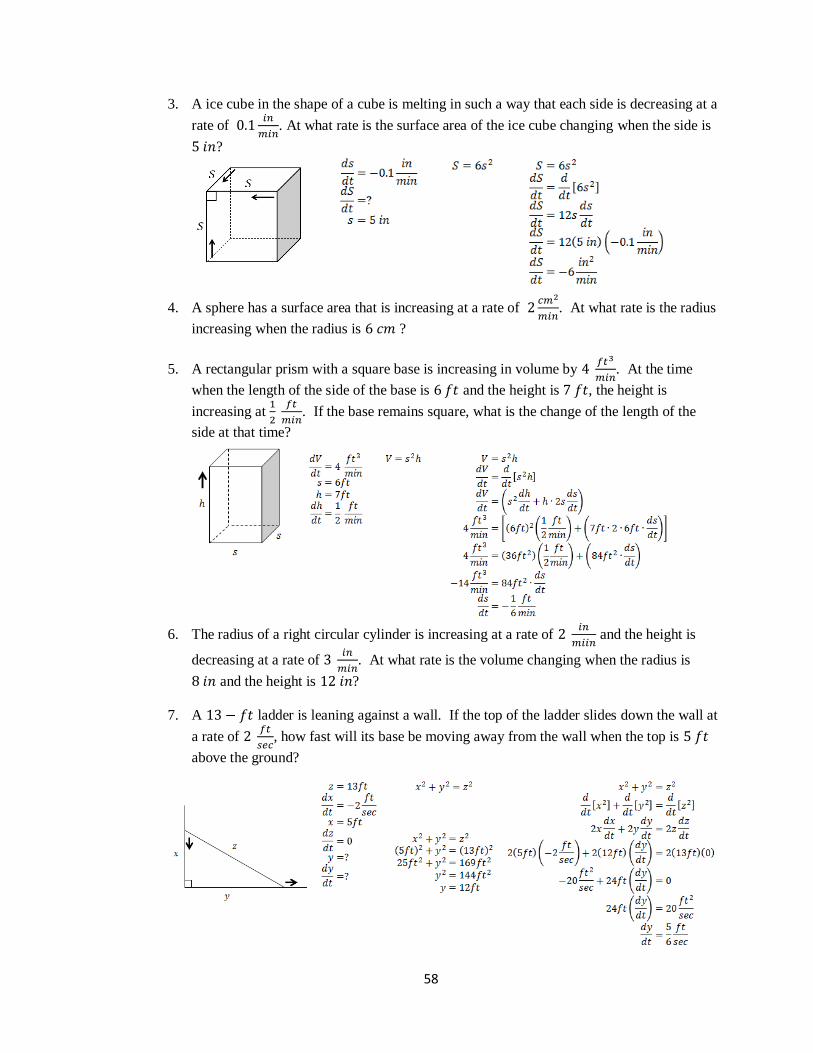
58
3. A ice cube in the shape of a cube is melting in such a way that each side is decreasing at a
rate of
. At what rate is the surface area of the ice cube changing when the side is
?
4. A sphere has a surface area that is increasing at a rate of
. At what rate is the radius
increasing when the radius is ?
5. A rectangular prism with a square base is increasing in volume by
. At the time
when the length of the side of the base is and the height is , the height is
increasing at
. If the base remains square, what is the change of the length of the
side at that time?
6. The radius of a right circular cylinder is increasing at a rate of
and the height is
decreasing at a rate of
. At what rate is the volume changing when the radius is
and the height is ?
7. A ladder is leaning against a wall. If the top of the ladder slides down the wall at
a rate of
, how fast will its base be moving away from the wall when the top is
above the ground?

59
8. A girl is flying a kite on a piece of string. The kite is above the ground and the
wind is blowing the kite horizontally away from her at
. At the time of
string has been let out, what rate must she let out the string to keep it flying at the same
height?
Finish Time: _____:__________

60
Appendix I
Section 5 of 5: Posttest
Directions: This activity contains two parts. The first section contains problems in the same
subject area that you just practiced. The second section contains a survey about your
experiences solving the problems.
For the first part, please complete the questions to the best of your ability. You are
encouraged to use any known strategies to complete the problems but you will not be allowed to ask any questions. Please show all work on the paper provided.
If you do not know how to solve an item, you may skip it. Please record the time you
start as well as the time you finish when prompted to do so. After you mark the finish time, please do not return to work on the problems.
When you are finished with both parts, turn your paper over, return all sections to the envelope and turn it in to the proctor.
Part 1
*(Large space left after each problem to show work. Mental effort and confidence scale shown
after workspace for every item. Part 2 not included.)
Start Time: _____:__________
1. A spherical balloon is being deflated so that the radius decreases at a constant rate of
. At what rate is air being removed when the radius is ?
2. All edges of a cube are expanding at a rate of
. How fast is the volume changing
when each edge is ?
3. A train, starting at 11 am, travels east at while another, starting at noon from the
same point, travels south at . How fast are they separating at 3 pm?
4. The cost C (in dollars) of manufacturing x number of high-quality computer laser printers
is
⁄
⁄
If the current level of production is 1728 printers and is increasing at the rate of 350
printers each month, find the rate at which the cost is increasing each month.
Finish Time: _____:__________

61
5. For which of the following scenarios would differentiation be appropriate to use to find
the solution? You may use the area at the bottom of the page for scratch paper.
(Mark all that apply)
Finding the area of a square at a certain time if the lengths of sides are uniformly
changing and the length of the sides at that time are known.
Finding the volume of a cylinder at a certain time when its radius and height are
given at that time.
Finding the change in height of a pyramid at a specific time as its volume increases
but the area of its base stays the same.
Finding the radius of a circle at a certain time when its change in area and change in
radius at that time are given.
Finding the change in volume of a cube between time a and time b when its volume
at both times are given.
Finding the change of the surface area of a sphere at a certain time when its radius at
that time and the rate of change of the radius at that time are given.
Finding the area of a circle at a certain time when the radius at that time is given as
well as the change in radius at that time.
6. Please construct as many representations of as many types (such as a drawing or a graph)
as possible for the following scenario. In each representation, include all important
details that are needed to solve the problem. Do NOT find an answer to the problem.
A stone dropped into a still pond sends out a circular ripple whose radius increases at a constant
rate of
. How rapidly is the area enclosed by the ripple increasing when the radius is ?

62
Bibliography
Asiala, M., Cottrill, J., Dubinsky, E., & Schwingendorf, K. (1997). The development of students'
graphical understanding of the derivative. Journal of Mathematical Behavior, 16(4), 399-
421.
Aspinwall, L., & Miller, L. (1997). Students' positive reliance on writing as a process to learn
first semester calculus. Journal of Instructional Psychology, 24(4), 253-261.
Atkinson, R., Renkl, A., & Merrill, M. (2003). Transitioning from studying examples to solving
problems: Effects of self-explanation prompts and fading worked-out steps. Journal of
Educational Psychology, 95(4), 774-783.
Berthold, K., & Renkl, A. (2009). Instructional aids to support a conceptual understanding of
multiple representations. Journal of Educational Psychology, 101(1), 70-87.
Berthold, K., Eysink, T., & Renkl, A. (2009). Assisting self-explanation prompts are more
effective than open prompts when learning with multiple representations. Instructional
Science, 37(4), 345-363.
Biesinger, K., & Crippen, K. (2010). The effects of feedback protocol on self-regulated learning
in a web-based worked example learning environment. Computers and Education, 55,
1470-1482.
Boekhout, P., van Gog, T., van de Wiel, M., Gerards-Last, D., & Geraets, J. (2010). Example-
based learning: Effects of model expertise in relation to student expertise. British Journal
of Educational Psycholgoy, 80(4), 557-566.
Brenner, M., Mayer, R., Moseley, B., Brar, T., Duran, R., Reed, B., & Webb, D. (1997). Learning
by understanding: The role of multiple representations in learning algebra. American
Educational Research Journal, 34(4), 663-689.
Cantrambone, R. (1996). Generalizing solution procedures learned from examples. Journal of
Experimental Psychology: Learning, Memory, and Cognition, 22(4), 1020-1031.

63
Carroll, W. M. (1994). Using worked examples as an instructional support in the algebra
classroom. Journal of Educational Psychology, 86(3), 360-367.
Chandler, P., & Sweller, J. (1991). Cognitive load theory and the format of instruction. Cognition
and Instruction, 8(4), 293-332.
Chi, M., Bassok, M., Lewis, M., Reimann, P., & Glaser, R. (1989). Self-explanations: How
students study and use examples in learning to solve problems. Cognitive Science, 13(2),
145-182.
Crippen, K., Biesinger, K., Muis, K., & Orgill, M. (2009). The role of goal orientation and self-
efficacy in learning from web-based worked examples. Journal of Interactive Learning
Research, 20(4), 385-403.
Darabi, A. A., Nelson, D. W., & Paas, F. (2007). Learner involvement in instruction on a
complex cognitive task: Application of a composite measure of performance and mental
effort. Journal of Research on Technology in Education, 40(1), 39-48.
de Bock, D., Vershaffel, L., & Janssens, D. (1998). The predominance of the linear model in
secondary school students' solutions of word problems involving length and area of
similar plane figures. Educational Studies in Mathematics, 35, 65-83.
Edens, K., & Potter, E. (2008). How students "unpack" the structure of a word problem: Graphic
representations and word problems. School Science and Mathematics, 108(5), 184-196.
Ferrini-Mundy, J., & Graham, K. G. (1991). An overview of the calculus curriculum reform
effort: Issues for learning, teaching, and curriculum development. The American
Mathematical Monthly, 98(7), 627-635.
Goldin, G. (1998). Representational systems, learning, and problem solving in mathematics.
Journal of Mathematical Behavior, 17(2), 137-165.
Goldin, G., & Kaput, J. (1996). A joint perspective on the idea of representation in learning and
doing mathematics. In L. Steffe, P. Nesher, P. Cobb, G. Goldin, & B. Greer (Eds.),
Theories of mathematical learning (pp. 397-430). Hillsdale, NJ: Erlbaum.

64
Große, C., & Renkl, A. (2007). Finding and fixing errors in worked examples: Can this foster
learning outcomes? Learning and Instruction, 17(1), 612-634.
Hegarty, M., & Kozhevnikov, M. (1999). Types of visual-spatial representations and
mathematical problem solving. Journal of Educational Psychology, 91(4), 684-689.
Herbert, S., & Pierce, R. (2011). What is rate? Does context or representation matter?
Mathematics Education Research Journal, 23(4), 455-477.
Kalyuga, S. (2007). Expertise reversal effects and its implications for learner-tailored instruction.
Educational Psychology Review, 19, 509-539.
Kalyuga, S., Chandler, P., & Sweller, J. (1998). Levels of expertise and instructional design.
Human Factors, 40(1), 1-17.
Kalyuga, S., Chandler, P., Tuovinen, J., & Sweller, J. (2001). When problem solving is superior
to studying worked examples. Journal of Educational Psychology, 93(3), 579-588.
Kalyuga, S., & Sweller, J. (2004). Measuring knowledge to optimize cognitive load factors
during instruction. Journal of Educational Psychology, 96(3), 558-568.
Larson, R., Hostetler, R.P., Edwards, B.H., Heyd, D.E. (2001). Calculus (7th Edition). Houghton
Mifflin Company College Division.
Mahir, N. (2009). Conceptual and procedural performance of undergraduate students in
integration. International Journal of Mathematical Education in Science and Technology,
40(2), 201-211.
Marley, S.C., Carbonneau, K.J. (2014). Theoretical perspectives and empirical evidence relevant
to classroom instruction with manipulatives. Educational Psychology Review, 26, 1-7.
Martin, T. (2000). Calculus Students' Ability to Solve Geometric Related-Rates Problems.
Mathematics Education Research Journal, 2(2), 74-91.
Miller, D. (2010). Using a three-step method in a calculus course: Extending the worked example.
College Teaching, 58, 99-104.

65
Mwangi, W., & Sweller, J. (1998). Learning to solve compare word problems: The effect of
example format and generating self-explanations. Cognition and Instruction, 16(2), 173-
199.
National Assessment of Educational Progress (NAEP) (1988). Mathematics objectives: 1990
Assessment. Princeton, NJ: Educational Testing Service.
Niemi, D. (1996). Assessing conceptual understanding in mathematics: Representations, problem
solutions, justifications and explanations. The Journal of Educational Research, 89(6),
351-363.
Orton, A. (1983a). Students' understanding of integration. Educational Studies in Matheamtics,
14(1), 1-18.
Orton, A. (1983b). Students' understanding of differentiation. Educational studies in
mathematics, 14(3), 235-250.
Owen, R., & Fuchs, L. (2002). Mathematical problem-solving strategy instruction for third-grade
students with learning disabilities. Remedial and Special Education, 23(5), 268-.
Paas, F. (1992). Training strategies for attaining transfer of problem-solving skills in statistics: A
cognitive load approach. Journal of Educational Psychology, 84(4), 429-434.
Paas, F., & Van Merrienboer, J. (1994). Variability of worked examples and transfer of
geometrical problem-solving skills: a cognitive-load approach. Journal of Educational
Psychology, 86(1), 122-133.
Panasuk, R. (2010). Three phase ranking framework for assessing conceptual understanding in
algebra using multiple representations. Education, 131(2), 235.
Panasuk, R., Beryranevand, M. (2010). Algebra students' ability to recognize multiple
representations and achievement. International Journal for Mathematics Teaching and
Learning, 22, 1-22.
Parnafes, O., & Disessa, A. (2004). Relations between types of reasoning and computation.
International Journal of , 251-280.

66
Renkl, A., Atkinson, R., & Große, C. (2004). How fading worked solution steps works-A
cognitive load perspective. Instructional Science, 32(1), 59-82.
Rittle-Johnson, B., Star, J., & Durkin, K. (2009). The importance of prior knowledge when
comparing examples: Influences on conceptual and procedural knowledge of equation
solving. Journal of Educational Psychology, 101(4), 836-852.
Salden, R.J.C.M., Aleven, V., & Schwonke, R. (2010). The expertise reversal effect and worked
examples in tutored problem solving. Instructional Science, 38(1), 289-307.
Schneider, M. (1992). A propos de l'apprentissage du taux de variation instantane (On learning
the rate of instantaneous change). Educational Studies in Mathematics, 23(4), 317-350.
Schwamborn, A., Mayer, R., Thillmann, H., Leopold, C., & Leutner, D. (2010). Drawing as a
generative activity and drawing as a prognostic activity. Journal of Educational
Psychology, 102(4), 872-879.
Schwonke, R., Berthold, K., & Renkl, A. (2009). How multiple external representations are used
and how they can be made more useful. Applied Cognitive Psychology, 23(9), 1227-1243.
Schwonke, R., Renkl, A., Krieg, C., Wittwer, J., & Aleven, V. (2009). The worked example
effect: Not an artefact of lousy control conditions. Computers in Human Behavior, 25(2),
258-266.
Schwonke, R., Renkl, A., Salden, R., & Aleven, V. (2011). Effects of different ratios of worked
solution steps and problem solving opportunities on cognitive load and learning
outcomes. Computers in Human Behavior, 27(1), 58-62.
Sweller, J. (1988). Cognitive load theory: Effects on learning. Cognitive Science, 12, 257-285.
Sweller, J. (2006). The worked example effect and human cognition. Learning and Instruction,
16, 165-169.
Sweller, J. (2010). Element interactivity and intrinsic, extraneous, and germane cognitive load.
Educational Psychology Review, 22, 123-138.

67
Sweller, J., & Chandler, P. (1994). Why some material is difficult to learn. Cognition and
Instruction, 12(3), 185-233.
Sweller, J., & Cooper, G. (1985). The use of worked examples as a substitute for problem solving
in learning algebra. Cognition and Instruction, 2(1), 59-89.
Sweller, J., Van Merrienboer, J., & Paas, F. (1998). Cognitive architecture and instructional
design. Educational Psychology Review, 10(3), 251-296.
Tarmizi, R., & Sweller, J. (1988). Guidance during mathematical problem solving. Journal of
Educational Psychology, 80(4), 424-436.
Thompson, P.W. (1994). Images of rate and operational understanding of the fundamental
theorem of calculus. Educational Studies in Mathematics, 26(2),229-274.
Tuovinen, J., & Sweller, J. (1999). A comparison of cognitive load associated with discovery
learning and worked examples. Journal of Educational Psycholgoy, 91(2), 334-341.
Ubuz, B. (2007). Interpreting at graph and constructing its derivative graph: stabiliity and change
in students' perceptions. International Journal of Mathematical Education in Science and
Technology, 38(5), 609-637.
van Gerven, P., Paas, F., Van Merrienboer, J., & Schmidt, H. (2002). Cognitive load theory and
aging: Effects of worked examples on training efficiency. Learning and Instruction,
12(1), 87-105.
van Gog, T., Kester, L., & Paas, F. (2011). Effects of worked examples, example-problem and
problem-example pairs on novices' learning. Contemporary Educational Psychology,
36(3), 212-218.
van Gog, T., Paas, F., & Van Merrienboer, J. (2006). Effects of process-oriented worked
examples on troubleshooting transfer performance. Learning and Instruction, 16, 154-
164.

68
van Gog, T., Paas, F., & Van Merrienboer, J. (2008). Effects of studying sequences of process-
oriented and product-oriented worked examples on troubleshooting transfer efficiency.
Learning and Instruction, 18(3), 211-222.
van Loon-Hillen, N., van Gog, T., & Brand-Guwel, S. (2012). Effects of worked examples in a
primary school mathematics curriculum. Interactive Learning Environments, 20(1), 89-
99.
Van Meter, P. (2001). Drawing construction as a strategy for learning from text. Journal of
Educational Psychology, 93(1), 129-140.
Van Meter, P., & Garner, J. (2005). The promise and practice of learner-generated drawing:
literature review and synthesis. Educational Psychology Review, 17(4), 285-325.
Van Meter, P., Aleksic, M., Schwartz, A., & Garner, J. (2006). Learner-generated drawing as a
strategy for learning form content area text. Contemporary Educational Psychology, 31,
142-166.
Villegas, J., Castro, E., & Gutiérrez, J. (2009). Representations in problem solving: A case study
with optimization problems. Electronic Journal of Research in Educational Psychology,
7(17), 279-308.
Ward, M., & Sweller, J. (1990). Structuring effective worked examples. Cognition and
Instrcution, 7(1), 1-39.
White, P., & Mitchelmore, M. (1996). Conceptual knowledge in introductory calculus. Journal
for Research in Mathematics Education, 27(1), 79-95.
Zhu, X., & Simon, H. (1987). Learning mathematics from examples and by doing. Cognition and
Instruction, 4(3), 137-166.
Zimmerman, W. (1991). Visual Thinking in Calculus. In W. Zimmerman, & S. Cunningham
(Eds.), Visualization in Teaching and Learning Mathematics (Vol. 19, pp. 127-137).
Washington, D.C.: Mathematical Association of America.

69
Zimmerman, W., & Cunningham, S. (Eds.). (1991). Visualization in Teaching and Learning
Mathematics (Vol. 19). Washington, D.C.: Mathematical Associaton of American.