Embed Size (px)
DESCRIPTION
Work environment correlates of WAI. R. J. Mykletun and T. Furunes. "Contemporary Problems of Prolonging Work Ability. Age Management: Extending the Work Life" October 9-10, 2008. Tallinn. Purpose. This study tests a four item version of the Work Ability Index (WAI-4) and relates the scale to: - PowerPoint PPT Presentation
Citation preview
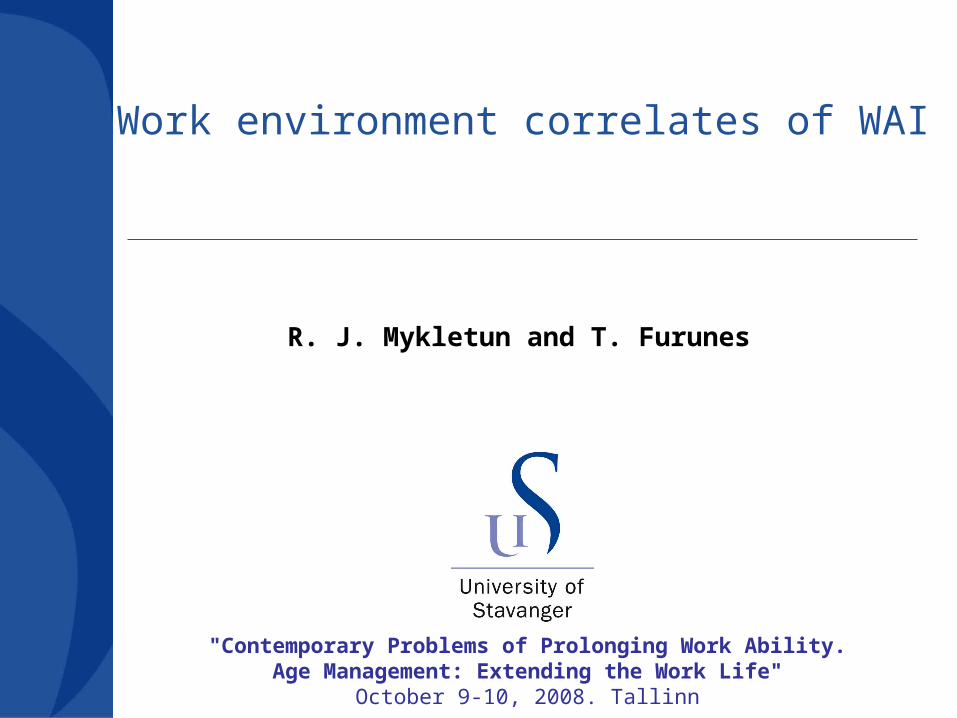
Work environment correlates of WAI
R. J. Mykletun and T. Furunes
"Contemporary Problems of Prolonging Work Ability.Age Management: Extending the Work Life"
October 9-10, 2008. Tallinn
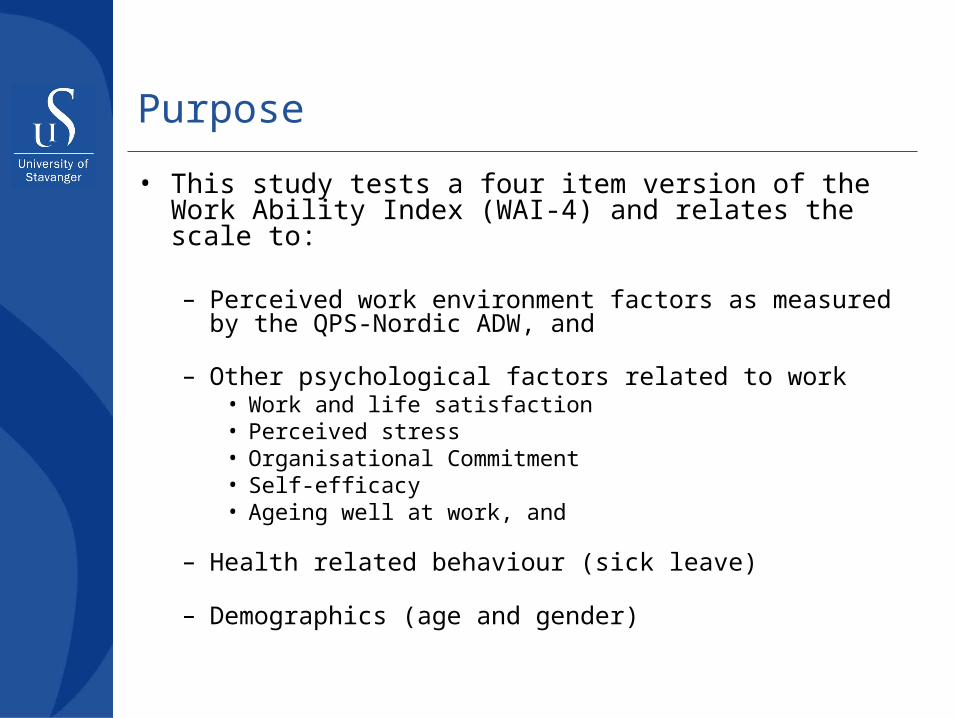
Purpose
• This study tests a four item version of the Work Ability Index (WAI-4) and relates the scale to:
– Perceived work environment factors as measured by the QPS-Nordic ADW, and
– Other psychological factors related to work • Work and life satisfaction• Perceived stress• Organisational Commitment• Self-efficacy• Ageing well at work, and
– Health related behaviour (sick leave)
– Demographics (age and gender)
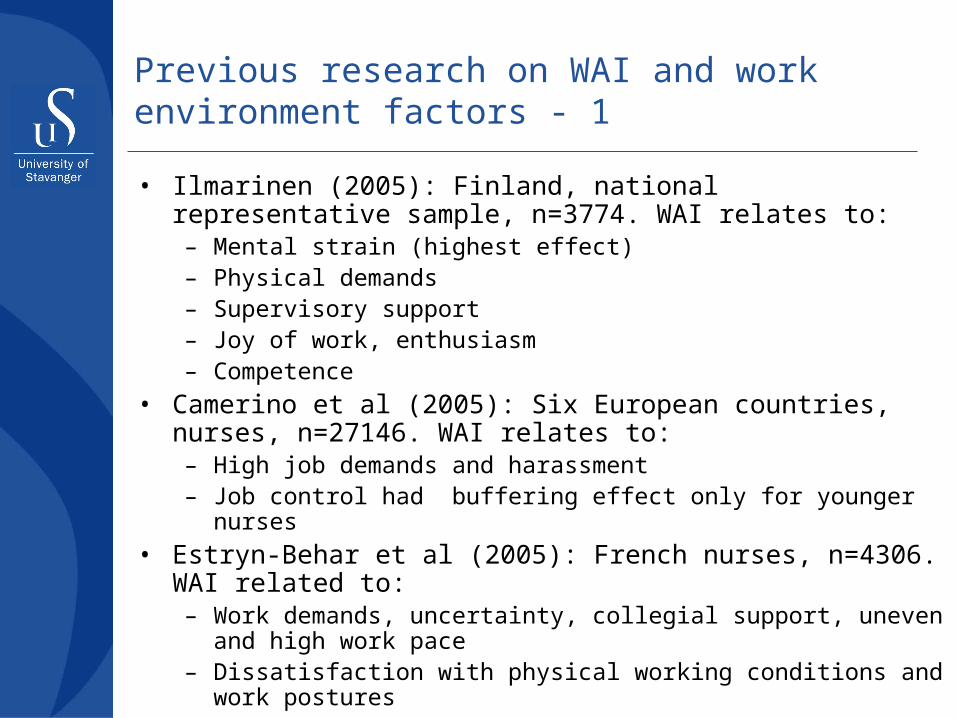
Previous research on WAI and work environment factors - 1
• Ilmarinen (2005): Finland, national representative sample, n=3774. WAI relates to:– Mental strain (highest effect)– Physical demands– Supervisory support– Joy of work, enthusiasm – Competence
• Camerino et al (2005): Six European countries, nurses, n=27146. WAI relates to: – High job demands and harassment– Job control had buffering effect only for younger nurses
• Estryn-Behar et al (2005): French nurses, n=4306. WAI related to:– Work demands, uncertainty, collegial support, uneven and
high work pace– Dissatisfaction with physical working conditions and work
postures

Previous research on WAI and work environment factors - 2
• Freude et al. (2005): German female teachers, n=100. WAI relates to– efforts – rewards balance at work
• Goedhard & Goedhard (2005): Dutch army servants, n=144. WAI relates to – Stress defined by boredom, lack of support,
quantitative overload, qualitative overload, salary and physical working conditions
• Bugajska & Lastowiecka (2005): Polish cross-occupational sample, n=1485. WAI relates to– Collegial support, work pace, time for breaks

Background – few published studies report scale properties
• Torgen, 2005: Swedish sample, n=3493– Ten item questionnaire version of WAI grouped to seven
scores– Factor analysis showed homogeneity (one factor) – “Ceiling effect” and unstable correlations of items to sum-
score for healthy workforce and for younger male workers for three scores
– Gender differences, increasing average over time?• Geissler et al (2005): German home care workers, n=126
– WAI score influenced by interviewer’s profession • Radkiewcz & Widerzahl-Bazyl (2005): NEXT-study in nine
European countries, n=38000 – Seven item questionnaire version– Factor structures (1 – 2) vary across national samples– Alpha coefficient varies across national samples from .54 to
79; average Alpha = .72– Predictive validity (health, burnout)
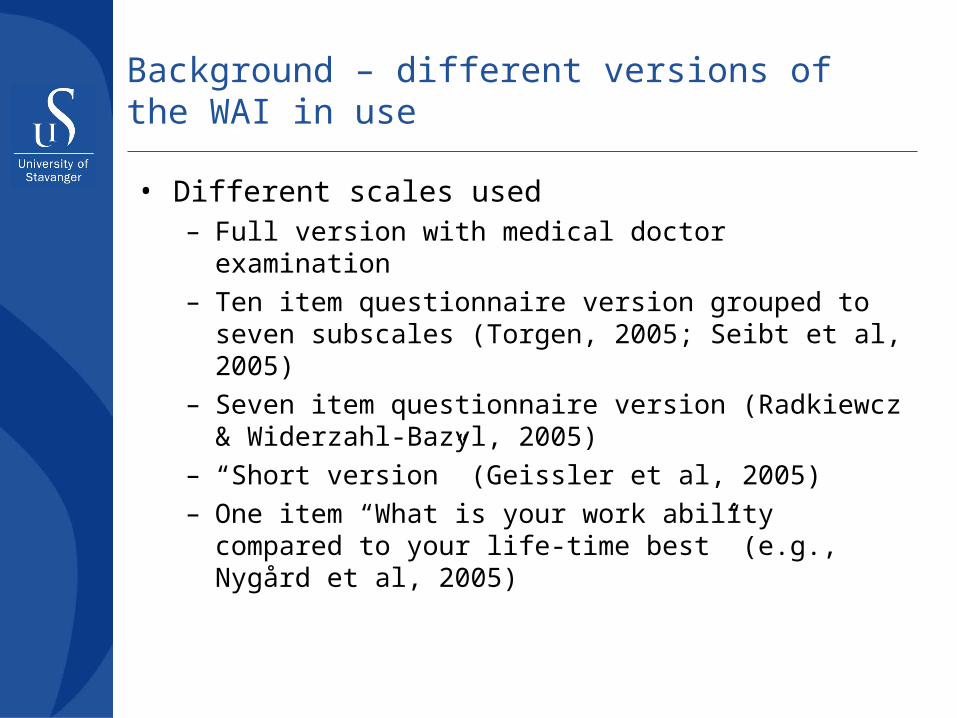
Background – different versions of the WAI in use
• Different scales used– Full version with medical doctor examination– Ten item questionnaire version grouped to seven
subscales (Torgen, 2005; Seibt et al, 2005)– Seven item questionnaire version (Radkiewcz &
Widerzahl-Bazyl, 2005)– “Short version” (Geissler et al, 2005)– One item “What is your work ability compared to
your life-time best” (e.g., Nygård et al, 2005)
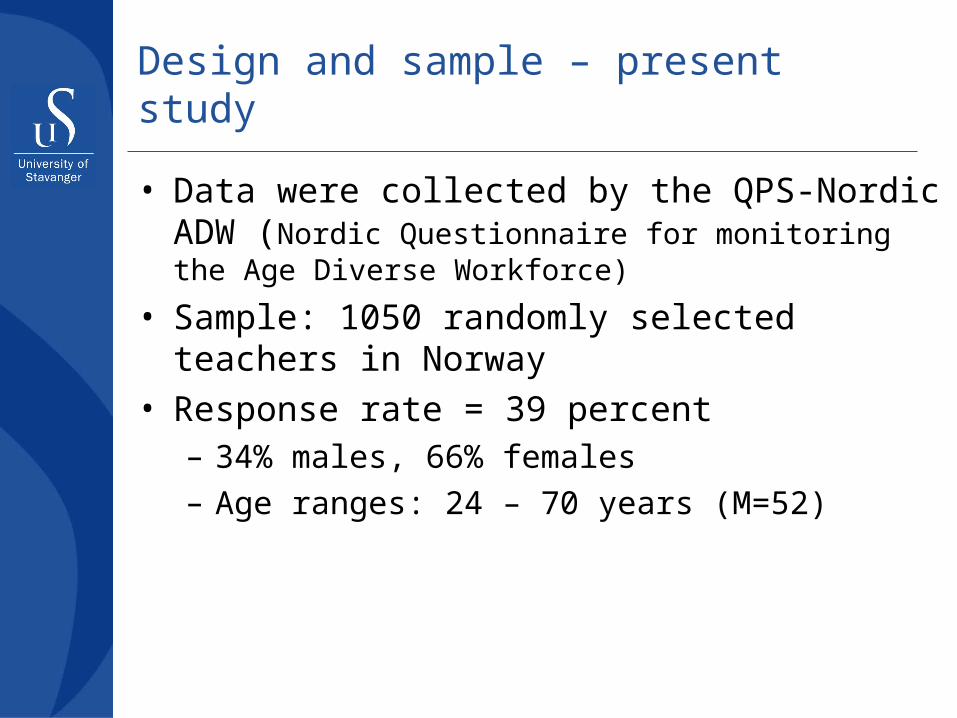
Design and sample – present study
• Data were collected by the QPS-Nordic ADW (Nordic Questionnaire for monitoring the Age Diverse Workforce)
• Sample: 1050 randomly selected teachers in Norway
• Response rate = 39 percent– 34% males, 66% females– Age ranges: 24 – 70 years (M=52)
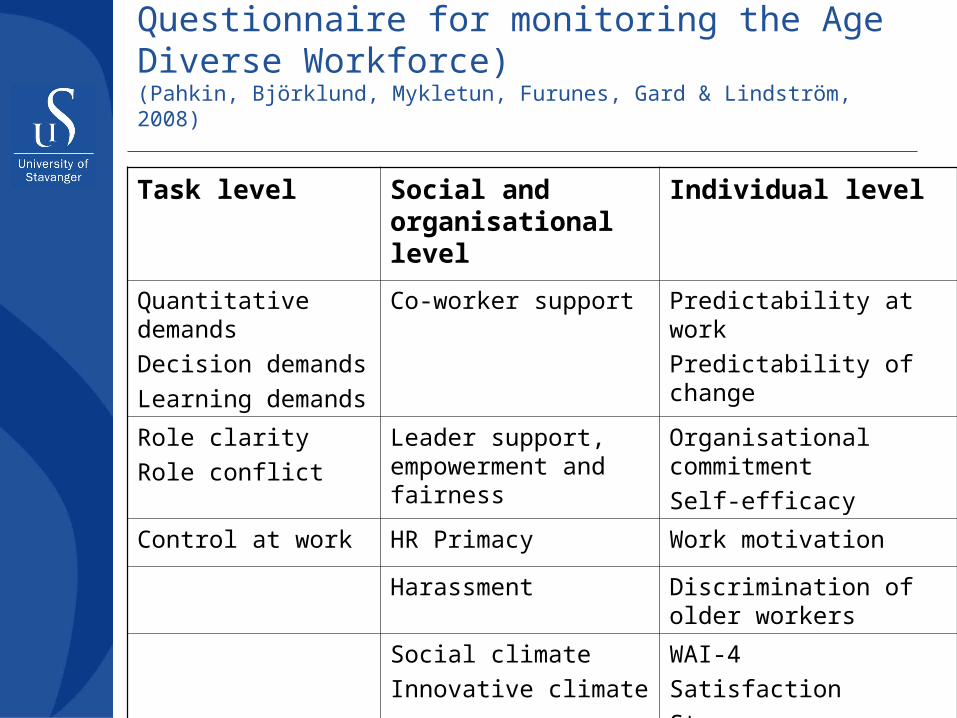
QPS-Nordic ADW (Nordic Questionnaire for monitoring the Age Diverse Workforce)(Pahkin, Björklund, Mykletun, Furunes, Gard & Lindström, 2008)
Task level Social and organisational level
Individual level
Quantitative demandsDecision demandsLearning demands
Co-worker support Predictability at workPredictability of change
Role clarityRole conflict
Leader support, empowerment and fairness
Organisational commitmentSelf-efficacy
Control at work HR Primacy Work motivation
Harassment Discrimination of older workers
Social climate Innovative climate
WAI-4Satisfaction Stress“Ageing well at work”
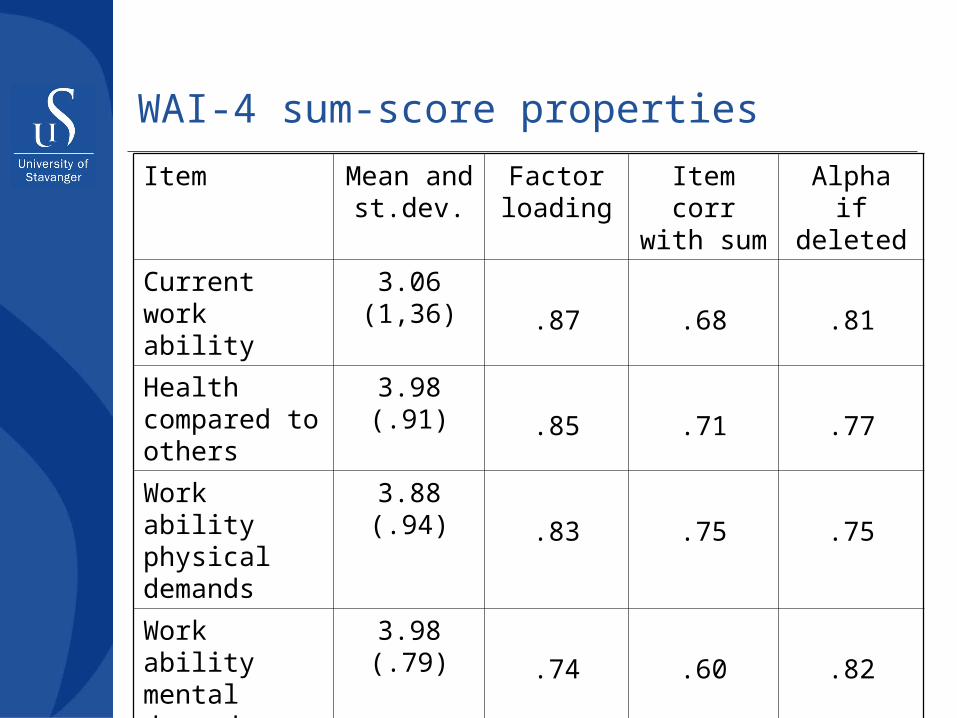
WAI-4 sum-score properties
Item Mean and st.dev.
Factor loading
Item corr with sum
Alpha if deleted
Current work ability
3.06 (1,36) .87 .68 .81
Health compared to others
3.98 (.91).85 .71 .77
Work ability physical demands
3.88 (.94).83 .75 .75
Work ability mental demands
3.98 (.79).74 .60 .82
Overall 3,7 (.64)
61 % expl. var
Alpha= .83
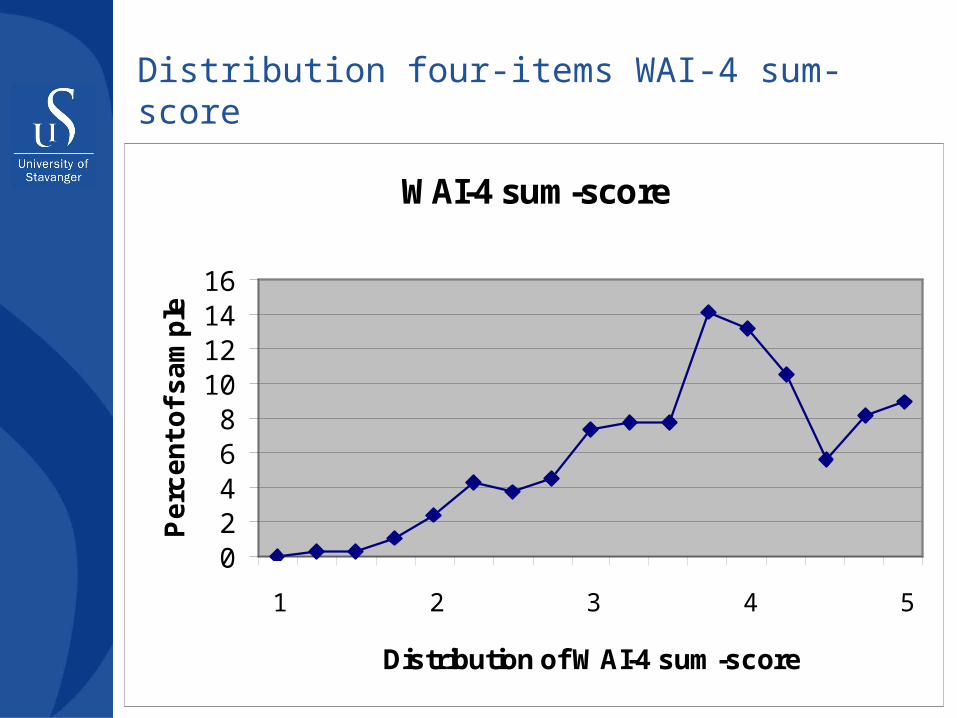
Distribution four-items WAI-4 sum-score
WAI-4 sum-score
02468
10121416
1 2 3 4 5
Distribution of WAI-4 sum-score
Pe
rce
nt
of
sa
mp
le
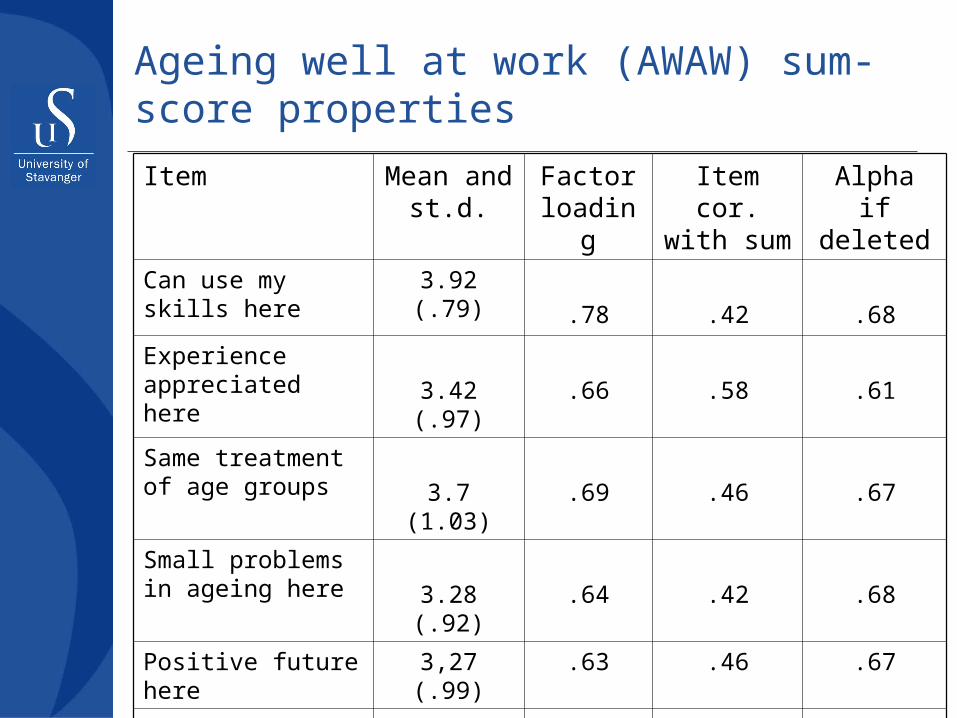
Ageing well at work (AWAW) sum-score properties
Item Mean and st.d.
Factor loading
Item cor. with sum
Alpha if deleted
Can use my skills here
3.92 (.79).78 .42 .68
Experience appreciated here 3.42 (.97) .66 .58 .61
Same treatment of age groups 3.7 (1.03) .69 .46 .67
Small problems in ageing here 3.28 (.92) .64 .42 .68
Positive future here
3,27 (.99) .63 .46 .67
Overall 3,5 (.64)
47 % expl. Var
Alpha= .71
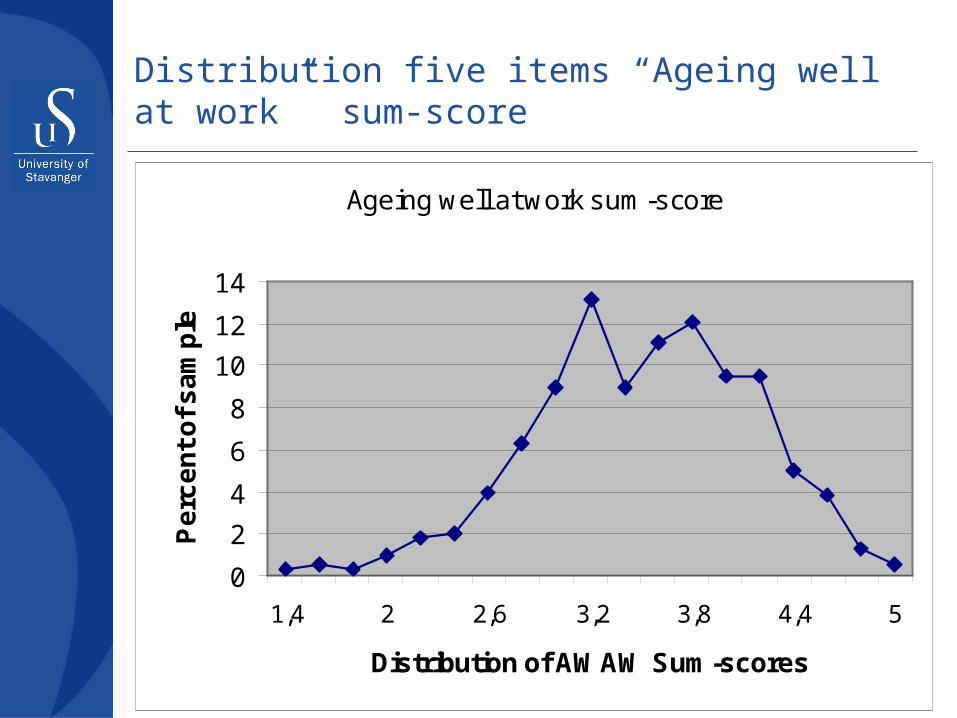
Distribution five items “Ageing well at work” sum-score
Ageing well at work sum-score
0
2
4
6
8
10
12
14
1,4 2 2,6 3,2 3,8 4,4 5
Distribution of AWAW Sum-scores
Pe
rce
nt
of
sa
mp
le
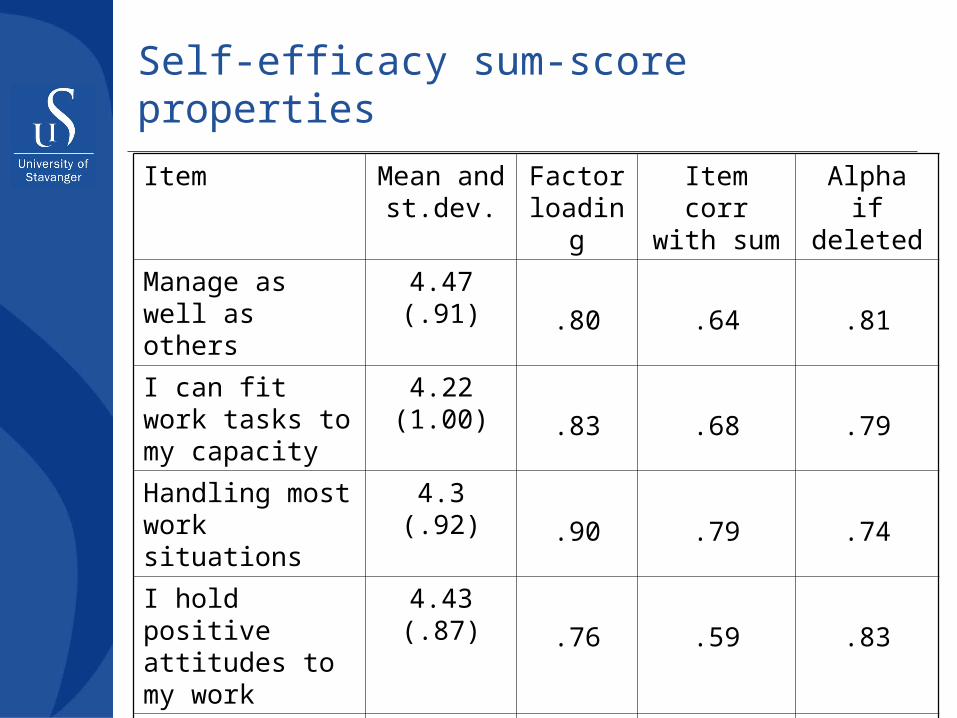
Self-efficacy sum-score properties
Item Mean and st.dev.
Factor loading
Item corr with sum
Alpha if deleted
Manage as well as others
4.47 (.91).80 .64 .81
I can fit work tasks to my capacity
4.22 (1.00) .83 .68 .79
Handling most work situations
4.3 (.92).90 .79 .74
I hold positive attitudes to my work
4.43 (.87).76 .59 .83
Overall 4.35 (.78)
68 % expl. var
Alpha= .84
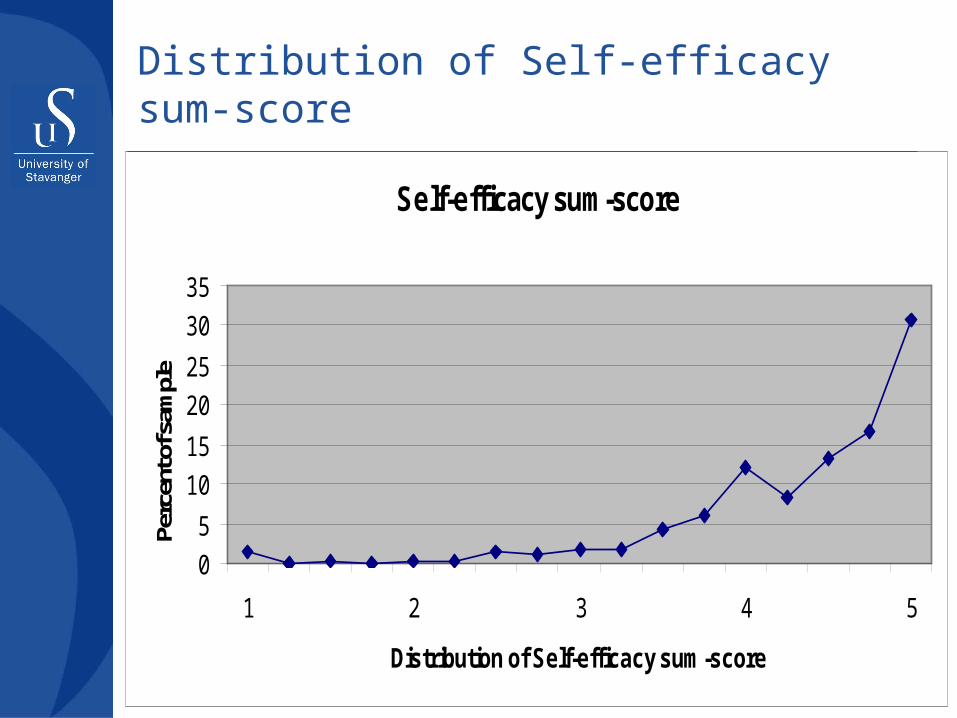
Distribution of Self-efficacy sum-score
Self-efficacy sum-score
0
5
10
15
20
25
30
35
1 2 3 4 5
Distribution of Self-efficacy sum-score
Perc
ent o
f sam
ple
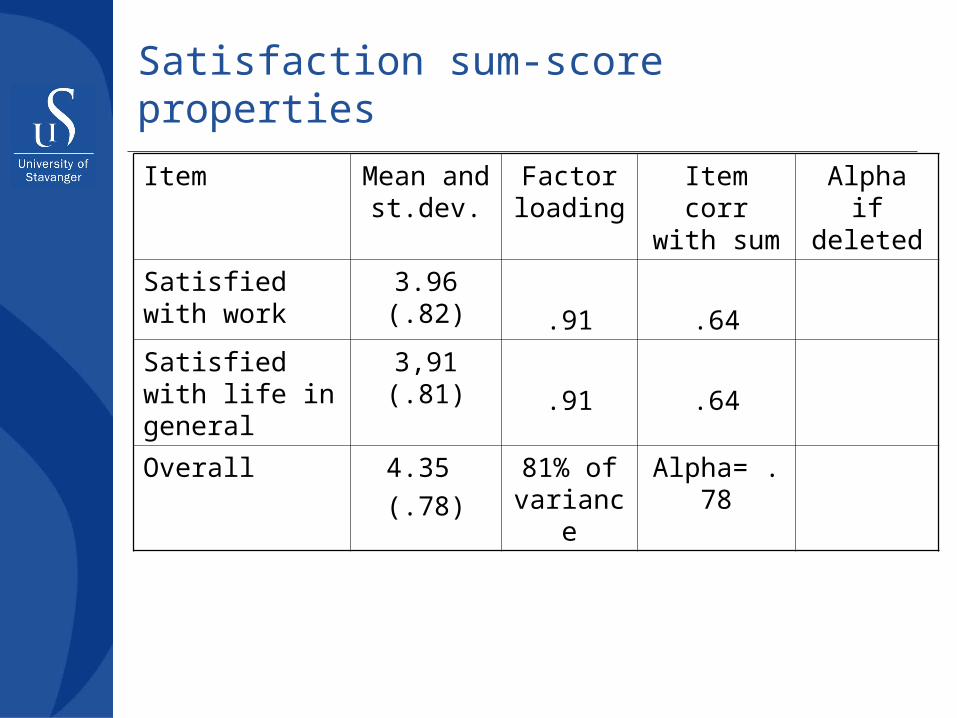
Satisfaction sum-score properties
Item Mean and st.dev.
Factor loading
Item corr with sum
Alpha if deleted
Satisfied with work
3.96 (.82).91 .64
Satisfied with life in general
3,91 (.81).91 .64
Overall 4.35 (.78)
81% of variance
Alpha= .78
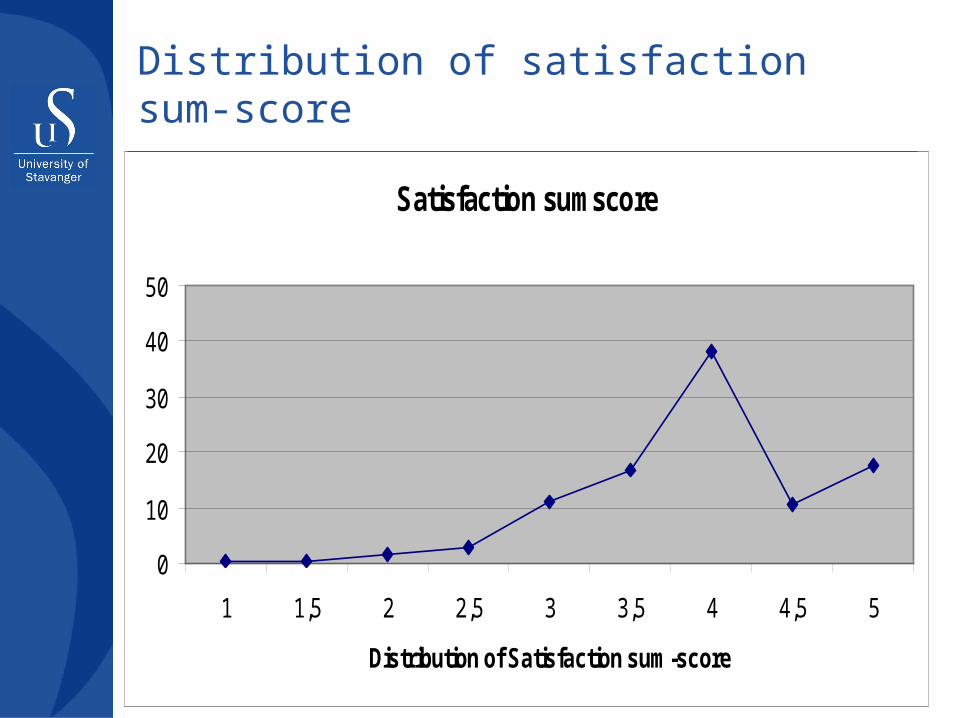
Distribution of satisfaction sum-score
Satisfaction sumscore
0
10
20
30
40
50
1 1,5 2 2,5 3 3,5 4 4,5 5
Distribution of Satisfaction sum-score
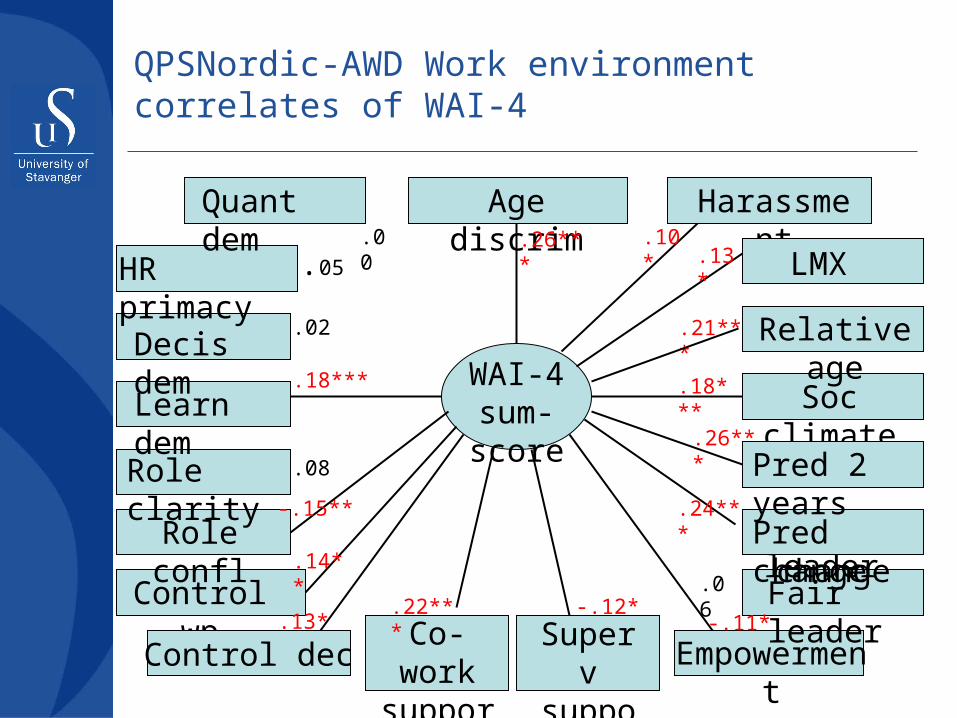
QPSNordic-AWD Work environment correlates of WAI-4
WAI-4 sum-score
Age discrim
Decis dem
Learn dem
Role clarity
Role confl
Control wpCo-work support
Superv support
Empowerment
Fair leader
Soc climate
Relative age
HR primacy
Harassment.10*.26***
.02
.18***
.08
-.15**
.14**
.22*** -.12*-.11*
.06
.18***
.21***
.05
.00
Quant dem
Control dec.13*
Pred change
Fair leader
Pred change.24***
Pred 2 years.26***
LMX.13*
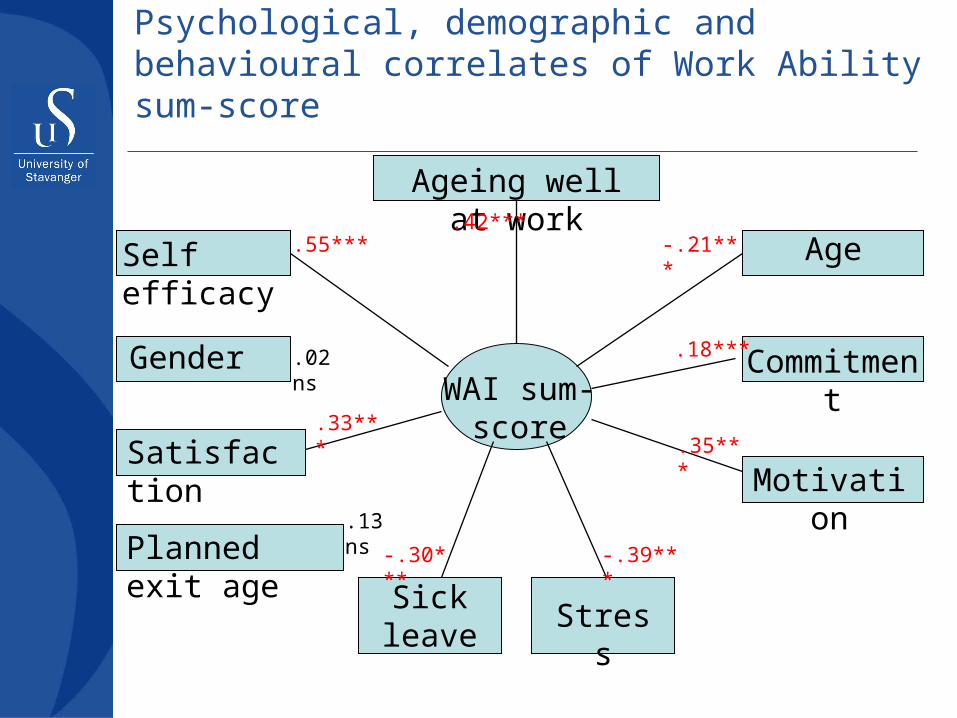
Psychological, demographic and behavioural correlates of Work Ability sum-score
WAI sum-score
Ageing well at work
Self efficacy
Gender
Sick leave
Stress
Commitment
Age.42***
.55***
-.30*** -.39***
.35***
.18***
.13 ns
MotivationSatisfaction
.33***
-.21***
Planned exit age
.02ns
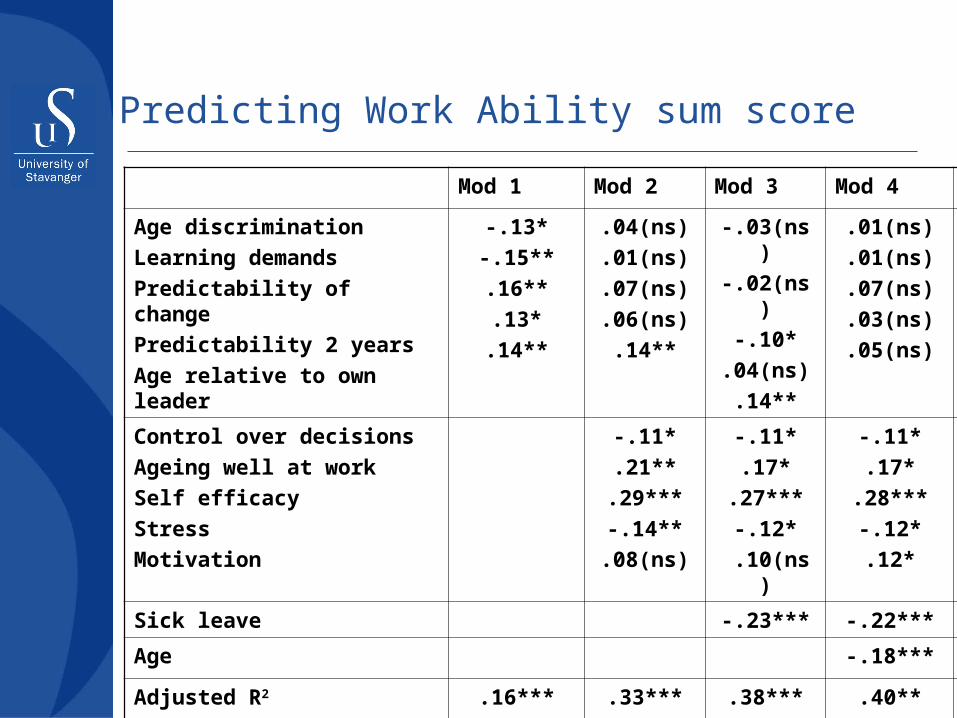
Predicting Work Ability sum score
Mod 1 Mod 2 Mod 3 Mod 4
Age discriminationLearning demandsPredictability of changePredictability 2 years Age relative to own leader
-.13*-.15**.16**.13*.14**
.04(ns)
.01(ns)
.07(ns)
.06(ns).14**
-.03(ns)-.02(ns)
-.10*.04(ns).14**
.01(ns)
.01(ns)
.07(ns)
.03(ns)
.05(ns)
Control over decisionsAgeing well at workSelf efficacy StressMotivation
-.11*.21**.29***-.14**
.08(ns)
-.11*.17*
.27***-.12*
.10(ns)
-.11*.17*
.28***-.12*.12*
Sick leave -.23*** -.22***
Age -.18***
Adjusted R2 .16*** .33*** .38*** .40**
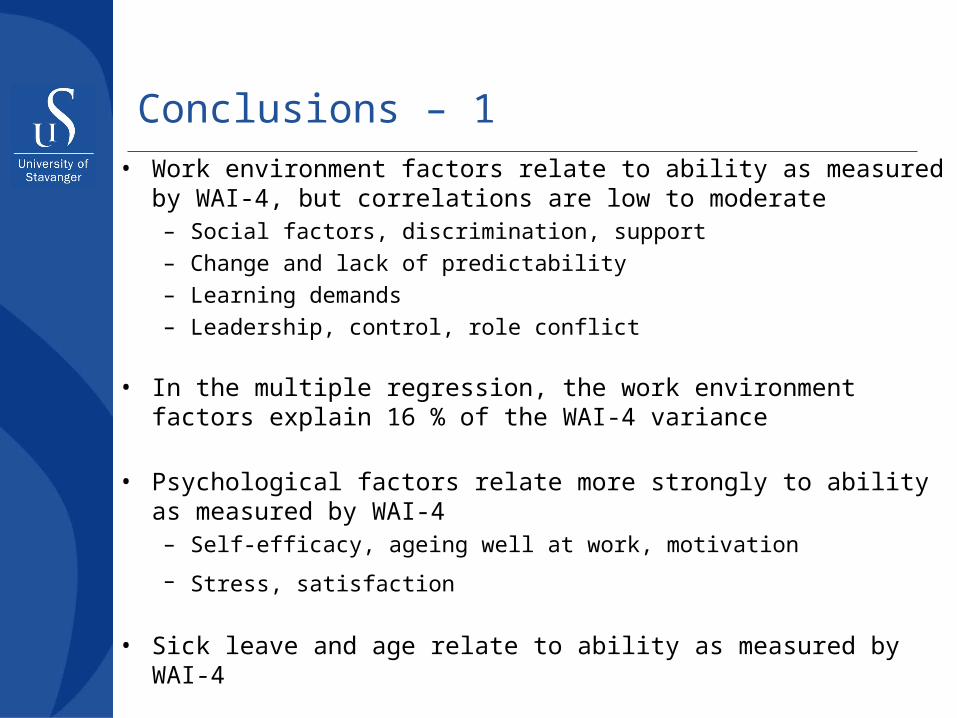
Conclusions – 1• Work environment factors relate to ability as measured by
WAI-4, but correlations are low to moderate– Social factors, discrimination, support– Change and lack of predictability– Learning demands– Leadership, control, role conflict
• In the multiple regression, the work environment factors explain 16 % of the WAI-4 variance
• Psychological factors relate more strongly to ability as measured by WAI-4– Self-efficacy, ageing well at work, motivation
– Stress, satisfaction
• Sick leave and age relate to ability as measured by WAI-4
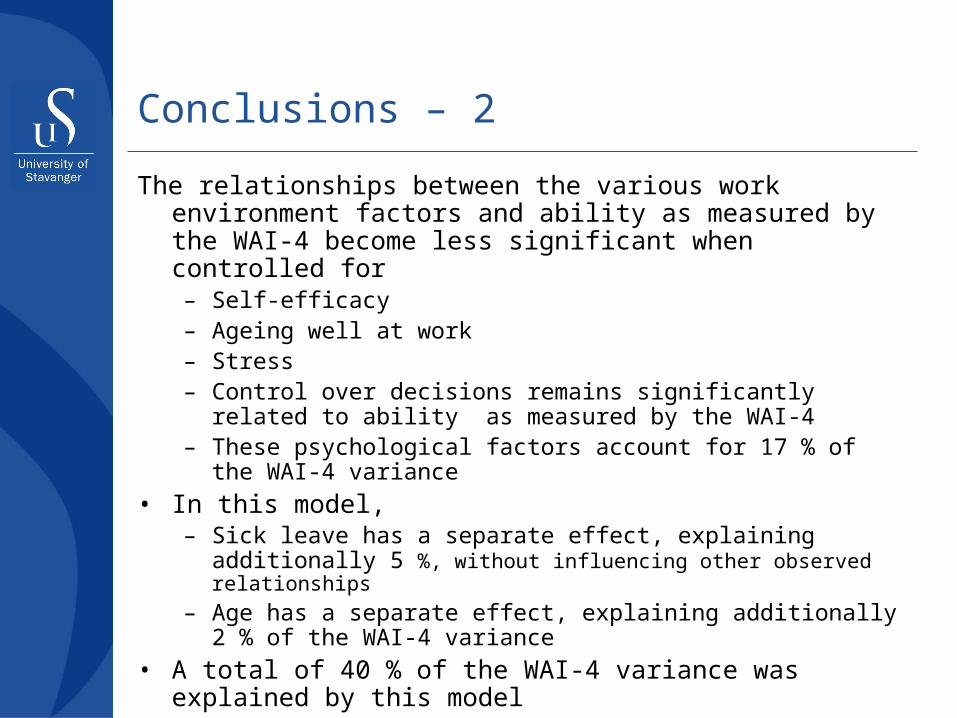
Conclusions – 2
The relationships between the various work environment factors and ability as measured by the WAI-4 become less significant when controlled for– Self-efficacy– Ageing well at work– Stress– Control over decisions remains significantly related to
ability as measured by the WAI-4 – These psychological factors account for 17 % of the WAI-
4 variance• In this model,
– Sick leave has a separate effect, explaining additionally 5 %, without influencing other observed relationships
– Age has a separate effect, explaining additionally 2 % of the WAI-4 variance
• A total of 40 % of the WAI-4 variance was explained by this model
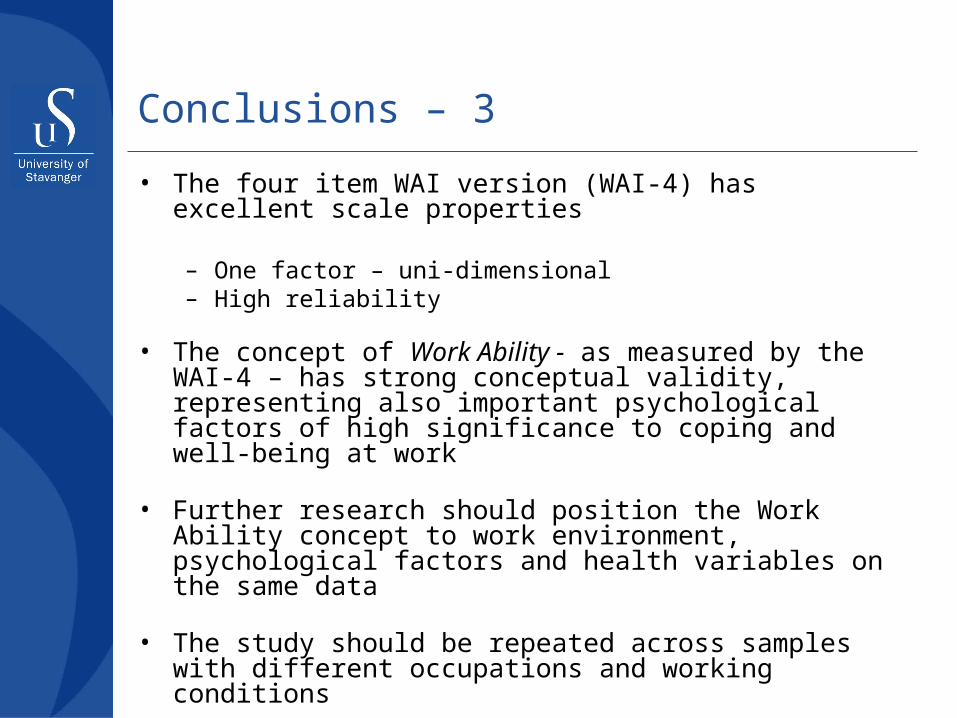
Conclusions – 3
• The four item WAI version (WAI-4) has excellent scale properties
– One factor – uni-dimensional– High reliability
• The concept of Work Ability - as measured by the WAI-4 – has strong conceptual validity, representing also important psychological factors of high significance to coping and well-being at work
• Further research should position the Work Ability concept to work environment, psychological factors and health variables on the same data
• The study should be repeated across samples with different occupations and working conditions

Thank you – questions and comments, please
Reidar J. Mykletun
University of Stavanger4036 Stavanger, Norway
Email to [email protected]