Embed Size (px)
Citation preview
1
AcknowledgementsThis report was produced by Jack Noone, Martin Mackey and Philip Bohle of the Ageing, Work and Health Research Unit, University of Sydney under commission from Safe Work Australia.
We acknowledge the previous unpublished research of Chris McLoughlin and Philip Taylor of Monash University that informed the writing of this report.
Disclaimer The information provided in this document can only assist you in the most general way. This document does not replace any statutory requirements under any relevant state and territory legislation. Safe Work Australia is not liable for any loss resulting from any action taken or reliance made by you on the information or material contained on this document. Before relying on the material, users should carefully make their own assessment as to its accuracy, currency, completeness and relevance for their purposes, and should obtain any appropriate professional advice relevant to their particular circumstances. The views in this report should not be taken to represent the views of Safe Work Australia unless otherwise expressly stated.
Creative Commons With the exception of the Safe Work Australia logo, this report is licensed by Safe Work Australia under a Creative Commons 3.0 Australia Licence. To view a copy of this licence, visit http://creativecommons.org/licenses/by/3.0/au/deed.en In essence, you are free to copy, communicate and adapt the work, as long as you attribute the work to Safe Work Australia and abide by the other licensing terms.
Suggested citation Noone, J. H., Mackey, M.G., & Bohle, P. (2014). Work ability in Australia – pilot study: A report to Safe Work Australia. Canberra: Safe Work Australia.
Enquiries regarding the licence and any use of the report are welcome at: Copyright Officer Safe Work Australia GPO Box 641 Canberra ACT 2601 Email: [email protected] ISBN 978-1-74361-813-4 [PDF] ISBN 978-1-74361-814-1 [DOCX]
Table of Content
2

sACKNOWLEDGEMENTS....................................................................................................................................... 2
FIGURES.............................................................................................................................................................. 6
TABLES................................................................................................................................................................. 7
EXECUTIVE SUMMARY........................................................................................................................................ 8
CONTEXT....................................................................................................................................................................8FINDINGS....................................................................................................................................................................8APPROACH..................................................................................................................................................................9
INTRODUCTION................................................................................................................................................. 10
REPORT STRUCTURE.......................................................................................................................................... 10
BACKGROUND.................................................................................................................................................. 11
CORRELATES OF WORK ABILITY......................................................................................................................... 12
WORK ABILITY AND AGE..............................................................................................................................................12WORK ABILITY, WORK-RELATED HEALTH ISSUES AND AGE...................................................................................................13WORK ABILITY AND WORKPLACE INDICATORS...................................................................................................................13WORK ABILITY AND SOCIOECONOMIC STATUS..................................................................................................................14WORK ABILITY AND DEMOGRAPHIC INDICATORS...............................................................................................................15SUMMARY................................................................................................................................................................15THE MEASUREMENT OF WORK ABILITY............................................................................................................................15
METHODOLOGY................................................................................................................................................ 16
PARTICIPANTS AND PROCEDURES...................................................................................................................................16MEASURES................................................................................................................................................................19
Work ability as measured by the WAS...............................................................................................................19Work ability as measured by the WAI...............................................................................................................20Factors related to productivity..........................................................................................................................20Work-related injuries and illnesses (health issues)............................................................................................21Workplace variables..........................................................................................................................................21Socioeconomic status........................................................................................................................................22Demographic variables......................................................................................................................................22
ANALYSIS..................................................................................................................................................................23The correlates of work ability............................................................................................................................23Work ability and factors related to productivity................................................................................................23Workers with low work ability...........................................................................................................................24
STUDY RESULTS................................................................................................................................................. 24
SAMPLE REPRESENTATIVENESS......................................................................................................................................24Age, gender and education...............................................................................................................................24Occupation........................................................................................................................................................25Industry.............................................................................................................................................................27
3
Summary...........................................................................................................................................................29WORK ABILITY SCORES.................................................................................................................................................29AGE-RELATED TRENDS IN WORK ABILITY..........................................................................................................................31
Overall work ability...........................................................................................................................................31Organisational capacity.....................................................................................................................................31Personal capacity..............................................................................................................................................32Summary...........................................................................................................................................................33
AGE AND OCCUPATIONAL TRENDS IN WORK-RELATED HEALTH ISSUES....................................................................................34Prevalence of work-related health issues..........................................................................................................34Age-based differences in prevalence of work-related health issues...................................................................34Occupation-based differences in prevalence of work-related health issues.......................................................34
TYPES OF WORK-RELATED HEALTH ISSUES........................................................................................................................35Age-based differences in type of health issues..................................................................................................36Occupation-based differences in type of health issue........................................................................................36
MECHANISMS FOR WORK-RELATED ILLNESSES AND INJURIES................................................................................................37Age-based differences in self-reported mechanisms.........................................................................................37Occupation-based differences in self-reported mechanisms..............................................................................37Summary...........................................................................................................................................................38
CORRELATES OF WORK ABILITY......................................................................................................................................38Work-related health issues................................................................................................................................38Organisational capacity.....................................................................................................................................38Personal capacity..............................................................................................................................................39Summary...........................................................................................................................................................41
EMPLOYMENT VARIABLES.............................................................................................................................................41Organisational capacity.....................................................................................................................................41Personal capacity..............................................................................................................................................43Summary...........................................................................................................................................................44
SOCIOECONOMIC STATUS.............................................................................................................................................44Organisational capacity.....................................................................................................................................44Personal capacity..............................................................................................................................................45Summary...........................................................................................................................................................45
DEMOGRAPHIC VARIABLES............................................................................................................................................46Organisational capacity.....................................................................................................................................46Personal capacity..............................................................................................................................................46Summary...........................................................................................................................................................47
OCCUPATION-BASED DIFFERENCES IN THE CORRELATES OF WORK ABILITY..............................................................................47Organisational capacity.....................................................................................................................................47Personal capacity..............................................................................................................................................48Summary...........................................................................................................................................................48
AGE-BASED DIFFERENCES IN THE CORRELATES OF WORK ABILITY...........................................................................................48Organisational capacity.....................................................................................................................................48Personal capacity..............................................................................................................................................48Summary...........................................................................................................................................................48
WORK ABILITY AND FACTORS RELATED TO PRODUCTIVITY...................................................................................................49Job satisfaction..................................................................................................................................................49Regression analysis – full sample......................................................................................................................50
4
Regression analysis – restricted sample............................................................................................................51Job satisfaction and the subscales of work ability.............................................................................................51Summary...........................................................................................................................................................52
INTENTION TO BE WORKING IN CURRENT JOB IN TWO YEARS’ TIME.......................................................................................53Regression analysis – full sample......................................................................................................................53Regression analysis – restricted sample............................................................................................................54Intention to remain in job and the subscales of work ability.............................................................................54Summary...........................................................................................................................................................54
EFFECT OF WORK-RELATED HEALTH ISSUES ON CAPACITY TO WORK.......................................................................................55Regression analysis – restricted sample............................................................................................................56Health effects on work and the subscales of work ability..................................................................................56Summary...........................................................................................................................................................57
ABSENCE FROM WORK................................................................................................................................................57Summary...........................................................................................................................................................57
PARTICIPANTS WITH LOW WORK ABILITY SCORES...............................................................................................................58Predictors of low organisational capacity..........................................................................................................58Predictors of low personal capacity...................................................................................................................59Predictors of low overall work ability................................................................................................................59Summary...........................................................................................................................................................59
LOW OVERALL WORK ABILITY AND FACTORS RELATED TO PRODUCTIVITY................................................................................59Job satisfaction..................................................................................................................................................59Intention to remain in the same job..................................................................................................................60The effects of health on capacity to work..........................................................................................................61Absence from work............................................................................................................................................61Summary...........................................................................................................................................................61
EVALUATION OF THE WAS...........................................................................................................................................62Scale reliability..................................................................................................................................................62Scale validity......................................................................................................................................................62Face validity of the WAS....................................................................................................................................63Factorial validity of the WAS.............................................................................................................................63Convergent validity: Comparing the WAS to the WAI........................................................................................63Criterion validity: WAS, WAI and productivity variables....................................................................................64Distributional properties of the WAS compared to the WAI..............................................................................65General comments on the WAS.........................................................................................................................66Summary of the strengths and weaknesses for the WAI and the WAS..............................................................67WAI – Strengths.................................................................................................................................................67WAI - Limitations...............................................................................................................................................67WAS - Strengths.................................................................................................................................................67WAS – Limitations.............................................................................................................................................67Recommendations for refinement of the WAS..................................................................................................67Summary...........................................................................................................................................................68
DISCUSSION AND IMPLICATIONS....................................................................................................................... 69
WORK ABILITY AND FACTORS RELATED TO PRODUCTIVITY...................................................................................................71AGE AND WORK ABILITY...............................................................................................................................................72WORK-RELATED HEALTH ISSUES.....................................................................................................................................73
5
SOCIOECONOMIC AND DEMOGRAPHIC FACTORS................................................................................................................73WORKPLACE INDICATORS.............................................................................................................................................74MENTAL AND PHYSICAL JOB DEMANDS...........................................................................................................................74PARTICIPANTS WITH LOW WORK ABILITY.........................................................................................................................74STUDY LIMITATIONS....................................................................................................................................................75FUTURE RESEARCH ON WORK ABILITY.............................................................................................................................75CONCLUDING COMMENTS............................................................................................................................................76
REFERENCES...................................................................................................................................................... 78
Figures FIGURE 1. AGE DISTRIBUTION OF WORKERS ACCORDING TO THE 2011 CENSUS AND SAFE WORK DATA..........................................25FIGURE 2. DISTRIBUTION OF OCCUPATIONAL CATEGORIES ACCORDING TO AGE FOR THE 2011 CENSUS AND SAFE WORK SAMPLE........26 FIGURE 3. DISTRIBUTION OF INDUSTRY CATEGORIES FOR THE 2011 CENSUS AND SAFE WORK SAMPLE..........................................28FIGURE 4. DISTRIBUTION OF ORGANISATIONAL CAPACITY SCORES.............................................................................................29FIGURE 5. DISTRIBUTION OF PERSONAL CAPACITY SCORES.......................................................................................................30FIGURE 6. DISTRIBUTION OF OVER ALL WORK ABILITY SCORES..................................................................................................30FIGURE 7. AGE RELATED TRENDS IN WORK ABILITY AS MEASURED BY PERSONAL AND ORGANISATIONAL CAPACITY..............................31FIGURE 8. AGE-RELATED TRENDS IN ORGANISATIONAL CAPACITY AND ASSOCIATED SUB-SCALES......................................................32FIGURE 9. AGE-RELATED TRENDS IN PERSONAL CAPACITY AND ASSOCIATED SUB-SCALES...............................................................33FIGURE 10. PREVALENCE OF WORK-RELATED HEALTH ISSUES ACCORDING TO OCCUPATIONAL CATEGORY..........................................35FIGURE 11. DISTRIBUTION OF WORK-RELATED INJURIES AND ILLNESSES.....................................................................................35FIGURE 12. PREVALENCE OF TOP FIVE INJURIES AND ILLNESSES ACCORDING TO OCCUPATION.........................................................36FIGURE 13. MECHANISMS OF INJURY AND ILLNESS ACCORDING TO OCCUPATION.........................................................................37FIGURE 14. MEAN PERSONAL CAPACITY SCORES ACCORDING TO THE NUMBER OF WORK-RELATED HEALTH ISSUES.............................40FIGURE 15. ORGANISATIONAL CAPACITY ACCORDING TO EMPLOYMENT VARIABLES......................................................................42FIGURE 16. MEAN PERSONAL CAPACITY SCORES ACCORDING TO EMPLOYMENT VARIABLES............................................................43FIGURE 17. ORGANISATIONAL CAPACITY ACCORDING TO OCCUPATION......................................................................................44FIGURE 18. LEVELS OF JOB SATISFACTION ACCORDING TO PERSONAL AND ORGANISATIONAL CAPACITY............................................50FIGURE 19. INTENTION TO BE WORKING IN CURRENT JOB TWO YEARS FROM NOW......................................................................53FIGURE 20. EFFECTS OF HEALTH ISSUES ON ABILITY TO WORK.................................................................................................56FIGURE 21. JOB SATISFACTION FOR PARTICIPANTS CATEGORISED AS HAVING LOW WORK ABILITY....................................................60FIGURE 22. INTENTION TO REMAIN IN THE JOB FOR PARTICIPANTS CATEGORISED AS HAVING LOW WORK ABILITY..............................60FIGURE 23. THE EFFECT OF HEALTH ISSUES ON CAPACITY TO WORK FOR PARTICIPANTS CATEGORISED AS HAVING LOW WORK ABILITY....61FIGURE 24. DISTRIBUTION OF WAS AND WAI SCORES..........................................................................................................66
6
TABLES
TABLE 1. DETAILED RESPONSE RATES AND TOTAL CONTACTS OF CATI SURVEY............................................................................18TABLE 2. SUBSCALES AND EXAMPLE ITEMS USED TO CONSTRUCT THE WORK ABILITY MEASURES..................................................20TABLE 3. FINANCIAL ADVERSITY ITEMS...............................................................................................................................22TABLE 4. BIVARIATE CORRELATIONS BETWEEN WORK ABILITY, PRESENCE OF WORK-RELATED HEALTH ISSUE, TYPE OF HEALTH ISSUE AND
SELF-PERCEIVED CAUSE...........................................................................................................................................39TABLE 5. PEARSON’S CORRELATIONS BETWEEN THE WAS AND WAI VARIABLES........................................................................64TABLE 6. SUMMARY OF WAI STRENGTHS AND WEAKNESSES..................................................................................................67TABLE 7. SUMMARY OF WAS STRENGTHS AND WEAKNESSES.................................................................................................67TABLE 8. SUMMARY OF MAJOR FINDINGS AND IMPLICATIONS FOR INTERVENTION STUDIES..........................................................69
7
Executive Summary
Context
Population ageing is expected to place a significant economic burden on Australia’s social security system, particularly Medicare and the Age Pension. In response, policies are being developed to promote increased labour force participation by older Australians (45+). Northern European research has shown that work ability, or workers’ capacity to meet the demands of their jobs, is an important component of sustained employability. Work ability includes the health and functional capacity of workers, their values and attitudes, family life and community, the external environment, work conditions and the work environment. Research in Finland and the EU has focussed on the health and functional capacity of the individual worker.
This pilot study expanded this focus to include some aspects of work conditions and the work environment. Work ability is relatively understudied in Australia. This study aims to better understand work ability and strategies to promote it in Australia. This was achieved by:
1. examining the relationships between work ability and factors related to productivity2. examining the relationships between work ability and health, work characteristics,
socioeconomic status and demographics, and3. evaluating the suitability of a new work ability assessment tool (the Work Ability Survey –
WAS) described in previous research1 for use by work health and safety consultants, regulators and business.
Findings
Overall work ability did not differ with age, even though some of the work ability sub-scales showed age-related variation. This finding suggests that pilot intervention studies could be usefully directed at all age groups, but tailored to their particular needs. For example, a focus on the autonomy and psychological health of younger workers and the physical health of older workers may be warranted. Younger workers in larger organisations were also at risk of low organisational capacity, identifying them as a further target group.
Workers with high mental demands at work tended to report low work ability regardless of occupation and other work-related factors. These findings in conjunction with the age-based results above suggest that work ability interventions should focus on both psychological and physical health as well as monitoring worker demands and intervening where appropriate.
Occupational contexts should also be considered. Blue-collar workers reported poorer work ability compared to other occupational groups, and should be considered a high priority for intervention. However, the findings also indicated that promoting the organisational capacity (i.e. the psychosocial work environment) of white-collar workers
1 McLoughlin and Taylor (unpublished research). McLoughlin, C., Taylor, P., & Bohle, P. (2011). Promoting Worker Resilience Over the Lifecourse. In B. Resnick, L. Gwyther & K. Roberto (Eds.), Resilience in Aging (pp. 121-132). London: Springer.
8
might be particularly beneficial for their job satisfaction. It is important to note that these relationships were not strong enough to preclude a cross-sector approach to promoting work ability. Like age, individuals across all occupations may benefit from the promotion of work ability.
In line with wider evidence on public health, workers in poorer socioeconomic circumstances tended to report low personal capacity, even after accounting for differences in occupation, job demands, and other employment characteristics.
The evaluation of the WAS provided support for its use in potential future pilot intervention research. The WAS showed good alignment with contemporary work ability theory, providing better guidance and opportunities for detailed evaluation compared to the existing European measure. The new measure also showed a more favourable distribution of responses than the European Work Ability Index suggesting that the WAS would be better able to identify changes as a result of interventions.
Based on the findings above potential strategies for promoting work ability include:
the promotion of enhanced psychosocial work environments, particularly worker autonomy
promotion of both psychological and physical health, and monitoring and developing ways to reduce potentially harmful job demands.
This national study of work ability provides support for the use of the WAS and identified various potential targets and strategies for intervention. However, it is important to note that many of the relationships identified were relatively weak. This means that while potential target groups and strategies for pilot interventions can be suggested, future studies should be more inclusive and cross-sectoral.
Approach
The current research is based on a national survey of 3 203 Australian workers aged 18 to 83, selected at random from telephone directories and purchased lists. Data were collected using telephone interview techniques with a response rate of approximately 10%. The primary measure of work ability was the WAS which includes items pertaining to an individual’s personal capacity (e.g. their health and work attitudes) and their organisational capacity (e.g. their psychosocial work environment).
The principal limitation of this pilot study is the low response rate (10%), which appears to be largely attributable to the length of the telephone interview (greater than 30 minutes). Younger workers, males, and lower socioeconomic groups were also under-represented, suggesting that the sample is not fully representative of the working population. As well, those in the poorest health are likely to have already left the workforce and are therefore not included in the current research. The cross sectional nature of this study precludes discussion about the causes and effects of work ability.
9
IntroductionAustralia’s population is ageing in line with many other Western and non-western nations. By 2056 it is expected that 25% of Australia’s population will be over the age of 65 compared to 13% in 2006 (Australian Bureau of Statistics, 2013). Population ageing is expected to result in significant social and economic change, elements of which are clearly positive (e.g. a highly experienced workforce) as well as challenging (e.g. greater spending on social security and Medicare). Australia’s main political strategy for managing the ageing population has been to promote the labour force participation of “mature-aged” workers (aged 45 and over). For example, eligibility for the Age Pension is set to rise from 65 to 67 by 2023. Related strategies include the promotion of older workers’ skills and job seeking capabilities, formalising care givers’ right to request flexible working conditions, and steps to reduce age discrimination in the workplace such as the provision of financial incentives to employ older workers (Swan & Butler, 2012). Finally, strategies such as the Healthy Worker Initiative (Department of Health, 2013) have been developed to promote the physical health of Australia’s workforce and people’s resultant ability to work for as long as they need or want. Understanding the “work ability” (Ilmarinen et al., 2005) of Australia’s labour force is therefore of particular importance for individuals, in terms of promoting personal capacity to work, and for the government, in terms of fostering economic productivity. However, for work ability to be effectively and efficiently promoted, research is needed with respect to the measurement of work ability and identifying target groups and strategies for informing work ability intervention programs.
The aims of the current research are:
1 to examine and better understand the health, socioeconomic, demographic, and workplace correlates of work ability
2 to quantify the relationships between work ability and factors related to productivity, including intention to leave current job and job satisfaction
3 to evaluate a new work ability assessment tool for use in organisations and survey research, and
4 to inform future research regarding strategies to enhance work ability and potential target populations for intervention to improve health and employment outcomes.
Report structureThe first section in this report provides a review of the research literature on work ability. The background section describes the relationships between work ability and employment and productivity outcomes, providing the rationale for a national study of work ability. This sub-section concludes with a description of the existing validated assessment tool for measuring work ability—the Work ability Index (WAI). The review then examines the health, socioeconomic, demographic and workplace factors that are argued to influence work ability. The introductory section ends with a summary of the critical research into the measurement of work ability.
10

The methods section of this report describes the procedures and assessment tools used to meet the aims of the current research. This includes a description of the participants, the methods used for gathering the data, a description of the survey measures, and an outline of the statistical analyses undertaken.
The results are divided into seven subsections examining:
1 the sample’s representativeness compared to the working population2 work ability summary scores3 age-related trends in work ability4 age and occupational trends in work-related health issues5 the relationships between the new measure of work ability and its health-based,
socioeconomic, demographic and workplace correlates6 the associations between work ability and factors related to productivity including
job satisfaction and intention to remain in one’s current job7 the factors which differentiate workers with low work ability from those who are
more advantaged, and8 the reliability and validity of the WAS.
The discussion section outlines the next steps for translating the study findings into recommendations for policy and practice through further research, including pilot intervention studies.
BackgroundThe original work ability construct, defined as a “worker’s capacity to do their work with respect to the work demands and their health and mental resources” (Ilmarinen & Tuomi, 1992, p. 8), is correlated with increased productivity at work and participation in the labour market. For example, Salonen et al. (2003) found that poor work ability scores at baseline were associated with early retirement 11 years later. Ilmarinen and colleagues showed that a third of workers aged over 51 who were originally classified as “low work ability” had become disabled at the four year follow-up (Ilmarinen et al., 1991). After 11 years, approximately 62% of the original low work ability participants had retired on a disability pension, 12% had passed away and only 2% remained working full-time (Ilmarinen & Rantanen, 1999; Tuomi, Ilmarinen, Martikainen, Aalto, & Klockars, 1997).
More recent research has shown that work ability also predicts the length of time spent on sick leave (Ahlstrom, Grimby-Ekman, Hagberg, & Dellve, 2010; see also Reiso, Nygård, Brage, Gulbrandsen, & Tellnes, 2001) and levels of productivity (Tuomi, Huuhtanen, Nykyri, & Ilmarinen, 2001; van den Berg et al., 2011). In their study of 10 500 Dutch workers, van den Berg et al. (2011) found that those with lower self-reported productivity reported significantly lower levels of work ability than relatively higher productivity workers. Finally, research suggests that increasing work ability is associated with greater commitment to the organisation and job satisfaction (McLoughlin et al., 2011; Taskila et al., 2007), two factors which predict employee productivity and turnover (Harter, Schmidt, & Hayes, 2002).
11
Work ability is argued to be a function of many factors including the psychosocial characteristics of the organisation, the external environment, family demands, attitudes and motivation, and an individual’s health and functional capacity (Gould, Ilmarinen, Jarvisalo, & Koskinen, 2008). The primary validated tool for assessing work ability is the WAI. This measure comprises seven subscales assessing physical health (e.g. presence of disease or injury), psychological health or “mental resources”, and subjective perceptions of work ability compared to life time best and compared to the mental and physical demands of the job. Participants are also asked the likelihood that they will be in their current position in two years’ time. However, the WAI’s focus on health is at the expense of the other components of the work ability construct including characteristics of the organisation and workers’ motivations. This discrepancy and the WAI’s established ceiling effects have led to the development of an alternative tool for assessing work ability (McLoughlin et al., 2011), one which encompasses Ilmarinen et al’s (2005) comprehensive conceptualisation. In this report, the newly developed Work Ability Survey (WAS) and the WAI are both examined in relation to previously studied correlates of work ability with the goal of developing a better understanding of how work ability can be most effectively measured and promoted. This information informs recommendations for the development and testing of intervention programs for improving work ability outcomes.
Correlates of work ability
Work ability and age
As workers age, their physical health tends to decrease as evidenced by higher prevalence of chronic disease and reductions in functional capacity (Ilmarinen & Rantanen, 1999; see Mackey, 2013, for a review). Due to the importance of functional capacity in shaping work ability, it is not surprising that work ability also tends to decrease with age. However the relationship between age and work ability is typically weak (e.g., Kloimüller, Karazman, Geissler, Karazman-Morawetz, & Haupt, 2000) and exceptions are apparent. Van den Berg, Elders, de Zwart and Burdorf’s (2009) literature review showed that of the seven studies examining age differences in work ability, four identified a decrease with age, two revealed no age differences and one found that work ability increased with age for health care shift workers (Fischer et al., 2006). Small but significant differences were found in a study (N=1,624) of NSW and Queensland miners (Parker et al., 2006). These authors showed that average work ability scores2 ranged from approximately 44 for younger miners (20-29) to 40.5 for miners aged 50-59. In their study of Finnish female home care workers, Pohjonen (2001) reported a work ability score of 40.3 (SD=4.9) for the youngest workers (19-34) compared to 33 (SD=9.6) for the oldest workers (55-62, p<.001). Monteiro, Ilmarinen, & Filho’s study (2006) of Brazilian public health workers found smaller relationships across similar age groups for females but no differences for males. There are a number of possible reasons for inconsistencies in the research findings. Firstly, the research takes place over numerous countries, each with their own set of political and social contexts. Second, the research occurs across a wide array of occupational settings with differing mental and physical demands. For instance, manual occupations (e.g. labouring) tend to have higher physical rather mental demands, whereas in more sedentary roles the demands 2 Work ability scores range from 7 to 49.
12
are predominantly mental (Schreuder, Roelen, Koopmans, & Groothoff, 2008). Thus due to declining functional capacity, it is likely that age may have a greater effect on the work ability of manual rather than non-manual workers. Finally, older and younger workers are not homogenous groups. Sluiter (2006) argues that job demands tend to overtax the capacities of older workers when the demands are high, but acknowledges that the effects of age on work ability vary considerably within age groups. For example, the standard deviations presented in Pohjonen’s (2001) study show that the work ability of older workers (SD=9.6) varies considerably compared to the youngest group (SD=4.9) with similar findings reported in Parker et al.’s 2006 study of Australian miners.
This report on the work ability of the Australian workforce examines the issues of occupational contexts and homogeneity across age groups. This is achieved by performing analyses separately for those working in blue-collar, intermediate and white-collar occupations and for older and younger workers. These cross-group analyses allow differential relationships between work ability and its correlates to be identified. Understanding the factors which are associated with work ability can also help to identify at-risk groups as well as avenues for promoting workers’ capacity to perform their duties. The correlates of work ability examined in this report fall into four groups: work-related injury and illness; socioeconomic status (e.g. education, financial stability, occupation); demographics (e.g. age, gender, marital status); and employment related factors (e.g. working hours, the size of the organisation, contract type).
Work ability, work-related health issues and age
Work ability has been shown to be lower for workers reporting a work-related health issue (Parker et al., 2006). However, research has generally not examined the relationships between work ability and different types of health issues, such as injuries from falls, musculoskeletal disorders, mental stress, or occupational diseases. It is important to understand these relationships as workplace injuries and diseases are differentially reported by workers of different ages (Ilmarinen, 1999; Kemmlert & Lundholm, 2001). Although research indicates that the incidence of workplace incidents and occupational diseases tends to increase with age (for a review see Turner, Franklin, & Turk, 2000), other studies suggests that older workers are more likely to report falls (Kemmlert & Lundholm, 2001), injuries from exposure to vibration (Molinie, 2003), and occupational diseases with long latencies, such as cancers (Ilmarinen, 1999). However, Zuhosky et al. (2007) have argued that although injured older workers tend to stay out of the workforce for longer than younger workers, there are only small age differences in the incidence of work-related injuries. This proposition is echoed in Bennington and Tharenou’s (1996) review. They argue that age based differences in avoidable incidents are only apparent for men and that the sharp rise in the incidence and costs of injury after the age of 50 are not apparent in Australian data. Therefore, further research would be required to closely examine the relationships between injury or illness and work ability across age groups.
Work ability and workplace indicators
Research suggests that when mental and physical demands are high, work ability tends to be lower (Pranjić et al., 2006; Sjögren-Rönkä, Ojanen, Leskinen, Mustalampi, & Mälkiä, 2002;
13
Tuomi, Eskelinen, et al., 1991), but these findings are not consistent across all studies (e.g., Fischer et al., 2006; Pohjonen, 2001). Sjögren-Rönkä et al. (2002) found that workers reporting higher levels of mental stress tended to report poorer work ability after controlling for physical health symptoms. However, the effect was weak with mental stress explaining less than 3% of the variance in work ability scores.
Non-standard working hours (e.g. shift, weekend, night and irregular work) are known to be associated with poorer health outcomes (Bohle et al., 2009). However, only limited research has examined the relationship between non-standard work conditions and work ability. One study (Camerino et al., 2008) found nurses working only night shifts reported significantly lower WAI scores than nurses working in other conditions including days only and day and night shifts. However, Costa (2005a) has argued that performing night rather than day shifts is associated with lower WAI across work sectors (see also Fischer et al., 2006; Tuomi, Eskelinen, et al., 1991). Costa (2005) also notes that a decrease in the WAI score associated with shift working conditions is particularly apparent for older workers. However, he also identifies healthy worker and seniority effects that complicate the interpretation of the results. For instance, workers in more senior positions tend to do less shift work (Garbarino et al., 2002) while older workers who do remain in the workforce tend to be healthier than those who exit (Li & Sung, 1999).
Although limited research has examined the relationship between the size of the organisation and work ability, the psychosocial workforce characteristics within the organisation have been consistently linked to work ability scores. For instance, participants who report high work ability tend to have autonomy at work, good relationships with their supervisors and managers (Lindberg et al., 2006; Pohjonen, 2001; Tuomi et al., 2001), access to training and other opportunities to develop their career (Tuomi, Eskelinen, et al., 1991; Tuomi et al., 2001), and more supportive co-workers (Taskila et al., 2007). Pohjeonen’s cross-sectional study (2001) showed that home care workers tended to report lower work ability if they perceived that their supervisors did not have a good attitude towards their workers and were perceived to be unhelpful and non-supportive.
Work ability and socioeconomic status
Socioeconomic status is relatively understudied in the work ability literature and does not explicitly feature in the multi-dimensional conceptualisation of work ability (Gould, Ilmarinen, Järvisalo, & Koskinen, 2008; Ilmarinen et al., 2005). However, studies do suggest that those with limited access to social and economic resources, as reflected through the proxies of education, occupation and income, tend to report poorer work ability (Fischer et al., 2006; Monteiro et al., 2006; Pohjonen, 2001; Taskila et al., 2007; Tuomi, Vanhala, Nykyri, & Janhonen, 2004). Martimo, Varonen, Husman, and Viikari-Juntura (2007) showed that blue-collar workers with a health issue rated their work ability more poorly than other workers attending an occupational health centre. One study of 4,000 municipal workers across 13 occupational groups found that low work ability was most present in physically demanding working conditions for both men and women and in roles with a combination of demands, but only for men (Tuomi, Ilmarinen, et al., 1991).
14
The relationship between occupation and work ability is complex because differences may be due to divergent demands or because of a lack of socioeconomic resources associated with blue-collar positions. This complexity is examined in the current research by examining the inter-relationships between occupation, financial security, job demands and work ability.
Work ability and demographic indicators
Research examining gender differences in work ability research is equivocal. For example, one study (Costa & Sartori, 2007) found that women were more likely than men to report poor-to moderate work ability. However, a literature review by van den Berg et al. (2009) showed no differences in work ability between men and women in the two studies that examined gender differences. Ilamarinen and Toumi’s earlier research (1992) found that the risk of low work ability was higher for women younger than 55 years compared to men of the same age, but was lower for women who were older than 55.
According to the holistic conceptualisation of work ability (Gould, Ilmarinen, Järvisalo, et al., 2008), factors outside the home including family life and social support are important domains of work ability. For instance, Gould et al. 2008 argue that the social support provided by a marital or de facto relationship is important for promoting work ability. However, research into the relationship between marital status is also equivocal. Gould and colleagues (2008) report that married and cohabitating individuals reported poorer work ability than other groups, particularly widows. However, other studies report no effect (Martinez & Latorre, 2006; Taskila et al., 2007; Tuomi, Eskelinen, et al., 1991).
Summary
The work ability literature indicates that workers who have few socioeconomic resources, work non-standard hours, are employed in highly demanding work environments, and work in poor psychosocial environments, tend to report lower work ability. Work ability also tends to decrease with age and for workers who carry an injury or illness. However, the many exceptions to these generalisations and the weak relationships between variables cannot be ignored, particularly in terms of age and different occupational exposures. The current research elucidates some of these discrepancies in the literature by analysing the work ability data separately for older and younger workers and for those working in different occupational contexts. This data will be used to provide information on how the work ability of the Australian workforce may be improved. However, the current research uses an alternative measure of work ability in response to recent criticisms of the WAI.
The measurement of work ability
Scholars have now begun to question the use of the WAI, and particularly its summary score, as a valid and reliable measure of work ability (Bohle, Pitts, & Quinlan, 2010; Martus, Jakob, Rose, Seibt, & Freude, 2010; McLoughlin et al., 2011). For instance, factor analytical studies (Abdolalizadeh et al., 2012; Martus et al., 2010) suggest that it is inappropriate to summate the seven components of the WAI because they measure separate aspects of work ability. Abdolalizadeh et al. (2012) found that the seven subscales formed three factors assessing
15
physical health, mental health and subjective ratings of work ability. This finding suggests that summing the components to form a single WAI score could result in a loss of important information. McLoughlin and colleagues (2011) have also argued that the WAI summary score exhibits strong ceiling effects. That is, the majority of workers report high levels of work ability. Ceiling effects make it difficult to identify improvements in work ability as a result of intervention or over waves of longitudinal data. However, a more pressing concern is the unclear definition of work ability (Bohle et al., 2010), which can be seen in the mismatch between recent multidimensional conceptualisations of work ability (Gould, Ilmarinen, Järvisalo, et al., 2008; Ilmarinen et al., 2005) and the primary tool for measuring work ability, which was developed nearly 20 years earlier.
Work ability is a multidimensional construct. The foundation for work ability is an individual’s health and functional capacity. However, work ability is also a function of workers’ competencies, their values and attitudes, their family life and close community, their external environment, and of particular concern for the current research, aspects of working conditions and work organisation (Ilmarinen et al., 2005). Indeed, working conditions and work organisation themselves influence workers’ health and functional capacity (Bohle et al., 2010). In addition to the physical and mental demands of the job, the literature review above showed that psychosocial conditions at work, including higher levels of autonomy and career support and good worker-management relationships, are associated with greater work ability. However, the WAI does not assess these psychosocial characteristics of the organisation. This is an important discrepancy to explore as interventions designed to improve the organisational environment have been shown to improve health and employment outcomes (Bourbonnais, Brisson, & Vézina, 2011; Lavoie-Tremblay et al., 2005) and have been identified as the site for promoting work ability (Ilmarinen & Rantanen, 1999). There is also limited theoretical research on how factors such as the organisational environment, employment conditions and individual characteristics can influence work ability.
In response to the above concerns, this research draws on an alternative measure of work ability developed by McLoughlin et al. (2011). The work ability survey (WAS) assesses the organisational environment (labelled organisational capacity) as well as an individual’s health, work-family balance, social support and intrinsic and extrinsic motivations to work (labelled personal capacity). This research plays an important role in the development of the WAS as it is the first time it has been used with a national sample across occupational and industry settings. In addition, the regression analyses examine how the correlates of work ability interrelate to explain variation in work ability scores. The associated findings represent the initial stage of theorisation of work ability and its influences, providing the foundation for intervention research.
Methodology
Participants and procedures
The project used computer-aided telephone interviewing (CATI) to survey 3 203 Australian workers. Sampling techniques included a mixture of readily available residential telephone data
16

(White Pages) and a purchased list of Australian residents. A list was purchased to ensure good representation of specific quota groups and also to cost effectively reach population groups who are traditionally difficult to find by telephone (full-time employed, people between the age of 18-24, and single person households). The purchased list was derived from a list of over 2 million Australians (the Acxiom Consumerbase file) which is updated annually for accuracy. It was built from multiple marketing sources, both offline and online. Random selection was generated to a set formula (normally every 3rd or 5th number) and, by adding a postcode selection criterion, a good geographical spread was achieved. Up to five attempts to contact each selected number were made to minimise non-response. Including piloting, data collection took place between April and August 2011 (McLouglin & Taylor, unpublished report).
It was intended that the survey instrument would take approximately 20 minutes to administer. However, in practice this was exceeded, with an average completion time of over 30 minutes. To maximise the response rate a financial incentive was added shortly after the commencement of fieldwork. This strategy overcame the problem to some extent, although the length of the survey instrument continued to have a detrimental effect on the response rate (McLouglin & Taylor, unpublished report).
The response rate was estimated to be 10.3% after removing ineligible responders from the calculation as set out in Table 1. The highest proportion (42%) of the 90000 calls were made to individuals who did not qualify to respond to the survey because they were under the age of 18 or were not currently in employment. These 37 826 people were therefore removed from the response rate calculations. Approximately 21% of the total calls made were to numbers that were either invalid, disconnected, duplicated, connected to fax machines, answered by individuals who did not speak English, or were not answered during the data collection. A further 2% of individuals were omitted who were either not available to participate during the administration period, had demographic characteristics for which quotas had already been achieved, or terminated the interview before completing the survey. Of the 31 144 eligible participants, 27 941 (89.7%) did not want to take part in the survey or terminated the interview before it was completed and 3 203 (10.3%) provided complete responses.
17
Table 1. Detailed response rates and total contacts of CATI survey
Outcome Count %In
elig
ible
resp
onde
rsInvalid number 11 302 19.20%
No contact 5 057 8.59%
Unavailable for duration of campaign 940 1.60%
Duplicate 100 4.63%
No English 2 726 4.63%
Disconnected 244 0.42%
Does not qualify 37 826 64.26%
Fax number 301 5.11%
Quota full 368 0.63%
Sub-total 58 864 100.00%
Elig
ible
re
spon
ders No interest 27 807 89.29%
Survey terminated 134 0.43%
Survey complete 32 03 10.28%
Sub-total 31 114 100.00%
18

Measures
Work ability as measured by the WASAccording to McLoughlin and Taylor (unpublished report) groups of items were selected to form scales that represented concepts in the holistic model of work ability. Efforts were made to ensure all concepts in work ability theory that were appropriate to measure using a self-report survey were covered to maximise face validity. A primary source of items was the previous Australian research study (Redesigning Work for an Ageing Society), which was the basis for the first attempt to measure concepts that linked directly to the holistic model of work ability. This study derived work ability items from the WAI, the Fourth European Working Conditions Survey (European Foundation, 2007), the Copenhagen Psychosocial Questionnaire (COPSOQ, Pejtersen et al, 2010), the Household, Income and Labour Dynamics in Australia Survey (HILDA, Watson and Wooden, 2002) and the SF-36 (Ware et al, 1993), and also tested new items. Other measurement sources included Baker et al, (2007), Carless et al, (2000), Deitch et al, (2003), Goldberg and Williams, (1988), and MacDonald (1998).
Using the current data, McLoughlin and Taylor (Unpublished Report) drew on exploratory and confirmatory factor analytic techniques to select a configuration of items to derive two work ability variables: organisational capacity and personal capacity. The subscales (and example items) used to form the work ability variables are summarised in Table 2.
All 53 items that comprise the WAS were scored on a 1-5 scale with higher scores representing higher levels of the particular construct, excepting the job discrimination variable, which was reverse coded.
As the work ability model is still in development, simple summary scores were created for organisational and personal capacity by averaging item scores to create subscale scores and then averaging subscale scores to form the capacity or work ability variables. This technique ensures that individual items carry equal weight in forming their respective subscale scores and that subscale scores carry equal weighting in forming either organisational or personal capacity scores. Finally, the organisational and personal capacity scores were scaled to have a theoretical range of 0-100 for ease of interpretation. An overall work ability score was calculated by averaging the scores for the two capacity variables.
19

Table 2. Subscales and Example Items Used to Construct the Work Ability Measures.
Organisational capacity Personal capacity
Supervisor communication (2 items)Do you receive all the information you need to do your work well?Supervisor competence (5 items)[My supervisor] gives encouragement and recognition to staff.Career support (3 items)[Does your manager] support your career?Social support (2 items){my supervisor] is willing to listenSocial discrimination (4 items)[Have you experienced] being left out of a social gathering at work?Advancement discrimination (2 items)[Have you experienced] being passed over for promotion?Skill usage (4 items)Can you use your skills and expertise at work?Control over work (4 items)Do you have control over your methods of work?Respect (5 items)Are you treated fairly at your workplace?
Psychological well-being (5 items)Are you able to concentrate on what you are doing?Extrinsic benefits (2 items)[My work] provides sufficient income to enable lifestyle choicesPhysical health (3 items)In general how would you say your health is?Intrinsic benefits (4 items)[My work] provides me with valued statusWork-life balance (2 items)Does work drain so much of your energy that it has a negative effect on your private life?Support from spouse, relatives and friends (4 items)[My spouse, friends, and relatives] are easy to talk withSupport from co-workers (2 items)[My co-workers] are easy to talk with
Work ability as measured by the WAIThree items from the Work Ability Index (Tuomi & Oja, 1998) were used in the current study. The first of these was participants’ self-rating of the work ability compared to their life time best. Responses were scored on a 1-5 scale with higher scores reflecting greater perceived work ability. This work ability measure was analysed alongside organisational and personal capacity for comparative purposes. The other two WAI measures were conceptualised as variables related to productivity as described below.
Factors related to productivity Four variables related to productivity were also measured:
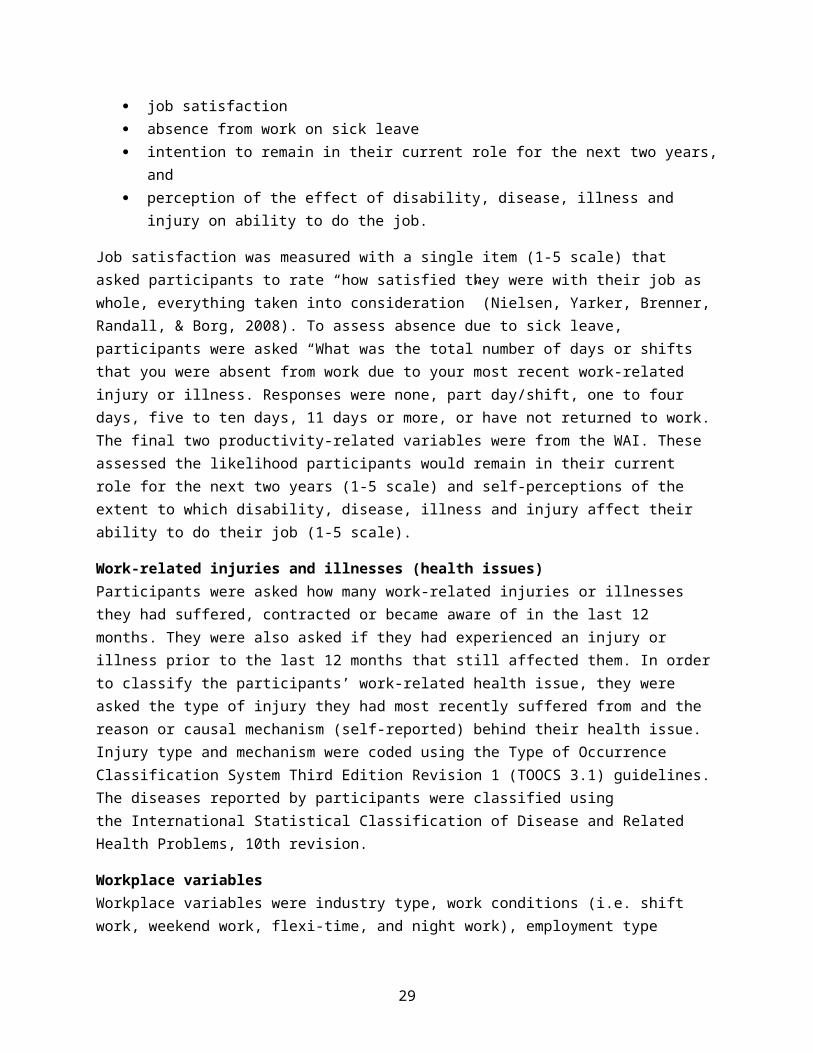
job satisfaction absence from work on sick leave intention to remain in their current role for the next two years, and perception of the effect of disability, disease, illness and injury on ability to do the job.
Job satisfaction was measured with a single item (1-5 scale) that asked participants to rate “how satisfied they were with their job as whole, everything taken into consideration” (Nielsen, Yarker, Brenner, Randall, & Borg, 2008). To assess absence due to sick leave, participants were asked “What was the total number of days or shifts that you were absent from work due to your most
20
recent work-related injury or illness. Responses were none, part day/shift, one to four days, five to ten days, 11 days or more, or have not returned to work. The final two productivity-related variables were from the WAI. These assessed the likelihood participants would remain in their current role for the next two years (1-5 scale) and self-perceptions of the extent to which disability, disease, illness and injury affect their ability to do their job (1-5 scale).
Work-related injuries and illnesses (health issues)Participants were asked how many work-related injuries or illnesses they had suffered, contracted or became aware of in the last 12 months. They were also asked if they had experienced an injury or illness prior to the last 12 months that still affected them. In order to classify the participants’ work-related health issue, they were asked the type of injury they had most recently suffered from and the reason or causal mechanism (self-reported) behind their health issue. Injury type and mechanism were coded using the Type of Occurrence Classification System Third Edition Revision 1 (TOOCS 3.1) guidelines. The diseases reported by participants were classified using the International Statistical Classification of Disease and Related Health Problems, 10th revision.
Workplace variablesWorkplace variables were industry type, work conditions (i.e. shift work, weekend work, flexi-time, and night work), employment type (permanent versus contract or casual worker), the size of the organisation and mental and physical job demands.
Industry type was coded using the Australian and New Zealand Standard Industrial Classification 2006 (ANZSIC) while work conditions were assessed with simple dichotomous yes or no variables (e.g. shift work or no shift work). The same yes/no format was used to determine if participants were employed on a permanent or causal/contract basis. The size of the organisation where participants were employed was assessed with a five-point ordinal variable: one employee, two to five employees, 6-19 employees, 20-199 or more than 200 employees.
The self-rated mental demands of the participants’ jobs were assessed with five items (European Foundation for the Improvement of Living and Working Conditions, 2007). Participants were asked to rate their levels of stress, the time they had to recover from the demands of the job, whether they had to make difficult decisions and the extent to which they worked beyond their mental capacity. Items scores were summed and averaged to form a mental demands variable ranging from 1-5.
Participants’ perceived physical demands were assessed with nine items measuring the physicality of participants’ work (European Foundation for the Improvement of Living and Working Conditions, 2007). Questions assessed the extent to which participants lift or move heavy loads, sit still for long periods of time, stand, walk, work in tired or awkward positions and the extent to which they work beyond their physical capacity. Item scores were summed and averaged to form a physical demands variable ranging from 1-5.
21
Socioeconomic statusThe participants’ education, occupation and self-rated financial adversity were used as proxies for SES in the current research.
Highest educational qualification was measured using a collapsed version of the ABS categories: Completed Year 10 or less, completed up to Year 11 or 12, Certificate (e.g. TAFE, Trade), and graduate diploma or higher.
Occupation was assessed using the Australian and New Zealand Standard Classification of Occupations First Edition (ANZSCO) 1-digit codes. The categories are Managers, Professionals, Technicians and Trades Workers, Community and Personal Service Workers, Clerical and Administrative Workers, Sales Workers, Machinery Operators and Drivers, and Labourers. In regression analysis (described below) small sample sizes for certain occupations required the eight categories to be collapsed into three categories. Managers and Professionals were labelled “white-collar”, Labourers and Machinery Drivers and Operators were labelled “blue-collar” and all other occupations (e.g. Technicians and Trades Workers) were re-categorised as “intermediate” workers. Note that these categories were also used to assess difference in occupational exposures in multiple group analysis.
Levels of self-perceived financial adversity were assessed with five questions scored on a 1-5 Likert scale (see Table 3). Scores for the five variables were summed and averaged such that higher scores reflect greater financial adversity.
Table 3. Financial Adversity Items.
I have money left over at the end of the monthI make just enough money to make ends meetIrregular income makes budgeting difficultMy income makes it difficult to plan for financial commitmentsIt is difficult to pay my bills
Demographic variablesDemographic variables included age, gender, and marital status. The average age for the sample was 43.2 years (SD=12.4), 40.3% were male, and 73.5% were married or living in a de facto relationship.
22
Analysis
In addition to the provision of basic descriptive statistics and bivariate relationships, data were analysed using three sets of linear, ordinal and logistic regressions under the subheadings: the correlates of work ability, work ability and factors related to productivity, and workers with low work ability. There was less than 1% missing data on some of the survey items and these cases were excluded from analyses.
The correlates of work abilityThe first set of (linear) regression analyses were used to identify which factors may be most important for the promotion of work ability and whether these relationships were consistent across different occupational and age groups. Organisational capacity and personal capacity were modelled as dependent variables. The four sets of correlates were entered in a hierarchical fashion to establish the strength of the relationships between work ability and work-related health issues, workplace variables, SES, and demographics respectively. These relationships were then re-assessed for a subsample who reported a work-related health issue (N=853). This analysis allowed for the examination of the relationship between work ability and the type of work-related health issues. Finally, analyses for the full sample were run separately for mature-aged (45+) and younger workers and across the three occupational categories. In cases where the 95% confidence intervals for a particular parameter estimate did not overlap across groups or were overlapping by less than 10%3, it was judged that the strength of the relationship differed significantly across groups (see Payton, Greenstone, & Schenker, 2003 for further discussion). Multiple group analysis was only performed for the full sample, due to restriction in the sample size.
Work ability and factors related to productivity The second set of regressions (ordinal) examined the relationships between work ability and the productivity outcomes and to evaluate which measure of work ability (WAI or WAS) was the best predictor. In these analyses the four productivity variables4 were modelled as dependent variables and organisational capacity and personal capacity were modelled as independent variables. Additional independent variables included physical and mental job demands, work ability as measured by the WAI, age and occupation. Analyses were run separately for a subsample of participants with a work-related health issue and cross-group analyses according to occupation and age were again employed for the full sample. Additionally, the relationships between the subscales of work ability (e.g. autonomy, work-life balance) and the productivity variables were also examined. Although no formal test of statistical significance was used, these analyses were designed to establish which aspects of work ability were most strongly associated with the productivity-related factors.
3 Payton, Greenstone, & Schenker (2003) argue that this test is conservative. Therefore, for the purposes of this report, a small level of overlap (10%) was considered indicative of a between-group difference.4 Productivity variables were job satisfaction, intention to remain in current employment, perceived effect of health issues on capacity to work, and absenteeism due to sick leave.
23
Workers with low work abilityThe final set of regressions was designed to identify which factors distinguished low work ability workers from the rest of the sample and to identify the relationship between low work ability and the productivity variables. In the absence of an established criterion, low organisational capacity and personal capacity were defined as scores falling in the lowest quartile. Workers with low overall work ability were defined as those with low organisational and personal capacity scores. Binary logistic regression was used to examine the relationships between low work ability and age, work-related health issues, SES, demographic indicators and workplace indicators. Chi-Square analysis was then used to compare scores on the productivity outcomes across those with low organisational capacity, personal capacity, and low overall work ability.
Study ResultsThe results section is organised as follows:
4.1 sample representativeness4.2 distribution of work ability scores4.3 age-related trends in work ability4.4 age and occupational trends in work-related health issues4.5 correlates of work ability4.6 work ability and productivity outcomes4.7 low work ability workers, and4.8 evaluation of the WAS.
Sample representativeness
Age, gender and educationFigure 1 shows the distribution of workers’ age according to the 2011 Census and the Safe Work Australia work ability data. These data suggest an over-representation of mid-aged (35-54) workers in the sample and under-representation of 20-34 year-old workers. However, the proportion of workers aged 55 and over in the data was aligned with population estimates.
24
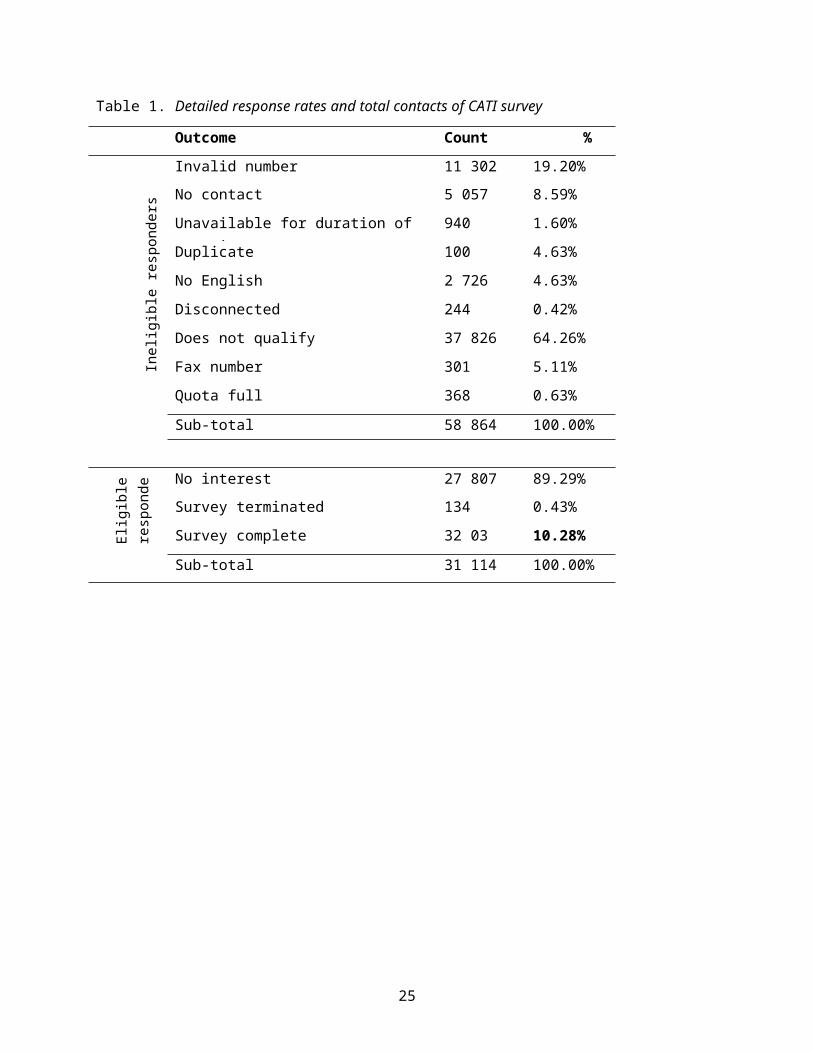
Figure 1. Age distribution of workers according to the 2011 Census and Safe Work data.
Data comparisons also suggest that the sample over represents female workers compared to the population. The 2011 Census data indicates that of Australia’s employed population, 46.7% are female and 53.3% are male. However, these proportions were 59.7% for females and 40.3% for males in the data.
The participants also reported higher levels of high school education compared to the employed population. According to the Census, approximately 64.5% of the working population has a Year 11 or Year 12 high school qualification compared to 74.8% in the sample. Likewise, 35.5% of the working population had only up to Year 10 schooling compared to 25% of the participants.
OccupationFigure 2 shows the distribution of occupations for the employed population (2011 Census) and the sample. The black bars represent the total proportion in each category for all age groups and the coloured bars represent the age-indexed data. The first two sets of columns represent the distribution of Managers in the population and the data respectively. Firstly, comparisons of the first two black bars show that the proportion of Managers in the data is broadly similar to the population, though no formal statistic is used to test for differences. Comparisons of the coloured bars confirm that the sample generally matches the population across the different age groups. However, Figure 2 indicates that Professionals are over-represented in the data, particularly in the three oldest age categories. Conversely, Technicians and Trades Workers appear to be under-represented in the data, particularly for younger workers. The sample characteristics for the five remaining occupational categories were broadly comparable to the population. In particular, the population trend of increased younger workers in Community and Personal Services and Sales positions was matched in the data.
25

Figure 2. Distribution of occupational categories according to age for the 2011 Census and Safe Work sample.
26

IndustryPopulation and sample data on industry
Figure 3) suggests that those working in Health Care and Social Assistance, Education and Training, and Professional, Scientific and Technical Services are over-represented in the sample. In contrast those working in Construction, Manufacturing and Public Administration and Safety are under-represented in the sample. There were insufficient numbers to examine the 13 industry categories by age group. Overall, the data on occupation and industry together suggests participants working in higher socioeconomic occupations and industries are over-represented in the sample.
27
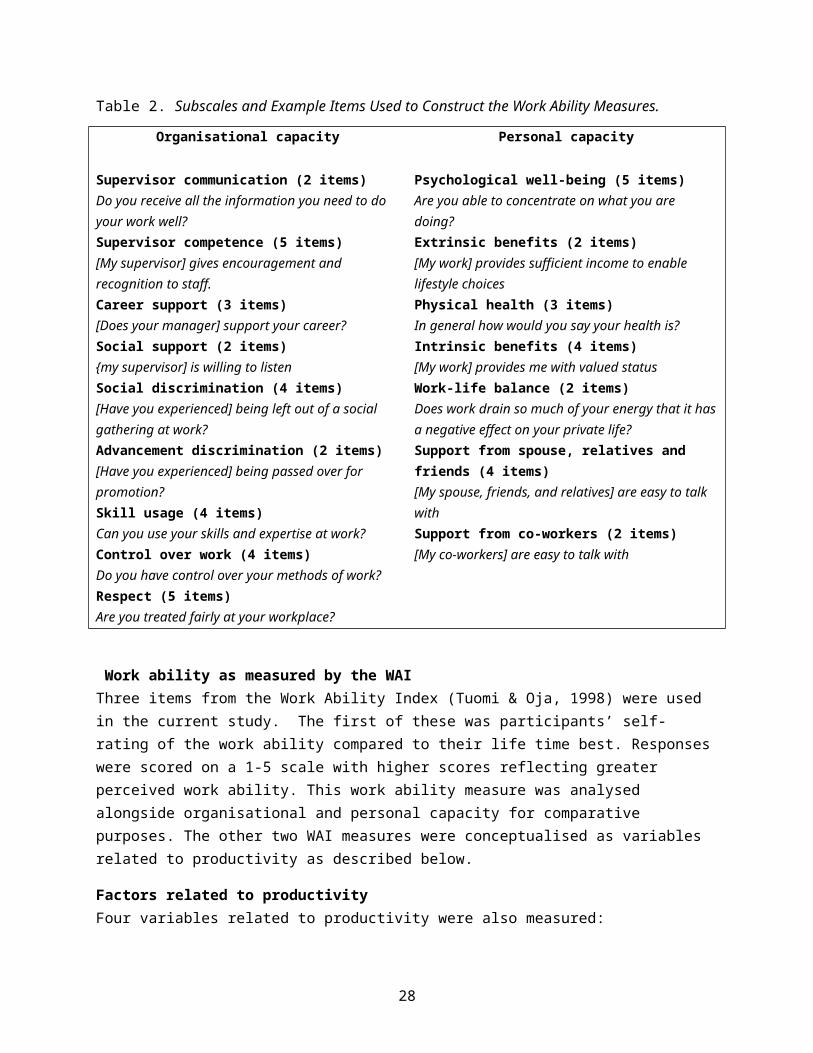
Figure 3. Distribution of industry categories for the 2011 Census and Safe Work sample.
28
SummaryThe under-representation of younger, male and lower SES workers in the data is not an unexpected finding as survey responses can be biased towards wealthier, healthier, and female participants (Hill, Roberts, Ewings, & Gunnell, 1997; Martikainen, Laaksonen, Piha, & Lallukka, 2007). Although the data do not fully represent the working population, there were still sufficient numbers of lower socioeconomic groups and males for analytic comparisons with sufficient statistical power. Nevertheless, the non-response and self-selection bias in the data means that caution must be taken in terms of generalisability and how the findings are transposed into recommendations for future research.
Work ability scores
As noted in section 3.2.1, work ability scores were scaled to have a theoretical range of 0-100. The distribution of scores for organisational capacity, personal capacity, and overall work ability (the mean of the two capacity variables) are displayed in Figure 4, Figure 5 and Figure 6 respectively5. The mean score for organisational capacity was 68.9, 75.1 for personal capacity and 72.0 for overall work ability.
Figure 4. Distribution of organisational capacity scores.
5 Organisational capacity: Mean = 68.91, standard deviation = 13.53, skew = -.82, kurtosis = 1.14. Personal capacity: Mean = 75.14, standard deviation = 11.19, skew = -.51, kurtosis = .45. Overall work ability: Mean=72.03, standard deviation = 10.93, skew = -.60, kurtosis = .81.
29

Figure 5. Distribution of personal capacity scores.
Figure 6. Distribution of over all work ability scores.
In contrast to previous research with the WAI (Costa, 2005b), organisational and personal capacity exhibited weaker ceiling affects and greater variation in responses. However, there was still some evidence of ceiling effects. Organisational capacity scores exhibited weaker ceiling effects compared to personal capacity scores and slightly greater variation. The distribution of overall work ability scores (the mean of organisational and personal capacity scores) was also skewed towards the positive end of the scale.
30
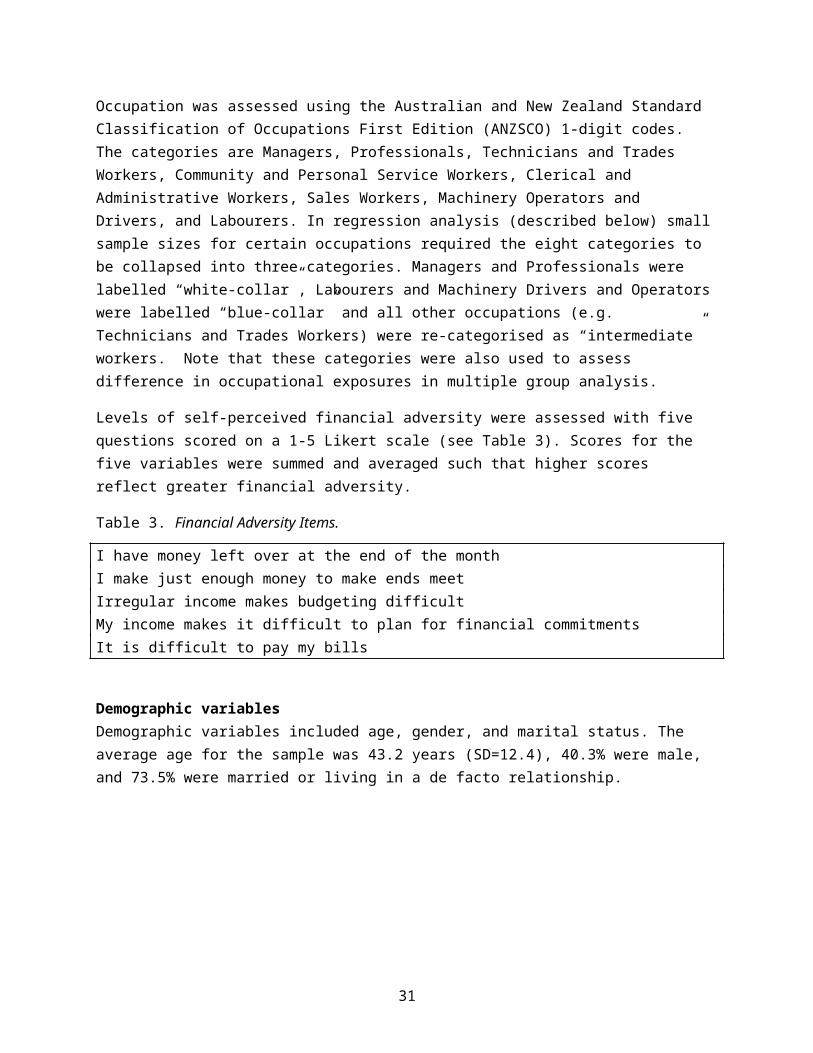
Age-related trends in work ability
Overall work abilityOverall work ability is conceptualised as the intersection of personal and organisational capacity (McLoughlin & Taylor, Unpublished Report) and is calculated as the average score of these two variables. Figure 7 shows that work ability differs very little with age in this sample. The vertical lines show the inter-quartile range for overall work ability. Twenty five per cent of the sample has scores that fall above the vertical line and 25% have scores that fall below the line. Thus, 50% of total work ability scores fall between, for instance, 61 and 81 for 45-54 year-olds. At face value, Figure 7 suggests that levels of personal capacity are “higher” than for organisational capacity across all age groups. Therefore, the two capacity variables are considered separately in this report.
Figure 7. Age related trends in work ability as measured by personal and organisational capacity.
Organisational capacityReported levels of organisational capacity did not differ substantively by age. However, the youngest participants (18-24) reported workplace autonomy was lower than all other age groups (p<.01). There were no age-related differences in levels of perceived supervisor support, respect for workers or discrimination. However, scores on the (non) discrimination subscale6 were notably higher than the other scales, indicating relatively low levels of reported discrimination in the sample. In contrast, autonomy and supervisor support scales were relatively low compared to the other subscales. Overall, organisational capacity scores for 50% of the sample fell between approximately 58 and 80 on the 0-100 scale.
6 For scale summation purposes, scores on the discrimination scale were reverse coded such that higher scores reflect less perceived discrimination.
31

Figure 8. Age-related trends in organisational capacity and associated sub-scales.
Personal capacityAs shown in Figure 9, there were no substantive differences in personal capacity scores across the different age groups. However, of the subscales that comprise personal capacity, reported psychological wellbeing of workers over 55 was significantly higher (p<.001) compared to the younger workers. The oldest group of workers also reported significantly better wellbeing compared to those aged 55-64 (p<.05). In contrast, physical health showed consistent decline with increasing age. These findings are consistent with the national and international literature on age differences in mental and physical health (Ilmarinen & Rantanen, 1999; Stone, Schwartz, Broderick, & Deaton, 2010). Figure 9 also indicates that, at face value, scores on the work benefits subscale appeared relatively low compared to the other scales while work health and safety competence was relatively high. Overall, personal capacity scores for 50% of the sample fell between approximately 65 and 88 on the 0-100 scale.
32

Figure 9. Age-related trends in personal capacity and associated sub-scales.
SummaryThe lack of age trends in work ability is not wholly unexpected given some of the weak or non-significant findings in the work ability literature (van den Berg et al., 2009). However, there was a tendency for older workers to report greater autonomy at work, better psychological well-being, and poorer physical health. The finding of no age differences in work ability may reflect either a bias in the sample, a problem with the measurement, or perhaps unique characteristics of the Australian workforce. To test for possible measurement issues, the widely used self-rated work ability item7 from the WAI was also examined according to age. Statistical analysis revealed no significant age differences in work ability as measured by the WAI measure. This finding provides support for the validity of the WAS and at the same time suggests that the lack of age difference in work ability is more likely a function of sample bias or characteristics of the Australian workforce rather than issues of measurement.
7 This self-rated work ability items asks individuals to rate their current level of work ability compared to their lifetime best. This single item measure has been shown to account for the majority of the variation in the full WAI scale (Ahlstrom et al., 2010; El Fassi et al., 2013).
33
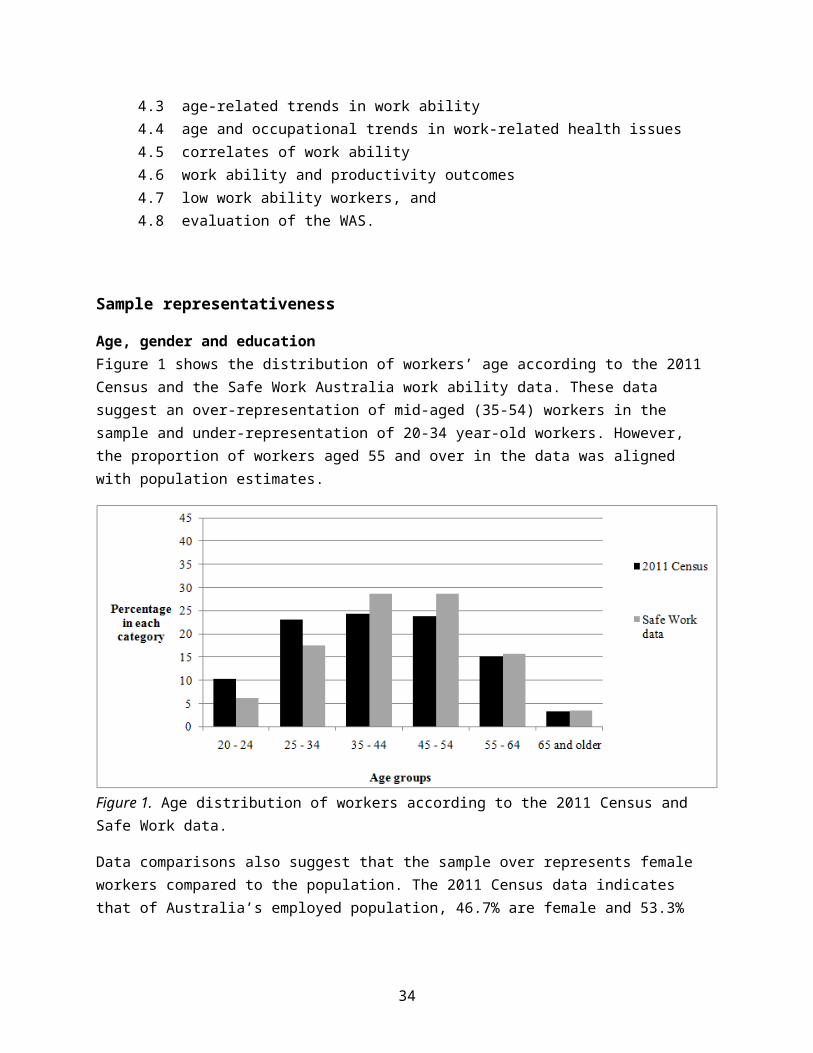
Age and occupational trends in work-related health issues
Prevalence of work-related health issuesOf the 3 146 participants with completed responses taking part in the study, 853 (27%) reported suffering from, contracting, or becoming aware of an injury or illness in the past 12 months that they believed was associated with their work (referred to hereafter as a work-related health issue).
Age-based differences in prevalence of work-related health issuesStatistical tests indicated no age differences in the number of work-related health issues. Likewise, no age differences were found when the number of health issues was dichotomised to reflect either no issue or one or more health issues. Participants were also asked if they have had a health issue prior to the last 12 months that still affected them and 25% confirmed that they did. Findings showed that increasing age was weakly associated with being affected by a prior health issue (r=.12, p<.001). These findings are consistent with the literature which suggests that older workers are no more likely to report a work-related injury or illness than younger workers, but that they do take longer to recover (e.g. Zuhosky et al., 2007).
Occupation-based differences in prevalence of work-related health issuesThere were no clear trends in occupation-based differences in the prevalence and number of work-related health issues. However, as shown in Figure 108 those working in managerial, professional or clerical roles reported the lowest prevalence of work-related health issues, while those working in community and personal services reported the highest prevalence. In terms of the number of health issues, community and personal service workers reported more health issues than managers, professionals, clerical and administrative workers, and labourers9. Although it appears that community and personal service workers have the poorest health outcomes, survivor or healthy worker effects maybe at play (Li & Sung, 1999). That is, those most affected by a work-related health issue may have already retired and may be over-represented by those working in physically demanding roles. Indeed research suggests that blue-collar workers retire earlier than other workers (Krause et al., 1997; Lund & Villadsen, 2005).
8 Chi square=64.1, df=7,1, p<.001.9 F=8.7, df=7,3087, p<.001.
34

Figure 10. Prevalence of work-related health issues according to occupational category.
Types of work-related health issues
Figure 11 shows the distribution of different types of injury and illness categories with the five most prevalent being: Musculoskeletal and connective tissue diseases (25.2%), traumatic joint/ligament and muscle/tendon injury (21.5%), wounds, lacerations, amputations and internal issues (13.4%), infectious and parasitic diseases (12.9%), and psychological health issues (7.7%).
Figure 11. Distribution of work-related injuries and illnesses.
35
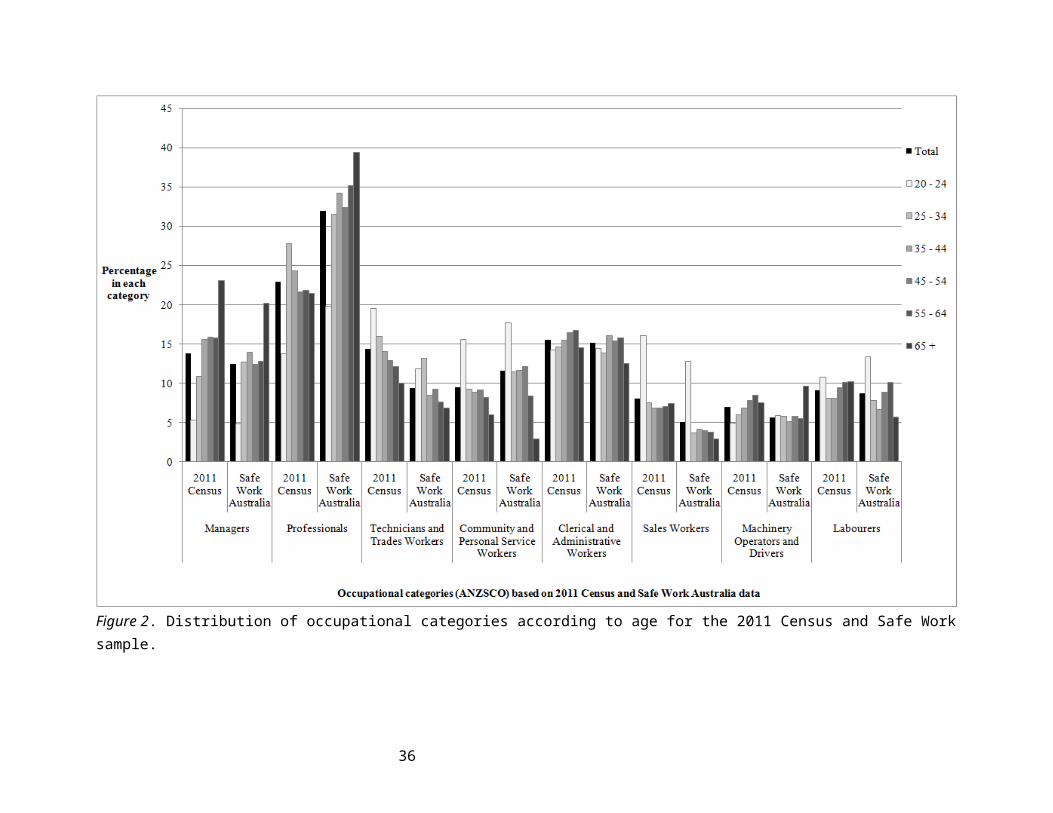
Age-based differences in type of health issuesThe mean age of those reporting an infectious or parasitic disease (39.1 years, SD=11.2) was significantly lower than for those reporting all other injuries or diseases except wounds, lacerations, amputations and internal organ damage10. This finding suggests that prevalence of four of the five most prevalent injuries and illnesses was independent of age in this sample.
Occupation-based differences in type of health issueDue to the small number of participants with particular health issues, occupational categories were collapsed into three broad groups: white-collar, intermediate, and blue-collar workers11. The prevalence of the top five health issues was associated with occupation12. As shown in Figure 12, those in white-collar occupations were more likely to report psychological health problems or parasitic/infectious diseases compared to blue-collar and intermediate workers, but were less likely to report wounds or traumatic joint/ligament and muscle/tendon injuries (p<.001). However, it is also important to note the variation presented in Figure 12. For instance 12.9% of white-collar workers also reported a wound, laceration, amputation or internal organ damage, while approximately 7% of blue-collar workers reported a psychological health problem as a result of their working conditions. Finally, the prevalence of musculoskeletal and connective tissue diseases was spread relatively evenly across the three occupational categories.
Figure 12. Prevalence of top five injuries and illnesses according to occupation.
Further statistical tests showed that while participants working in different occupational settings face different occupational hazards, the relationships appeared stable across different age groups within occupations. In other words, blue collar workers were more likely to report a wound laceration, amputation or internal organ damage compared to the other occupational groups, regardless of their age.
10 Traumatic joint/ligament and muscle/tendon injury (M=43.2 years, SD=11.7), Musculoskeletal and connective tissue diseases (M=45.1, SD=10.9), Psychological health issues (M=45.8, SD=11.5), wounds, lacerations, amputations and internal issues (M=42.5, SD=12.1). 11 Managers and professionals categorized as white-collar, labourers and machinery drivers and operators categorized as blue-collar. All other occupations categorised as “intermediate”.12 X2(8, 681)=42.5, p<.001.
36
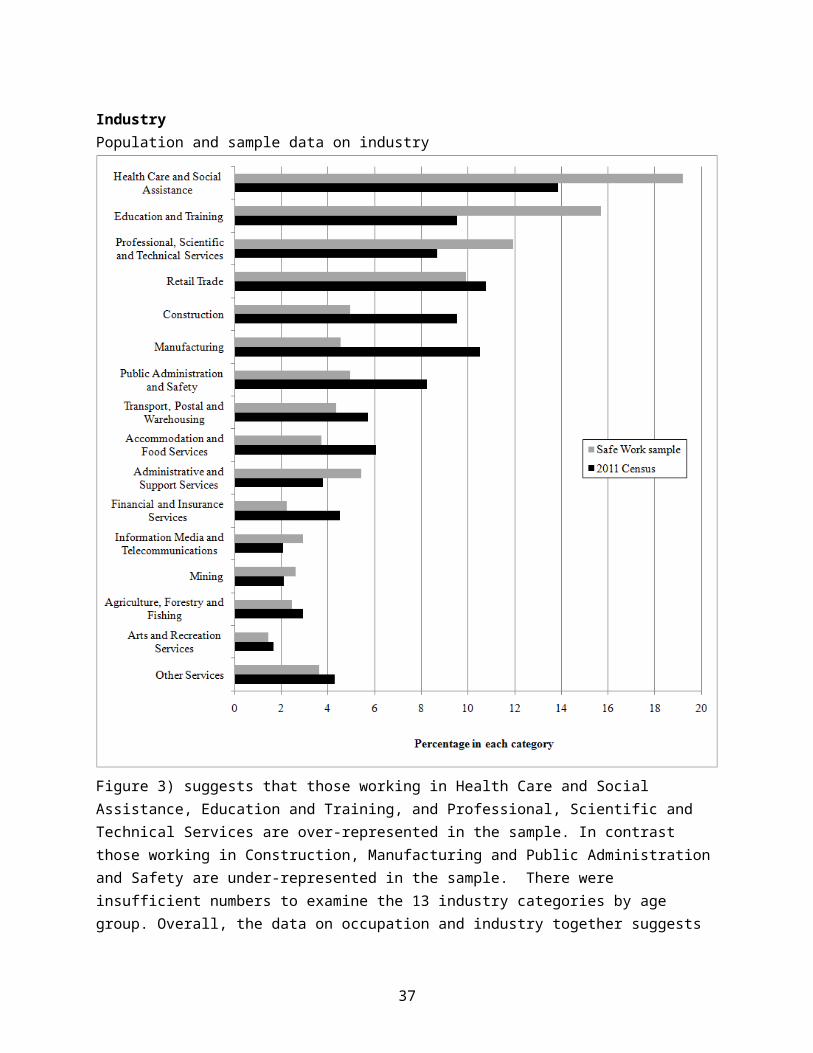
Mechanisms for work-related illnesses and injuries
Participants were also asked to describe how their most recent work-related health issue occurred and their self-reported responses showed substantial variation. The most commonly reported causes were categorised as body stressing (32%), biological factors (14%), falls, trips or slips (12%), vehicle and other incidents (11%), mental stress (10%) and being hit by moving objects (10%). Less common self-reported causes included heat, electricity or other environmental factors (4%), hitting objects with a part of the body (4%), chemicals and other substances (3%), and sound and pressure (1%).
Age-based differences in self-reported mechanismsMean age did not differ across the different causal mechanisms. The standard deviations, which ranged from 11-14 years, further suggest that certain mechanisms are not restricted to certain age groups.
Occupation-based differences in self-reported mechanismsSelf-reported mechanisms for health issues did vary across occupations (see Figure 13). For example, 18% of blue-collar workers identified a fall, slip or trip as the cause of their health issue compared to only 9.4% of intermediate workers. Similar findings were also apparent for vehicle and other incidents. In contrast, white-collar workers were more likely than blue-collar workers to identify biological factors or mental stress as the cause of their health issue. Body stressing was a relatively consistent mechanism across all occupational categories. These findings corroborate those on types of work related health issues. Those in more physically demanding roles tended to be more affected by physical factors (e.g. slips, being hit by objects) and less affected by mental stress. The reverse was apparent for white-collar workers whose health-issues were more likely to be a function of non-physical components of work. Yet, there was still variation in self-reported causality across the occupational categories that were not explained by differences in occupation. This was most clearly evidenced by the consistency of body stress as a self-reported cause of participants’ health issues regardless of the occupational setting.
Figure 13. Mechanisms of injury and illness according to occupation.
37
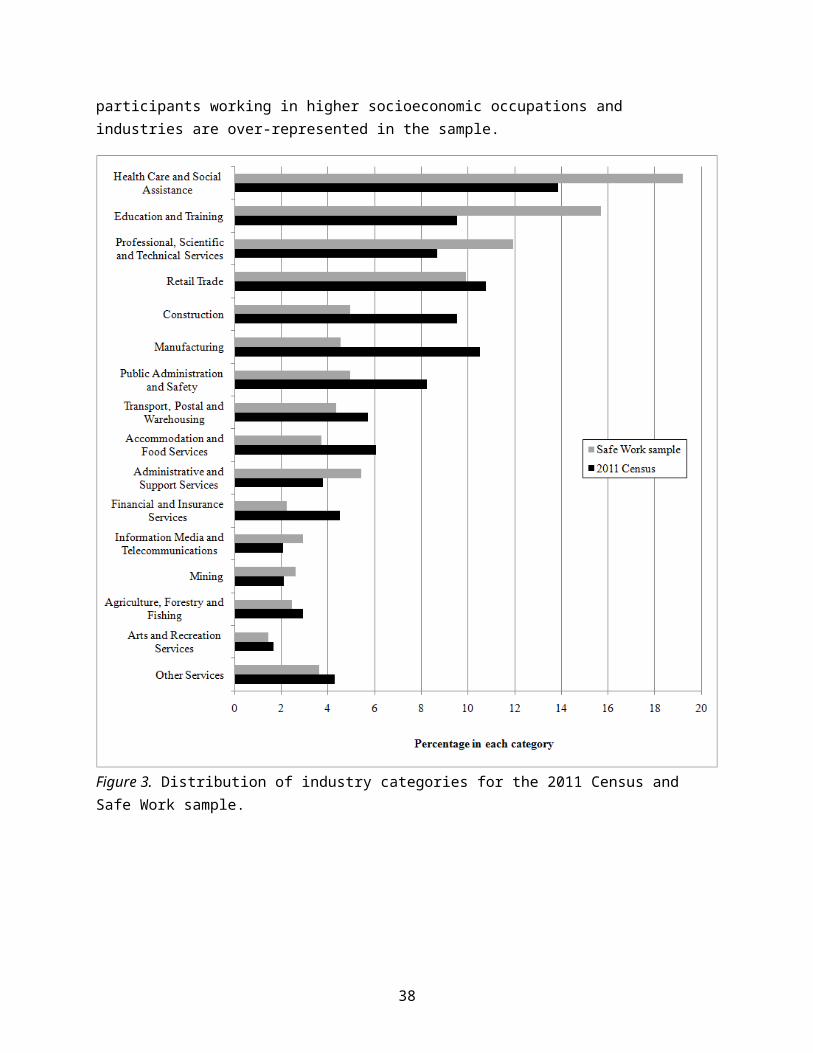
SummaryFindings indicate that age plays little role in the prevalence, type and cause of work-related health issues in this sample, even when occupational exposures are taken into consideration. In contrast, occupation appeared to play a more significant role in terms of the prevalence and type of injuries and illnesses reported. Blue-collar workers were more likely to report physical health conditions while white-collar workers were more likely to report work-related health issues that were mental in origin. Given that health issues are reported differentially across occupations and that health is an important domain of work ability, the following section begins by examining the relationship between work ability and the prevalence and type of health issue reported. In doing so, this report starts to develop a representation of how occupational exposures may shape the work ability of Australia’s labour force.
Correlates of work ability
Using a series of hierarchical linear regressions, models are built to account for the inter-relationships between the four different blocks of correlates and their independent and shared relationships with work ability. The relationships between work ability and work-related health issues are examined first, followed by the other three blocks of correlates. At the beginning of each of the four sub-sections, bivariate relationships between work ability and the correlates are examined for statistical significance to determine which variables to use in regression. Due to the large sample size, only variables that are correlated with work ability at p<.001 are used in the regressions. In the fifth sub-section, relationships identified in the hierarchical regressions are examined according to occupational categories to test how different workplace settings may influence the relationships between work ability and its correlates. The relationships are also tested across “mature-age” (45+) and younger workers in the sixth and final sub-section.
Work-related health issues
Organisational capacityT-tests showed that organisational capacity was significantly lower for those who had experienced a work-related health issue in the last year (Mean [M]=65.4, Standard Deviation [SD]=14.7) compared to those who had not (M=70.3, SD=12.8, p<.001).
Due to the relatively small number of participants reporting multiple health issues, the number of issues was re-categorised to reflect no issue (n=2,294), one issue (n=496), two issues (n=211), three issues (n=76), or four or more work-related health issues (n=70). Statistical tests showed that the number of work-related health issues was not associated with organisational capacity. In other words, the prevalence of work-related health issues (present or not present) was a stronger correlate of organisational capacity than the number of health issues. Therefore, the presence of a work-related health issue (or not) was used as a dichotomous variable in the regression analysis rather than the number of health issues.
For those who had experienced a work-related health issue, the type of issue was associated with organisational capacity, but the self-perceived cause of the health issue was not. Those who reported a work-related psychological health problem exhibited significantly lower organisational capacity scores (M=59.1, SD=16.8) compared to those reporting joint or ligament
38
problems (M=65.5, SD=13.6), musculoskeletal problems (M=66.4 SD=14.1), and infectious disease (M=67.5, SD=14.9, p<.05). However, there were no differences in organisational capacity scores between the different physical health issues. This suggests a distinction could be made between work-related health issues that are physical in nature or psychological in nature, with the latter reporting lower levels of organisational capacity than the former.
Table 4 summarises the significant associations between the work ability variables and health issue variables: prevalence (absent or present), type of health issue (physical versus psychological), and self-perceived cause of health issue (physical versus mental)13. Due to the high correlation between the type and perceived cause of health issue (r=.76, p<.001), only the type of issue was used in regression analysis.
Table 4. Bivariate Correlations Between Work Ability, Presence of Work-related Health Issue, Type of Health Issue and Self-perceived Cause.
Organisational capacity
Personal capacity
Health issue
Issue type
Personal capacity .56**Health issue (present) -.16** -.21**Issue type (mental) -.12** -.17** -Issue cause (mental) -.11** -.20** - .76**
Regression – full sample. Linear regression for the full sample showed that presence of a health issue explained 2.5% of the variance in organisational capacity14.
Regression – restricted sample. Linear regression for those with a health issue showed that the nature of the issue explained 1.1% of the variance in organisational capacity. The beta coefficient of -.11 indicates that those with a mental health issue reported lower organisational capacity that those with a physical health issue.
Personal capacityPersonal capacity was also lower for those reporting a work-related health issue (M=71.3, SD=11.8) compared to those who did not (M=76.6, SD=10.6, p<.00115). Unlike organisational capacity, the number of health issues was associated with different levels of personal capacity. As shown in Figure 14 below, those reporting no work-related health issues exhibited slightly higher personal capacity than the other four groups (p<.001). Those reporting one health issue also showed higher personal capacity scores than those reporting two or more issues. However, there were no capacity-based differences between those reporting two or more work-related illnesses or injuries. As the difference in personal capacity between those with one and two or more health issues was small, creation of a dichotomous health issue/no health issue or prevalence variable was still considered appropriate.
13 Absent is coded “0” and present is coded “1” such that increasing scores reflect presence of a health issue. Physical issues/causes are coded “0” and mental issues/causes are coded “1” such that higher scores reflect mental rather than physical issues and causation.14 Beta=-.16, p<.00115 T(3141)=12.1
39
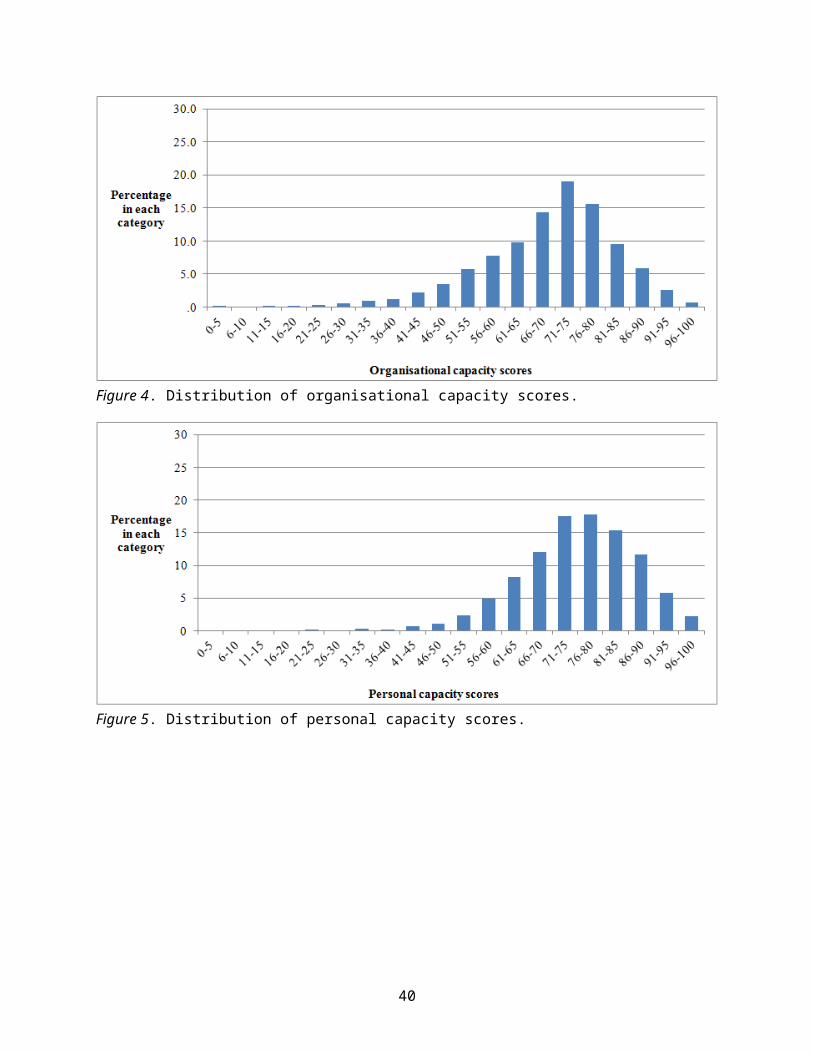
Figure 14. Mean personal capacity scores according to the number of work-related health issues.
In terms of the type of health issue, those reporting a work-related psychological health issue reported significantly lower personal capacity scores (M=64.5, SD=13.3) compared to those reporting physical health problems (p<.001). Mean personal capacity scores ranged from 71.0 (SD=11.8) for musculoskeletal conditions to 73.0 (SD=12) for those reporting infectious disease—between 5.5 and 7.5 points higher than for those reporting a psychological health issue. However, consistent with organisational capacity, there were no differences in personal capacity across the different physical injuries or illnesses. Therefore, the dichotomised health issue variable (physical or psychological) was retained for regression with the personal capacity variable.
For the self-perceived causal mechanisms, those identifying mental stress as the cause of their health issue reported significantly lower personal capacity scores (M=64.03, SD=13.4) compared to all other causal mechanisms except heat, electrical and other environmental factors. Personal capacity scores for the other mechanisms ranged from 70.4 for vehicle incidents and other causes (SD=13.9) to 75.9 (SD=11.6) for chemicals and other substances. Due to the high correlation between health issue type and perceived cause, only the type of issue was used in the regression analysis.
Regression – full sample (step 1). Linear regression for the full sample showed that the presence of a work-related health issue explained 4.6% of the variation in personal capacity16.
Regression – restricted sample (step 1). Linear regression for those with a work-related health issue showed that the type of issue explained 2.6% of the variation in personal capacity17.
16 Beta= -.22, p<.001. 17 Beta= -.18, p<.001.
40

Summary Five key findings emerge from section this section:
the presence of a work-related injury was associated with lower work ability work ability was lower for those with mental rather than physical health issues work ability was lower for those who reported the cause of their health issue was mental
rather than physical a strong association between the type of health-issue and the cause of the health issue
(r=.78, p<.001), and linear regression showed that prevalence and nature of work-related health issues
explained a small proportion of the variance in work ability scores.
The final point indicates that the prevalence and type of work-related health issues are not strong correlates of work ability. This means that while pilot intervention studies could focus on workers with health issues initially, wider intervention programs should not be excluded.
Employment variables
Employment-based correlates of work ability include work hours (shift work, weekend work, flexi-time, night shifts), self-employed versus employee, contract or permanent, industry, size of organisation and job demands.
Organisational capacity Figure 15 shows the significant relationships between work hours, contract type, organisation size and organisational capacity. Shift workers, night workers, weekend workers and those without permanent or continuing positions reported poorer organisational capacity compared to those not working under these conditions. However, only the shift work variable reached the p<.001 threshold for use in regression analysis. Participants working in organisations with more than 20 workers also reported significantly lower levels of organisational capacity than those working in smaller organisations. However, there were no differences within these two groups. Accordingly, the five categories of organisation size were dichotomised to reflect organisations with 20 or more employees and organisations with fewer than 20 employees, for use in regression analysis. There were no systematic differences in organisational capacity according to industry type. Organisational capacity was negatively correlated with mental demands (r=-.05, p=.005)18 and physical demands (r=-.12, p<.001). These relationships indicate that as perceived cognitive and physical demands of the job increase, organisational capacity tends to decrease.
18 Despite not meeting the p<.001 threshold, cognitive demands were retained for regression analysis because of their centrality to the work ability construct.
41

Figure 15. Organisational capacity according to employment variables.
Regression – full sample. Addition of the employment variables increased the explained variance in organisational capacity from 2.5% to 5.8%. Shift work, working in an organisation with more than 20 employees, and increasing physical demands were associated with lower organisational capacity controlling for other variables19.
Addition of the employment variables did not change the relationships between organisational capacity and prevalence of health issues. This finding suggests that the two blocks of correlates have reasonably independent associations with organisational capacity. This means that the relationship between health issue prevalence and organisational capacity cannot be explained in terms of differing employment circumstances.
Regression – restricted sample. Hierarchical linear regression for those reporting a work-related health issue showed similar findings to the full sample. Introduction of the employment variables increased the explained variance in organisational capacity from 1.1% to 6.3%. Shift work, decreasing organisation size, and decreasing physical demands were independently associated with higher organisational capacity controlling for other variables20. As was the case for the full sample, the two blocks of variables had independent relationships with organisational capacity of injured workers. This means that lower organisational capacity scores for those with a mental rather than physical health issue cannot be explained in terms of differing workplace circumstances.
19 Beta = -.08 (p<.001) for shift work, -.13 (p<.001) for organisation size and -.07 (p<.001) for physical demands. 20 Beta = -.09 (p<.01) for shift work, -.17 (p<.001) for organisation size and -.09 (p<.001) for physical demands.
42
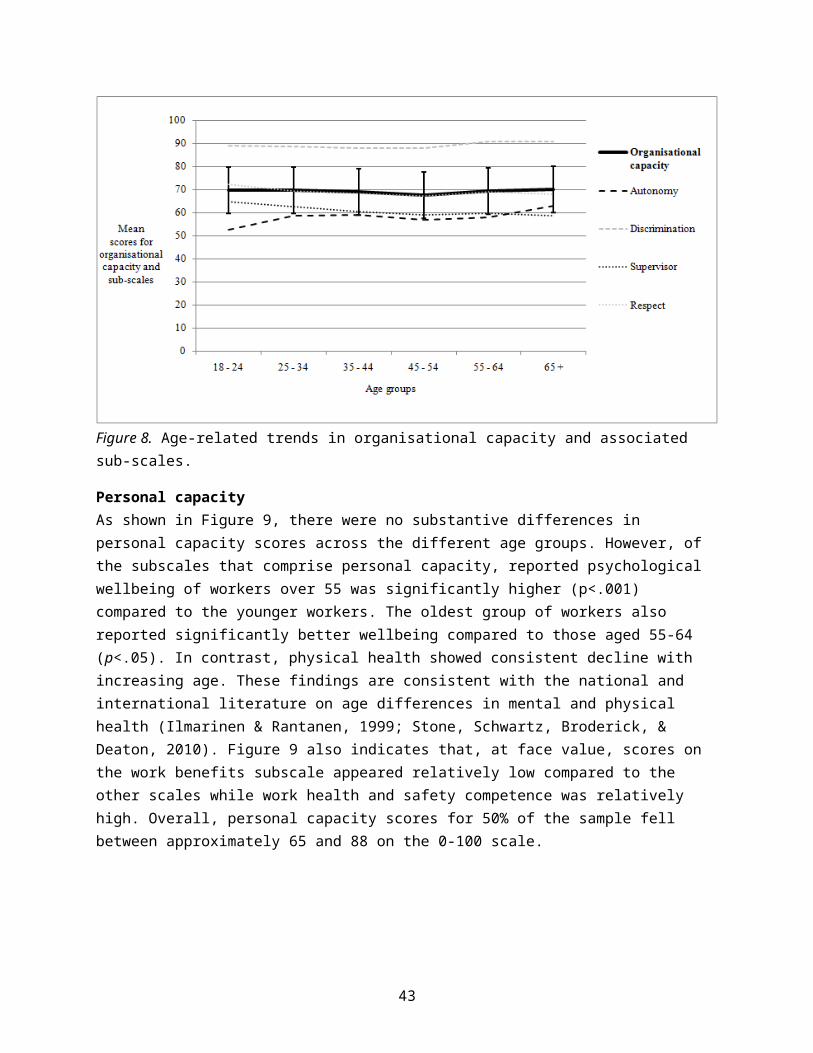
Personal capacityAs shown in Figure 16, those working at night (p<.001) or during the weekend (p<.001) reported lower levels of personal capacity. However, the size of the organisation, whether the participant was employed on a continuing or contract basis, and whether they had access to flex-time hours had no bearing on their reported levels of personal capacity. Therefore, these variables were not used in the regression analysis. There were also no significant differences in personal capacity across industry type. Personal capacity was negatively correlated with mental demands (r=-.28, p=.005) and physical demands (r=-.12, p<.001). These relationships indicate that as perceived mental and physical demands of the job increase, personal capacity tends to decrease.
Figure 16. Mean personal capacity scores according to employment variables.
Regression – full sample. For the full sample of participants with or without a work-related health issue, addition of the three employment variables increased the proportion of explained variance in personal capacity from 4.6% to 11.1%. However, only mental demands of the job were significantly associated with personal capacity21. As cognitive demands increased, personal capacity decreased. Addition of the employment variables marginally reduced the relationship between health issue prevalence and personal capacity from beta = -.22 to -.15.
Regression – restricted sample. For the component of the sample reporting a health issue, adding the employment variables increased the explained variance from 2.6% to 8.4%. Mental demands were again the only significant correlate of personal capacity controlling for other variables22 and did not substantively influence the relationship between the nature of the health issue and personal capacity.
21 Beta = -.25 (p<.001).22 Beta = -.24, p<.001.
43
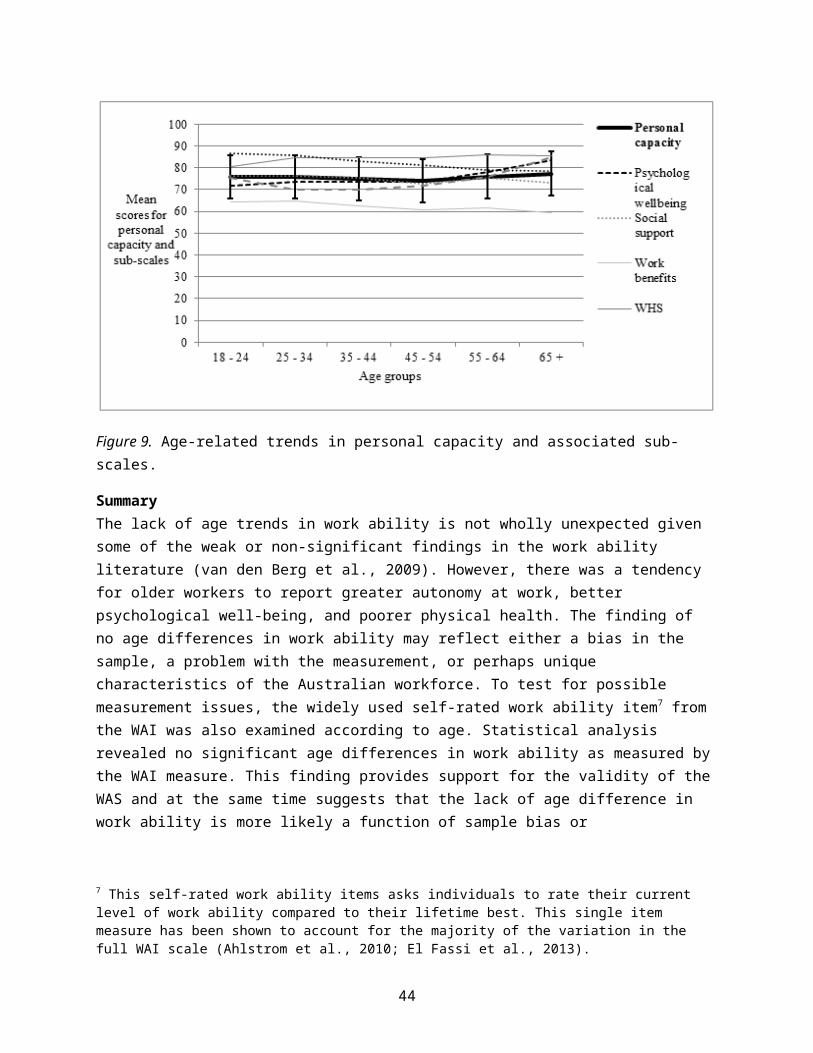
SummaryWorkers reporting irregular work conditions, higher mental demands and employment in larger organisations reported lower organisational capacity scores compared to workers in other employment circumstances. This was consistent across the full sample and for workers reporting a health issue. In contrast, increasing mental demands was the only variable to show an independent relationship (negative) with personal capacity across the full and restricted samples.
The relationship between the two work ability variables and health issue prevalence and type remained largely unchanged when the employment variables were added to the equation. This finding suggests that the relationship between work ability and work-related health issues cannot be explained by differences in the employment conditions examined here. Instead, work-related health issues and employment conditions exhibit independent relationships with work ability offering different opportunities for promoting work ability outcomes rather than an explanation as to how work ability is formed.
Socioeconomic status
Organisational capacityThose with a graduate diploma or higher educational qualification reported higher organisational capacity scores (M=70.2, SD=12.7) compared to those with Year 10 or below (M=67.2, SD=14.0), Year 11-12 (M=68.1, SD=13.9), or a TAFE qualification (M=68.2, SD=14.0). However, there were no differences in organisational capacity for those with less than a graduate diploma. Therefore a dichotomous education variable reflecting participants with up to a diploma (coded 0) and those with a graduate degree (coded 1) was created for use in the regression analysis.
Occupation was also associated with organisational capacity. As shown in Figure 17, white-collar workers reported greater organisational capacity compared to intermediate (p<.01) and blue-collar workers (p<.01) and intermediate workers reported higher organisational capacity than blue-collar workers (p<.01).
Figure 17. Organisational capacity according to occupation.
44

Increasing levels of financial security were positively associated with increasing organisational capacity (r=.18, p<.001) and also the decreasing likelihood of reporting a work-related health issue (r=-.10, p<.001). Put another way, those in more financially precarious situations tend, on average, to report slightly higher rates of injury and lower levels of organisational capacity.
Regression – full sample. Addition of education, occupation and financial insecurity to the regression equation increased the explained variance from 5.8% to 9.5%23. Addition of the SES variables to the equation did not change the relationships between organisational capacity and health issue prevalence, shift work or organisational size. However, the relationship between physical demands and organisational capacity was reduced from Beta = -.07 (p<.001) to .00 (ns) when SES was accounted for. One explanation for this finding is that low SES groups report lower organisational capacity partly due to their over-representation in physically demanding roles. Nevertheless, the independent relationship between financial security and organisational capacity indicates there are aspects of SES that explain differences in organisational capacity that cannot be attributed to differences in job demands.
Regression – restricted sample. For those with a work-related health issue, addition of the SES variables increased the explained variance from 6.3% to 9.5%24. Being other than a blue-collar worker and greater financial security were independently associated with higher levels of organisational capacity for workers with a health issue. As with the full sample, addition of the SES variables did not change the relationships between organisational capacity and health issue prevalence, shiftwork or organisational size. However, the relationship between physical demands and organisational capacity became non-significant.
Personal capacityPersonal capacity did not differ according to occupation or education, but was positively associated with financial security (r=.32, p<.001). Those in more financially stable circumstances reported higher levels of personal capacity.
Regression – full sample. The explained variance in personal capacity increased from 11.1% to 19.9% when financial security was added to the equation25. The relationship between financial security and personal capacity was independent of the other variables.
Regression – restricted sample. For participants with a work-related health issue, addition of the financial security variable increased the explained variance in personal capacity from 8.4% to 17.4% independently of the other variables26.
SummaryFindings indicate that differing socioeconomic backgrounds play a role in explaining why some people have high levels of work ability while others do not. This relationship was particularly apparent for personal capacity and is consistent with the research literature. For instance, the SES gradient is a widely identified effect demonstrating a linear relationship between increasing socioeconomic resources and improving physical and mental health outcomes (see Adler & 23 Blue-collar versus other occupations – Beta =.09, p<.001). Financial security – Beta=.16, p<.001. 24 Blue-collar versus other occupations – Beta =.10, p<.001). Financial security – Beta=.13, p<.001). 25 Beta = .30, p<.001.26 Beta = .30, p<.001.
45
Newman, 2002, for a review; Goldman, 2001). Research also indicates that social support, an element of personal capacity, also decreases as socioeconomic resources decrease (Berkman, Glass, Brissette, & Seeman, 2000). Considered together these findings suggest that the work ability model could be expanded to incorporate aspects of socioeconomic resources.
The relationship between the three blocks of variables and work ability occur independently of each other. In other words, work-related health issues, employment circumstances and socioeconomic status all play a role in building a representation of work ability. However, their inter-relationships do not play a substantive role in explaining how or why this may occur. The one exception involved the inter-relationships between SES, physical demands and organisational capacity. This suggested that increasing physical demands may be part of the reason why lower socioeconomic groups report lower organisational capacity.
Demographic variables
Organisational capacityAs noted above, age was not associated with organisational capacity and there were only very weak correlations between organisational capacity and gender (r=.05, p<.01) and organisational capacity and marital status (r=.07, p<.001). These relationships indicate that females and married or partnered individuals reported slightly higher organisational capacity compared to men and those living alone. However, only marital status was used in the regression analysis as age and gender did not meet the p<.001 threshold.
Regression – full sample. For the full sample, linear regression with the addition of marital status increased the amount of explained variance in organisational capacity from 9.5% to 9.9%. This indicates that after controlling for other variables, being married was associated with higher levels of organisational capacity27. Addition of marital status did not change the other relationships in the model.
Regression – restricted sample. Adding marital status to the equation increased the explained variance from 9.5 to 9.6%, a non-significant change. Moreover, the relationship between marital status and organisational capacity was not significant, indicating that marital status had no bearing on the organisational capacity of participants with a work-related health issue after controlling for other variables.
Personal capacityCorrelations between the demographic variables and personal capacity were also weak or not significant. Gender and age had no influence on personal capacity, but those who were married were more likely to report higher levels of personal capacity (r=.07, p<.001). Therefore only marital status was used as a variable in the regression equation for personal capacity.
Regression – full sample. For the full sample, addition of marital status to the regression equation increased the explained variance in personal capacity from 19.9 to 20.6%28.
27 Beta = .06, p<.001.28 Beta = .09, p<.001.
46
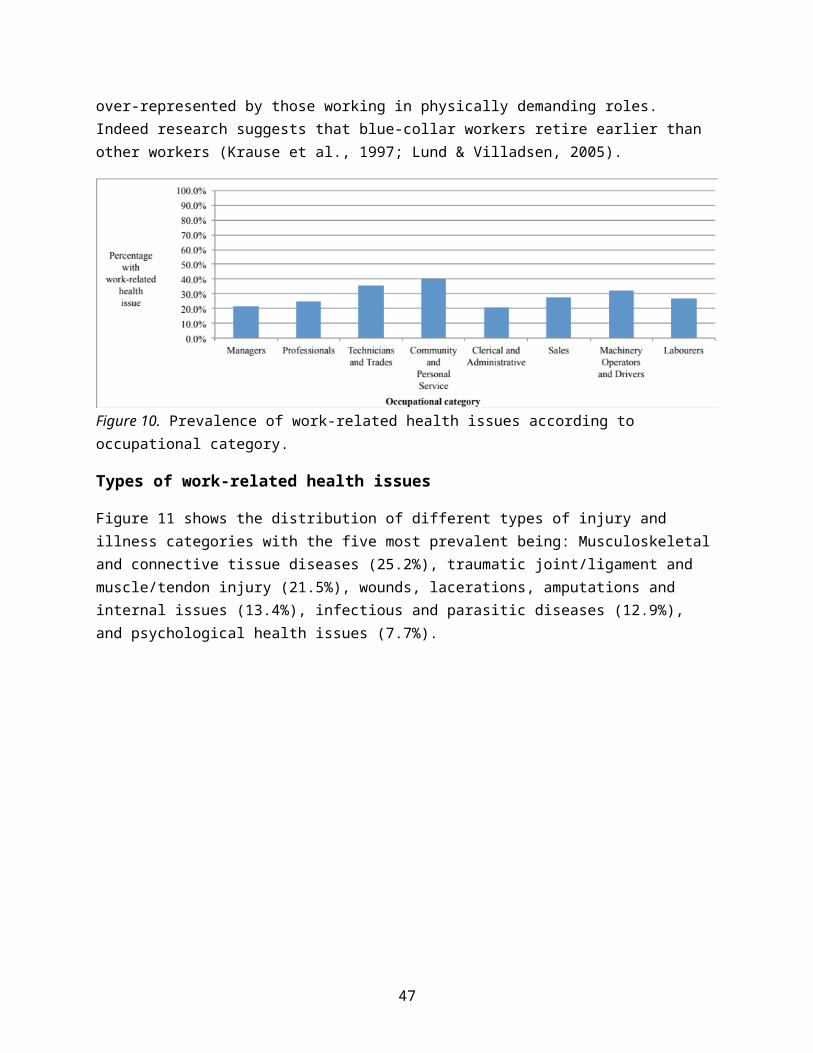
Addition of marital status to the equation did not change the magnitude of the other relationships in the model.
Regression – restricted sample. For only those reporting a work-related injury or illness, marital status was not associated with personal capacity after controlling for the type and cause of health issue and financial stability. This was reflected in the non-significant increase in explained variance from 17.4% to 17.7%.
SummaryDemographic variables were at best weakly correlated with work ability before and after controlling for other variables. While having a partner was associated with slightly higher organisational capacity, the relationship occurred independently of financial stability. This suggests that the mechanism linking marital status with organisational capacity may be more to do with social rather than economic support. However the relationships were very weak and further research is needed.
Considered together, the work-related health issues, employment variables, SES and demographics explained between 9.6% and 20.6% of the variation in work ability scores, reflecting a stronger association with personal rather than organisational capacity. The variables with the strongest relationships included cognitive demands and financial security for personal capacity and organisation size for organisational capacity. Each of the four blocks of variables played a statistically significant role in explaining work ability scores and independently of each other. This means that the correlates help build a picture of work ability, but play a limited role in explaining why or how injury status, employment, socioeconomic conditions and demographic may combine to influence work ability outcomes. This finding suggests that more theory-based research is needed to help elucidate the occurrence of work ability, identify those at risk for low work ability, and to help inform work ability interventions.
While the low rates of explained variance suggest that little is known of work ability’s correlates, important findings can be masked when between-group differences are not taken into consideration. Therefore, in the final two sub-sections the relationships between the four blocks of correlates and work ability are examined separately across the three occupational categories and for mature-aged (45+) and younger participants.
Occupation-based differences in the correlates of work ability
In this section the relationships described in the four previous sections are examined separately for blue-collar, intermediate and white-collar workers. These analyses are not performed for the restricted sample due to the small sample size (N=850) and resultant unstable estimates.
Organisational capacitySeparate analyses for the full sample showed similar results across occupational categories with the correlates explaining 6.5%, 8.7%, and 8.4% of the variance in organisation capacity for blue-collar, intermediate and white-collar workers respectively. Confidence intervals for the parameter estimates were overlapping across the three occupational groups, indicating that relationship strength did not differ. However, shift work was only associated with decreasing
47
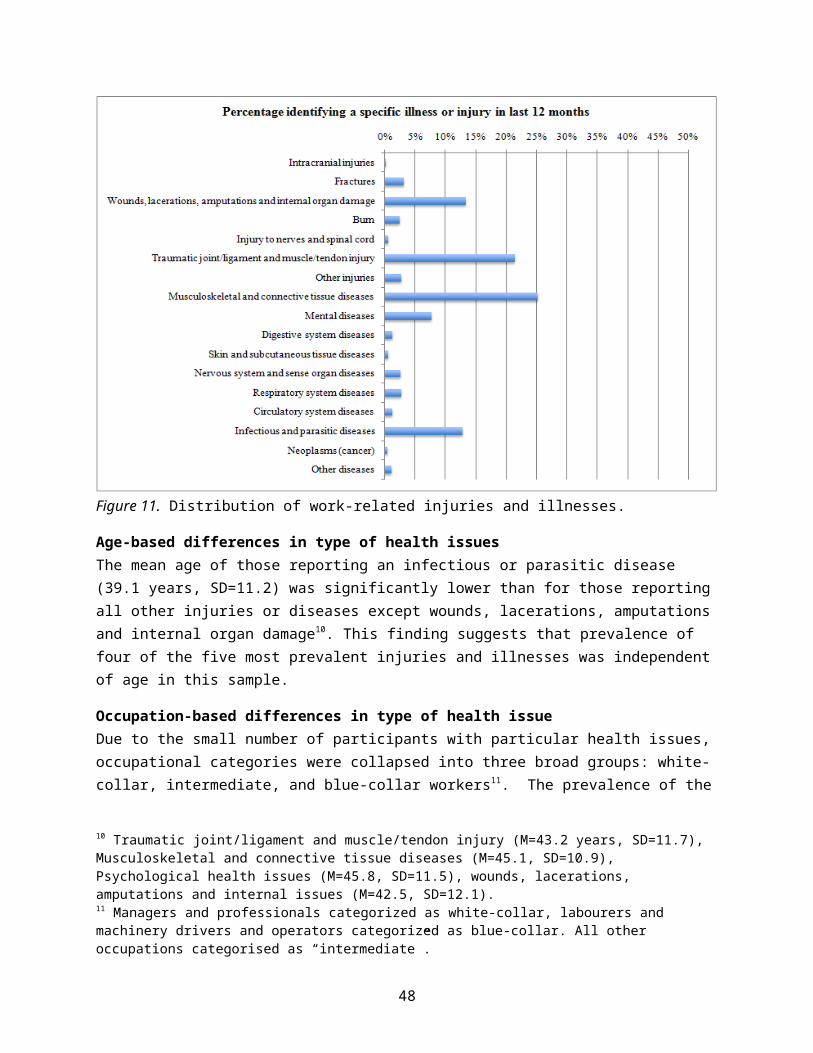
organisational capacity for intermediate and white-collar workers. This may be because shift work is more commonly accepted in blue-collar occupations.
Personal capacityThe correlates explained 20.9%, 20.1%, and 21.4% of the variance in the personal capacity of blue-collar, intermediate and white-collar workers respectively. The parameter estimates were equal across groups.
SummaryIn general, the correlates exhibited the same relationships for the three groups of workers. In other words, broadly different occupational contexts had no bearing on how the presence of a health issue, cognitive demands, employment factors, SES, or marital status were associated with personal or organisational capacity.
Age-based differences in the correlates of work ability
Organisational capacity.For the full sample, the correlates explained 9.9% of the variance in organisational capacity for younger workers and 9.3% of the variance for older workers. There were no substantive differences in the correlates’ relationship with organisational capacity except for organisation size. The non-overlapping confidence intervals29 suggest that increasing organisation size was more associated with organisational capacity for younger workers compared to mature-age workers. In other words, working in a larger organisation was more detrimental for younger workers’ organisational capacity.
Personal capacity.There were no substantive aged-based differences in the correlates of personal capacity for the full sample. Variables predicted 19.4% of the variance in younger workers’ personal capacity and 22.3% of the variance in older workers’ personal capacity.
SummaryAge differences appeared to play little or no role in moderating the effects of injury prevalence, financial stability, and marital status on work ability. However, younger workers tended to be more disadvantaged in terms of organisational capacity if they worked in a larger rather than smaller organisation. It is possible that older workers, through their greater experience, may be better equipped to deal with shortcomings at the organisational levels including lower levels of support that may be more prevalent in larger organisations. However, healthy worker effects cannot be discounted as an explanation for the differential effects of organisation size on organisational capacity. Regardless of the explanation, the findings suggest that while age is not associated with work ability at the broadest level, it may still be an important factor in identifying areas where work ability interventions could be directed.
29 Beta=-.20, p<.001 for younger group (Unstandardised CI= -6.9 to -4.2) . Beta =-.10, p<.001 for older workers (Unstandardised CI= -3.9 to -1.1).
48
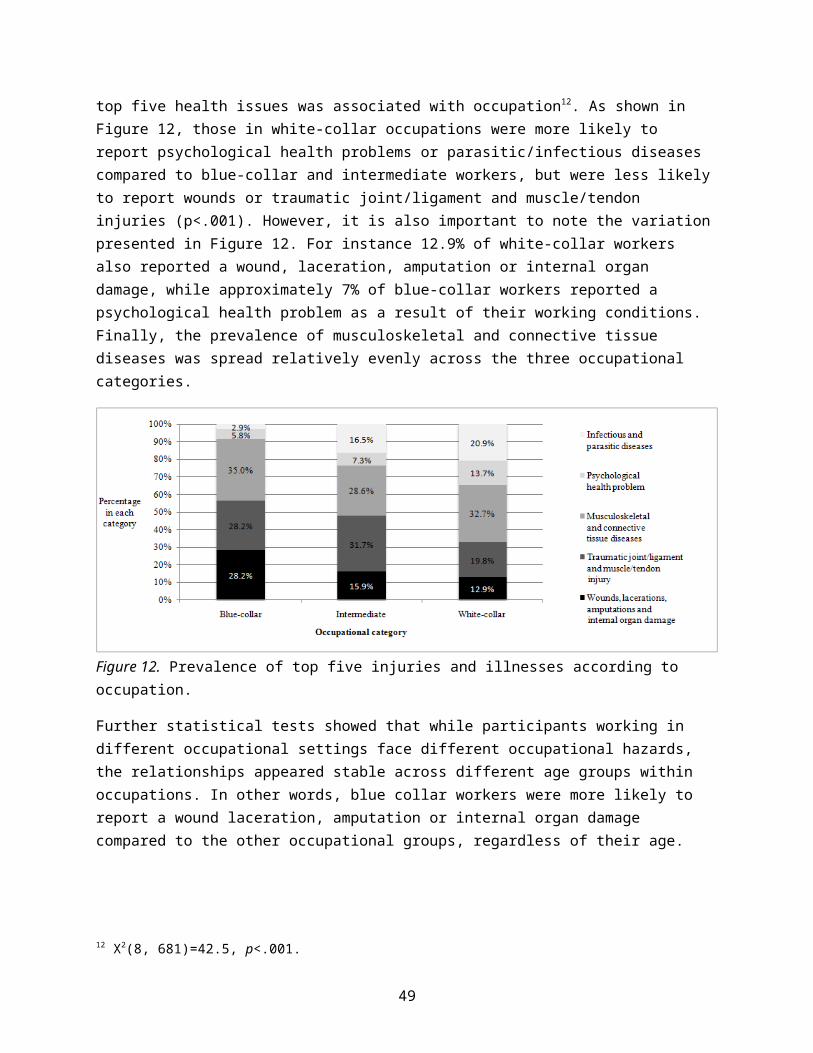
Work ability and factors related to productivity
In this section work ability is treated as an independent rather than dependent variable in four regression analyses corresponding to the productivity-related variables. Other predictors include cognitive and physical job demands, prevalence of work-related health issues, age and occupation. The effects of self-rated work ability (from the WAI) on productivity are also examined alongside the (WAS) measures of organisational and personal capacity. Correlation analysis indicated that the WAI measure was positively correlated with both organisational capacity (r=.28, p<.001) and personal capacity (r=.39, p<.001).
Regression analyses for job satisfaction and intention to remain in the current position are performed for the full sample and then for participants with a work-related health issue (restricted sample). However, self-reported impact of health issues and absence from work are only examined for those who reported having a health issue. As with the previous section, the analyses are run separately according to age (younger versus mature-age workers) and occupational category, but only for the full sample.
Finally, the relationships between the subscales of work ability (e.g. autonomy, psychological wellbeing) and the productivity variables are also considered. This data will provide information on which aspects of work ability may be most usefully promoted. The consistency of these correlations is also compared across occupations, age groups and for those with and without a work-related injury.
Job satisfaction.Participants’ self-reported their job satisfaction on a four-point scale. Approximately 2% were not at all satisfied with their job as a whole, 8% were not very satisfied, 49% were satisfied, and 40% were very satisfied. Approximately 1% was not sure about their level of satisfaction and was excluded from further analysis. Those reporting “not at all” or “not very” satisfied were collapsed into a single variable resulting in a satisfaction variable with three ordered categories: not satisfied, satisfied and very satisfied.
As shown in Figure 18, increasing satisfaction at work was associated with higher levels of organisational and personal capacity (i.e. work ability). Those who were not satisfied at work reported significantly lower work ability than those who were satisfied or very satisfied (p<.001). Those who were satisfied reported lower work ability scores than those who reported being very satisfied at work30.
30 Organisational capacity: F(2,3160)=516.7, p<.001. Personal capacity: F(2,3158)=475.9, p<.001.
49

Figure 18. Levels of job satisfaction according to personal and organisational capacity.
Regression analysis – full sampleOrdinal regression showed that both organisational and personal capacity had independent positive relationships with job satisfaction after controlling for job demands, self-rated work ability, age, occupation, and injury status. A one-unit increase in organisational capacity improved the odds of being in a higher category of satisfaction (i.e. from “not satisfied” to “satisfied” or from “satisfied to very satisfied”) by approximately 6% (Odds Ratio [OR] = 1.06)31, after controlling for personal capacity, job demands and the other variables. Likewise, a one-unit increase in personal capacity also increased the odds of being in a higher satisfaction category by 6%. While these percentage increases appear small, the work ability variables have a theoretical range of 0-100. Thus a small increase in organisational or personal capacity coincides with a relatively substantive increase in satisfaction—a variable with only three categories.
The capacity variables were moderately associated with each other (r=.56, p<.001), but still showed independent relationships with job satisfaction. This is important because although organisational and personal capacity may plausibly influence each other, they exhibit significant independent relationships with job satisfaction despite their correlation. In terms of reciprocal relationships between the two capacity variables, those with poor physical and mental health (subscales of personal capacity) may be discriminated against at work (a subscale of organisational capacity)(Kessler, Mickelson, & Williams, 1999). Likewise, low levels of support at work may negatively affect mental health (Stansfeld & Candy, 2006). However, evidence of independent effects suggests that improving organisational capacity is related to job satisfaction in a way that is not explained by differences in mental and physical health. While these relationships need to be explored in greater detail, this finding suggests that both forms of
31 Odds ratios are calculated by taking the exponential of the log odds.
50
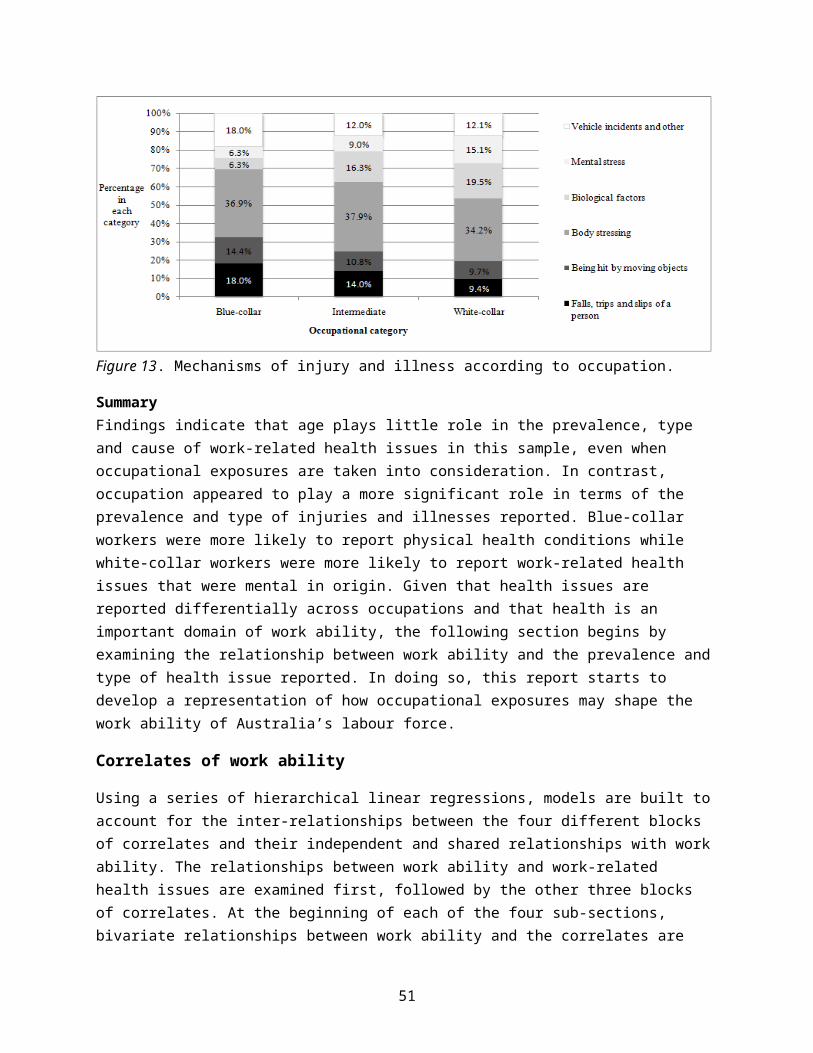
capacity are important for job satisfaction. This has important implications for the promotion of work ability as discussed in Section 5.1.
Cognitive and physical job demands had no effect on job satisfaction controlling for other variables. However, increasing age was associated with greater job satisfaction (OR=1.03, p<.001). Of note, improving self-rated work ability (WAI) was still associated with better job satisfaction after controlling for other variables including organisational and personal capacity (OR=1.41, p<.001).
Together, the independent variables explained approximately 39% of the variance32 in levels of job satisfaction, 35% of which was explained by personal and organisational capacity. This suggests that although self-rated reliability from the WAI was still a significant correlate of satisfaction, it played a relatively small role compared to work ability as measured by the WAS33. This finding provides support for the validity of the WAS as discussed in Section 4.8.2.4.
Examination of the 95% confidence intervals using multiple group analysis showed that the relationships between predictor variables and satisfaction did not differ substantively across occupational categories or for younger and older workers with one exception. Increasing organisational capacity was more associated with job satisfaction for white-collar compared to blue-collar workers. This finding suggests that in roles where the demands are mainly mental, a good psychosocial work environment (i.e. organisational capacity) is particularly beneficial for job satisfaction. However, personal capacity, job demands and the other variables were related to job satisfaction in much the same way regardless of occupational category or age group.
Regression analysis – restricted sample.For participants with a work-related health issue, significant predictors of satisfaction included organisational capacity (OR=1.05, p<.001) and personal capacity (OR=1.07, p<.001), physical job demands (OR=0.79, p<.05), self-rated work ability (OR=1.38, p<.001), age (OR=1.03, p<.001), and type of health issue (OR=1.90, p<.05). These relationships were similar to those for the full sample excepting physical demands. This indicates that work ability—as measured by the WAS and the WAI—had the same effect on satisfaction regardless of whether the participants had a work-related health issue or not. However, for those with a work-related health issue, increasing physical demands were associated with lower satisfaction for participants even after accounting for differences in age and occupation.
Job satisfaction and the subscales of work ability.At face value34, the four subscales of organisational capacity (autonomy, discrimination, supervisor and respect) showed similar relationships with job satisfaction. Bivariate relationships ranged from r=.26 (p<.001) for autonomy to r=.41(p<.001) for supervisor quality. In other words, improving organisational capacity was moderately associated with better job satisfaction and each of the components of organisational capacity played a similar role in forging this relationship.
32 According to Nagelkerke R2
33 Self-rated work ability explained 11% of the variance in job satisfaction when the effects of other variables were not accounted for.34 No formal statistical test used.
51
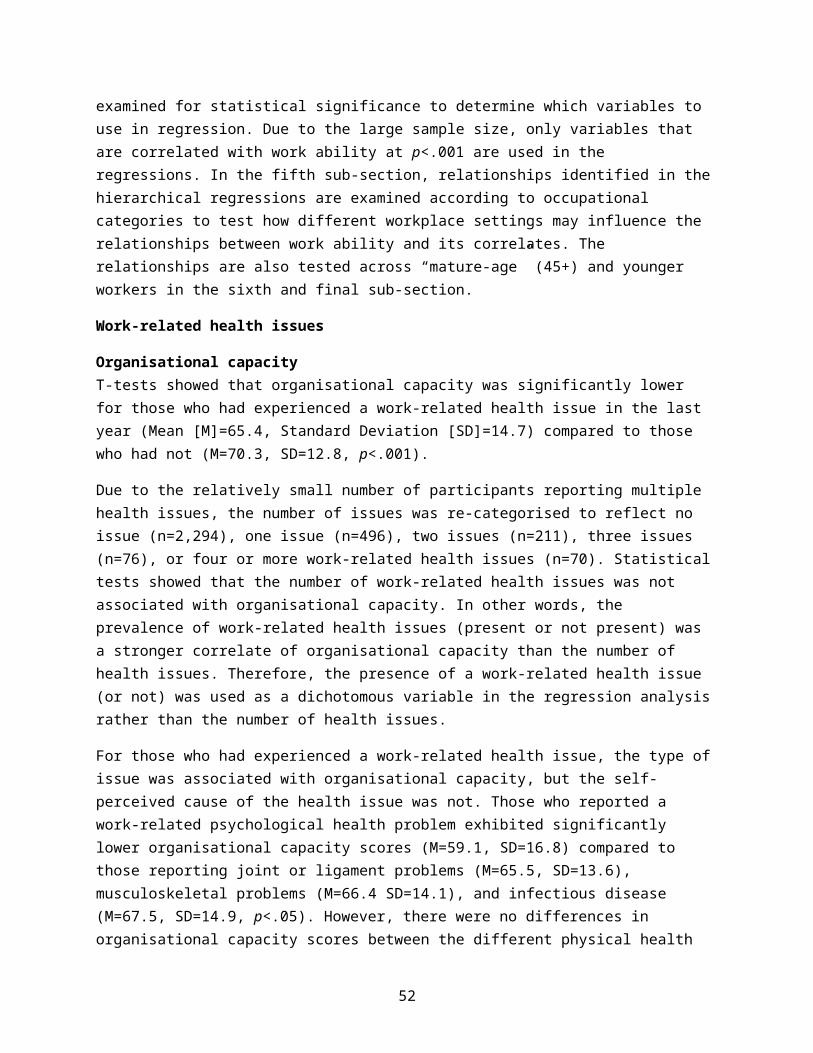
The subscales of personal capacity appeared differentially associated35 with satisfaction. Social support, psychological well-being and work benefits were moderately correlated with satisfaction (r=.35 to r=.43 respectively), while physical health, work health and safety and work-life balance were only weakly correlated (r=.15 to r=.22 respectively). Although further research is needed, these differential findings suggest that the promotion of job satisfaction through increases in personal capacity may be most effectively directed at social support, workers’ psychological health and their intrinsic and extrinsic benefits from employment.
Cross-group comparisons36 suggested that the relationships between the subscales of work ability and job satisfaction were reasonably consistent for workers with and without health issues, across different occupational exposures and age groups.
SummaryThe majority of participants in this sample were satisfied with their job as a whole. However, participants who were more satisfied in their work tended to report:
higher organisational capacity, particularly for white-collar workers higher personal capacity higher self-rated work ability older age, and decreasing physical demands (for participants with a work-related health issue).
Findings support the implementation of work ability-based pilot intervention studies to improve job satisfaction. Importantly, organisational and personal capacity played an equally strong role and independently of each other. This suggests that efforts to promote better productivity via job satisfaction could look to improve both components of work ability. However, cross group analysis suggests that improving the organisational capacity of white-collar workers may be particularly beneficial.
Findings also showed that decreasing physical demands predicted higher satisfaction for participants with a work-related health issue. Thus, the promotion of work ability for at-risk workers may need to carefully consider the types of demands they are under to best improve job satisfaction.
Finally, organisational and personal capacity played a stronger role in predicting job satisfaction compared to self-rated work ability as measured by the WAI. This finding provides support for the use of the WAS measure. In addition, the multiple subscales of the WAS provide information that the WAI cannot. Examination of the work ability subscales suggests that a focus on all the organisational capacity subscales may be beneficial for promoting job satisfaction. However, a focus on promoting social support, psychological wellbeing and work rewards may be the most effective way of improving job satisfaction through increases in personal capacity.
35 No formal statistical test used.36 No formal statistical test used.
52

Intention to be working in current job in two years’ time
Figure 19 shows that approximately 65% of the participants were at least fairly certain that they would be working in the same job in two years’ time. However, a sizeable minority (16.6%) thought it unlikely that they would be in the same work. The remaining 14.3% were unsure. For the regression analysis, intention to be in one’s job in two years’ time was treated as an ordered variable with three categories: unlikely to be in job (coded 1), not sure (coded 2), and likely to be in job (coded 3).
Figure 19. Intention to be working in current job two years from now.
Increasing intention to remain in the job was correlated with greater organisational capacity (r=.20, p<.001) and personal capacity (r=.16, p<.001). As work ability increases, so does intention to remain in the current job.
Regression analysis – full sampleOrdinal regression showed that increasing work ability as measured by both the WAS and the WAI independently predicted stronger intention to remain in the job. Increasing age and cognitive and physical demands also predicted greater likelihood of intention to stay in the job. Compared to those in white-collar jobs, blue-collar and intermediate workers had weaker intentions to remain in the same job. However, the predictor variables only explained 14.8% of the variance in intention to remain in the job with the WAS variables accounting for 7%. Self-reported work ability accounted for 5.7% of the variance, but this reduced to 2.4% when accounting for the effects of organisational and personal capacity.
Multiple group analysis showed that work ability and the other variables were slightly more correlated with intentions to remain in the job for younger versus older workers37. In particular, non-overlapping confidence intervals suggested that increasing age predicted greater intention to remain in the job for the younger workers (OR=1.07) but weaker intentions for the older group (OR=0.94). This is perhaps not surprising considering that the older group are closer to or beyond the traditional retirement age of 65 while the younger group may have a greater 37 Explained variance was 22% for younger workers and 14.6% for older workers.
53

necessity to work due to economic reasons. But whatever the nature of the relationship between age and employment intentions, the association between work ability and intention to remain in the job differed little by age.
The independent variables also explained a larger proportion of the variance for blue-collar and intermediate workers compared to white-collar workers38. Increasing mental demands were a stronger predictor of 2-year intention to remain for blue-collar (OR=1.6, p<.001) rather than white-collar workers (OR=1.3, ns). The marginally overlapping confidence intervals39 for intermediate workers (OR=1.5, p<.001) suggests a gradient effect. That is, as the demands of the job move from mainly physical to mainly mental, increasing mental job demands become a less important factor in encouraging people to remain in their current position. This finding suggests that for blue-collar workers, opportunities to use their initiative, skills and expertise may strengthen their intention to remain in their current role.
Regression analysis – restricted sampleWork ability and the other variables explained 19.4% of the variance in the intention to remain in the same job for participants with a work-related health issue. As with the full sample, increasing work ability (WAS and WAI) independently predicted greater intention to remain in the current job. Increasing cognitive demands also increased intention to remain in the same job, but physical demands were not associated with intentions after controlling for the other variables. Increasing age was also associated with the greater likelihood of intention to remain in the same job. Blue-collar workers were also marginally less likely to expect to remain in the current job compared to the other occupational categories (OR=.55, p<.05).
Intention to remain in job and the subscales of work abilityThe four subscales of organisational capacity showed weak but broadly similar correlations with intention to remain in the same job. Correlations ranged from r=.08 (p<.001) for discrimination to r=.20 (p<.001) for the supervisor subscale. The subscales of personal capacity were also weakly correlated with job intentions, but with slightly more variation. The strongest correlates of intentions to remain in the current job were improving work benefits (r=.21, p<.001) and better psychological well-being (r=.15, p<.001) and the weakest were physical health (r=.05, p<.01) and work-life balance (r=.02, ns). Between group comparisons according to age group, occupation, and presence of a work-related health issue, showed no substantive differences in these patterns.
SummaryWork ability along with the other predictor variables played a statistically significant role in explaining why some people intend to stay in their current job while other do not. For example, there was a tendency for those who expected to remain in their current job to report:
higher organisational capacity (for intermediate and white-collar workers) higher personal capacity
38 Explained variance was 21.5% for blue-collar workers, 20.1% for intermediate workers and 9% for non-manual workers.39 Blue-collar 95 CI (log odds): 0.51 – 1.19, Intermediate 95 CI: 0.23 - 0.58, White-collar 95 CI: -0.8 – 0.26.
54
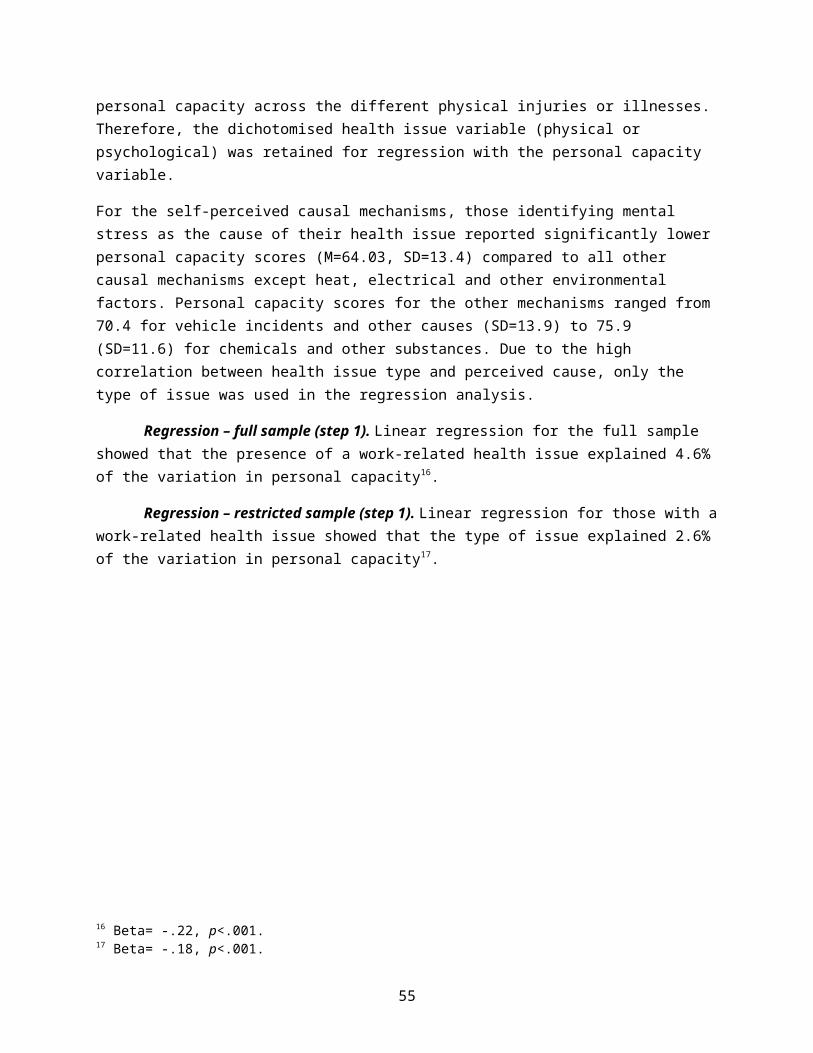
higher self-rated work ability increasing cognitive demands (particularly blue- collar and intermediate occupations and
for those with a work-related health issue) increasing physical demands (intermediate and white-collar), and white-collar rather than intermediate or blue-collar occupation.
Higher personal capacity and organisational capacity each independently contributed to explaining job-based intentions and therefore could both be considered as part of a broader strategy for promoting retainment. In particular, the promotion of a stimulating cognitive environment may encourage blue-collar workers to remain in the job. There was also some evidence to suggest that a focus on improving the organisational capacity of white-collar and intermediate workers may play a role in improving their retainment.
Age played a different role in affecting intention to remain in the job. For mature-age workers, increasing age decreased the likelihood of remaining in paid work—perhaps due to retirement— but the opposite was apparent for younger workers (those under 45). For younger workers, the necessity to work as they move towards late middle age may reflect a lack of choice in where they work, perhaps due to family commitments. While the reasons for these age-based differences can only be speculated at this stage, the finding does suggest that the way retainment is promoted should depend on the ages and stages of the target population.
Finally, the effects of work ability and other variables on intentions to remain in the job were reasonably consistent across workers with or without a work-related health issue. This finding in conjunction with the limited impact of health issues (prevalence and type of health issue) on retainment, suggests that a focus on job demands and work ability to reduce staff turnover may be equally effective across workers with and without a health issue. The cross-group consistency in the correlations between job intentions and the work ability subscales provides further support for this interpretation.
Effect of work-related health issues on capacity to work
As part of the WAI, all participants were asked the extent to which a disability, disease, illness or injury affected their ability to do their job. Figure 20 shows the majority (61.5%, n=1 968) reported no health issue and were excluded from the analysis. Therefore, this section focuses solely on those with a health issue that may or may not be work-related (n=1 222)40. Of those who did report a health issue, 46.5% reported that their issue did not hinder their work and 24.1% reported some difficulties. Due to limited responses, the remaining four categories were collapsed into one (29.4%). The three ordered categories were labelled “work not affected at all” (n= 568, coded 1), “some difficulties” (n=295) and “greater difficulties” (n=359).
40 This number includes those with a health issue that was not judged to be related to work.
55

Figure 20. Effects of health issues on ability to work.
Ordinal regression was used to examine the effects of organisational and personal capacity, job demands, self-rated work ability, occupation and age on the extent to which participants’ work is affected by their health issues. Correlation analysis indicated that as participants’ work became more affected by their health issue, their reported organisational capacity slightly decreased (r=-.08, p<.01). However, this negative relationship was more marked for personal capacity (r=-.29, p<.01), which is not surprising given the health focus of this scale.
Regression analysis – restricted sampleWithout controlling for other variables, organisational and personal capacity explained 10.7% of the variance in the effects of health issues on participants’ work. Self-reported work ability accounted for 6.9%. Together, the WAS and WAI variables explained 14% of the variance in the effects of health on capacity to work. These findings indicate that the two sets of work ability variables explain different aspects of health effects on ability to work. Addition of job demands and other variables to the regression equation increased the explained variance to 16.4%.
Findings indicate that increasing personal capacity and self-rated work ability predicted the decreasing likelihood of being affected by a health issue controlling for the other variables. However, increasing organisational capacity predicted a greater likelihood of being affected by a health issue after controlling for other variables41. Increasing physical demands were associated with the greater likelihood that the participants’ work was affected by a health issue (OR=1.41, p<.001). However, cognitive demands, age and occupational category played no role in explaining health effects on work controlling for other variables.
Health effects on work and the subscales of work abilityThe four subscales of organisational capacity showed broadly similar associations with the effect of health issues on capacity to work. Correlations42 ranged from r=0.01(ns) for autonomy to r=-.13 (p<.001) for discrimination. In terms of personal capacity, physical health had a much
41 This is likely due to a suppression effect given the negative correlation of r=-.08, between organisational capacity and health effects.42 Spearman’s.
56
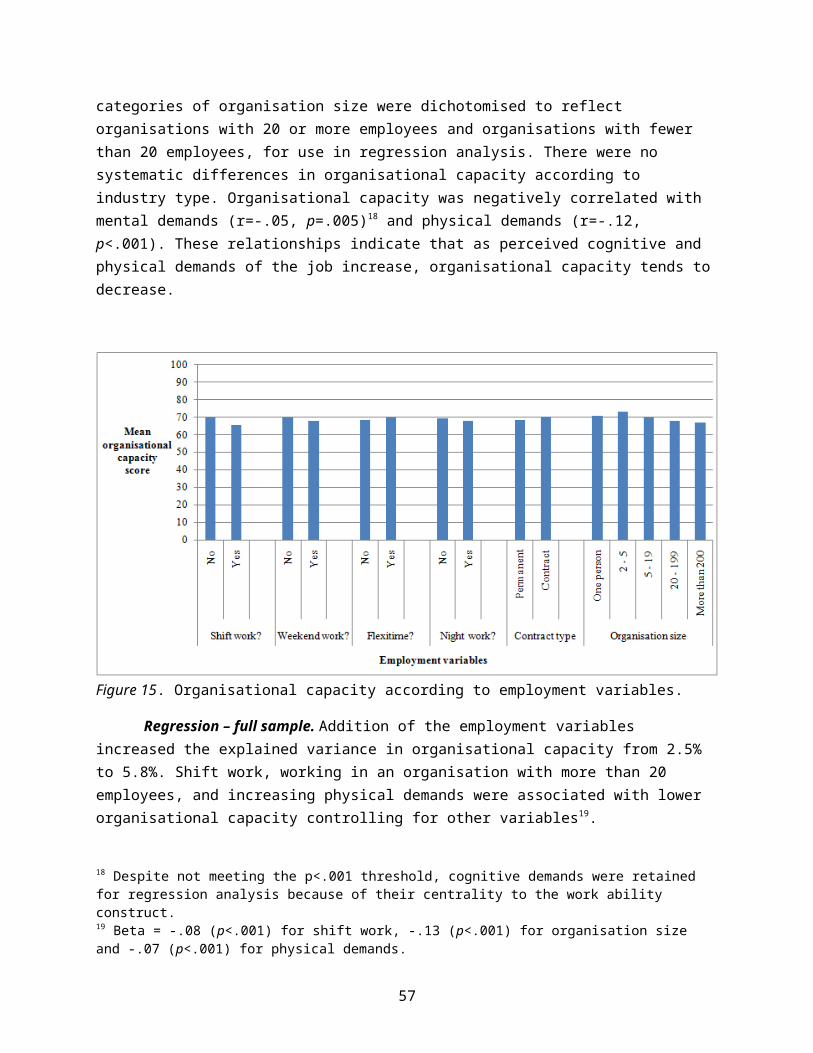
stronger relationship with health affects (r=-.58, p<.001) compared to the other five subscales whose relationships ranged from r=-.05 (ns) for work safety and health to r=-.22 for psychological well-being.
SummaryThe predictor variables played a small but statistically significant role in explaining why the working lives of some participants are differentially affected by their health issues. There was a tendency for those whose work was most affected by disease, disability, illness or injury to report:
lower organisational capacity (particularly autonomy) lower personal capacity (particularly physical health) lower self-rated work ability, and higher physical demands.
However, age and occupation did not play a direct role in predicting health effects on work.
As with satisfaction and intention to remain in the job, self-rated work ability predicted health effects on work independently of organisational and personal capacity. However, the patterns of shared and unique effects suggest that the two measures of work ability are capturing different aspects of how poor health can affect capacity to work. One advantage of the WAS measure is that one can assess which components of work ability (e.g. poor health, autonomy) are most important. Nevertheless, a single-item measure of work ability still played a role in explaining the effects of health on capacity to work—a point returned to in Section 4.8.2.4.
Absence from work
Participants who reported a work-related injury or illness in the last year also reported the total number of days or shifts they were absent from work as a result of their condition. Approximately 39% had not missed any work because of their injury or illness, 4.6% reported a part day/shift absence, 30.2% reported one to four days absence from work, 10.9% reported five to ten days, 12.1% reported more than 11 days off work, and 2.9% had not yet returned to work. Due to the low number of participants in some of these categories, they were recoded to reflect no days off work (39.2%, coded 1), up to four days off work (34.8%, coded 2) and five or more days off work (25.9%, coded 3).
There were no substantive relationships between sick leave taken and work ability as measured by the WAS or WAI. Moreover, the subscales of the capacity variables were also not correlated with sick leave taken. Absence from work was also not substantively associated with cognitive or physical demands. Based on the lack of significant relationships, regression analysis was not undertaken.
SummaryThe lack of statistically significant relationships between absences due to a work-related health issue and work ability is at odds with the literature. For instance, research has shown that lower work ability is associated with both the increased incidence of sick leave and increasing time spent on sick leave (Ahlstrom et al., 2010; see also Reiso et al., 2001).
57

Overall, increasing levels of work ability were most strongly related to increasing job satisfaction (39% of variation explained), followed by the effects of health on capacity to work (16.4%) and intention to remain in the same job (14.8%). However, work ability was not related to time taken off work.
Participants with low work ability scores
In this section, binary logistic regression is used to test the relationships between dichotomised capacity variables and health issue prevalence, socioeconomic status, demographics and employment variables (e.g. organisation size). In the absence of an established criterion for low work ability with the WAS, participants with scores in the lowest quartile were categorised as having low work ability. The second regression analysis is based on the same predictors, but workers were categorised as either having low personal or organisational capacity versus those with low scores on both capacity scales. Workers with low scores on both scales are referred to as having “low overall work ability” and represent a particularly at-risk group. The possible implications of this risk are explored in the final section where comparisons are made with job satisfaction, intention to remain in their current job, the effects of health issues on capacity to work and absence from work. It is expected that those with low overall work ability will be more disadvantaged in terms of the factors related to productivity than those reporting low scores on only one of the work ability scales.
Participants in the lowest quartile of organisational capacity scored below 61.2 on the 0-100 scale and below 68.3 for personal capacity. Together, these low work ability workers accounted for 1199 of the 3152 survey participants. In terms of low overall work ability, 398 of the 1199 workers reported both low organisational and personal capacity. Four hundred participants reported only low personal capacity and 401 reported only low organisational capacity.
Predictors of low organisational capacityThe four sets of correlates examined in section 4.5 explained 11% of the variance in organisational capacity43 when categorised as low (less that 61.2 on the 0-100 scale) and higher organisational capacity (61.3-100). Participants were more likely to be classified as low work ability if they had a work-related health issue (OR=1.7, p<.001), were older (OR=1.01, p<.01) were in a blue collar occupation (OR=0.7, p<.01), were less financially secure (OR=0.8, p<.001), worked in shifts (OR=1.4, p<.01), did not have access to flexi-time (OR=.75, p<.01), and if they worked in an organisation with more than 20 people (OR=2.3, p<.001). Factors with the strongest relationship were organisation size, financial security and injury prevalence44. In contrast, gender, education and the other employment variables did not play a role in distinguishing between workers with lower and higher organisational capacity after controlling for other variables.
These findings are largely consistent with analyses using the full range of organisational capacity scores (see section 2.3). For instance, the significance of financial security suggests that those who have fewer resources outside of work also have fewer resources at work, at
43 Hosmer and Lemeshow test not significant, indicating an adequate model fit to the data. 44 Wald = 69.0, 37.1, and 30.7 respectively.
58
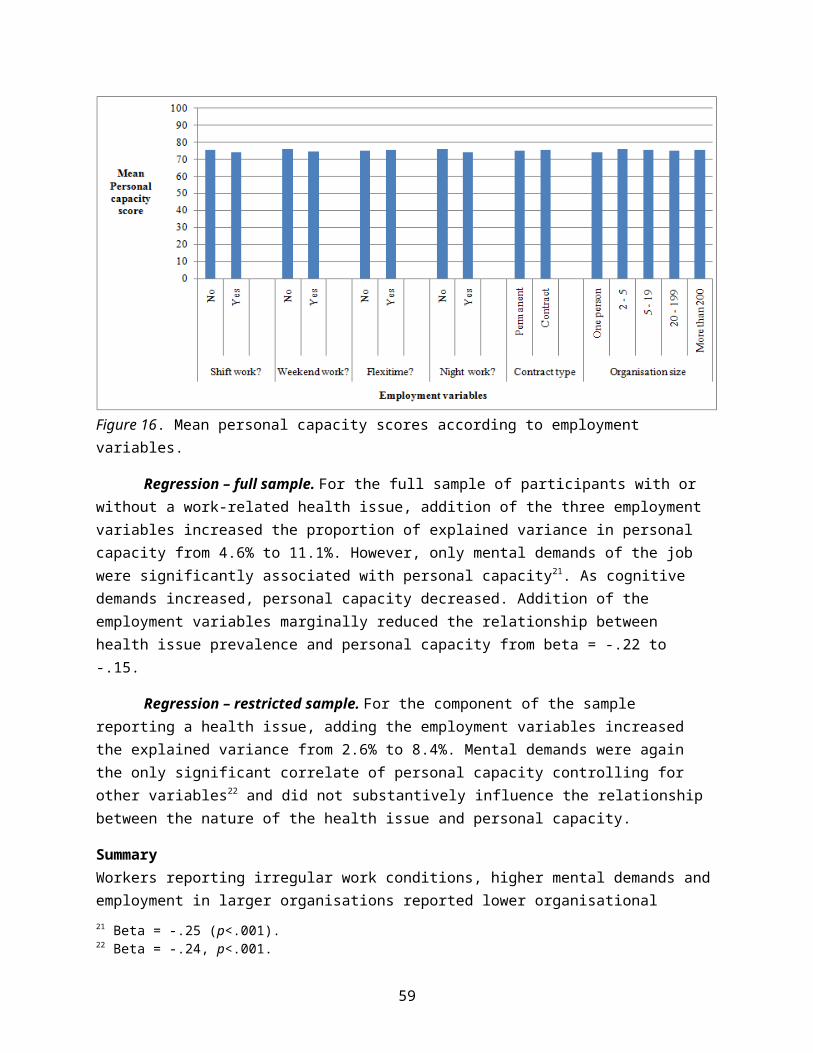
least in terms of organisational capacity. However, the size of the organisation emerged as a more important factor when low work ability participants were the focus of the analysis.
Predictors of low personal capacityThe predictor variables explained 13.8% of the variance in the dichotomised personal capacity variables45. Participants were more likely to be classified as having low personal capacity if they had a work-related health issue (OR=2.2, p<.001), were less financially secure (OR=0.6, p<.001) and not living with a partner (OR=.8, p<.01). Not surprisingly, these findings indicate that those with the lowest personal capacity have the poorest health and the fewest resources. In contrast, workplace indicators, gender and education played no role in distinguishing participants with low personal capacity from other workers. Factors with the strongest relationship were financial security and injury prevalence46. These findings are broadly consistent with those from section 2.3 and further highlight the link between low work ability and a lack of resources outside of work.
Predictors of low overall work abilityWorkers with low overall work ability tended to be distributed evenly across occupations and age groups. Not surprisingly then, the predictor variables explained only 5.8% of the variance in low overall work ability when contrasted against participants with low organisational or personal capacity. Only decreasing levels of financial security (OR=0.8, p<.001) and increasing organisation size (OR=1.9, p<.001) played a role in distinguishing those with low overall work ability from participants with low scores on only one work ability scale.
SummaryAnalyses from the previous three sections indicate that those with either low organisational or personal capacity and those with low overall work ability tend to have fewer resources outside of work compared to participants with higher levels of work ability. Findings also suggest that at risk workers tended to have a work-related health issues and were more prevalent in larger organisations. However, the low levels of explained variance in each of the three analyses (11%, 13.8%, and 5.8% respectively) indicates that low work ability workers are found across a variety of employment and occupational settings.
Low overall work ability and factors related to productivity
Job satisfactionFigure 21 shows that workers with low overall work ability were significantly less satisfied at work compared to those with low scores on only one of the work ability scales47. Approximately equal proportions of low personal or organisational capacity workers were satisfied or dissatisfied with their work. However, the combination of poor psychosocial work conditions (i.e. organisational capacity), poor health, low work rewards and work-life conflict (i.e. personal capacity) appears to play an important role in identifying the least satisfied workers.
45 Hosmer and Lemeshow test not significant, indicating an adequate model fit to the data.46 Wald = 162.6 and 72.6 respectively.47 X2(4)=115.78, p<.001.
59
Figure 21. Job satisfaction for participants categorised as having low work ability.
Intention to remain in the same jobA similar pattern (see Figure 22) was evident in regard to intention to remain in the job, but the relationship was weaker48. One reason for the weaker relationship could be that participants with low overall work ability may be dissatisfied in their work, but they may have few options in their choice of employment. Nevertheless, the combination of low personal and organisational capacity was still associated with an intention to not be in the current job in two years time. In contrast, intention to remain in the job was similar for participants with only low personal or organisational capacity.
Figure 22. Intention to remain in the job for participants categorised as having low work ability.
The effects of health on capacity to work
48 X2(4)=24.41, p<.001.
60

Figure 23 shows a different constellation of results for the effects of health on capacity to work49. Participants reporting only low organisational capacity were less affected by their health than the other two groups. Those reporting only low personal capacity, a variable that includes measures of health, were predictably the most affected by health issues. Interestingly, though, low personal capacity coupled with low organisational capacity appeared not to compound how health issues affected the participants work. This is reflected in the similar proportion of those with low overall work ability (39.7%) and those with only low personal capacity (45.9%) who reported that their health issues caused greater difficulties in undertaking their work. Likewise, 28.9% of workers with low personal capacity and 31.7% of those with overall low work ability reported that their work was not affected by their health condition.
Figure 23. The effect of health issues on capacity to work for participants categorised as having low work ability.
Absence from workSimilar to the results found in section 4.6.4, the different categories of low work ability were not associated with absence from work as a result of a work-related health issue. Participants with low overall work ability reported the same level of sick leave as participants reporting low work ability on only one of the scales.
SummaryParticipants with low overall work ability were less satisfied with work and had stronger intentions to leave their job compared to those with only low organisational or personal capacity. In contrast, the combination of low organisational and personal capacity appeared not to compound how participants’ health issues affected by their work. Understanding the factors that predict participants’ absence from work also remains a challenge. Results from Section 2.4.4 showed that work ability (WAS and WAI), job demands, and the other predictor variables were unrelated to the levels of sick leave taken. Even participants with low scores on both scales
49 X2(4)=48.00, p<.001.
61
report the same levels of sick leave as those reporting only low organisational or personal capacity. One explanation for this finding is possibly presenteeism which is likely to be high in Australia due to a high prevalence of precarious employment.
Evaluation of the WAS
The following evaluation discusses the reliability and validity of the WAS, summarises its strengths and weaknesses, and provides recommendations for potential refinement.
Scale reliability The reliability coefficients (Cronbach’s Alpha) for the items that form the subscales for organisational and personal capacity ranged from 0.6 to 0.9. Only two subscales had reliability scores below 0.7: expertise and physical health. Cronbach’s Alpha for the subscales comprising organisational and personal capacity were 0.9 and 0.8 respectively. Overall, item and subscale reliabilities were acceptable, suggesting that the items forming particular subscales were measuring the same construct.
Data were not available to assess test-retest reliability. Test-retest reliability would involve retesting a subsample of the same participants shortly after original data collection (e.g. one or two days) and comparing the responses. Test-retest reliability can be confirmed if participants’ responses in the first instance are a close match to their responses at the retest stage. It is recommended that this further test of internal reliability be undertaken in any future research.
Scale validityAn important component of evaluating the WAS is the assessment of its validity, or its ability to measure what it purports to measure. Comparisons between the competing measures of work ability are of particular interest because the WAS has been designed to address limitations of the WAI. The validity of the Work Ability Survey was evaluated in three ways:
1. by testing if the WAS is more strongly correlated with the factors related to productivity than the WAI
2. assessing whether the WAS had a more favourable distribution of responses than the WAI, and
3. assessing whether the results for the WAS were more consistent with work ability theory than those of the WAI.
In the following sub-sections, the validity of the Work Ability Survey was evaluated by:
1. examining the face validity of the measure2. assessing factorial validity through statistical modelling3. assessing the relationship between the WAS and an existing, validated measure of work
ability—the WAI (convergent validity), and4. comparing the relative strengths of the relationships of the WAS and WAI to selected
productivity variables (criterion validity).
62

Face validity of the WASAt face value, the WAS appears to assess the different domains of work ability as set out by Ilmarinen et al. (2005). It captures aspects of work, work community and leadership; motivation; family and close community, health and functional capacity. Overall the WAS has a particularly strong focus on the organisational environment but less focus on workers’ competence, training and attitudes towards work.
Work ability is defined as a “worker’s capacity to do their work with respect to the work demands and their health and mental resources” (Ilmarinen & Tuomi, 1992, p. 8). However the final version of the WAS does not assess job demands. McLoughlin and Taylor’s analysis with the current data (unpublished report) suggested that job demands should not form part of the work ability measure Their analysis showed that work ability fully explained the relationship between job demands and outcomes including the meaningfulness of work and job insecurity. Moreover, the original statistical modeling of the WAS showed significantly reduced fit to the data when job demands were added to the equation. But given the importance of job demands (mental in particular) in this report, it is recommended the work ability model could be further developed to include the interaction of organisational and personal capacity with job demands. This is an area for future research.
Factorial validity of the WASMcLoughlin and Taylor’s analysis (McLoughlin & Taylor, Unpublished Report) supported an overarching model comprising two capacity variables. Confirmatory factor analysis showed that the specification of personal and organisational capacity as higher order factors indicated by their respective subscales and individual items provided a reasonable fit to the data. The acceptable model fit infers that the items and respective subscales designed to assess personal capacity are indeed correlated with that variable but only weakly correlated with organisational capacity. In other words, the acceptable model fit indicates it is more appropriate for subscales assessing personal capacity to “load” onto that factor rather than organisational capacity and vice versa for the organisational capacity subscales.
Convergent validity: Comparing the WAS to the WAITests of convergent validity measure the extent to which two measures of the same construct are actually correlated. In this research there are two measures of work ability, the WAS and the WAI. The WAI is well validated as a measure of work ability. Therefore, to provide support for the convergent validity of the WAS it should be correlated with an already validated measure.
Aspreviously, the WAI’s primary measure—self-rated work ability compared to life time best—was positively associated with organisational capacity (r=.28, p<.001) and personal capacity (r=.39, p<.001). The slightly stronger relationship with personal compared to organisational capacity50 was expected given that both the WAI measure and personal capacity have a focus on health.
At face value the WAI measure, “effects of health on ability to work”, also appeared to differentially associated with organisational capacity (r=-.09, p<.001) and personal capacity
50 No formal statistic used.
63
(r=.28, p<.001). This differential finding was also expected due to the stronger emphasis on health in the personal capacity scale.
Intention to remain in one’s current position, the final WAI measure, was also associated with organisational capacity (r=.25, p<.001) and personal capacity (r=.21, p<.001). Similarity in these relationships was also expected as people may want to leave their job due to poor health (i.e. personal capacity) or because of a poor psychosocial climate at work (i.e. organisational capacity).
Overall, the correlations between the WAS and WAI variables were perhaps lower than expected. However, the constellation of differential results did create confidence in the measure. Moreover, self-rated work ability compared to lifetime best was associated with intentions to remain in one’s job and the effects of health on ability to work in the same way as personal capacity as shown in Table 5. Finally, the moderate inter-correlations show that the WAS is not a proxy for the WAI, an important point when determining which is a better correlate of the productivity variables.
Table 5. Pearson’s Correlations Between the WAS and WAI Variables.
Organisational capacity
Personal capacity
Self-rated work ability
(WAI)
Employment intentions
(WAI)
Personal capacity .56***
Self-rated work ability (WAI) .28*** .39***
Employment intentions (WAI) .25*** .21*** .25***
Effects of health on ability to work (WAI) -.09** -.28*** -.29*** -.09*****p<.001, **p<.01
Criterion validity: WAS, WAI and productivity variablesTests of criterion validity assess the extent to which a measure predicts an outcome based on information from other variables. In the absence of an objective employment-based behavioural benchmark such as staff turnover or job performance, the productivity variables are used as criteria with which to assess the predictive strength of the WAS versus the WAI.
Organisational capacity and personal capacity were more strongly associated with job satisfaction (35% of the variance) compared to the WAI measure (11% of the variance). However, the WAI still explained a small proportion of variance in job satisfaction that was not explained by differences in WAS scores.
Intentions to remain in one’s job were also more strongly correlated with the WAS measure (7% of the variance) compared to the WAI measure (5.7%). After accounting for the effects of the WAS on job intentions, the WAI still exhibited a small but significant independent relationship.
The effects of health issues on ability to work were also more strongly correlated with the WAS (10.4% of the variance) compared to the WAI (6.9%). However, when the two variables were
64
entered together, the WAI still showed a significant independent relationship with the effect of health on ability to work.
Overall, the data suggest that organisational and personal capacity are better predictors of job satisfaction, intentions to remain in one’s job and the self-perceived effects of health issues on ability to work compared to the WAI measure51. However, the WAI measure still accounted for some independent variance in the three measures of productivity. Considered together the results suggest that the WAS and the WAI assess both similar and divergent aspects of work ability. When examining how the relationship between the WAS with the productivity variables change when the WAI is added, it tends to be only the relationship between personal capacity and productivity which is affected. This finding is to be expected given the WAI and personal capacity both have a focus on health, resulting in substantive shared variance. It appears then that measuring work ability in terms of the organisation introduces a new dimension to the measurement of work ability, one that explains elements of productivity not accessible with the WAI. Nevertheless, the WAI is still independently associated with the productivity variables and this needs to be better understood and incorporated into the WAS as explained in Section 4.8.6.
Distributional properties of the WAS compared to the WAIFigure 24 compares the distributions of the competing work ability measures. For comparative purposes, the personal and organisational capacity variables have been rescaled52 to have a range of 1-5. The data show that the personal and organisational capacity variables were still skewed towards the high end of the scale. However, the WAS measures did exhibit weaker ceiling effects than the WAI, particularly for organisational capacity. This is important for future intervention research as, based on this data, it would be easier to identify an increase in work ability using the WAS than the WAI. For example, 41% were categorised in the highest level of work ability for the WAI compared to only 19% for organisational capacity. It is also important to note, that due to scaling in Figure 24, the variation within the categories for the capacity variables is hidden (see Figure 4 and Figure 5).
51 Self-rated work ability compared to lifetime best. It is worth noting again that this measure accounts for the majority of the variance in the full WAI measure. Thus, it is a suitable proxy for the WAI in the absence of the full scale.
52 Capacity scores ranging from 0 to 20 were recoded “1”, 20.001 to 40 as “2”, etc.
65

Figure 24. Distribution of WAS and WAI scores.
General comments on the WASAlthough this preliminary research shows good potential for the use of the WAS as a tool for assessing work ability, there are some areas that could be further refined. First, summary scores derived from simple summation or factor analysis may hide important information useful for the promotion of work ability. For example, scores on worker autonomy were low compared to the other scales of organisational capacity while a lack of perceived age discrimination was also evident in the data. Summarising these scores masks these differences. Therefore it is important that attention is paid to the subscales in addition to the capacity scores. In the current research psychological health emerged as an important component of personal capacity whereas self-assessed competence in occupational safety and health, a further indicator of personal capacity, did not.
The scale’s focus on the organisational environment is an important strength. In the current research organisational capacity was associated with the productivity variables in a way that the WAI could not explain, perhaps due to its focus on health. Considering functional capacity and the organisation together provides many more opportunities for promoting work ability.
At 53 items, the WAS is relatively long particularly compared to the WAI. While the scale does provide a comprehensive picture of work ability, it may be at the expense of response rates or uptake in work ability research.
Overall, the measure performed as expected. The WAI with its focus on health was more correlated with personal than organisational capacity. Decreasing work ability as measured by the Work Ability Survey was associated with higher incidence of work-related health issues, declining socioeconomic resources, non-normal working hours, lower status occupations and lower productivity as assessed by three proxies. Finally, the WAS has also started to address some of the WAI’s limitations such as the ceiling effects and narrow focus.
66
Summary of the strengths and weaknesses for the WAI and the WASTable 6. Summary of WAI Strengths and Weaknesses.
WAI – Strengths Widely used and validated measure of
work ability Relatively brief compared to the WAS
WAI - Limitations Does not capture the most up-to-date
conceptualisations of work ability Summary WAI score is heavily influenced
by health. Therefore the scale may function as a quasi-proxy for workers’ functional capacity
Ceiling effects make it difficult to demonstrate improvements in work ability
Table 7. Summary of WAS Strengths and Weaknesses.
WAS - Strengths Items have good face validity compared to
work ability theory Evidence for factorial, convergent and
criterion validity Scale indicators show good internal
reliability Weaker ceiling affects compared to the
WAI Focus on the psychosocial characteristics
of the organisation provides new directions for intervention that cannot be assessed with the WAI
WAS – Limitations At 53 items, the WAS is quite long Some aspects of the work ability model
remain unmeasured Test-retest reliability still to be assessed There is still some skew towards higher
work ability scores Currently no data on the relationship
between the WAS and objective employment/productivity behaviour such as staff turnover and job performance
Summary scores for capacity variables may hide important relationships between subscales (e.g. psychological health) and productivity outcomes
Relatively untested compared to WAI
Recommendations for refinement of the WASWhile the evaluation of the WAS provided support for the scale’s use in pilot intervention studies, future research could further strengthen the measure and provide different options for researchers and organisations wishing to use the scale. University of Sydney researchers are currently refining the WAS across three dimensions:
1. Reconfiguration of the variables to capture the five different components of work ability theory (Ilmarinen et al., 2005) for comparisons against the existing, two-capacity model.
One option for further developing the WAS is to test its current factor structure against an alternative configuration of variables. An alternative configuration could be based on a wider version of Ilmarinen’s new conceptualisations. For example, capacity summary scores could be reconfigured to assess: health and functional capacity; worker competence; values, attitudes and motivations; work, work community and leadership (i.e. organisational capacity); and family
67
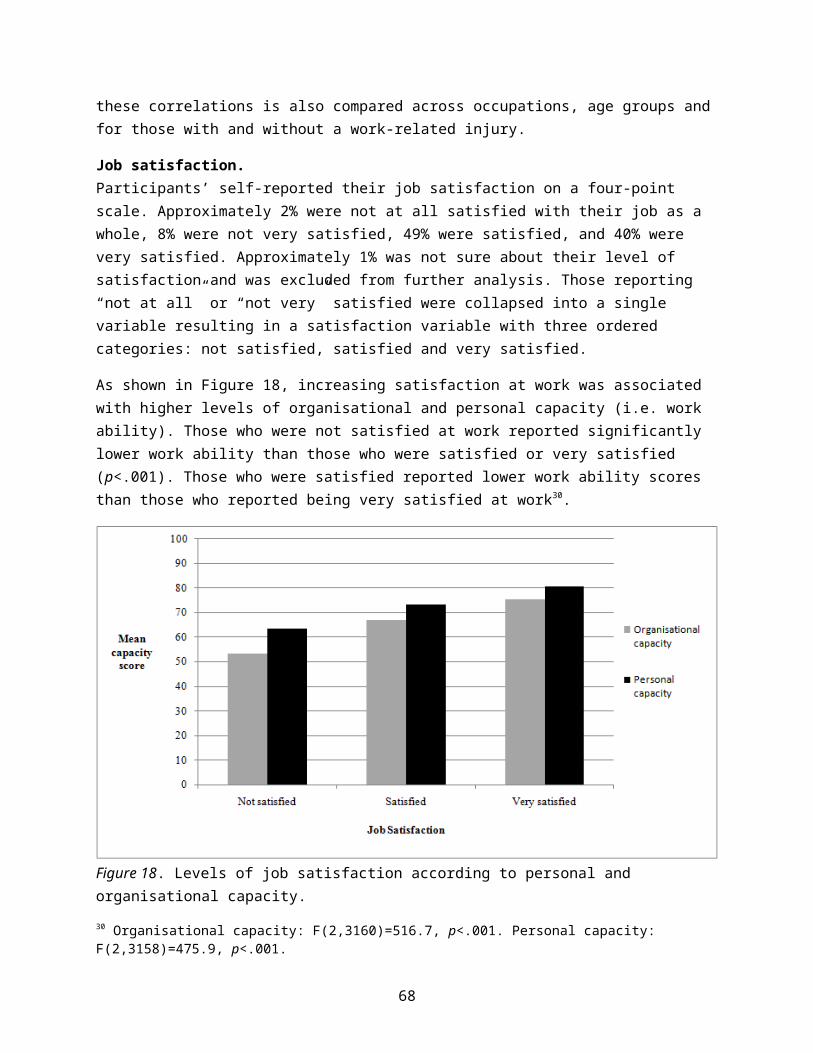
and close community. In the current version of the WAS, all the subscales except those relating to work, work community and leadership are combined to form a personal capacity variable. The alternative version of the WAS would have five capacity variables. The advantage of this alternative version is that important relationships (e.g. those relating to psychological wellbeing) would be less likely to be hidden within a broad summary score.
Different versions of the WAS could be examined according to the correlates and productivity variables considered in the current report. If the original version of the WAS out performed the alternative, this would provide support for the initial version. Otherwise an alternative version may be more appropriate.
2. Development of a brief measure of the WAS
Depending on which version of the WAS is deemed most appropriate, the number of items could be reduced to produce an alternative short version of the WAS. There are numerous ways of reducing subscale items such as the retainment of items with the highest factor loadings. Models based on fewer items could be compared against the productivity variables and other correlates to ensure that as little information is lost as possible. The advantages of a smaller measure are reduced levels of participant fatigue and perhaps the greater uptake of the scale in future research. Disadvantages include the potential loss of information and lower levels of reliability, particularly if one-item subscales are used.
3. Incorporation of the interaction of job demands with the capacity variables.
The original definition of work ability is a “worker’s capacity to do their work with respect to the work demands and their health and mental resources” (Ilmarinen & Tuomi, 1992). However, McLoughlin and Taylor’s statistical analysis (unpublished report) suggested it was inappropriate to include demand-based variables alongside the WAS. Nevertheless, the interaction of organisational and personal capacity with job demands has not been considered and job demands emerged as an important variable in the current research. One option would be to create categories of workers: Low work ability/low demands, Low work ability/high demands, high work ability/high demands, and high work ability/low demands. Incorporating the relationship between capacity and demands is more aligned with the definition of work ability and may uncover important relationships. For example, it is plausible that low work ability workers with low job demands may report better productivity outcomes compared to low work ability workers with high demands. Finally, a version of the WAS that more closely matches the definition of work ability’s may explain the aspects of the WAI that were not accounted for by the WAS in their prediction of the productivity variables.
SummaryThe overall performance of the WAS in this cross-sectional research environment provides support for its use as an assessment tool in pilot intervention studies. The scale showed acceptable internal consistency and face and factorial validity. Evidence was also provided for the convergent and criterion validity of the WAS. However, intervention research and longitudinal analysis to test the capacity of the WAS in predicting employment outcomes are needed to further establish the scale’s validity. The distribution of WAS scores also showed less
68

evidence of ceiling effects compared to the WAI and demonstrated the potential to provide more detailed information for work ability intervention than the WAI. Nevertheless, the WAS could be further refined by reconfiguring the variables to better align with work ability theory and by producing a short version of the scale. These refinements would provide alternatives for researchers and organisations alike.
Discussion and ImplicationsThis report aims to improve understanding of the work ability of the Australian labour force and identify targets for intervention. Due to the cross-sectional nature of the data used here, which cannot establish cause and effect, and the low response rate, which limits representativeness, the present results do not provide a firm evidence base for enhanced policy and practice, but rather provide indicative findings from which to develop further longitudinal and intervention research. Nevertheless, the report provides support for the WAS as a measure of work ability and highlights potential avenues for work ability promotion. The major findings and implications for pilot intervention studies are summarised in Table 8 and discussed in greater detail below.
Table 8. Summary of Major Findings and Implications for Intervention Studies
Major findings Implications for future researchWorkers with higher work ability were more satisfied with their job, had stronger intentions to remain in their current job and were less affected by health issues than workers with lower work ability.
Findings support the implementation of pilot work ability-based interventions studies designed to improve employment outcomes.
Organisational and personal capacity where independently associated with satisfaction and intention to remain in a job, even after controlling for other important variables.
Interventions should promote improvements in both organisational and personal capacity.
Most organisational capacity subscales were associated with job satisfaction and intention to remain in a job, but fewer subscales of personal capacity showed similar associations
At least initially, interventions should focus on improving psychosocial work conditions in addition to psychological health and work benefits.
Age was not associated with overall work ability, but was associated with some work ability subscales.
Workers of all ages could benefit from work ability interventions but targeted interventions could focus on physical health for older workers and both psychological health and autonomy for younger workers.
Blue-collar workers reported lower organisational capacity than intermediate and white-collar workers. Community and serviceworkers reported the most work-related health issues.
Intervention studies could target the specific problems of these groups initially. However, the relationships were not strong enough to preclude wider application of interventions to address the specific problems identified here.
Workers with a work-related health issue, especially psychological rather than physical
Workers, across age and occupational groups, with work-related health issues, particularly
69

Major findings Implications for future researchWorkers with higher work ability were more satisfied with their job, had stronger intentions to remain in their current job and were less affected by health issues than workers with lower work ability.
Findings support the implementation of pilot work ability-based interventions studies designed to improve employment outcomes.
Organisational and personal capacity where independently associated with satisfaction and intention to remain in a job, even after controlling for other important variables.
Interventions should promote improvements in both organisational and personal capacity.
Most organisational capacity subscales were associated with job satisfaction and intention to remain in a job, but fewer subscales of personal capacity showed similar associations
At least initially, interventions should focus on improving psychosocial work conditions in addition to psychological health and work benefits.
Age was not associated with overall work ability, but was associated with some work ability subscales.
Workers of all ages could benefit from work ability interventions but targeted interventions could focus on physical health for older workers and both psychological health and autonomy for younger workers.
conditions, had lower work ability, independent of SES, demographics or workplace conditions.
mental stress, are a potential target group for work ability promotion.
Participants reporting low organisational and personal capacity were less satisfied with their jobs than those reporting low scores on only one capacity variable.
Interventions aimed to improve job satisfaction should promote both organisational and personal capacity.
As socioeconomic status decreased, work ability also decreased, even after accounting for the effects of the other study variables. This relationship was strongest for personal capacity.
A focus on those with low socioeconomic resources may be warranted. Socioeconomic status could be incorporated into a work ability model.
Participants working in larger organisations reported lower organisational capacity. This was particularly evident for younger workers and for those with low overall work ability.
Pilot intervention studies could look to initially target organisations with more than 20 employees with a particular focus on younger workers.
Organisational capacity was a stronger correlate of job satisfaction for white-collar workers.
Intervention aimed at improving job satisfaction through the promotion of organisational capacity may be most effective for white-collar workers.
Mental demands were a stronger correlate of intention to remain in one’s job for blue-collar rather than white-collar workers.
The promotion of a stimulating cognitive environment may improve the retention of blue-collar workers.
The WAS predicted job satisfaction and employment intentions independently of the
Provides support for the use of the WAS as a work ability assessment tool. However, more
70
Major findings Implications for future researchWorkers with higher work ability were more satisfied with their job, had stronger intentions to remain in their current job and were less affected by health issues than workers with lower work ability.
Findings support the implementation of pilot work ability-based interventions studies designed to improve employment outcomes.
Organisational and personal capacity where independently associated with satisfaction and intention to remain in a job, even after controlling for other important variables.
Interventions should promote improvements in both organisational and personal capacity.
Most organisational capacity subscales were associated with job satisfaction and intention to remain in a job, but fewer subscales of personal capacity showed similar associations
At least initially, interventions should focus on improving psychosocial work conditions in addition to psychological health and work benefits.
Age was not associated with overall work ability, but was associated with some work ability subscales.
Workers of all ages could benefit from work ability interventions but targeted interventions could focus on physical health for older workers and both psychological health and autonomy for younger workers.
WAI. refinement is needed.Job demands are related to productivity outcomes independently of work ability, particularly for workers with a health issue.
Job demands should be incorporated into a work ability model.
Increasing mental demands were associated with poorer work ability.
Attention should be paid to the mental stress related to increasing mental demands.
Work ability and factors related to productivity
The study findings showed that both organisational capacity and personal capacity were independently associated with job satisfaction and intention to remain in one’s current position. This was still the case even after accounting for differences in socioeconomic status, job demands and workplace factors including prevalence of work-related health issues, non-standard hours, and the size of the participants’ organisation. The work ability variables were also equally associated with satisfaction and employment intentions for older and younger workers. However, organisational capacity was a stronger correlate of job satisfaction for white-collar compared to other workers. In general, each of the different components of organisational capacity (i.e. autonomy, supervisor, discrimination, and respect) were equally well associated with job satisfaction and job status intentions but were, not surprisingly, uncorrelated with the perceived effects of health issues on capacity to work. In terms of the relationship between personal capacity and the productivity outcomes, the strongest correlates were work benefits (e.g. remuneration, and meaningful work), social support, and psychological wellbeing. Physical health was the sole work ability subscale associated with perceived effects of health on capacity to work. It is also important to note that work ability was not associated with work absence due to sick leave.
71
Although further longitudinal and intervention-based research is needed, these findings suggest that the comprehensive promotion of work ability in pilot intervention studies may play a role in improving job satisfaction and intention to remain in one’s job. For instance, improving working relationships between managers and staff, reducing discrimination in the workplace, and allowing workers more control over their working conditions may encourage people to remain in their current position. Other areas warranting further research and pilot evaluation include the promotion of psychological health outcomes and the personal meaning workers gain from their role. Consistency in the findings across age suggests that promotional initiatives could be beneficial for employees of all ages rather than focusing on particular age groups. This point is elucidated in the following sections, which discuss where and how work ability may be best promoted. In contrast, the promotion of organisational capacity may be beneficial for job satisfaction in all workers, but white-collar workers in particular.
Age and work ability
Ilmarinen and Rantanen (1999) note that the organisation should promote work ability in older workers because the organisation is where workers reside and cope with their strengths and weaknesses. They argue that the best way to promote the work ability of an ageing workforce is to employ age management policies in the workplace. Their research suggests this should be accomplished by training managerial/supervisory staff to: develop a more positive attitude towards their own ageing and that of their workers, find solutions that acknowledge changing strengths and weaknesses with ageing, and develop open communication strategies for dealing with the changing nature of the workforce (Ilmarinen, 2006; Tuomi et al., 2001). However, findings from the current research suggest the promotion of work ability should occur for both older and younger workers, albeit in slightly different ways.
Although the previous research suggests that work ability decreases with age (Ilmarinen & Tuomi, 1992; Pohjonen, 2001), the current research found no age differences in work ability as measured by the WAS or the WAI. However, there were some differences in the subscales of the WAS. Older workers tended to report poorer physical health while younger workers reported poorer psychological health and self-perceived autonomy. As the WAI, the primary assessment tool for measuring work ability, has a strong focus on health (Gould, Ilmarinen, Järvisalo, et al., 2008), age differences in work ability found in previous research may be due to age declines in functional capacity. This is important because functional capacity is only one aspect of work ability. Factors such as autonomy and psychological health can also influence a worker’s capacity to meet the demands of the job (Gamperiene, Nygård, Sandanger, Lau, & Bruusgaard, 2008; Pohjonen, 2001; Tuomi et al., 2001). Our findings show that it is actually younger workers who are disadvantaged in these domains. Moreover, working in a larger organisation was a stronger correlate of poor organisational capacity for younger rather than older workers. Compared to older workers, younger workers were also less satisfied with their job, an important point given that job satisfaction was positively associated with autonomy at work. Finally our cross-group analyses showed that age had no bearing on the relationships between work ability and work-related health issues, workplace indicators, SES, demographic indicators and job satisfaction.
72

Considered together, these age-related findings tentatively suggest that work ability could be effectively promoted in pilot intervention studies across working careers rather than at specific age groups as it is associated with productivity outcomes for both younger and older workers. However, the promotion of work ability could be tailored to specific age groups. For example, an initial focus on promoting autonomy and psychological health for younger adults and physical health for older adults may be particularly efficient in improving work ability and its related outcomes.
Work-related health issues
Our findings were consistent with previous research, which suggests limited age differences in the incidence of work-related injury but that older workers take longer to recover (Zuhosky et al., 2007). Results also showed no age differences in the type of injury or illness. Community and Personal Service workers reported the highest rate of work-related health issues and Managers the least. Findings also showed that those working in “blue-collar” occupations were more likely to report wounds or laceration-type injuries while “white-collar” workers tended to report health issues that were based on mental stress. This finding is consistent with the differential job demands that characterise blue- and white-collar work. However, musculoskeletal injuries were reported relatively evenly across the occupational categories. The relationships between work-related health issues and occupation were also consistent across age categories. Blue-collar workers tended to report higher rates of wounding and laceration regardless of age. This finding suggests that a focus on occupational exposures rather than age differences in the promotion of work ability could be further explored.
Those with a work-related health issue tended to report lower organisational and personal capacity compared to those in better health. Results also indicated that those with a mental stress versus a physical health issue also tended to report lower work ability. However, the correlations were weak and the cross-sectional nature of the research precludes a cause and effect explanation. Finally, the findings from the hierarchical regression analysis suggest that relationships between work ability and both the prevalence of work-related health issues and their foundation were not dependent on the participants’ socioeconomic status, demographics or workplace indicators. In other words, those with a work-related health issue, but particularly one that was related to mental stress, report lower work ability across a wide array of employment contexts and personal circumstances. Therefore the promotion of work ability for injured or unwell workers could occur comprehensively across sectors and a greater focus on mental stress and psychological health at work could also be explored in pilot intervention studies. A focus on psychological health is further supported by the finding that work ability decreases as mental demands increase, a point discussed in Section 5.6.
Socioeconomic and demographic factors
Regression analysis indicated that the social support provided through marital status had little bearing on work ability and the same was apparent for education. However, those in financially adverse situations and those working in blue-collar occupations reported lower organisational and personal capacity compared to wealthier white-collar and intermediate workers. Given the known association between low socioeconomic status and poor health outcomes (Adler &
73

Ostrove, 1999) and the focus on health in the personal capacity variable, it is not surprising that those in financially adverse circumstances reported lower personal capacity. However, those with fewer socioeconomic resources also reported poorer psychosocial workplace conditions (i.e. organisational capacity). These relationships remained stable across occupational categories, suggesting that work ability initiatives could be initially focused on lower SES workers across occupations and industries rather than solely blue-collar workers.
Workplace indicators
The major finding from the workplace data was that younger participants (less than 45 year old) working in organisations with greater than 20 employees reported lower organisational capacity. This finding was consistent across occupational categories and after accounting for differences in work-related health issues, demographics and socioeconomic status. In addition, there was some evidence that those working non-standard work hours report poorer organisational capacity, but the relationship was weak.
It is plausible that the needs of younger workers get “lost” in larger organisations in contrast to older workers who more likely to have had more time to adapt to the organisational demands. Therefore pilot intervention studies could look to initially focus on larger organisations, particularly if the focus is on improving the work ability of younger workers. However, more research is needed to identify the threshold in terms of organisation size.
Mental and physical job demands
There was a tendency for reported levels of organisational capacity and personal capacity to increase as the mental demands of the job decreased. In regression analysis, job demands tended to be only weakly associated with satisfaction, intentions to remain in one’s current job and the effects of health on capacity to work. However, increasing physical demands reduced the job satisfaction of workers with a health issue. Findings also suggested that increasing cognitive demands were associated with greater intention to remain in one’s current position for blue-collar workers. Considered together these findings suggest that careful attention to workers’ mental load could be an important component of promoting work ability and job retention. In contrast, intervention studies could focus on the physical demands of work when promoting the work ability of injured workers.
Participants with low work ability
When participants categorised as having “low” work ability were differentiated from other workers, similar relationships emerged. For instance, low work ability participants tended to work in larger organisations, were living in more financially adverse circumstances, and were more likely to have a work-related health issue. Findings also showed that participants with low scores on both organisational and personal capacity were significantly less satisfied with their work and had weaker intention to remain in the current position compared to workers with low scores on only one of the work ability scales. This finding suggests that it’s the combination of both low personal and organisational capacity that is most detrimental for productivity.
74
In terms of the implications, these findings corroborate those above. Pilot intervention studies could focus on injured workers with fewer resources working in larger organisations. However, the weak relationships mean that other workers should not be precluded from intervention. Regardless of where interventions are directed, findings suggest both organisational and personal capacity should be the focus. However, before pilot intervention studies proceed it is recommended that the WAS is further refined as discussed in Section 4.8.
Study limitations
Cross-sectional survey research carries inherent limitations that impact on the conclusions that can be drawn. The most important of these limitations is the inability to infer cause and effect. Nevertheless, it was necessary to undertake a national study in order to test a new measure of work ability and to provide avenues for longitudinal and intervention research.
The low response rate and under-representation of particular industries and occupations were also limitations of the study. As noted in Section 3.1, the survey instrument to longer than 30 minutes to administer and it is likely that this played a role in the low response rate. The low response rate and lack of representativeness mean that further caution must be taken in terms of the study results, particularly in terms of generalisation to Australia’s working population.
Although an artifact of the sampling strategy, the study did not include those who were currently out of work or retired. This presents a number of problems. Firstly, excluding those not currently working makes it impossible to assess the extent and impact of healthy worker effects. Second, excluding non-workers eliminates an important outcome of work ability—early retirement and/or staff retention.
Future research on work ability
The positive relationships between work ability and the productivity-related factors examined in this report provide support for the piloting of work ability intervention studies aimed at improving employment outcomes. Pilot interventions should aim to improve the design of work to minimize hazards and risks while taking into consideration specific issues identified for different groups of workers.
The findings also provide support for the use of the WAS as an assessment tool for measuring work ability in pilot intervention studies, particularly if the recommended refinements are made. Intervention research would ideally use employment-based behaviours such as staff-retention and job performance as well as job satisfaction and intentions to remain in one’s current position. In conjunction with cross-sectional data, quasi-experimental research is essential for informing policy and practice and the current research offers guidance on how pilot intervention studies could be initially implemented. Avenues include:
1. a focus on larger organisations and the younger workers within them2. targeting of the blue-collar workforce and the transport, postal and warehousing
industries and the combination of demands these workers experience3. a focus on people with a work-related health issue, particularly psychological health4. targeted intervention for those in adverse financial situations
75

5. tailoring of work ability interventions according to age groups rather than a focus on particular age groups, and
6. careful monitoring of workers’ mental and physical job demands.
However, it is important to reiterate that the relationships between the WAS and its correlates were not strong enough to exclude a cross-sector approach to the promotion of work ability. The data suggest that workers with low work ability are located across all occupations and age groups. However, this finding may be due to the lack of representativeness in the data. Therefore it is also recommended that additional, preferably longitudinal, survey research is undertaken. The use of a shorter survey instrument would likely improve the response rate while longitudinal research introduces the ability to make predictions about the effects of work ability on productivity over time.
Concluding Comments
The ageing of the Australian workforce is expected to have significant social and economic effects. The most publicised is a rapidly increasing proportion of the population that is no longer in paid employment and the resultant strain on health and social systems. As a result, policies have been put in place to prolong the employment of Australia’s older workers. Work ability may become an increasingly important factor in the context of ageing workforces and political strategies to maximise worker participation. For example, European research has shown that as employees’ work ability increases, so do their levels of productivity, workforce participation and satisfaction with their work (Salonen et al., 2003; van den Berg et al., 2011). The promotion of work ability may therefore have significant economic, social, industrial and individual benefits. However, European findings cannot be uncritically generalised to Australia’s unique geographical, political, economic and social context. Instead a national Australian work ability program would be needed to inform employment and work management policies. This report represents an early contribution to the development of such any such program.
The research described in this report evaluated a new assessment tool for measuring work ability. The WAS shows good potential as an assessment tool for organisations and for future evaluation and survey research. However, several refinements were identified that are likely to increase the WAS’s discriminatory power and its value as a research and evaluation instrument.
The present findings also provide guidance on the direction of future work ability research in Australia, particularly pilot intervention studies. Importantly, the findings suggest that workers of all ages could benefit from targeted intervention programs. However, several potential populations for targeted interventions were also identified, such as younger workers in larger organisations, lower socioeconomic status and blue collar workers, white-collar workers in relation to job satisfaction, and workers experiencing health issues, particularly mental stress. Careful attention should be paid to workers with high mental demands due to the evidence of possible detrimental effects of mental stress and the benefits of promoting a cognitively stimulating environment.
While this study has provided valuable preliminary data, further research would be needed before priorities for policy change can be identified. Firstly, longitudinal and intervention studies
76
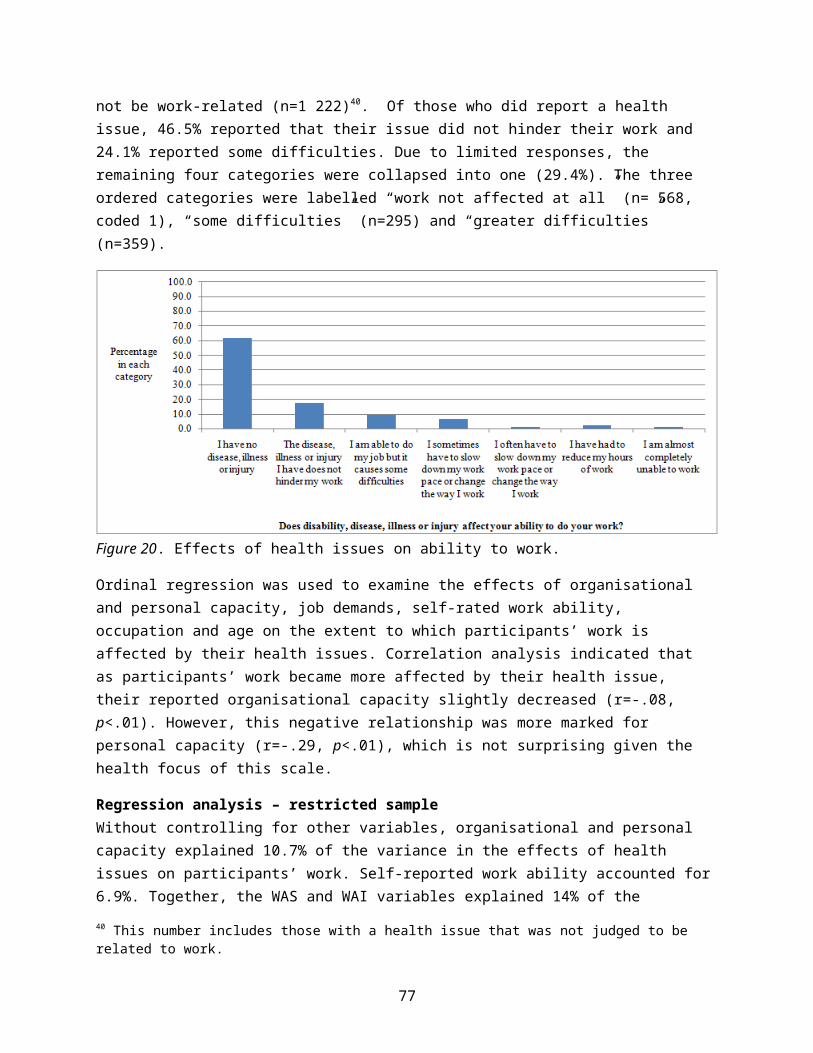
are needed to answer questions about cause and effect. For example, can interventions designed to improve the psychosocial work environment, a widely neglected element of work ability, produce valuable improvements in health and productivity? Do improvements in work ability lead to increased organisational commitment and job satisfaction? Quasi-experimental intervention studies should also be supplemented by longitudinal research to track to what extent changes in work ability over time predict health, productivity and attitudes to work and retirement. This knowledge will provide the necessary background for informed policy decision making.
77

ReferencesAbdolalizadeh, M., Arastoo, A., Ghsemzadeh, R., Montazeri, A., Ahmadi, K., & Azizi, A.
(2012). The psychometric properties of an Iranian translation of the Work Ability Index (WAI) questionnaire. Journal of occupational rehabilitation, 22(3), 401-408.
Adler, N. E., & Newman, K. (2002). Socioeconomic disparities in health: pathways and policies. Health Affairs, 21(2), 60-76.
Adler, N. E., & Ostrove, J. M. (1999). Socioeconomic status and health: what we know and what we don't. Annals of the New York Academy of Sciences, 896(1), 3-15.
Ahlstrom, L., Grimby-Ekman, A., Hagberg, M., & Dellve, L. (2010). The work ability index and single-item question: associations with sick leave, symptoms, and health–a prospective study of women on long-term sick leave. Scandinavian Journal of Work, Environment and Health, 36(5), 404-412.
Australian Bureau of Statistics. (2013). Measures of Australia's Progress, 2010. Canberra.
Bennington, L., & Tharenou, P. (1996). Older workers: Myths, evidence and implications for Australian managers. Asia Pacific Journal of Human Resources, 34(3), 63-76.
Berkman, L. F., Glass, T., Brissette, I., & Seeman, T. E. (2000). From social integration to health: Durkheim in the new millennium. Social Science and medicine, 51(6), 843-857.
Bohle, P., Buchanan, J., Cooke, T., Considine, G., Jakubauskas, M., Quinlan, M., . . . Ryan, R. (2009). The evolving work environment in New Zealand: implications for occupational health and safety. Wellington: National Occupational Health and Safety Advisory Committee.
Bohle, P., Pitts, C., & Quinlan, M. (2010). Time to call it quits? The safety and health of older workers. International Journal of Health Services, 40(1), 23-41.
Bourbonnais, R., Brisson, C., & Vézina, M. (2011). Long-term effects of an intervention on psychosocial work factors among healthcare professionals in a hospital setting. Occupational and Environmental Medicine, 68(7), 479-486.
Camerino, D., Conway, P. M., Sartori, S., Campanini, P., Estryn‐Béhar, M., van der Heijden, B. I. J. M., & Costa, G. (2008). Factors affecting work ability in day and shift-working nurses. Chronobiology International, 25(2-3), 425-442. doi: doi:10.1080/07420520802118236
Costa, G. (2005a). Some considerations about aging, shift work and work ability. Paper presented at the International Congress Series.
Costa, G. (2005b). Work ability in health care workers. Paper presented at the Assessment and Promotion of Work Ability, Health, and Well-being of Ageing Workers: Proceedings of the 2nd International Symposium on Work Ability, Verona, Italy.
Costa, G., & Sartori, S. (2007). Ageing, working hours and work ability. Ergonomics, 50(11), 1914-1930.
Department of Health. (2013). Health Workers' Initiative Retrieved January 22nd, 2014, from http://www.healthyworkers.gov.au/
78
El Fassi, M., Bocquet, V., Majery, N., Lair, M. L., Couffignal, S., Mairiaux, P., & Statistics, S. (2013). Work ability assessment in a worker population: comparison and determinants of Work Ability Index and Work Ability score. Bmc Public Health, 13(1), 305.
European Foundation for the Improvement of Living and Working Conditions. (2007). Fourth European Working Conditions Survey. Luxembourg: Office for Official Publications of the European Communities.
Fischer, F., Notarnicola da Silva Borges, F., Rotenberg, L., do Rosario Dias de Oliveira Latorre, M., Santos Soares, N., Lima Ferreira Santa Rosa, P., . . . Landsbergis, P. (2006). Work ability of health care shift workers: What matters? Chronobiology International, 23(6), 1165-1179. doi: doi:10.1080/07420520601065083
Gamperiene, M., Nygård, J. F., Sandanger, I., Lau, B., & Bruusgaard, D. (2008). Self-reported work ability of Norwegian women in relation to physical and mental health, and to the work environment. Journal of Occupational Medicine and Toxicology, 3(8), 1-9.
Garbarino, S., De Carli, F., Nobili, L., Mascialino, B., Squarcia, S., Penco, M. A., . . . Ferillo, F. (2002). Sleepiness and sleep disorders in shift workers: a study on a group of Italian police officers. Sleep, 25(6), 648-653.
Goldman, N. (2001). Social inequalities in health. Annals of the New York Academy of Sciences, 954(1), 118-139.
Gould, R., Ilmarinen, J., Jarvisalo, J., & Koskinen, S. (2008). New dimensions of work ability: Results of the Health 2000 Survey. Helsinki: Finnish Institute of Occupational Health.
Gould, R., Ilmarinen, J., Järvisalo, J., & Koskinen, S. (2008). Dimensions of work ability: Results of the Health 2000 survey. Helsinki: Finnish Institute of Occupational Health.
Harter, J. K., Schmidt, F. L., & Hayes, T. L. (2002). Business-unit-level relationship between employee satisfaction, employee engagement, and business outcomes: a meta-analysis. Journal of Applied Psychology, 87(2), 268.
Hill, A., Roberts, J., Ewings, P., & Gunnell, D. (1997). Non-response bias in a lifestyle survey. Journal of Public Health, 19(2), 203-207.
Ilmarinen, J. (1999). Ageing workers in the European Union. Helsinki Finnish Institute of Occupational Health/Ministry of Social Affairs and Health/Ministry of Labour.
Ilmarinen, J. (2006). The ageing workforce—challenges for occupational health. Occupational Medicine, 56(6), 362-364. doi: 10.1093/occmed/kql046
Ilmarinen, J., & Rantanen, J. (1999). Promotion of work ability during ageing. American Journal of Industrial Medicine, 36(S1), 21-23.
Ilmarinen, J., & Tuomi, K. (1992). Work ability of aging workers. Scandinavian Journal of Work, Environment and Health, 18, 8-10.
Ilmarinen, J., Tuomi, K., Eskelinen, L., Nygård, C.-H., Huuhtanen, P., & Klockars, M. (1991). Summary and recommendations of a project involving cross-sectional and follow-up studies on the aging worker in Finnish municipal occupations (1981—1985). Scandinavian Journal of Work, Environment and Health, 17, 135-141.
Ilmarinen, J., Tuomi, K., & Seitsamo, J. (2005). New dimensions of work ability. Paper presented at the International Congress Series.
79
Kemmlert, K., & Lundholm, L. (2001). Slips, trips and falls in different work groups—with reference to age and from a preventive perspective. Applied Ergonomics, 32(2), 149-153.
Kessler, R. C., Mickelson, K. D., & Williams, D. R. (1999). The prevalence, distribution, and mental health correlates of perceived discrimination in the United States. Journal of Health and Social Behavior, 4(3), 208-230.
Kloimüller, I., Karazman, R., Geissler, H., Karazman-Morawetz, I., & Haupt, H. (2000). The relation of age, work ability index and stress-inducing factors among bus drivers. International Journal of Industrial Ergonomics, 25(5), 497-502. doi: http://dx.doi.org/10.1016/S0169-8141(99)00035-9
Krause, N., Lynch, J., Kaplan, G. A., Cohen, R. D., Goldberg, D. E., & Salonen, J. T. (1997). Predictors of disability retirement. Scandinavian Journal of Work, Environment and Health, 23, 403-413.
Lavoie-Tremblay, M., Bourbonnais, R., Viens, C., Vézina, M., Durand, P. J., & Rochette, L. (2005). Improving the psychosocial work environment. Journal of Advanced Nursing, 49(6), 655-664.
Li, C.-Y., & Sung, F.-C. (1999). A review of the healthy worker effect in occupational epidemiology. Occupational Medicine, 49(4), 225-229.
Lindberg, P., Josephson, M., Alfredsson, L., & Vingård, E. (2006). Promoting excellent work ability and preventing poor work ability: the same determinants? Results from the Swedish HAKuL study. Occupational and Environmental Medicine, 63(2), 113-120.
Lund, T., & Villadsen, E. (2005). Who retires early and why? Determinants of early retirement pension among Danish employees 57–62 years. European Journal of Ageing, 2(4), 275-280.
Mackey, M. (2013). Promoting healthy working life in an ageing and increasingly sedentary society. Physical Therapy Reviews, 18(5), 358-367.
Martikainen, P., Laaksonen, M., Piha, K., & Lallukka, T. (2007). Does survey non-response bias the association between occupational social class and health? Scandinavian Journal of Public Health, 35(2), 212-215.
Martimo, K.-P., Varonen, H., Husman, K., & Viikari-Juntura, E. (2007). Factors associated with self-assessed work ability. Occupational Medicine, 57(5), 380-382. doi: 10.1093/occmed/kqm028
Martinez, M. C., & Latorre, M. d. R. D. d. O. (2006). Health and work ability among office workers. Revista de Saúde Pública, 40(5), 851-858.
Martus, P., Jakob, O., Rose, U., Seibt, R., & Freude, G. (2010). A comparative analysis of the Work Ability Index. Occupational Medicine, 60(7), 517-524.
McLoughlin, C., & Taylor, P. (Unpublished Report). Australian work ability pilot survey: A report to Safe Work Australia. Melbourne: Monash University.
McLoughlin, C., Taylor, P., & Bohle, P. (2011). Promoting Worker Resilience Over the Lifecourse Resilience in Aging (pp. 121-132): Springer.
Molinie, A. (2003). Age and working conditions in the European Union. Dublin: European Foundation for Improvement of Living and Working Conditions.
Monteiro, M. S., Ilmarinen, J., & Filho, H. (2006). Work ability of workers in different age groups in a public health institution in Brazil. International Journal of Occupational Safety and Ergonomics, 12(4), 417-427.
80
Nielsen, K., Yarker, J., Brenner, S. O., Randall, R., & Borg, V. (2008). The importance of transformational leadership style for the well‐being of employees working with older people. Journal of Advanced Nursing, 63(5), 465-475.
Parker, T. W., Worringham, C. J., Greig, K., & Woods, S. D. (2006). Age-related changes in work ability and injury risk in underground and open-cut coal miners. Brisbane: Australian Coal Research Limited.
Payton, M. E., Greenstone, M. H., & Schenker, N. (2003). Overlapping confidence intervals or standard error intervals: What do they mean in terms of statistical significance? Journal of Insect Science, 3, 1-6.
Pohjonen, T. (2001). Perceived work ability of home care workers in relation to individual and work-related factors in different age groups. Occupational Medicine, 51(3), 209-217.
Pranjić, N., Maleš-Bilić, L., Beganlić, A., & Mustajbegović, J. (2006). Mobbing, stress, and work ability index among physicians in Bosnia and Herzegovina: survey study. Croatian Medical Journal, 47(5), 750-758.
Reiso, H., Nygård, J. F., Brage, S., Gulbrandsen, P., & Tellnes, G. (2001). Work ability and duration of certified sickness absence. Scandinavian Journal of Public Health, 29(3), 218-225.
Salonen, P., Arola, H., Nygård, C. H., Huhtala, H., & Koivisto, A. M. (2003). Factors associated with premature departure from working life among ageing food industry employees. Occupational Medicine, 53(1), 65-68.
Schreuder, K., Roelen, C., Koopmans, P., & Groothoff, J. (2008). Job demands and health complaints in white and blue collar workers. Work: A Journal of Prevention, Assessment and Rehabilitation, 31(4), 425-432.
Sjögren-Rönkä, T., Ojanen, M. T., Leskinen, E. K., Mustalampi, S. T., & Mälkiä, E. A. (2002). Physical and psychosocial prerequisites of functioning in relation to work ability and general subjective well-being among office workers. Scandinavian Journal of Work, Environment and Health, 28(3), 184-190.
Sluiter, J. K. (2006). High-demand jobs: age-related diversity in work ability? Applied Ergonomics, 37(4), 429-440.
Stansfeld, S., & Candy, B. (2006). Psychosocial work environment and mental health—a meta-analytic review. Scandinavian Journal of Work, Environment and Health, 32(6), 443-462.
Stone, A. A., Schwartz, J. E., Broderick, J. E., & Deaton, A. (2010). A snapshot of the age distribution of psychological well-being in the United States. Proceedings of the National Academy of Sciences, 107(22), 9985-9990.
Swan, W., & Butler, M. (2012). Government Response to the Final Report of the Advisory Panel on the Economic Potential of Senior Australians. Canberra: Australian Government.
Taskila, T., Martikainen, R., Hietanen, P., & Lindbohm, M.-L. (2007). Comparative study of work ability between cancer survivors and their referents. European Journal of Cancer, 43(5), 914-920. doi: http://dx.doi.org/10.1016/j.ejca.2007.01.012
Tuomi, K., Eskelinen, L., Toikkanen, J., Jarvinen, E., Ilmarinen, J., & Klockars, M. (1991). Work load and individual factors affecting work ability among aging municipal employees. Scandinavian Journal of Work, Environment and Health, 17, 128-134.
81
Tuomi, K., Huuhtanen, P., Nykyri, E., & Ilmarinen, J. (2001). Promotion of work ability, the quality of work and retirement. Occupational Medicine, 51(5), 318-324.
Tuomi, K., Ilmarinen, J., Eskelinen, L., Järvinen, E., Toikkanen, J., & Klockars, M. (1991). Prevalence and incidence rates of diseases and work ability in different work categories of municipal occupations. Scandinavian Journal of Work, Environment and Health, 17, 67-74.
Tuomi, K., Ilmarinen, J., Martikainen, R., Aalto, L., & Klockars, M. (1997). Aging, work, life-style and work ability among Finnish municipal workers in 1981—1992. Scandinavian Journal of Work, Environment and Health, 23, 58-65.
Tuomi, K., & Oja, G. (1998). Work ability index: Finnish Institute of Occupational Health Helsinki.
Tuomi, K., Vanhala, S., Nykyri, E., & Janhonen, M. (2004). Organizational practices, work demands and the well-being of employees: a follow-up study in the metal industry and retail trade. Occupational Medicine, 54(2), 115-121.
Turner, J. A., Franklin, G., & Turk, D. C. (2000). Predictors of chronic disability in injured workers: a systematic literature synthesis. American Journal of Industrial Medicine, 38(6), 707-722.
van den Berg, T., Elders, L. A., de Zwart, B. C., & Burdorf, A. (2009). The effects of work-related and individual factors on the Work Ability Index: a systematic review. Occupational and Environmental Medicine, 66(4), 211-220.
van den Berg, T., Robroek, S. J., Plat, J. F., Koopmanschap, M. A., & Burdorf, A. (2011). The importance of job control for workers with decreased work ability to remain productive at work. International Archives of Occupational and Environmental Health, 84(6), 705-712.
Zuhosky, J. P., Irwin, R. W., Sable, A. W., Sullivan, W. J., Panagos, A., & Foye, P. M. (2007). Industrial medicine and acute musculoskeletal rehabilitation. 7. Acute industrial musculoskeletal injuries in the aging workforce. Archives of Physical Medicine and Rehabilitation, 88(3), S34-S39.
82