Embed Size (px)
Citation preview
Journal of Electronic Commerce Research, VOL 12, NO 3, 2011
Page 187
WORD-OF-BLOG FOR MOVIES:
A PREDICTOR AND AN OUTCOME OF BOX OFFICE REVENUE?
Li Qin
Department of Information Systems and Decision Sciences
Silberman College of Business
Fairleigh Dickinson University
ABSTRACT
Social media has become an important avenue of Word-of-mouth (WOM) and a recent study has found
blogging to be an important lead-generation source among social media options. This article examines the dynamic
interrelationship between word-of-blog volume and sales by using the movie industry as the research context. By
employing the Granger Causality test and modeling the interrelationship through simultaneous equations, the results
show that the volume of word-of-blog and box office revenue for movies provide significant causality and
explanatory power for each other, supporting word-of-blog volume is both a predictor and an outcome of sales. The
results also highlight for retailers the importance of strategically managing word-of-blog to influence consumer
purchase decisions and generate revenue as well as the value of the findings for forecasting.
Keywords: Word-of-Mouth; Word-of-Blog; Social media; Blogs; E-commerce
1. Introduction
Word-of-Mouth (WOM) is usually believed to be a credible information source for consumers’ purchase
decisions [Bynerjee 1992; Brown & Reingen 1987]. The Internet and online communities have brought WOM to an
even wider reach at a faster speed. For instance, online WOM can influence people’s online purchase via buyers’
subjective norm [Cha 2011; Suntompithug & Khamalah 2010] or via seller reputation [Saastamoinen 2009]. Online
WOM can take many forms such as online reviews, discussion boards, video sites, blogs, microblogs, social
networks, and so on. With the rapid increase in popularity of Web 2.0 technologies and the explosive growth of
online social communities, social media, i.e. consumer-generated media and content, have emerged as new channels
in which consumers interact and influence each other, as well as channels in which businesses and consumers
interact and influence each other. Not only are a huge percentage of consumers and businesses online engaged in
social media, but also a very large percentage of consumers discuss the brands and products they love or hate. Such
social media are perceived to be transparent, inclusive, authentic, grassroots and consumer-driven [Baker 2009]. The
unprecedented openness, velocity (speed) and volume of conversations produced by social media have made them
become a vital avenue for transmitting WOM. David Meerman Scott [2008] claims the challenge to marketing “is to
harness the amazing power of . . . whatever you call it – viral, buzz, word-of-mouse, or word-of-blog – having other
people tell your story drives action. One person sends it to another, then that person sends it to yet another, and on
and on.”
According to the Wikipedia entry for blog [http://en.wikipedia.org/wiki/Blog], “A blog (a contraction of the
term “weblog”) is a type of website, usually maintained by an individual with regular entries of commentary,
descriptions of events, or other material such as graphics or video. Entries are commonly displayed in reverse-
chronological order.” Based on a survey of 167 executives and business owners mostly from small and medium-
sized businesses, a recent study [Walsh 2009] found blogging to be an important lead-generation source among
social media options. Blogs have become pervasive and part of people’s daily lives. For instance, Technorati
[http://technorati.com] has indexed 133 million blog records since 2002. According to Technorati [2008], comScore
MediaMetrix [http://www.comscore.com] in August 2008 reported there are 77.7 million unique blog visitors in the
US among the total 188.9 million internet audience; eMarketer [http://www.emarketer.com] in May 2008 reported
22.6 million US bloggers in 2007 and 94.1 million US blog readers in 2007; Universal McCann
[http://www.umww.com] in March 2008 reported 184 million WW have started a blog, 346 million WW read blogs,
and 77% of active Internet users read blogs. In addition, this Technorati report indicated that “Four in five bloggers
post brand or product reviews, with 37% posting them frequently. 90% of bloggers say they post about the brands,
music, movies and books that they love (or hate).”
Qin: Dynamics between Word-of-Blog Volume and Sales for Movies
Page 188
Prior studies show various aspects of WOM influence sales. Research found that WOM dispersion [Godes &
Mayzlin 2004], valence [Chevalier & Mayzlin 2006], and volume [Liu 2006] have significant impact upon product
sales. In addition, study by Duan et al. [2008] focused on the explanatory power between consumer behavior and
WOM. These prior studies used online user reviews and newsgroups in a third-party website as the proxy for WOM.
Different from user reviews posted in a third-party website or newsgroup, blogs are dispersed in the cyberspace,
yet they join an inter-connected community in which conversations are conducted between blogs as well as between
blog authors and readers. In addition, by making use of web 2.0 technologies such as Really Simple Syndication
(RSS) feeds, updates in a blog can be immediately delivered to its subscribers, thus potentially increasing the speed
at which WOM can spread in the cyberspace. Blog search engines and trackers such as Google Blog Search
[http://blogsearch.google.com], Technorati [http://technorati.com], and BlogPulse [http://www.blogpulse.com]
further extend the reach and accessibility of blogs with unprecedented speed. Such technologies, services and tools
can potentially change the dynamics of WOM distribution. As a result, blogs as WOM (word-of-blog) and its
dynamic relationships with sales merit examination.
This study examines the dynamics between word-of-blog and sales by making use of a dataset containing daily
word-of-blog volume and daily box office revenue for movies. The movie industry has by far received the most
attention in marketing literature on WOM, and it is selected as the research context since WOM strongly influences
people’s movie selection [Bayus 1985; Faber & O'Guinn 1984; Neelamegham & Chintagunta 1999] and a movie’s
staying power [Elberse & Eliashberg 2003]. In particular, this study attempts to provide answers to the following
questions: First, how active is word-of-blog on a daily basis vs. days after the introduction of a new product?
Second, does word-of-blog happen before sales and help predict sales, and/or sales happen before word-of-blog and
help predict word-of-blog? Third, to what extent does the volume of word-of-blog help explain the sales of a new
product, and/or do the sales of a new product predict the volume of word-of-blog?
The rest of the paper is organized as follows. The next section provides the theoretical background along with
the discussion of our conceptual framework. Then the paper describes the data, the empirical model and
methodologies, which are followed by a presentation of main findings and a discussion of results. The paper
concludes with a discussion of conclusions, limitations, and future research.
2. Theoretical Background
2.1 WOM as a Predictor of Sales
Numerous studies have provided support for the idea that the volume of WOM affects consumer behavior and
market outcome. According to Bulte & Lilien [2001]’s research on medical innovations, awareness precedes
evaluation and adoption of innovations. Liu [2006] found that the volume of WOM plays an informational role
which increase consumer awareness about the movie. The greater the volume of WOM is, the more likely the
consumers get informed about the movie. As a result, a higher level of consumer awareness naturally generates more
sales. Empirical results in Liu [2006] showed that volume of WOM offers significant explanatory power for
aggregate and weekly box office revenue. Using data from 25 industries, the study by Anderson & Salisbury [2003]
suggested that the level of WOM is positively related to the consumers’ confidence in their market-level
expectations for a particular good or service. Inspired by the Bass [1969] model of product diffusion, Dellarocas et
al. [2007] developed a motion picture revenue-forecasting model, which can derive a notably accurate forecasting of
a movie’s total revenue from statistics of user reviews during the first week of a new movie’s release.
In other words, a larger word-of-blog volume means more people are more aware of the product, thus leading to
a higher consumer demand and larger sales. We expect such impact exists not only concurrently, but also over a
longer term since blogs stay in the blogosphere for a long time.
2.2 WOM as an outcome of Sales
There have been papers which present evidence for WOM as an outcome of consumer actions and experiences.
Bowman & Narayandas [2001] investigated manufacturers’ response to consumer-initiated contacts (CICs) and
consumers’ behavior following CICs. They found that loyal customers engage in only negative WOM when they are
dissatisfied. By using customer satisfaction data, Anderson [1998] identified a U-shaped function that very
dissatisfied customers and very satisfied customers are most likely to engage in WOM.
Therefore, more sales mean that more people have experience with the product, resulting in more word-of-blog
immediately or sometime after their experience.
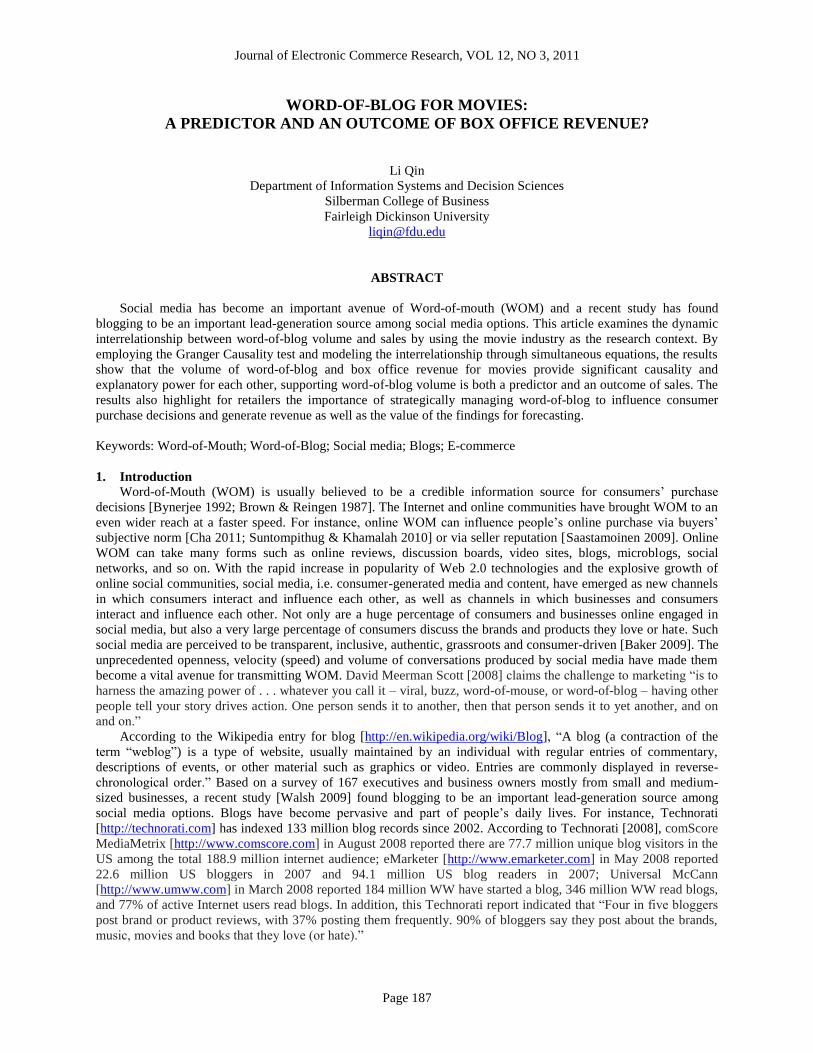
Figure 1 depicts the conceptual framework, which incorporates the dynamic relationship between WOM and
box office revenue for the movie industry. As shown in Figure 1, the volume of WOM affects the current and future
box office revenue whereas the box office revenue affects the current and future volume of WOM.
Duan et al. [2008] studied the dynamics between WOM and sales for the movie industry and found that a
movie’s box office revenue and WOM volume provide explanatory power for each other. Note that they used
Journal of Electronic Commerce Research, VOL 12, NO 3, 2011
Page 189
consumer movie reviews as WOM whereas this research uses blogs as a proxy of WOM. In addition, this research
also tries to validate the time precedence between WOM and revenue.
Figure 1: Conceptual Framework: Interrelationship between WOM and Box Office Revenue
3. Data
3.1 Data and Variables
BlogPulse is an automated trend discovery system for blogs by Nielsen [http://nielsen.com] which “applies
machine-learning and natural-language processing techniques to discover trends in the highly dynamic world of
blogs”. It is a blog search engine which creates a full-text search index of all of the blog entries it finds every day,
analyzes and reports on daily activity in the blogosphere. According to BlogPulse website accessed on September
21, 2009, it has identified 107,076,044 blogs for its blogosphere.
The WOM data in this study were collected from BlogPulse which provides the volume of word-of-blog by
topic (i.e. the movie title in our context) on a daily basis. Such source of collecting word-of-blog data represents a
publicly available low-cost service for consumers or businesses to monitor word-of-blog in practice. For each
movie, only blogs which contain exact matches with the full movie title were included. The volume of word-of-blog
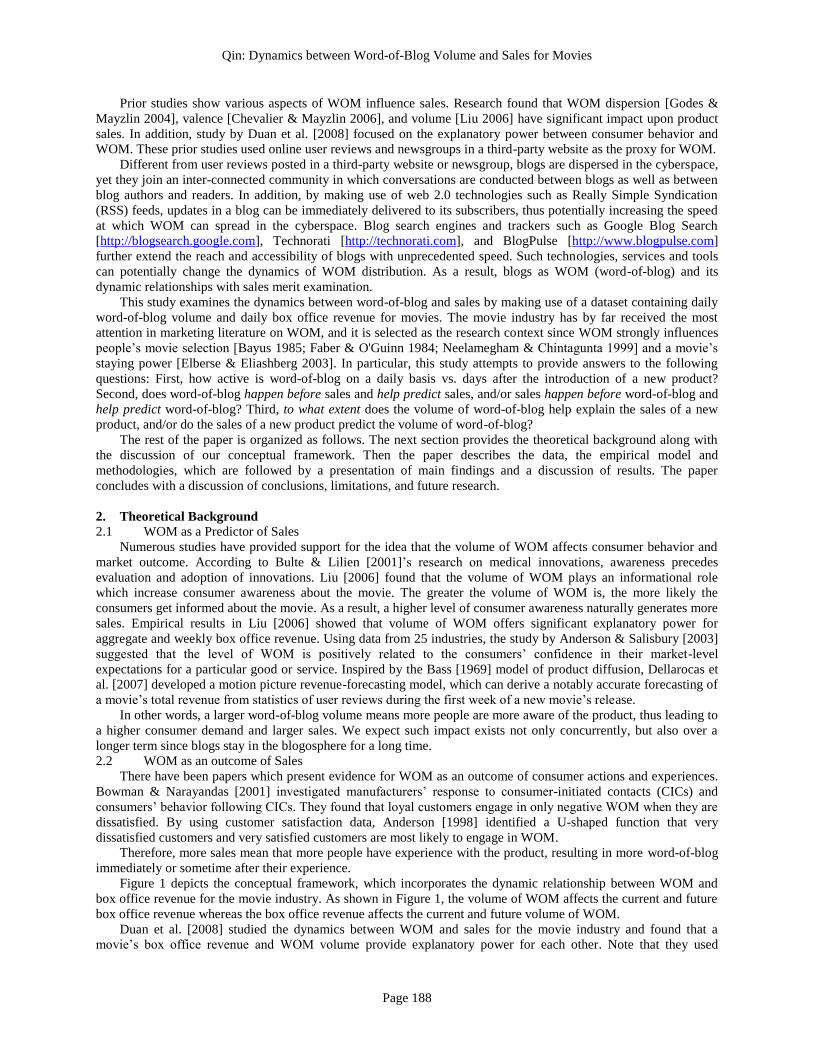
collected from BlogPulse website indicates the number of blogs which discuss the movie on a daily basis. Figure 2
shows the percent of all blog posts (The number of blog posts can be obtained by clicking on the chart) on the movie
“Transformers: Revenge of the Fallen” (released on June 24, 2009) on a daily basis.
Figure 2: Trend Chart from Blogpulse.com for Blog Posts on Movie “Transformers: Revenge of the Fallen”
…
WOM WOM
WOM
Box office sales Box office sales
Box office sales
Number of screens
Weekend effect
Movie features (e.g.
genre, MPAA rating)
Number of screens
Weekend effect
Movie features (e.g.
genre, MPAA rating)
Number of screens
Weekend effect
Movie features (e.g.
genre, MPAA rating)
Day t Day t+1 Day t+2
Number of screens
Weekend effect
Movie features (e.g.
genre, MPAA rating)
Number of screens
Weekend effect
Movie features (e.g.
genre, MPAA rating)
Number of screens
Weekend effect
Movie features (e.g.
genre, MPAA rating)
Qin: Dynamics between Word-of-Blog Volume and Sales for Movies
Page 190
Other information on movies including genre, MPAA rating, release date/age, number of screens, can affect
WOM and movie revenue. These information along with daily box office revenue, were collected from publicly
available sources: BoxOfficeMojo.com [http://www.boxofficemojo.com] and The Numbers [http://www.the-
numbers.com/]. Movies were chosen based on their box office rank in the U.S. market and all the movies in our
sample were among the top 13 box office based on their opening weekend revenue. Our data set included 49 movies
with the release time in U.S. theaters between March 2009 and October 2009. The appendix includes the list of
movies with title and release date. Our final sample included a time-series cross-sectional dataset of the 49 movies
for 4 weeks (28 days) after being released. The study chose the first four weeks after the movie release because the
paper focuses on studying the dynamics when the daily revenue is high (on average the revenue of the movies in the
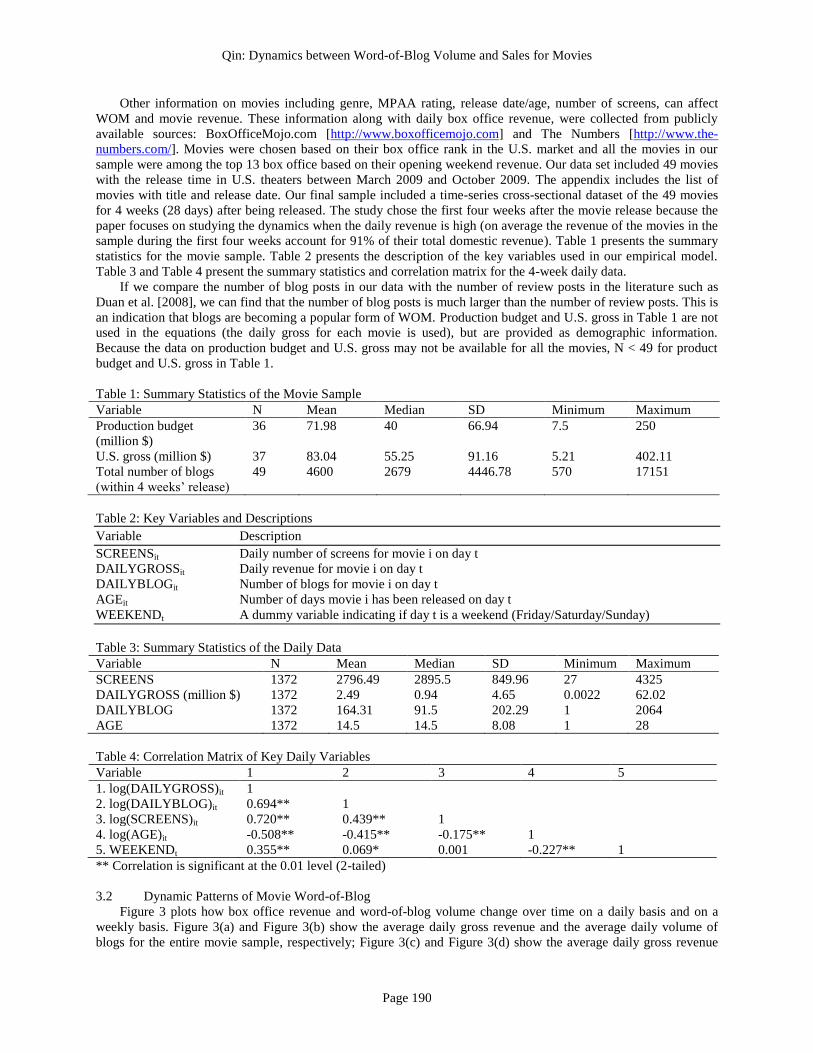
sample during the first four weeks account for 91% of their total domestic revenue). Table 1 presents the summary
statistics for the movie sample. Table 2 presents the description of the key variables used in our empirical model.
Table 3 and Table 4 present the summary statistics and correlation matrix for the 4-week daily data.
If we compare the number of blog posts in our data with the number of review posts in the literature such as
Duan et al. [2008], we can find that the number of blog posts is much larger than the number of review posts. This is
an indication that blogs are becoming a popular form of WOM. Production budget and U.S. gross in Table 1 are not
used in the equations (the daily gross for each movie is used), but are provided as demographic information.
Because the data on production budget and U.S. gross may not be available for all the movies, N < 49 for product
budget and U.S. gross in Table 1.
Table 1: Summary Statistics of the Movie Sample
Variable N Mean Median SD Minimum Maximum
Production budget
(million $)
36 71.98 40 66.94 7.5 250
U.S. gross (million $) 37 83.04 55.25 91.16 5.21 402.11
Total number of blogs
(within 4 weeks’ release)
49 4600 2679 4446.78 570 17151
Table 2: Key Variables and Descriptions
Variable Description
SCREENSit Daily number of screens for movie i on day t
DAILYGROSSit Daily revenue for movie i on day t
DAILYBLOGit Number of blogs for movie i on day t
AGEit Number of days movie i has been released on day t
WEEKENDt A dummy variable indicating if day t is a weekend (Friday/Saturday/Sunday)
Table 3: Summary Statistics of the Daily Data
Variable N Mean Median SD Minimum Maximum
SCREENS 1372 2796.49 2895.5 849.96 27 4325
DAILYGROSS (million $) 1372 2.49 0.94 4.65 0.0022 62.02
DAILYBLOG 1372 164.31 91.5 202.29 1 2064
AGE 1372 14.5 14.5 8.08 1 28
Table 4: Correlation Matrix of Key Daily Variables
Variable 1 2 3 4 5
1. log(DAILYGROSS)it 1
2. log(DAILYBLOG)it 0.694** 1
3. log(SCREENS)it 0.720** 0.439** 1
4. log(AGE)it -0.508** -0.415** -0.175** 1
5. WEEKENDt 0.355** 0.069* 0.001 -0.227** 1
** Correlation is significant at the 0.01 level (2-tailed)
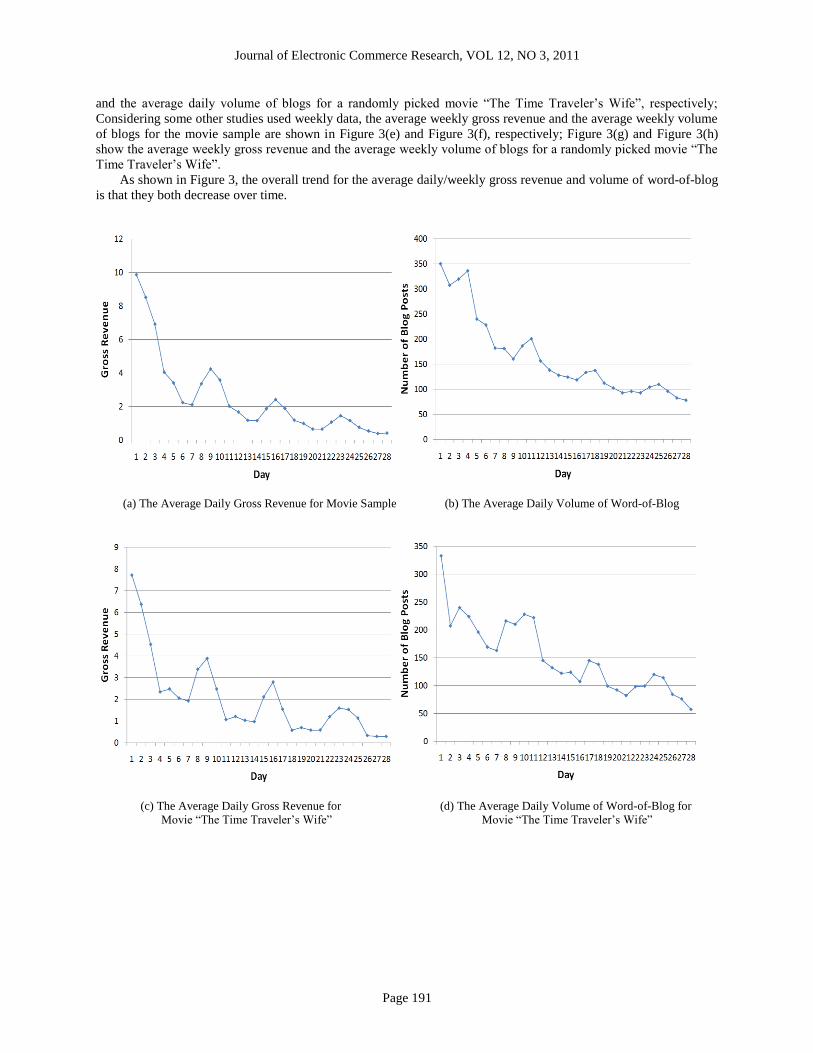
3.2 Dynamic Patterns of Movie Word-of-Blog
Figure 3 plots how box office revenue and word-of-blog volume change over time on a daily basis and on a
weekly basis. Figure 3(a) and Figure 3(b) show the average daily gross revenue and the average daily volume of
blogs for the entire movie sample, respectively; Figure 3(c) and Figure 3(d) show the average daily gross revenue
Journal of Electronic Commerce Research, VOL 12, NO 3, 2011
Page 191
and the average daily volume of blogs for a randomly picked movie “The Time Traveler’s Wife”, respectively;
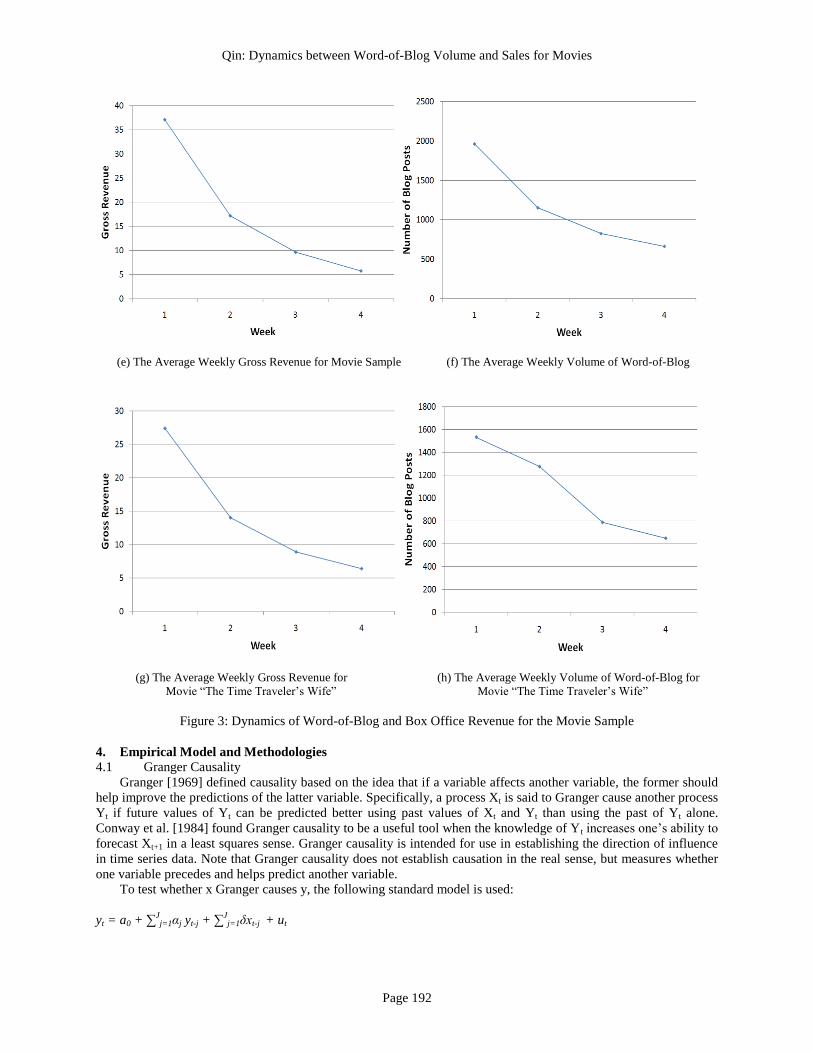
Considering some other studies used weekly data, the average weekly gross revenue and the average weekly volume
of blogs for the movie sample are shown in Figure 3(e) and Figure 3(f), respectively; Figure 3(g) and Figure 3(h)
show the average weekly gross revenue and the average weekly volume of blogs for a randomly picked movie “The
Time Traveler’s Wife”.
As shown in Figure 3, the overall trend for the average daily/weekly gross revenue and volume of word-of-blog
is that they both decrease over time.
(a) The Average Daily Gross Revenue for Movie Sample (b) The Average Daily Volume of Word-of-Blog
(c) The Average Daily Gross Revenue for (d) The Average Daily Volume of Word-of-Blog for
Movie “The Time Traveler’s Wife” Movie “The Time Traveler’s Wife”
Qin: Dynamics between Word-of-Blog Volume and Sales for Movies
Page 192
(e) The Average Weekly Gross Revenue for Movie Sample (f) The Average Weekly Volume of Word-of-Blog
(g) The Average Weekly Gross Revenue for (h) The Average Weekly Volume of Word-of-Blog for
Movie “The Time Traveler’s Wife” Movie “The Time Traveler’s Wife”
Figure 3: Dynamics of Word-of-Blog and Box Office Revenue for the Movie Sample
4. Empirical Model and Methodologies
4.1 Granger Causality
Granger [1969] defined causality based on the idea that if a variable affects another variable, the former should
help improve the predictions of the latter variable. Specifically, a process Xt is said to Granger cause another process
Yt if future values of Yt can be predicted better using past values of Xt and Yt than using the past of Yt alone.
Conway et al. [1984] found Granger causality to be a useful tool when the knowledge of Yt increases one’s ability to
forecast Xt+1 in a least squares sense. Granger causality is intended for use in establishing the direction of influence
in time series data. Note that Granger causality does not establish causation in the real sense, but measures whether
one variable precedes and helps predict another variable.
To test whether x Granger causes y, the following standard model is used:
yt = a0 + ∑Jj=1αj yt-j + ∑
Jj=1δxt-j + ut
Journal of Electronic Commerce Research, VOL 12, NO 3, 2011
Page 193
where J represents the number of lagged values of each of the variables, also called the order of vector
autoregressive (VAR).
The theoretical background supporting WOM as both a predictor and outcome of sales leads to assessments of
bi-directional Granger causality between sales and word-of-blog. The following equation is used to test whether
word-of-blog Granger causes sales:
Revenue equation I
log(DAILYGROSS)it = a0 + ∑Jj=1αjlog(DAILYGROSS)i,t-j + ∑
Jj=1δjlog log (DAILYBLOG)i,t-j + ut
for each day separately (t = 1, 2, …, 28), where i indexes the movies (i = 1, 2, …, 49) and J is the number of lagged
values.
Similarly, the following equation is used to test whether sales Granger cause word-of-blog:
WOM equation I
log(DAILYBLOG)it = b0 + ∑Jj=1βjlog(DAILYBLOG)i,t-j + ∑
Jj=1ηjlog (DAILYGROSS)i,t-j + vt
for each day separately (t = 1, 2, …, 28), where i indexes the movies (i = 1, 2, …, 49) and J is the number of lagged
values.
There are a variety of criteria for determining the VAR order including AIC (Akaike’s Information Criterion),
HQ (Hannan-Quinn criterion), SC (Schwarz criterion), and so on. Lutkepohl (2005) indicated that AIC may have
better properties and produce more superior forecasts than HQ and SC. Therefore, in this study, the order of VAR
was determined to minimize the AIC criterion. AIC results indicated that six lags of log(DAILYBLOG) it should be
used for revenue equation I and three lags of log(DAILYGROSS)it should be used for WOM equation I. For each
equation, a Granger Causality Wald test was conducted.
4.2 Simultaneous Equations
To further quantify the dynamics between word-of-blog volume and box office revenue shown in our
conceptual model (Figure 1), a system of two interdependent equations are constructed: The revenue equation II is
used to test the volume of word-of-blog as a predictor of daily box office revenue, and the WOM equation II is to
test the daily box office revenue as a predictor of volume of word-of-blog.
Revenue equation II
log(DAILYGROSS)it = χ0 + ∑Jj=0αjlog(DAILYBLOG)i,t-j + β1log(SCREEN)it + γ1log(AGE)it + δ1WEEKENDt +
ρ1genrei + ζ1MPAAratingi + εit,
for each day separately (t = 1, 2, …, 28), where i indexes the movies (i = 1, 2, …, 49) and J is the number of lagged
values.
WOM equation II
log(DAILYBLOG)it = ϙ 0 + ∑K
k=0ζklog(DAILYGROSS)i,t-k + η1log(SCREEN)it + θ1log(AGE)it + ι1WEEKENDt +
η1genrei + θ1MPAAratingi + κit,
for each day separately (t = 1, 2, …, 28), where i indexes the movies (i = 1, 2, …, 49) and K is the number of lagged
values.
Three other variables which vary over time for each movie are included in the equations: the number of screens
(log(SCREEN)it), the number of days after release (log(AGE)it), and whether day t is during a weekend
(WEEKENDt). Considering that some movie-specific factors which may influence revenue and WOM, non-time
varying factors on the movies including genre and MPAA rating are added in the model as control variables.
Both equations include endogenous variables, which are variables explained by the model and are explanatory
variable of another equation. Such simultaneity causes the coefficients and standard errors estimated through
Ordinary Least Squares (OLS) to be biased [Gatignon 2003]. Two-Stage Least Square (2SLS) and Three-Stage
Least Square (3SLS) can reduce the bias. To compare OLS, 2SLS, 3SLS, a Hausman’s specification test was
performed with the results shown in Table 5. Our Granger causality results show that the lagged values of word-of-
Qin: Dynamics between Word-of-Blog Volume and Sales for Movies
Page 194
blog can help predict the sales and the lagged values of sales can help predict the volume of word-of-blog.
Therefore, in addition to the concurrent value in each simultaneous equation, six lagged values of
log(DAILYBLOG)i,t-j were included in revenue equation II and three lagged values of log(DAILYGROSS)i,t-k were
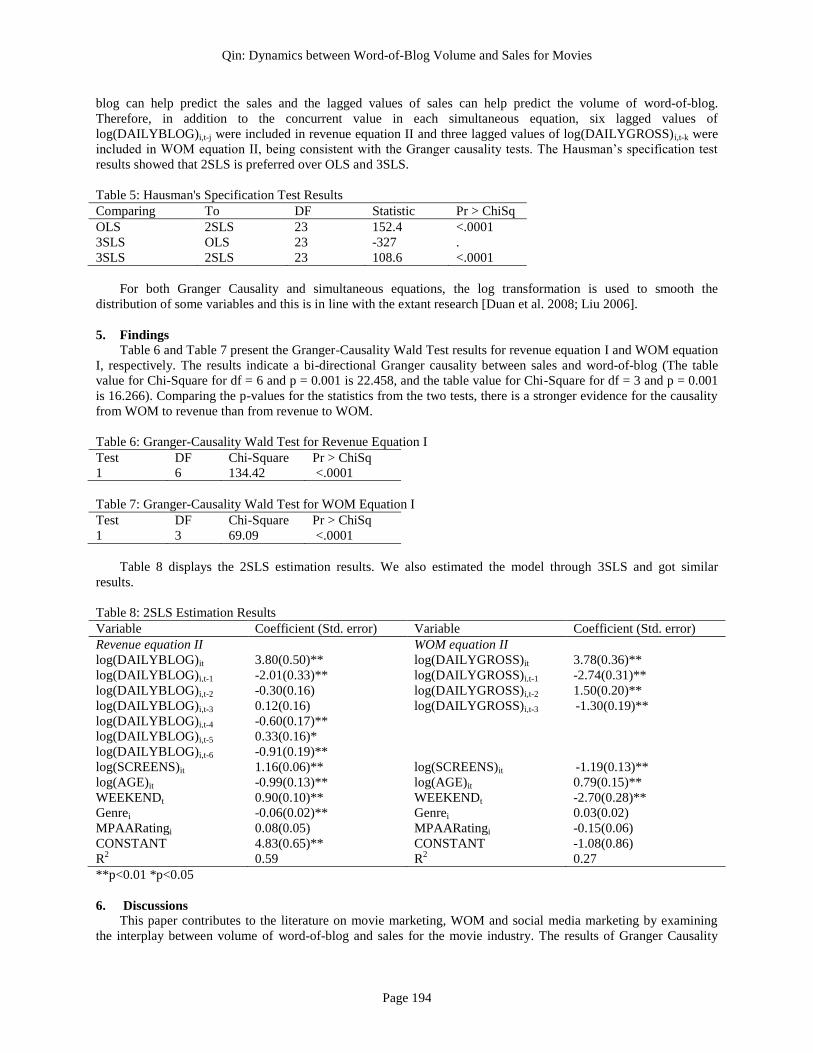
included in WOM equation II, being consistent with the Granger causality tests. The Hausman’s specification test
results showed that 2SLS is preferred over OLS and 3SLS.
Table 5: Hausman's Specification Test Results
Comparing To DF Statistic Pr > ChiSq
OLS 2SLS 23 152.4 <.0001
3SLS OLS 23 -327 .
3SLS 2SLS 23 108.6 <.0001
For both Granger Causality and simultaneous equations, the log transformation is used to smooth the
distribution of some variables and this is in line with the extant research [Duan et al. 2008; Liu 2006].
5. Findings
Table 6 and Table 7 present the Granger-Causality Wald Test results for revenue equation I and WOM equation
I, respectively. The results indicate a bi-directional Granger causality between sales and word-of-blog (The table
value for Chi-Square for df = 6 and p = 0.001 is 22.458, and the table value for Chi-Square for df = 3 and p = 0.001
is 16.266). Comparing the p-values for the statistics from the two tests, there is a stronger evidence for the causality
from WOM to revenue than from revenue to WOM.
Table 6: Granger-Causality Wald Test for Revenue Equation I
Test DF Chi-Square Pr > ChiSq
1 6 134.42 <.0001
Table 7: Granger-Causality Wald Test for WOM Equation I
Test DF Chi-Square Pr > ChiSq
1 3 69.09 <.0001
Table 8 displays the 2SLS estimation results. We also estimated the model through 3SLS and got similar
results.
Table 8: 2SLS Estimation Results
Variable Coefficient (Std. error) Variable Coefficient (Std. error)
Revenue equation II WOM equation II
log(DAILYBLOG)it 3.80(0.50)** log(DAILYGROSS)it 3.78(0.36)**
log(DAILYBLOG)i,t-1 -2.01(0.33)** log(DAILYGROSS)i,t-1 -2.74(0.31)**
log(DAILYBLOG)i,t-2 -0.30(0.16) log(DAILYGROSS)i,t-2 1.50(0.20)**
log(DAILYBLOG)i,t-3 0.12(0.16) log(DAILYGROSS)i,t-3 -1.30(0.19)**
log(DAILYBLOG)i,t-4 -0.60(0.17)**
log(DAILYBLOG)i,t-5 0.33(0.16)*
log(DAILYBLOG)i,t-6 -0.91(0.19)**
log(SCREENS)it 1.16(0.06)** log(SCREENS)it -1.19(0.13)**
log(AGE)it -0.99(0.13)** log(AGE)it 0.79(0.15)**
WEEKENDt 0.90(0.10)** WEEKENDt -2.70(0.28)**
Genrei -0.06(0.02)** Genrei 0.03(0.02)
MPAARatingi 0.08(0.05) MPAARatingi -0.15(0.06)
CONSTANT 4.83(0.65)** CONSTANT -1.08(0.86)
R2 0.59 R
2 0.27
**p<0.01 *p<0.05
6. Discussions
This paper contributes to the literature on movie marketing, WOM and social media marketing by examining
the interplay between volume of word-of-blog and sales for the movie industry. The results of Granger Causality
Journal of Electronic Commerce Research, VOL 12, NO 3, 2011
Page 195
confirm the feedback mechanism between word-of-blog and sales in which the volume of word-of-blog can help
better predict sales and sales can help better predict the volume of word-of-blog. The bi-directional relationship is
further quantified through 2SLS. The independent variables in the revenue equation II including the concurrent and
lagged values of word-of-blog can explain 59% of the variance in log(DAILYGROSS)it and the independent
variables in the WOM equation II can explain 27% of the variance in log(DAILYBLOG)it.
For the revenue equation II, log(DAILYBLOG)it is a significant and positive predictor for log(DAILYGROSS)it. The coefficient of log(DAILYBLOG)i,t-1 is also significant, however, becomes negative. This
can be due to the high correlation between the concurrent and lagged values of the variable. For instance, the
correlation between log(DAILYBLOG)it and log(DAILYBLOG)i,t-1 is 0.96, and the correlation between
log(DAILYGROSS)it and log(DAILYGROSS)i,t-1 is 0.94. log(DAILYGROSS)it is also a significant and positive
predictor for log(DAILYBLOG)it. When two independent variables are highly and positively correlated, their
coefficient estimators are going to be highly and negatively correlated [Berry & Feldman 1985]. Therefore, the
coefficients of some lagged values are negative due to the correlation between the concurrent and lagged values.
Since the concurrent value of log(DAILYBLOG) is correlated with its lagged values and the concurrent value of
log(DAILYGROSS) is correlated with its lagged values, the model was tested with the lagged values removed from
WOM equation II and Revenue equation II and similar results were obtained between word-of-blog and sales.
In addition to theoretical values, this paper provides practical value by providing insights for managers.
The finding that volume of word-of-blog has significant impact on sales suggests that managers should create
and manage word-of-blog to promote sales after the introduction of a new product. Technorati [2008] reports that
“Companies are already reaching out to bloggers: one-third of bloggers have been approached to be brand
advocates.” Many companies now start to monitor and engage in consumer-generated contents about their company,
products, brands, etc. Previous research [Liu 2006] also indicates that most of the explanatory power of WOM
comes from WOM volume, not WOM valence. Therefore, the key to managing WOM is to increase the volume of
word-of-blog, which will increase consumer awareness and ultimately increase revenue. Our findings provide
empirical support for such efforts and investments. Meanwhile, the feedback mechanism implies that increased sales
from more word-of-blog will help create more word-of-blog, which will further increase sales.
Another important managerial value of the findings in this paper is forecasting. Based on our findings, the daily
volume of word-of-blog on the same and previous few days is shown to be helpful for forecasting the daily box
office revenue. The application of forecasting box office revenue can include movie screening allocation and
planning by studios and theaters. On the other hand, the daily box office revenue as a helpful measure to forecast
word-of-blog can also help managers make better decisions on planning efforts to manage word-of-blog. Though
this paper does not provide a forecasting model, the findings support that the feedback mechanism between word-of-
blog and sales should be incorporated into the forecasting model.
The coefficients for control variables also displayed interesting results. Sales and word-of-blog show opposite
trends relative to AGEit and SCREENit: with a larger number of days after the movie release and a smaller number
of screens for the movie, people are more likely to write blogs on the movie (as shown by a positive coefficient,
0.79, for log(AGE)it in WOM equation II in Table 8). However, people are even less likely to watch the movie with
a larger number of days after the movie release (as shown by a larger negative coefficient, -0.99, for log(AGE)it in
revenue equation II in Table 8). As the coefficients indicate the negative impact of AGE upon the likelihood for
people to watch the movie is higher than the likelihood to write blogs on the movie, the volume of the word-of-blog
decreases over time (Note that Figure 3 shows both sales and word-of-blog decline over time after the movie
release). This again shows the feedback mechanism between sales and word-of-blog. Also, based on the results in
Table 8, people are more likely to watch a movie over the weekend (as shown by a positive coefficient, 0.90, for
WEEKENDt in revenue equation II in Table 8). However, they are less likely to write blogs on the movie over the
weekend (as shown by a negative coefficient, -2.70, for WEEKENDt in WOM equation II in Table 8).
7. Conclusions, Limitations and Future Research
The literature shows that a larger volume of word-of-blog leads to better consumer awareness and thus more
sales. Meanwhile, more consumer experience of the product leads to more word-of-blog and then more sales. By
capturing such dynamics through Granger Causality and simultaneous equations, this study found that the volume of
word-of-blog and box office revenue for movies provide Granger causality and explanatory power for each other,
supporting that word-of-blog volume is both a predictor and an outcome of sales.
Similar to the limitation of using a third-party website as the proxy of WOM by many studies, the data used in
this study are restricted to blogs indexed by BlogPulse. Therefore, the findings should be interpreted with this
limitation. Studies based on other sources/indexers of word-of-blog should be conducted for future research.
Qin: Dynamics between Word-of-Blog Volume and Sales for Movies
Page 196
This study focused on only one aspect of word-of-blog, volume. The current research can be extended by
examining the other aspects of word-of-blog such as valence. Conducting sentiment analysis of blogs (e.g. positive,
negative, neutral, etc) and examining the relationship between word-of-blog valence and sales will be of particular
interest for future research. It can be interesting to study the impact of other variables such as star power, correlation
between movies, etc. upon revenue and word-of-blog if such data are available.
Also, blog is only one of the options of social media. There has been an explosion of other types of social media
on the Internet. Though these social media options share some common characteristics, each type of social media
may display different characteristics in distributing WOM. Further examination of the other social media options
will provide insights for social media marketers to make more informed decisions.
REFERENCES
Anderson, E. and L. Salisbury, “The Formation of Market-Level Expectations and Its Covariates,” Journal of
Consumer Research, Vol. 30:115-124, 2003.
Bayus, B., “Word of Mouth: The Indirect Effect of Marketing Efforts,” Journal of Advertising Research, Vol. 23,
No. 3:31-39, 1985.
Baker, B., “Your Customers are Talking to Everyone,” Information Management, May 2009.
Bass, F. M., “A New Product Growth for Model Consumer Durables,” Management Science, Vol. 15, No. 5:215-
227, 1969.
Berry, W. D. and S. Feldman, Multiple Regression in Practice, Sage Publications, Inc., 1985.
Bowman, D. and D. Narayandas, “Managing Customer-Initiated Contacts with Manufactures: The Impact on Share
of Category Requirements and Word-of-Mouth Behavior,” Journal of Marketing Research, Vol. 38: 281-297,
2001.
Brown, J. and P. Reingen, “Social Ties and Word-of-Mouth Referral Behavior,” Journal of Consumer Research,
Vol. 14 (December): 350-362, 1987.
Bulte, C.V. and G. Lilien, “Two-Stage Partial Observability Models for Innovation Adoption,” working paper,
Wharton School, University of Pennsylvania, 2001.
Bynerjee, A., “A Simple Model of Herd Behavior,” Quarterly Journal of Economics, Vol. 107, No. 3:797-817,
1992.
Cha, J., “Exploring the Internet as a Unique Shopping Channel to Sell Both Real and Virtual Items: a Comparison of
Factors Affecting Purchase Intention and Consumer Characteristics,” Journal of Electronic Commerce
Research, Vol. 12, No. 2:115-132, 2011.
Chevalier, J. and D. Mayzlin, “The Effect of Word of Mouth on Sales: Online Book Reviews,” Journal of Marketing
Research, Vol. 43, No. 3:345-354, 2006.
Conway, R.K., P.A.V.B. Swamy, J.F. Yanagida, and P. von zur Muehlen, “The Impossibility of Causality Testing,”
Agricultural Economics Research, Vol. 36, No. 3:1-19, 1984.
Dellarocas, C.N., N.F. Awad, and X. Zhang, “Exploring the Value of Online Product Reviews in Forecasting Sales:
The Case of Motion Pictures,” Journal of Interactive Marketing, Vol. 21, No. 4:23-45, 2007.
Duan, W., B. Gu, and A.B. Whinston, “The Dynamics of Online Word-of-mouth and Product Sales-An Empirical
Investigation of the Movie Industry,” Journal of Retailing, Vol. 84, No. 2: 233-242, 2008.
Elberse, A. and J. Eliashberg, “Demand and Supply Dynamics for Sequentially Released Products in International
Markets: The Case of Motion Pictures,” Marketing Science, Vol. 22, No. 3:329-354, 2003.
Faber, R. and T. O'Guinn, “Effect of Media Advertising and Other Sources on Movie Selection,” Journalism
Quarterly, Vol. 61:371-377, 1984.
Gatignon, H., Statistical Analysis of Management Data, Kluwer Academic Publishers, 2003.
Godes, D. and D. Mayzlin, “Using Online Conversations to Study Word of Mouth Communication,” Marketing
Science, Vol. 23, No. 4: 545-560, 2004.
Granger, C.W.J., “Investigating Causal Relations by Econometric Models and Cross-spectral Methods,”
Econometrica, Vol. 37:424-438, 1969.
Liu, Y., “Word of Mouth for Movies: Its Dynamics and Impact on Box Office Revenue,” Journal of Marketing, Vol.
70:74-89, 2006.
Lutkepohl, H., New Introduction to Multiple Time Series Analysis, Springer, 2005.
Neelamegham, R. and P. Chintagunta, “A Bayesian Model to Forecast New Product Performance in Domestic and
International Markets,” Marketing Science, Vol. 18, No. 2:115-136, 1999.
Saastamoinen, J., “Returns on Reputation in Retail E-commerce,” Journal of Electronic Commerce Research, Vol.
10, No. 4:196-219, 2009.
Scott, D. M., The New Rules of Viral Marketing: How Word-of-Mouse Spreads Your Ideas for Free, 2008.
Journal of Electronic Commerce Research, VOL 12, NO 3, 2011
Page 197
Suntornpithug, N. and J. Khamalah, “Machine and Person Interactivity: The Driving Forces behind Influences on
Consumers’ Willingness to Purchase Online,” Journal of Electronic Commerce Research, Vol. 11, No. 4:299-
325, 2010.
Technorati 2008 State of Blogsphere report, http://technorati.com/blogging/state-of-the-blogosphere/, 2008.
Walsh, M., “Study: Company Blogs Lead Social Media Options. Online Media Daily,”
http://www.mediapost.com/publications/?fa=Articles.showArticle&art_aid=99389, January 30, 2009
Qin: Dynamics between Word-of-Blog Volume and Sales for Movies
Page 198
Appendix
List of Movies with Title and Release Date
Movie Title Release Date Movie Title Release Date
Transformers: Revenge of the Fallen 6/24/2009 Harry Potter and the Half-blood Prince 7/15/2009
Terminator Salvation 5/21/2009 X-men Origins: Wolverine 5/1/2009
The Hangover 6/5/2009 Fast and Furious 4/3/2009
Angels & Demons 5/15/2009 Monsters vs. Aliens 3/27/2009
Public Enemies 7/1/2009 Dragonball Evolution 4/10/2009
Hannah Montana the Movie 4/10/2009 The Taking of Pelham 1 2 3 6/12/2009
Race to Witch Mountain 3/13/2009 Ghosts of Girlfriends Past 5/1/2009
State of Play 4/17/2009 The Haunting in Connecticut 3/27/2009
Julie & Julia 8/7/2009 Crank: High Voltage 4/17/2009
My Sister's Keeper 6/26/2009 The Last House on the Left 3/13/2009
(500) Days of Summer 7/17/2009 Observe and Report 4/10/2009
Dance Flick 5/22/2009 The Time Traveler's Wife 8/14/2009
The Soloist 4/24/2009 12 Rounds 3/27/2009
G.I. Joe: The Rise of Cobra 8/7/2009 District 9 8/14/2009
Ice Age: Dawn of the Dinosaurs 7/1/2009 I Love You, Beth Cooper 7/10/2009
G-Force 7/24/2009 Inglourious Basterds 8/21/2009
The Goods: Live Hard, Sell Hard 8/14/2009 Ponyo 8/14/2009
A Perfect Getaway 8/7/2009 Bandslam 8/14/2009
Aliens in the Attic 7/31/2009 The Final Destination 8/28/2009
Halloween II 8/28/2009 Taking Woodstock 8/26/2009
Post Grad 8/21/2009 All about Steve 9/4/2009
I Can Do Bad All by Myself 9/11/2009 Sorority Row 9/11/2009
Zombieland 10/2/2009 Cloudy with a Chance of Meatballs 9/18/2009
The Invention of Lying 10/2/2009 Pandorum 9/25/2009
Jennifer's Body 9/18/2009


![Critical Ultrasound Journal · According to the ‘Neurosonology in Acute Ischemic Stroke study,’ TCCS is an independent predictor for stroke patient's outcome [17]. Assessment](https://img.pdfslide.us/doc/110x75/5f0e68317e708231d43f1868/critical-ultrasound-journal-according-to-the-aneurosonology-in-acute-ischemic.jpg)