Embed Size (px)
Citation preview

Wool research to enhance the competitiveness and prosperity ofcompetitiveness and prosperity of
the U.S. sheep industry
Chris Lupton
Texas AgriLife ResearchTexas A&M SystemTexas A&M System,
San Angelo

Animal fiber research program p g
• Develop and evaluate improved• Develop and evaluate improved procedures for measuring value-determining characteristics ofdetermining characteristics of animal fibers.
• Collaborate in research projects that require fiber production and quality to be quantified.

Animal fiber programAnimal fiber program
• We recognize the need to increase sheep and goat numbers beforesheep and goat numbers before excessive infrastructure is lost.
• Develop technologies and / or animals capable of increasinganimals capable of increasing producers’ income.

Species we work withSpecies we work with
Muskox (qiviut), rabbit, dog, cattle, mice, et al.
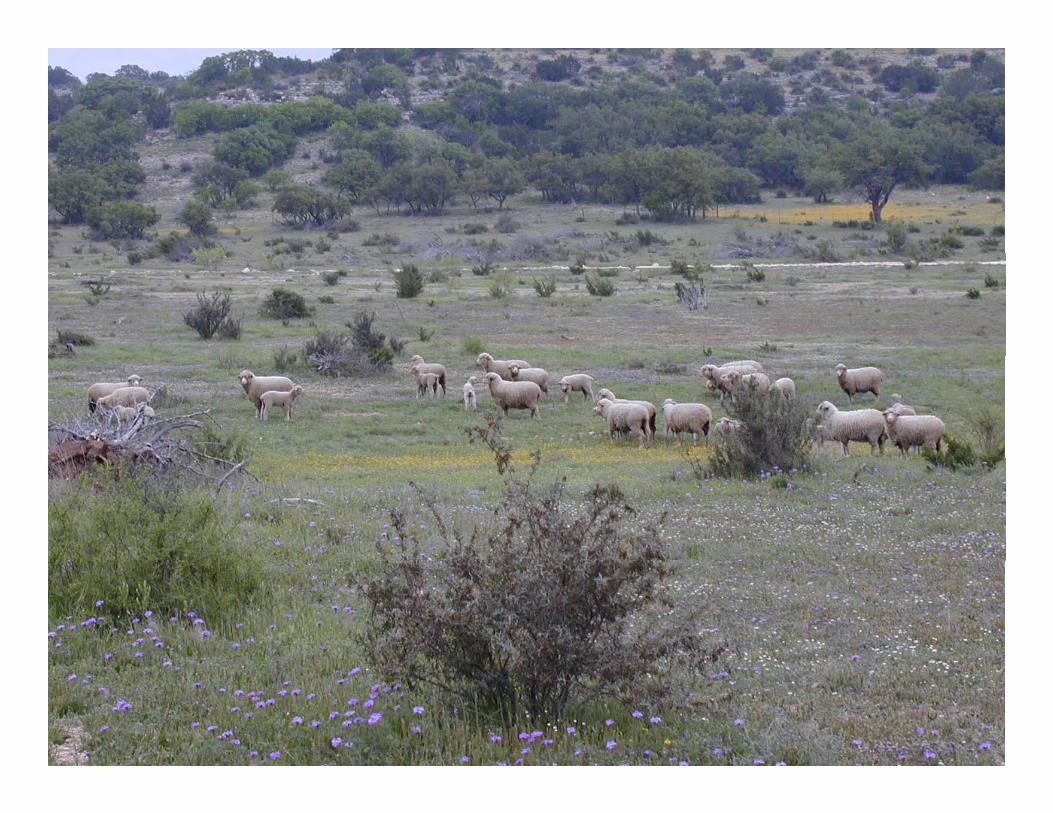
Current instrumentation focus
NIRS
Automatic image analysis, OFDA2000 100

The SAMBA System (AIA) for measurement of fiber
luster

Predicting the Average Fineness of Bulk Lines of Fine Wool by Measuring One Mid-side Staple From Each Skirted Fleece in the Line With an OFDA2000

Incentive to make wool lines within specific AFD ?AFD ranges?
• Actual wool price differentials
• USDA Wool Loan and LDP ratesUSDA Wool Loan and LDP rates

Current Loan, LDP, and Repayment Rates, $$/lb clean (1/7/09 to 1/13/09)
< 18.6 microns
18.6 to 19.5
19.6 to 20.5
20.6 to 22.0
Loan rate
5.27 3.38 2.45 2.24
LDP rate
2.33 0.88 0.45 0.30
Repayment rate 2.94 2.50 2.00 1.94
OFDA2000
• Designed to measure fiber diameter (and g (other traits) of greasy wool (usually side samples) under variable conditions of temperature and humiditytemperature and humidity.
• Greasy correction factor for a specific flock• Greasy correction factor for a specific flock based on average grease content determined on first 20 to 30 wool samples measured.

OFDA2000OFDA2000• Montana State University, Bozeman,
Rodney KottPMCI S A l R ld P• PMCI, San Angelo, Ronald Pope
• Texas AgriLife Research, San Angelo, Chris LuptonChris Lupton
• University of California, Davis, Martin Dallyy
• University of Nevada-Reno, Tumen Wuliji (Hudson Glimp)
• University of Wyoming, Laramie, Bob Stobart

OFDA2000OFDA2000
• Our commitment to ASI:• Assist wool producers with sheep
selection and wool marketing by g ymeasuring at least 5000 wool samples for at least 20 producers (not including p ( gUniversity flocks) charging only a nominal fee (no charge for machine). ( g )
• Conduct research using the instrument.

ProcedureProcedure
M h f bl l d b f• Measure sheep, preferably several days before shearing.
• Ear tag and/or mark sheep according to AFD for• Ear tag and/or mark sheep according to AFD for easy sorting (typically 3 groups).
• Shear and skirt fleeces. Package according to g gmeasured AFD (by-passing traditional classer except for short or tender fleeces, for example).

Procedure (contd.)Procedure (contd.)
• Core sample individual lots and measure at commercial wool testing glab.
• Compare predicted with actualCompare predicted with actual results.

Predictions made using the following tiassumptions:
OFDA2000 provides a reasonably accurate measurement of side sample.
? The mid-side AFD is an accurate predictor f fof the whole fleece AFD.
X All skirted fleeces weigh the same.

Results (< 18.6 µm group)( µ g p)
Predicted Actual P-A No. bales
17.2 18.3 -1.1 4
17.3 17.5 -0.2 6
17.4 18.2 -0.8 6
17.4 18.1 -0.7 2
17.5 18.2 -0.7 6
17.7 18.9 -1.2 5
17.7 18.9 -1.2 2
18.5 19.2 -0.7 7
18.5 18.6 -0.1 3

Results (< 18.6 to 19.5 µm group)( µ g p)
Predicted Actual P-A No. bales
18.6 19.0 -0.4 3
18.6 19.1 -0.5 7
18.8 18.6 0.2 4
19.1 19.4 -0.3 1
19.3 19.8 -0.5 2
19.3 19.6 -0.3 6
19.4 18.9 0.5 3
19.5 19.5 0.0 2
19.5 20.0 -0.5 8

Results (19.6 and > µm group)( µ g p)
Predicted Actual P-A No. bales
20.6 19.9 0.7 4
20.7 21.0 -0.3 9
20.7 20.1 0.6 2
20.8 20.6 0.2 39
20.8 20.8 0.0 1
21.1 20.8 0.3 621.1 20.8 0.3 6
21.1 20.7 0.4 2
21 3 21 2 0 1 321.3 21.2 0.1 3

ResultsResults• Overall, Actual AFD > Predicted AFD, 0.25 µm,
P=0.02.
• SE of y estimate (Actual AFD) = 0.35 µm.
• Range in (Predicted – Actual AFD) was –1.2 to 0.7 µm.µ

Predicted versus actual average fiber diameter of i t t l d b lk l liinstrument classed bulk wool lines
23
y = 0.70x + 6.02r2 = 0.88
22
23
ns
20
21
al A
FD, m
icro
18
19
Act
u
1717 18 19 20 21 22
Predicted AFD, microns

ConclusionsConclusions
• For the fine-wool flocks we worked withFor the fine wool flocks we worked with in West Texas, the method we used with the OFDA2000 proved to be a somewhat punreliable predictor of fiber diameter of instrument-classed wool lines.
• The accuracy of prediction varied considerably among clips.
• Weighing individual skirted fleeces would likely produce more accurate predictions.

Major Study: Australian Wool Innovation, May 2004
• Biases were observed between on-farm classing predictions (OFDA2000 and Fleecescan) and Certified Test results in the range –1.1 to +0.9 microns. Magnitude of bias was different for each property.

28R= 0.94 N = 1320
24
26
000
R 0.94 N 1320 y = 0.92 + 0.94x
20
22
OFD
A20
16
18O
14 16 18 20 22 24 26 28
OFDA 100
14

Previous Conclusion (most OFDA2000 users)
• The OFDA 2000 is an excellent tool for• The OFDA 2000 is an excellent tool for selection of sheep based on wool average fiber diameterfiber diameter.

Breed and crossbreed evaluations
• Comparison of Texas Rambouillet with MerinoComparison of Texas Rambouillet with Merino x Rambouillet crosses.
• Central performance tests for fine-wool (mainly Rambouillet) rams .

Selection and breed evaluation• Texas Rambouillet
Superior Genetics
• Dorper versus Rambouillet for lifetime lamb production
• Comparison of Meat vs Angora goats and Hair vs Rambouillet sheep in an extensive range environmentRambouillet sheep in an extensive range environment
Nutrition experimentsNutrition experiments
• Evaluation of the nutritional and feeding value of juniper and distiller’s driedvalue of juniper and distiller s dried grains in lamb feedlot rations.
• Fiber component in each of these projects