Embed Size (px)
DESCRIPTION
Woodies CCI
Citation preview

BASIC PATTERNS AND TERMINOLOGY
By James L. O’Connell
T H E R E I S R I S K O F L O S S I N T R A D I N G F U T U R E S
First I would like to thank Jim O’Connell of PFG (Peregrine Financial Group and Peregrine Charities) for reworking this document. This was needed very badly as the original needed to be updated. Jim spent many hours and hard work putting together the correct info and CCI documentation so that traders worldwide would have something to help them in there trading careers and learning CCI. Jim has gone past “traders helping traders” excellent work, and hope all who read it and learn CCI will be successful and thank Jim…JIM WELL DONE Woodie We hope that after reading this text, you will get the basic idea of Woodies CCI system, an ability to recognize his entry and corresponding exit patterns. This will also serve as a reference for all of the vocabulary used in Woodie’s community of traders, so you will be able to ask questions in the trading room. www.woodiescciclub.com Woodie’s goal is “Traders Helping Traders”. It is my hope that this text will do just that. Jim O’Connell This document is for educational purposes and is intended to describe how Woodie CCI system is used. Nothing written is to be taken as advice, please consult with your broker or financial advisor before placing any trade. Anyone selling or

copying this document or changing any information printed within is liable for legal action Getting Started Many have asked me ‘what is the best way to learn the CCI?’ My answer is to start on one pattern, one time frame, one indicator and one set up. I have found too many trying to learn all the patterns at once and all that does are cause confusion and frustration. Take one pattern at a time, learn it, follow it, until you can see it on any chart and that will hasten the learning curve. Markets will be there tomorrow, next week, next month do it right the first time and you’ll see it will get you up to speed faster. Also, get your own charts as many now have the Woodies CCI Trading Panel available. KEEP IT SIMPLE. READ the following document and apply it to your charts as this will also help your learning curve. One must apply oneself if you’re going to succeed. All my work and information is free for traders, if it helps you please make a donation to the MAKE-A-WISH FOUNDATION in honor Woodies CCI Club. Help put a smile on some kids face. I thank you in advance for that. Best Direct Navigator by Genesis and PFG brokerage work together to provide the Navigator solution for trades. This includes everything you need to analyze and trade the Woodie CCI System. Demo Registration and Software installation: Go to www.pfgkelly.com/navigator.asp Assistance call Neil Rogers 800 546 9423 or 312 775 3543 Email [email protected] Woodie
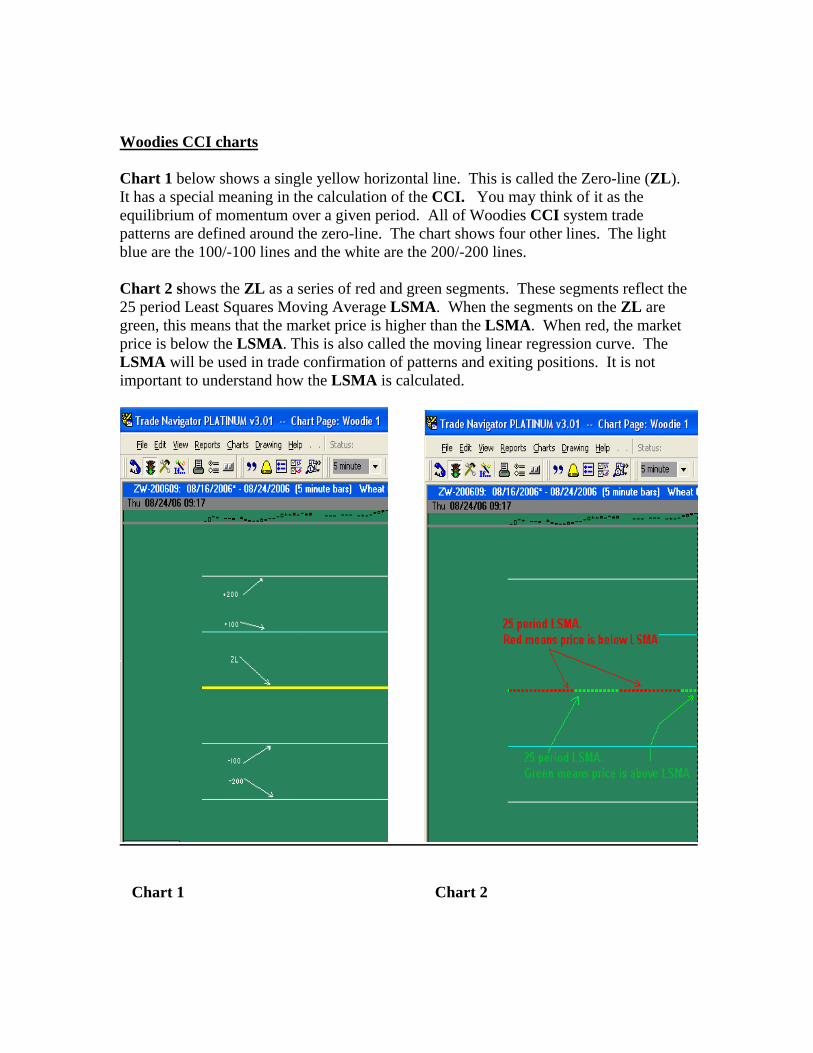
Woodies CCI charts Chart 1 below shows a single yellow horizontal line. This is called the Zero-line (ZL). It has a special meaning in the calculation of the CCI. You may think of it as the equilibrium of momentum over a given period. All of Woodies CCI system trade patterns are defined around the zero-line. The chart shows four other lines. The light blue are the 100/-100 lines and the white are the 200/-200 lines. Chart 2 shows the ZL as a series of red and green segments. These segments reflect the 25 period Least Squares Moving Average LSMA. When the segments on the ZL are green, this means that the market price is higher than the LSMA. When red, the market price is below the LSMA. This is also called the moving linear regression curve. The LSMA will be used in trade confirmation of patterns and exiting positions. It is not important to understand how the LSMA is calculated.
Chart 1 Chart 2
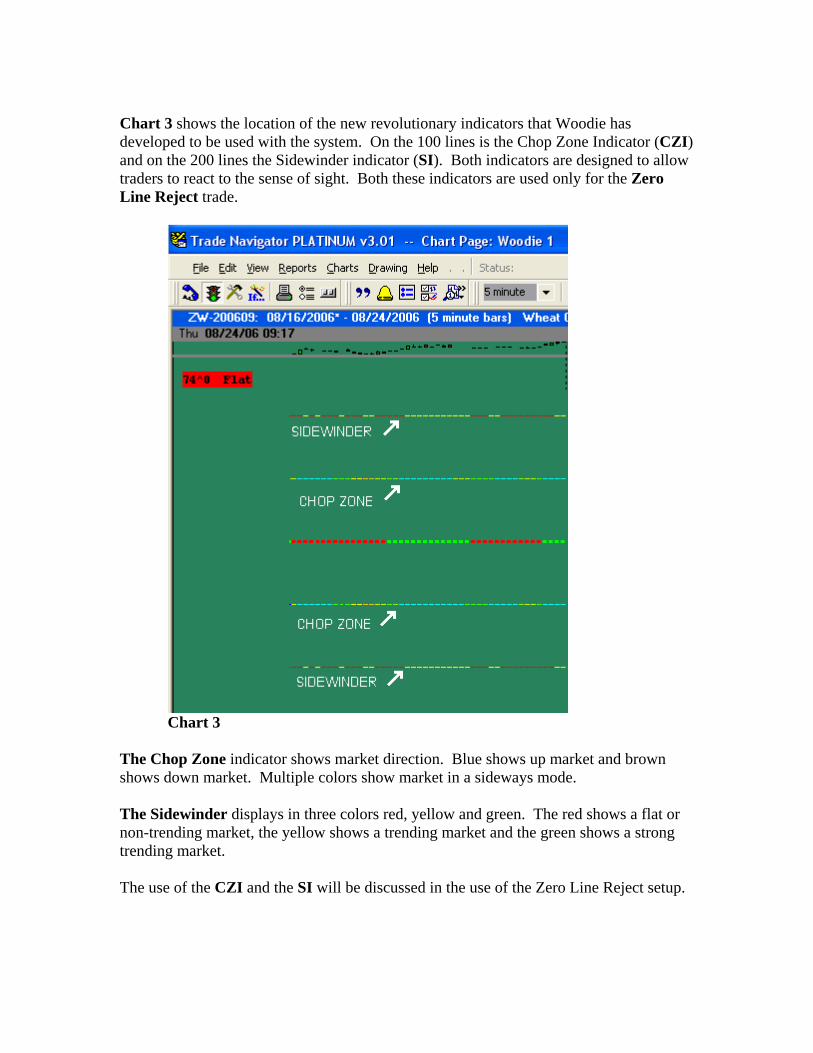
Chart 3 shows the location of the new revolutionary indicators that Woodie has developed to be used with the system. On the 100 lines is the Chop Zone Indicator (CZI) and on the 200 lines the Sidewinder indicator (SI). Both indicators are designed to allow traders to react to the sense of sight. Both these indicators are used only for the Zero Line Reject trade.
Chart 3
The Chop Zone indicator shows market direction. Blue shows up market and brown shows down market. Multiple colors show market in a sideways mode. The Sidewinder displays in three colors red, yellow and green. The red shows a flat or non-trending market, the yellow shows a trending market and the green shows a strong trending market. The use of the CZI and the SI will be discussed in the use of the Zero Line Reject setup.
Zero-Line It is the major support and resistance at this moment in time. Amplification:
“…at this moment in time”, means that it does not represent a forward-looking projection of where the support and resistance will be in moments from now, but where S/R is.
This line will be tested and crossed several times throughout the trading day.
Attention is necessary when the CCI crosses the ZL. These are important events during the trading day.
“It’s breaking major support and resistance at this time...this will give you confidence that the trade is going our way”
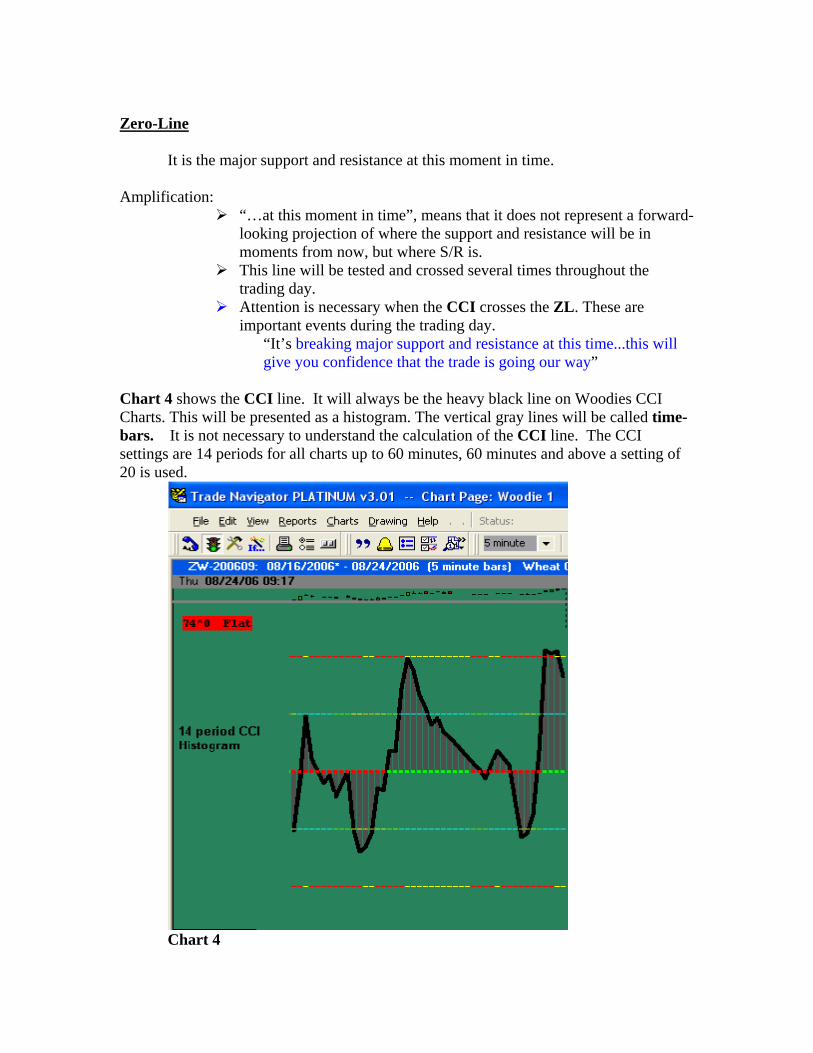
Chart 4 shows the CCI line. It will always be the heavy black line on Woodies CCI Charts. This will be presented as a histogram. The vertical gray lines will be called time-bars. It is not necessary to understand the calculation of the CCI line. The CCI settings are 14 periods for all charts up to 60 minutes, 60 minutes and above a setting of 20 is used.
Chart 4
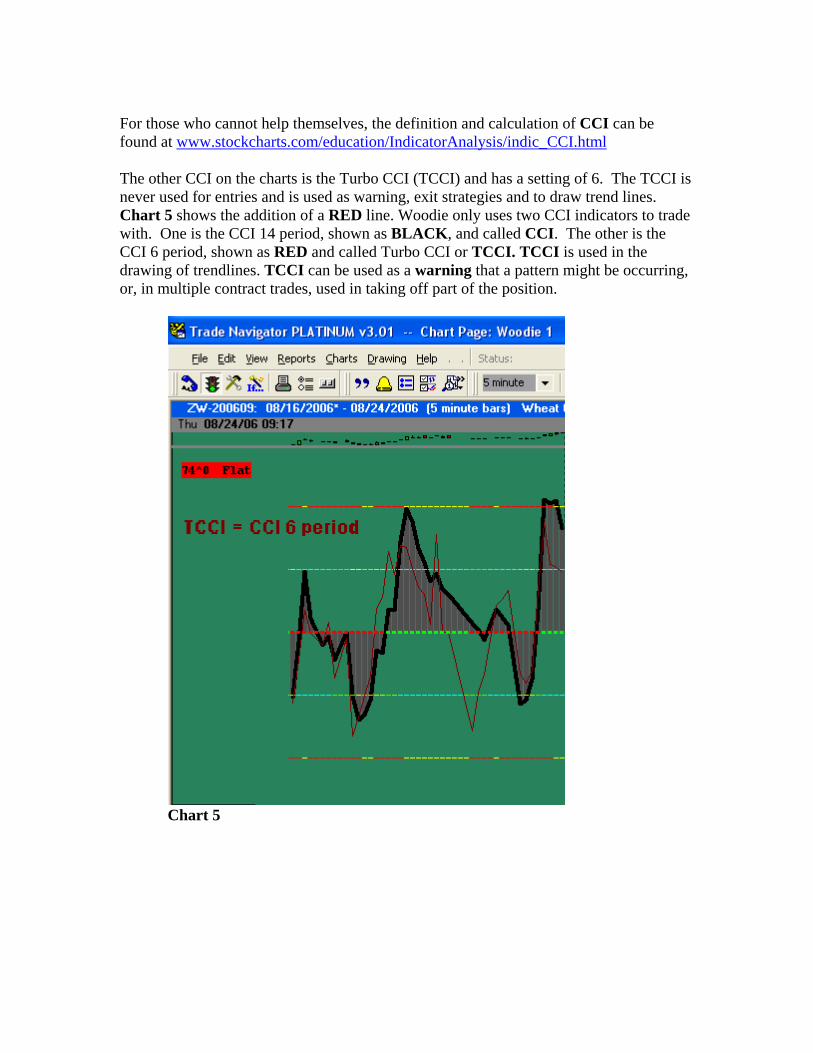
For those who cannot help themselves, the definition and calculation of CCI can be found at www.stockcharts.com/education/IndicatorAnalysis/indic_CCI.html The other CCI on the charts is the Turbo CCI (TCCI) and has a setting of 6. The TCCI is never used for entries and is used as warning, exit strategies and to draw trend lines. Chart 5 shows the addition of a RED line. Woodie only uses two CCI indicators to trade with. One is the CCI 14 period, shown as BLACK, and called CCI. The other is the CCI 6 period, shown as RED and called Turbo CCI or TCCI. TCCI is used in the drawing of trendlines. TCCI can be used as a warning that a pattern might be occurring, or, in multiple contract trades, used in taking off part of the position.
Chart 5
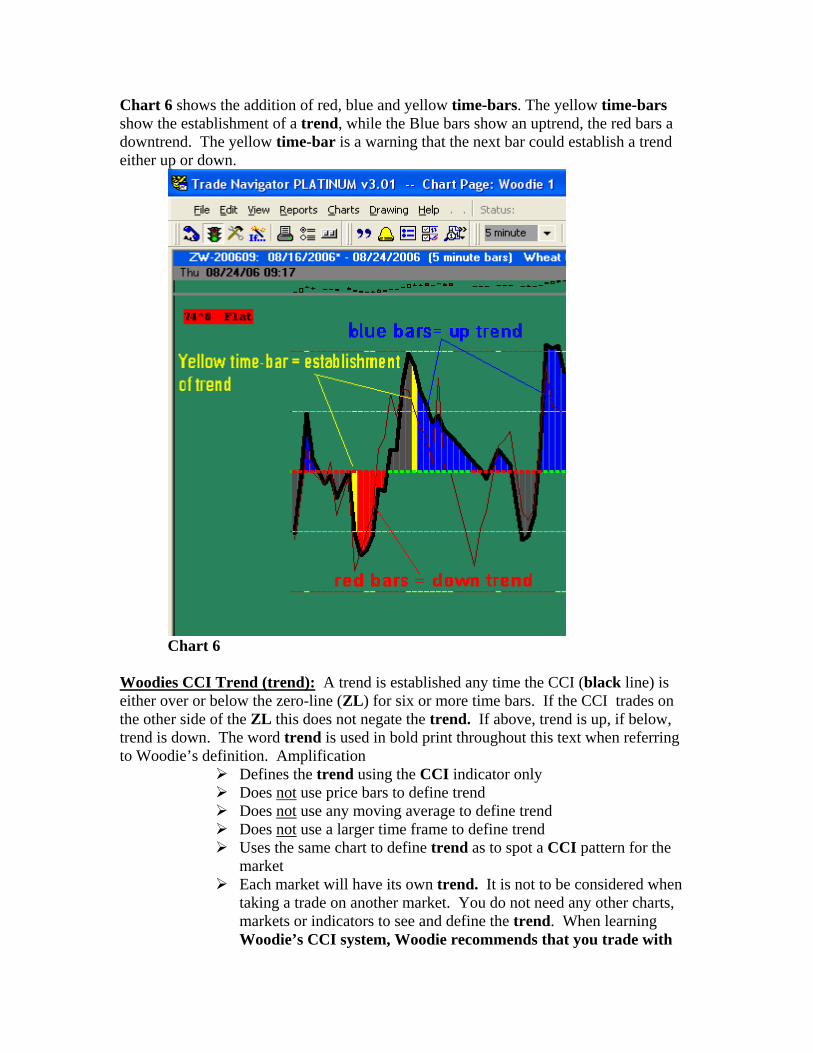
Chart 6 shows the addition of red, blue and yellow time-bars. The yellow time-bars show the establishment of a trend, while the Blue bars show an uptrend, the red bars a downtrend. The yellow time-bar is a warning that the next bar could establish a trend either up or down.
Chart 6
Woodies CCI Trend (trend): A trend is established any time the CCI (black line) is either over or below the zero-line (ZL) for six or more time bars. If the CCI trades on the other side of the ZL this does not negate the trend. If above, trend is up, if below, trend is down. The word trend is used in bold print throughout this text when referring to Woodie’s definition. Amplification
Defines the trend using the CCI indicator only Does not use price bars to define trend Does not use any moving average to define trend Does not use a larger time frame to define trend Uses the same chart to define trend as to spot a CCI pattern for the
market Each market will have its own trend. It is not to be considered when
taking a trade on another market. You do not need any other charts, markets or indicators to see and define the trend. When learning Woodie’s CCI system, Woodie recommends that you trade with
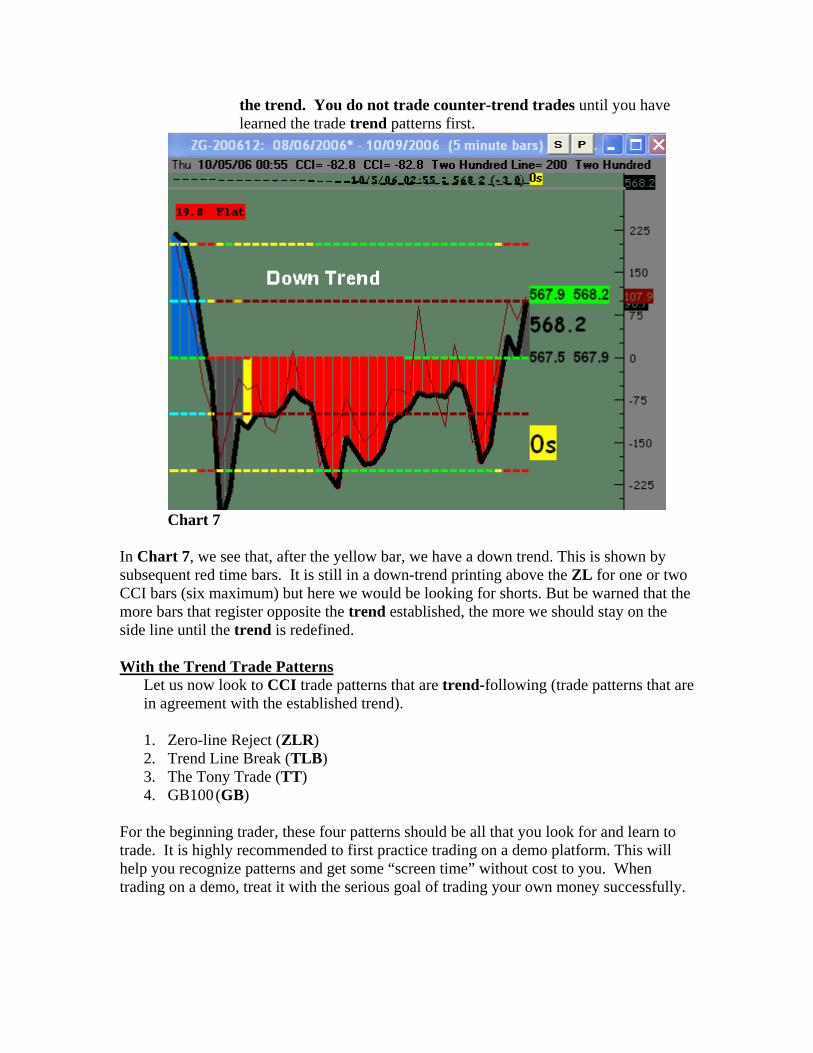
the trend. You do not trade counter-trend trades until you have learned the trade trend patterns first.
Chart 7
In Chart 7, we see that, after the yellow bar, we have a down trend. This is shown by subsequent red time bars. It is still in a down-trend printing above the ZL for one or two CCI bars (six maximum) but here we would be looking for shorts. But be warned that the more bars that register opposite the trend established, the more we should stay on the side line until the trend is redefined. With the Trend Trade Patterns
Let us now look to CCI trade patterns that are trend-following (trade patterns that are in agreement with the established trend).
1. Zero-line Reject (ZLR) 2. Trend Line Break (TLB) 3. The Tony Trade (TT) 4. GB100 (GB)
For the beginning trader, these four patterns should be all that you look for and learn to trade. It is highly recommended to first practice trading on a demo platform. This will help you recognize patterns and get some “screen time” without cost to you. When trading on a demo, treat it with the serious goal of trading your own money successfully.
Zero-line Reject (ZLR) This is where the CCI line is traveling in a direction opposite to the established trend toward, or just through, the ZL and then, in a subsequent bar, reverses direction from that to the established trend. To be considered a ZLR, the movement back or against the established trend, to the ZL should at least go back into the 100/-100 level then reverse back to trend direction. Must have 6 bars above/below zero line as discussed prior. For a long trade
CCI must be in an established uptrend with the CCI tracking above the 100 line
The CCI line must have change in direction against the established trend traveling below the 100 line
The CCI line must then reverse back (hook up) in the direction of the established trend CCI breaking the downtrend line must have a angle of 90 degrees or more up
This reverse must occur with the CZI blue (cyan) for at least three bars
The SI must be yellow or green
If all these conditions are met a Buy is warranted. If the bar closes in excess of 120 don’t chase the trade. Later we will discuss taking a trade before the signal bar close. For a short trade
CCI must be in established downtrend with the CCI tracking below the-100 line
The CCI line must have change in directon against the establish trend traveling above the -100 line
The CCI line must then reverse back (hook down) in the direction of the establish trend CCI breaking the uptrend line must have a angle of 90 degrees or more down
This reverse must occur with the CZI brown for at least three bars The SI must be yellow or green
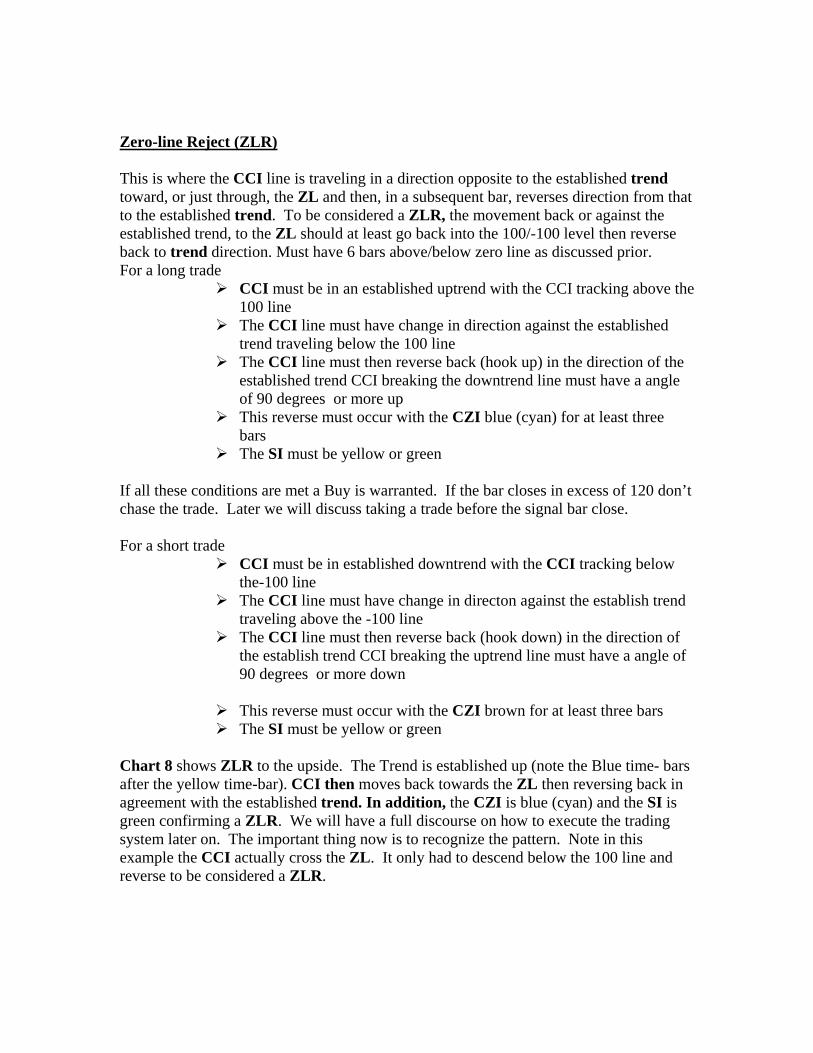
Chart 8 shows ZLR to the upside. The Trend is established up (note the Blue time- bars after the yellow time-bar). CCI then moves back towards the ZL then reversing back in agreement with the established trend. In addition, the CZI is blue (cyan) and the SI is green confirming a ZLR. We will have a full discourse on how to execute the trading system later on. The important thing now is to recognize the pattern. Note in this example the CCI actually cross the ZL. It only had to descend below the 100 line and reverse to be considered a ZLR.
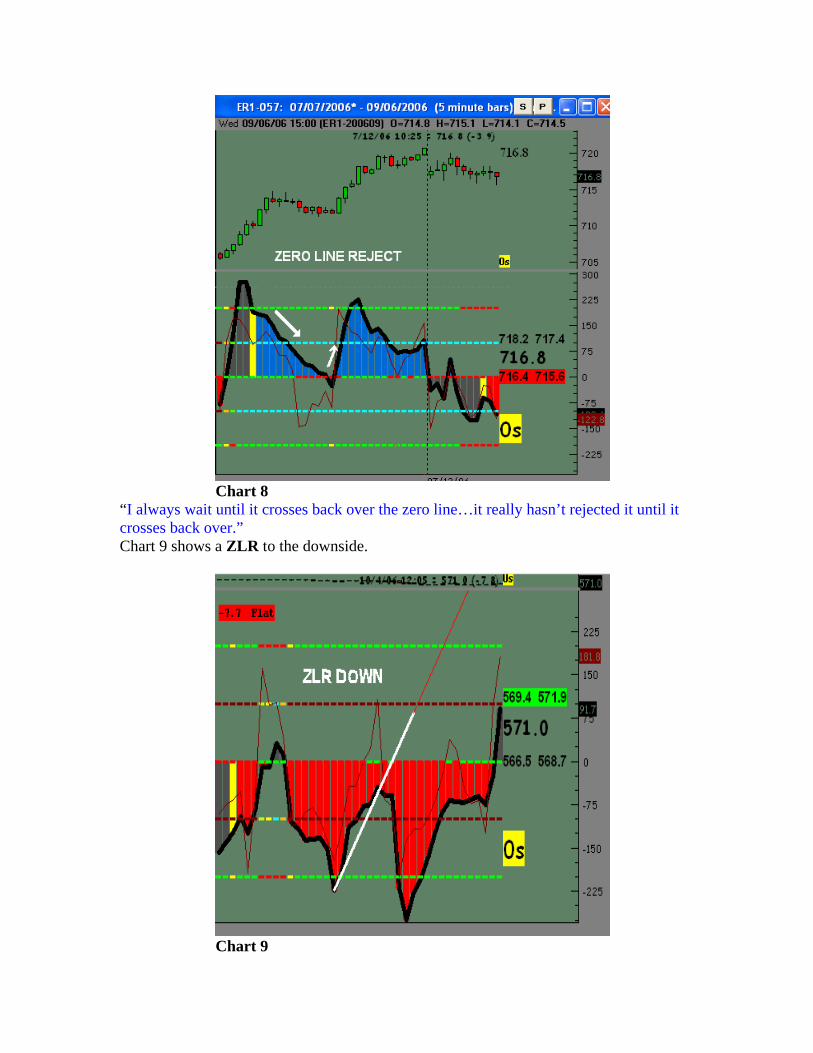
Chart 8
“I always wait until it crosses back over the zero line…it really hasn’t rejected it until it crosses back over.” Chart 9 shows a ZLR to the downside.
Chart 9
Trend Line Break (TLB)
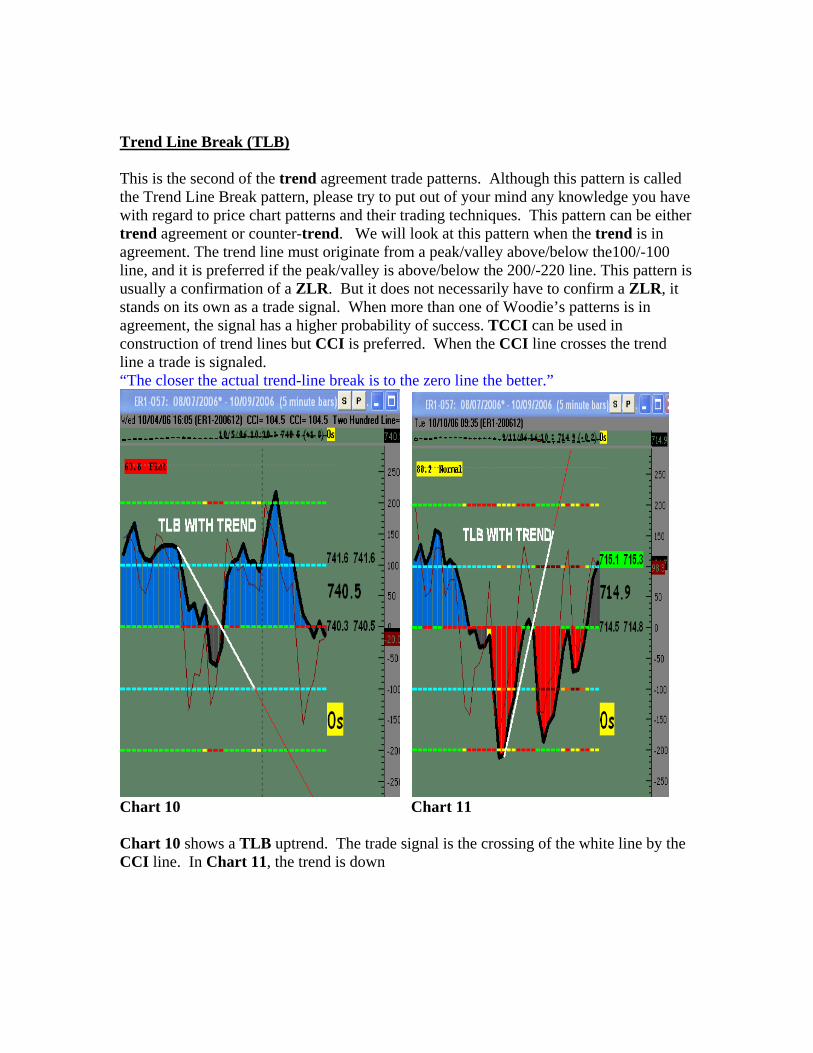
This is the second of the trend agreement trade patterns. Although this pattern is called the Trend Line Break pattern, please try to put out of your mind any knowledge you have with regard to price chart patterns and their trading techniques. This pattern can be either trend agreement or counter-trend. We will look at this pattern when the trend is in agreement. The trend line must originate from a peak/valley above/below the100/-100 line, and it is preferred if the peak/valley is above/below the 200/-220 line. This pattern is usually a confirmation of a ZLR. But it does not necessarily have to confirm a ZLR, it stands on its own as a trade signal. When more than one of Woodie’s patterns is in agreement, the signal has a higher probability of success. TCCI can be used in construction of trend lines but CCI is preferred. When the CCI line crosses the trend line a trade is signaled. “The closer the actual trend-line break is to the zero line the better.”
Chart 10 Chart 11 Chart 10 shows a TLB uptrend. The trade signal is the crossing of the white line by the CCI line. In Chart 11, the trend is down
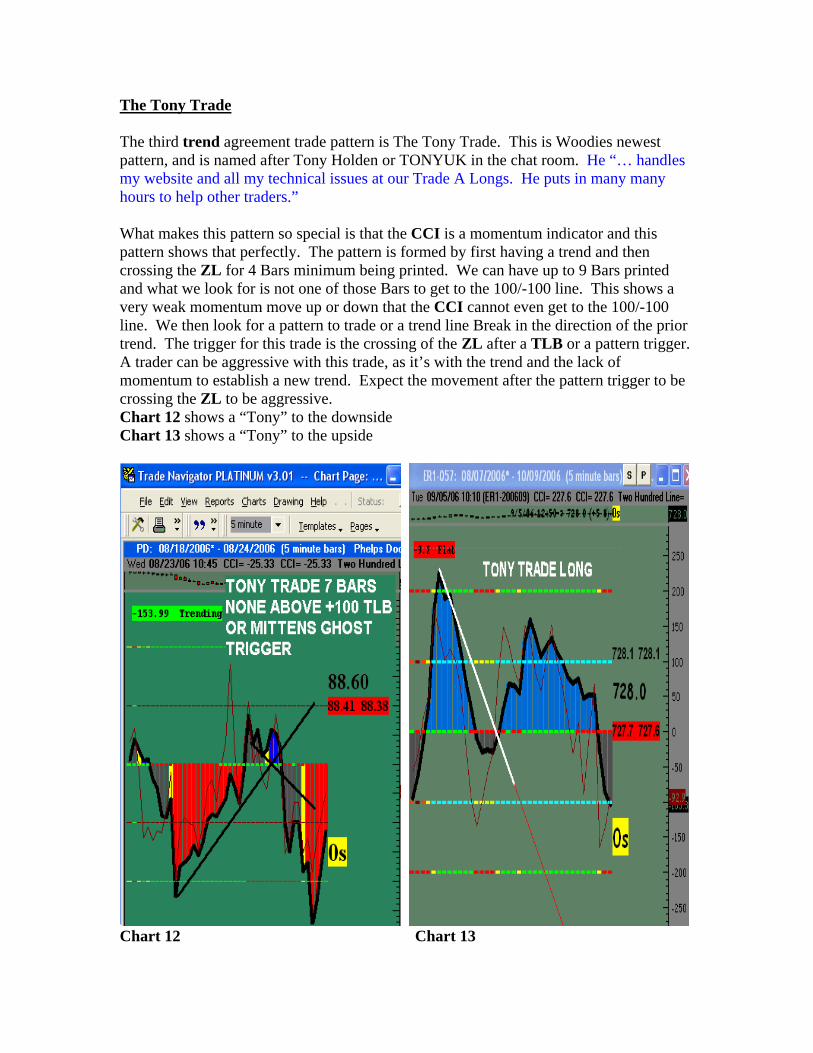
The Tony Trade The third trend agreement trade pattern is The Tony Trade. This is Woodies newest pattern, and is named after Tony Holden or TONYUK in the chat room. He “… handles my website and all my technical issues at our Trade A Longs. He puts in many many hours to help other traders.” What makes this pattern so special is that the CCI is a momentum indicator and this pattern shows that perfectly. The pattern is formed by first having a trend and then crossing the ZL for 4 Bars minimum being printed. We can have up to 9 Bars printed and what we look for is not one of those Bars to get to the 100/-100 line. This shows a very weak momentum move up or down that the CCI cannot even get to the 100/-100 line. We then look for a pattern to trade or a trend line Break in the direction of the prior trend. The trigger for this trade is the crossing of the ZL after a TLB or a pattern trigger. A trader can be aggressive with this trade, as it’s with the trend and the lack of momentum to establish a new trend. Expect the movement after the pattern trigger to be crossing the ZL to be aggressive. Chart 12 shows a “Tony” to the downside Chart 13 shows a “Tony” to the upside
Chart 12 Chart 13
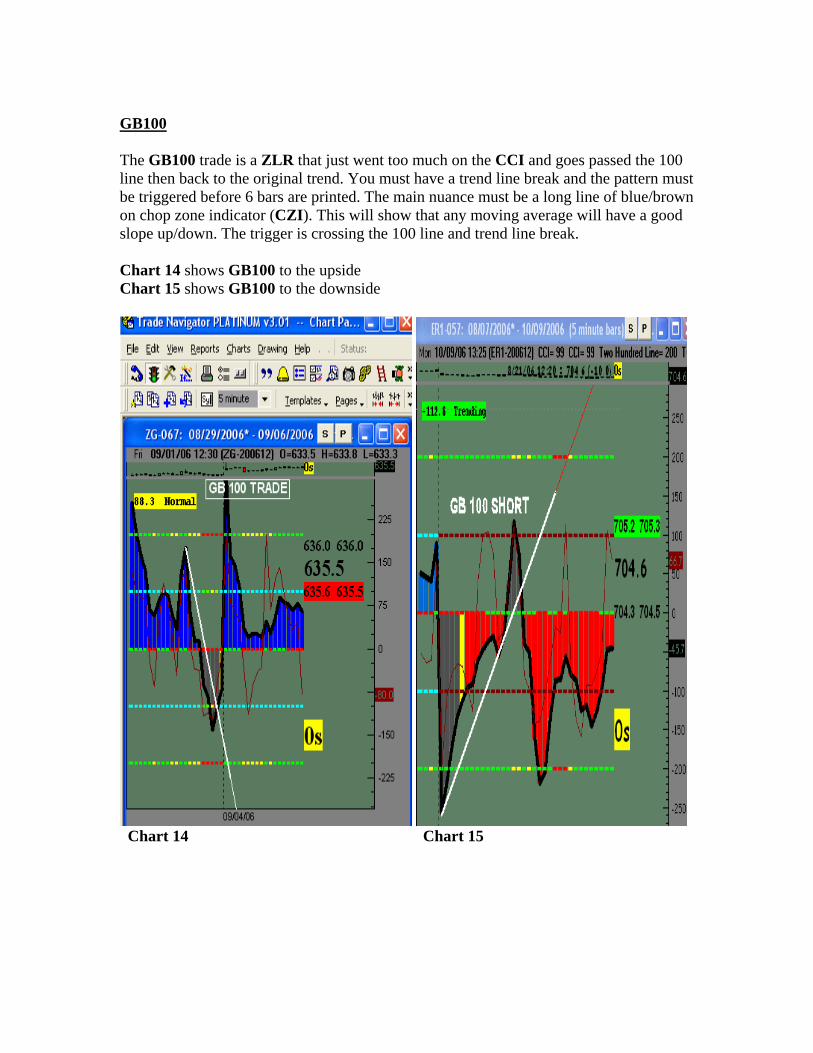
GB100 The GB100 trade is a ZLR that just went too much on the CCI and goes passed the 100 line then back to the original trend. You must have a trend line break and the pattern must be triggered before 6 bars are printed. The main nuance must be a long line of blue/brown on chop zone indicator (CZI). This will show that any moving average will have a good slope up/down. The trigger is crossing the 100 line and trend line break. Chart 14 shows GB100 to the upside Chart 15 shows GB100 to the downside
Chart 14 Chart 15
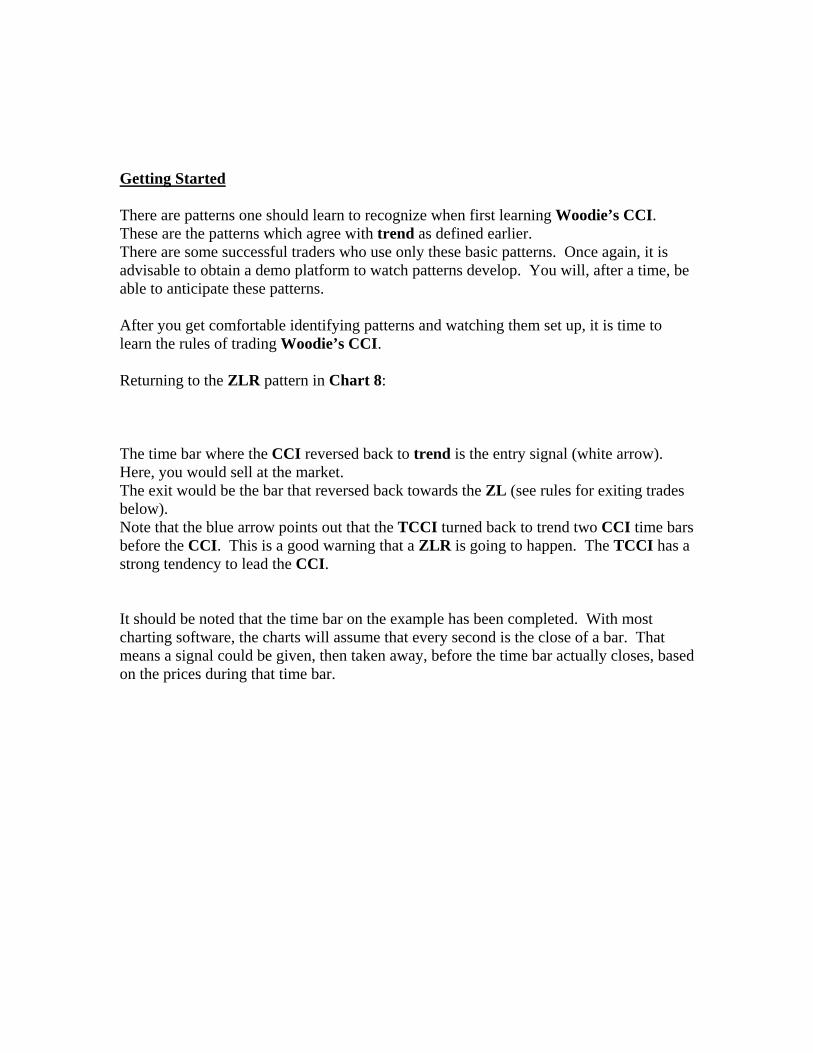
Getting Started There are patterns one should learn to recognize when first learning Woodie’s CCI. These are the patterns which agree with trend as defined earlier. There are some successful traders who use only these basic patterns. Once again, it is advisable to obtain a demo platform to watch patterns develop. You will, after a time, be able to anticipate these patterns. After you get comfortable identifying patterns and watching them set up, it is time to learn the rules of trading Woodie’s CCI. Returning to the ZLR pattern in Chart 8:
The time bar where the CCI reversed back to trend is the entry signal (white arrow). Here, you would sell at the market. The exit would be the bar that reversed back towards the ZL (see rules for exiting trades below). Note that the blue arrow points out that the TCCI turned back to trend two CCI time bars before the CCI. This is a good warning that a ZLR is going to happen. The TCCI has a strong tendency to lead the CCI. It should be noted that the time bar on the example has been completed. With most charting software, the charts will assume that every second is the close of a bar. That means a signal could be given, then taken away, before the time bar actually closes, based on the prices during that time bar.
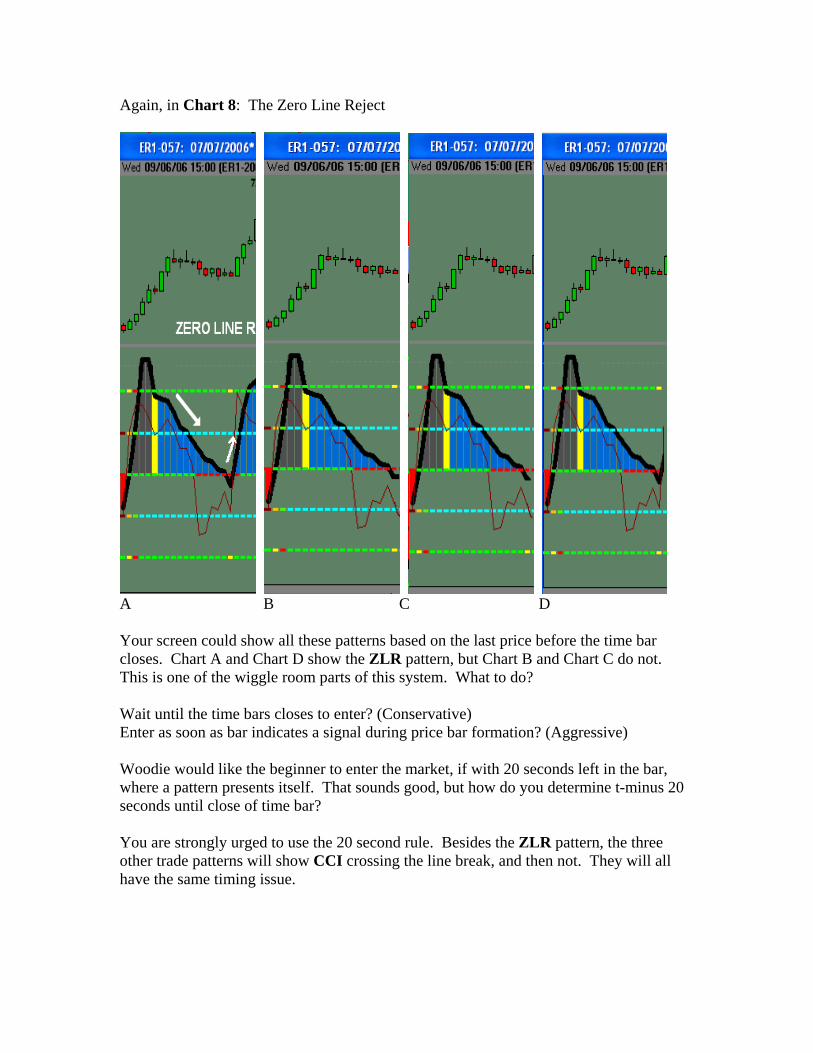
Again, in Chart 8: The Zero Line Reject
A B C D Your screen could show all these patterns based on the last price before the time bar closes. Chart A and Chart D show the ZLR pattern, but Chart B and Chart C do not. This is one of the wiggle room parts of this system. What to do? Wait until the time bars closes to enter? (Conservative) Enter as soon as bar indicates a signal during price bar formation? (Aggressive) Woodie would like the beginner to enter the market, if with 20 seconds left in the bar, where a pattern presents itself. That sounds good, but how do you determine t-minus 20 seconds until close of time bar? You are strongly urged to use the 20 second rule. Besides the ZLR pattern, the three other trade patterns will show CCI crossing the line break, and then not. They will all have the same timing issue.
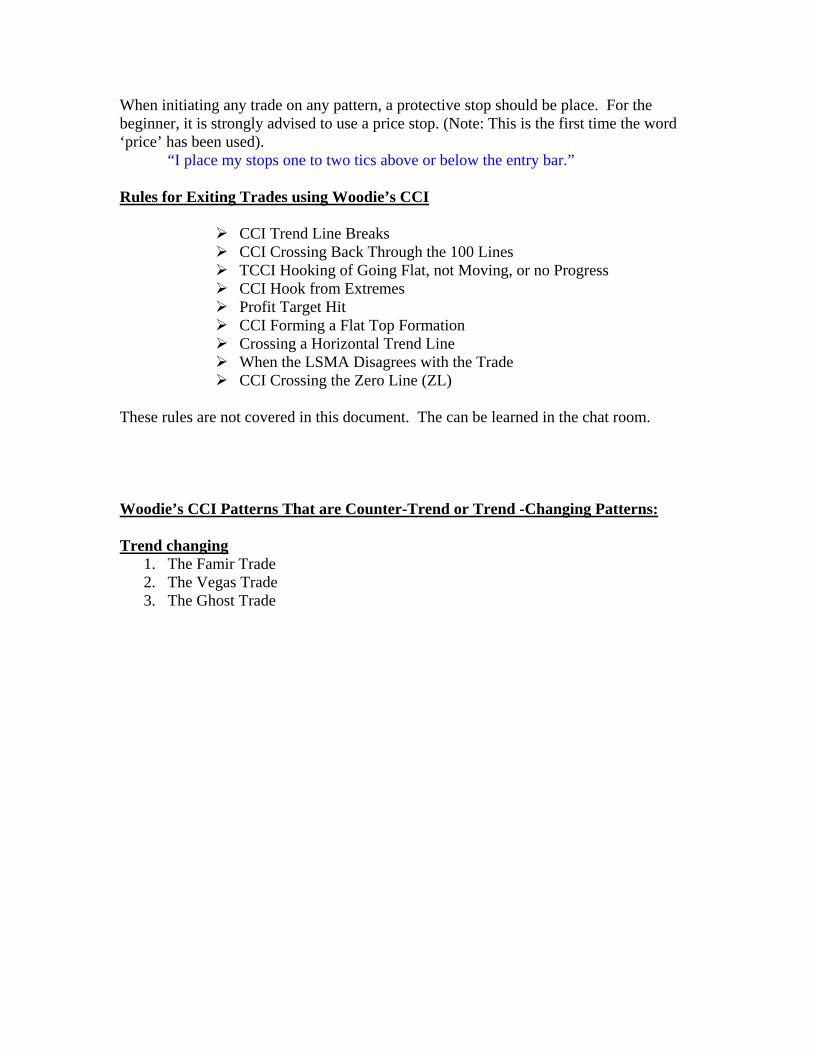
When initiating any trade on any pattern, a protective stop should be place. For the beginner, it is strongly advised to use a price stop. (Note: This is the first time the word ‘price’ has been used). “I place my stops one to two tics above or below the entry bar.” Rules for Exiting Trades using Woodie’s CCI
CCI Trend Line Breaks CCI Crossing Back Through the 100 Lines TCCI Hooking of Going Flat, not Moving, or no Progress CCI Hook from Extremes Profit Target Hit CCI Forming a Flat Top Formation Crossing a Horizontal Trend Line When the LSMA Disagrees with the Trade CCI Crossing the Zero Line (ZL)
These rules are not covered in this document. The can be learned in the chat room.
Woodie’s CCI Patterns That are Counter-Trend or Trend -Changing Patterns: Trend changing
1. The Famir Trade 2. The Vegas Trade 3. The Ghost Trade
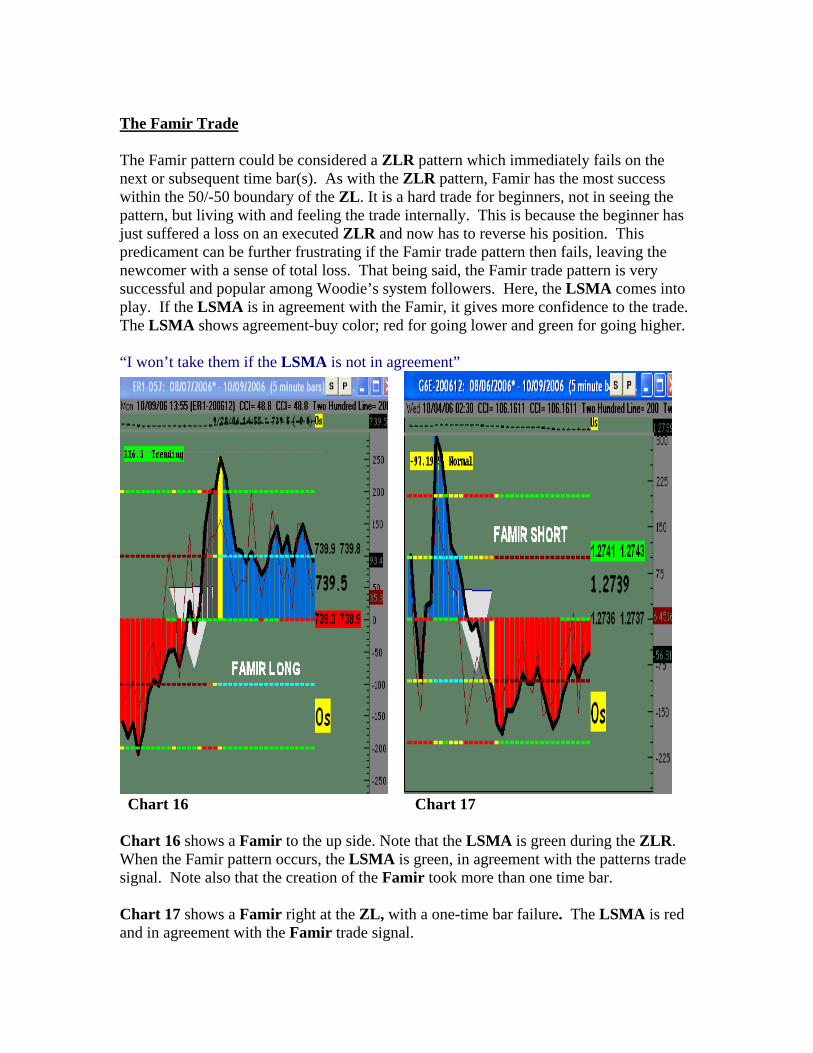
The Famir Trade The Famir pattern could be considered a ZLR pattern which immediately fails on the next or subsequent time bar(s). As with the ZLR pattern, Famir has the most success within the 50/-50 boundary of the ZL. It is a hard trade for beginners, not in seeing the pattern, but living with and feeling the trade internally. This is because the beginner has just suffered a loss on an executed ZLR and now has to reverse his position. This predicament can be further frustrating if the Famir trade pattern then fails, leaving the newcomer with a sense of total loss. That being said, the Famir trade pattern is very successful and popular among Woodie’s system followers. Here, the LSMA comes into play. If the LSMA is in agreement with the Famir, it gives more confidence to the trade. The LSMA shows agreement-buy color; red for going lower and green for going higher. “I won’t take them if the LSMA is not in agreement”
Chart 16 Chart 17 Chart 16 shows a Famir to the up side. Note that the LSMA is green during the ZLR. When the Famir pattern occurs, the LSMA is green, in agreement with the patterns trade signal. Note also that the creation of the Famir took more than one time bar. Chart 17 shows a Famir right at the ZL, with a one-time bar failure. The LSMA is red and in agreement with the Famir trade signal.
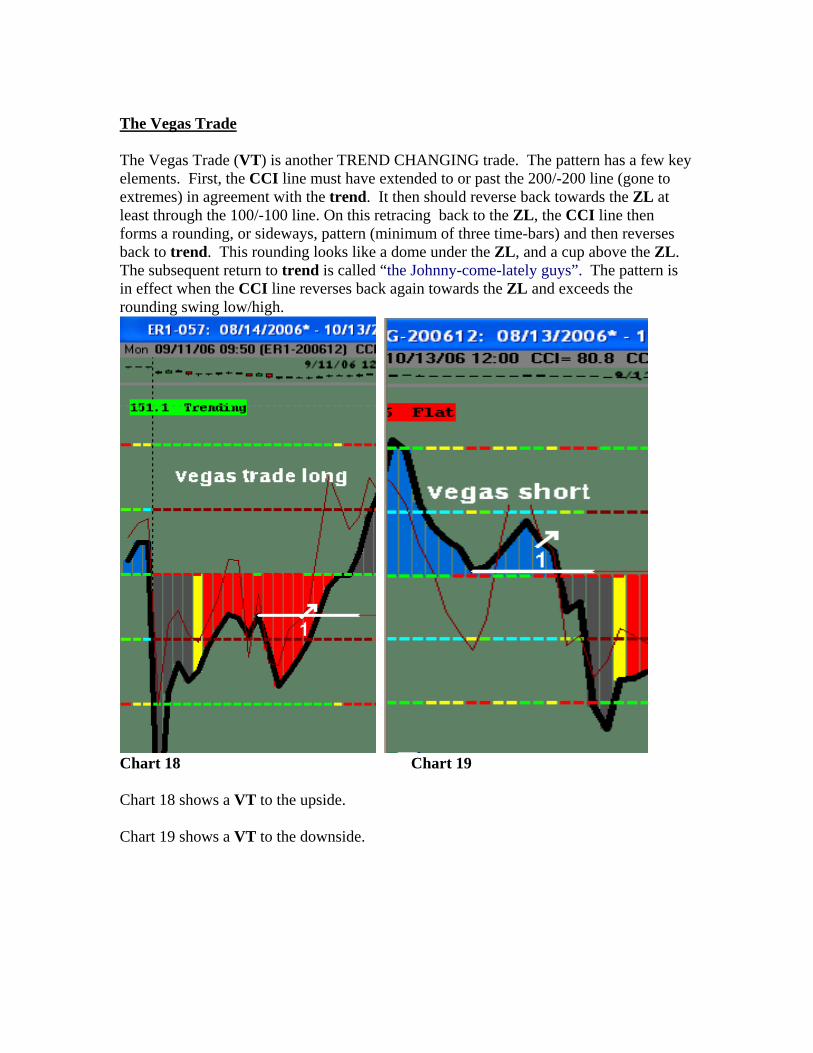
The Vegas Trade The Vegas Trade (VT) is another TREND CHANGING trade. The pattern has a few key elements. First, the CCI line must have extended to or past the 200/-200 line (gone to extremes) in agreement with the trend. It then should reverse back towards the ZL at least through the 100/-100 line. On this retracing back to the ZL, the CCI line then forms a rounding, or sideways, pattern (minimum of three time-bars) and then reverses back to trend. This rounding looks like a dome under the ZL, and a cup above the ZL. The subsequent return to trend is called “the Johnny-come-lately guys”. The pattern is in effect when the CCI line reverses back again towards the ZL and exceeds the rounding swing low/high.
Chart 18 Chart 19 Chart 18 shows a VT to the upside. Chart 19 shows a VT to the downside.
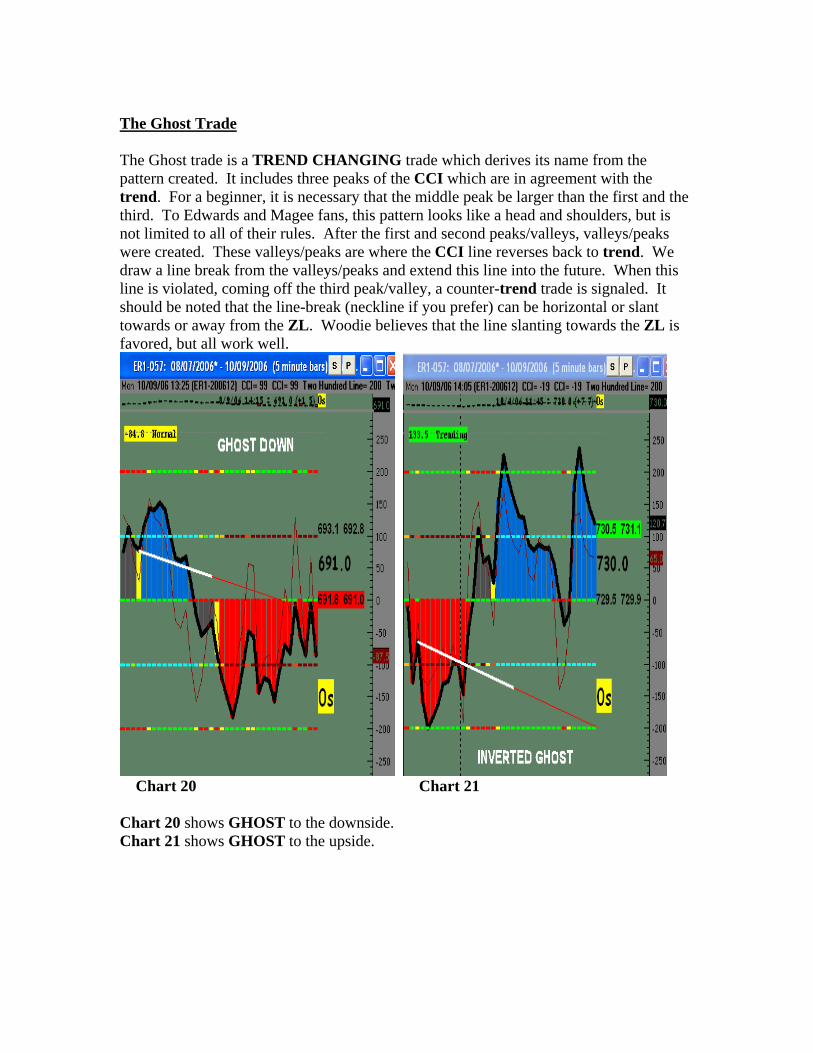
The Ghost Trade The Ghost trade is a TREND CHANGING trade which derives its name from the pattern created. It includes three peaks of the CCI which are in agreement with the trend. For a beginner, it is necessary that the middle peak be larger than the first and the third. To Edwards and Magee fans, this pattern looks like a head and shoulders, but is not limited to all of their rules. After the first and second peaks/valleys, valleys/peaks were created. These valleys/peaks are where the CCI line reverses back to trend. We draw a line break from the valleys/peaks and extend this line into the future. When this line is violated, coming off the third peak/valley, a counter-trend trade is signaled. It should be noted that the line-break (neckline if you prefer) can be horizontal or slant towards or away from the ZL. Woodie believes that the line slanting towards the ZL is favored, but all work well.
Chart 20 Chart 21 Chart 20 shows GHOST to the downside. Chart 21 shows GHOST to the upside.

Best Direct Navigator Free 30 day simulator. It gives full unrestricted access to Woodie’s panel with accurate historical and real-time data. BDN allows for auto trading functionality of Woodie’s trade setups. www.pfgkelly.com/woodies_navigator.asp Best Pro-Trader Free 30 day simulator. It gives full unrestricted access to Woodie’s panel with accurate real-time data. www.pfgkelly.com/woodies_protrader.asp Call Neil Rogers at (800)546-9423 or (312)775-3543 [email protected] If you have any questions about this text, please send me an E-mail to: [email protected]
T H E R E I S R I S K O F L O S S I N T R A D I N G F U T U R E S