Embed Size (px)
Citation preview
Page 1 |
1. INTRODUCTION
This factsheet focuses on increasing
women's participation in the labour market and decreasing pay and earnings gaps. In
all EU countries, women's labour participation is lower than men's. Women
in employment tend to work fewer hours,
work in lower-paying sectors, and occupy lower-ranking positions than men,
resulting in considerable gender pay and earnings gaps. These differences are to
some extent due to deep-rooted traditional gender roles, but also due to
economic incentives.
Increasing women's participation in the
labour-force and raising their employment rate are paramount to meeting the Europe
2020 headline target for 75% of the population aged 20-64 to be employed by
2020. These can provide a boost to economic growth1 and mitigate the social
and public finance risks related to
population ageing. Continuous efforts are also needed to tackle gender gaps and
move towards a dual model where both men and woman can be earners and
carers.
The EU has been promoting greater
gender equality in the labour market through a mix of legislation, policy
guidance and financial support.
This factsheet is structured as follows.
1 GDP per capita losses attributable to gender gaps in the labour market have been estimated
at up to 10% in Europe (Cuberes and Teignier-Baqué, 2016).
Section 2 reviews the performance in EU
countries with regard to female labour participation and the gender pay and
earnings gaps.
Section 3 discusses the available evidence on potential policies to
effectively address the challenges of low
female participation and their specific conditions, and reviews the approach on
this taken at the EU level.
Section 4 sketches good policy practice to increase female labour participation and
reduce gender inequalities among EU
countries.
This factsheet focuses on participation of women in the labour market. For a more
information on the gender pension gap, please refer to the factsheet on Adequacy
and Sustainability of Pensions.
2. CHALLENGES: AN OVERVIEW OF
PERFORMANCE IN EU COUNTRIES
2.1. A significant employment gap
between women and men
2.1.1. Women experience lower employment rates and higher levels
of part-time employment
In all Member States, employment rates
of women are lower than those for men, with big variations across the
EU. The Social Scoreboard headline indicator for gender equality in the labour
market is the gender employment gap,
EUROPEAN SEMESTER THEMATIC FACTSHEET
WOMEN IN THE LABOUR MARKET
Page 2 |
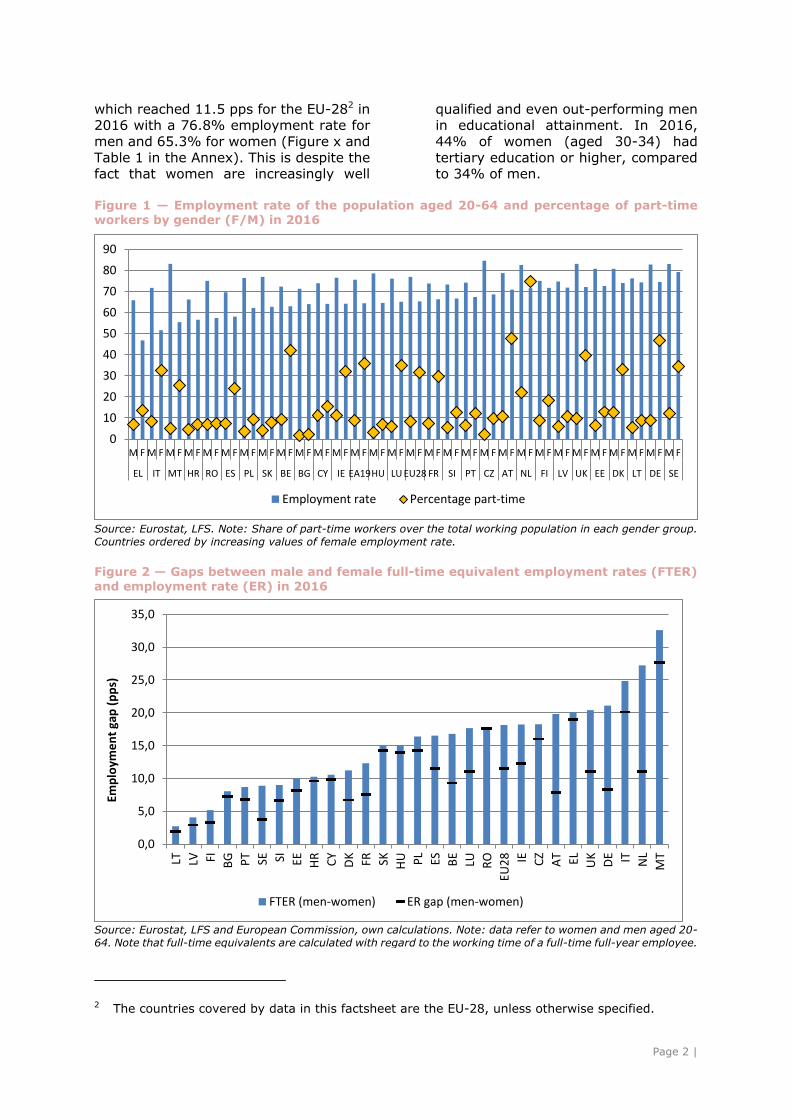
which reached 11.5 pps for the EU-282 in 2016 with a 76.8% employment rate for
men and 65.3% for women (Figure x and
Table 1 in the Annex). This is despite the fact that women are increasingly well
qualified and even out-performing men in educational attainment. In 2016,
44% of women (aged 30-34) had
tertiary education or higher, compared to 34% of men.
Figure 1 — Employment rate of the population aged 20-64 and percentage of part-time workers by gender (F/M) in 2016
Source: Eurostat, LFS. Note: Share of part-time workers over the total working population in each gender group.
Countries ordered by increasing values of female employment rate.
Figure 2 — Gaps between male and female full-time equivalent employment rates (FTER)
and employment rate (ER) in 2016
Source: Eurostat, LFS and European Commission, own calculations. Note: data refer to women and men aged 20-
64. Note that full-time equivalents are calculated with regard to the working time of a full-time full-year employee.
2 The countries covered by data in this factsheet are the EU-28, unless otherwise specified.
0
10
20
30
40
50
60
70
80
90
M F M F M F M F M F M F M F M F M F M F M F M F M F M F M F M F M F M F M F M F M F M F M F M F M F M F M F M F M F M F
EL IT MT HR RO ES PL SK BE BG CY IE EA19HU LU EU28 FR SI PT CZ AT NL FI LV UK EE DK LT DE SE
Employment rate Percentage part-time
0,0
5,0
10,0
15,0
20,0
25,0
30,0
35,0
LT LV FI BG PT SE SI EE HR CY
DK FR SK HU PL
ES BE
LU RO
EU2
8 IE CZ
AT EL UK
DE IT NL
MT
Emp
loym
en
t ga
p (
pp
s)
FTER (men-women) ER gap (men-women)
Page 3 |
A few Member States have female employment rate of 60% or below,
with high differences between female
and male employment rates (Greece, Italy, Malta, Croatia, Spain and
Romania, see Figure 2, Figure 3 and Table 1 in the Annex). Most of these
Member States also face strong demographic ageing prospects3 and have
strong potential for increasing labour supply by bringing more women into the
workforce. Malta, Italy, Greece, Romania, the Czech Republic, Slovakia, Poland,
Hungary, Ireland and Luxembourg also
suffer from a large gap between male and female employment rates, with Malta
having the largest (27.6 pps, or even 32.6 pps if considering full-time equivalent
rates). In addition, the employment rate is also strikingly low for older women (age
55-64) in some cases4.
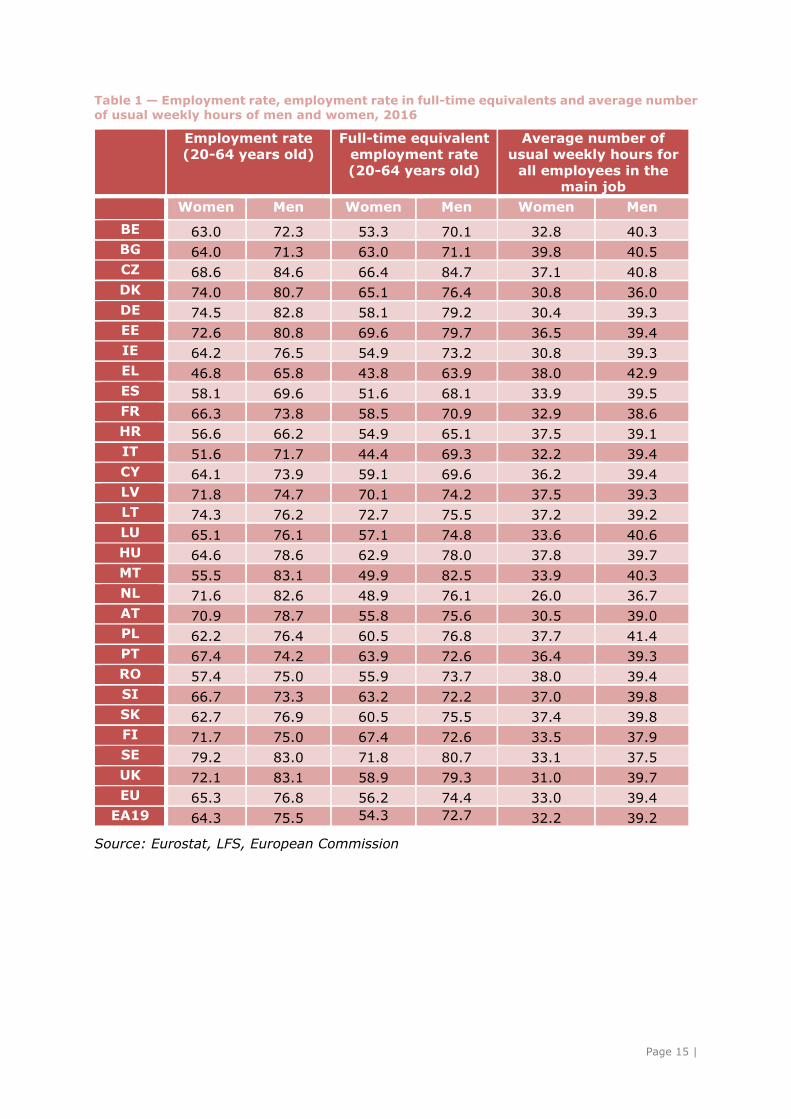
The gender gap in part-time work
remains high. As it is most often women who carry the bulk of caring
responsibilities, they tend to reduce their working hours. One third (31.4%) of
women in employment in the EU worked on a part-time basis in 2016, a much
higher proportion than the corresponding
share for men (8.2%). This results in a gender gap in full-time equivalent rates of
18 pps in the EU (see Figure 2 and Table 1 in the Annex). The gap is particularly high
in the Netherlands (where more than 75% of employed women work part-time) and
Malta, but also in Italy, Germany, the UK, Greece and Austria (see Figure 1). On
average across the EU, men spend more
than 6 hours a week more in paid work than women (Table 1 in the Annex).
3 According to demographic projections, the population of working age is projected to
decline in a majority of Member States, and especially in Lithuania, Latvia, Bulgaria, Slovakia, Greece, Portugal, Poland, Estonia,
Romania, Germany, Croatia and Hungary (see
European Commission (2015), Ageing report) http://ec.europa.eu/economy_finance/publicati
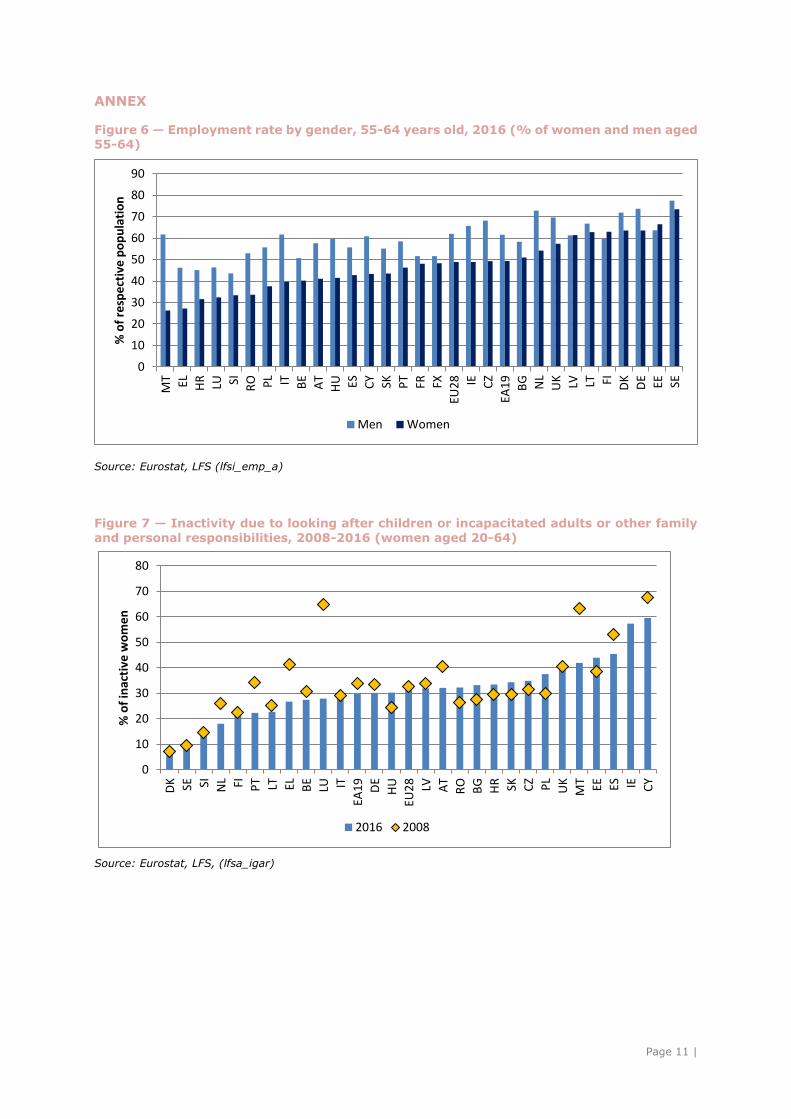
ons/european_economy/2015/pdf/ee3_en.pdf. 4 As shown in Figure 6 in Annex, it is below 35% in Malta, Greece, Slovenia, Croatia, Romania and Luxembourg.
Particular attention needs to be given to the labour market participation of
vulnerable categories of women, such
as older women, single parents, women with a disability, women with a migrant
background and women from ethnic minorities.
2.1.2. The unbalanced sharing of
caring responsibilities between women and men
More than 50% of the potential female workforce (aged 25-49) in 2016 is inactive
because women are looking after children or incapacitated adults in Cyprus, Ireland,
Spain, Estonia, Malta, and the UK (see Figure 7 in the Annex).
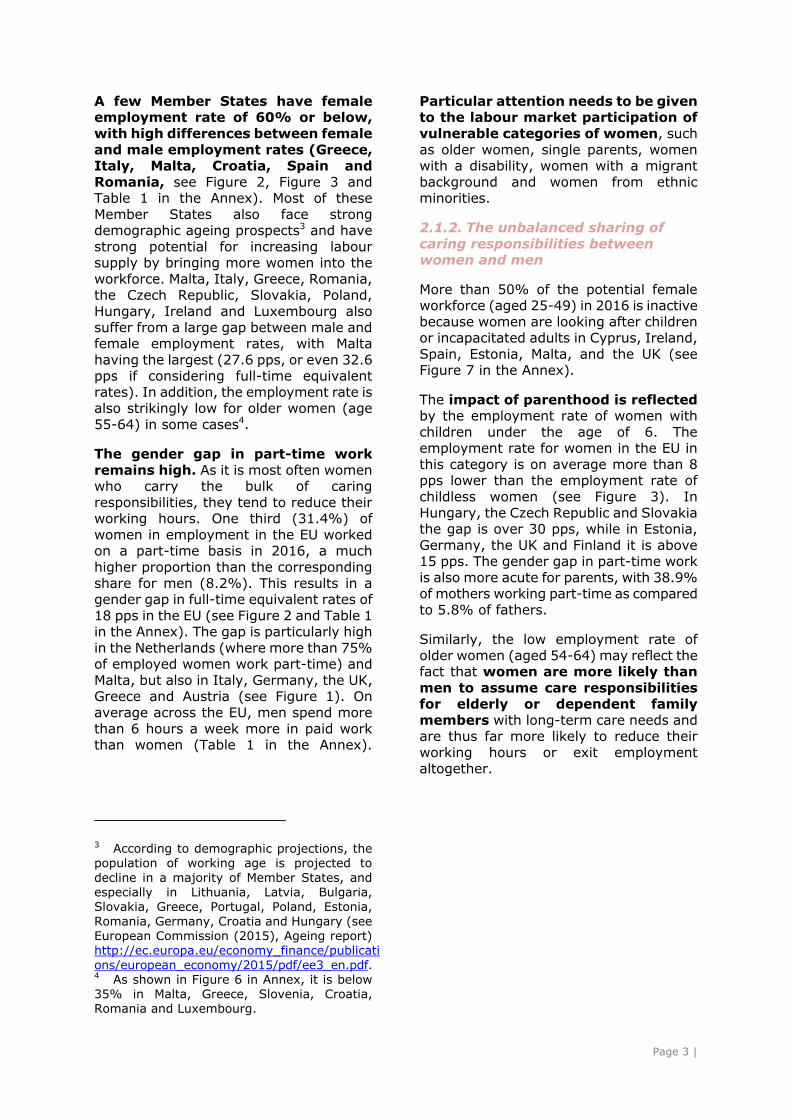
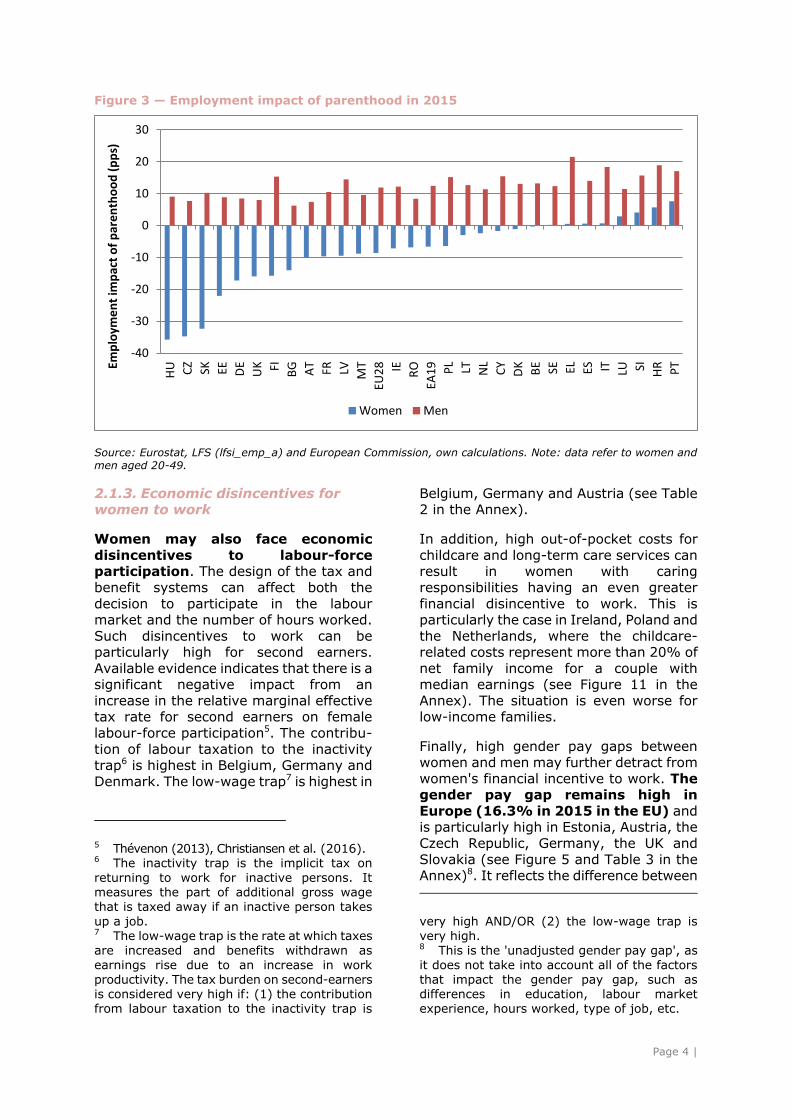
The impact of parenthood is reflected by the employment rate of women with
children under the age of 6. The employment rate for women in the EU in
this category is on average more than 8 pps lower than the employment rate of
childless women (see Figure 3). In
Hungary, the Czech Republic and Slovakia the gap is over 30 pps, while in Estonia,
Germany, the UK and Finland it is above 15 pps. The gender gap in part-time work
is also more acute for parents, with 38.9% of mothers working part-time as compared
to 5.8% of fathers.
Similarly, the low employment rate of
older women (aged 54-64) may reflect the fact that women are more likely than
men to assume care responsibilities for elderly or dependent family
members with long-term care needs and are thus far more likely to reduce their
working hours or exit employment
altogether.
Page 4 |
Figure 3 — Employment impact of parenthood in 2015
Source: Eurostat, LFS (lfsi_emp_a) and European Commission, own calculations. Note: data refer to women and men aged 20-49.
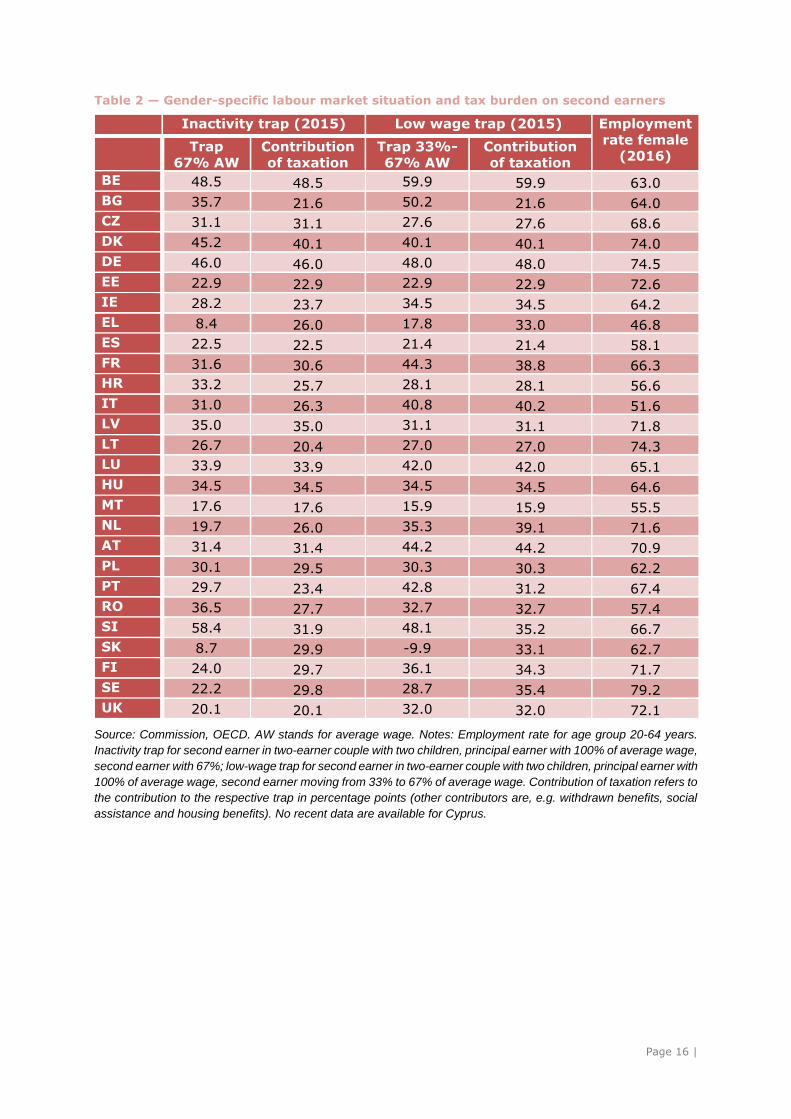
2.1.3. Economic disincentives for women to work
Women may also face economic
disincentives to labour-force participation. The design of the tax and
benefit systems can affect both the
decision to participate in the labour market and the number of hours worked.
Such disincentives to work can be particularly high for second earners.
Available evidence indicates that there is a significant negative impact from an
increase in the relative marginal effective tax rate for second earners on female
labour-force participation5. The contribu-
tion of labour taxation to the inactivity trap6 is highest in Belgium, Germany and
Denmark. The low-wage trap7 is highest in
5 Thévenon (2013), Christiansen et al. (2016). 6 The inactivity trap is the implicit tax on
returning to work for inactive persons. It measures the part of additional gross wage that is taxed away if an inactive person takes
up a job. 7 The low-wage trap is the rate at which taxes are increased and benefits withdrawn as
earnings rise due to an increase in work productivity. The tax burden on second-earners is considered very high if: (1) the contribution from labour taxation to the inactivity trap is
Belgium, Germany and Austria (see Table 2 in the Annex).
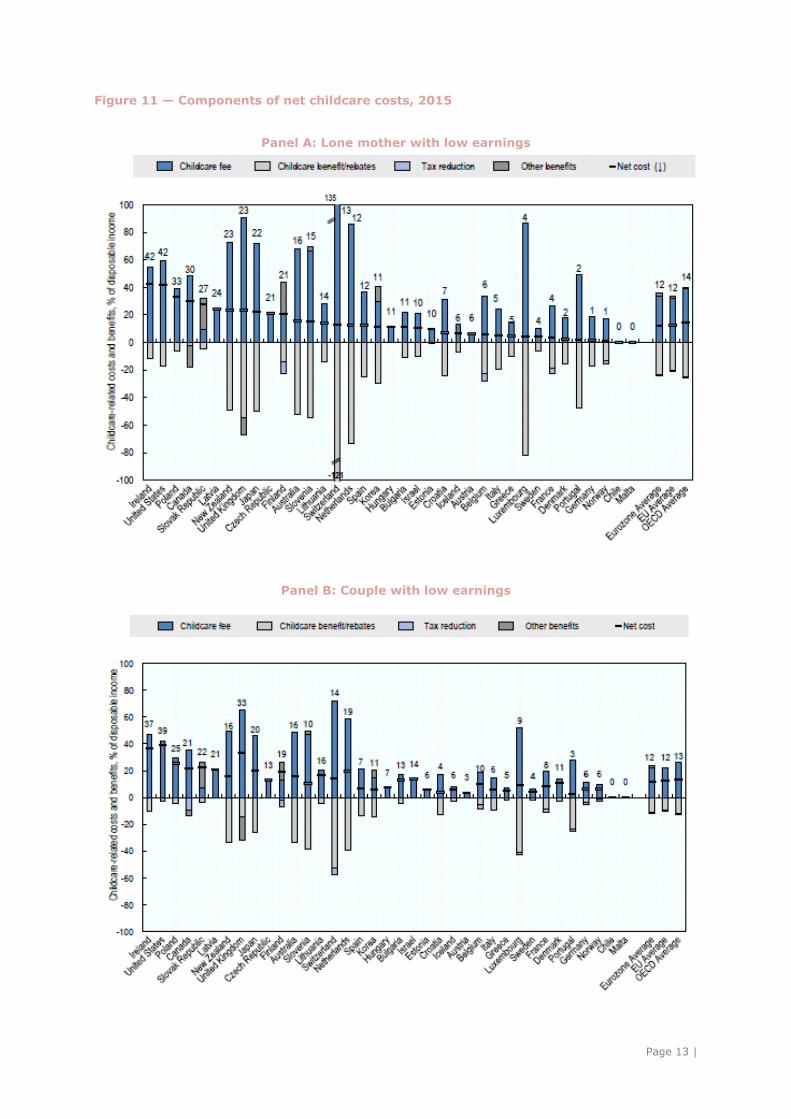
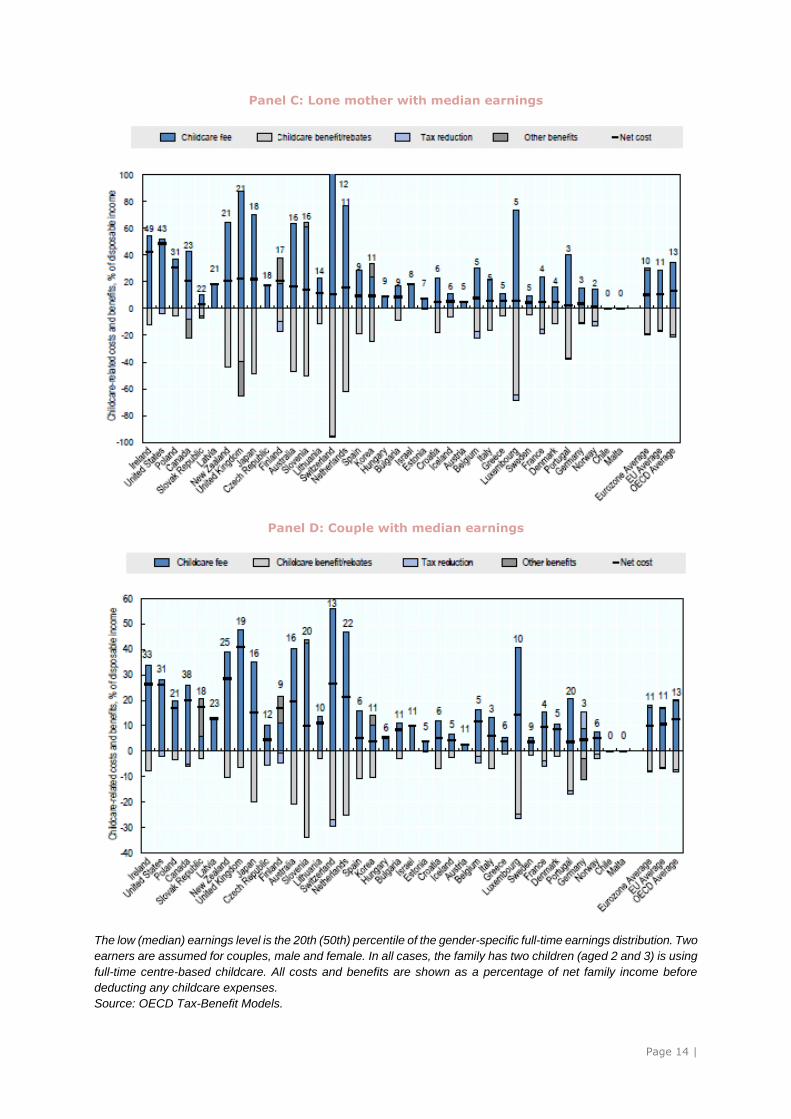
In addition, high out-of-pocket costs for
childcare and long-term care services can result in women with caring
responsibilities having an even greater
financial disincentive to work. This is particularly the case in Ireland, Poland and
the Netherlands, where the childcare-related costs represent more than 20% of
net family income for a couple with median earnings (see Figure 11 in the
Annex). The situation is even worse for low-income families.
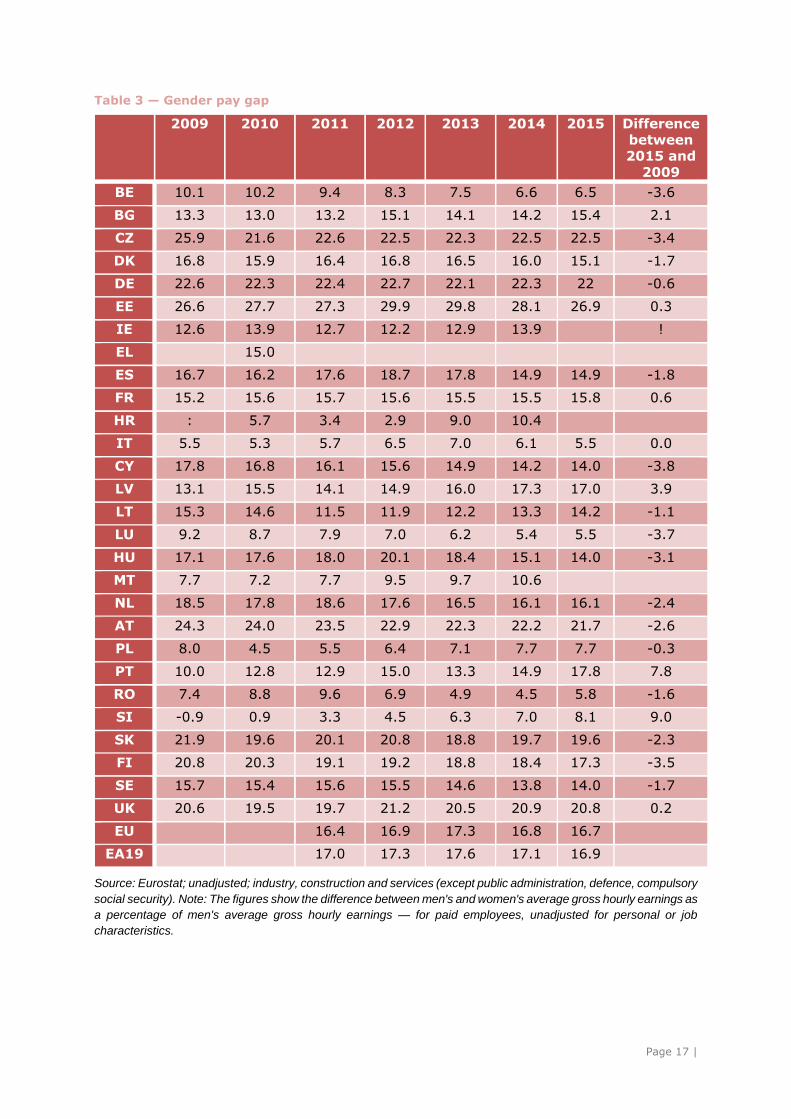
Finally, high gender pay gaps between women and men may further detract from
women's financial incentive to work. The gender pay gap remains high in
Europe (16.3% in 2015 in the EU) and is particularly high in Estonia, Austria, the
Czech Republic, Germany, the UK and
Slovakia (see Figure 5 and Table 3 in the Annex)8. It reflects the difference between
very high AND/OR (2) the low-wage trap is
very high. 8 This is the 'unadjusted gender pay gap', as
it does not take into account all of the factors that impact the gender pay gap, such as differences in education, labour market experience, hours worked, type of job, etc.
-40
-30
-20
-10
0
10
20
30
HU CZ
SK EE DE
UK FI BG AT
FR LV MT
EU2
8 IE RO
EA1
9 PL LT NL
CY
DK
BE SE EL ES IT LU SI HR PTEm
plo
yme
nt
imp
act
of
par
en
tho
od
(p
ps)
Women Men
Page 5 |
men's and women's pay, based on the average difference in gross hourly
earnings of all employees. The gender
pay gap is a secondary gender equality indicator in the Social Scoreboard.
The various potential drivers of the
gender pay gap differ in size and impact9. These include observable factors such as
differences in work experience due to the low employment level of women
described above. They also include
imbalances in the type of job (vertical segregation) or the sector of employment
(horizontal segregation). For the EU, such imbalances as a whole are relatively high,
reaching 24.3% for occupational and 18.9% for sectoral imbalances10. Other
factors such
as discrimination may also widen the gender pay gap. Moreover, the high
prevalence of part-time work among
female workers also contributes to the gap, as part-time-work is associated with
significant lower hourly wages in most countries.
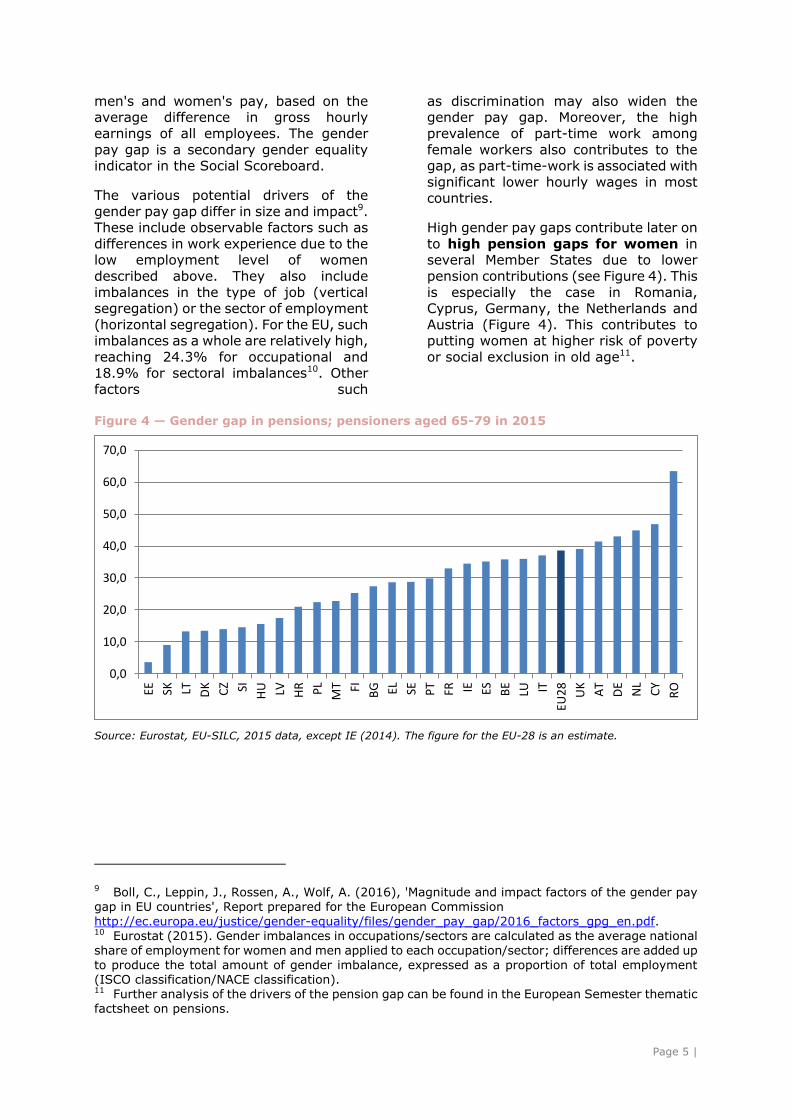
High gender pay gaps contribute later on
to high pension gaps for women in several Member States due to lower
pension contributions (see Figure 4). This
is especially the case in Romania, Cyprus, Germany, the Netherlands and
Austria (Figure 4). This contributes to putting women at higher risk of poverty
or social exclusion in old age11.
Figure 4 — Gender gap in pensions; pensioners aged 65-79 in 2015
Source: Eurostat, EU-SILC, 2015 data, except IE (2014). The figure for the EU-28 is an estimate.
9 Boll, C., Leppin, J., Rossen, A., Wolf, A. (2016), 'Magnitude and impact factors of the gender pay gap in EU countries', Report prepared for the European Commission
http://ec.europa.eu/justice/gender-equality/files/gender_pay_gap/2016_factors_gpg_en.pdf. 10 Eurostat (2015). Gender imbalances in occupations/sectors are calculated as the average national share of employment for women and men applied to each occupation/sector; differences are added up
to produce the total amount of gender imbalance, expressed as a proportion of total employment (ISCO classification/NACE classification). 11 Further analysis of the drivers of the pension gap can be found in the European Semester thematic factsheet on pensions.
0,0
10,0
20,0
30,0
40,0
50,0
60,0
70,0
EE SK LT DK CZ SI
HU LV HR PL
MT FI BG EL SE PT
FR IE ES BE
LU IT
EU2
8
UK
AT
DE
NL
CY
RO
Page 6 |
3. POLICY LEVERS TO ADDRESS WOMEN'S UNDERREPRESENTATION
IN THE LABOUR MARKET
There are a number of policy levers that
are intended to tackle the challenges of women's low participation in the labour
market. These include work-life balance policies such as well-designed, gender-
balanced family-related leaves, flexible working arrangements and formal care
services, as well as policies to limit the
economic disincentives for women to work.
3.1. Work-life balance policies to address the unbalanced sharing of
caring responsibilities
3.1.1. Gender-balanced family-
related leaves
The provision of compensated family-related leave tends to boost female
labour-force participation by:
helping women to reconcile work and family life;
allowing them some time off when they have a young child to care for;
strengthening their attachment to the labour market.
Evidence also shows that effective protections against dismissal for pregnant
workers or workers returning from leave can have an important role in keeping
women in the labour market. On the other hand, excessively long leaves have been
shown to have a harmful effect on women's careers, making it more difficult
for them to re-enter employment12.
A balanced use of leave entitlements
between women and men after childbirth has also been shown to have
positive effects on the distribution of household and care responsibilities and on
female labour market outcomes. The use
of leave arrangements by fathers reduces some of the burden of care on mothers,
12 The duration of what constitutes excessively
long leave is subject to some academic debate. The OECD has cautioned against leaves longer
than 2 years because of skill deterioration and long career interruptions which make it more difficult for them to re-enter employment. OECD (2012) Closing the gender gap.
and thus enables women to return to the labour market sooner. However, fathers'
take-up of paternity and parental leave is
generally very low and when fathers do take leave, the periods of leave are
usually very short. The level of the benefit and the degree of flexibility (i.e. whether
or not a leave can be taken on a piecemeal or part-time basis) can help to improve
fathers' take-up of leaves. Reserving leave periods for fathers (paternity leave and
non-transferable parental leave) can also increase the take-up of leave by men.
Adequate leave to take care of other dependent relatives can also have a
positive impact on female employment. Where there is no provision for carers'
leave, it is generally women who will work part-time or drop out of the labour market
to take care of their relative for a short
period of time.
3.1.2. Flexible working arrangements
Insufficient availability of flexible working arrangements — such as telework and
flexitime — and of reduced working hours (part-time work) can lead people
with caring responsibilities, particularly women, to exit the labour market.
Eurofound has reported that more than half of inactive mothers would prefer to
work part-time13. Key drivers of
effectiveness are the presence of consensus among the social partners that
flexibility is valuable, a workplace culture supportive of flexible working, and
responsiveness to changing needs over the course of one's life.
However, the availability of part-time work can lead to gender wage gaps and in the
longer run reinforce the gender pension gap. This is because women often take on
part-time work due to their higher share of caring responsibilities14. Ensuring both
13 Eurofound (2014), Third European Quality of
Life Survey — Quality of life in Europe: Families
in the economic crisis. 14 Just under one third (31.4%) of women
aged 15-64 who were employed in the EU-28 worked on a part-time basis in 2016, a much higher proportion than the corresponding share for men (8.2%).

Page 7 |
the quality of flexible work and a gender-balanced take-up of these arrangements is
key to ensuring gender equality.
3.1.3. Accessible, affordable and
quality formal care services
Formal care services are important
tools to remove obstacles to employment. The headline indicator of the Social
Scoreboard for early childhood care is the enrolment of children aged less than 3
years in formal childcare. In 2015, only 31% of children under 3 were enrolled in
formal childcare, which is below the
Barcelona target of 33%. In five Member States even less than 10% of children
under 3 were enrolled (see Figure x). Low
attendance rates may reflect possible shortfalls in the provision of formal
childcare services, especially for children up to 3 years of age. In addition to a
lack of available places, difficulties in access (distance, opening hours, strict
eligibility criteria), the high out-of-pocket cost of these services and poor
quality have all been shown to be obstacles to the use of these services.
Figure 5 — Share of children cared for by formal arrangements as a percentage, out of the total number of children in the respective age group, 2015
Source: Eurostat, EU-SILC.
Page 8 |
Demographic ageing leads to a rise in demand for long-term care services,
one that is expected to continue in the
future. However, these services remain underdeveloped in many Member States.
The lack of adequate long-term care arrangements negatively affects the
labour market participation of informal carers, a disproportionate share of whom
are women.
3.2. Policy levers to address
economic disincentives for women to work
3.2.1. Adjusting tax-benefit systems
to reduce financial disincentives for second earners
A key feature of the tax-benefit system affecting the work incentives for second
earners is the degree of jointness of taxation and eligibility for benefits,
transferable tax credits and depen-dent spouse allowances. In most EU
countries, the unit of taxation is the
individual. However, in some countries couples are taxed jointly (e.g. Germany,
France, Ireland, Luxembourg and Portugal) or couples may opt for joint taxation (e.g.
Spain). Shifting from joint taxation systems to individual taxation systems can
help reduce disincentives (in particularly in countries with high progressivity of
taxation). Eliminating transferable tax
credits between partners can also help to reduce work disincentives for the lower
earner, as well as eliminating dependent spouse allowances.
3.2.2. Tackling the gender pay gap
Part-time work and career breaks for care responsibilities have a negative impact on
women's hourly wages and on their career prospects15. The policy levers mentioned
in Section 3.1 can also have a positive impact on addressing the gender pay and
pension gaps.
Strengthening public awareness of anti-
discrimination laws, promoting pay transparency and improving enforcement
15 OECD (2012), Close the gender gap: act now.
of equal pay provisions also contribute to reducing wage inequalities16.
Initiatives to tackle gender imbalances in education, training and in the labour
market17 can help women access higher-wage professions and sectors. Policies to
improve students' awareness of fast-growing industries and high-paying jobs
may reduce gender stereotypes in the choice of field of study at university and
increase female representation in science,
technology, engineering and mathematics (STEM). Raising awareness among men
about some of the top growth occupations that are predominantly occupied by
women can also help18.
4. CROSS EXAMINATION OF POLICY
STATE OF PLAY
Many Member States have been undertaking reforms to enhance work-life
balance policies and increase the labour-force participation of women.
To increase the provision of childcare, most Member States have committed to
providing a childcare place for all children, either by establishing a legal
entitlement to these services or by making attendance compulsory for at least the last
pre-primary year (three countries, namely
Italy, Lithuania and Slovakia, have not yet introduced either of these measures).
Nevertheless, in many Member States gaps19 remain between the end (maximum
16 http://ec.europa.eu/justice/gender-equality/files/gender_pay_gap/c_2014_1405_en.pdf 17 Examples include 'girls' days' and 'boys' days' in companies, wider initiatives attracting women into ICT and science, and general
awareness-raising measures such as equal pay days. 18 See the European Vacancy Monitor, which shows that primary school and early childhood
teachers and personal care workers in health services are among the top growth occupations. 19 These gaps can be identified in national
legislation. However, in practice there may not be significant problems with childcare
availability during these 'gap months', even if availability is not guaranteed by law. It is therefore important to analyse the childcare gap together with data on childcare use.

Page 9 |
duration) of adequately paid leave (maternity or parental) and the start of
childcare entitlement or compulsory school
age. Currently only six Member States (Germany, Denmark, Finland, Sweden,
Estonia and Slovenia) do not have such a gap20.
In many Member States, reforms are
currently ongoing to significantly expand childcare. For instance, in April
2014 Malta introduced a free childcare
scheme for children under the age of 3 to incentivise more parents, particularly
mothers, to return or to remain in work. This reform has contributed to a significant
increase in the number of children enrolled in childcare centres21. In 2017 Member
States have also introduced measures to develop services for children in
disadvantaged communities (Hungary)
and for job-seekers' children (France). Austria has announced investments to
increase the number and availability of places in all-day schools, and to improve
the quality of their services22.
Some Member States have launched
reforms to encourage a more equal sharing of family-related leave
entitlements between women and men. In 2016 Luxembourg adopted a
reform of its parental leave system to make it more flexible and better
compensated. In 2017, the Czech Republic and Cyprus both introduced new
entitlements to paternity leave and
Portugal extended the period of leave. In 2016/2017, Belgium, the Czech Republic
and Italy introduced measures to
20 Although in some cases, despite the introduction of legislation to address this,
availability can still be an issue (this is the case for Estonia for children under 3 years of age). 21 According to the national data, between April and December 2014, the number of
children attending childcare increased from 1 800 to 2 917. Peer Review on 'Making work pay for mothers', 18-19 May 2015, Malta. 22 Childcare policies, particularly high quality
early education, have a greater positive impact on children from disadvantaged backgrounds
such as migrants or low-income households, and can in particular improve the school readiness of disadvantaged children. — Cascio (2015), Dustmann et al. (2012).
facilitate more flexibility in the organisation of work.
Some Member States have introduced targeted measures to encourage
women to re-enter the labour market while their child is still very young. For
instance in 2017 Bulgaria adopted a measure to provide some childcare benefit
to mothers with children under 1 year old who return to employment. Similarly, in
Romania such benefits have increased in
2017 (the incentive is granted up to when the child is 3, if the parents start working
at least 60 days before the child turns 2 years old). Other Member States have
developed schemes targeted at women who have already taken lengthy career
breaks. This is the case of the 'Returnships' scheme in the UK, launched
in 2017. Likewise, Luxembourg passed a
law to strengthen the principle of equal pay for women and men, and supported
awareness-raising campaigns and other actions to eliminate barriers to female
employment.
Date: 8.11.2017
Page 10 |
5. REFERENCES
Christiansen, L., Lin, H., Pereira, J., Topalova, P., and R. Turk, 'Individual Choice or
Policies? Drivers of Female Employment in Europe', IMF Working Paper WP/16/49, Washington D.C., 2016.
Cuberes, D., and M. Teignier-Baqué, Aggregate Costs of Gender Gaps in the Labor Market: A Quantitative Estimate, Journal of Human Capital 10(3), 2016.
Eurofound, 'The Gender Employment Gap: Challenges and Solutions', Eurofound, 2016.
European Commission, 'Secondary earners and fiscal policies in Europe', European Commission, 2015.
OECD, 'Closing the Gender Gap', OECD, 2012.
Thévenon, O., 'Drivers of Female Labour Force Participation in the OECD', OECD Social, Employment and Migration Working Papers, No 145, OECD Publishing, 2013.
Vaganay, A., Canónico, E., and, E. Courtin, 'Challenges of work-life balance faced by working families: review of Costs and Benefits', LSE Evidence Review, 2016.
Boll, C., Leppin, J., Rossen, A., and A. Wolf, 'Magnitude and impact factors of the gender pay gap in EU countries', Report prepared for the European Commission,
2016.
Page 11 |
ANNEX
Figure 6 — Employment rate by gender, 55-64 years old, 2016 (% of women and men aged 55-64)
Source: Eurostat, LFS (lfsi_emp_a)
Figure 7 — Inactivity due to looking after children or incapacitated adults or other family
and personal responsibilities, 2008-2016 (women aged 20-64)
Source: Eurostat, LFS, (lfsa_igar)
0
10
20
30
40
50
60
70
80
90M
T EL HR
LU SI RO PL IT BE
AT
HU ES CY SK PT
FR FX
EU2
8 IE CZ
EA1
9
BG NL
UK LV LT FI DK
DE EE SE
% o
f re
spe
ctiv
e p
op
ula
tio
n
Men Women
0
10
20
30
40
50
60
70
80
DK SE SI NL FI PT LT EL BE
LU IT
EA1
9
DE
HU
EU2
8 LV AT
RO
BG
HR SK CZ PL
UK
MT EE ES IE CY
% o
f in
acti
ve w
om
en
2016 2008
Page 12 |
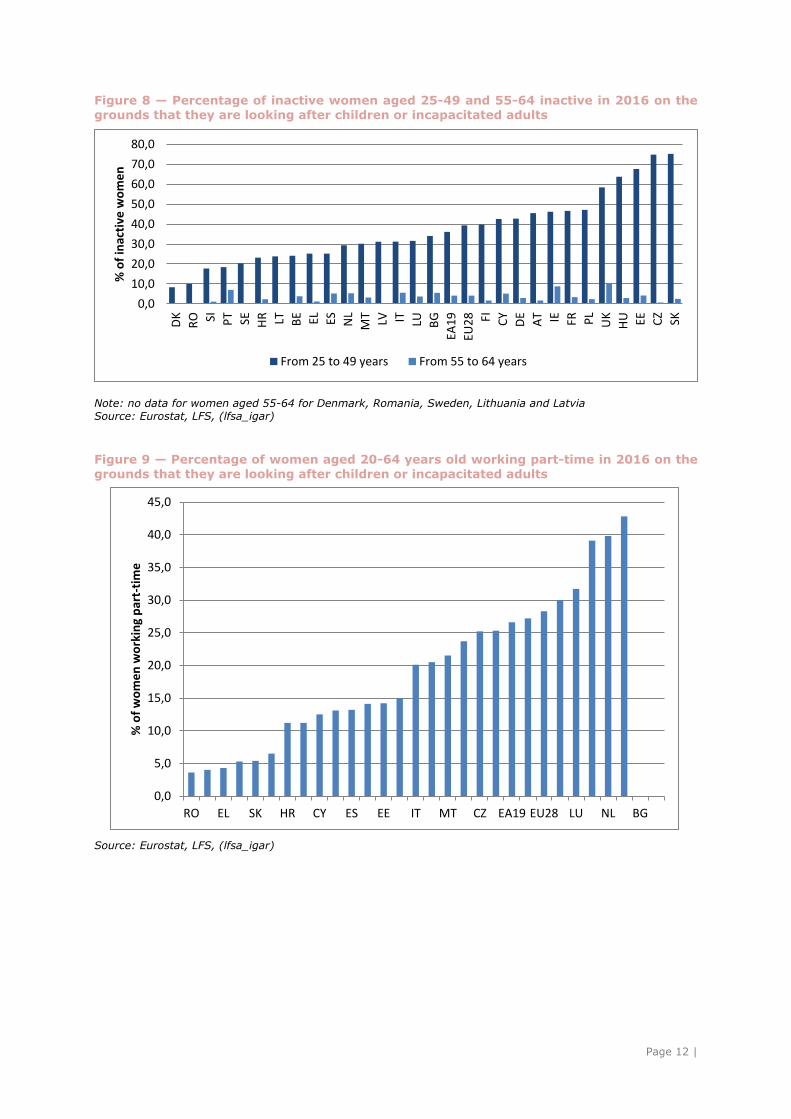
Figure 8 — Percentage of inactive women aged 25-49 and 55-64 inactive in 2016 on the grounds that they are looking after children or incapacitated adults
Note: no data for women aged 55-64 for Denmark, Romania, Sweden, Lithuania and Latvia
Source: Eurostat, LFS, (lfsa_igar)
Figure 9 — Percentage of women aged 20-64 years old working part-time in 2016 on the
grounds that they are looking after children or incapacitated adults
Source: Eurostat, LFS, (lfsa_igar)
0,0
10,0
20,0
30,0
40,0
50,0
60,0
70,0
80,0
DK
RO SI PT SE HR LT BE EL ES NL
MT
LV IT LU BG
EA1
9
EU2
8 FI CY
DE
AT IE FR PL
UK
HU EE CZ
SK
% o
f in
acti
ve w
om
en
From 25 to 49 years From 55 to 64 years
0,0
5,0
10,0
15,0
20,0
25,0
30,0
35,0
40,0
45,0
RO EL SK HR CY ES EE IT MT CZ EA19 EU28 LU NL BG
% o
f w
om
en
wo
rkin
g p
art-
tim
e
Page 13 |
Figure 11 — Components of net childcare costs, 2015
Panel A: Lone mother with low earnings
Panel B: Couple with low earnings
Page 14 |
Panel C: Lone mother with median earnings
Panel D: Couple with median earnings
The low (median) earnings level is the 20th (50th) percentile of the gender-specific full-time earnings distribution. Two
earners are assumed for couples, male and female. In all cases, the family has two children (aged 2 and 3) is using
full-time centre-based childcare. All costs and benefits are shown as a percentage of net family income before
deducting any childcare expenses.
Source: OECD Tax-Benefit Models.
Page 15 |
Table 1 — Employment rate, employment rate in full-time equivalents and average number of usual weekly hours of men and women, 2016
Employment rate
(20-64 years old)
Full-time equivalent
employment rate
(20-64 years old)
Average number of
usual weekly hours for
all employees in the main job
Women Men Women Men Women Men
BE 63.0 72.3 53.3 70.1 32.8 40.3
BG 64.0 71.3 63.0 71.1 39.8 40.5
CZ 68.6 84.6 66.4 84.7 37.1 40.8
DK 74.0 80.7 65.1 76.4 30.8 36.0
DE 74.5 82.8 58.1 79.2 30.4 39.3
EE 72.6 80.8 69.6 79.7 36.5 39.4
IE 64.2 76.5 54.9 73.2 30.8 39.3
EL 46.8 65.8 43.8 63.9 38.0 42.9
ES 58.1 69.6 51.6 68.1 33.9 39.5
FR 66.3 73.8 58.5 70.9 32.9 38.6
HR 56.6 66.2 54.9 65.1 37.5 39.1
IT 51.6 71.7 44.4 69.3 32.2 39.4
CY 64.1 73.9 59.1 69.6 36.2 39.4
LV 71.8 74.7 70.1 74.2 37.5 39.3
LT 74.3 76.2 72.7 75.5 37.2 39.2
LU 65.1 76.1 57.1 74.8 33.6 40.6
HU 64.6 78.6 62.9 78.0 37.8 39.7
MT 55.5 83.1 49.9 82.5 33.9 40.3
NL 71.6 82.6 48.9 76.1 26.0 36.7
AT 70.9 78.7 55.8 75.6 30.5 39.0
PL 62.2 76.4 60.5 76.8 37.7 41.4
PT 67.4 74.2 63.9 72.6 36.4 39.3
RO 57.4 75.0 55.9 73.7 38.0 39.4
SI 66.7 73.3 63.2 72.2 37.0 39.8
SK 62.7 76.9 60.5 75.5 37.4 39.8
FI 71.7 75.0 67.4 72.6 33.5 37.9
SE 79.2 83.0 71.8 80.7 33.1 37.5
UK 72.1 83.1 58.9 79.3 31.0 39.7
EU 65.3 76.8 56.2 74.4 33.0 39.4
EA19 64.3 75.5 54.3 72.7 32.2 39.2
Source: Eurostat, LFS, European Commission
Page 16 |
Table 2 — Gender-specific labour market situation and tax burden on second earners
Inactivity trap (2015) Low wage trap (2015) Employment
rate female (2016)
Trap 67% AW
Contribution of taxation
Trap 33%-67% AW
Contribution of taxation
BE 48.5 48.5 59.9 59.9 63.0
BG 35.7 21.6 50.2 21.6 64.0
CZ 31.1 31.1 27.6 27.6 68.6
DK 45.2 40.1 40.1 40.1 74.0
DE 46.0 46.0 48.0 48.0 74.5
EE 22.9 22.9 22.9 22.9 72.6
IE 28.2 23.7 34.5 34.5 64.2
EL 8.4 26.0 17.8 33.0 46.8
ES 22.5 22.5 21.4 21.4 58.1
FR 31.6 30.6 44.3 38.8 66.3
HR 33.2 25.7 28.1 28.1 56.6
IT 31.0 26.3 40.8 40.2 51.6
LV 35.0 35.0 31.1 31.1 71.8
LT 26.7 20.4 27.0 27.0 74.3
LU 33.9 33.9 42.0 42.0 65.1
HU 34.5 34.5 34.5 34.5 64.6
MT 17.6 17.6 15.9 15.9 55.5
NL 19.7 26.0 35.3 39.1 71.6
AT 31.4 31.4 44.2 44.2 70.9
PL 30.1 29.5 30.3 30.3 62.2
PT 29.7 23.4 42.8 31.2 67.4
RO 36.5 27.7 32.7 32.7 57.4
SI 58.4 31.9 48.1 35.2 66.7
SK 8.7 29.9 -9.9 33.1 62.7
FI 24.0 29.7 36.1 34.3 71.7
SE 22.2 29.8 28.7 35.4 79.2
UK 20.1 20.1 32.0 32.0 72.1
Source: Commission, OECD. AW stands for average wage. Notes: Employment rate for age group 20-64 years.
Inactivity trap for second earner in two-earner couple with two children, principal earner with 100% of average wage,
second earner with 67%; low-wage trap for second earner in two-earner couple with two children, principal earner with
100% of average wage, second earner moving from 33% to 67% of average wage. Contribution of taxation refers to
the contribution to the respective trap in percentage points (other contributors are, e.g. withdrawn benefits, social
assistance and housing benefits). No recent data are available for Cyprus.
Page 17 |
Table 3 — Gender pay gap
2009 2010 2011 2012 2013 2014 2015 Difference
between 2015 and
2009
BE 10.1 10.2 9.4 8.3 7.5 6.6 6.5 -3.6
BG 13.3 13.0 13.2 15.1 14.1 14.2 15.4 2.1
CZ 25.9 21.6 22.6 22.5 22.3 22.5 22.5 -3.4
DK 16.8 15.9 16.4 16.8 16.5 16.0 15.1 -1.7
DE 22.6 22.3 22.4 22.7 22.1 22.3 22 -0.6
EE 26.6 27.7 27.3 29.9 29.8 28.1 26.9 0.3
IE 12.6 13.9 12.7 12.2 12.9 13.9 !
EL 15.0
ES 16.7 16.2 17.6 18.7 17.8 14.9 14.9 -1.8
FR 15.2 15.6 15.7 15.6 15.5 15.5 15.8 0.6
HR : 5.7 3.4 2.9 9.0 10.4
IT 5.5 5.3 5.7 6.5 7.0 6.1 5.5 0.0
CY 17.8 16.8 16.1 15.6 14.9 14.2 14.0 -3.8
LV 13.1 15.5 14.1 14.9 16.0 17.3 17.0 3.9
LT 15.3 14.6 11.5 11.9 12.2 13.3 14.2 -1.1
LU 9.2 8.7 7.9 7.0 6.2 5.4 5.5 -3.7
HU 17.1 17.6 18.0 20.1 18.4 15.1 14.0 -3.1
MT 7.7 7.2 7.7 9.5 9.7 10.6
NL 18.5 17.8 18.6 17.6 16.5 16.1 16.1 -2.4
AT 24.3 24.0 23.5 22.9 22.3 22.2 21.7 -2.6
PL 8.0 4.5 5.5 6.4 7.1 7.7 7.7 -0.3
PT 10.0 12.8 12.9 15.0 13.3 14.9 17.8 7.8
RO 7.4 8.8 9.6 6.9 4.9 4.5 5.8 -1.6
SI -0.9 0.9 3.3 4.5 6.3 7.0 8.1 9.0
SK 21.9 19.6 20.1 20.8 18.8 19.7 19.6 -2.3
FI 20.8 20.3 19.1 19.2 18.8 18.4 17.3 -3.5
SE 15.7 15.4 15.6 15.5 14.6 13.8 14.0 -1.7
UK 20.6 19.5 19.7 21.2 20.5 20.9 20.8 0.2
EU 16.4 16.9 17.3 16.8 16.7
EA19 17.0 17.3 17.6 17.1 16.9
Source: Eurostat; unadjusted; industry, construction and services (except public administration, defence, compulsory
social security). Note: The figures show the difference between men's and women's average gross hourly earnings as
a percentage of men's average gross hourly earnings — for paid employees, unadjusted for personal or job
characteristics.