Embed Size (px)
Citation preview
25 September 2013
Office for National Statistics | 1
Full report - Women in the labour marketCoverage: UKDate: 25 September 2013Geographical Area: UKTheme: Labour Market
Key points
The key points are:
• Rising employment for women and falling employment for men over 40 years• Men have consistently higher employment rates than women above the age of 22• Employment rates for women lowest in Northern Ireland and London• Birmingham has the lowest employment rate among the smaller areas• Men with children more likely to work than those without – opposite picture for women• The employment rate gap between mothers in a couple and lone mothers smaller for those with
older children• Men tend to work in the professional occupations associated with higher levels of pay than
women• Women dominate employment within caring and leisure occupations• The number of women working within managerial roles slightly higher than the EU average• Female graduates more likely to work in a slightly lower skilled occupation group than men • Men make up the majority of workers in the top 10% of earners for all employees but the gap is
lower for those under 30
Women in the labour market
Rising employment for women and falling employment for men over 40 years
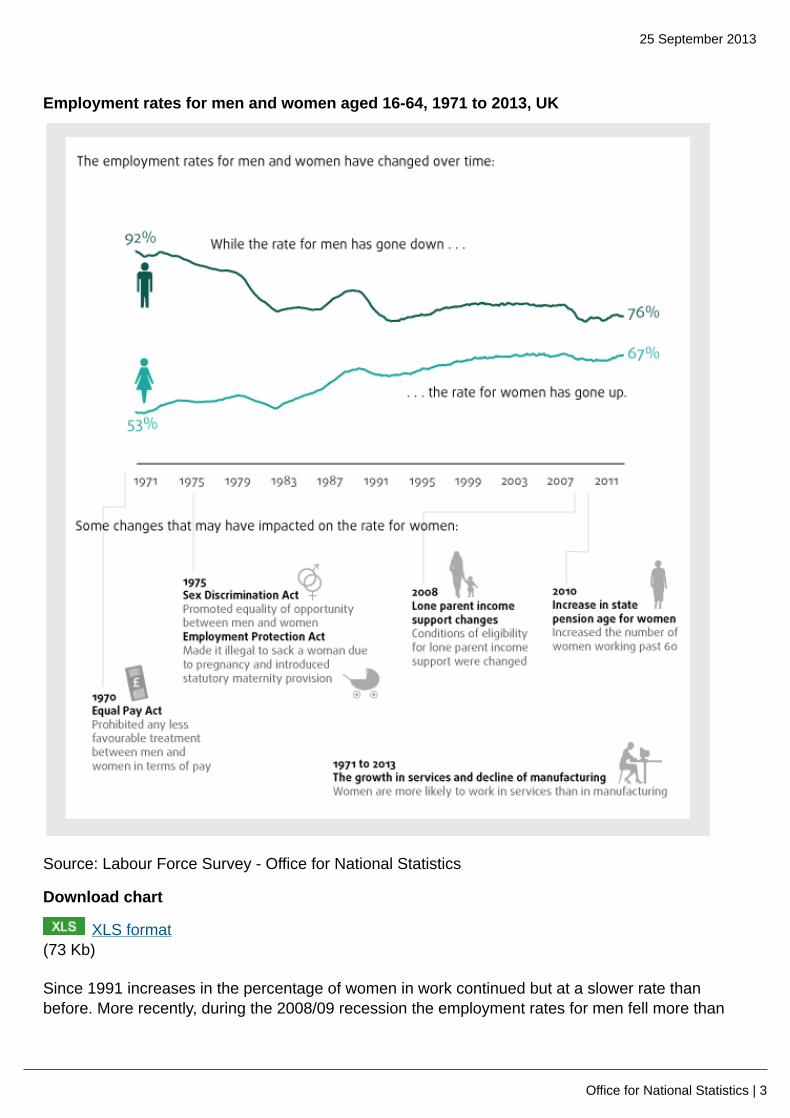
Over the past 40 years there has been a rise in the percentage of women aged 16 to 64 inemployment and a fall in the percentage of men. In April to June 2013 around 67% of women aged16 to 64 were in work, an increase from 53% in 1971. For men the percentage fell to 76% in 2013from 92% in 1971.
In April to June 2013, looking at the not seasonally adjusted series, around 13.4 million women aged16 to 64 were in work (42% part-time) and 15.3 million men (12% part-time). For those who workedfull-time there were differences in the average hours worked per week. For example, full-time menworked on average 44 hours per week whilst full-time women worked 40 hours per week. Whilethere have been increases in the number of women in work, the percentage of them doing a part-time role has fluctuated between 42-45% over the past 30 years.
25 September 2013
Office for National Statistics | 2
Most of the shift in more women and fewer men working happened between 1971 and 1991. Severalfactors may account for this. One possible factor is the rise of the service sector and decline of themanufacturing sector beginning in the 1960s. Traditionally a higher proportion of women than menhave worked in services, with a higher proportion of men working in manufacturing. The growingdemand to employ people within the service sector and falling demand within the manufacturingsector may have resulted in more women and fewer men working. Over the period the fall in menworking has seen an increase in the number who are inactive. This could be for many reasons, forexample between 1971 and 1991 when most of the fall in men in work occurred, many could havetaken earlier retirement, left work for health reasons or started sharing childcare responsibilities.Since 1993 there have been increases in young men who are inactive due to study.
Since the 1970s there have been several pieces of new legislation that may have impacted on theemployment rate for women:
• 1970 Equal Pay Act – this prohibited any less favourable treatment between men and women interms of pay
• 1975 Sex Discrimination Act – promoted equality and opportunity between men and women• 1975 Employment Protection Act – made it illegal to sack a woman due to pregnancy and
introduced statutory maternity provision• 2008 Lone parent income support changes – conditions of eligibility for lone parent income
support were changed• 2010 increase in State Pension Age for women - women now retiring later than previously
25 September 2013
Office for National Statistics | 3
Employment rates for men and women aged 16-64, 1971 to 2013, UK
Source: Labour Force Survey - Office for National Statistics
Download chart
XLS format(73 Kb)
Since 1991 increases in the percentage of women in work continued but at a slower rate thanbefore. More recently, during the 2008/09 recession the employment rates for men fell more than
25 September 2013
Office for National Statistics | 4
for women and have since levelled off in the last four years with men’s employment rates remainingbetween 75% and 77% and women’s at 65% to 67%.
The rise in women in employment is partly due to an increase in the percentage of mothers in work.In 1996 (when comparable records began), 67% of married or cohabiting mothers with dependentchildren were in work and by 2013 this had increased to 72%. There has also been an increase inthe lone mother’s employment rate from 43% to 60% over the same period. As more women haveentered employment there has been a fall in those inactive, which are those who are either notlooking for work or not available to work, for example looking after the family. The percentage ofwomen who were inactive gradually fell over the past 40 years to a low of 28% of women aged 16 to64 in 2013.
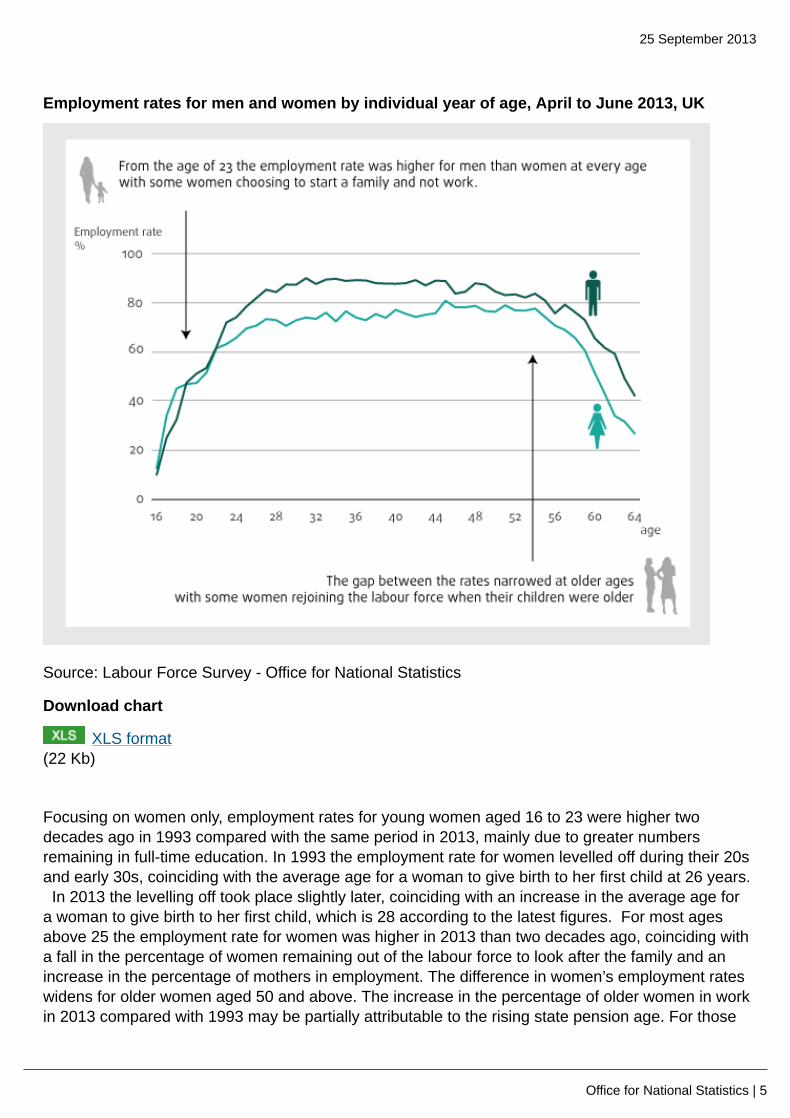
Men have consistently higher employment rates than women above the age of 22
In 2013, up until the age of 22 the percentage of men and women in work was similar, above thisage men consistently had a higher employment rate than women with some women choosingto start a family and not work. The gap between the two rates narrowed at older ages with somewomen rejoining the labour force when their children are older. At some of the oldest age groups thegap widens as women approach and pass their state pension age and retire while men have to waituntil 65 for the state pension age.
25 September 2013
Office for National Statistics | 5
Employment rates for men and women by individual year of age, April to June 2013, UK
Source: Labour Force Survey - Office for National Statistics
Download chart
XLS format(22 Kb)
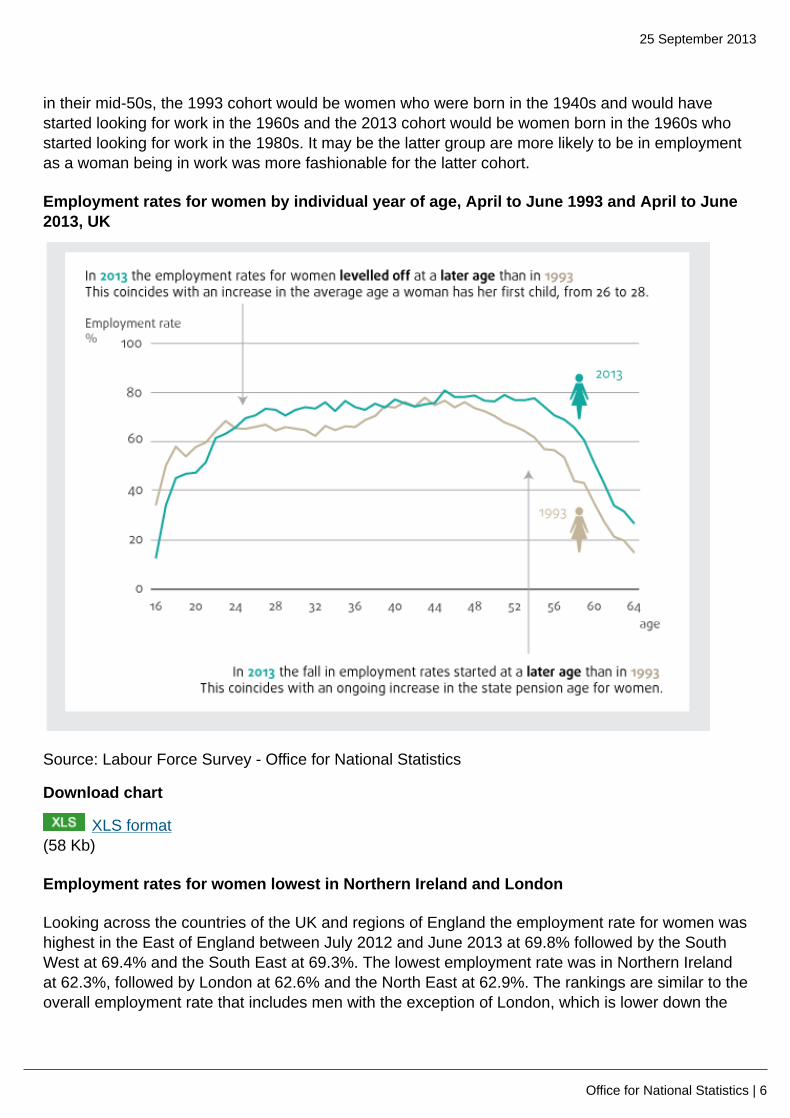
Focusing on women only, employment rates for young women aged 16 to 23 were higher twodecades ago in 1993 compared with the same period in 2013, mainly due to greater numbersremaining in full-time education. In 1993 the employment rate for women levelled off during their 20sand early 30s, coinciding with the average age for a woman to give birth to her first child at 26 years. In 2013 the levelling off took place slightly later, coinciding with an increase in the average age fora woman to give birth to her first child, which is 28 according to the latest figures. For most agesabove 25 the employment rate for women was higher in 2013 than two decades ago, coinciding witha fall in the percentage of women remaining out of the labour force to look after the family and anincrease in the percentage of mothers in employment. The difference in women’s employment rateswidens for older women aged 50 and above. The increase in the percentage of older women in workin 2013 compared with 1993 may be partially attributable to the rising state pension age. For those
25 September 2013
Office for National Statistics | 6
in their mid-50s, the 1993 cohort would be women who were born in the 1940s and would havestarted looking for work in the 1960s and the 2013 cohort would be women born in the 1960s whostarted looking for work in the 1980s. It may be the latter group are more likely to be in employmentas a woman being in work was more fashionable for the latter cohort.
Employment rates for women by individual year of age, April to June 1993 and April to June2013, UK
Source: Labour Force Survey - Office for National Statistics
Download chart
XLS format(58 Kb)
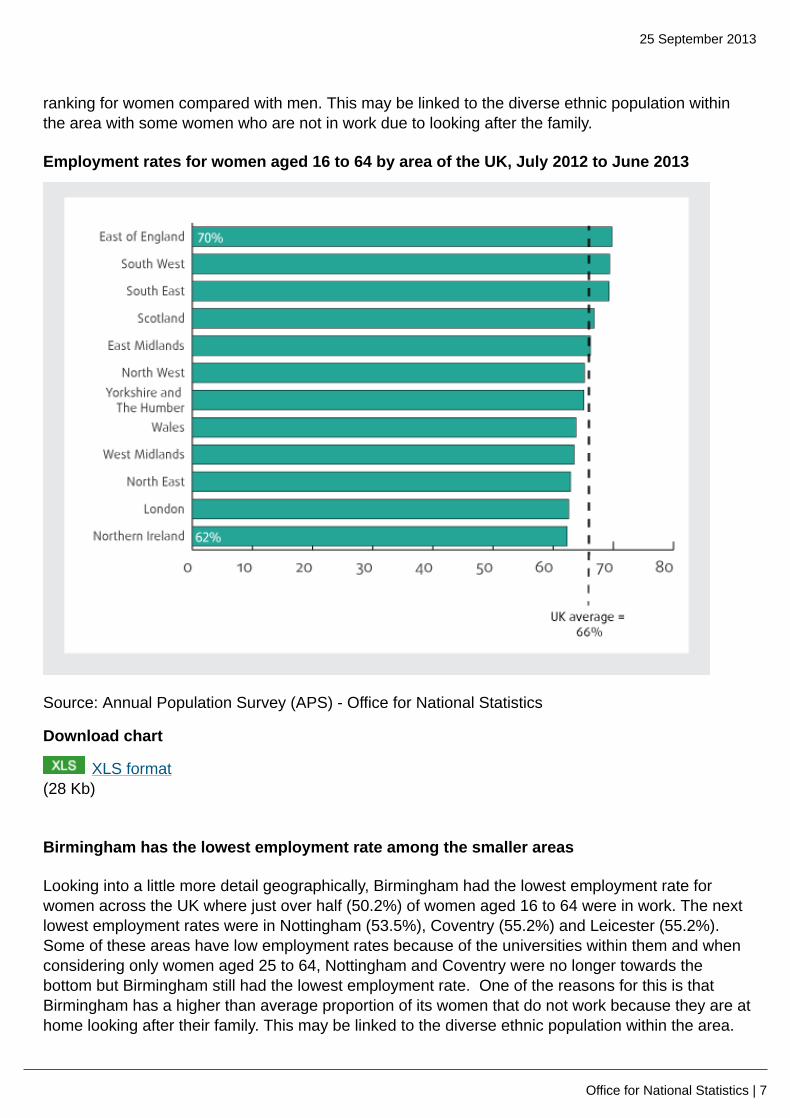
Employment rates for women lowest in Northern Ireland and London
Looking across the countries of the UK and regions of England the employment rate for women washighest in the East of England between July 2012 and June 2013 at 69.8% followed by the SouthWest at 69.4% and the South East at 69.3%. The lowest employment rate was in Northern Irelandat 62.3%, followed by London at 62.6% and the North East at 62.9%. The rankings are similar to theoverall employment rate that includes men with the exception of London, which is lower down the
25 September 2013
Office for National Statistics | 7
ranking for women compared with men. This may be linked to the diverse ethnic population withinthe area with some women who are not in work due to looking after the family.
Employment rates for women aged 16 to 64 by area of the UK, July 2012 to June 2013
Source: Annual Population Survey (APS) - Office for National Statistics
Download chart
XLS format(28 Kb)
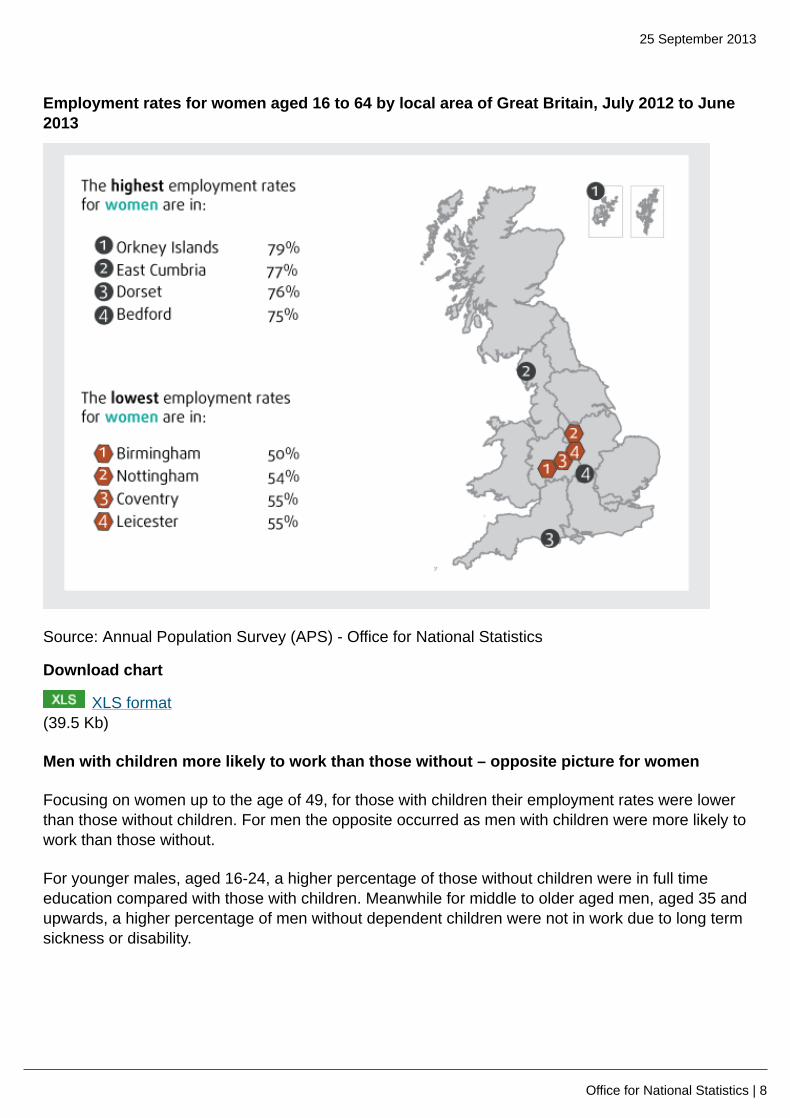
Birmingham has the lowest employment rate among the smaller areas
Looking into a little more detail geographically, Birmingham had the lowest employment rate forwomen across the UK where just over half (50.2%) of women aged 16 to 64 were in work. The nextlowest employment rates were in Nottingham (53.5%), Coventry (55.2%) and Leicester (55.2%).Some of these areas have low employment rates because of the universities within them and whenconsidering only women aged 25 to 64, Nottingham and Coventry were no longer towards thebottom but Birmingham still had the lowest employment rate. One of the reasons for this is thatBirmingham has a higher than average proportion of its women that do not work because they are athome looking after their family. This may be linked to the diverse ethnic population within the area.
25 September 2013
Office for National Statistics | 8
Employment rates for women aged 16 to 64 by local area of Great Britain, July 2012 to June2013
Source: Annual Population Survey (APS) - Office for National Statistics
Download chart
XLS format(39.5 Kb)
Men with children more likely to work than those without – opposite picture for women
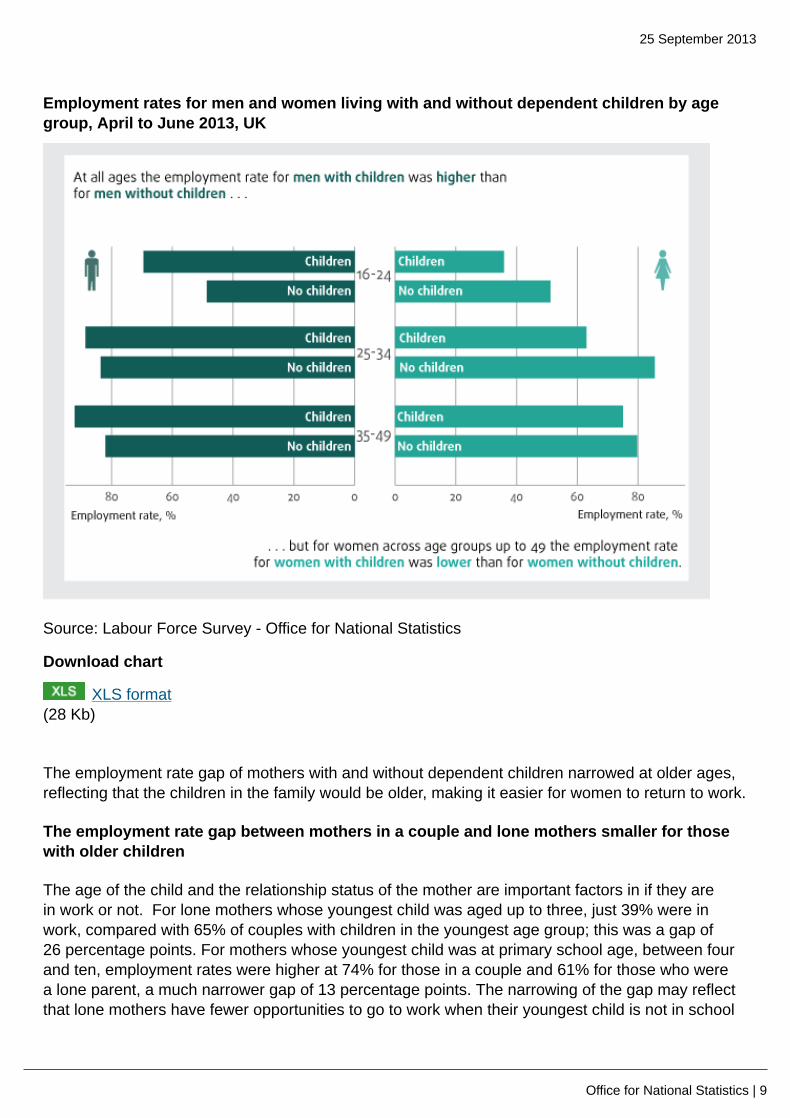
Focusing on women up to the age of 49, for those with children their employment rates were lowerthan those without children. For men the opposite occurred as men with children were more likely towork than those without.
For younger males, aged 16-24, a higher percentage of those without children were in full timeeducation compared with those with children. Meanwhile for middle to older aged men, aged 35 andupwards, a higher percentage of men without dependent children were not in work due to long termsickness or disability.
25 September 2013
Office for National Statistics | 9
Employment rates for men and women living with and without dependent children by agegroup, April to June 2013, UK
Source: Labour Force Survey - Office for National Statistics
Download chart
XLS format(28 Kb)
The employment rate gap of mothers with and without dependent children narrowed at older ages,reflecting that the children in the family would be older, making it easier for women to return to work.
The employment rate gap between mothers in a couple and lone mothers smaller for thosewith older children
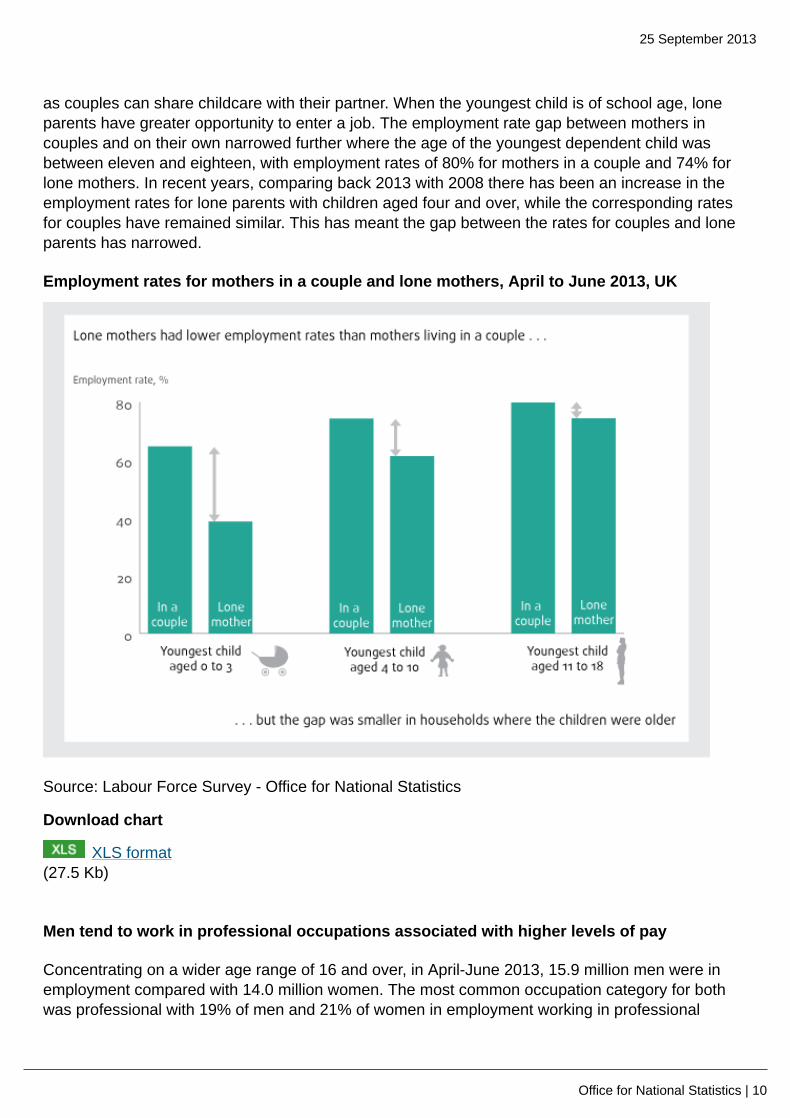
The age of the child and the relationship status of the mother are important factors in if they arein work or not. For lone mothers whose youngest child was aged up to three, just 39% were inwork, compared with 65% of couples with children in the youngest age group; this was a gap of26 percentage points. For mothers whose youngest child was at primary school age, between fourand ten, employment rates were higher at 74% for those in a couple and 61% for those who werea lone parent, a much narrower gap of 13 percentage points. The narrowing of the gap may reflectthat lone mothers have fewer opportunities to go to work when their youngest child is not in school
25 September 2013
Office for National Statistics | 10
as couples can share childcare with their partner. When the youngest child is of school age, loneparents have greater opportunity to enter a job. The employment rate gap between mothers incouples and on their own narrowed further where the age of the youngest dependent child wasbetween eleven and eighteen, with employment rates of 80% for mothers in a couple and 74% forlone mothers. In recent years, comparing back 2013 with 2008 there has been an increase in theemployment rates for lone parents with children aged four and over, while the corresponding ratesfor couples have remained similar. This has meant the gap between the rates for couples and loneparents has narrowed.
Employment rates for mothers in a couple and lone mothers, April to June 2013, UK
Source: Labour Force Survey - Office for National Statistics
Download chart
XLS format(27.5 Kb)
Men tend to work in professional occupations associated with higher levels of pay
Concentrating on a wider age range of 16 and over, in April-June 2013, 15.9 million men were inemployment compared with 14.0 million women. The most common occupation category for bothwas professional with 19% of men and 21% of women in employment working in professional
25 September 2013
Office for National Statistics | 11
occupations. Within this professional occupation category workers were spread over a wide varietyof jobs but with differences for men and women. For example, the most common occupation forwomen was nursing while the most common for men was programmers and software developmentprofessionals. Men tended to work in professional occupations associated with higher levels ofpay. For example programmers and software development professionals earned £20.02 per hour(excluding overtime) while nurses earned on average £16.61 according to the 2012 Annual Surveyof Hours and Earnings.
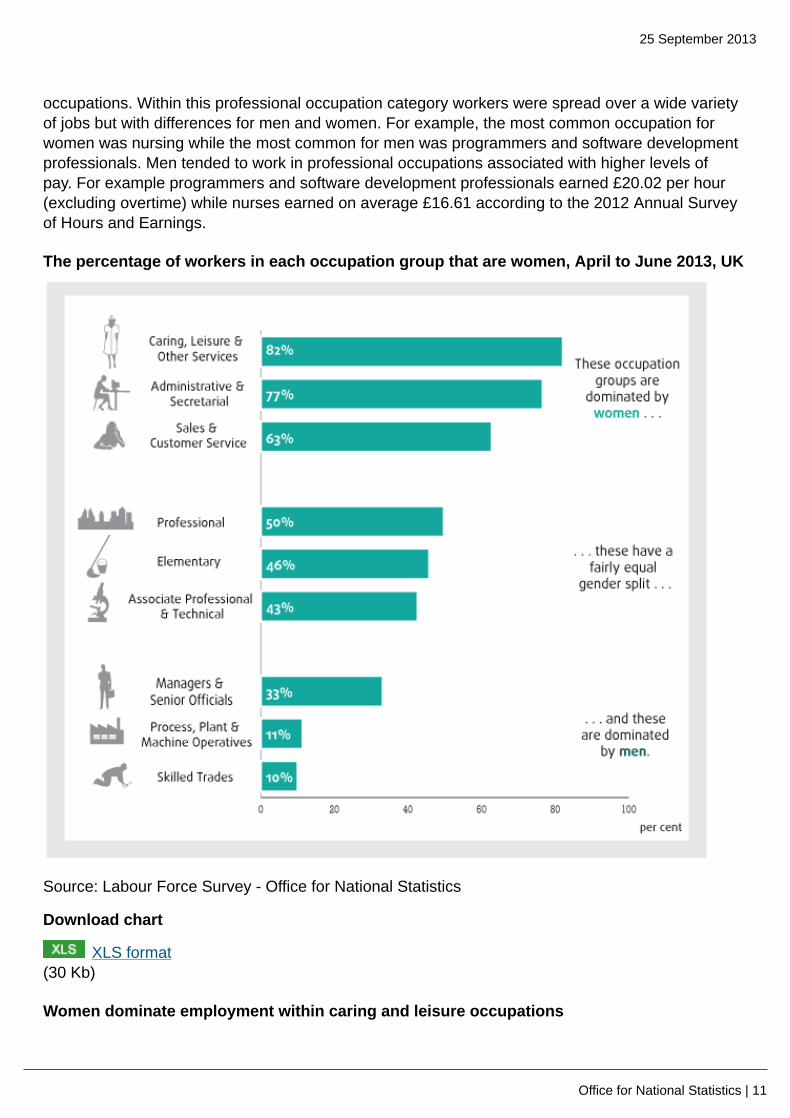
The percentage of workers in each occupation group that are women, April to June 2013, UK
Source: Labour Force Survey - Office for National Statistics
Download chart
XLS format(30 Kb)
Women dominate employment within caring and leisure occupations
25 September 2013
Office for National Statistics | 12
Looking within each of the occupational groups women dominate employment within occupationswithin caring and leisure, accounting for 82% of those within these occupation types. The next mostcommon occupations that women dominated were admin and secretarial roles and sales/customerservice occupations. At the other end of the scale, women were in the minority within skilled tradeoccupations, accounting for just 10%, followed by roles within manufacturing such as process, plantand machine operatives.
The number of women working within managerial roles slightly higher than the EU average
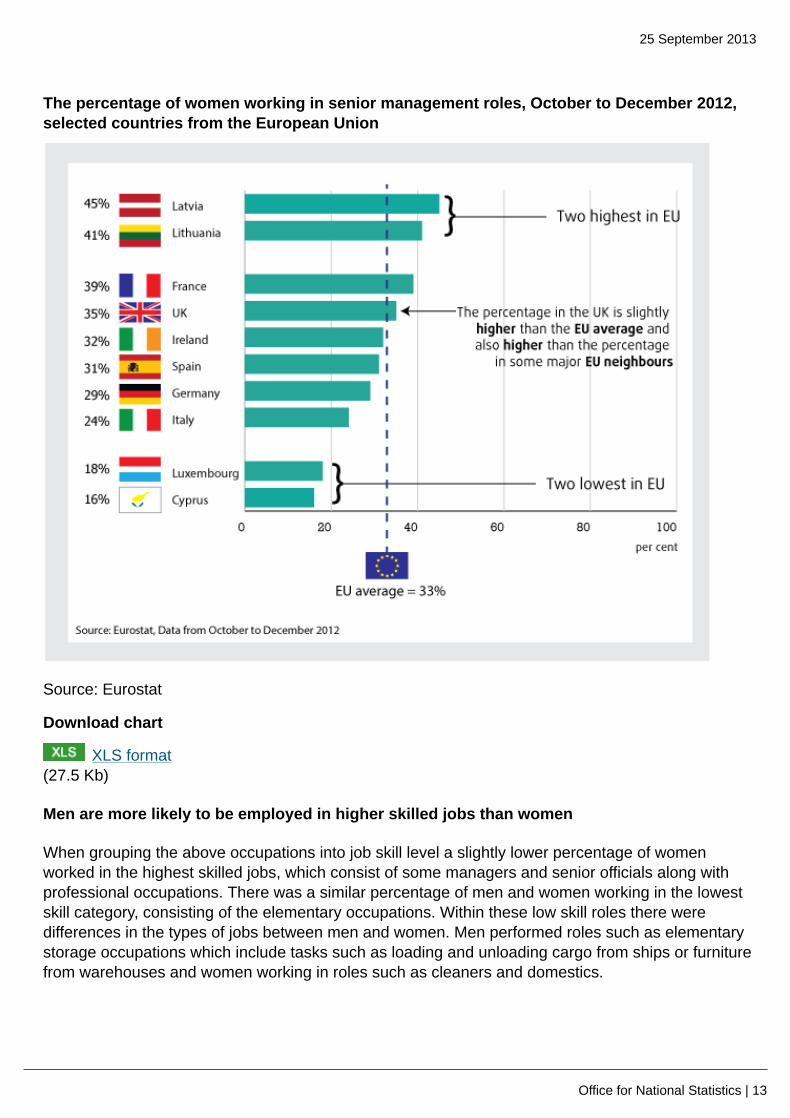
Focusing on occupations within the highest paid category of managers, directors and senior officials,within this latter category around a third (33%) was female in April to June 2013. Looking across theEuropean Union and using information from Eurostat and the International Standard Classificationof Occupations for the final quarter of 2012, around 34.8% of women were working as managers,slightly higher than the European Union average of 33.5%. The percentage of managers that werewomen was slightly lower than the UK figure in the larger economies of Spain (31%), Germany(29%), and Italy (24%) but it was greater in France (39%). Across the European Union as a whole,women were most prominent within the managerial occupation group in Latvia (45%) and Lithuania(41%). The country where women were least prominent as managers was Cyprus (16%).
25 September 2013
Office for National Statistics | 13
The percentage of women working in senior management roles, October to December 2012,selected countries from the European Union
Source: Eurostat
Download chart
XLS format(27.5 Kb)
Men are more likely to be employed in higher skilled jobs than women
When grouping the above occupations into job skill level a slightly lower percentage of womenworked in the highest skilled jobs, which consist of some managers and senior officials along withprofessional occupations. There was a similar percentage of men and women working in the lowestskill category, consisting of the elementary occupations. Within these low skill roles there weredifferences in the types of jobs between men and women. Men performed roles such as elementarystorage occupations which include tasks such as loading and unloading cargo from ships or furniturefrom warehouses and women working in roles such as cleaners and domestics.
25 September 2013
Office for National Statistics | 14
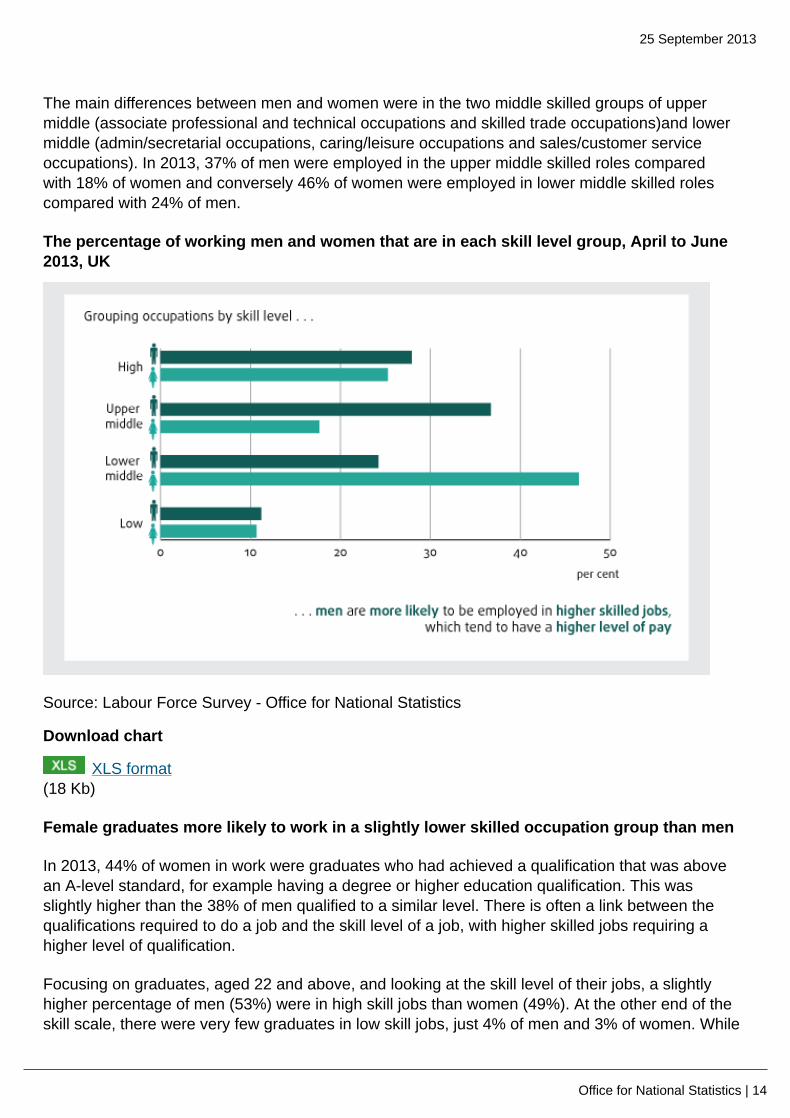
The main differences between men and women were in the two middle skilled groups of uppermiddle (associate professional and technical occupations and skilled trade occupations)and lowermiddle (admin/secretarial occupations, caring/leisure occupations and sales/customer serviceoccupations). In 2013, 37% of men were employed in the upper middle skilled roles comparedwith 18% of women and conversely 46% of women were employed in lower middle skilled rolescompared with 24% of men.
The percentage of working men and women that are in each skill level group, April to June2013, UK
Source: Labour Force Survey - Office for National Statistics
Download chart
XLS format(18 Kb)
Female graduates more likely to work in a slightly lower skilled occupation group than men
In 2013, 44% of women in work were graduates who had achieved a qualification that was abovean A-level standard, for example having a degree or higher education qualification. This wasslightly higher than the 38% of men qualified to a similar level. There is often a link between thequalifications required to do a job and the skill level of a job, with higher skilled jobs requiring ahigher level of qualification.
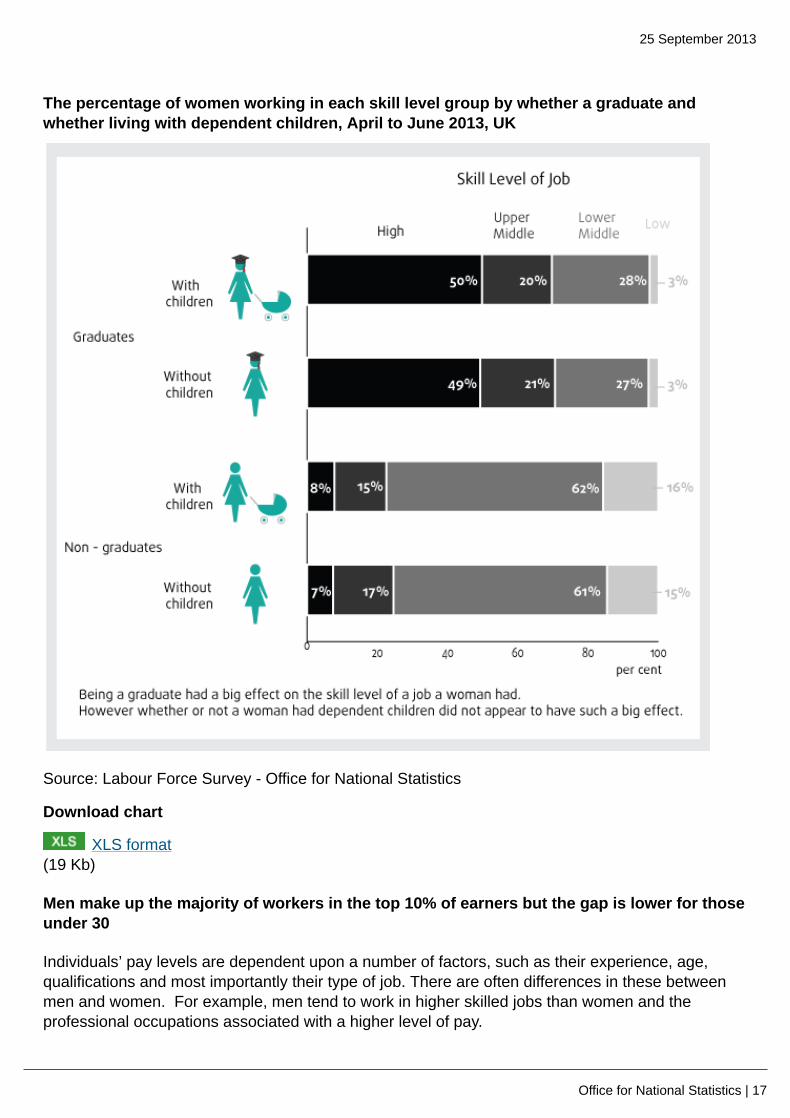
Focusing on graduates, aged 22 and above, and looking at the skill level of their jobs, a slightlyhigher percentage of men (53%) were in high skill jobs than women (49%). At the other end of theskill scale, there were very few graduates in low skill jobs, just 4% of men and 3% of women. While
25 September 2013
Office for National Statistics | 15
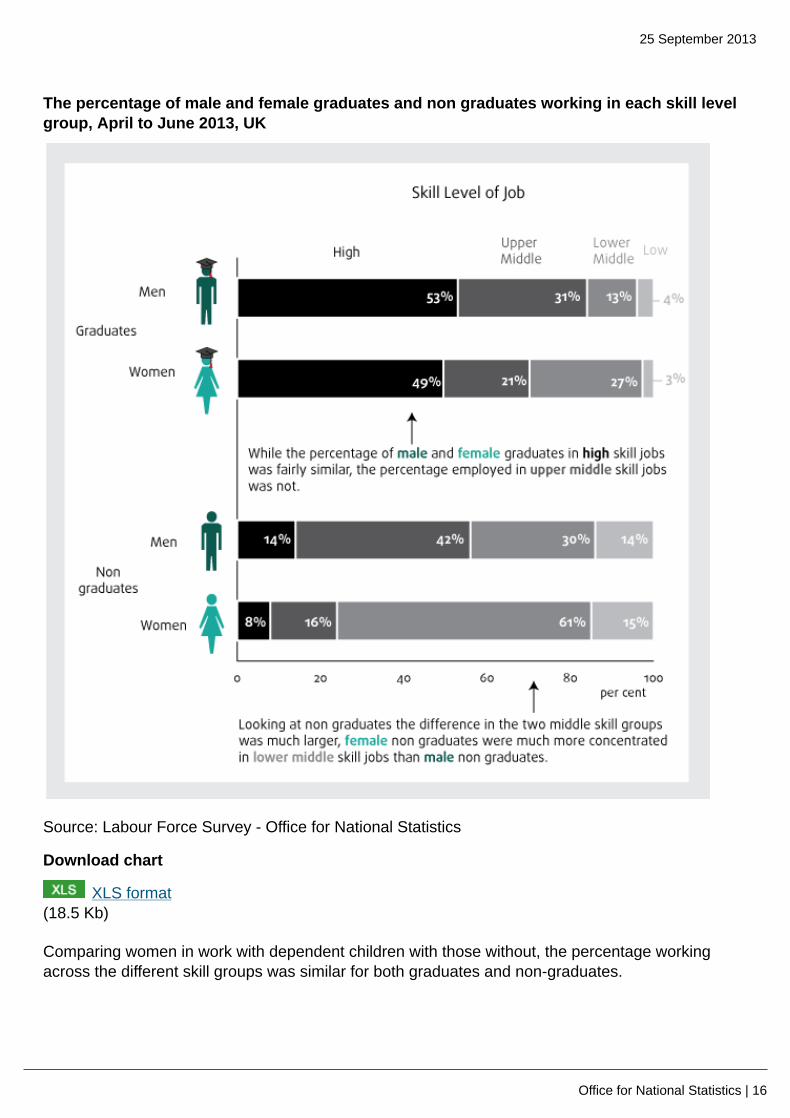
31% of men were employed in the second highest skill category of upper middle, 21% of womenwere employed in this category. As for everyone as a whole, including non-graduates, the maindifferences between men and women graduates were in the two middle job skill level groups ofupper middle and lower middle.
Consequently a higher percentage of female graduates (27%) compared with males (13%) workedin lower middle skill jobs with teaching assistants, care workers and home carers and administrativeroles forming the top three jobs for women working in this skill level. More women than men wereemployed in lower middle skilled jobs despite employed female graduates tending to achieve justas strong degree results, with every three in five of those females (62%) with a degree or equivalentattaining a first or upper second class compared with 56% of men.
For non-graduates the difference in the two middle skill groups for men and women was muchlarger, with around 42% of male non-graduates employed in the upper middle group comparedwith 16% of women. Meanwhile 30% of men and the majority of female non-graduates, 61%, wereemployed in lower middle skilled jobs such as sales and retail assistants and care workers/homecarers. There were a similar percentage of men and women in the lowest skill group but more non-graduate men (14%) were employed in the highest skill group than women (8%).
25 September 2013
Office for National Statistics | 16
The percentage of male and female graduates and non graduates working in each skill levelgroup, April to June 2013, UK
Source: Labour Force Survey - Office for National Statistics
Download chart
XLS format(18.5 Kb)
Comparing women in work with dependent children with those without, the percentage workingacross the different skill groups was similar for both graduates and non-graduates.
25 September 2013
Office for National Statistics | 17
The percentage of women working in each skill level group by whether a graduate andwhether living with dependent children, April to June 2013, UK
Source: Labour Force Survey - Office for National Statistics
Download chart
XLS format(19 Kb)
Men make up the majority of workers in the top 10% of earners but the gap is lower for thoseunder 30
Individuals’ pay levels are dependent upon a number of factors, such as their experience, age,qualifications and most importantly their type of job. There are often differences in these betweenmen and women. For example, men tend to work in higher skilled jobs than women and theprofessional occupations associated with a higher level of pay.
25 September 2013
Office for National Statistics | 18
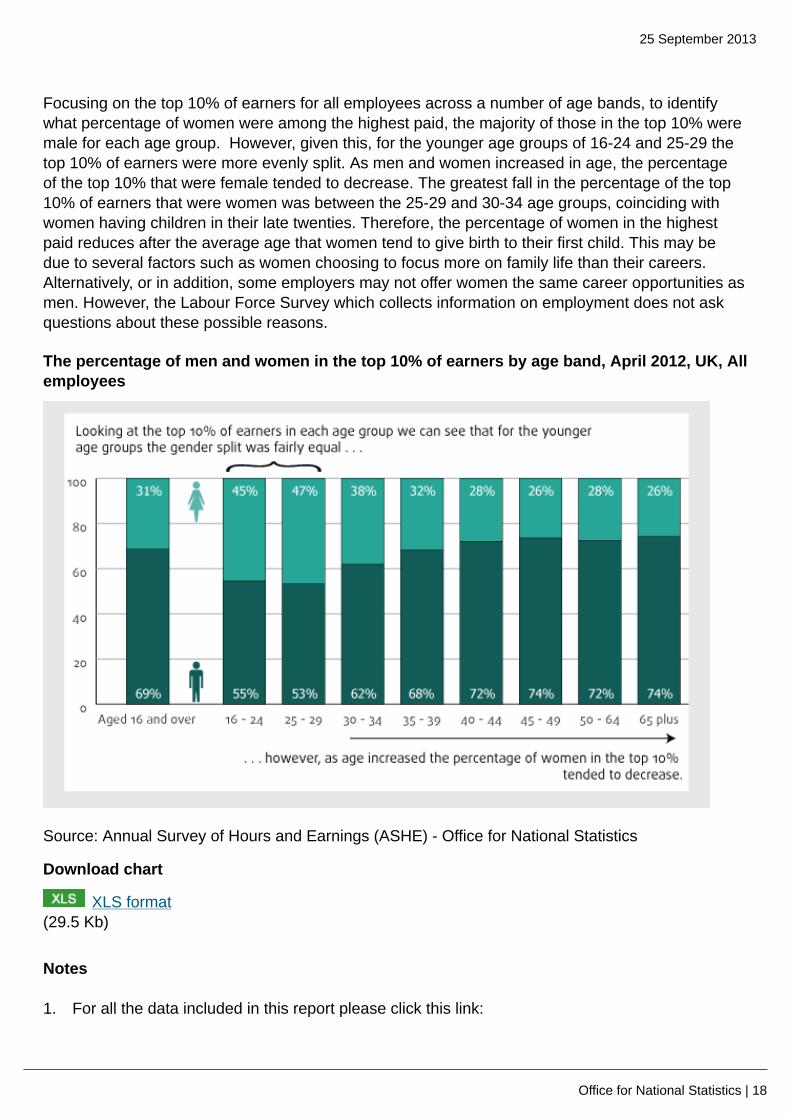
Focusing on the top 10% of earners for all employees across a number of age bands, to identifywhat percentage of women were among the highest paid, the majority of those in the top 10% weremale for each age group. However, given this, for the younger age groups of 16-24 and 25-29 thetop 10% of earners were more evenly split. As men and women increased in age, the percentageof the top 10% that were female tended to decrease. The greatest fall in the percentage of the top10% of earners that were women was between the 25-29 and 30-34 age groups, coinciding withwomen having children in their late twenties. Therefore, the percentage of women in the highestpaid reduces after the average age that women tend to give birth to their first child. This may bedue to several factors such as women choosing to focus more on family life than their careers. Alternatively, or in addition, some employers may not offer women the same career opportunities asmen. However, the Labour Force Survey which collects information on employment does not askquestions about these possible reasons.
The percentage of men and women in the top 10% of earners by age band, April 2012, UK, Allemployees
Source: Annual Survey of Hours and Earnings (ASHE) - Office for National Statistics
Download chart
XLS format(29.5 Kb)
Notes
1. For all the data included in this report please click this link:
25 September 2013
Office for National Statistics | 19
All data used in the "Women in the Labour Market 2013" report (196.5 Kb Excel sheet)
Background notes
1. Datasets
The charts and all related figures from the Annual Population Survey (APS) and the LabourForce Survey from charts 1-3 use person datasets. The charts and all related figures from theremaining Labour Force Survey charts use the household datasets as most of the analysis hascomparisons with and without children.
2. Seasonal adjustment
Most of the data in this report is not seasonally adjusted so may differ slightly to the headlinefigures published monthly. The exception is the first paragraph and chart that uses the headlineseasonally adjusted figures from 1971 onwards.
3. Concepts and definitions
• The employment rate is the number in employment aged 16 to 64 as a percentage of allthose aged 16-64
• The employment rate for each age is the number in employment as a percentage of all thatage.
• The full-time/part-time split is not available for some workers, these have been excluded fromthe total.
• Hours worked refers to the average total usual hours worked in main job, including overtime.This is unavailable for some workers.
• The mean age of mother at childbirth is standardised. This measure eliminates the impact ofany changes in the distribution of the population by age and therefore enables trends overtime to be analysed.
• Standardised mean ages for 2011 have been calculated using mid-year population estimatesbased on the 2011 Census.
• Dependent children are children aged under 16 and those aged 16 to 18 who have nevermarried and are in full-time education.
• Mother/father includes biological mothers/fathers, step-mothers/fathers and adoptivemothers/fathers with dependent children that live in the same household as them. Fostermothers/fathers, women/men with non-dependent children and those whose children live in aseparate household are not included.
• Women on maternity leave and on a career break are defined as in employment.• Rankings for local areas are based on Nomenclature of Units for Territorial Statistics Level 3
areas (NUTS3).• Occupation group is based on the Standard Occupation Classification (SOC) 2010 major
groups. The occupation group is not available for some workers, these have been excludedfrom the total.
• The skill level groups are created by grouping jobs together based on their occupationaccording to the Standard Occupation Classification (SOC) 2010 lower level groups.
25 September 2013
Office for National Statistics | 20
• A graduate is defined as an individual who has completed the first stage of tertiary education.Those who have achieved a qualification that is above an A-level or equivalent.
• Hourly pay includes employees aged 16 and over on adult rates whose pay for the payperiod was not affected by absence and excludes overtime.
• The 90th percentile is the point at which, if workers were ordered by increasing pay, 10% ofworkers will earn at or above this.
4. Details of the policy governing the release of new data are available by visitingwww.statisticsauthority.gov.uk/assessment/code-of-practice/index.html or from the MediaRelations Office email: [email protected]
These National Statistics are produced to high professional standards and released according tothe arrangements approved by the UK Statistics Authority.
Copyright
© Crown copyright 2013
You may use or re-use this information (not including logos) free of charge in any formator medium, under the terms of the Open Government Licence. To view this licence, visitwww.nationalarchives.gov.uk/doc/open-government-licence/ or write to the Information Policy Team,The National Archives, Kew, London TW9 4DU, or email: [email protected].
This document is also available on our website at www.ons.gov.uk.