Embed Size (px)
Citation preview
WOMEN IN THE COLOMBIAN LAND RESTITUTION AND
TITING PROCESS – A RDS HOUSEHOLD SURVEY OF IDPS
HENRIK WIIG Department of International Studies,
Norwegian Institute of Urban and Regional Research, Norway
JEMIMA GARCÍA-GODOS Department of Sociology and Human Geography
University of Oslo, Norway
Paper prepared for presentation at the “2015 WORLD BANK CONFERENCE ON LAND AND POVERTY ”
The World Bank - Washington DC, March 23-27, 2015 Copyright 2015 by author(s). All rights reserved. Readers may make verbatim copies of this document for non-commercial purposes by any means, provided that this copyright notice appears on all such copies.
Abstract
The Victims’ Law from 2011 in Colombia initiated a land restitution process that potentially would benefit more than 5 million Internally Displaced Persons (IDPs) that lost an estimated 7-8 million hectares of land when they fled their homes in the countryside due to the conflict. The government helps them to reclaim the same piece of land and give support to return. Women are supposed to receive preferential and differentiated treatment in the process and the land is furthermore jointly titled as a gender equality measure. However, the process is slow and even less people is willing to actually return from their current place of residence shows our RDS household survey sample of 499 IDP households. Fear of repeated displacement, psychological trauma related to the place of origin especially among women and loss of agricultural knowledge influences their willingness to return. Both Survey and key informant interviews shows that gender perspective is reasonably successful but women have less intention than men to claim land restitution, return and make use of the land.
Key Words:
Colombia, Conflict, Land Restitution, Land Titling, Gender Equality

Introduction
Colombian Law 1448 of 2011, known as the Victims’ Law, addresses the issue of internal displacement and land
dispossession caused by the armed conflict in the Colombia. More than 5 million Internally Displaced Persons
(IDPs) has lost an estimated 7-8 million hectares of agricultural land that fled their homes in the countryside due to
the conflict (CODHES 2010). The purpose of the law is to restitute exactly the same land parcel to any family that
left the land after 1991 and facilitate their return by giving protection, rebuild infrastructure and securing future
property rights through a land titling process. The overall objective of the law is twofold: (i) to help poor IDPs to a
better life by giving them the means to sustain themselves and (ii) to break the vicious circle that land grabbers in
time of conflict will actually keep their loot when peace return, something that might spark and fuel future conflict
in the country (García-Godos and Wiig, 2014).
Women are poorly linked to the land in Colombia. Agriculture is mainly a male activity and the land hence
perceived as the property of men. The conflict furthermore destroyed many families. The men were killed leaving
the widows as household heads or the stress of the displacement caused marriage breakups. The Colombian
government hence wanted to secure gender equality in the land restitution process in two ways. Preferential and
differential treatment implies that the land restitution institutions will give more and first support women in the
application, administrative and legal parts of the process, for example do many women not know the exact
geographic position or borders of the abandoned parcels. The Victims’ Law also sets the principle of Joint titling.
The couple at the time of abandonment will be share the property right to the land independent of current household
formation and the way land was originally acquired. This measure implies an active redistribution from men to
women since most land is male property, for example through male preference in inheritance, and contradicts the
partial community property marriage regime that secures individual to land brought into the marriage. The policy
hence follows the example of Peru where joint titling has empowered women (Wiig, 2013)
This presentation is based on a joint Colombian and Norwegian collaborative research project using both qualitative
and quantitative methods1. I will first present the experience on gender issued as reported by land restitution related
institutions and actors so far. Even though the process is slow and thorough, as most legal processes in Colombia,
and the restitution courts has so far only issued processed claims for 20.877 hectares of land, is it possible identify
the process for women (García-Godos and Wiig, 2014). The URT is reasonably successful in convincing women to
claim their rights, but preferential treatment has turned out to be difficult in the administrative and legal phases as
the unit works by subunit. Surprisingly, joint titling seems to be accepted by men. However, this might be due to the 1 See Project homepages www.colombialandgender.org, financed by The Norwegian Ministry of Foreign Affairs. Main partners are Professor Francisco Gutierrez, National University, and assistant professor Paola Garcia Reyes, University of the North, in the Land Observatory Project financed by Colciencias, see homepages http://transformacionesagrariasypaz.com/. I furthermore thank Daniel Contreras, Camilo Argoty, the survey collection team organised by my partners, and Jose Manuel Arencibia Aleman for excellent research assistance at NIBR.

high number of former land reform farms where the land was initially given by the government to both spouses. The
resistance might increase when areas of longer history of individual ownership, and hence male inheritance, are
included in process.
We also conducted a Respondent Driven Sample (RDS) survey in 2014 of 499 IDP households currently living in
the Bogota and Barranquilla area, 259 in the former and 240 in the latter. Only households with land in
municipalities where the restitution process had started were included. Each of the initial IDP respondents supplied
up to 5 new IDP household from their network. By reaching until 7 subsequent rounds in this snowball sampling
method, the data set is hence representative for all IDPs within respectively Bogota and Barranquilla. We ask about
the household history, their expectations and experience with the land restitution process and preferences for the
future. The overall result verifies the impression of the quantitative research. Especially female IDP respondents are
reluctant to return to their original places of residence; only 19% has any plans to return compared to 38% for men.
They fear new rounds of displacement and furthermore carry a negative connotation to their place of origin due to
the horrors experienced when displaced.
Few have actually been involved in the restitution process and even less made any concrete measure to return. A
rather long residence in urban areas, loss of agricultural practice, new livelihood strategies as well as now being
accustomed to more urban way of life with access to infrastructure reduces their willingness to return. The RDS
dataset is unique representative source of information on IDPs and the land restitution process in Colombia which
has not conducted any large scale representative survey on IDPs since 2008 (IDP-Commission, 2010). The
presentation will give gender related descriptive statistics, for example reflecting how the displacement experience
destroys families. 19 percent of the household consist are single headed by men (of which more than half is actually
alone), 27 percent led my women alone and 54 percent of the household have a couple. Such lack of matrimonial
unity is probably a hindrance for return.
We find in the RDS survey that only 21 percent of the sample intends to claim land restitution and actually return to
the place of origin, and woman considerably less interested than men. Women seem to be reasonably informed about
the process and do not report less confidence in the process. It is not possible to conclude from our RDS survey
whether the women receive differential and preferential treatment, but our qualitative investigation indicates such
does not take place.
However, the outcome has a clear gender difference as the share of all households that has actually done anything to
register a claim to land restitution, intends to return in order to use the land themselves, is only 1.5 percent for single
woman headed households, compared to 9.3 percent for single male headed and 10.5 percent for couple headed
households.

Our survey indicate clearly that neither men nor women accept joint land titling if the land inherited by either side
and is considered individual according to civil law. The joint titling in the Victims’ Law is probably hence
considered an imposition by the state on private property rights.
The land restitution process is furthermore an implicit land reform since the state will now become the guarantor of
property rights through the accompanying land titling process. Until know, the ultimate property right belong to
local powerlords in a semi-feudal system in the countryside (Wiig, 2008). The land demand side analysis from this
RDS survey on land restitution reflects and test hypothesis’ that is relevant for the ongoing peace negotiations
between the Colombian government and the FARC guerrilla in Havana facilitated by Norway. An “integral rural
reform” constitutes the first element of a future peace agreement which will probably include a land reform
redistributing 10 million hectares of agricultural land. Networks of IDPs to the countryside, level of education and
work experience, etc. will probably impact their willingness to start farming as for other landless poor people in
rural areas that will potentially benefit from such land reform.
Women in the Colombian land restitution process
Intention of the law and institutional arrangement
Law 1448 – Main features
The Victims’ Law covers victims of illegal armed groups such as paramilitaries and guerrillas, as well as
members of the Colombian police and armed forces. Reparations can be claimed for harm since 1 January
1985, while land and property restitution applies for acts committed after 1 January 1991. The law does
not affect the judicial processes implemented under the Law of Justice and Peace. Compared to the
Justice and Peace process, the threshold of proof is significantly reduced in favour of the victim.
The definition of ‘victim’ is established by Art. 3, which takes as its point of departure violations of
international humanitarian law and international human rights law committed after 1 January 1985.
Victims include those who suffered violations, as well as their closest relatives, independent of status or
identification of the perpetrator. Members of armed groups are not considered victims; the sole exception
being children or youngsters who demobilized while still minors. Relatives of illegal armed groups can be
considered victims only if their individual rights have been violated.
Persons whose rights were violated in the context of armed conflict prior to 1985 are entitled to the right
to truth, symbolic reparations and guarantees of non-repetition, but only as part of collective measures
directed at society at large. Articles 13 to 27 establish principles to guide implementation of this law, the
most relevant in this context being the principles of differential treatment (Art. 13), progressiveness (Art.
17), gradual implementation (Art. 18), and the rights to truth, justice and integral reparation (Articles 23–
25). Art. 28 explicitly addresses what is to be considered as victims’ rights in the framework of Law
1448, highlighting twelve specific rights, including ‘the right to truth, justice and reparation’ and ‘the
right to return to one’s place of origin or relocate out of free will, in conditions of security and dignity’.
The scope and mechanisms for land and property restitution are established in great detail in Articles 71–
123. Formal owners (propietarios), persons in possession of the land (posesionarios), or those using state
lands (ocupantes) who have been disposed or forced to abandon the land due to the armed conflict after
the cut-off date are entitled to the right of restitution of land and property (Art. 75). The law also
establishes the categories of abandonment and dispossession as bases for restitution, identifying
restitution as the preferred form of reparation for victims. Restitution encompasses the return of the
property lost, as well as the formalization of legal entitlements (formal property rights) (Art. 72). The law
envisages the possibility of monetary compensation or relocation to land/property of similar
characteristics to that which was lost only as a secondary measure and in cases where material restitution
is not feasible (Art. 97).
Law 1448 has been regulated by various subsequent decrees and directives explicitly addressing specific
aspects of the law.2 For instance, there are special regulations for each ethnic group in accordance to the
principle of differential treatment, special regulations concerning the Registry of Usurped and Abandoned
Lands and the National Victims Registry, and various administrative directives concerning specific parts
of registration processes. All in all, the restitution process is a complex endeavour involving a large
number of institutional actors at various stages of the process.
Where are ‘women’ in Law 1448?
To protect women’s access to land and enhance gender equality, Law 1448 establishes preferential
treatment for women in the process of land restitution (Articles 114-118). Such preferential treatment
encompasses prioritization of cases when the applicant is a woman, and the general mainstreaming of
gender perspectives in the administrative and judicial process. Women whose land is restituted are also
entitled to various additional benefits according to Law 731 of 2002. Furthermore, in restitution cases
involving the formalization of a property title, the new title will be issued in the name of both the man and
his partner or spouse at the moment of dispossession or abandonment, as a way of ensuring women’s
access to property and land (Art. 18).
2 An updated list of decrees regulating Law 1448 can be found at
http://www.unidadvictimas.gov.co/index.php/en/normativa, accessed 23 June 2014.
The emphasis on differential treatment in general and preferential treatment towards women has been
followed up by the various institutions created by the law in terms of special procedures and internal
guidelines. A state policy on the protection of women victims of the armed conflict, where the issue of
land restitution and access to land forms part of a priority area, was approved recently. A direct follow-up
has been the signing of a cooperation agreement between the Specialized Unit for Land Restitution (URT)
and the Presidential Commissioner for the Equality of Women in June 2014, aiming, inter alia, to
mainstream gender indicators in the restitution process, provide capacity-building on gender
differentiation among judicial and administrative staff working at various stages of the restitution process,
and strengthening female victims of armed conflict.3
Qualitative gender experiences with restitution
Differential and preferential treatment
There was a great fear that women would not be included in the land restitution and land titling
experience as agriculture is normally perceived as a male activity and the man considered the household
head in Colombia. The law hence imposes joint titling between the man and woman (at the moment of
displacement) to secure that women was left without land right and hence the most important form of
capital/wealth for the rural population. Woman was furthermore considered to be in a weak position to
claim rights as she might consider the land to be the property of men as women adapt the general gender
norm of the society, which in Colombia is considered to be male-biased (machista). The government
hence intended to give women both preferential and special treatment in the restitution process to
compensate for lack of own will and knowledge, e.g. the actual whereabouts of the land plot.
As discussed in section 2, women – in particular, single mothers who head a household – are to receive
differential and preferential treatment in accordance to the Victims’ Law at all stages of the process: in
the application and administrative phase (Art. 114 ),at the judicial phase (Art. 115), and during the
liberation and transfer of property (Art. 116). They are also to be the first to receive other types of
additional support like credit, productive projects, education and other individual goods of limited supply.
The requirement of joint property rights between the couple who originally abandoned the property is
apparently gender-neutral. However, agriculture is mainly a male activity and land is normally perceived
to be the property of men: most inherited land is passed on to sons rather than daughters. The Victims’
3 ‘Nuevas alianzas fortalecen los derechos de la mujer en la restitución de tierras’,
http://restituciondetierras.gov.co/?action=article&id=1215, accessed 23 June 2014.

Law implicitly defines its provisions on joint property as being a gender-equalizing policy by including
Article 118 under the section heading ‘Norms for women in the restitution processes.
Public discussion concerning joint titling in the Victims’ Law and contradictions with the Civil Code has
been almost absent in Colombia. Few are aware that joint titling overruns the individual right of spouses
who have brought property into the marriage or inherited as defined in the civil law. Gender activists
consider joint titling as a means to counter structural gender discrimination (SismaMujer 2013). While the
law states that both sons and daughters should inherit equally, men continue to inherit land more often
than women do. In practice, what joint titling does is to balance a daughter’s unlawful loss (not having
inherited) with the transfer of property rights to her brother’s wife. While this logic may make sense at the
structural level, the rights of the individual woman may not necessarily be protected. In this perspective,
women are considered more as a group rather than as individuals.
Differential and preferential treatment to women in the restitution process is guided by two policy
documents. First, the ‘Programme for special access for women, girls and youngster in the administrative
stage of the restitution of disposed land process’ was approved by a resolution in late 2013 (URT 2013).
While mainstreaming female preference is treated in very general terms, the resolution refers to a
‘technical document’ to be produced by the URT, and explicitly opening for the possibility to access non-
governmental funding sources to finance the ‘programme’. The second policy document is a recent
government White Paper providing perspectives on the protection of female victims of the armed conflict
and their rights (DNP 2013).
Outcome
According to interviews we carried out by the project team, it has been difficult to implement preferential
treatment for women in the restitution process as intended.
The first challenge is to make women claim land. Through special information campaigns and
collaboration with gender-focused NGOs, the URT is attempting to get women, especially heads of
household, to come forward to claim land that belonged to the household. This has proven difficult
because both men and women in the countryside normally consider agriculture to be a male activity, and
see land as being the property of men. For instance, a widow might not even know the exact locality of
the parcel or the position of its boundaries. Weaker connection to the land also makes it harder for women
to overcome the psychological barriers involved in returning to areas where they may have experienced
horrendous atrocities. However, the few available figures on the content of the land restitution rulings
indicate reasonable success in reaching out to women (see below).

The three selection criteria for micro-focalization security, concentration of cases and economic viability
of return are not directly related to gender. The concentration of potential female applicants could have
been an additional selection criteria for micro-focalization, e.g. the number of widows, for example proxy
by the number of recorded male deaths, would de facto put women first in line to be included in the
process if such is the aim of the policy
It is also difficult to prioritize women in the administrative phase due to the practical implementation of
tasks in the micro-focalized areas. The URT finds it more time efficient to include all claimants in one
identified area before they moving to the next. Selecting women first, and then men, would imply more
travelling for the institutions involved and hence a loss of valuable work-time.
However, informants indicate that the URT and other institutions involved in formalization do make
greater efforts to help women compared to men in similar situations, as well as seeking to help the most
vulnerable – who tend to be women. Actually, the degree of gender awareness has increased in most of
the Colombian state administration in general. For example, INCODER previously often adjudicated land
only to male applicants; today they would immediately ask about any female partner to be included on the
title deed with joint ownership.
The URT normally represents women, as well as male applicants, at the judicial phase. Our informants
expressed that the URT had high gender awareness and willingness to use resources to help women.
Furthermore, that restitution judges and restitution magistrates are trained to take into consideration the
special circumstances that affect women, both as claimants and partners to be jointly titled with male
claimants. The top–down signal from URT and SNARIV to prioritize women seems to have trickled
down to people working on the ground. However, the need for the local URT offices to meet annual
targets as to number of land parcels might lead them to prioritize male claimants, as these tend to be better
informed about the property being claimed.
One paradox found during implementation, is that even in those cases where a parcel is owned by a
couple, the law presumes to be only one claimant; which is usually a man. Various actors perceive this as
an unreasonable practice that reduces gender equality, and have proposed innovative, practical ways to
bypass this situation. Local URT offices may formally register a given parcel as two separate claims, one
for the husband, the other for the wife. In processing the claims, these two are administratively treated as
one property. While this creative solution makes women more visible, it also increases the number of
claimants to the same property.
Women are also supposed to receive preferential treatment and more attention in the post-ruling/follow-
up stage. Land restitution is only part of the comprehensive package of measures involving court rulings.
The claimants and their families can be entitled to individual help, such as education, psychological
assistance, or productive projects, or collective benefits like the provision of infrastructure. There is no
information available on the gender perspective in such assistance. However, respondents stress that
measure to make returning a viable enterprise, for example productive projects, would assist more
profitable agricultural activity which is culturally dominated by men.
Whether the URT has been successful in identifying potential female claimants and convincing them to
register is difficult to assess, as we do not know the distribution of potential claimants. However, as many
as 40% of the 54,063 claims for land restitution registered by 31 December 2013 were made by women
(URT, 2014). However, the URT annual report does not indicate how many female claims were accepted
in the RTDAF or later actually given a title.
Joint titling between applicant and the spouse at the time when they abandoned the land is another
important gender equalizing policy. It seems reasonable to assume that most of the 40 percent female
claimants are widows and hence without a male spouse with whom to share the land title. On the other
hand, most of the 60 percent male claimants do probably have a spouse. SismaMujer (2014) refers to
URT statistics which indicate that for all claims involving the claimant’s spouse, 72 percent are made by
men and 28 percent by women (unfortunately, the number of total claims is not known). The URT is
reported to put considerable effort into identifying female companions, whether they are still in the
household or have formed a separate household, in order to issue joint property rights. A partial review of
early court cases indicates that half of the parcels are given a joint title, a quarter individual titling and a
fifth is restituted to an undefined group of inheritors of the deceased original rights-holder.4 A woman is
normally the main beneficiary, but the restitution judges implicitly grant rights to children, parents and
other family members.5 The explicit distribution is to be decided later.
Gender outcomes are difficult to identify in statistics based on settled land restitution cases published by
URT. According to URT informants, about 3500 individuals have so far benefitted from restitution, 49
percent of these being women and 51 percent men. While judge’s order joint titling in 90 percent of the
court decisions, this figure might encompass different types of households and include several family
members. The extent of imposed joint titling and co-ownership between husband and wife at the moment
of displacement is still unknown.
One possible explanation for the rather high share of land titling to women mentioned above is that the
URT chose to start with land reform farms that were handed over to poor peasants in the 1960–70s after
4 The residual are smaller categories. 5 The cases of orphaned children are normally put in this category.

land occupations. INCORA, and later INCODER, often issued joint ownership in these cases and both
spouses hence recognise their dual ownership rights today. It can be expected that there will be less
acceptance of joint property rights as the restitution programme proceeds with more cases where land was
inherited and brought into the family by one spouse alone.
The Victims’ Law establishes preferential treatment for women. URT informants express concern about
the lack of explicit regulations applicable to the paragraphs addressing this during the restitution process
as well as concerning joint titling. Accordingly, the law’s general approach in this matter leaves
preferential treatment up to the interpretation of local URT offices and individual judges. Judges tend to
be conservative when it comes to establishing the rights of women, often requesting explicit, material
proof of a marital relation to the man. Since many couples were never officially married, a formal marital
connection is hard to establish. Men and women may have changed partners after displacement, and may
even lack formal identity papers; The URT puts great effort to demonstrate the contribution of the woman
in farming, taking care of the family or her participation in other economic activities to contributing to the
family livelihood. When such contribution is acknowledged at the court, the judges tends approve
property rights to the woman either through joint titling or by splitting the land into two properties with
both the man and the woman as owners if they no longer constitute a single household. The preferential
treatment seems to be more a question of differences in knowledge and ability, both on the part of
restitution authorities as well as women claimants, rather than gender per se. One example is the tendency
for women not to be able to give the exact position and demarcation of the parcel. The URT hence often
rely on the social mapping exercise to prove land right for women whose men died or disappeared during
the conflict, e.g. in practise the neighbours indications are taken at face value.
Idiosyncratic interpretations, however, seem to play a major role in final court decisions. URT informants
inform that some male occupant restitution claimants are titled individually in spite of the clear rule of
joint titling when state land is adjudicated to households. On the other hand, many judges establish joint
titling for individually owned land (bien propio), brought into marriage or inherited, in contradiction to
the partial common property rights (gananciales) clause of the Civil Code. There have been cases where
the judge grants monetary compensation to the woman for “improvements to the land while living
together” when outright property rights are not admitted.
Specific effects for women
Fear and psychological effects: The return of IDPs to their original homes is held as the ultimate aim of
the land restitution process. The rural population have lived very difficult lives during the conflict. Direct
intimidation or a specific act of violence made people pack all their belonging and flee, often overnight,

driven by fear. These fears, or feelings of insecurity, remain vivid in their minds, overriding the urge to
return – especially for women. The men, as the principal agriculturalists in Colombian households, are
more connected to the land itself and may often be more willing to take risks.
Some quantitative surveys indicate that few IDPs actually want to return. CCPPDF (2008) found that only
3.1% of the respondents actually wanted to return. Part of the explanation is probably that IDPs who
farmed on marginal land on the agricultural frontier had not developed deep family roots in the colonizing
areas that were most affected (Saffon 2010). They would gladly accept compensation or replacement land
somewhere else.
Survey results
RDS methodology and survey construction
Internally Displaced People (IDP) represents a so-called hidden population. There is no complete registry
of the IDP, and a large share of them would resist identification and request for interviews if one apply
conventional household surveys methodology. Snowball sampling is one possible solution to both
identify respondents and persuade them to take part, e.g. asking some initial respondents within this
population to identify friends, family and acquaintances with the same hidden population characteristic
with request of interviews on behalf of the researchers. Furthermore, normal methodologies of
quantitative analysis would probably give biased results as such selection would not be representative of
the whole population. Salganik and Heckathorn (2004) developed the Respondent Driven Sampling
(RDS) methodology which makes it possible to calculate unbiased incidence of a given variable in such
snowball sampling datasets.
We identified the initial group of IDP respondents in round 0 through NGOs which works closely with
this hidden population. The contacted IDPs by these initial respondents represent round 1 and are
supposed to recruit new respondents for round 2. The more rounds of “new” IDPs that have not be
included in preceding rounds by other respondents are collected, the shorter will the estimated confidence
interval of the estimated variables be. The rounds can be illustrated as a tree with different branches that
are split in each round. Some branches are dead ends as the respondent are not able to recruit new IDP
within his network, while other branches can last for several rounds before it stops. The main reasons for
stopping are that the respondents are not really willing to recruit new IDPs, have a limited network or the
one suggested are already included in the survey by others. The participants are given a small amount of

money to participate in the survey, and furthermore some money per new IDP recruited to the following
round.
We expect IDPs with claims in areas where restitution have started would be reasonably informed about
the process and have considered their options. We hence restrict our universe to IDPs with property,
possession or rightful claim (tenants excluded) in a municipality where parts of the territory have already
been micro-focalized. The land restitution institutions would then have been in the area both collecting
information and informing people on the process to come. We expect IDPs living outside the municipality
to the informed. The micro-focalized zones normally cover a share of the municipality, but the URT
intends to continue with the rest as soon as they have finalized the process the first group. People seldom
know the exact borders of the micro-focalized zones, while they identify closely with the municipality as
a territorial unit. The enumerators would hence easily verify if the new IDPs identified by a respondent
belonged to our universe by checking a complete list of municipalities with micro-focalized zones
published by URT.
Certain characteristics of the hidden population are required if a RDS sample should be representative of
the hidden population and hence produce unbiased estimates. Heckathorn indicates that the social bonds
between the IDPs should be frequent and reciprocal and constitute a convex group, e.g. there can possibly
be a connection between any member of the group. Such would not be present at national level, and the
RDS methodology is hence not suitable to calculate national figures. We hence concentrated our
investigation to the two city regions of Barranquilla and Bogota including municipalities close by. Our
universes of respondents on which we make inferences are IDPs living in or within a few hours drive by
car from each other in these two city regions and have a rightful claim to land restitution in any part of the
country
Most conventional surveys today are stratified and weighted with the population to produce unbiased estimates for
the chosen universe. The RDS methodology uses a similar, although more sophisticated, mathematical technique. It
estimates proportions of respondents of the total universe and the corresponding confidence interval of respondents
of the total universe (Salganik y Heckatorn, 2004). The following analysis is often based on variables that are
constructed by combining different questions from the survey in order to identify gender differences. Due to the
cross-continental collaboration in this project between Norway and Colombia, do I not at this moment in time have
the means to calculate the weighted percentages using the RDS technique but rather report figures from the
unweighted survey sample. Gutierrez Sanin (2014) report the correctly weighted average for some of our variables,
and by comparing some of them I fortunately find they do not differ that much, e.g. they report that 86.13 percent of

the sample fear repeated displacement compared to 84.37 percent in my unweighted sample (see table 17). All
variables will be weighted in the next version of the article which will be presented at the conference in March.
RDS studies traditionally only report incidences of categorical variables, e.g. the share of households with
respectively 1, 2, 3, 4 and 5 or more parcels to be claimed in restitution. However, our interest is to know whether
such differs between types of households, e.g. whether consists of only woman, only man or couple. Members of the
Land observatory research group that took part in this survey have developed a way of calculating unbiased
correlation coefficients. The methodology will be documented in future publications.
The survey is rich in detailed information and I will hence also report tables with average figures based on
continuous variables, e.g. parcel size, on the unweighted survey population without any claim of being
representative of the whole universe. Furthermore, it is also interesting to know certain characteristics of
subpopulations, e.g. share of households with only woman that had a spouse before they became IDPs and the
reason behind that will be given in such non-representative tables.
RDS Results
Gender categories of interest
Table 1 about here
There are more female than male respondents in the sample, 271 vs. 228 of the 499 observations (table 1). The
gender of the respondent in itself is however only relevant if the perceptions given are not affected by his or her
family composition. This is normally not the case. We hence chose two typologies to report responses from the
survey. First, we split between households in which the responsible adult is woman without spouse (Woman HH), a
man without spouse (Man HH) and a couple (Couple HH). There figures are respectively 27, 19 and 53 percent of
the household observations. We do hence not differentiate on other household characteristics, e.g. number of
household members, geography, etc. We then consider that the responses given reflect the situation of the household
as a unit rather than the gender of the respondent.
For other questions the response might reflect the individual characteristic of the respondent rather than the
household. We would then divide the Couple HH category into two categories, household with male respondent
(Couple HH Man) and female respondent (Couple HH Woman). The latter is slightly larger with 27 percent of the
sample compared to 26 percent of the former. The Woman HH and Man HH remains identical as all Woman HH
respondents are women and all Man HH respondents are men.
Household composition
Table 2 about here

The average number of household members differs a lot between the household categories with 2.6 in Man HH, 4.7
in Woman HH and 5.6 in Couple HH (table 2). To our surprise, a large number of men live alone, 55 percent of Man
HH, while such is very rear for women, less than 5 percent for Woman HH. Men appear to become lonely
individuals when they split from their family through displacement, while women keep the responsibility for both
children and elderly.
Table 3 about here
Qualitative studies indicate that displacement often leads to family break up. We find that 40 percent of our sample
had spouse before and after displacement (table 3). However, the spouse only differed in 5 percentage point of those.
On the other side, 21 percent of the sample had spouse before displacement but not now. This implies that of 42
percent of the 309 household that had spouse before displacement lost husband and remained single.
Table 4 about here
The reasons for losing the original spouse natural death in 11 percent of the households, 15 percent died an
unnatural death and 25 percent live in another household (table 4). The gender difference is clear, female
respondents said their husband had died unnaturally in 28 percent of the cases while the similar figure for male
respondents were only 3 percent. This verifies that men rather than women got killed in the conflict.
Table 5 about here
Table 6 about here
The literacy rate is rather high, as only 13 percent of the respondents do not know how to read or write (table 5). 12
percent of them say they have not had any formal education (table 6). About 50 percent of respondents have at least
completed primary education but the most repeated level of education in our sample was “incomplete primary
education”. It is worth to note that 12 percent of single women have technical upper secondary education and 20
percent of single men have secondary education. Anyhow, education seems to be rather equal by gender.
Land
Table 7 about here
The respondents are reasonably well informed about the existence of the restitution program, nearly 80 percent for
the whole sample (table 7), although male respondents are marginally general better informed than female
respondents in all household categories.
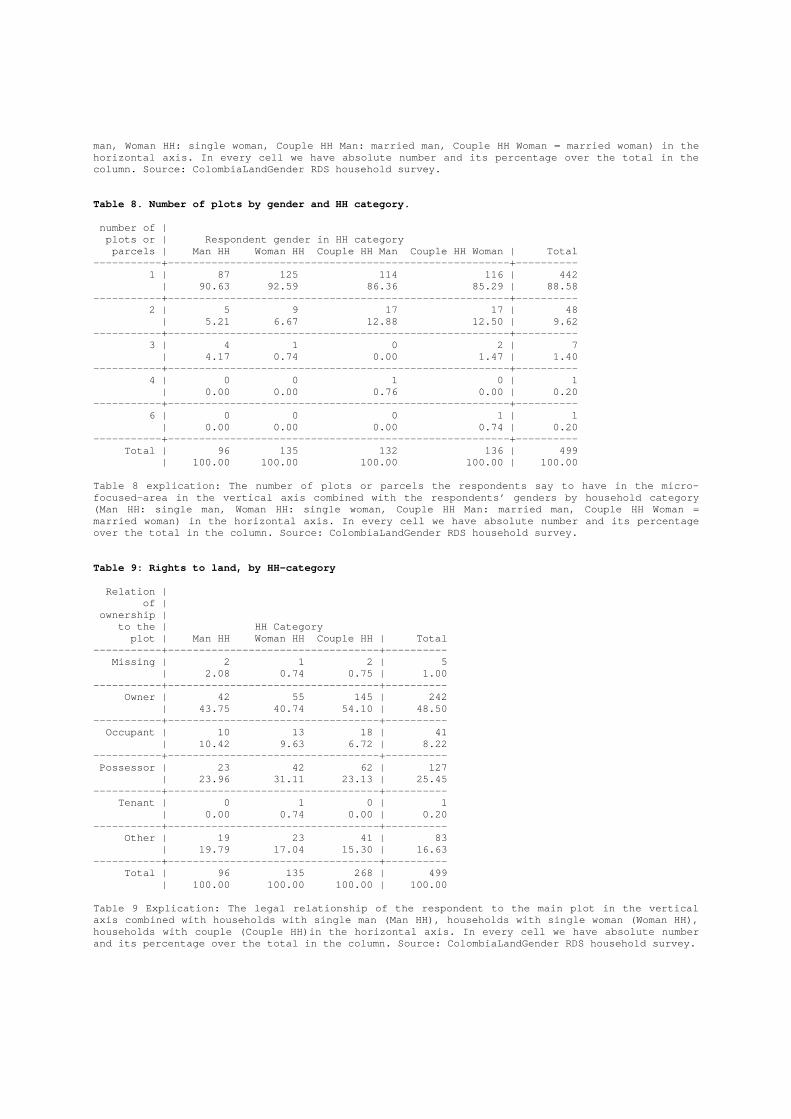
Table 8 about here
Man HH indicates to have far more land with right to restitution than both Woman HH and Couple HH, respectively
53 hectares (HA), 11 HA and 23 HA (table 2). The mean for the whole sample is 25 HA, the maximum amount of
land is 1000 HA and only 7 percent of the households as more than one parcel. Most IDPs in our survey are hence
smallholders with one parcel of land, and our detailed questions for the most important parcel hence covers nearly
the total land agricultural area. About 89 percent of the respondents say they have a single plot in the micro-focused
areas (table 8). Although we do not observe great differences between men and women, the relative amount of
couples who say to have 2 plots is twice as big as the relative amount of single people. We find 7 more cases with 3
plots, 1 married man with 4 and married woman with 6.
Table 9 about here
True ownership is more common than expected as 48 percent report to be owners, e.g title deed in their own name
registered in the own name, 25 percent possessors, e.g. title deed exist but not in their name, and only 8 percent
occupants without any or documentation that carries less judicial weight (table 9). Women are only marginally more
vulnerable to informality since ownership for Woman HH is 40 percent compared to 43 and 54 percent for their
male and couple counterparts.
Table 10 about here
Table 11 about here
In a separate question we ask about the existence of any documentation of type of land rights Woman HH is worst of
with 45 percent, compared to 53 percent and 58 percent for respectively their male and couple counterparts (table
10). It turns out that most of these documents were proper titles registered in the Public Registry, something which
implies that undocumented occupancy is not as common as suspected (table 11).
Table 12 about here
Independent of land right type, it seems like women are less likely to claim land restitution as the response by couple
HH differs by the sex of the respondent. 44 percent of Couple HH Woman compared to 33 percent of Couple HH
Man does not want to apply for restitution (table 12). The gender difference is even higher for single households as
the rate for Woman HH increases to 54 percent compared to 33 percent for Man HH. One interpretation is that
women are in general more reluctant to return, and are able to influence their spouses not to return.
Table 13 about here
Table 14 about here

A majority of 62 percent the 275 households that claim to have sought or willingness to seek restitution has not
started the process and we find the same gender pattern where women turn out to be least involved (table 13). Only
9 cases, or the tiny share of 3.1 percent of these willing households, have actually entered or ended the judicial phase
and as much as 7 are actually Men HH. So there are mostly men among the few that have been able to reach this
stage of the process. We also find that men are overwhelmingly the actual registered responsible claimant if the
household have entered the restitution process. In Woman HH 37 percent is not the woman herself, while the similar
figure for Man HH is 14 percent (table 14). Other relatives are important in Couple HH, probably offspring as the
original members has grown old.
Return
Table 15 about here
Restitution is about right to the land, to reclaim what was lost, and there is no precondition for the displaced to
return. The wish for return depend both on the household conditions and the sex of the respondent as the couple has
seldom reached a joint agreement on what to do in the future. Personal perceptions of the respondent hence matters.
We find that 16 percent of the Woman HH want to return compared to 37 percent for Man HH, similarly 24 percent
for Couple HH Woman compared to 33 percent for Couple HH Man (table 15).
There is also a gender difference on the intention to actually use the land themselves, something which implicitly
require presence and is hence linked to return. There is a huge gender difference for single headed households, e.g.
43 percent of Woman HH vs. 28 percent of Man HH want to sell the land, while it is slightly the other way for
couples, e.g. only 36 percent of Couple HH Woman vs. 43 percent Couple HH Man. We can only speculate about
the reason, e.g. maybe the respondent woman does not want to provoke their husband by stating she wants to sell the
land.
Table 16 about here
37 percent of the 275 HH who intend to claim restitution would sell the land as soon as possible and only 36 percent
3 would keep it to farm themselves (table 16). Only 100 of the 499 HH, or 20 percent, state any interest in using the
land, and reduced to 72 HH if combined with stated willingness to return to original household, e.g. less than 15
percent of the sample of potential benefactors of land restitution. Of these nearly half has not taken any initiative to
actually register a restitution claim and thereby stating a real interest, something which reduces the likely return HH
to less than 10 percent of the people URT would actually approach and work with in the restitution process, there is
furthermore a large female discrepancy, e.g. 1.5 percent for Woman HH, 9.3 percent for Man HH and 10.5 percent
for Couple HH. Woman HH would several practical reasons if they returned to their original parcels Agriculture is
considered male activity in Colombia and male dominated. Returning to rural areas without a husband or male
protector in the household is probably not viable for single mothers.
Table 17 about here
Table 18 about here
IDPs were often forced to flee nearly by definition, otherwise they would be considered migrants. An overwhelming
84 percent of all household fear they would experience a similar situation in the future (table 17). The survey
question is however ambiguous, and we do not whether they fear displacement at the current location or if they
returned to their original residence. The enumerators indicate respondents made the first interpretation and are
consistent with the high level of general insecurity sensed by 60 percent of the respondents (table 18).
Table 19 about here
Some sort of violence was reported to be the reason for leaving the plot in the first place as nobody indicated
economic reasons to leave it. 23 percent of all household due to the general sense of risk in the area (women higher
incidence than men), 50 percent after direct threats and 27 percent forcefully evicted (table 19).
Table 20 about here
Table 21 about here
It is important to feel strong and inspired to entail in the rather laborious task of rebuilding a future in the original
place. Unfortunately, more women than men report to be sick (table 20), and considerably more women than men
report to feel lonely (table 21). Interaction with government officials is vital, and their relationship with such is
hence important.
Table 22 about here
There is no major difference between men and woman when it come to the ease of interacting with government
officials, but it seems like Man HH and Woman HH find this more difficult than Couple HH (table 22).
As previously shown, women have fewer plots than men and their property rights are weaker. Women have hence
less to gain economically by returning.
Joint titling
Table 23 about here
Table 24 about here

The Victims’ Law require all land to be titled jointly, independent of former ownership. This contradicts the spirit of
the family law which imply all inherited property and property acquired before marriage to remain individual
property in contrast to property acquired while married that is jointly owned. Most of our respondents where such
joint ownership is relevant tended to disagree. Of the 87 Couple HH intended to claim land restitution and actually
indicate whom they would include in the title deed, 49 percent would include only respondent, 39 percent
respondent and current spouse and 12 percent respondent and original spouse (table 23). The subgroup of 28
households where the respondent had inherited the land, 79 percent would only include themselves, 11 percent add
the current spouse and 11 add the original spouse (table 24). If the latter is split by sex of the respondent, 91 percent
of female respondents would only include themselves in contrast to 68 percent for their male counterparts. People
hence tend to perceive the individual rights under the marriage law as stronger than the imposed joint property rights
in the Victims’ Law, even more strongly by women than men.
Gender roles
Table 25 about here
Colombia is considered a male dominated society. We asked both about norms and expectations regarding specific
situations to disclose the gender culture. The results are mixed , implying gender equality in some situations and
others not. For example, 91 percent of our sample thinks that women can go alone to the store (table 25). This
percent goes down to around 88 percent when our respondent is a single or married man.
Table 26 about here
If we refer to more direct questions as whether the woman should obey the man however, our data reflects that most
of respondents share the opinion that indeed women should obey men. There is one factor that seems to strengthen
this view: to be married, increasing the percentages from 54 percent to 69 percent in the case of men, and from 50
percent to 64 percent in the case of women. We also can derive from this that this view is strongly shared by women
but to a lesser extension than men (table 26).
Table 27 about here
It is of some interest also to observe the answers provided to the question “How should walk man and woman in the
street?” The majority of the sample, 85 percent, thinks that women and spouse should walk side by side but an 8
percent thinks that men should walk in front and a 5 percent the other way around. If we pay attention to the group
formed by single women the results are slightly different, increasing the amount of responses saying that the man
should walk ahead up to 13 percent (table 27).
Table 28 about here
Another proxy for the role of women in the household, specially the financial role, can be observed by the share of
respondents that agree with the statement “women should never make more money than men. In this case 89 percent
of the sample disagrees, being the group of single men who reaches the higher percentage of disagreement with a 95
percent, and married men the lowest with an 87 percent (table 28).
Table 29 about here
Table 30 about here
The role that women play in the acquisition of goods by the household varies greatly on the kind of good or
investment we refer to and the household category we put our focus on. Thus, we observe (table 29) how women
have taken the initiative 52 percent of the times to buy school supplies. When the household head is a couple, 33
percent and 28 percent of man and women respectively say to have taken the initiative together, while only 30
percent of the married male respondent say to have taken himself the initiative, against the 59 percent of the married
female respondent. When we ask who took the decision instead, percentages do not vary to a great extent, although
we observe how men played a slightly bigger role in the decision process. The biggest change is for the married
male respondents, where now a 37 percent claims having taken the decision themselves (table 30).
Table 31 about here
Table 32 about here
Related to the previous good is the initiative and decision of paying the children’s enrolment fee to school. When we
refer to the initiative (table 31), we see how women, in spite of being the group that takes the initiative more often,
lose some weight in favour of the “others” group. The fact that in the group “other” descendants are included might
be the underlying reason of this change. Again, the answers about who took the decision (table 32) are consistent
with those about the initiative, but the minor changes we observe are in favour of “other” instead of men as in the
previous case.
Table 33 about here
Table 34 about here
In the case of the initiative for the 68 households that bought alcohol, 69 percent of those who took the initiative
were men and when only 6 percent of married men say that the initiative was of the couple, the percentage goes up
to 26 when asked the married women. In our sample, it seems that in most of the cases, those who took the initiative
(table 33), made the decision (table 34).
Table 35 about here
Table 36 about here
To close the descriptive analysis of purchase initiative and decision, we look to “purchases in general”. In this case,
initiative (table 35) corresponded to women 45 percent of times, men a 29 percent and the couples a 23 percent.
Those who said that the initiative came from the couple more often were men and as expected, single respondents
said the initiative was theirs most of the times making for a 78 percent in the case of men and 74 percent in the case
of woman. It is noticeable that 70 percent of married women said the initiative was hers, in contrast to only a 34
percent of married men claiming the same. The decisions (table 36) are again taken in most of the cases for those
who had the initiative.
Therefore, we see how the initiative and decision seem to be linked for all the 4 previous cases and how for every
good listed, with the exception of alcohol, the initiative and decision came most of time from a woman. Thus, the
provision of the household was responsibility mainly of women and, with exception of alcohol, what is bought is the
women decision. In what follows we look at the role that gender has on the different investments that a household
must face.
Table 37 about here
Table 38 about here
The initiative to invest on housing plot is distributed equally for men and women in our sample with a 33 percent
each one (table 37). However, when we look at the answer by sex of the respondent we see how, independently of
the sex, respondent say he has taken the decision himself in approximately 60 percent of the cases when married and
66 when single. When we talk about the decision men made the final decision a 37 percent (table 38) . In absolute
numbers this is only one more man, but given the small size of household investing on a housing plot of our sample,
the relative change looks bigger.
Table 39 about here
Table 40 about here
20 respondents of our sample invested on housing. Of these respondents, 20 percent said that was by the man’s
initiative and 50 percent by the woman’s initiative and 60 percent of married men said was by initiative of the
couple (table 39). When it comes to the decision however, men took the decision 30 percent of times (table 40).
Table 41 about here
Table 42 about here
The initiative to invest on material (table 41) was in 36 percent of occasions from a woman and 27 percent of times
from a man. However, within households headed by a couple, the initiative came most of the times from the couple
or the men. In the decision process however (table 42), there were as many respondents that said that was women’s
decision as respondents that said it was men’s. Within couples, most of the times were the man who took the
decision, followed by the couples and finally only the woman.
Table 43 about here
Table 44 about here
The initiative (table 43) and decision (table 44) about investment of furniture show a more traditional pattern. The
initiative came from the woman 36 percent of times against 27 percent of times that came from men. However the
decision was taken by the man in 35 percent of the households. If we look only to households formed by couples,
the couple as a whole had the initiative most often, followed by the men and finally the women, but the decision was
most of the times, taken by the man.
Table 45 about here
Table 46 about here
Finally, if we take a look to who had the initiative to buy a cart or animals from transport (Table 45), we see that
men were 53 percent who took the initiative, and to an even large extent were who decided if the investment should
be done or not (table 46).
From the analysis of the answers about household investment, we observe how in our sample men take more
decisions than they did about the purchase of goods. In the case of couples, were the men who usually decided if the
investment was to be done or not, even if the initiative came from women.
In conclusion, there is some degree of duality when it comes to gender roles. On one hand, 60 percent of
respondents and over 65 percent if we talk about married respondents, think that women should obey men (table 36).
On the other hand, women play a more important role in financial issues and most of times they take both the
initiative and have the final say about where the money should be spent on (table 36). In this direction points also
the fact that most respondents (i.e. 89 percent of the sample, 95 percent if we refer to single man), disagree with the
claim that “women should never make more money than men” (table 28).
Conclusions
Colombia’s land restitution process is moving forward slowly. The comprehensive documentation of each individual
case and resources required for the courts will make it impossible to help the more than 5 million IDPs (Gutierrez

Sanin, 2013). A large proportion of the IDPs will probably never benefit from the restitution process, or perhaps the
government will be forced to give monetary compensations, often based on collective judicial processes, instead.
If, contrary to expectations, the URT is able to reach all IDPs and formalize their property rights in the process, one
may still question whether the state apparatus is strong enough to defend these rights later. The institutional presence
in the countryside is weak, and vulnerable to pressure and corrupt practices that may undermine the achievements.
Furthermore, land formalization processes tend to become single episodes of titling and the creation of a registry
that is not updated afterwards. If information on land sales, inheritance and other transfers is not updated in the
Public Registry because the actors feel the process is too complicated, time- and money-consuming, the registry will
soon lose relevance.
Restitution of land does not necessarily mean that the IDPs will move back. A generation might have passed since
they lost their land, and they may have now settled down in other areas, earning a living in other professions than
agriculture. Their offspring often have no relationship to the area their parents left and will probably not consider
relocating when they inherit the land. Preliminary fieldwork indicates three possible outcomes as the most common:
the land remains idle; the land is used solely for recreational purposes; or the land is sold as soon as the two years of
embargo have passed. In the course of our fieldwork we have not encountered any returning IDPs who have actually
resettled on their original land. Those who take up farming again do so by migrating seasonally to conduct the farm
work.
Our qualitative study survey indicates that both gender policies that should secure the rights for women to land do
not necessarily work according to the intention. Our qualitative informants indicate that URT find it difficult to give
women differential and preferential treatment as the restitution process considers all claimants within the small
micro-focalized zone more or less at the same time. The URT are furthermore not able to target women specifically
to make them claim land restitution. Our survey indicate that women are nearly as well informed on the restitution
process as men and do not have less formal resources like education than their male counterparts. However, women
do show considerably less willingness to claim land restitution, use the land themselves and return to the place of
origin. The qualitative informants indicate women are less connected to the land and furthermore more traumatized
by the experience of displacement than men. Our sample data verifies to a minor degree this gender difference in
traumatisation.
Informality of land rights is considered one of the drivers of conflict in Colombia. Surprisingly, nearly half the
sample report to be owners and number households lacking any documentation is rather low. Many have inherited
the land, and we find that a majority such resists the inclusion of the spouse on the title deed, women actually more
than men. This illustrates that people adhere to the civil law that states individual property rights in such cases rather
than the joint ownership between the spouses as indicated in the Victims’ Law. Wisely, to avoid resistance and
discrediting the restitution process, the government has yet not introduced an explicit regulation of the Victims’ Law
that imposes such joint ownership in all circumstances. It is hence left to the land restitution judges to decide, and
our qualitative informants indicate that they stick to the civil law when the plot is previously titled in only one of the

spouses’ name. However, if informality reigns, joint land ownership is normally imposed even if such land might
also be “inherited” by one of the spouses.
References
COHDES (2010) ‘¿Consolidación de qué? Informe sobre desplazamiento, conflicto armado y derechos
humanos en Colombia en 2010’ (Consolidation of what? Report on displacement, armed conflict and
human rights in Colombia in 2010), CODHES Informa, No 77, 15 February, Bogotá.
García-Godos, J. & Wiig, H. (2014). The Colombian land restitution process - Process, results and
challenges, with special emphazis on women. Report. Oslo: NIBR
http://www.colombialandgender.org/images/pdf/GGW_2014_Land.pdf
Gutiérrez Sanín, F. (2013). Un trancón fenomenal - Un análisis de las demoras en el proceso de
restitución [A gigantic bottleneck – An analisis of the delays in the restitution process], Working
paper, Land Restitution Observatory, Bogota.
Gutierrez Sanín (2014) La restitucion y sus problemas segun sus potenciales beneficiarios (The restitution and its
problems as perceived by potential beneficiaries): Observatorio de Restitucion y regulacion de derechos de
propiedad agraria
Heckathorn, M. (1997). Respondent driven sampling. A new approach to the study of hidden populations. Social
problems.
IDP Commission (2010) III Encuesta nacional de verificacion de los derechos de la populacion desplazada 2010 -
Resumen de resultados preliminares en materia de bienes rurales (III National census on the verification of
the rights tot he displaced people - Resume of the preliminary findings for rurales goods). Bogota:
Commission for the follow up of the puplic policy for enforced displacement
Saffon M. P. (2010). The project of land restitution in Colombia: An illustration of the civilizing force of hypocracy.
Estudios Socio-juridicos, 12 (2): 109-194
Salganik, M. J. & Heckathorn, M. (2004). Sampling and Estimation in Hidden Populations Using Respondent-
Driven Sampling Sociological Methodology.
Wiig, H. (2013). Joint titling in Rural Peru: Impact on Women's participation in Household Decision-
Making. World Development, 52 (1): 104-119
Wiig, H. (2009). Compensation or restitution of land rights in the Colombian peacemaking process – Economic
efficiency vs. society building? Working Paper 119. Oslo: NIBR. http://www.nibr.no/filer/2009-119.pdf

Tables
Appendix Table 1. Household head composition, split by sex o f respondent HH category | | | sex of the respondant | man woman | Total -------------+----------------------+---------- Man HH | 96 0 | 96 | 42.11 0.00 | 19.24 -------------+----------------------+---------- Woman HH | 0 135 | 135 | 0.00 49.82 | 27.05 -------------+----------------------+---------- Couple HH | 132 136 | 268 | 57.89 50.18 | 53.71 -------------+----------------------+---------- Total | 228 271 | 499 | 100.00 100.00 | 100.00 Table 1 explication: The household categories in ve rtical axis with households with single man (Man HH), households with single woman (Woman HH), households with couple (Couple HH), combined with sex of respondent in horizontal axis. Source: ColombiaLandGender RDS household survey. Table 2. Summary table of quantitative figures Man HH Variable Obs Mean Std. D ev. Min Max # Family members 96 2.614583 2.381374 1 11 # Area of plots 96 52.77299 131.7383 0 1000 Mean, Standard deviation, minimum and maximum of fa mily members and hectares of plots for households in which the respondent is a single man. Source: ColombiaLandGender RDS household survey. Woman HH Variable Obs Mean Std. Dev. Mi n Max # Family members 135 4.77037 2.308132 1 14 # Area of plots 135 11.03022 22.41069 0 143 Mean, Standard deviation, minimum and maximum of fa mily members and hectares of plots for households in which the respondent is a single wome n. Source: ColombiaLandGender RDS household survey. Couple HH Variable Obs Mean Std. Dev. Mi n Max # Family members 268 5.593284 2.505924 1 16 # Area of plots 268 22.52724 49.06007 0 409 Mean, Standard deviation, minimum and maximum of fa mily members and hectares of plots for households in which the respondent is married curre ntly. Source: ColombiaLandGender RDS household survey. Number of single men in households with one member: 53 Number of single women in households with one membe r: 6 Table 3: Couple now and before displacement

Dummy for | Dummy for respondent respondent | having spouse before having or | displacement not spouse | yes no | Total -----------+----------------------+---------- yes | 203 65 | 268 | 40.68 13.03 | 53.71 -----------+----------------------+---------- no | 106 125 | 231 | 21.24 25.05 | 46.29 -----------+----------------------+---------- Total | 309 190 | 499 | 61.92 38.08 | 100.00 Table 3 explication: A dummy for whether the respon dent is currently married or not stands in the vertical axis combined with a dummy for whether the respondent was married originally or not in the horizontal axis. In every cell we have absolute number and its percentage over the total. Source: ColombiaLandGender RDS household survey. Table 4: Reason for loosing spouse, by current hous ehold status | Having lost spou se Reason for the lost | has new spouse ? spouse to be lost | Changed spouse Have n o spouse | Total ---------------------------+----------------------- ---------+---------- Missing | 0 4 | 4 | 0.00 3.77 | 3.08 ---------------------------+----------------------- ---------+---------- Natural death | 1 13 | 14 | 4.17 12.26 | 10.77 ---------------------------+----------------------- ---------+---------- Unnatural death | 5 15 | 20 | 20.83 14.15 | 15.38 ---------------------------+----------------------- ---------+---------- Moved out (part of the HH) | 0 7 | 7 | 0.00 6.60 | 5.38 ---------------------------+----------------------- ---------+---------- Moved out (out of HH) | 8 24 | 32 | 33.33 22.64 | 24.62 ---------------------------+----------------------- ---------+---------- Other | 10 43 | 53 | 41.67 40.57 | 40.77 ---------------------------+----------------------- ---------+---------- Total | 24 106 | 130 | 100.00 100.00 | 100.00 Table 4 explication: (Group: Those who lost their o riginal spouse.) The reasons for which the spouse where lost according to respondents are list ed in the vertical axis combined with those that lost their original spouse and have currently a new spouse (Changed spouse) and those that lost their original spouse and are currently single (Have no spouse). In every cell we have absolute number and its percentage over the total i n the column. Source: ColombiaLandGender RDS household survey. Table 5. Alphabetization by gender and HH category. Respondent | knows how | to read | Respondent gender and HH categ ory and write | Man HH Woman HH Couple HH Man Couple HH Woman | Total -----------+--------------------------------------- ----------------+---------- yes | 76 109 110 115 | 410 | 81.72 81.95 84.62 86.47 | 83.84 -----------+--------------------------------------- ----------------+---------- no | 17 24 20 18 | 79 | 18.28 18.05 15.38 13.53 | 16.16 -----------+--------------------------------------- ----------------+---------- Total | 93 133 130 133 | 489 | 100.00 100.00 100.00 100.00 | 100.00

Table 5 explication: (Group: All respondents, exclu ded those that did not answer if they could read and write.) A dummy for whether respondent kno ws how to read and write or not stands in the vertical axis combined with the respondents’ gender s by household category (Man HH: single man, Woman HH: single woman, Couple HH Man: married man, Couple HH Woman = married woman) in the horizontal axis. In every cell we have absolute num ber and its percentage over the total in the column. Source: ColombiaLandGender RDS household su rvey. Table 6. Education of respondent, by gender and HH category. Level of education of | Respondent gender in HH category the respondent | Man HH Woman HH Coup le HH Man Couple HH Woman | Total ----------------------+---------------------------- ---------------------------+---------- None | 16 18 16 12 | 62 | 16.84 13.43 12.21 8.89 | 12.53 ----------------------+---------------------------- ---------------------------+---------- Primary, incomplete | 18 28 32 34 | 112 | 18.95 20.90 24.43 25.19 | 22.63 ----------------------+---------------------------- ---------------------------+---------- Primary | 19 24 19 22 | 84 | 20.00 17.91 14.50 16.30 | 16.97 ----------------------+---------------------------- ---------------------------+---------- Secondary, incomplete | 15 31 24 37 | 107 | 15.79 23.13 18.32 27.41 | 21.62 ----------------------+---------------------------- ---------------------------+---------- Secondary | 19 16 22 22 | 79 | 20.00 11.94 16.79 16.30 | 15.96 ----------------------+---------------------------- ---------------------------+---------- Upper Secondary, Tech | 3 17 8 4 | 32 | 3.16 12.69 6.11 2.96 | 6.46 ----------------------+---------------------------- ---------------------------+---------- Universitary, incomp. | 2 0 8 3 | 13 | 2.11 0.00 6.11 2.22 | 2.63 ----------------------+---------------------------- ---------------------------+---------- Universitary | 3 0 2 1 | 6 | 3.16 0.00 1.53 0.74 | 1.21 ----------------------+---------------------------- ---------------------------+---------- Total | 95 134 131 135 | 495 | 100.00 100.00 100.00 100.00 | 100.00 Table 6 explication: (Group: All respondents, exclu ded those that did not respond to which was their education.) Respondents’ level of education i n the vertical axis combined with the respondents’ genders by household category (Man HH: single man, Woman HH: single woman, Couple HH Man: married man, Couple HH Woman = married woman) in the horizontal axis. In every cell we have absolute number and its percentage over the total i n the column. Source: ColombiaLandGender RDS household survey. Table 7: Knowledge of restitution program by sex of respondent and HH composition Respondent | knows about | the | restitution | Respondent gender in HH cat egory program | Man HH Woman HH Couple HH Man Couple HH Woman | Total ------------+-------------------------------------- -----------------+---------- Missing | 0 0 1 3 | 4 | 0.00 0.00 0.76 2.21 | 0.80 ------------+-------------------------------------- -----------------+---------- yes | 76 96 112 107 | 391 | 79.17 71.11 84.85 78.68 | 78.36 ------------+-------------------------------------- -----------------+---------- no | 20 39 19 26 | 104 | 20.83 28.89 14.39 19.12 | 20.84 ------------+-------------------------------------- -----------------+---------- Total | 96 135 132 136 | 499 | 100.00 100.00 100.00 100.00 | 100.00 Table 7 explication: Dummy for whether the responde nt says to know about the restitution program in the vertical axis combined with the respondents’ genders by household category (Man HH: single
man, Woman HH: single woman, Couple HH Man: married man, Couple HH Woman = married woman) in the horizontal axis. In every cell we have absolute num ber and its percentage over the total in the column. Source: ColombiaLandGender RDS household su rvey. Table 8. Number of plots by gender and HH category. number of | plots or | Respondent gender in HH category parcels | Man HH Woman HH Couple HH Man Couple HH Woman | Total -----------+--------------------------------------- ----------------+---------- 1 | 87 125 114 116 | 442 | 90.63 92.59 86.36 85.29 | 88.58 -----------+--------------------------------------- ----------------+---------- 2 | 5 9 17 17 | 48 | 5.21 6.67 12.88 12.50 | 9.62 -----------+--------------------------------------- ----------------+---------- 3 | 4 1 0 2 | 7 | 4.17 0.74 0.00 1.47 | 1.40 -----------+--------------------------------------- ----------------+---------- 4 | 0 0 1 0 | 1 | 0.00 0.00 0.76 0.00 | 0.20 -----------+--------------------------------------- ----------------+---------- 6 | 0 0 0 1 | 1 | 0.00 0.00 0.00 0.74 | 0.20 -----------+--------------------------------------- ----------------+---------- Total | 96 135 132 136 | 499 | 100.00 100.00 100.00 100.00 | 100.00 Table 8 explication: The number of plots or parcels the respondents say to have in the micro-focused-area in the vertical axis combined with the respondents’ genders by household category (Man HH: single man, Woman HH: single woman, Couple HH Man: married man, Couple HH Woman = married woman) in the horizontal axis. In every cel l we have absolute number and its percentage over the total in the column. Source: ColombiaLandG ender RDS household survey. Table 9: Rights to land, by HH-category Relation | of | ownership | to the | HH Category plot | Man HH Woman HH Couple HH | Total -----------+----------------------------------+---- ------ Missing | 2 1 2 | 5 | 2.08 0.74 0.75 | 1.00 -----------+----------------------------------+---- ------ Owner | 42 55 145 | 242 | 43.75 40.74 54.10 | 48.50 -----------+----------------------------------+---- ------ Occupant | 10 13 18 | 41 | 10.42 9.63 6.72 | 8.22 -----------+----------------------------------+---- ------ Possessor | 23 42 62 | 127 | 23.96 31.11 23.13 | 25.45 -----------+----------------------------------+---- ------ Tenant | 0 1 0 | 1 | 0.00 0.74 0.00 | 0.20 -----------+----------------------------------+---- ------ Other | 19 23 41 | 83 | 19.79 17.04 15.30 | 16.63 -----------+----------------------------------+---- ------ Total | 96 135 268 | 499 | 100.00 100.00 100.00 | 100.00 Table 9 Explication: The legal relationship of the respondent to the main plot in the vertical axis combined with households with single man (Man HH), households with single woman (Woman HH), households with couple (Couple HH)in the horizontal axis. In every cell we have absolute number and its percentage over the total in the column. So urce: ColombiaLandGender RDS household survey.

Table 10: Existence of document of land rights, by HH category Dummy for | existing | documents | of | HH Category property | Man HH Woman HH Couple HH | Total -----------+----------------------------------+---- ------ Missing | 2 1 3 | 6 | 2.08 0.74 1.12 | 1.20 -----------+----------------------------------+---- ------ yes | 51 62 155 | 268 | 53.13 45.93 57.84 | 53.71 -----------+----------------------------------+---- ------ no | 43 72 110 | 225 | 44.79 53.33 41.04 | 45.09 -----------+----------------------------------+---- ------ Total | 96 135 268 | 499 | 100.00 100.00 100.00 | 100.00 Table 10 explication: Dummy for existing documents of property for the main plot combined with households with single man (Man HH), households wit h single woman (Woman HH), households with couple (Couple HH) in the horizontal axis. In every cell we have absolute number and its percentage over the total in the column. Source: Co lombiaLandGender RDS household survey. Table 11: If land rights documented, share as prope rty in Public Registry Dummy for | existing | documents | Dummy for documents being of | registered at ORIP property | Missing yes no | Total -----------+---------------------------------+----- ----- Missing | 6 0 0 | 6 | 100.00 0.00 0.00 | 1 00.00 -----------+---------------------------------+----- ----- yes | 17 214 37 | 268 | 6.34 79.85 13.81 | 1 00.00 -----------+---------------------------------+----- ----- no | 47 0 178 | 225 | 20.89 0.00 79.11 | 1 00.00 -----------+---------------------------------+----- ----- Total | 70 214 215 | 499 | 14.03 42.89 43.09 | 1 00.00 Table 11 explication: Dummy for respondent saying t hat there are documents of property for the main plot in the vertical axis combined with the do cuments being registered at the ORIP in the horizontal axis. In every cell we have absolute num ber and its percentage over the total in the row. Source: ColombiaLandGender RDS household surve y. Table 12: Intention to request land restitution and return, by HH category Respondent | gender in HH | Intention to apply and to come ba ck to plot category | Missing No apply Back No Back | Total ----------------+---------------------------------- ----------+---------- Man HH | 18 31 29 18 | 96 | 18.75 32.29 30.21 18.75 | 100.00 ----------------+---------------------------------- ----------+---------- Woman HH | 21 74 13 27 | 135 | 15.56 54.81 9.63 20.00 | 100.00 ----------------+---------------------------------- ----------+---------- Couple HH Man | 15 43 34 40 | 132 | 11.36 32.58 25.76 30.30 | 100.00 ----------------+---------------------------------- ----------+---------- Couple HH Woman | 16 60 28 32 | 136 | 11.76 44.12 20.59 23.53 | 100.00 ----------------+---------------------------------- ----------+---------- Total | 70 208 104 117 | 499

| 14.03 41.68 20.84 23.45 | 100.00 Table 12 explication: Respondents’ genders by house hold category (Man HH: single man, Woman HH: single woman, Couple HH Man: married man, Couple HH Woman = married woman) in the vertical axis combined with whether they do not want to apply (No apply), have applied or plan to apply (Apply Back)or have applied or plan to apply and not comin g back (No Back). In every cell we have absolute number and its percentage over the total i n the row. Source: ColombiaLandGender RDS household survey. Table 13: Stage in restitution process for signalle d willingness to apply, by HH category How advanced is the | HH Category restitu. application? | Man HH Woman HH Coup le HH | Total ----------------------+---------------------------- ------+---------- Missing | 2 1 7 | 10 | 3.33 1.85 4.35 | 3.64 ----------------------+---------------------------- ------+---------- Finish legal process | 2 0 0 | 2 | 3.33 0.00 0.00 | 0.73 ----------------------+---------------------------- ------+---------- In legal proceedings | 5 1 1 | 7 | 8.33 1.85 0.62 | 2.55 ----------------------+---------------------------- ------+---------- Pending of URT | 10 8 24 | 42 | 16.67 14.81 14.91 | 15.27 ----------------------+---------------------------- ------+---------- Applied to URT | 7 7 30 | 44 | 11.67 12.96 18.63 | 16.00 ----------------------+---------------------------- ------+---------- Not started | 34 37 99 | 170 | 56.67 68.52 61.49 | 61.82 ----------------------+---------------------------- ------+---------- Total | 60 54 161 | 275 | 100.00 100.00 1 00.00 | 100.00 Table 13 explication: (Group: Those who have applie d or plan to apply to the restitution programme) How advanced is the restitution programm e combined with households with single man (Man HH), households with single woman (Woman HH), households with couple (Couple HH) in the horizontal axis. In every cell we have absolute num ber and its percentage over the total in the column. Source: ColombiaLandGender RDS household su rvey. Table 14: Individual made the responsible claimant if HH has entered the restitution process, by HH category Who applied to | restitution | HH Category program | Man HH Woman HH Couple HH | Total ----------------+---------------------------------- +---------- Woman | 0 10 0 | 10 | 0.00 62.50 0.00 | 18.52 ----------------+---------------------------------- +---------- Man | 18 0 0 | 18 | 85.71 0.00 0.00 | 33.33 ----------------+---------------------------------- +---------- Husband | 0 0 3 | 3 | 0.00 0.00 17.65 | 5.56 ----------------+---------------------------------- +---------- Descendant | 0 0 1 | 1 | 0.00 0.00 5.88 | 1.85 ----------------+---------------------------------- +---------- Other relatives | 2 4 9 | 15 | 9.52 25.00 52.94 | 27.78 ----------------+---------------------------------- +---------- Other | 1 2 4 | 7 | 4.76 12.50 23.53 | 12.96 ----------------+---------------------------------- +---------- Total | 21 16 17 | 54 | 100.00 100.00 100.00 | 100.00

Table 14 explication: (Group: Those who have applie d or plan to start, that have not finished the legal proceedings)Who applied to the restitution pr ogram in the vertical axis combined with households with single man (Man HH), households wit h single woman (Woman HH), households with couple (Couple HH) in the horizontal axis. In every cell we have absolute number and its percentage over the total in the column. Source: Co lombiaLandGender RDS household survey. Table 15: Intention to return, by sex of respondent and HH category Dummy for | planning | to return | Respondent gender in HH cate gory to plot | Man HH Woman HH Couple HH Man Couple HH Woman | Total -----------+--------------------------------------- ----------------+---------- yes | 37 21 49 33 | 140 | 38.54 15.56 37.12 24.26 | 28.06 -----------+--------------------------------------- ----------------+---------- no | 59 114 83 103 | 359 | 61.46 84.44 62.88 75.74 | 71.94 -----------+--------------------------------------- ----------------+---------- Total | 96 135 132 136 | 499 | 100.00 100.00 100.00 100.00 | 100.00 Table 15 explication: Dummy for whether the respond ents plan to come back to the plot or not in the vertical axis combined with the respondents’ ge nders by household category (Man HH: single man, Woman HH: single woman, Couple HH Man: married man, Couple HH Woman = married woman) in the horizontal axis. In every cell we have absolute num ber and its percentage over the total in the column. Source: ColombiaLandGender RDS household su rvey. Table 16: Plans with plot if restituted, by HH cate gory Respondent | gender in HH | Which plans do you ha ve for the plot if restituted? category | Missing Lease lan Farming a farming a Stay away Sell it Other | To tal ----------------+---------------------------------- -------------------------------------------+------- --- Man HH | 5 0 28 1 1 17 8 | 60 | 8.33 0.00 46.67 1.67 1.67 28.33 13.33 | 100 .00 ----------------+---------------------------------- -------------------------------------------+------- --- Woman HH | 8 3 12 1 1 23 6 | 54 | 14.81 5.56 22.22 1.85 1.85 42.59 11.11 | 100 .00 ----------------+---------------------------------- -------------------------------------------+------- --- Couple HH Man | 8 3 34 0 1 36 5 | 87 | 9.20 3.45 39.08 0.00 1.15 41.38 5.75 | 100 .00 ----------------+---------------------------------- -------------------------------------------+------- --- Couple HH Woman | 8 4 26 2 1 27 6 | 74 | 10.81 5.41 35.14 2.70 1.35 36.49 8.11 | 100 .00 ----------------+---------------------------------- -------------------------------------------+------- --- Total | 29 10 100 4 4 103 25 | 275 | 10.55 3.64 36.36 1.45 1.45 37.45 9.09 | 100 .00 Label list: 1 Lease lan: Lease land to others 2 Farming a: Farming and having animals of my own 3 farming a: farming and having animals of a relative 4 Stay away: Stay away because others ar e there 5 Sell it: Sell the plot 6 Other Table 16 explication: (Group: those that have appli ed or plan to apply for restitution) Respondents’ genders by household category (Man HH: single man, Woman HH: single woman, Couple HH Man: married man, Couple HH Woman = married woman) in the vertical axis combined with the plan the respondent have for the plot if it was restitut ed. In every cell we have absolute number and its percentage over the total in the row. Source: C olombiaLandGender RDS household survey. Table 17: Feeling fear of repeated displacement, by HH and respondent category Respondent | Afraid of having to abandon gender in HH | residence for conflict again category | 0 yes no | Total ----------------+---------------------------------+ ---------- Man HH | 0 78 18 | 96 | 0.00 81.25 18.75 | 100.00

----------------+---------------------------------+ ---------- Woman HH | 0 119 16 | 135 | 0.00 88.15 11.85 | 100.00 ----------------+---------------------------------+ ---------- Couple HH Man | 0 112 20 | 132 | 0.00 84.85 15.15 | 100.00 ----------------+---------------------------------+ ---------- Couple HH Woman | 1 112 23 | 136 | 0.74 82.35 16.91 | 100.00 ----------------+---------------------------------+ ---------- Total | 1 421 77 | 499 | 0.20 84.37 15.43 | 100.00 Table 17 explication: Respondents’ genders by house hold category (Man HH: single man, Woman HH: single woman, Couple HH Man: married man, Couple HH Woman = married woman) in the vertical axis combined with whether they are afraid about having to leave again for a conflict. In every cell we have absolute number and its percentage over the total in the row. Source: ColombiaLandGender RDS household survey. Table 18: Feeling fear in general, by HH and respon dent category Respondent | gender in HH | Variable for feeling fea r category | Missing yes no sometimes | Total ----------------+---------------------------------- ----------+---------- Man HH | 0 52 44 0 | 96 | 0.00 54.17 45.83 0.00 | 100.00 ----------------+---------------------------------- ----------+---------- Woman HH | 4 85 46 0 | 135 | 2.96 62.96 34.07 0.00 | 100.00 ----------------+---------------------------------- ----------+---------- Couple HH Man | 1 71 59 1 | 132 | 0.76 53.79 44.70 0.76 | 100.00 ----------------+---------------------------------- ----------+---------- Couple HH Woman | 3 87 46 0 | 136 | 2.21 63.97 33.82 0.00 | 100.00 ----------------+---------------------------------- ----------+---------- Total | 8 295 195 1 | 499 | 1.60 59.12 39.08 0.20 | 100.00 Table 18 explication: Respondents’ genders by house hold category (Man HH: single man, Woman HH: single woman, Couple HH Man: married man, Couple HH Woman = married woman) in the vertical axis combined with whether they feel fear in the horizon tal axis. In every cell we have absolute number and its percentage over the total in the row . Source: ColombiaLandGender RDS household survey. Table 19: Reason for abandoning plot, by respondent household category Respondent | gender in HH | Reasons to leave plot category | 0 Abandoned Threaths Forced ou | Total ----------------+---------------------------------- ----------+---------- Man HH | 1 13 53 29 | 96 | 1.04 13.54 55.21 30.21 | 100.00 ----------------+---------------------------------- ----------+---------- Woman HH | 0 31 67 37 | 135 | 0.00 22.96 49.63 27.41 | 100.00 ----------------+---------------------------------- ----------+---------- Couple HH Man | 0 30 68 34 | 132 | 0.00 22.73 51.52 25.76 | 100.00 ----------------+---------------------------------- ----------+---------- Couple HH Woman | 1 38 64 33 | 136 | 0.74 27.94 47.06 24.26 | 100.00 ----------------+---------------------------------- ----------+---------- Total | 2 112 252 133 | 499 | 0.40 22.44 50.50 26.65 | 100.00 Label list: 1 Abandoned: Abandoned for fear, violent acts in neighbourhood
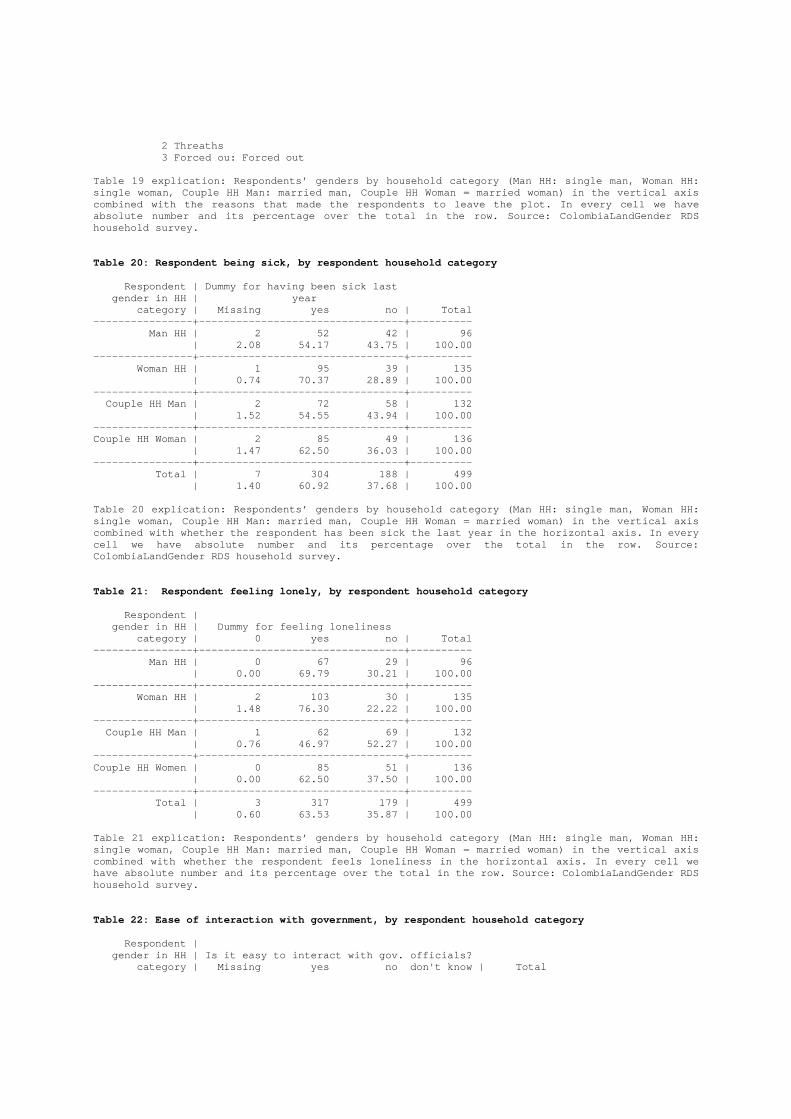
2 Threaths 3 Forced ou: Forced out Table 19 explication: Respondents’ genders by house hold category (Man HH: single man, Woman HH: single woman, Couple HH Man: married man, Couple HH Woman = married woman) in the vertical axis combined with the reasons that made the respondents to leave the plot. In every cell we have absolute number and its percentage over the total i n the row. Source: ColombiaLandGender RDS household survey. Table 20: Respondent being sick, by respondent hous ehold category Respondent | Dummy for having been sick last gender in HH | year category | Missing yes no | Total ----------------+---------------------------------+ ---------- Man HH | 2 52 42 | 96 | 2.08 54.17 43.75 | 100.00 ----------------+---------------------------------+ ---------- Woman HH | 1 95 39 | 135 | 0.74 70.37 28.89 | 100.00 ----------------+---------------------------------+ ---------- Couple HH Man | 2 72 58 | 132 | 1.52 54.55 43.94 | 100.00 ----------------+---------------------------------+ ---------- Couple HH Woman | 2 85 49 | 136 | 1.47 62.50 36.03 | 100.00 ----------------+---------------------------------+ ---------- Total | 7 304 188 | 499 | 1.40 60.92 37.68 | 100.00 Table 20 explication: Respondents’ genders by house hold category (Man HH: single man, Woman HH: single woman, Couple HH Man: married man, Couple HH Woman = married woman) in the vertical axis combined with whether the respondent has been sick the last year in the horizontal axis. In every cell we have absolute number and its percentage ove r the total in the row. Source: ColombiaLandGender RDS household survey. Table 21: Respondent feeling lonely, by respondent household category Respondent | gender in HH | Dummy for feeling loneliness category | 0 yes no | Total ----------------+---------------------------------+ ---------- Man HH | 0 67 29 | 96 | 0.00 69.79 30.21 | 100.00 ----------------+---------------------------------+ ---------- Woman HH | 2 103 30 | 135 | 1.48 76.30 22.22 | 100.00 ----------------+---------------------------------+ ---------- Couple HH Man | 1 62 69 | 132 | 0.76 46.97 52.27 | 100.00 ----------------+---------------------------------+ ---------- Couple HH Women | 0 85 51 | 136 | 0.00 62.50 37.50 | 100.00 ----------------+---------------------------------+ ---------- Total | 3 317 179 | 499 | 0.60 63.53 35.87 | 100.00 Table 21 explication: Respondents’ genders by house hold category (Man HH: single man, Woman HH: single woman, Couple HH Man: married man, Couple HH Woman = married woman) in the vertical axis combined with whether the respondent feels loneline ss in the horizontal axis. In every cell we have absolute number and its percentage over the to tal in the row. Source: ColombiaLandGender RDS household survey. Table 22: Ease of interaction with government, by r espondent household category Respondent | gender in HH | Is it easy to interact with gov. officials? category | Missing yes no don't know | Total
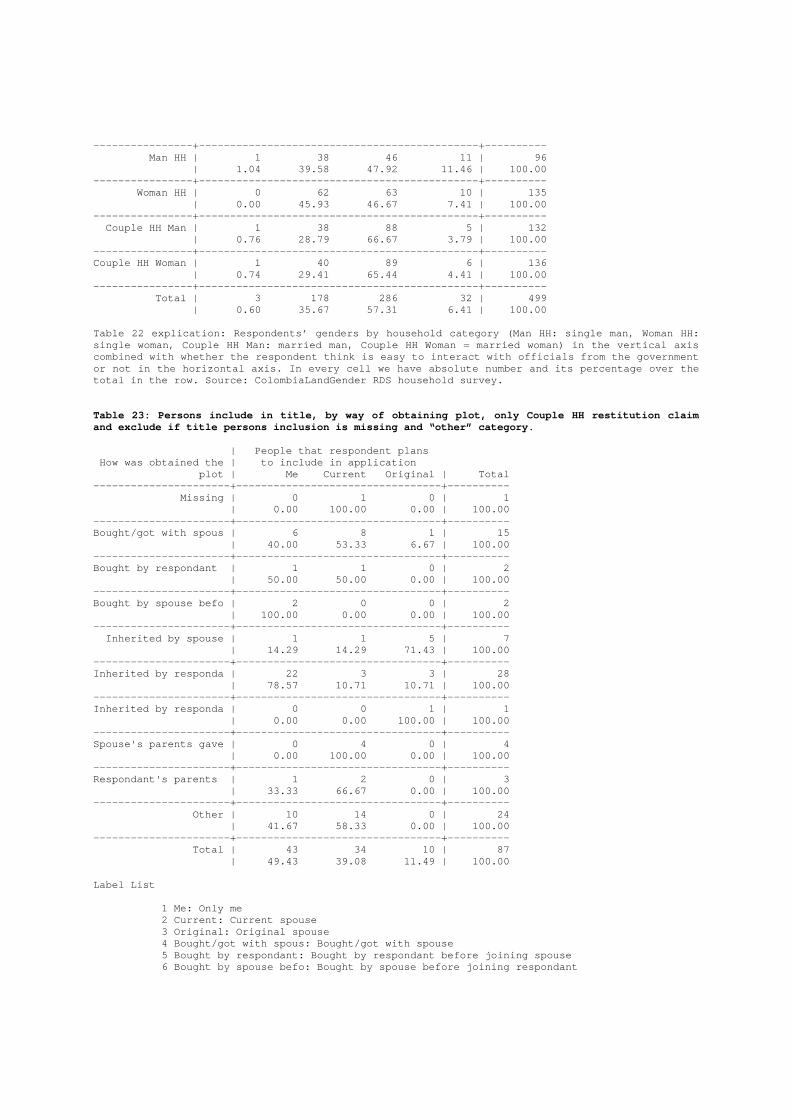
----------------+---------------------------------- -----------+---------- Man HH | 1 38 46 11 | 96 | 1.04 39.58 47.92 11.46 | 100.00 ----------------+---------------------------------- -----------+---------- Woman HH | 0 62 63 10 | 135 | 0.00 45.93 46.67 7.41 | 100.00 ----------------+---------------------------------- -----------+---------- Couple HH Man | 1 38 88 5 | 132 | 0.76 28.79 66.67 3.79 | 100.00 ----------------+---------------------------------- -----------+---------- Couple HH Woman | 1 40 89 6 | 136 | 0.74 29.41 65.44 4.41 | 100.00 ----------------+---------------------------------- -----------+---------- Total | 3 178 286 32 | 499 | 0.60 35.67 57.31 6.41 | 100.00 Table 22 explication: Respondents’ genders by house hold category (Man HH: single man, Woman HH: single woman, Couple HH Man: married man, Couple HH Woman = married woman) in the vertical axis combined with whether the respondent think is easy to interact with officials from the government or not in the horizontal axis. In every cell we hav e absolute number and its percentage over the total in the row. Source: ColombiaLandGender RDS ho usehold survey. Table 23: Persons include in title, by way of obtai ning plot, only Couple HH restitution claim and exclude if title persons inclusion is missing a nd “other” category. | People that respondent pl ans How was obtained the | to include in applicatio n plot | Me Current Orig inal | Total ----------------------+---------------------------- -----+---------- Missing | 0 1 0 | 1 | 0.00 100.00 0.00 | 100.00 ----------------------+---------------------------- -----+---------- Bought/got with spous | 6 8 1 | 15 | 40.00 53.33 6.67 | 100.00 ----------------------+---------------------------- -----+---------- Bought by respondant | 1 1 0 | 2 | 50.00 50.00 0.00 | 100.00 ----------------------+---------------------------- -----+---------- Bought by spouse befo | 2 0 0 | 2 | 100.00 0.00 0.00 | 100.00 ----------------------+---------------------------- -----+---------- Inherited by spouse | 1 1 5 | 7 | 14.29 14.29 7 1.43 | 100.00 ----------------------+---------------------------- -----+---------- Inherited by responda | 22 3 3 | 28 | 78.57 10.71 1 0.71 | 100.00 ----------------------+---------------------------- -----+---------- Inherited by responda | 0 0 1 | 1 | 0.00 0.00 10 0.00 | 100.00 ----------------------+---------------------------- -----+---------- Spouse's parents gave | 0 4 0 | 4 | 0.00 100.00 0.00 | 100.00 ----------------------+---------------------------- -----+---------- Respondant's parents | 1 2 0 | 3 | 33.33 66.67 0.00 | 100.00 ----------------------+---------------------------- -----+---------- Other | 10 14 0 | 24 | 41.67 58.33 0.00 | 100.00 ----------------------+---------------------------- -----+---------- Total | 43 34 10 | 87 | 49.43 39.08 1 1.49 | 100.00 Label List 1 Me: Only me 2 Current: Current spouse 3 Original: Original spouse 4 Bought/got with spous: Bought/got with spouse 5 Bought by respondant: Bought by respon dant before joining spouse 6 Bought by spouse befo: Bought by spous e before joining respondant

7 Bought by respondant's parents 8 Bought the allotment and built on it 9 Inherited by spouse 10 Inherited by responda: Inherited by re spondant 11 Inherited by respondant after joining spouse 12 Spouse's parents gave: Spouse's parent s gave it to respondant and spouse 13 Respondant's parents: Respondant's par ents gave it to respondant and spouse 14 Other Table 23 explication: (Group: Those that have appli ed or plan to apply and are currently in a couple) How was the main plot obtained in the verti cal axis combined with who is he planning to include at the restitution process application in t he horizontal axis. In every cell we have absolute number and its percentage over the total i n the row. Source: ColombiaLandGender RDS household survey. Table 24 Who included in title by gender of respond ent, if land inherited by respondent in Couple HH | People that respondant plans to sex of the | to include in application respondant | Me Current Original | Total -----------+---------------------------------+----- ----- man | 11 2 3 | 16 | 68.75 12.50 18.75 | 1 00.00 -----------+---------------------------------+----- ----- woman | 11 1 0 | 12 | 91.67 8.33 0.00 | 1 00.00 -----------+---------------------------------+----- ----- Total | 22 3 3 | 28 | 78.57 10.71 10.71 | 1 00.00 Label List 1 Me: Only me 2 Current: Current spouse 3 Original: Original spouse Table 24 explication: Sex of the respondent of in v ertical axis combined with who it is planning to include at the restitution process application i n the horizontal axis. In every cell we have absolute number and its percentage over the total i n the row. Source: ColombiaLandGender RDS household survey. Table 25. Woman going alone to store, by sex and HH type, exclude 0 Can women | go alone | to the | Respondent gender in HH cate gory store? | Man HH Woman HH Couple HH Man Couple HH Woman | Total -----------+--------------------------------------- ----------------+---------- yes | 77 118 117 125 | 437 | 88.51 92.91 89.31 92.59 | 91.04 -----------+--------------------------------------- ----------------+---------- no | 10 9 14 10 | 43 | 11.49 7.09 10.69 7.41 | 8.96 -----------+--------------------------------------- ----------------+---------- Total | 87 127 131 135 | 480 | 100.00 100.00 100.00 100.00 | 100.00 Table 25 explication: (Group: All respondents, excl uded those that not answered whether a woman can go alone to the store or not) Dummy for whether a woman can go alone to the store or not in the vertical axis combined with the respondents’ ge nders by household category (Man HH: single man, Woman HH: single woman, Couple HH Man: married man, Couple HH Woman = married woman) in the horizontal axis. In every cell we have absolute num ber and its percentage over the total in the column. Source: ColombiaLandGender RDS household su rvey. Table 26. Woman should obey man excluded missing, b y sex and HH type. Should |
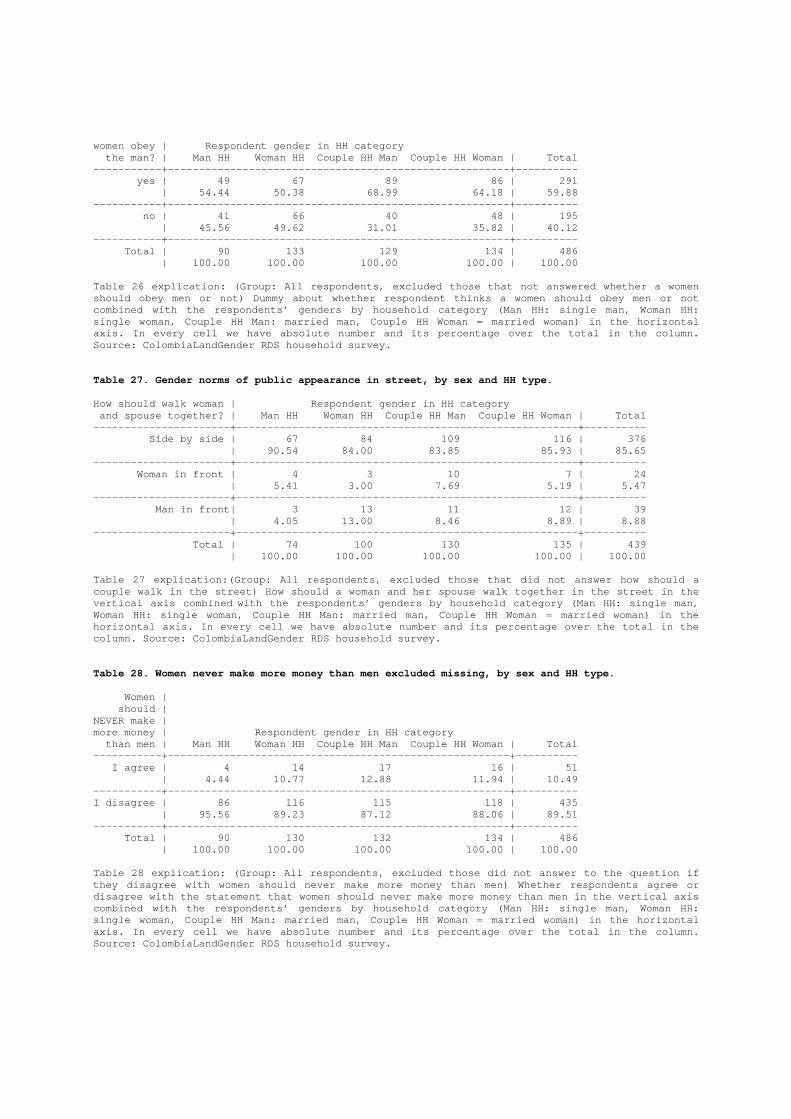
women obey | Respondent gender in HH category the man? | Man HH Woman HH Couple HH Man Couple HH Woman | Total -----------+--------------------------------------- ----------------+---------- yes | 49 67 89 86 | 291 | 54.44 50.38 68.99 64.18 | 59.88 -----------+--------------------------------------- ----------------+---------- no | 41 66 40 48 | 195 | 45.56 49.62 31.01 35.82 | 40.12 -----------+--------------------------------------- ----------------+---------- Total | 90 133 129 134 | 486 | 100.00 100.00 100.00 100.00 | 100.00 Table 26 explication: (Group: All respondents, excl uded those that not answered whether a women should obey men or not) Dummy about whether respond ent thinks a women should obey men or not combined with the respondents’ genders by household category (Man HH: single man, Woman HH: single woman, Couple HH Man: married man, Couple HH Woman = married woman) in the horizontal axis. In every cell we have absolute number and its percentage over the total in the column. Source: ColombiaLandGender RDS household survey. Table 27. Gender norms of public appearance in stre et, by sex and HH type. How should walk woman | Respondent gende r in HH category and spouse together? | Man HH Woman HH Coup le HH Man Couple HH Woman | Total ----------------------+---------------------------- ---------------------------+---------- Side by side | 67 84 109 116 | 376 | 90.54 84.00 83.85 85.93 | 85.65 ----------------------+---------------------------- ---------------------------+---------- Woman in front | 4 3 10 7 | 24 | 5.41 3.00 7.69 5.19 | 5.47 ----------------------+---------------------------- ---------------------------+---------- Man in front| 3 13 11 12 | 39 | 4.05 13.00 8.46 8.89 | 8.88 ----------------------+---------------------------- ---------------------------+---------- Total | 74 100 130 135 | 439 | 100.00 100.00 100.00 100.00 | 100.00 Table 27 explication:(Group: All respondents, exclu ded those that did not answer how should a couple walk in the street) How should a woman and h er spouse walk together in the street in the vertical axis combined with the respondents’ genders by household category (Man HH: single man, Woman HH: single woman, Couple HH Man: married man, Couple HH Woman = married woman) in the horizontal axis. In every cell we have absolute num ber and its percentage over the total in the column. Source: ColombiaLandGender RDS household su rvey. Table 28. Women never make more money than men excl uded missing, by sex and HH type. Women | should | NEVER make | more money | Respondent gender in HH c ategory than men | Man HH Woman HH Couple HH Man Couple HH Woman | Total -----------+--------------------------------------- ----------------+---------- I agree | 4 14 17 16 | 51 | 4.44 10.77 12.88 11.94 | 10.49 -----------+--------------------------------------- ----------------+---------- I disagree | 86 116 115 118 | 435 | 95.56 89.23 87.12 88.06 | 89.51 -----------+--------------------------------------- ----------------+---------- Total | 90 130 132 134 | 486 | 100.00 100.00 100.00 100.00 | 100.00 Table 28 explication: (Group: All respondents, excl uded those did not answer to the question if they disagree with women should never make more mon ey than men) Whether respondents agree or disagree with the statement that women should never make more money than men in the vertical axis combined with the respondents’ genders by household category (Man HH: single man, Woman HH: single woman, Couple HH Man: married man, Couple HH Woman = married woman) in the horizontal axis. In every cell we have absolute number and its percentage over the total in the column. Source: ColombiaLandGender RDS household survey.

Table 29. Initiative to buy school supplies, exclud ed missing, by HH category. who had | INITIATIVE | Respondent gender in HH category school | Man HH Woman HH Couple HH Man Couple HH Woman | Total ------------+-------------------------------------- -----------------+---------- Man | 24 2 21 6 | 53 | 70.59 2.82 30.88 7.14 | 20.62 ------------+-------------------------------------- -----------------+---------- Woman | 3 64 17 50 | 134 | 8.82 90.14 25.00 59.52 | 52.14 ------------+-------------------------------------- -----------------+---------- Both/couple | 3 2 23 24 | 52 | 8.82 2.82 33.82 28.57 | 20.23 ------------+-------------------------------------- -----------------+---------- Other | 4 3 7 4 | 18 | 11.76 4.23 10.29 4.76 | 7.00 ------------+-------------------------------------- -----------------+---------- Total | 34 71 68 84 | 257 | 100.00 100.00 100.00 100.00 | 100.00 Table 29 explication: (Group: Those that bought sch ool supplies, excluded missing) Who took the initiative to buy the school supplies in the vertic al axis combined with the respondents’ genders by household category (Man HH: single man, Woman HH : single woman, Couple HH Man: married man, Couple HH Woman = married woman) in the horizontal axis. In every cell we have absolute number and its percentage over the total in the column. So urce: ColombiaLandGender RDS household survey. Table 30. Decision to buy school supplies, excluded missing, by HH category who took | DECISION | Respondent gender in HH category school | Man HH Woman HH Couple HH Man Couple HH Woman | Total ------------+-------------------------------------- -----------------+---------- Man | 25 1 25 8 | 59 | 73.53 1.43 37.31 9.52 | 23.14 ------------+-------------------------------------- -----------------+---------- Woman | 3 62 17 50 | 132 | 8.82 88.57 25.37 59.52 | 51.76 ------------+-------------------------------------- -----------------+---------- Both/couple | 3 6 21 21 | 51 | 8.82 8.57 31.34 25.00 | 20.00 ------------+-------------------------------------- -----------------+---------- Other | 3 1 4 5 | 13 | 8.82 1.43 5.97 5.95 | 5.10 ------------+-------------------------------------- -----------------+---------- Total | 34 70 67 84 | 255 | 100.00 100.00 100.00 100.00 | 100.00 Table 30 explication: (Group: Those that bought sch ool supplies, excluded missing) Who made the decision to buy the school supplies in the vertical axis combined with the respondents’ genders by household category (Man HH: single man, Woman HH : single woman, Couple HH Man: married man, Couple HH Woman = married woman) in the horizontal axis. In every cell we have absolute number and its percentage over the total in the column. So urce: ColombiaLandGender RDS household survey. Table 31. Initiative to pay fee children school, ex cluded missing, by HH category. who had | INITIATIVE | Respondent gender in HH category fee | Man HH Woman HH Couple HH Man Couple HH Woman | Total ------------+-------------------------------------- -----------------+---------- Man | 8 1 8 0 | 17 | 66.67 6.25 36.36 0.00 | 21.25 ------------+-------------------------------------- -----------------+---------- Woman | 1 14 4 16 | 35 | 8.33 87.50 18.18 53.33 | 43.75 ------------+-------------------------------------- -----------------+---------- Both/couple | 1 1 9 13 | 24 | 8.33 6.25 40.91 43.33 | 30.00 ------------+-------------------------------------- -----------------+----------

Other | 2 0 1 1 | 4 | 16.67 0.00 4.55 3.33 | 5.00 ------------+-------------------------------------- -----------------+---------- Total | 12 16 22 30 | 80 | 100.00 100.00 100.00 100.00 | 100.00 Table 31 explication: (Group: Those that paid the e nrolment fee for children’s education, excluded missing) Who took the initiative to pay th e enrolment fee for children’s education in the vertical axis combined with the respondents’ ge nders by household category (Man HH: single man, Woman HH: single woman, Couple HH Man: married man, Couple HH Woman = married woman) in the horizontal axis. In every cell we have absolute num ber and its percentage over the total in the column. Source: ColombiaLandGender RDS household su rvey. Table 32. Decision to pay fee children school, excl uded missing, by HH category. who took | DECISION | Respondent gender in HH category fee | Man HH Woman HH Couple HH Man Couple HH Woman | Total ------------+-------------------------------------- -----------------+---------- Man | 9 1 5 1 | 16 | 75.00 6.25 22.73 3.33 | 20.00 ------------+-------------------------------------- -----------------+---------- Woman | 1 13 5 14 | 33 | 8.33 81.25 22.73 46.67 | 41.25 ------------+-------------------------------------- -----------------+---------- Both/couple | 1 2 10 13 | 26 | 8.33 12.50 45.45 43.33 | 32.50 ------------+-------------------------------------- -----------------+---------- Other | 1 0 2 2 | 5 | 8.33 0.00 9.09 6.67 | 6.25 ------------+-------------------------------------- -----------------+---------- Total | 12 16 22 30 | 80 | 100.00 100.00 100.00 100.00 | 100.00 Table 32 explication: (Group: Those that paid the e nrolment fee for children’s education, excluded missing) Who made the decision to pay the enrolment fee for children’s education in the vertical axis combined with the respondents’ gender s by household category (Man HH: single man, Woman HH: single woman, Couple HH Man: married man, Couple HH Woman = married woman) in the horizontal axis. In every cell we have absolute num ber and its percentage over the total in the column. Source: ColombiaLandGender RDS household su rvey. Table 33. Initiative to buy alcohol, excluded missi ng, by HH category who had | INITIATIVE | Respondent gender in HH category alcohol | Man HH Woman HH Couple HH Man Couple HH Woman | Total ------------+-------------------------------------- -----------------+---------- Man | 18 0 26 3 | 47 | 94.74 0.00 86.67 20.00 | 69.12 ------------+-------------------------------------- -----------------+---------- Woman | 0 4 2 7 | 13 | 0.00 100.00 6.67 46.67 | 19.12 ------------+-------------------------------------- -----------------+---------- Both/couple | 0 0 2 4 | 6 | 0.00 0.00 6.67 26.67 | 8.82 ------------+-------------------------------------- -----------------+---------- Other | 1 0 0 1 | 2 | 5.26 0.00 0.00 6.67 | 2.94 ------------+-------------------------------------- -----------------+---------- Total | 19 4 30 15 | 68 | 100.00 100.00 100.00 100.00 | 100.00 Table 33 explication: (Group: Those that bought alc ohol, excluded missing) Who took the initiative to buy the alcohol in the vertical axis combined with the respondents’ genders by household category (Man HH: single man, Woman HH: s ingle woman, Couple HH Man: married man, Couple HH Woman = married woman) in the horizontal axis. In every cell we have absolute number and its percentage over the total in the column. So urce: ColombiaLandGender RDS household survey.

Table 34. Decision to buy alcohol, excluded missing , by HH category. who took | DECISION | Respondent gender in HH category alcohol | Man HH Woman HH Couple HH Man Couple HH Woman | Total ------------+-------------------------------------- -----------------+---------- Man | 18 0 25 3 | 46 | 94.74 0.00 86.21 20.00 | 68.66 ------------+-------------------------------------- -----------------+---------- Woman | 0 3 2 8 | 13 | 0.00 75.00 6.90 53.33 | 19.40 ------------+-------------------------------------- -----------------+---------- Both/couple | 0 1 2 4 | 7 | 0.00 25.00 6.90 26.67 | 10.45 ------------+-------------------------------------- -----------------+---------- Other | 1 0 0 0 | 1 | 5.26 0.00 0.00 0.00 | 1.49 ------------+-------------------------------------- -----------------+---------- Total | 19 4 29 15 | 67 | 100.00 100.00 100.00 100.00 | 100.00 Table 34 explication: (Group: Those that bought alc ohol, excluded missing) Who made the decision to buy alcohol in the vertical axis combined with t he respondents’ genders by household category (Man HH: single man, Woman HH: single woman, Couple HH Man: married man, Couple HH Woman = married woman) in the horizontal axis. In every cel l we have absolute number and its percentage over the total in the column. Source: ColombiaLandG ender RDS household survey. Table 35. Initiative to purchase in general, exclud ed missing, by HH category. who had | INITIATIVE | Respondent gender in HH c ategory general | Man HH Woman HH Couple HH Man Couple HH Woman | Total ------------+-------------------------------------- -----------------+---------- Man | 32 10 27 8 | 77 | 78.05 13.51 34.18 10.96 | 28.84 ------------+-------------------------------------- -----------------+---------- Woman | 2 55 13 51 | 121 | 4.88 74.32 16.46 69.86 | 45.32 ------------+-------------------------------------- -----------------+---------- Both/couple | 6 7 37 13 | 63 | 14.63 9.46 46.84 17.81 | 23.60 ------------+-------------------------------------- -----------------+---------- other | 1 2 2 1 | 6 | 2.44 2.70 2.53 1.37 | 2.25 ------------+-------------------------------------- -----------------+---------- Total | 41 74 79 73 | 267 | 100.00 100.00 100.00 100.00 | 100.00 Table 35 explication: (Group: Those that bought thi ngs in general, excluded missing) Who took the initiative to buy things in general in the vertical axis combined with the respondents’ genders by household category (Man HH: single man, Woman HH : single woman, Couple HH Man: married man, Couple HH Woman = married woman) in the horizontal axis. In every cell we have absolute number and its percentage over the total in the column. So urce: ColombiaLandGender RDS household survey. Table 36. Decision to purchase in general, excluded missing, by HH category. who took | DECISION | Respondent gender in HH c ategory general | Man HH Woman HH Couple HH Man Couple HH Woman | Total ------------+-------------------------------------- -----------------+---------- Man | 31 3 25 9 | 68 | 75.61 4.11 32.47 12.50 | 25.86 ------------+-------------------------------------- -----------------+---------- Woman | 1 57 16 49 | 123 | 2.44 78.08 20.78 68.06 | 46.77 ------------+-------------------------------------- -----------------+---------- Both/couple | 6 11 35 13 | 65 | 14.63 15.07 45.45 18.06 | 24.71 ------------+-------------------------------------- -----------------+----------

Other | 3 2 1 1 | 7 | 7.32 2.74 1.30 1.39 | 2.66 ------------+-------------------------------------- -----------------+---------- Total | 41 73 77 72 | 263 | 100.00 100.00 100.00 100.00 | 100.00 Table 36 explication: (Group: Those that bought thi ngs in general, excluded missing) Who made the decision to buy things in general in the vertical a xis combined with the respondents’ genders by household category (Man HH: single man, Woman HH: s ingle woman, Couple HH Man: married man, Couple HH Woman = married woman) in the horizontal axis. In every cell we have absolute number and its percentage over the total in the column. So urce: ColombiaLandGender RDS household survey. Table 37. Initiative investing lote for house, excl uded missing, by HH category who had | INITIATIVE | Respondent gender in HH cat egory lote | Man HH Woman HH Couple HH Man Couple HH Woman | Total ------------+-------------------------------------- -----------------+---------- Man | 2 0 5 1 | 8 | 66.67 0.00 62.50 10.00 | 33.33 ------------+-------------------------------------- -----------------+---------- Woman | 0 2 0 6 | 8 | 0.00 66.67 0.00 60.00 | 33.33 ------------+-------------------------------------- -----------------+---------- Both/couple | 1 1 2 2 | 6 | 33.33 33.33 25.00 20.00 | 25.00 ------------+-------------------------------------- -----------------+---------- Other | 0 0 1 1 | 2 | 0.00 0.00 12.50 10.00 | 8.33 ------------+-------------------------------------- -----------------+---------- Total | 3 3 8 10 | 24 | 100.00 100.00 100.00 100.00 | 100.00 Table 37 explication: (Group: Those that invested o n a lote for the house, excluded missing) Who took the initiative to invest on a lote for the hou se in the vertical axis combined with the respondents’ genders by household category (Man HH: single man, Woman HH: single woman, Couple HH Man: married man, Couple HH Woman = married woman) in the horizontal axis. In every cell we have absolute number and its percentage over the total i n the column. Source: ColombiaLandGender RDS household survey. Table 38. Decision investing lote for house, exclud ed missing, by HH category who took | DECISION | Respondent gender in HH cat egory lote | Man HH Woman HH Couple HH Man Couple HH Woman | Total ------------+-------------------------------------- -----------------+---------- Man | 2 0 5 2 | 9 | 66.67 0.00 62.50 20.00 | 37.50 ------------+-------------------------------------- -----------------+---------- Woman | 0 3 1 4 | 8 | 0.00 100.00 12.50 40.00 | 33.33 ------------+-------------------------------------- -----------------+---------- Both/couple | 1 0 2 3 | 6 | 33.33 0.00 25.00 30.00 | 25.00 ------------+-------------------------------------- -----------------+---------- Other | 0 0 0 1 | 1 | 0.00 0.00 0.00 10.00 | 4.17 ------------+-------------------------------------- -----------------+---------- Total | 3 3 8 10 | 24 | 100.00 100.00 100.00 100.00 | 100.00 Table 38 explication: (Group: Those that invested o n a lote for the house, excluded missing) Who decided to invest on a lote for the house in the ve rtical axis combined with the respondents’ genders by household category (Man HH: single man, Woman HH: single woman, Couple HH Man: married man, Couple HH Woman = married woman) in the horizo ntal axis. In every cell we have absolute number and its percentage over the total in the col umn. Source: ColombiaLandGender RDS household survey.

Table 39. Initiative to invest in housing, excluded missing, by HH category who had | INITIATIVE | Respondent gender in HH cat egory house | Man HH Woman HH Couple HH Man Couple HH Woman | Total ------------+-------------------------------------- -----------------+---------- Man | 1 0 2 1 | 4 | 50.00 0.00 40.00 11.11 | 20.00 ------------+-------------------------------------- -----------------+---------- Woman | 0 4 0 6 | 10 | 0.00 100.00 0.00 66.67 | 50.00 ------------+-------------------------------------- -----------------+---------- Both/couple | 1 0 3 2 | 6 | 50.00 0.00 60.00 22.22 | 30.00 ------------+-------------------------------------- -----------------+---------- Total | 2 4 5 9 | 20 | 100.00 100.00 100.00 100.00 | 100.00 Table 39 explication: (Group: Those that invested o n a housing, excluded missing) Who took the initiative to invest on housing in the vertical axi s combined with the respondents’ genders by household category (Man HH: single man, Woman HH: s ingle woman, Couple HH Man: married man, Couple HH Woman = married woman) in the horizontal axis. In every cell we have absolute number and its percentage over the total in the column. So urce: ColombiaLandGender RDS household survey. Table 40. Decision to invest in housing, excluded m issing, by HH category who took | DECISION | Respondent gender in HH cat egory house | Man HH Woman HH Couple HH Man Couple HH Woman | Total ------------+-------------------------------------- -----------------+---------- Man | 1 0 3 2 | 6 | 50.00 0.00 60.00 22.22 | 30.00 ------------+-------------------------------------- -----------------+---------- Woman | 0 4 0 5 | 9 | 0.00 100.00 0.00 55.56 | 45.00 ------------+-------------------------------------- -----------------+---------- Both/couple | 0 0 2 2 | 4 | 0.00 0.00 40.00 22.22 | 20.00 ------------+-------------------------------------- -----------------+---------- Other | 1 0 0 0 | 1 | 50.00 0.00 0.00 0.00 | 5.00 ------------+-------------------------------------- -----------------+---------- Total | 2 4 5 9 | 20 | 100.00 100.00 100.00 100.00 | 100.00 Table 40 explication: (Group: Those that invested o n housing, excluded missing) Who decided to invest on a housing in the vertical axis combined w ith the respondents’ genders by household category (Man HH: single man, Woman HH: single woma n, Couple HH Man: married man, Couple HH Woman = married woman) in the horizontal axis. In every c ell we have absolute number and its percentage over the total in the column. Source: ColombiaLandG ender RDS household survey. Table 41. Initiative to invest in materials, exclud ed missing, by HH category who had | INITIATIVE | Respondent gender in HH cat egory material | Man HH Woman HH Couple HH Man Couple HH Woman | Total ------------+-------------------------------------- -----------------+---------- Man | 5 1 12 1 | 19 | 62.50 6.67 57.14 4.17 | 27.94 ------------+-------------------------------------- -----------------+---------- Woman | 1 13 0 11 | 25 | 12.50 86.67 0.00 45.83 | 36.76 ------------+-------------------------------------- -----------------+---------- Both/couple | 1 1 6 12 | 20 | 12.50 6.67 28.57 50.00 | 29.41 ------------+-------------------------------------- -----------------+---------- Other | 1 0 3 0 | 4 | 12.50 0.00 14.29 0.00 | 5.88 ------------+-------------------------------------- -----------------+----------
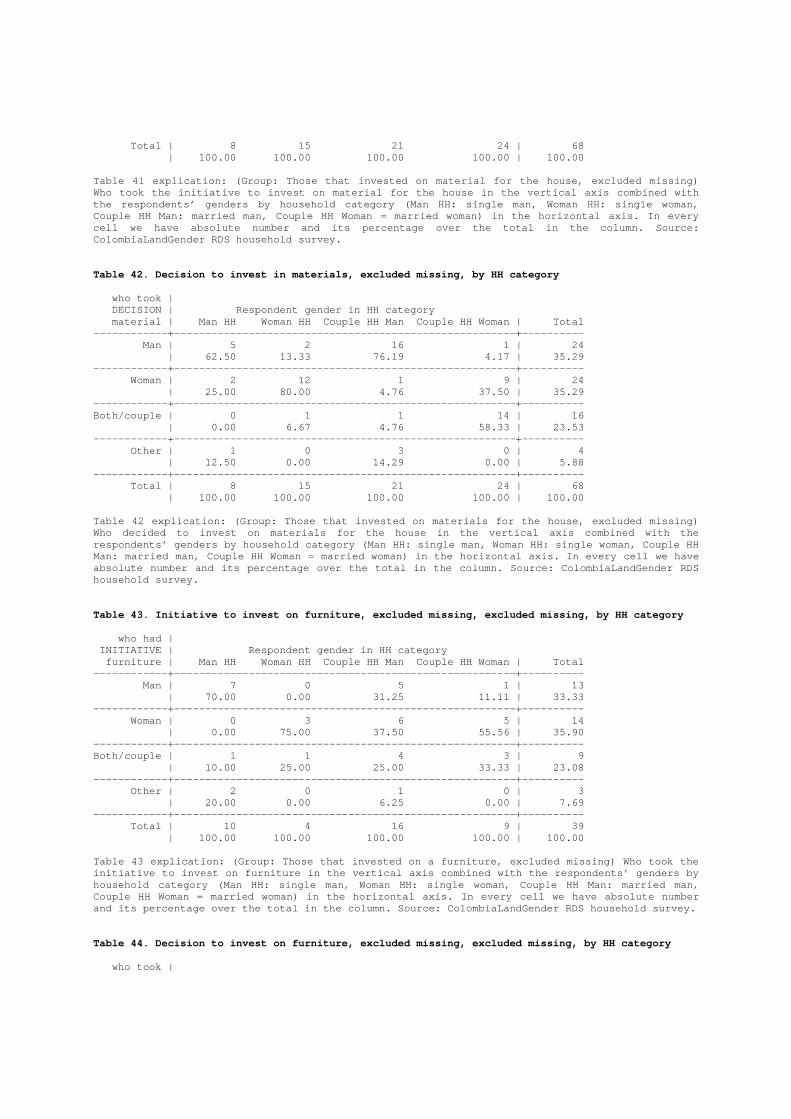
Total | 8 15 21 24 | 68 | 100.00 100.00 100.00 100.00 | 100.00 Table 41 explication: (Group: Those that invested o n material for the house, excluded missing) Who took the initiative to invest on material for t he house in the vertical axis combined with the respondents’ genders by household category (Man HH: single man, Woman HH: single woman, Couple HH Man: married man, Couple HH Woman = marri ed woman) in the horizontal axis. In every cell we have absolute number and its percentage ove r the total in the column. Source: ColombiaLandGender RDS household survey. Table 42. Decision to invest in materials, excluded missing, by HH category who took | DECISION | Respondent gender in HH cate gory material | Man HH Woman HH Couple HH Man Couple HH Woman | Total ------------+-------------------------------------- -----------------+---------- Man | 5 2 16 1 | 24 | 62.50 13.33 76.19 4.17 | 35.29 ------------+-------------------------------------- -----------------+---------- Woman | 2 12 1 9 | 24 | 25.00 80.00 4.76 37.50 | 35.29 ------------+-------------------------------------- -----------------+---------- Both/couple | 0 1 1 14 | 16 | 0.00 6.67 4.76 58.33 | 23.53 ------------+-------------------------------------- -----------------+---------- Other | 1 0 3 0 | 4 | 12.50 0.00 14.29 0.00 | 5.88 ------------+-------------------------------------- -----------------+---------- Total | 8 15 21 24 | 68 | 100.00 100.00 100.00 100.00 | 100.00 Table 42 explication: (Group: Those that invested o n materials for the house, excluded missing) Who decided to invest on materials for the house in the vertical axis combined with the respondents’ genders by household category (Man HH: single man, Woman HH: single woman, Couple HH Man: married man, Couple HH Woman = married woman) in the horizontal axis. In every cell we have absolute number and its percentage over the total i n the column. Source: ColombiaLandGender RDS household survey. Table 43. Initiative to invest on furniture, exclud ed missing, excluded missing, by HH category who had | INITIATIVE | Respondent gender in HH ca tegory furniture | Man HH Woman HH Couple HH Man Couple HH Woman | Total ------------+-------------------------------------- -----------------+---------- Man | 7 0 5 1 | 13 | 70.00 0.00 31.25 11.11 | 33.33 ------------+-------------------------------------- -----------------+---------- Woman | 0 3 6 5 | 14 | 0.00 75.00 37.50 55.56 | 35.90 ------------+-------------------------------------- -----------------+---------- Both/couple | 1 1 4 3 | 9 | 10.00 25.00 25.00 33.33 | 23.08 ------------+-------------------------------------- -----------------+---------- Other | 2 0 1 0 | 3 | 20.00 0.00 6.25 0.00 | 7.69 ------------+-------------------------------------- -----------------+---------- Total | 10 4 16 9 | 39 | 100.00 100.00 100.00 100.00 | 100.00 Table 43 explication: (Group: Those that invested o n a furniture, excluded missing) Who took the initiative to invest on furniture in the vertical a xis combined with the respondents’ genders by household category (Man HH: single man, Woman HH: s ingle woman, Couple HH Man: married man, Couple HH Woman = married woman) in the horizontal axis. In every cell we have absolute number and its percentage over the total in the column. So urce: ColombiaLandGender RDS household survey. Table 44. Decision to invest on furniture, excluded missing, excluded missing, by HH category who took |

DECISION | Respondent gender in HH cate gory furniture | Man HH Woman HH Couple HH Man Couple HH Woman | Total ------------+-------------------------------------- -----------------+---------- Man | 8 0 9 1 | 18 | 80.00 0.00 56.25 11.11 | 46.15 ------------+-------------------------------------- -----------------+---------- Woman | 0 3 3 4 | 10 | 0.00 75.00 18.75 44.44 | 25.64 ------------+-------------------------------------- -----------------+---------- Both/couple | 1 1 4 4 | 10 | 10.00 25.00 25.00 44.44 | 25.64 ------------+-------------------------------------- -----------------+---------- Other | 1 0 0 0 | 1 | 10.00 0.00 0.00 0.00 | 2.56 ------------+-------------------------------------- -----------------+---------- Total | 10 4 16 9 | 39 | 100.00 100.00 100.00 100.00 | 100.00 Table 44 explication: (Group: Those that invested o n furniture, excluded missing) Who decided to invest on furniture in the vertical axis combined w ith the respondents’ genders by household category (Man HH: single man, Woman HH: single woma n, Couple HH Man: married man, Couple HH Woman = married woman) in the horizontal axis. In every c ell we have absolute number and its percentage over the total in the column. Source: ColombiaLandG ender RDS household survey. Table 45. Initiative to invest on cart, excluded mi ssing by HH category who had | INITIATIVE | Respondent gender in HH cate gory transport | Man HH Woman HH Couple HH Man Couple HH Woman | Total ------------+-------------------------------------- -----------------+---------- Man | 2 0 2 3 | 7 | 100.00 0.00 66.67 42.86 | 53.85 ------------+-------------------------------------- -----------------+---------- Woman | 0 1 0 3 | 4 | 0.00 100.00 0.00 42.86 | 30.77 ------------+-------------------------------------- -----------------+---------- Both/couple | 0 0 1 0 | 1 | 0.00 0.00 33.33 0.00 | 7.69 ------------+-------------------------------------- -----------------+---------- Other | 0 0 0 1 | 1 | 0.00 0.00 0.00 14.29 | 7.69 ------------+-------------------------------------- -----------------+---------- Total | 2 1 3 7 | 13 | 100.00 100.00 100.00 100.00 | 100.00 Table 45 explication: (Group: Those that invested o n a cart or animals for transport, excluded missing) Who took the initiative to invest on a car t or animals for transport in the vertical axis combined with the respondents’ genders by hous ehold category (Man HH: single man, Woman HH: single woman, Couple HH Man: married man, Couple HH Woman = married woman) in the horizontal axis. In every cell we have absolute number and its percentage over the total in the column. Source: ColombiaLandGender RDS household survey. Table 46. Decision to invest on a cart, excluded mi ssing, by HH category. who took | DECISION | Respondent gender in HH categ ory transport | Man HH Woman HH Couple HH Man Couple HH Woman | Total ------------+-------------------------------------- -----------------+---------- Man | 1 0 2 4 | 7 | 100.00 0.00 66.67 57.14 | 58.33 ------------+-------------------------------------- -----------------+---------- Woman | 0 1 0 3 | 4 | 0.00 100.00 0.00 42.86 | 33.33 ------------+-------------------------------------- -----------------+---------- Both/couple | 0 0 1 0 | 1 | 0.00 0.00 33.33 0.00 | 8.33 ------------+-------------------------------------- -----------------+---------- Total | 1 1 3 7 | 12 | 100.00 100.00 100.00 100.00 | 100.00

Table 462 explication: (Group: Those that invested on a cart or animals for transport, excluded missing) Who decided to invest on a cart or animals for transport in the vertical axis combined with the respondents’ genders by household category (Man HH: single man, Woman HH: single woman, Couple HH Man: married man, Couple HH Woman = marri ed woman) in the horizontal axis. In every cell we have absolute number and its percentage ove r the total in the column. Source: ColombiaLandGender RDS household survey.