Embed Size (px)
Citation preview

Women in Agriculture:Marketing Tools
Mykel [email protected]‐532‐6925
Department of Ag Economicswww.agmanager.info

MARKETING TOOLSUnderstanding and using your

Outline
• Managing risk exposure
• Basis risk and hedging
• Avoiding basis risk – the forward contract
• Marketing plans and performance tracking

MANAGING RISK EXPOSURE

Managing Risk• Risk preferences vary across people
• How do growers limit production risk?– Crop insurance– Fertilizer/chemical application– Varietal selection
• How do we limit price risk?– Hedging – Forward contracting– Pray

Managing Risk
• Sources of price risk (cash and futures)– Domestic markets– International markets
• Sources of basis risk– Cash price: local markets– Futures market: lack of convergence
• None of these are under your control, so what can you do?
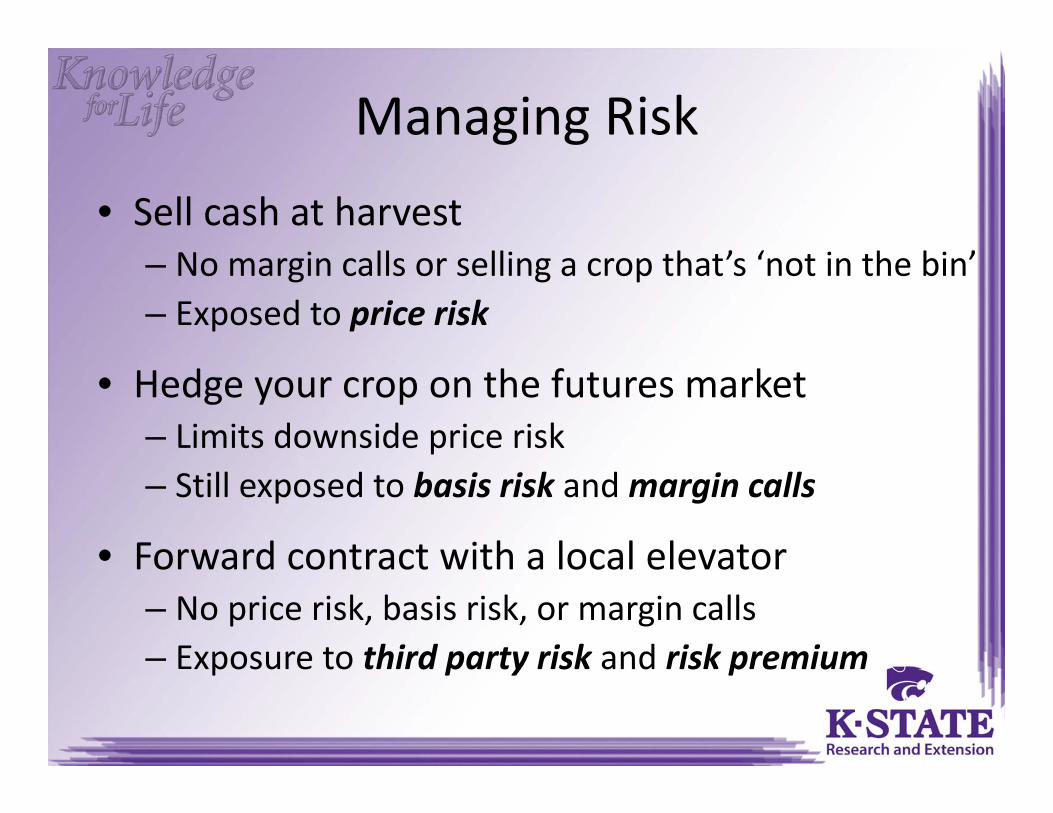
Managing Risk• Sell cash at harvest
– No margin calls or selling a crop that’s ‘not in the bin’– Exposed to price risk
• Hedge your crop on the futures market– Limits downside price risk– Still exposed to basis risk andmargin calls
• Forward contract with a local elevator– No price risk, basis risk, or margin calls– Exposure to third party risk and risk premium
BASIS RISK

Basis
• Basis defined
Cash Price – Nearby Futures Price = Basis
– Reflects costs of transporting to a terminal market
– Can be affected by local market conditions• Alternative uses: feedlots, bio‐fuel plants
– Can vary over space and time

Geographic Variation

Time Variation

Basis• “Every hedge is a cross‐hedge”
– Level of basis risk is a function of how close the cash and futures prices track
• HRW basis in Kansas– Tracks closely (especially with convergence)– Basis affected primarily by transportation costs
• Canola basis in Kansas– Doesn’t track Canadian canola board as closely– Additional risk exposure in currency market

Basis
• Hedging trades price risk for basis risk– Cash prices tend to be more volatile– Relative risk exposure is reduced
• Basis relationships for a given location tend to be stable over time:
expected basis = actual basis
• Is this the case today?

Historical Data 2005‐2011
‐$1.60
‐$1.40
‐$1.20
‐$1.00
‐$0.80
‐$0.60
‐$0.40
‐$0.20
$0.00Jan‐05 Jul‐05 Jan‐06 Jul‐06 Jan‐07 Jul‐07 Jan‐08 Jul‐08 Jan‐09 Jul‐09 Jan‐10 Jul‐10 Jan‐11
Beloit HRW Basis

Historical Data 2005‐2011
‐$1.60
‐$1.40
‐$1.20
‐$1.00
‐$0.80
‐$0.60
‐$0.40
‐$0.20
$0.00
Garden City HRW Basis

‐$1.40
‐$1.20
‐$1.00
‐$0.80
‐$0.60
‐$0.40
‐$0.20
$0.00
$0.20
$0.40
Topeka HRW Basis
Historical Data 2005‐2011

Historical Data 2005‐2011
0.324
0.144
0.2430.215
0.407
0.213
0.337
0.215
0.00
0.05
0.10
0.15
0.20
0.25
0.30
0.35
0.40
0.45
Soybeans Corn HRW Milo
Basis Standard DeviationPRE Years: 2005 to mid‐2008
POST Years: mid‐2008 to 2011

Historical Data 2005‐2011
KCBOT Settle Price KS Cash Price* Basis
Average 6.08 5.52 ‐0.56Minimum 3.15 2.81 ‐1.73Maximum 13.37 13.03 0.25Std. Deviation 2.05 1.92 0.39* Cash price is an average of 6 KS locations: Beloit, Garden City, Goodland, Hutchinson, Pittsburg, and Topeka.

Historical Data 2005‐2011
• Basis deviation is lower– Less volatile than either cash or futures prices
KCBOT Settle Price KS Cash Price* Basis
Average 6.08 5.52 ‐0.56Minimum 3.15 2.81 ‐1.73Maximum 13.37 13.03 0.25Std. Deviation 2.05 1.92 0.39* Cash price is an average of 6 KS locations: Beloit, Garden City, Goodland, Hutchinson, Pittsburg, and Topeka.

New Crop Hedge
• Example of new crop hedge– Sell a July wheat contract for some proportion of your expected wheat harvest
– Size of contract not to exceed your estimated harvest
– Take an offsetting position on that July contract prior to expiration
– Calculate your actual price received

Date15‐Feb Sell July wheat contract $9.25/bu1‐Jul Buy July wheat contract $8.85/bu
Futures gain + $0.40/buActual basis ‐ $0.60/buCommision costs ‐ $0.02/buActual cash sale price $8.63/bu
Price Decrease
New Crop Hedge
• Scenario 1– Price decrease at harvest
(Cash price = $8.25)
Additional revenue = $0.38/bu

Date15‐Feb Sell July wheat contract $9.25/bu1‐Jul Buy July wheat contract $9.65/bu
Futures loss ‐ $0.40/buActual basis ‐ $0.60/buCommision costs ‐ $0.02/buActual cash sale price $8.63/bu
Price Increase
New Crop Hedge
• Scenario 2– Price increase at harvest
(Cash price = $9.05)
Additional revenue = $0.00/buCost of risk protection = $0.42/bu

New Crop Hedge
• The hedge worked in both markets– The actual price received was $8.63/bu whether prices went up or down
– Key to successful hedge
expected basis = actual basis
• What happens if basis moves?– More volatile markets suggest expected and actual basis may not be equal

• Scenario 3– Harvest price decrease, basis widens
– Not a complete hedge, lost $.50/bu to basis risk
New Crop Hedge
(Cash price = $7.75)
Date15‐Feb Sell July wheat contract $9.25/bu1‐Jul Buy July wheat contract $8.85/bu
Futures gain + $0.40/buActual basis ‐ $1.10/buCommision costs ‐ $0.02/buActual cash sale price $8.13/bu
Price Decrease

New Crop Hedge
• Depending on the direction of a change in basis, you can benefit or lose– Basis widens: lose money– Basis narrows: gain money
• Is this a level of variability you can live with?
• If not, what are your other marketing options?– Forward contracting

Forward Contracting
• Alternative to hedging
• Eliminates downside price risk and basis risk– No commission costs or margin calls– Fewer transaction costs (paperwork, time)
• Exposes you to third party risk and a risk premium

Forward Contracting
• Cost of risk management– Elevators will charge you a premium for accepting your price risk
• Expect this cost to increase as basis risk increases
– New crop bids and cash prices tend to converge as harvest nears

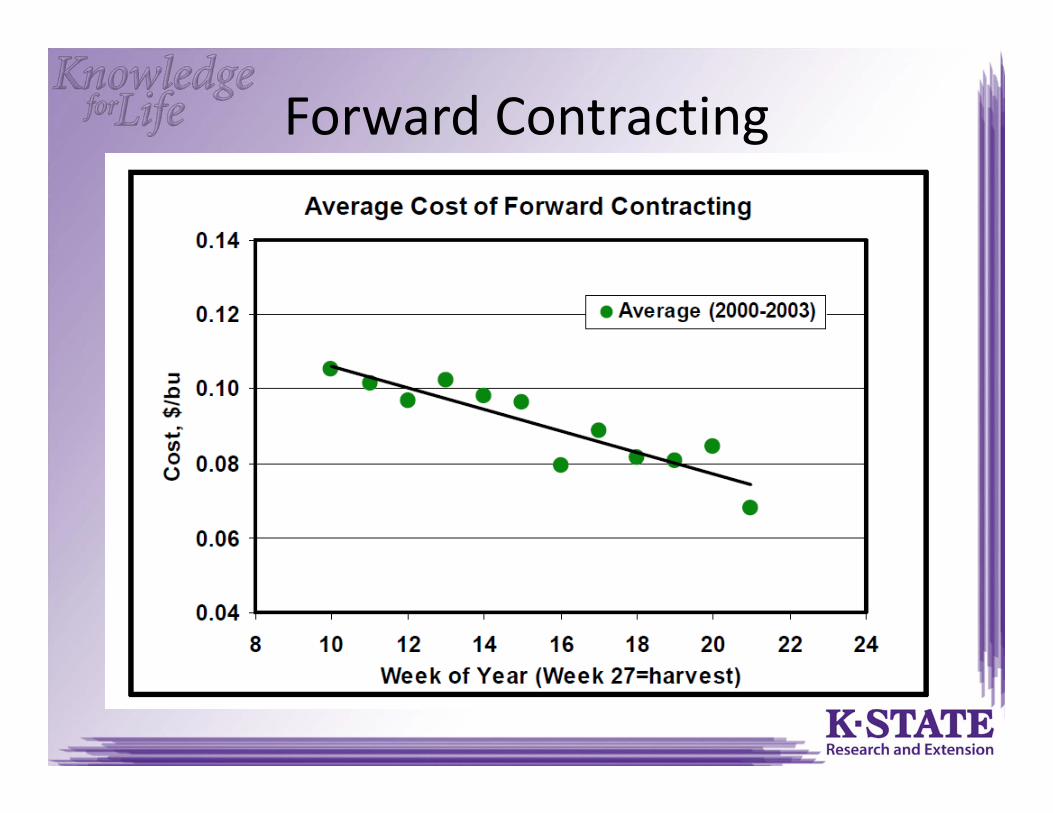
Forward Contracting• Previous research
– K‐State and U of Illinois studies– Looked at cost of forward contracting in Kansas– Four to fourteen years of data– Findings
• Risk premium for declines as approach harvest• Suggests that as more information is available, basis risk declines
Sources: Taylor, M., K. Dhuyvetter, and T. Kastens. 2003. “Hedging vs. Forward Contracting for Wheat.”
http://www.agmanager.info/marketing/publications/marketing/forward_contracting_wheat.pdfShi, W., S. Irwin, D. Good, and S. Dietz. 2005. “Wheat Forward Contract Pricing: Evidence on Forecast Power and
Risk Premia.” http://ageconsearch.umn.edu/handle/19043
Forward Contracting

Forward Contracting
• Further research– Data used in studies are ‘old’ and don’t include current levels of risk
– Are the elevators any better at forecasting basis?• Determine the relationship between the risk premium and the basis variability
– How much is ‘too much’? • When do the elevators stop offering forward contracts?

MARKETING PLANS
Marketing Plan
• Together the tools we have discussed can comprise a marketing plan
• Plans can take a portfolio approach – Use some combination of tools to diversify risk exposure
• Tracking and evaluating performance – Over several years to know if it is working

Marketing Tools
• Track your progress– Data collection over time will help you evaluate your marketing plan
– If you encounter Scenario 2 and ‘miss out’ on a harvest time price increase, are you going to hedge next year?
– What is your 3, 4, & 5 year average price under a marketing plan?
– How does it compare to selling cash at harvest or paying the risk premium for a forward contract?

Basis Risk
• Basis risk is higher today, but so is price risk– Relative exposure still matters– Everyone facing the same volatility in the markets
• Marketing plans and tracking performance more important than ever– Is hindsight 20/20 if you never look back?– Are you making marketing decisions using solid information or knee‐jerk responses?