Embed Size (px)
Citation preview

WOMEN AND THE LABOUR MARKET:Two Decades of Change and Continuity
Other titles from IES:
Balancing the Building Team: Gender Issues in the Building ProfessionsG Court, J MoraleeReport 284, 1995. ISBN 1-85184-210-1
Women in the NHS: Experiences in South East ThamesC Jackson, L BarberReport 249, 1994. ISBN 1-85184-172-5
Family Friendly Working: Hope or Hype?J Hillage, C SimkinReport 224, 1992. ISBN 1-85184-147-4
A catalogue of these and over 100 other titles is available from IES.
WOMEN IN THELABOUR MARKET:
Two Decades OfChange And Continuity
Gill Court
THE INSTITUTE FOR EMPLOYMENT STUDIES Report 294
A study supported by the IES Co-operative Research Programme
Published by:
THE INSTITUTE FOR EMPLOYMENT STUDIESMantell BuildingUniversity of SussexBrighton BN1 9RFUK
Tel. + 44 (0) 1273 686751Fax + 44 (0) 1273 690430
Copyright © 1995 The Institute for Employment Studies
No part of this publication may be reproduced or used in any form by any means — graphic, electronicor mechanical including photocopying, recording, taping or information storage or retrieval systems —without prior permission in writing from the Institute for Employment Studies.
A catalogue record for this publication is available from the British Library
ISBN 1-85184-221-7
Printed in Great Britain by Microgen UK Ltd
v
The Institute for Employment Studies
The Institute for Employment Studies is an independent,international centre of research and consultancy in humanresource issues. It has close working contacts with employers inthe manufacturing, service and public sectors, governmentdepartments, agencies, professional and employee bodies, andfoundations. Since it was established 25 years ago the Institutehas been a focus of knowledge and practical experience inemployment and training policy, the operation of labour marketsand human resource planning and development. IES is a not-for-profit organisation which has a multidisciplinary staff of over 50.IES expertise is available to all organisations through research,consultancy, training and publications.
IES aims to help bring about sustainable improvements inemployment policy and human resource management. IESachieves this by increasing the understanding and improving thepractice of key decision makers in policy bodies and employingorganisations.
Formerly titled the Institute of Manpower Studies (IMS), theInstitute changed its name to the Institute for Employment Studies(IES) in Autumn 1994, this name better reflecting the full range ofthe Institute’s activities and involvement.
The IES Co-operative Research Programme
This report is the product of a study supported by the IES Co-operative Research Programme, through which a group of IESSubscribers finance, and often participate in, applied research onemployment issues. The members of the CRP are:
Abbey National plcBAA plcBarclays Bank plcBritish Steel plcBritish Telecommunications plcThe Cabinet Office (OPS)Department of TransportElectricity Association Services LtdGuardian InsuranceHalifax Building SocietyHM Customs and ExciseHM Treasury
Lloyds Bank plcMarks & Spencer plcNational Westminster Bank plcPrudential Corporation plcRolls Royce plcJ Sainsbury plcShell (UK) LtdThe Post OfficeUnilever UK Holdings LtdThe Wellcome FoundationWoolwich Building Society

vi
vii
Contents
1. Introduction 11.1 A changing legal context 1
1.1.1 The Equal Pay Act 21.1.2 The Sex Discrimination Act 21.1.3 Maternity rights 31.1.4 The impetus for legislative change 4
1.2 The UK industrial structure: labour demand factors 41.3 Male wages and household incomes:
labour supply factors 5
2. Economic Activity 62.1 Economic activity by gender 1971 to 2006 62.2 Working mothers 82.3 Lone mothers 92.4 Ethnic minority women 10
3. Employment Patterns 133.1 Self-employment 13
3.1.1 Overall trends 133.1.2 Ethnic minority women 13
3.2 Employees 143.2.1 The rise of part-time work 143.2.2 Reasons for working part-time 153.2.3 Ethnic minority women and part-time work 15
4. Industry and Occupation 164.1 Industry 16
4.1.1 The situation in 1993 164.1.2 Trends to the 1990s 17
4.2 Occupations 184.2.1 The situation in 1993 184.2.2 Trends to the 1990s 18
5. Pay 21
6. Education and Training 236.1 Secondary level qualifications 236.2 Higher education qualifications 246.3 Professional qualifications 256.4 Training 25
7. An End to Discrimination? 26
Bibliography 29
Women in the Labour Market 1
1. Introduction
This report outlines the main trends and issues in women’semployment over the past two decades. The period has been oneof particularly rapid change for women, both in terms of theirlevel of participation in paid work and the quality of the labourmarket options available to them. In other respects, however, agood deal of continuity is evident. Occupational segregation hasproved remarkably resilient, which is one of the reasons why, onaverage, women’s earnings are still less than 80 per cent of thosefor men. In sum, the changed environment has by no meansmeant an end to substantial differences between women’s andmen’s employment opportunities.
The report is divided into five main sections each of which dealswith a particular aspect of women’s experience of the labourmarket. It includes discussions of:
changes in economic activity
the pattern of women’s employment
the industries and occupations in which women work
pay
education and training issues.
The trends in women’s employment discussed in this report havetaken place within marked changes in the legislativeenvironment. The rest of this chapter provides a context for theremainder of the report by summarising key changes in the legaland socio-economic environment that have influenced thesituation of women in the labour market.
1.1 A changing legal context
The current legislative environment regarding women in thelabour market is far removed from that which sanctioned anemployer’s right to require women to resign their post onmarriage, a practice which persisted into the 1960s. In thissection, we highlight three main legal landmarks and summarisethe way in which they changed the legislative framework withinwhich women’s experience of the labour market has developed.
2 The Institute for Employment Studies
1.1.1 The Equal Pay Act
The Equal Pay act was passed in 1970 and came into force in1975. It provides for equal pay for men and women working forthe same or an associated employer in the same or equivalentwork. In order to comply with Article 119 of the EC Treaty (ofRome), the Act was amended in 1983 to provide for claims toequal pay for work of equal value from 1984 onwards(Employment Department Group, 1994b). This has had the effectof allowing a wider range of claims, including comparisonsbetween totally dissimilar jobs, in different pay structures andacross different collective bargaining groups (Suter, 1990; Gilland Ungerson, 1984).
Most recently, the Equal Pay Act has been used to ensureequality between women and men in the area of occupationalpensions and survivors’ benefits. These are now deemed ‘pay’for the purposes of the Treaty of Rome, and since May 1990 thelaw requires women’s and men’s contributions to, and benefitsreceived from, occupational pensions to be equal.
1.1.2 The Sex Discrimination Act
The Sex Discrimination Act of 1975 made discrimination on thebasis of sex in employment, training, education, and other areasillegal. It also made discrimination on the basis of marital statusillegal. Under the Act, individuals have redress to civil courtsand industrial tribunals in the event of unlawful discrimination(Employment Department Group, 1994b). The 1975 Act alsoprovided for the establishment of the Equal OpportunitiesCommission to monitor enforcement.
The Sex Discrimination Act allowed for a number of exceptionswhich have since been removed in two major revisions, one in1986 and the second in 1989. In 1986 the impact of the UK’smembership of the European Community became evident andthe 1975 Act was revised to bring the UK legal context more intoline with European Community law. The revisions extended theoriginal Act to cover all employers, including those with five orfewer employees, and private households. The 1986 changes alsomade it unlawful to compel a woman to retire at a different agethan a comparable male employee.
In 1989 further revisions were made under the Employment Actof 1989. This reduced the number of exceptions allowed in theSex Discrimination Act, in particular those relating to women’shours of work. For example, the 1975 Act permitted employers torestrict women’s hours of employment. Most of these restrictionswere lifted by the 1989 Act (Employment Department Group,1984b; Suter, 1990).
Restrictions on the amount of compensation for discrimination,previously set at a maximum of £11,000, recently have been ruled
Women in the Labour Market 3
as contrary to EC law. This has made successful claimspotentially very expensive to employers (Clarke, 1994).
The UK Sex Discrimination legislation prohibits both direct andindirect discrimination. Indirect discrimination occurs whenemployers, or other persons, set requirements or conditionswhich apply equally to men and women but which members ofone sex will be less likely to be able to comply with than others.Examples include setting a minimum height requirement orrequiring certain educational qualifications. Where the practicehas a business-related purpose, however, sex discriminationlegislation allows it to continue.
Many recent legal cases claiming sex discrimination have beenmade on the grounds of indirect discrimination and this conceptis increasingly recognised as a powerful tool for change.Arguments around indirect discrimination have been ofparticular importance, for example, in improving the employmentrights of part time workers, the majority of whom are women.
1.1.3 Maternity rights
The third main area of the legislative environment which hasinfluenced women’s participation in, and experience of, thelabour market is that of maternity rights. The effect ofprogressive changes in the rights of pregnant workers has beento make it easier for women to continue working during andafter pregnancy. The most recent legislation (the Trade UnionReform and Employment Rights Act 1993 [TURER]), makesdismissal of a woman because she is pregnant, or for reasonsconnected with pregnancy, unfair. Women are also guaranteedthe right to return to work after pregnancy. The same legislationenhances existing maternity rights by ensuring that all pregnantemployees, regardless of length of service or hours of work willhave the right to:
14 weeks statutory maternity leave during which all their non-wage contractual benefits must be continued
be offered any suitable alternative work before beingsuspended due to a maternity-related health and safetyrestriction, and to receive full pay while on suspension if thereis no such work available.
Additional entitlements are available for women with two years’continuous full time service or five years’ continuous serviceworking between eight and 16 hours a week (EmploymentDepartment Group, 1994b; Clarke, 1994).
The existence of an appropriate legal framework is, however,only part of the story. The length and expense of many sexdiscrimination and equal pay claims make it difficult forindividuals to bring a claim without the backing of their union orthe Equal Opportunities Commission. In addition, current
4 The Institute for Employment Studies
legislation is limited in its ability to deal with the more subtleforms of discrimination against women, such as those generatedby a culturally hostile working environment where women areeither collectively or individually belittled and undermined,denied access to informal networks etc. As highlighted later inthe report, the cumulative impact of these pressures can have asubstantial effect on women’s ability to compete effectively withtheir male counterparts.
1.1.4 The impetus for legislative change
A key feature of changes in UK legislation affecting women inthe labour market is that the impetus for change has come fromEurope (Earnshaw, 1994). Relevant European Communitylegislation includes Article 119 of the Treaty of Rome and a seriesof Council Directives. The European Court of Justice hasconsistently upheld the applicability of this legislation tomember states. Individuals in the UK may bring legal claims onthe basis of Article 119 where this gives them greater rights thanthose accorded by domestic laws. In addition, courts andtribunals are obliged to interpret ambiguous national legislationin such a way that it conforms to, rather than conflicts with,Council Directives (Earnshaw, 1994).
1.2 The UK industrial structure: labour demand factors
A second key influence on women’s employment has been theshift in the UK economy from one based primarily onmanufacturing and other non-tertiary activities, to the currentdominance of the service sector. In 1954, service sectororganisations accounted for less than half of UK employment.1
By 1993, this proportion had risen to 72 per cent (Lindley andWilson, 1994, Table 2.4).
In the absence of a similarly marked change in occupational andindustrial sex segregation, this has meant that the expandingsectors of the economy have been those in which women areconcentrated. That is, even if the pattern of employment bygender and by industry and occupation had remainedunchanged over the last forty years, the shift in industrialstructure would have led to increased demand for womenemployees. In addition, however, there is evidence to suggestthat women’s share of employment increased in these growingareas of the economy, due, in part, to the substitution of femaleemployees for male employees in some services. To some extent,however, this substitution may be explained by the impact of theSex Discrimination Act, which reduced the scope for pre-entrydiscrimination against women (Mallier and Rosser, 1987, p.485).
1 Non-marketed services, business and miscellaneous services,distribution, transport etc.
Women in the Labour Market 5
1.3 Male wages and household incomes: labour supply factors
A third trend which is likely to have influenced women’semployment patterns relates to the effect of changes in maleearnings. Since the mid-1970s, the earnings of the lowest paidmen have declined slightly in real terms. In addition, the gapbetween the earnings of low paid men and those on medianwages has increased: by 1992 the bottom ten per cent wereearning only 56 per cent of median earnings, down from almost70 per cent in 1976 (Gosling, Machin and Meghir, 1994). Thisrelative (and absolute) decline in the earnings of the lowest paidmen suggests that in order to maintain their standard of living,households containing individuals in this group will have had toseek other sources of income, including that from women’semployment. Indeed, the biggest changes in women’s labourforce participation since the late 1970s have occurred amongwomen with low earning partners. As a result, women’scontribution to family incomes has risen (Harkness, Machin,Waldfogel, 1994).
6 The Institute for Employment Studies
2. Economic Activity
This chapter charts the rapid rise in women’s economic activityrates in the 1970s and 1980s. It first outlines overall trends andthen goes on to summarise more recent changes for specificgroups of women including:
women with dependent children
lone parents
ethnic minority women.
2.1 Economic activity by gender 1971 to 2006
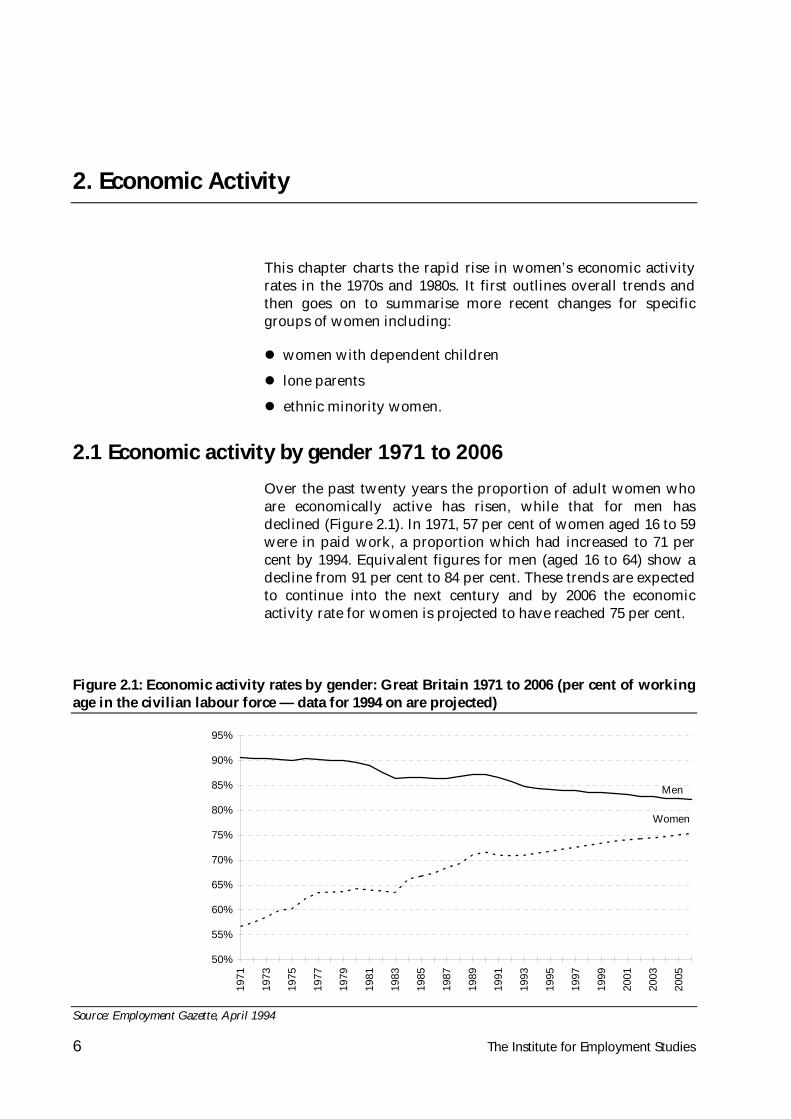
Over the past twenty years the proportion of adult women whoare economically active has risen, while that for men hasdeclined (Figure 2.1). In 1971, 57 per cent of women aged 16 to 59were in paid work, a proportion which had increased to 71 percent by 1994. Equivalent figures for men (aged 16 to 64) show adecline from 91 per cent to 84 per cent. These trends are expectedto continue into the next century and by 2006 the economicactivity rate for women is projected to have reached 75 per cent.
Figure 2.1: Economic activity rates by gender: Great Britain 1971 to 2006 (per cent of workingage in the civilian labour force — data for 1994 on are projected)
50%
55%
60%
65%
70%
75%
80%
85%
90%
95%
1971
1973
1975
1977
1979
1981
1983
1985
1987
1989
1991
1993
1995
1997
1999
2001
2003
2005
Men
Women
Source: Employment Gazette, April 1994
Women in the Labour Market 7
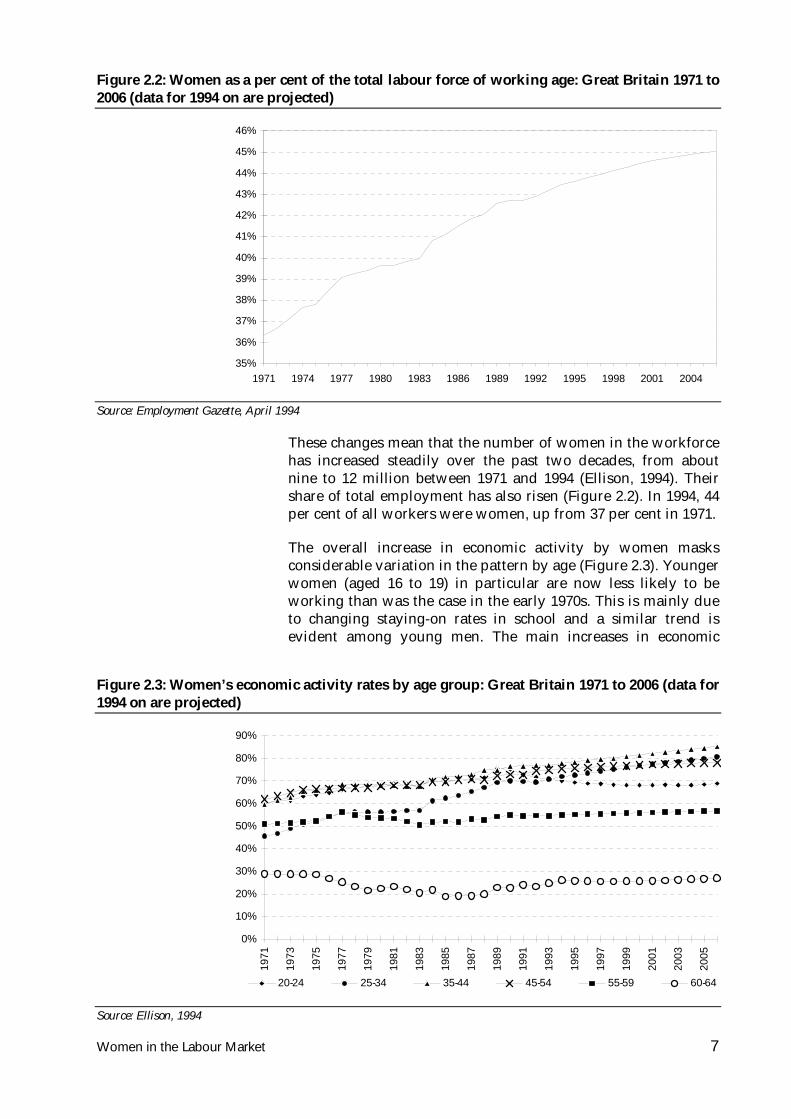
These changes mean that the number of women in the workforcehas increased steadily over the past two decades, from aboutnine to 12 million between 1971 and 1994 (Ellison, 1994). Theirshare of total employment has also risen (Figure 2.2). In 1994, 44per cent of all workers were women, up from 37 per cent in 1971.
The overall increase in economic activity by women masksconsiderable variation in the pattern by age (Figure 2.3). Youngerwomen (aged 16 to 19) in particular are now less likely to beworking than was the case in the early 1970s. This is mainly dueto changing staying-on rates in school and a similar trend isevident among young men. The main increases in economic
Figure 2.2: Women as a per cent of the total labour force of working age: Great Britain 1971 to2006 (data for 1994 on are projected)
35%
36%
37%
38%
39%
40%
41%
42%
43%
44%
45%
46%
1971 1974 1977 1980 1983 1986 1989 1992 1995 1998 2001 2004
Source: Employment Gazette, April 1994
Figure 2.3: Women’s economic activity rates by age group: Great Britain 1971 to 2006 (data for1994 on are projected)
0%
10%
20%
30%
40%
50%
60%
70%
80%
90%
1971
1973
1975
1977
1979
1981
1983
1985
1987
1989
1991
1993
1995
1997
1999
2001
2003
2005
20-24 25-34 35-44 45-54 55-59 60-64
Source: Ellison, 1994
8 The Institute for Employment Studies
activity have occurred in the 20 to 54 age range. Among womenaged 25 to 34, for example, labour force participation grew from46 per cent in 1971 to 72 per cent in 1994.
2.2 Working mothers
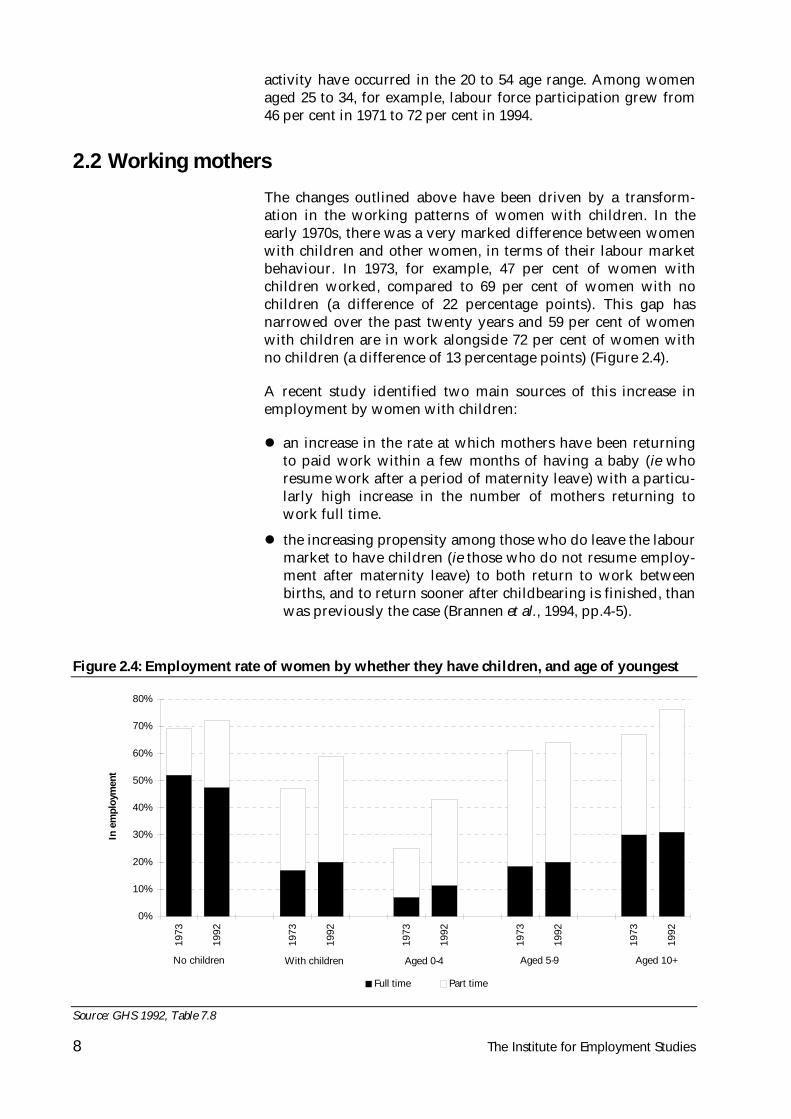
The changes outlined above have been driven by a transform-ation in the working patterns of women with children. In theearly 1970s, there was a very marked difference between womenwith children and other women, in terms of their labour marketbehaviour. In 1973, for example, 47 per cent of women withchildren worked, compared to 69 per cent of women with nochildren (a difference of 22 percentage points). This gap hasnarrowed over the past twenty years and 59 per cent of womenwith children are in work alongside 72 per cent of women withno children (a difference of 13 percentage points) (Figure 2.4).
A recent study identified two main sources of this increase inemployment by women with children:
an increase in the rate at which mothers have been returningto paid work within a few months of having a baby (ie whoresume work after a period of maternity leave) with a particu-larly high increase in the number of mothers returning towork full time.
the increasing propensity among those who do leave the labourmarket to have children (ie those who do not resume employ-ment after maternity leave) to both return to work betweenbirths, and to return sooner after childbearing is finished, thanwas previously the case (Brannen et al., 1994, pp.4-5).
Figure 2.4: Employment rate of women by whether they have children, and age of youngest
0%
10%
20%
30%
40%
50%
60%
70%
80%
1973
1992
1973
1992
1973
1992
1973
1992
1973
1992
In e
mpl
oym
ent
Full time Part time
No children With children Aged 5-9 Aged 10+Aged 0-4
Source: GHS 1992, Table 7.8
Women in the Labour Market 9
As a result of these trends, women with dependent children arenow more likely to be working than not working. The mostmarked changes have occurred among women with childrenaged under five, 43 per cent of whom now work compared toonly a quarter in 1973.1 Part time employment accounts for muchof this change, with the proportion of women with childrenunder five working part time rising from 18 per cent in 1973 to 31per cent in 1992. The number in full time work also increased,but to a lesser extent (from seven to 11 per cent).
Figure 2.4 also shows that women’s propensity to enter paidemployment increases with the age of their youngest child. Asnoted above, 43 per cent of women with children under five arein work. This proportion rises to 76 per cent for those withchildren aged ten to 15. In addition, while the difference betweenthe two groups remains large, it has lessened over the past 20years.
These changes mean that by early 1994, one in every sixemployed people was a woman with a child under the age of 16(Sly, 1994). They have also had a profound impact onhouseholds. The proportion of dual-earner households hasincreased; by 1989 over a half (57 per cent) of all two-parentfamilies were those in which both adults were in paid work, afigure which had increased from 44 per cent in 1981. That is,there has been a substantial decline in the number of familieswhere the father is the sole breadwinner — from 46 per cent ofall two-parent families in 1981 to 32 per cent in 1989 (Harrop andMoss, 1994, p.349).
2.3 Lone mothers
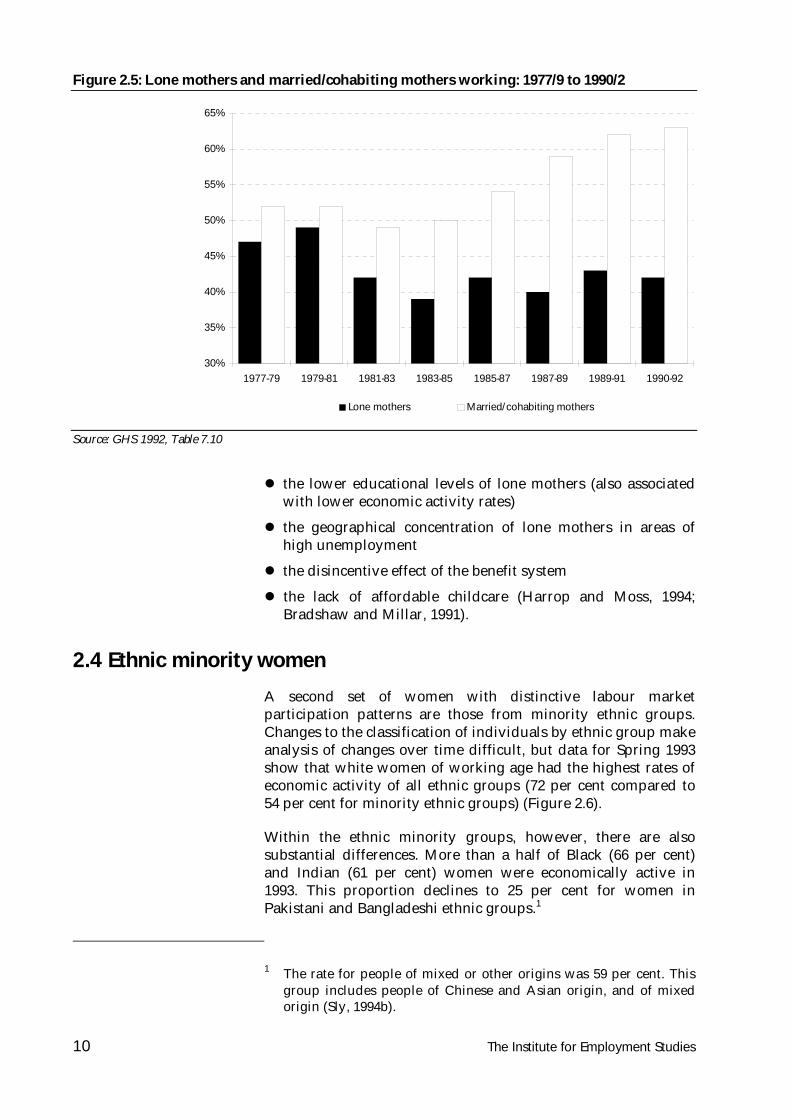
The data above describe the situation for all mothers. Theexperience of lone mothers is, however, very different from thatof women with partners. While the employment rate of marriedor cohabiting mothers has increased, that for lone mothers hasdeclined (Figure 2.5). In the early 1990s, 42 per cent of lonemothers were working, compared to 63 per cent of marriedmothers. In the late 1970s, these figures were 47 and 52 per centrespectively.
The lower employment rates for lone mothers are related to anumber of factors, including:
the increasing proportion of lone mothers with three or morechildren or children under five (both of these characteristicsare associated with lower economic activity rates)
1 More recent data show that this proportion has continued toincrease, with the latest estimate being 47 per cent (derived fromSly, 1994, Table 3.
10 The Institute for Employment Studies
the lower educational levels of lone mothers (also associatedwith lower economic activity rates)
the geographical concentration of lone mothers in areas ofhigh unemployment
the disincentive effect of the benefit system
the lack of affordable childcare (Harrop and Moss, 1994;Bradshaw and Millar, 1991).
2.4 Ethnic minority women
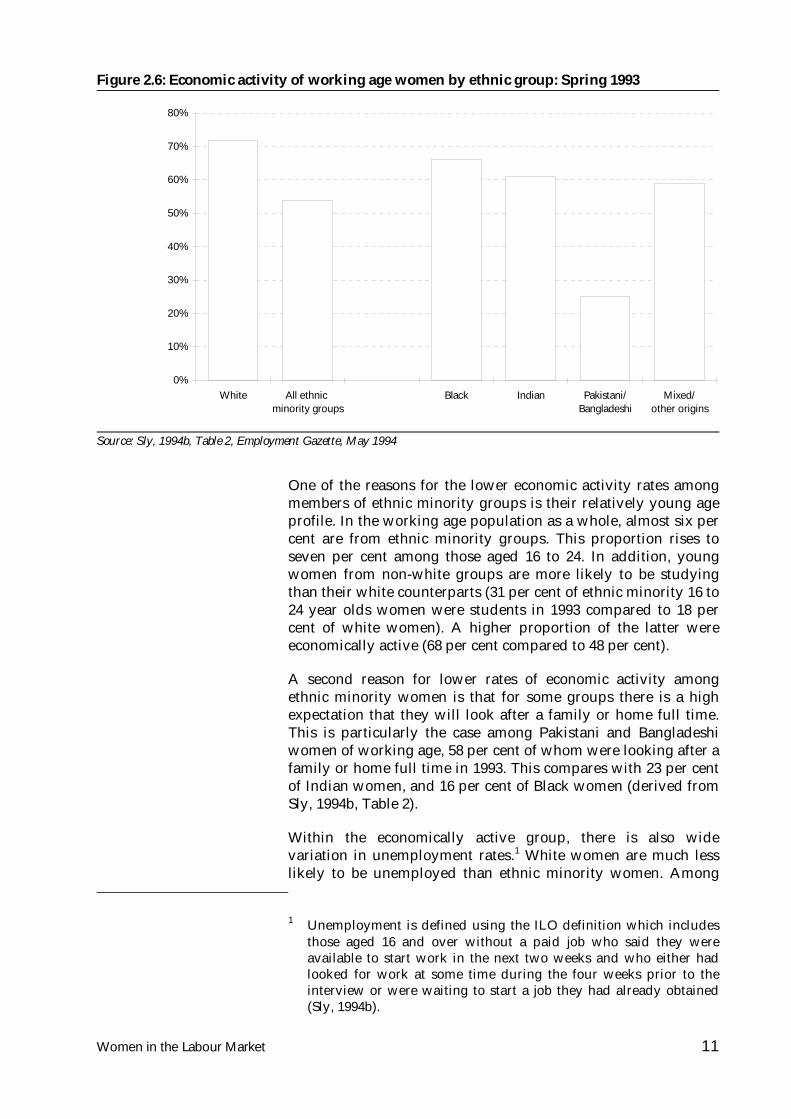
A second set of women with distinctive labour marketparticipation patterns are those from minority ethnic groups.Changes to the classification of individuals by ethnic group makeanalysis of changes over time difficult, but data for Spring 1993show that white women of working age had the highest rates ofeconomic activity of all ethnic groups (72 per cent compared to54 per cent for minority ethnic groups) (Figure 2.6).
Within the ethnic minority groups, however, there are alsosubstantial differences. More than a half of Black (66 per cent)and Indian (61 per cent) women were economically active in1993. This proportion declines to 25 per cent for women inPakistani and Bangladeshi ethnic groups.1
1 The rate for people of mixed or other origins was 59 per cent. Thisgroup includes people of Chinese and Asian origin, and of mixedorigin (Sly, 1994b).
Figure 2.5: Lone mothers and married/cohabiting mothers working: 1977/9 to 1990/2
30%
35%
40%
45%
50%
55%
60%
65%
1977-79 1979-81 1981-83 1983-85 1985-87 1987-89 1989-91 1990-92
Lone mothers Married/cohabiting mothers
Source: GHS 1992, Table 7.10
Women in the Labour Market 11
One of the reasons for the lower economic activity rates amongmembers of ethnic minority groups is their relatively young ageprofile. In the working age population as a whole, almost six percent are from ethnic minority groups. This proportion rises toseven per cent among those aged 16 to 24. In addition, youngwomen from non-white groups are more likely to be studyingthan their white counterparts (31 per cent of ethnic minority 16 to24 year olds women were students in 1993 compared to 18 percent of white women). A higher proportion of the latter wereeconomically active (68 per cent compared to 48 per cent).
A second reason for lower rates of economic activity amongethnic minority women is that for some groups there is a highexpectation that they will look after a family or home full time.This is particularly the case among Pakistani and Bangladeshiwomen of working age, 58 per cent of whom were looking after afamily or home full time in 1993. This compares with 23 per centof Indian women, and 16 per cent of Black women (derived fromSly, 1994b, Table 2).
Within the economically active group, there is also widevariation in unemployment rates.1 White women are much lesslikely to be unemployed than ethnic minority women. Among
1 Unemployment is defined using the ILO definition which includesthose aged 16 and over without a paid job who said they wereavailable to start work in the next two weeks and who either hadlooked for work at some time during the four weeks prior to theinterview or were waiting to start a job they had already obtained(Sly, 1994b).
Figure 2.6: Economic activity of working age women by ethnic group: Spring 1993
0%
10%
20%
30%
40%
50%
60%
70%
80%
White All ethnic minority groups
Black Indian Pakistani/Bangladeshi
Mixed/other origins
Source: Sly, 1994b, Table 2, Employment Gazette, May 1994

12 The Institute for Employment Studies
the latter, Pakistani/Bangladeshi women have the highestunemployment rate (29 per cent in 1993) and Indian women thelowest (11 per cent).
Women in the Labour Market 13
3. Employment Patterns
This chapter looks at the employment patterns of women overthe past twenty-five years, in particular the rise in self-employment and the expansion of part time workingarrangements.
3.1 Self-employment
3.1.1 Overall trends
The number of self-employed women has increased by 73 percent since the late 1960s, from 423,000 in 1968 to 782,000 in 1993.This growth took place within a context of rising femaleeconomic activity and so the proportion of women in the labourforce who are self-employed has only increased slightly (fromfive to seven per cent).1
As was the case with men, the number of self-employed womenremained relatively static until the early 1980s, and thenincreased rapidly until the late 1980s, when the growth ratelevelled off (Figure 3.1).
Part time self-employment has risen particularly rapidly amongwomen (by 165 per cent between 1979 and 1993, compared to a66 per cent increase for full time self-employment). This mirrorsthe trend among employees (see below) and has meant that theproportion of self-employed women who work part time hasincreased from 37 to 49 per cent.
3.1.2 Ethnic minority women
As is the case with men, women from ethnic minorities display agreater propensity to be self-employed than their whitecounterparts (almost nine per cent were self-employed in 1991compared to seven per cent of whites). Again, there is substantialvariation by ethnic group. The rate of self-employment is highestamong Chinese women (20 per cent of whom were self-
1 Among men, on the other hand, self-employment accounted for amuch higher proportion of the workforce in 1993 than in 1968 (18compared to ten per cent).

14 The Institute for Employment Studies
employed in 1991) and Pakistani and Indian women (with ratesof 16 and 13 per cent respectively. At the other end of the scale,the self-employment rate for black women is much lower (threeper cent) (Owen, 1994, Table 6.3, p.85).
In terms of numbers, South Asian women dominate the ranks ofself-employed ethnic minority women, accounting for over a halfof the total. Chinese and other groups make up an additionalthird (Owen, 1994).
3.2 Employees
3.2.1 The rise of part time work
The vast majority (over 90 per cent) of women in paid work areemployees. There were 10.3 million women employees in 1993,up from 8.2 million in 1968. During this period the growth inwomen’s employment has counteracted a decline in maleemployment, and women now account for 49 per cent of allemployees (up from 37 per cent in 1968).
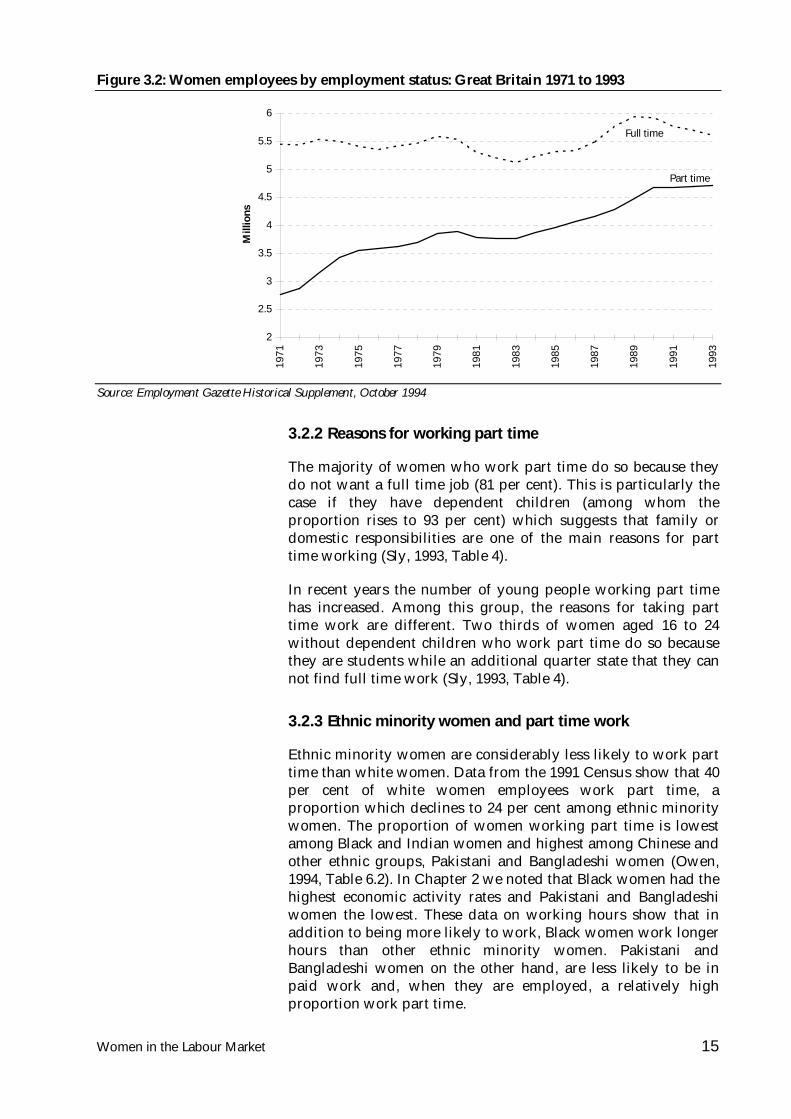
Figure 3.2 shows that much of this increase has been accountedfor by the rise in part time work (between 1971 and 1993, 93 percent of the total increase in women’s employment was in parttime work). The proportion of all women employees who areemployed part time has increased correspondingly and it nowaccounts for 46 per cent of the total, up from 34 per cent in 1971(the first year for which data are available).
Figure 3.1: Self-employed by gender: UK 1968 to 1993 (adjusted for seasonal variation)
0
0.5
1
1.5
2
2.5
3
3.5
1968 1970 1972 1974 1976 1978 1980 1982 1984 1986 1988 1990 1992
Mill
ions
Men Women
Source: Employment Gazette Historical Supplement, October 1994
Women in the Labour Market 15
3.2.2 Reasons for working part time
The majority of women who work part time do so because theydo not want a full time job (81 per cent). This is particularly thecase if they have dependent children (among whom theproportion rises to 93 per cent) which suggests that family ordomestic responsibilities are one of the main reasons for parttime working (Sly, 1993, Table 4).
In recent years the number of young people working part timehas increased. Among this group, the reasons for taking parttime work are different. Two thirds of women aged 16 to 24without dependent children who work part time do so becausethey are students while an additional quarter state that they cannot find full time work (Sly, 1993, Table 4).
3.2.3 Ethnic minority women and part time work
Ethnic minority women are considerably less likely to work parttime than white women. Data from the 1991 Census show that 40per cent of white women employees work part time, aproportion which declines to 24 per cent among ethnic minoritywomen. The proportion of women working part time is lowestamong Black and Indian women and highest among Chinese andother ethnic groups, Pakistani and Bangladeshi women (Owen,1994, Table 6.2). In Chapter 2 we noted that Black women had thehighest economic activity rates and Pakistani and Bangladeshiwomen the lowest. These data on working hours show that inaddition to being more likely to work, Black women work longerhours than other ethnic minority women. Pakistani andBangladeshi women on the other hand, are less likely to be inpaid work and, when they are employed, a relatively highproportion work part time.
Figure 3.2: Women employees by employment status: Great Britain 1971 to 1993
2
2.5
3
3.5
4
4.5
5
5.5
6
1971
1973
1975
1977
1979
1981
1983
1985
1987
1989
1991
1993
Mill
ions
Part time
Full time
Source: Employment Gazette Historical Supplement, October 1994
16 The Institute for Employment Studies
4. Industry and Occupation
This section looks at changes in women’s employment byindustry and occupation. It is divided into two main sections.The first looks at industrial employment patterns while thesecond addresses the issue of occupational trends. In both cases,the situation in 1993 is discussed before moving on to summarisetrends over the past two decades.
4.1 Industry
4.1.1 The situation in 1993
The striking feature of women’s employment by industry is itsconcentration in a few sectors. Almost two-fifths of womenemployees work in the public (or non-marketed) services sector.Within this category, health and education are the dominantindustries, employing 3.3 million women, or almost one third ofall women employees (Table 4.1). Other industries accounting fora high proportion of women employees are:
distribution, hotels and catering (24 per cent)
banking and professional services (11 per cent)
public administration and defence (six per cent).
By contrast, male employment is less concentrated with no singleindustry accounting for more than 20 per cent of the total. Thetwo main industries in which men are employed are:
distribution, hotel and catering (19 per cent)
engineering (13 per cent).
In addition, transport and communication, public administration,health and education, and banking and business services eachaccount for about nine per cent of male employment.
The most highly feminised industries (ie those in which women’sshare of total employment is highest) are:
health and education (77 per cent of employees are women)
textiles and clothing (60 per cent)
banking and business services (56 per cent)
distribution, hotels and catering (54 per cent).
Women in the Labour Market 17
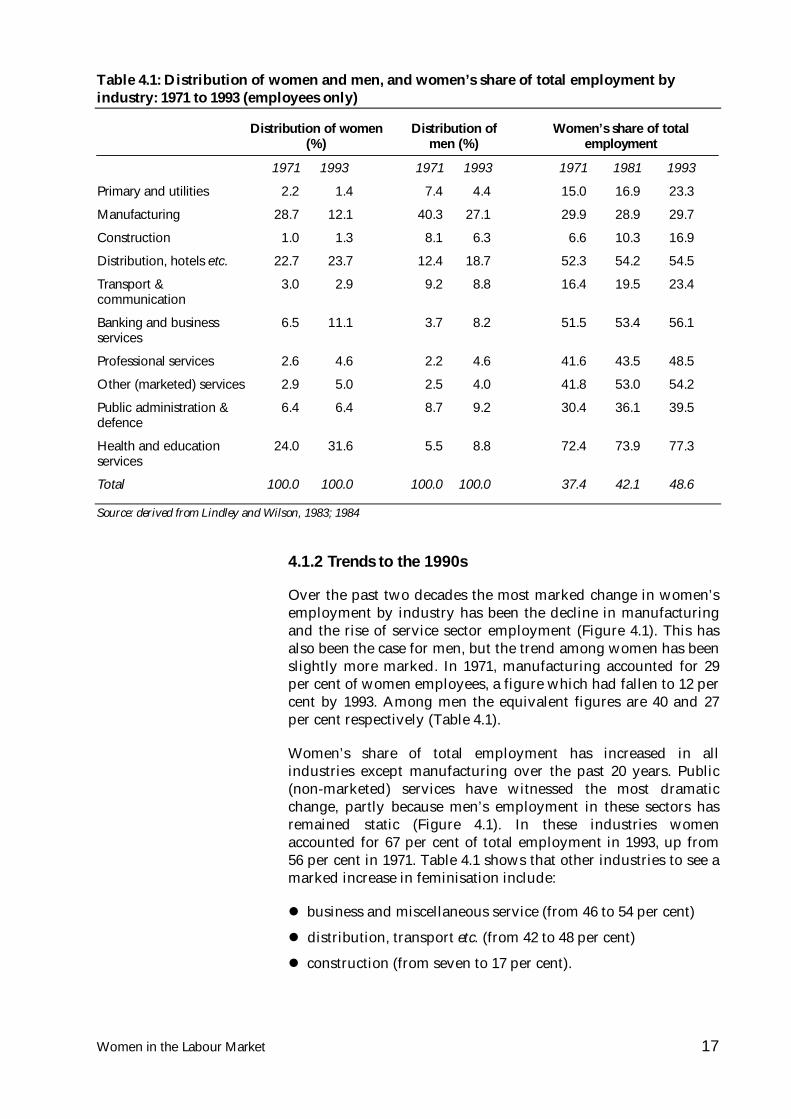
4.1.2 Trends to the 1990s
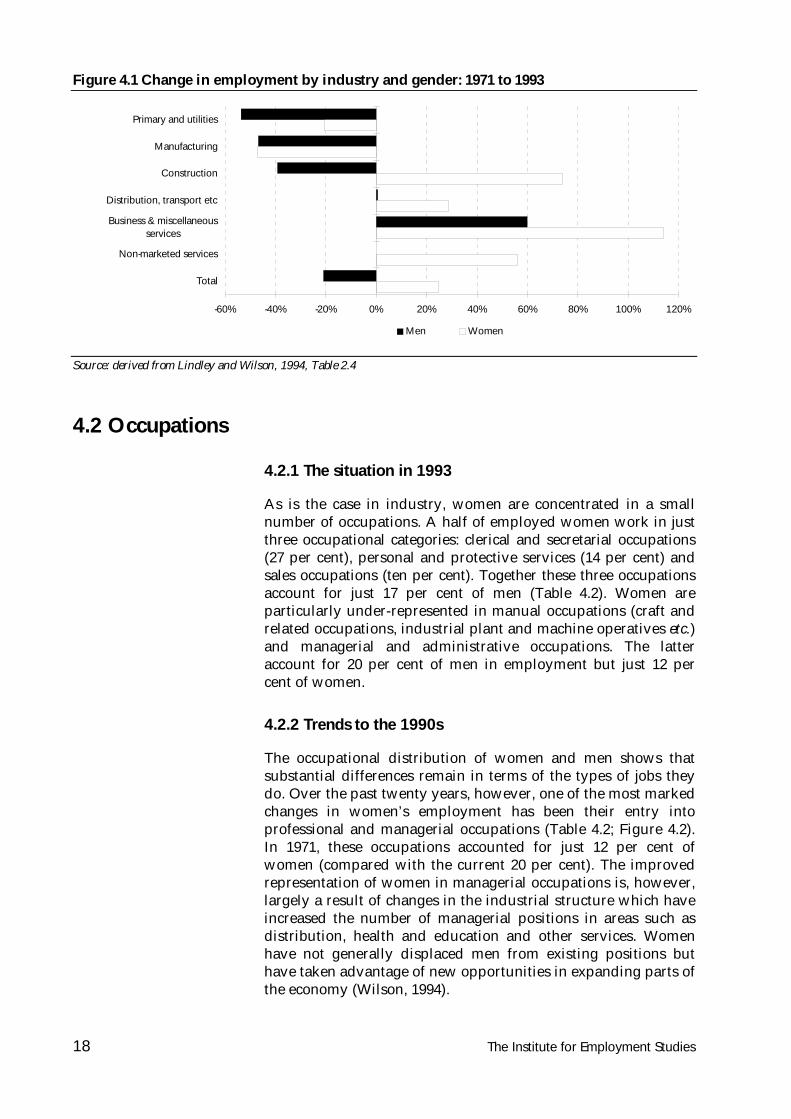
Over the past two decades the most marked change in women’semployment by industry has been the decline in manufacturingand the rise of service sector employment (Figure 4.1). This hasalso been the case for men, but the trend among women has beenslightly more marked. In 1971, manufacturing accounted for 29per cent of women employees, a figure which had fallen to 12 percent by 1993. Among men the equivalent figures are 40 and 27per cent respectively (Table 4.1).
Women’s share of total employment has increased in allindustries except manufacturing over the past 20 years. Public(non-marketed) services have witnessed the most dramaticchange, partly because men’s employment in these sectors hasremained static (Figure 4.1). In these industries womenaccounted for 67 per cent of total employment in 1993, up from56 per cent in 1971. Table 4.1 shows that other industries to see amarked increase in feminisation include:
business and miscellaneous service (from 46 to 54 per cent)
distribution, transport etc. (from 42 to 48 per cent)
construction (from seven to 17 per cent).
Table 4.1: Distribution of women and men, and women’s share of total employment byindustry: 1971 to 1993 (employees only)
Distribution of women(%)
Distribution ofmen (%)
Women’s share of totalemployment
1971 1993 1971 1993 1971 1981 1993
Primary and utilities 2.2 1.4 7.4 4.4 15.0 16.9 23.3
Manufacturing 28.7 12.1 40.3 27.1 29.9 28.9 29.7
Construction 1.0 1.3 8.1 6.3 6.6 10.3 16.9
Distribution, hotels etc. 22.7 23.7 12.4 18.7 52.3 54.2 54.5
Transport &communication
3.0 2.9 9.2 8.8 16.4 19.5 23.4
Banking and businessservices
6.5 11.1 3.7 8.2 51.5 53.4 56.1
Professional services 2.6 4.6 2.2 4.6 41.6 43.5 48.5
Other (marketed) services 2.9 5.0 2.5 4.0 41.8 53.0 54.2
Public administration &defence
6.4 6.4 8.7 9.2 30.4 36.1 39.5
Health and educationservices
24.0 31.6 5.5 8.8 72.4 73.9 77.3
Total 100.0 100.0 100.0 100.0 37.4 42.1 48.6
Source: derived from Lindley and Wilson, 1983; 1984
18 The Institute for Employment Studies
4.2 Occupations
4.2.1 The situation in 1993
As is the case in industry, women are concentrated in a smallnumber of occupations. A half of employed women work in justthree occupational categories: clerical and secretarial occupations(27 per cent), personal and protective services (14 per cent) andsales occupations (ten per cent). Together these three occupationsaccount for just 17 per cent of men (Table 4.2). Women areparticularly under-represented in manual occupations (craft andrelated occupations, industrial plant and machine operatives etc.)and managerial and administrative occupations. The latteraccount for 20 per cent of men in employment but just 12 percent of women.
4.2.2 Trends to the 1990s
The occupational distribution of women and men shows thatsubstantial differences remain in terms of the types of jobs theydo. Over the past twenty years, however, one of the most markedchanges in women’s employment has been their entry intoprofessional and managerial occupations (Table 4.2; Figure 4.2).In 1971, these occupations accounted for just 12 per cent ofwomen (compared with the current 20 per cent). The improvedrepresentation of women in managerial occupations is, however,largely a result of changes in the industrial structure which haveincreased the number of managerial positions in areas such asdistribution, health and education and other services. Womenhave not generally displaced men from existing positions buthave taken advantage of new opportunities in expanding parts ofthe economy (Wilson, 1994).
Figure 4.1 Change in employment by industry and gender: 1971 to 1993
-60% -40% -20% 0% 20% 40% 60% 80% 100% 120%
Primary and utilities
Manufacturing
Construction
Distribution, transport etc
Business & miscellaneousservices
Non-marketed services
Total
Men Women
Source: derived from Lindley and Wilson, 1994, Table 2.4
Women in the Labour Market 19
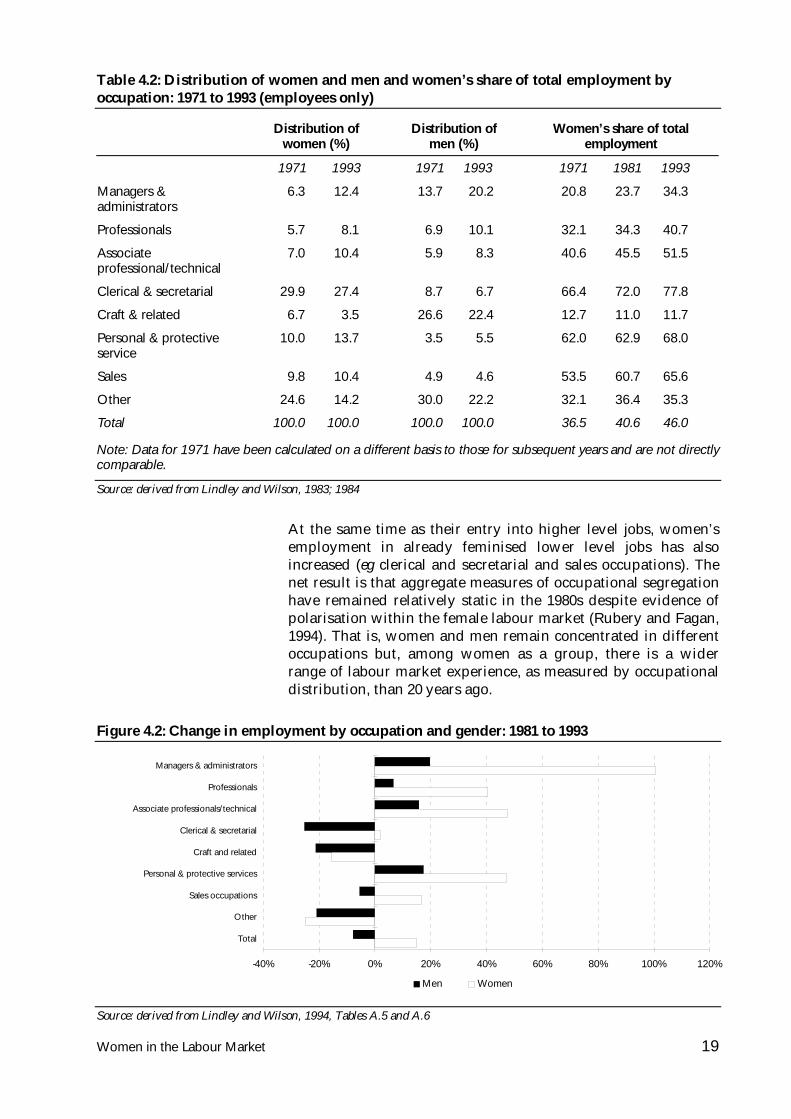
At the same time as their entry into higher level jobs, women’semployment in already feminised lower level jobs has alsoincreased (eg clerical and secretarial and sales occupations). Thenet result is that aggregate measures of occupational segregationhave remained relatively static in the 1980s despite evidence ofpolarisation within the female labour market (Rubery and Fagan,1994). That is, women and men remain concentrated in differentoccupations but, among women as a group, there is a widerrange of labour market experience, as measured by occupationaldistribution, than 20 years ago.
Figure 4.2: Change in employment by occupation and gender: 1981 to 1993
-40% -20% 0% 20% 40% 60% 80% 100% 120%
Managers & administrators
Professionals
Associate professionals/technical
Clerical & secretarial
Craft and related
Personal & protective services
Sales occupations
Other
Total
Men Women
Source: derived from Lindley and Wilson, 1994, Tables A.5 and A.6
Table 4.2: Distribution of women and men and women’s share of total employment byoccupation: 1971 to 1993 (employees only)
Distribution ofwomen (%)
Distribution ofmen (%)
Women’s share of totalemployment
1971 1993 1971 1993 1971 1981 1993
Managers &administrators
6.3 12.4 13.7 20.2 20.8 23.7 34.3
Professionals 5.7 8.1 6.9 10.1 32.1 34.3 40.7
Associateprofessional/technical
7.0 10.4 5.9 8.3 40.6 45.5 51.5
Clerical & secretarial 29.9 27.4 8.7 6.7 66.4 72.0 77.8
Craft & related 6.7 3.5 26.6 22.4 12.7 11.0 11.7
Personal & protectiveservice
10.0 13.7 3.5 5.5 62.0 62.9 68.0
Sales 9.8 10.4 4.9 4.6 53.5 60.7 65.6
Other 24.6 14.2 30.0 22.2 32.1 36.4 35.3
Total 100.0 100.0 100.0 100.0 36.5 40.6 46.0
Note: Data for 1971 have been calculated on a different basis to those for subsequent years and are not directlycomparable.
Source: derived from Lindley and Wilson, 1983; 1984
20 The Institute for Employment Studies
One of the main reasons for women’s increased access to higherlevel occupations is their rising level of educational qualifications.A second important factor is, as already highlighted, their greatercontinuity of employment as they remain out of the labourmarket for shorter periods of time (Rubery and Fagan, 1994).
Women in the Labour Market 21
5. Pay
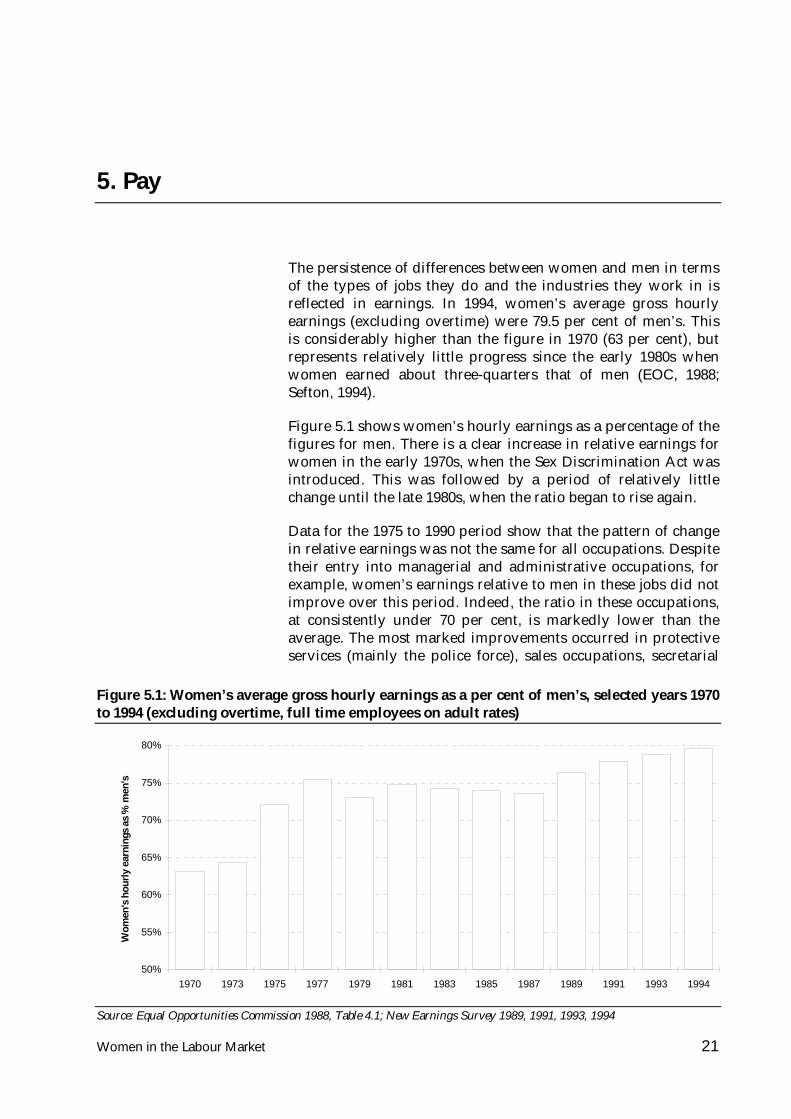
The persistence of differences between women and men in termsof the types of jobs they do and the industries they work in isreflected in earnings. In 1994, women’s average gross hourlyearnings (excluding overtime) were 79.5 per cent of men’s. Thisis considerably higher than the figure in 1970 (63 per cent), butrepresents relatively little progress since the early 1980s whenwomen earned about three-quarters that of men (EOC, 1988;Sefton, 1994).
Figure 5.1 shows women’s hourly earnings as a percentage of thefigures for men. There is a clear increase in relative earnings forwomen in the early 1970s, when the Sex Discrimination Act wasintroduced. This was followed by a period of relatively littlechange until the late 1980s, when the ratio began to rise again.
Data for the 1975 to 1990 period show that the pattern of changein relative earnings was not the same for all occupations. Despitetheir entry into managerial and administrative occupations, forexample, women’s earnings relative to men in these jobs did notimprove over this period. Indeed, the ratio in these occupations,at consistently under 70 per cent, is markedly lower than theaverage. The most marked improvements occurred in protectiveservices (mainly the police force), sales occupations, secretarial
Figure 5.1: Women’s average gross hourly earnings as a per cent of men’s, selected years 1970to 1994 (excluding overtime, full time employees on adult rates)
50%
55%
60%
65%
70%
75%
80%
1970 1973 1975 1977 1979 1981 1983 1985 1987 1989 1991 1993 1994
Wom
en's
hou
rly
earn
ings
as
% m
en's
Source: Equal Opportunities Commission 1988, Table 4.1; New Earnings Survey 1989, 1991, 1993, 1994
22 The Institute for Employment Studies
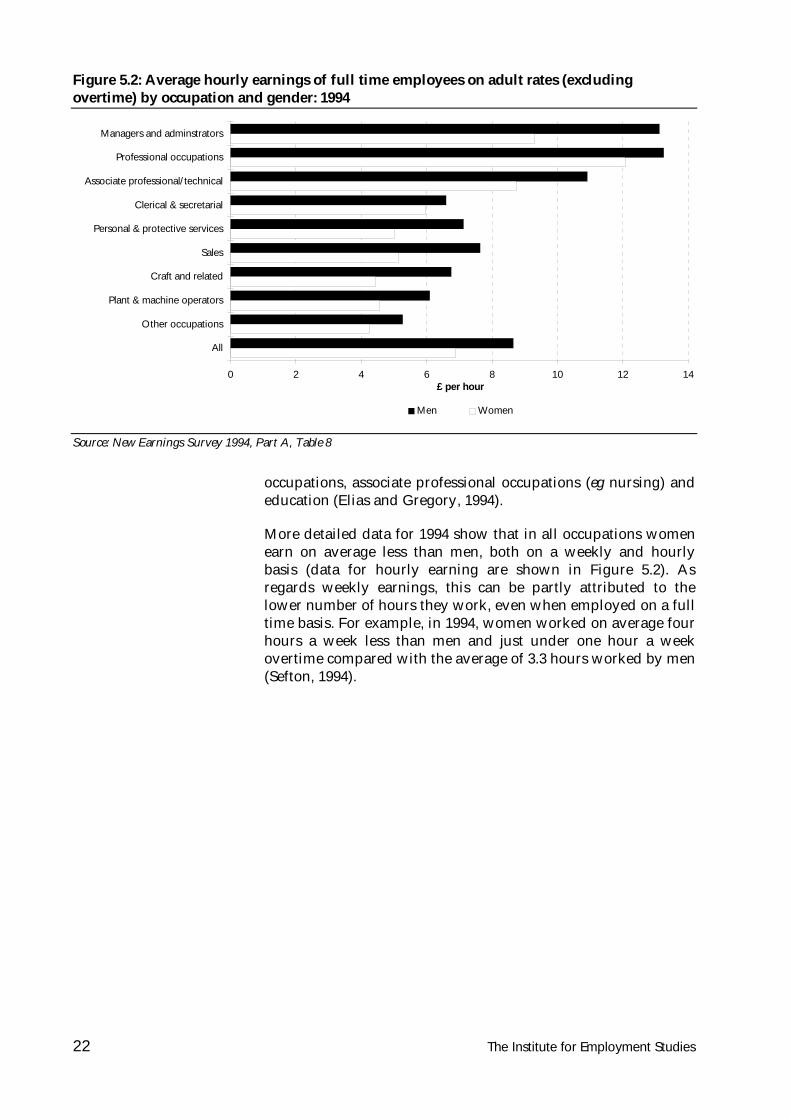
occupations, associate professional occupations (eg nursing) andeducation (Elias and Gregory, 1994).
More detailed data for 1994 show that in all occupations womenearn on average less than men, both on a weekly and hourlybasis (data for hourly earning are shown in Figure 5.2). Asregards weekly earnings, this can be partly attributed to thelower number of hours they work, even when employed on a fulltime basis. For example, in 1994, women worked on average fourhours a week less than men and just under one hour a weekovertime compared with the average of 3.3 hours worked by men(Sefton, 1994).
Figure 5.2: Average hourly earnings of full time employees on adult rates (excludingovertime) by occupation and gender: 1994
0 2 4 6 8 10 12 14
Managers and adminstrators
Professional occupations
Associate professional/technical
Clerical & secretarial
Personal & protective services
Sales
Craft and related
Plant & machine operators
Other occupations
All
£ per hour
Men Women
Source: New Earnings Survey 1994, Part A, Table 8
Women in the Labour Market 23
6. Education and Training
Women have substantially increased their level of qualificationsover the past two decades. This has facilitated their entry into arange of professional and managerial occupations and contributedto the differentiation within the female labour markethighlighted in Chapter 4. This chapter first looks at theincreasing educational attainment of women at both thesecondary and post-secondary level. It then goes on to highlighta series of issues on training.
6.1 Secondary level qualifications
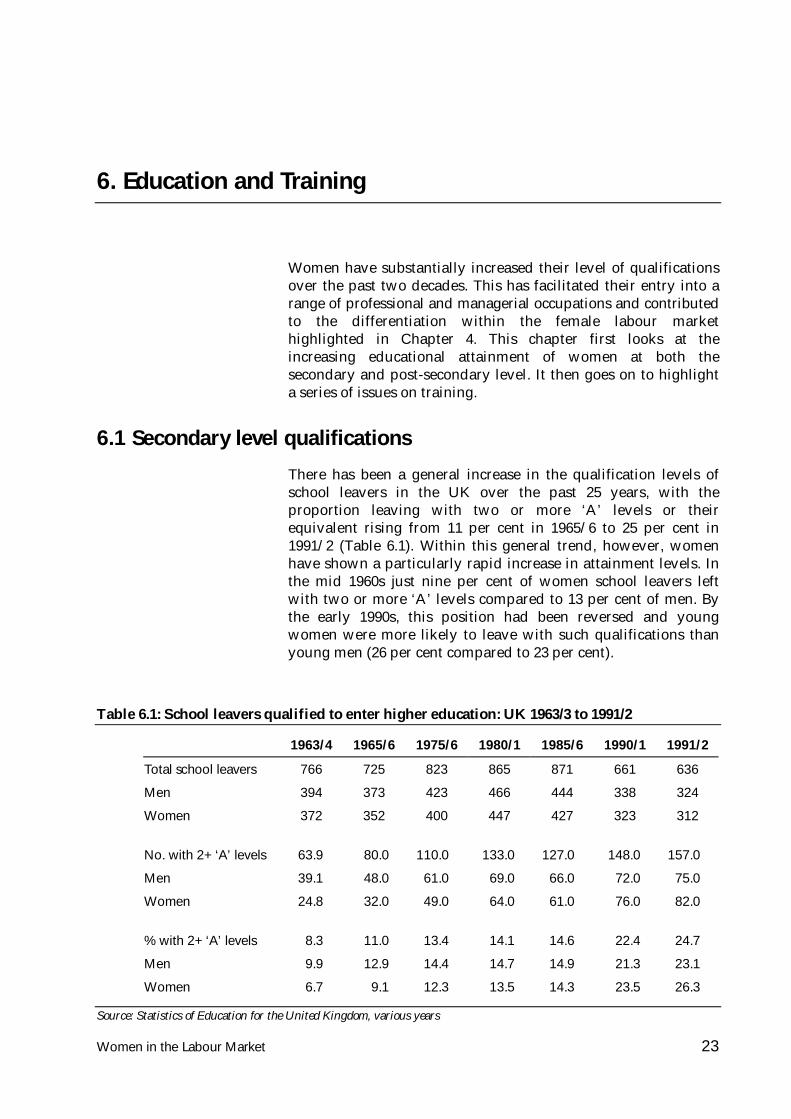
There has been a general increase in the qualification levels ofschool leavers in the UK over the past 25 years, with theproportion leaving with two or more ‘A’ levels or theirequivalent rising from 11 per cent in 1965/6 to 25 per cent in1991/2 (Table 6.1). Within this general trend, however, womenhave shown a particularly rapid increase in attainment levels. Inthe mid 1960s just nine per cent of women school leavers leftwith two or more ‘A’ levels compared to 13 per cent of men. Bythe early 1990s, this position had been reversed and youngwomen were more likely to leave with such qualifications thanyoung men (26 per cent compared to 23 per cent).
Table 6.1: School leavers qualified to enter higher education: UK 1963/3 to 1991/2
1963/4 1965/6 1975/6 1980/1 1985/6 1990/1 1991/2
Total school leavers 766 725 823 865 871 661 636
Men 394 373 423 466 444 338 324
Women 372 352 400 447 427 323 312
No. with 2+ ‘A’ levels 63.9 80.0 110.0 133.0 127.0 148.0 157.0
Men 39.1 48.0 61.0 69.0 66.0 72.0 75.0
Women 24.8 32.0 49.0 64.0 61.0 76.0 82.0
% with 2+ ‘A’ levels 8.3 11.0 13.4 14.1 14.6 22.4 24.7
Men 9.9 12.9 14.4 14.7 14.9 21.3 23.1
Women 6.7 9.1 12.3 13.5 14.3 23.5 26.3
Source: Statistics of Education for the United Kingdom, various years
24 The Institute for Employment Studies
The success of women at gaining ‘A’ level qualifications1 is likelyto continue in the near future, if only because of theirachievements earlier in the secondary school system. The GCSEattainment of young women is now well above that for youngmen. In 1992/3, 46 per cent of girls aged 15 gained five or moreGCSEs at grades A to C, a proportion which fell to 37 per centamong boys of the same age (Statistical Bulletin, 7/94).
In addition to gaining more GCSEs, young women also tend toreach a higher standard. This is particularly the case in modernlanguages and English, although even in areas where boys havetraditionally done better, such as mathematics and sciences, girlsare now achieving similar results to boys (Statistical Bulletin 7/94;Employment Department Group, 1994).
6.2 Higher education qualifications
The changes outlined above have been mirrored within thehigher education system which has seen the number andproportion of women gaining qualifications increase rapidly overthe past two decades. Women currently account for almost a halfof all higher education enrolment, up from less than a quarter inthe early 1960s and a third in 1970/1 (Court and Meager, 1994,Table 5).
In terms of degrees awarded, the proportion of university firstdegrees gained by women increased from 31 to 45 per cent in thetwo decades to 1990/1. An even more marked expansion wasrecorded for higher degrees, 36 per cent of which went to womenin 1990/1 compared to just nine per cent in 1970/1 (Court andMeager, 1994, Table 5).
In overall terms, then, women are well represented in highereducation. Marked differences by subject remain, however, withmen continuing to dominate in science, technology andengineering subjects (Committee on Women in Science,Engineering and Technology, 1994). The persistence of maledomination of some subjects is indicated by the case ofengineering: despite a decade-old campaign to increase therepresentation of women, they account for just 15 per cent ofstudents on engineering courses (up from less than ten per centin 1984).
Nevertheless, the potential for change in these patterns isindicated by past transformations in the gender balance withinsubjects. One of the clearest examples is that of medicine. In the
1 Despite similar attainment levels at ‘A’ level, young women andmen still tend to study different subjects. In particular, youngwomen are less likely than men to take ‘A’ levels in science subjects(ten per cent did so in 1991 compared to 14 per cent of their malecounterparts (Employment Department Group, 1994).
Women in the Labour Market 25
UK, almost a half of medical degrees are awarded to women, upfrom just over a fifth in the late 1960s (University GrantsCommittee, 1973; Universities Statistical Record, 1994).
6.3 Professional qualifications
Another area in which the representation of women hasincreased over the past twenty years is among those gainingprofessional qualifications (Crompton, 1992; Crompton, Hantraisand Walters, 1990). The increasing share of medical degreesawarded to women is highlighted above, but similar trends areevident in a number of other key areas including:
law, where about half of all new entrants are women, up from19 per cent in 1975
accountancy, where in the early 1970s only three per cent ofnew chartered accountants were women. Two decades later,this figure had increased to almost a half (48 per cent)
banking, where women accounted for just two per cent ofsuccessful finalists in the Institute of Banking exams in 1970, aproportion which had increased to 27 per cent by the late1980s.
6.4 Training
Recent trends suggest the proportion of women and menreceiving job-related training has increased over the past decadeand that there is little difference by gender in terms of access totraining (13 per cent of both women and men in employmentreceived training in 1994) [Gibbins, 1994]. Roughly 30 per cent oftraining takes place on the job, 60 per cent off the job and in tenper cent of cases it is some combination of the two. This patterndoes not vary between men and women.
Women are not therefore markedly different from men in termsof the extent to which they receive training. Indeed, amongemployees, women are slightly more likely to have receivedtraining than their male counterparts. There is, however,evidence to suggest that training, in particular that aimed ayoung people, does little to counteract prevailing patterns ofoccupational segregation. Thus, in 1990, the largest occupationalgroups for women YTS (as it was then called) trainees werecatering, cleaning and personal service work (37 per cent) andclerical and related work (ten per cent) (Courtenay and McAleese,1994, Table 9.4; see also Clarke, 1991). In addition, young womengenerally are less likely to receive training and a much lowerproportion gain vocational qualifications at NVQ Level 3 than isthe case for men (Gibbins, 1994). These patterns suggest thatyoung women’s access to higher level and male dominatedoccupations are not being sufficiently addressed under currentvocational training arrangements.
26 The Institute for Employment Studies
7. An End to Discrimination?
The trends discussed in this paper raise the question of whetherwomen remain at a disadvantage in the labour market. A widebody of evidence suggests that women’s success in enteringhigher order occupations cannot be equated with an end todiscrimination on the basis of gender within the labour market.In the first place, much of the change has occurred in occupationsassociated with a caring role (teaching, health, social work etc).These occupations tend to be less well paid and have lowerstatus than more commercial activities (see Chapter 5 for adiscussion of earnings inequality).
Second, increasing equality of access to managerial andprofessional occupations does not mean that women and menwill progress within those occupations at a similar rate. Inteaching, for example, women account for almost three quartersof full time employees and yet they represent just 44 per cent ofall head teachers and 21 per cent of secondary school heads (DfEStatistics of Education: Teachers in Service England and Wales1991). Likewise, while over a half of new entrants to the legalprofession are women, they account for less than a fifth ofpartners in law firms and just seven per cent of High CourtJudges (Mills, 1993; Rice, 1991; Employment Department Group,1994, p.101).
A similar situation is evident in managerial and administrativeposts. Women account for a disproportionate number of those inthe lower levels of the occupational hierarchy. While overallmore than 30 per cent of corporate managers and administratorsare women, the proportion of women in senior management ismuch less (less than five per cent according to most estimates)(Hirsh and Jackson, 1990; Summers, 1991). One of the reasons forthis discrepancy is indicated by a recent report which shows thatwomen managers are far less likely than their male counterpartsto be included on ‘fast track’ promotion programmes. Only 18per cent of future leaders in the companies surveyed for thestudy were women (GHN, 1994).
To some extent these patterns can be attributed to women’srelatively recent entry into higher level occupations. Thepersistence of inequality in areas such as teaching (where womenhave formed a majority of the workforce at least since 1950),however, suggests that considerable barriers to progress remainand are likely to do so for some time. There are a number of
Women in the Labour Market 27
potential reasons for this. They fall into two main categories: thepractical difficulties of combining work and family responsi-bilities and cultural patterns or assumptions which militateagainst women’s career progression (Hirsh and Jackson, 1990).
Practical barriers
Taking the practical difficulties first, progress in manyoccupations remains dependent upon a full time continuouscareer path. As long as women continue to take primaryresponsibility for the demands of households (childcare,eldercare, household tasks etc.) their ability to demonstrate therequired level of commitment will be limited. An increasingnumber of organisations do appear to be offering ‘familyfriendly’ arrangements, but issues around the actual extent ofsuch policies (apart from part time work) and take up ratesremain.
In the first place, a minority of all employers report offeringfamily friendly arrangements and those that do often only grantthem at managerial discretion (Brannen et al., 1994, p.52-3).Second, even where flexible working policies are introduced,take-up remains low (Opportunity 2000, 1994). This may bepartly due to workplace cultures. Even where part time andflexible work are available, these options are often not viewed ascompatible with continued career progress, and women talk of‘putting their career on hold’ or being ‘sidelined’ if they takeadvantage of them. As a result, women with family responsibili-ties tend to take longer to reach the senior positions than theirmale counterparts and women with no such responsibilities.
In many cases, particularly in managerial work, part time workis not even an option. Although some 11 per cent of all women inemployment are managers or administrators, only five per centof those working part time are in these occupations(Employment Department Group, 1994, p.56). In a recent study,the lack of part time work in management was invoked as apotential explanation for the particularly severe occupationaldowngrading experienced by women managers who left work tohave children. After having children, they found it especiallydifficult to find suitable work at a level similar to that they hadheld prior to giving birth (McRae, 1991).
These patterns suggest that it is not sufficient simply to provideflexible working patterns, although these at least enable womento continue working. Issues concerning workplace and householdcultures also need to be addressed. Women’s continuedresponsibility for household management and the ‘long hours’culture which prevails in many organisations make it verydifficult for women with families to progress in their careers atthe same rate as their male colleagues.
28 The Institute for Employment Studies
Cultural barriers
The practical difficulties of combining a career with family lifeare not, however, the sole determinants of women’s lack ofcareer progress (Hirsh and Jackson, 1990). An increasing body ofevidence suggests that broader cultural factors are involved.These include the persistence of informal networks and theirinfluence on recruitment and promotion decisions; women’sgreater reticence about advertising their achievements to peoplein a position to influence their career progress; their lack ofconfidence in applying for positions and demanding careerprogression; and, in some cases, the influence of a generallyhostile working environment, or one which does not expect orencourage women to succeed.
One of the results of these factors is that women are less likelythan their male colleagues to be channelled into jobs whichinvolve the exercise of direct control and/or authority. This isespecially the case in a male dominated working environment(Devine, 1992; Savage, 1992; Crompton, 1994). Since experiencein these jobs is frequently required for promotion to seniormanagement, it is difficult to see how women will manage theprogression to positions of organisational authority or control(Crompton, 1994).
Women in the Labour Market 29
Bibliography
Bradshaw J, Millar J (1991), Lone Parents in the UK, DSS ResearchReport No. 6, HMSO, London
Brannen J, Meszaros G, Moss P, Poland G (1994), Employment andFamily Life: A review of research in the UK (1980-1994),Employment Department Research Series No. 41,November
Clarke K (1991), Women and training: a review, EqualOpportunities Commission Research Discussion Series 1,EOC, Manchester
Clarke Linda (1994) Discrimination, Institute of PersonnelManagement, London
Committee on Women in Science, Engineering and Technology(1994), The Rising Tide: A report on women in science,engineering and technology, HMSO, London
Court G, Meager N (1994), ‘Higher Education in the UK’, Paperprepared for 2nd meeting of International HigherEducation Research Network, WZB, Berlin, December
Courtenay G, McAleese I (1994), England and Wales Youth CohortStudy: Cohort 4: Young people 17-18 years old in 1990 —Report on Sweep 2, Employment Department ResearchSeries Youth Cohort Report No. 27, March 1994
Crompton R (1992), ‘Where did all the bright girls go? Women’shigher education and employment since 1964’, inAbercrombie N, Warde A (eds), Social Change in Britain,Polity Press, Cambridge, pp. 54-69
Crompton R (1994), ‘Occupational Trends and Women’sEmployment Patterns’, in Lindley R (ed.), Labour MarketStructures and Prospects for Women, Equal OpportunitiesCommission, Manchester
Crompton R, Hantrais L, Walters P (1990), ‘Gender relations andemployment’, British Journal of Sociology, 41:3, pp. 329-350
Department of Employment (1987), Employment Gazette HistoricalSupplement No. 1: Employment Statistics, 95:2, February
30 The Institute for Employment Studies
Devine F (1992), ‘Gender Segregation in the Engineering andScience Professions: a case of continuity and change’,Work, Employment and Society, 6:4, pp. 557-575
Digest of Education Statistics (1993), National Center for EducationStatistics, US Department of Education, GovernmentPrinting Office, Washington DC
Earnshaw J (1994), ‘Sex Discrimination in the Workplace — UKlegal round-up’, Gender, Work and Organisation, 1:2, pp.110-119
Education Statistics for the United Kingdom 1993, HMSO, London
Elias P, Gregory M (1994), The Changing Structure of Occupationsand Earnings in Great Britain, 1975-1990: An analysis basedon the New Earnings Survey Panel Dataset, EmploymentDepartment Research Series No. 27, May
Ellison R (1994), ‘British labour force projections: 1994 to 2006’,Employment Gazette, April, pp. 111-121
Employment Department Group (1994a), Employment GazetteHistorical Supplement No. 4: Employment Statistics, 102:10,October
Employment Department Group (1994b), United Nations FourthWorld Conference on Women — Beijing 1995: Report of theUnited Kingdom of Great Britain and Northern Ireland
Employment Gazette (1995), Parliamentary Questions, January,p. 8
EOC (Equal Opportunities Commission) (1988), Women and Menin Britain 1987: A research profile, Equal OpportunitiesCommission, Manchester
GHN (1995), Future Top Managers, GHN Career ManagementConsultants, London
GHS (1994), General Household Survey 1992, OPCS Series GHS,HMSO, London
Gibbins C (1994), ‘Women and training — data from the labourforce survey’, Employment Gazette, November 1994, pp.391-401
Gosling A, Machin S, Meghir C (1994), ‘The UK male wagedistribution 1966-92’, Findings: Social Policy Research 52,Joseph Rowntree Foundation, York
Harkness S, Machin S, Waldfogel J (1994), ‘Women’s pay andfamily income inequality’, Findings: Social Policy Research60, Joseph Rowntree Foundation, York
Women in the Labour Market 31
Harrop A, Moss P (1994), ‘Working parents: trends in the 1980s’,Employment Gazette, October, pp. 343-357
Hirsh W, Jackson C (1990), Women into Management: Issuesinfluencing the entry of women into managerial jobs, IMSPaper No. 158, Brighton
Lindley R (ed.) (1994) Labour Market Structures and Prospects forWomen, Equal Opportunities Commission, Manchester
Lindley R, Wilson R (eds) (1993), Review of the Economy andEmployment: Occupational Assessment, Institute forEmployment Research, University of Warwick
Lindley R, Wilson R (eds) (1994), Review of the Economy andEmployment: Occupational Assessment, Institute forEmployment Research, University of Warwick
Mallier A T, Rosser M J (1987), ‘Changes in the industrialdistribution of female employment in Great Britain, 1951-1981’, Work, Employment and Society, 1:4, pp. 463-486
McRae S (1991), ‘Occupational Change over Childbirth: evidencefrom a national survey’, Sociology, 25:4, pp. 589-605
Mills H (1993), ‘Legal slump hits women’s prospects’,Independent, October 26, p. 9
Opportunity 2000 (1994), Third Year Report, Opportunity 2000,London
Owen D (1994), Ethnic Minority Women and the Labour Market:Analysis of the 1991 Census, Equal OpportunitiesCommission Research Series, EOC, Manchester
Rice R (1991), ‘Law Society reports rise in number of womensolicitors’, Financial Times, October 15, p. 11
Rubery J, Fagan C (1994), ‘Occupational Segregation: Plus çachange . . . ?’, in R Lindley (ed.), Labour Market Structuresand Prospects for Women, Equal Opportunities Commission,Manchester
Savage M (1992), ‘Women’s expertise and men’s authority:gendered organisation and the contemporary middleclass’, in Savage M, Witz A (eds), Gender and Bureaucracy,Blackwell, Oxford
Sefton R (1993), ‘Patterns of pay: results from the 1993 NewEarnings Survey’, Employment Gazette, November, pp.515-522
32 The Institute for Employment Studies
Sefton R (1994), Patterns of pay: results from the 1994 NewEarnings Survey, Employment Gazette, December, pp. 453-460
Sly F (1993), ‘Women in the labour market’, Employment Gazette,November, pp. 483-502
Sly F (1994a), ‘Mothers in the labour market’, Employment Gazette,November, pp. 403-413
Sly F (1994b), ‘Ethnic groups and the labour market’, EmploymentGazette, May, pp. 147-159
Smithers A, Robinson P, (1994) The Impact of Double Science in OurSchools, Engineering Council, London
Statistical Bulletin (7/94), GCSE and GCE A/AS ExaminationResults 1992/93, Department for Education, June
Straw J (1989), Equal Opportunities: the way ahead, Institute ofPersonnel Management, London
Summers D (1991), ‘No room for new faces at the top’, FinancialTimes, May 7
Summers D (1992), ‘Female directors report widespreadinequality’, Financial Times, March 19, p. 9
Suter E (1990), The Employment Law Checklist: Fourth Edition,Institute of Personnel Management, London
Universities’ Statistical Record (1994), First destinations ofuniversity graduates 1992-93
University Grants Committee (1993), Statistics of Education 1970,Vol. 6: Universities, HMSO, London
Wilson RA (1994), ‘Sectoral and Occupation Change: Prospectsfor Women’s Employment’, in Lindley R (ed.), LabourMarket Structures and Prospects for Women, EqualOpportunities Commission, Manchester


![British Columbia Labour Market Outlook 2010 - 2020 · Labour Market OutlookLabour Market Outlook British Columbia Labour Market Outlook: 2010-2020 [2] B.C. Labour Market Outlook,](https://img.pdfslide.us/doc/110x75/5e167e8e481eae63a43f8127/british-columbia-labour-market-outlook-2010-2020-labour-market-outlooklabour-market.jpg)