Embed Size (px)
Citation preview

CFA Institute Research Challenge
Southern Classic
Wofford College
CFA Institute Research Challenge Axiall Corporation
Recommendation: Sell 1/22/2015
1
Ticker: AXLL (NYSE) Recommendation: Sell
Price: $44.05 (as of 1/22/15) Price Target: $32.00 (27% Decrease)
Highlights Sell Recommendation: We initiate coverage of Axiall Corporation (AXLL) with a Sell recommendation. Our target price of $32, based on DCF and multiples valuations, represents a 27% decrease from its recent market price.
Primary Factors that discourage an investment in AXLL include the following.
Forecasts of Excessive Earnings Growth: AXLL’s stock price reflects analysts’ estimates that 2015 EPS will more than double. Such estimates seem to overestimate the housing recovery and fail to recognize the industry’s overcapacity and a reversion of AXLL’s tax rate to 31% versus an unsustainably low 17% in 2014. The stock price has increased while average 2015 EPS estimates have declined from $3.65 to $3.04 in the last 120 days.
Lack of Competitive Advantages: AXLL lacks significant and sustainable competitive advantages in all its
segments, as reflected in its low profit margin (2.5% TTM) and low investment returns (4.4% TTM ROIC).
Limited Financial Flexibility: High debt levels, as reflected in AXLL’s non-investment-grade ratings and as a
result of its 2013 acquisition of a PPG spinoff, limit AXLL’s financial flexibility and stockholder payouts.
Negative Profit Trends: As a result of its apparent overpayment for the 2013 acquisition and AXLL’s 2014
decline in profitability, AXLL’s ROE has decreased from 20.0% in 2012, to 6.3% in 2013 and 4.3% TTM, and
its net profit margin has decreased from 3.6% in 2012 to 3.5% in 2013 and 1.6% YTD 2014.
Aromatics Segment Difficulties: Due to weak demand and pricing pressures, the Aromatics segment, which
comprises 17% of 2014 sales, has provided little operating profit over the last several years and may be divested.
Earnings per Share
Q1 Q2 Q3 Q4 Year P/E Ratio
2011A $0.34 $0.42 $0.99 -$0.06 $1.69 11.5
2012A $1.02 $0.39 $1.12 $0.93 $3.46 11.9
2013A -$0.06 $1.03 $0.55 $0.92 $2.44 19.4
2014A/E -$0.17 $0.38 $0.63 $0.21E $1.05E 40.4
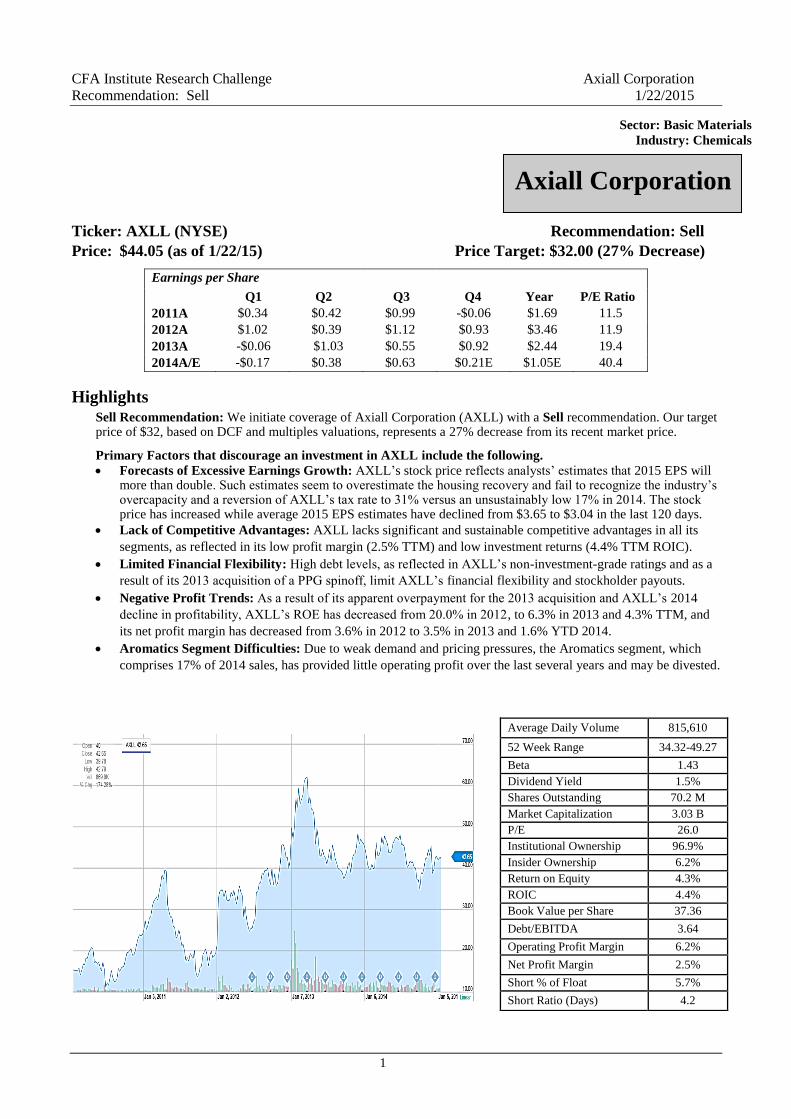
Average Daily Volume 815,610
52 Week Range 34.32-49.27
Beta 1.43
Dividend Yield 1.5%
Shares Outstanding 70.2 M
Market Capitalization 3.03 B
P/E 26.0
Institutional Ownership 96.9%
Insider Ownership 6.2%
Return on Equity 4.3%
ROIC 4.4%
Book Value per Share 37.36
Debt/EBITDA 3.64
Operating Profit Margin 6.2%
Net Profit Margin 2.5%
Short % of Float 5.7%
Short Ratio (Days) 4.2
Axiall Corporation
Sector: Basic Materials
Industry: Chemicals
CFA Institute Research Challenge Axiall Corporation
Recommendation: Sell 1/22/2015
2
Business Description Axiall (AXLL), formerly known as the Georgia Gulf Corporation, is an international manufacturer of
chlorovinyl and aromatic chemicals, in addition to vinyl home improvement and building products. Founded in
1984 as a spinoff from Georgia-Pacific, AXLL is headquartered in Atlanta, Georgia. Most of AXLL’s
production facilities are in the U.S.; likewise, its sales are U.S. dominated with 80% in the U.S., 12% in Canada,
and 8% in other countries, primarily Asia. Its business is divided into three segments, each of which is discussed
separately below.
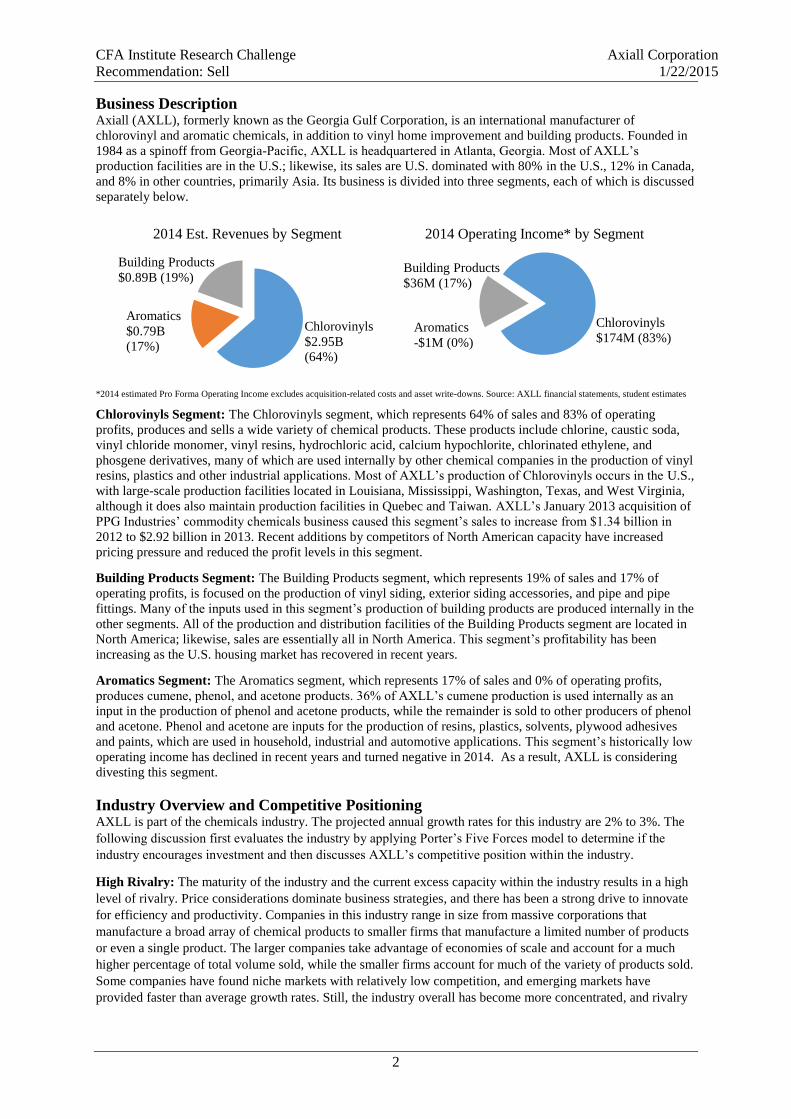
*2014 estimated Pro Forma Operating Income excludes acquisition-related costs and asset write-downs. Source: AXLL financial statements, student estimates
Chlorovinyls Segment: The Chlorovinyls segment, which represents 64% of sales and 83% of operating
profits, produces and sells a wide variety of chemical products. These products include chlorine, caustic soda,
vinyl chloride monomer, vinyl resins, hydrochloric acid, calcium hypochlorite, chlorinated ethylene, and
phosgene derivatives, many of which are used internally by other chemical companies in the production of vinyl
resins, plastics and other industrial applications. Most of AXLL’s production of Chlorovinyls occurs in the U.S.,
with large-scale production facilities located in Louisiana, Mississippi, Washington, Texas, and West Virginia,
although it does also maintain production facilities in Quebec and Taiwan. AXLL’s January 2013 acquisition of
PPG Industries’ commodity chemicals business caused this segment’s sales to increase from $1.34 billion in
2012 to $2.92 billion in 2013. Recent additions by competitors of North American capacity have increased
pricing pressure and reduced the profit levels in this segment.
Building Products Segment: The Building Products segment, which represents 19% of sales and 17% of
operating profits, is focused on the production of vinyl siding, exterior siding accessories, and pipe and pipe
fittings. Many of the inputs used in this segment’s production of building products are produced internally in the
other segments. All of the production and distribution facilities of the Building Products segment are located in
North America; likewise, sales are essentially all in North America. This segment’s profitability has been
increasing as the U.S. housing market has recovered in recent years.
Aromatics Segment: The Aromatics segment, which represents 17% of sales and 0% of operating profits,
produces cumene, phenol, and acetone products. 36% of AXLL’s cumene production is used internally as an
input in the production of phenol and acetone products, while the remainder is sold to other producers of phenol
and acetone. Phenol and acetone are inputs for the production of resins, plastics, solvents, plywood adhesives
and paints, which are used in household, industrial and automotive applications. This segment’s historically low
operating income has declined in recent years and turned negative in 2014. As a result, AXLL is considering
divesting this segment.
Industry Overview and Competitive Positioning AXLL is part of the chemicals industry. The projected annual growth rates for this industry are 2% to 3%. The
following discussion first evaluates the industry by applying Porter’s Five Forces model to determine if the
industry encourages investment and then discusses AXLL’s competitive position within the industry.
High Rivalry: The maturity of the industry and the current excess capacity within the industry results in a high
level of rivalry. Price considerations dominate business strategies, and there has been a strong drive to innovate
for efficiency and productivity. Companies in this industry range in size from massive corporations that
manufacture a broad array of chemical products to smaller firms that manufacture a limited number of products
or even a single product. The larger companies take advantage of economies of scale and account for a much
higher percentage of total volume sold, while the smaller firms account for much of the variety of products sold.
Some companies have found niche markets with relatively low competition, and emerging markets have
provided faster than average growth rates. Still, the industry overall has become more concentrated, and rivalry
2014 Est. Revenues by Segment
Chlorovinyls
$2.95B
(64%)
Building Products
$0.89B (19%)
Aromatics
$0.79B
(17%)
2014 Operating Income* by Segment
Building Products
$36M (17%)
Aromatics
-$1M (0%)
Chlorovinyls
$174M (83%)
CFA Institute Research Challenge Axiall Corporation
Recommendation: Sell 1/22/2015
3
has intensified. As a result, rivalry remains excessive and limits profitability in the industry relative to the
market in general, as shown by the below chart.
Profit Ratios:* AXLL Median of Eleven
Competitors Market
Net Profit Margin 2.5% 6.9% 9.0%
ROIC 4.4% 9.0% 11.8%
*Based on TTM amounts. See Figure 15 for details. Sources: Bloomberg, company financial statements
Medium Barriers to Entry: There is a moderate level of barriers to entry. The industry is extremely capital
intensive and requires significant investment in order to achieve economies of scale and maximize price-
competiveness, especially for firms striving to compete at national and global levels. Technologies used in
producing commodity chemicals are generally known or able to be licensed and are therefore not usually a
significant barrier.
High Threat of Substitutes: There is a high threat of substitutes due to the lack of differentiation between
products within the industry and mature technology. Substitutes that provide customers cost savings pose the
biggest threat. At times, the need to reduce costs has encouraged alliances and joint ventures between
competitors to best achieve cost-effective and efficient solutions through collaborative efforts in raw material
procurement or manufacturing. This high threat of substitutes increases the downward pressure on prices and
profit margins.
Low Supplier Bargaining Power: Overall, supplier bargaining power is fairly low. The main inputs for
chemical products include oil, gas, water, minerals, and other materials that can be acquired from numerous
suppliers or are produced in-house if the manufacturer is vertically integrated, which AXLL and many of its
competitors are.
Medium Customer Bargaining Power: The chemicals industry creates numerous commodity and chemical
products that are used in a plethora of industries. This results in a wide and diverse customer base. Some
products, such as those involved in specialty chemicals and added-value products, are sold to other chemical
companies, while most are sold to different industries. Although there is a breadth of customers within the
customer base, there are some larger and more powerful buyers, such as the automotive companies. The size of
certain buyers and the fact that price is often the biggest sales driver provide more bargaining power to
customers. Still, the variety of customers moderates this power.
AXLL’s Competitive Position within the Industry and by Segment: AXLL lacks distinct and sustainable
competitive advantages. Although AXLL claims to be one of the world’s lowest-cost producers of chlorovinyl
products, many of its competitors, such as Occidental, make the same claim. Further, AXLL’s profit margins
relative to its competitors do not demonstrate clear advantages. AXLL maintains that its vertical integration is a
competitive advantage. Again, however, many of its competitors are vertically integrated. Vertical integration
offers limited benefits when excess capacity allows companies to buy products as cheaply as they can be
produced.
It is difficult to identify AXLL’s specific niche. The company does seem in certain areas to be working to
become more of a “neighborhood” chemicals company by focusing more on relationship-oriented selling, as
seen by its emphasis on local manufacturing as well as partnerships. An example of this can be seen in the report
it helped publish about sanitation deficiencies in public pools in the Chicago area.
Chlorovinyls Segment: Representing 64% of its sales and over 80% of its operating income, the Chlorovinyls
segment is AXLL’s largest and most profitable. However, even after the 2013 acquisition that more than
doubled sales in the Chlorovinyls segment, AXLL’s major competitors in this segment, are still much larger. For
example, AXLL, even relative to its largest chemical products, only produces about 60% or less of the amounts
produced by either Occidental Chemical (a subsidiary of Occidental Petroleum) or Dow Chemical. In summary,
AXLL does not seem to possess any significant advantages in cost structure, product quality, delivery, or
technical services in this segment and is forced to compete primarily on price with the result being low to
moderate profit levels.
Building Products Segment: In the Building Products segment, which makes up 19% of AXLL’s sales, AXLL
faces competition from numerous manufacturers of vinyl products and traditional building materials, including
VEKA, VisionGroup, IPEX and PlyGem. Market share for AXLL within this segment is very small, and
AXLL’s low profit margins within this segment suggest that it lacks significant competitive advantages. Still,
CFA Institute Research Challenge Axiall Corporation
Recommendation: Sell 1/22/2015
4
AXLL has been attempting to carve out a niche by developing environmentally friendly and sustainable building
products that differentiate AXLL from the competition. For example, this week at the 2015 International
Builders’ Show, AXLL introduced durable and low-maintenance siding products with the look and feel of
wood. However, we anticipate that if demand grows for such products, numerous competitors will develop
comparable competing products.
Aromatics Segment: In the Aromatics segment, which represents 17% of sales, AXLL’s historically low
operating income has declined in recent years and turned negative in 2014, as a result of slack export demand,
increased international industry capacity, and margin pressure caused by rising benzene and propylene prices.
As a result, AXLL is considering divesting this segment. Such ongoing low profit levels and the expressed
desire to divest the segment demonstrate AXLL’s lack of sustainable competitive advantages in this segment.
Overall Summary: The maturity of the industry and the high levels of rivalry and potential substitutes
discourage investment in the chemicals industry. The returns on investment have been historically low for
AXLL and the industry in general. These returns suggest that this industry does not facilitate sustainable
competitive advantages for firms. Along this line, AXLL lacks sustainable competitive advantages in all
segments. There is little reason for customers to prefer AXLL’s products over those of its competitors, unless
AXLL offers lower prices. The present excess capacity within the industry only exasperates these issues. In the
Chlorovinyls segment, significant new capacity has been added in North America by competitors in anticipation
of growth in demand that has not yet materialized. The U.S. housing bubble created excess capacity in the
building products industry; although this excess still lingers, it has lessened as the housing market has
recovered. Finally, AXLL’s U.S. facilities are at a disadvantage relative to transportation costs for the largest
growth opportunities in Pacific Asia, particularly India and China, and the U.S. dollar’s recent strength reduces
the international competitiveness of AXLL’s U.S. facilities.
Investment Summary We are initiating coverage on AXLL with a Sell recommendation and a target price of $32. Various
qualitative and quantitative factors motivate our Sell recommendation.
No Sustainable Competitive Advantages: AXLL lacks sustainable competitive advantages in all of its
segments. Any advantages noted by AXLL, such as vertical integration, are also possessed by various
competitors. AXLL’s below-industry profit levels reflect its lack of competitive advantages.
Current Excess Capacity in the Industry: There have been recent capacity additions by competitors, such as
Dow Chemical and Occidental Chemical, that have caused current industry capacity to be excessive and
margins to decline significantly in 2014. In the Outlook section of its September 2014 10Q (page 56), AXLL
suggests that it may take several years for demand growth to offset this recently added capacity. Economies of
scale in this industry require massive plants and plant construction can take multiple years. Supply and demand
imbalances can easily result when new plants open and forecasted demand growth has not materialized. Excess
industry capacity in both the Chlorovinyls and Aromatics segments is currently suppressing AXLL’s profits.
Low Growth in Industry: Demand for many of AXLL’s products depends significantly on the construction
industry. However, in part due to a lack of income growth, the housing market has plateaued at a new normal,
despite very low mortgage rates. In addition, the prior lax lending standards created an artificially high level of
housing starts that will not be reached in the foreseeable future. Due to higher prior levels of construction, there
is excess capacity in many areas related to housing. We are forecasting that AXLL’s recent low single-digit
levels of organic revenue growth will continue for the foreseeable future.
Overpayment for Eagle Spinco Acquisition: AXLL’s capital structure is burdened by its overpayment for the
January 2013 acquisition of Eagle Spinco, a spinoff of PPG Industries. This acquisition left AXLL with little
additional debt capacity, and its doubling of AXLL’s common shares outstanding has diluted subsequent EPS
amounts. Profit margins of the acquired operations significantly declined in 2014, despite the synergies claimed
by AXLL from the acquisition. As noted in the Financial Analysis section, the price paid for the acquisition is
excessive relative to recent incremental profit levels.
Excessive Earnings Growth Reflected in Current Stock Price: Our target price reflects strong operating
earnings growth of 89% in 2015. Such growth is in the lower quartile of a broad range of analysts’ forecasts.
AXLL’s current stock price, based on our analysis, anticipates that EPS will more than double in 2015 in
comparison to 2014 pro forma levels, despite no significant EPS growth in recent quarters. We believe that the
amount of EPS growth built into the stock price is excessive and may also fail to recognize AXLL’s artificially
low tax rate in 2014.
CFA Institute Research Challenge Axiall Corporation
Recommendation: Sell 1/22/2015
5
$10 $20 $30 $40 $50 $60
DCF
EV/EBITDA
P/E
Value Per Share
Valu
ati
on
Met
hod
Valuation Football Field
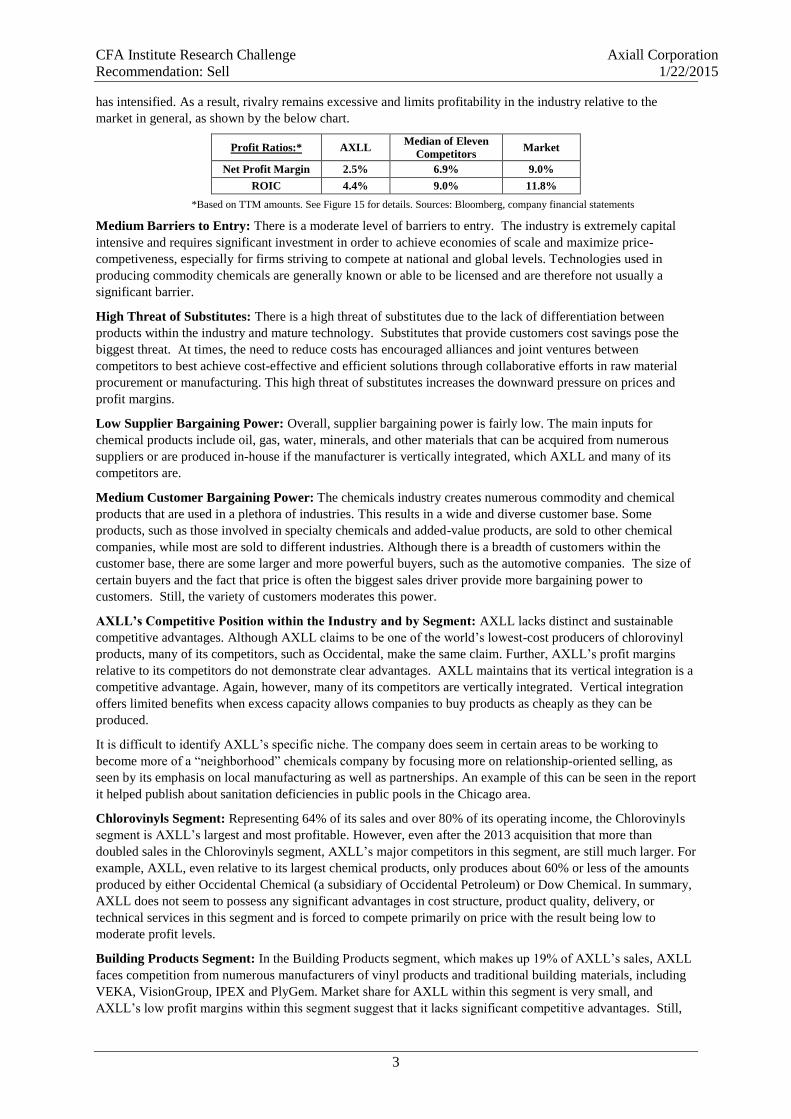
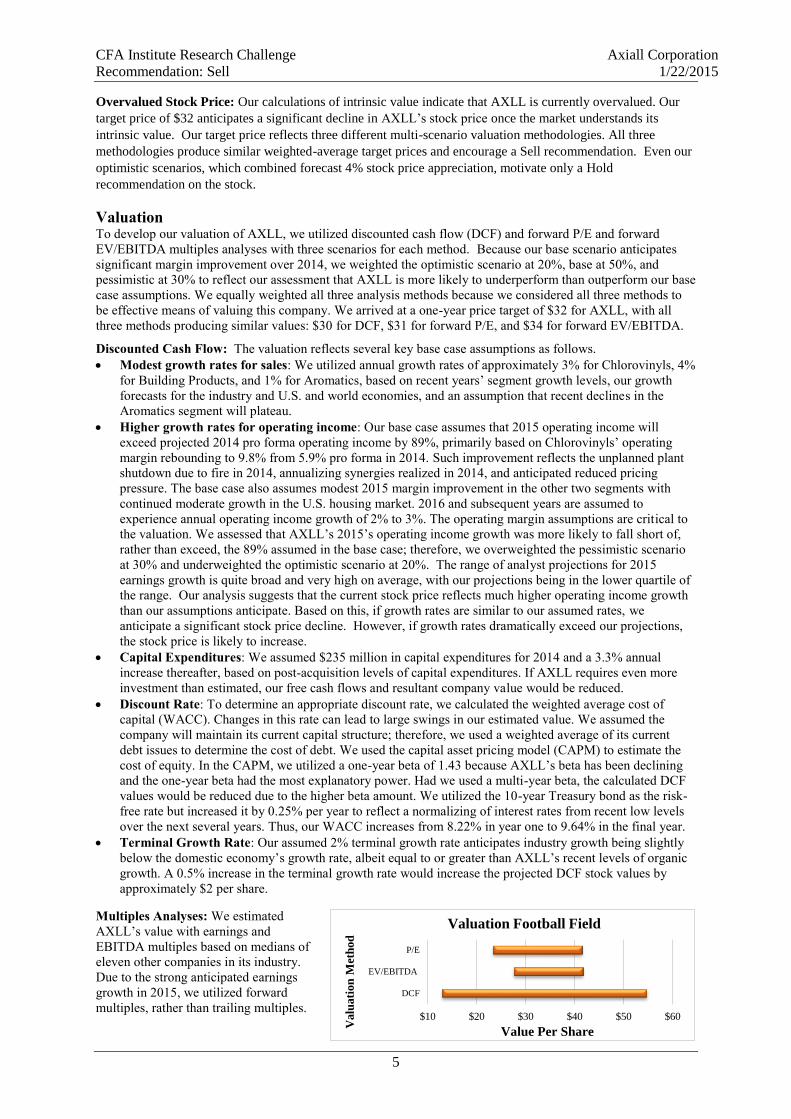
Overvalued Stock Price: Our calculations of intrinsic value indicate that AXLL is currently overvalued. Our
target price of $32 anticipates a significant decline in AXLL’s stock price once the market understands its
intrinsic value. Our target price reflects three different multi-scenario valuation methodologies. All three
methodologies produce similar weighted-average target prices and encourage a Sell recommendation. Even our
optimistic scenarios, which combined forecast 4% stock price appreciation, motivate only a Hold
recommendation on the stock.
Valuation To develop our valuation of AXLL, we utilized discounted cash flow (DCF) and forward P/E and forward
EV/EBITDA multiples analyses with three scenarios for each method. Because our base scenario anticipates
significant margin improvement over 2014, we weighted the optimistic scenario at 20%, base at 50%, and
pessimistic at 30% to reflect our assessment that AXLL is more likely to underperform than outperform our base
case assumptions. We equally weighted all three analysis methods because we considered all three methods to
be effective means of valuing this company. We arrived at a one-year price target of $32 for AXLL, with all
three methods producing similar values: $30 for DCF, $31 for forward P/E, and $34 for forward EV/EBITDA.
Discounted Cash Flow: The valuation reflects several key base case assumptions as follows.
Modest growth rates for sales: We utilized annual growth rates of approximately 3% for Chlorovinyls, 4%
for Building Products, and 1% for Aromatics, based on recent years’ segment growth levels, our growth
forecasts for the industry and U.S. and world economies, and an assumption that recent declines in the
Aromatics segment will plateau.
Higher growth rates for operating income: Our base case assumes that 2015 operating income will
exceed projected 2014 pro forma operating income by 89%, primarily based on Chlorovinyls’ operating
margin rebounding to 9.8% from 5.9% pro forma in 2014. Such improvement reflects the unplanned plant
shutdown due to fire in 2014, annualizing synergies realized in 2014, and anticipated reduced pricing
pressure. The base case also assumes modest 2015 margin improvement in the other two segments with
continued moderate growth in the U.S. housing market. 2016 and subsequent years are assumed to
experience annual operating income growth of 2% to 3%. The operating margin assumptions are critical to
the valuation. We assessed that AXLL’s 2015’s operating income growth was more likely to fall short of,
rather than exceed, the 89% assumed in the base case; therefore, we overweighted the pessimistic scenario
at 30% and underweighted the optimistic scenario at 20%. The range of analyst projections for 2015
earnings growth is quite broad and very high on average, with our projections being in the lower quartile of
the range. Our analysis suggests that the current stock price reflects much higher operating income growth
than our assumptions anticipate. Based on this, if growth rates are similar to our assumed rates, we
anticipate a significant stock price decline. However, if growth rates dramatically exceed our projections,
the stock price is likely to increase.
Capital Expenditures: We assumed $235 million in capital expenditures for 2014 and a 3.3% annual
increase thereafter, based on post-acquisition levels of capital expenditures. If AXLL requires even more
investment than estimated, our free cash flows and resultant company value would be reduced.
Discount Rate: To determine an appropriate discount rate, we calculated the weighted average cost of
capital (WACC). Changes in this rate can lead to large swings in our estimated value. We assumed the
company will maintain its current capital structure; therefore, we used a weighted average of its current
debt issues to determine the cost of debt. We used the capital asset pricing model (CAPM) to estimate the
cost of equity. In the CAPM, we utilized a one-year beta of 1.43 because AXLL’s beta has been declining
and the one-year beta had the most explanatory power. Had we used a multi-year beta, the calculated DCF
values would be reduced due to the higher beta amount. We utilized the 10-year Treasury bond as the risk-
free rate but increased it by 0.25% per year to reflect a normalizing of interest rates from recent low levels
over the next several years. Thus, our WACC increases from 8.22% in year one to 9.64% in the final year.
Terminal Growth Rate: Our assumed 2% terminal growth rate anticipates industry growth being slightly
below the domestic economy’s growth rate, albeit equal to or greater than AXLL’s recent levels of organic
growth. A 0.5% increase in the terminal growth rate would increase the projected DCF stock values by
approximately $2 per share.
Multiples Analyses: We estimated
AXLL’s value with earnings and
EBITDA multiples based on medians of
eleven other companies in its industry.
Due to the strong anticipated earnings
growth in 2015, we utilized forward
multiples, rather than trailing multiples.
CFA Institute Research Challenge Axiall Corporation
Recommendation: Sell 1/22/2015
6
We also calculated values based on trailing multiples, and these supported our overall Sell recommendation
since the values were well below our $32 price target. Our revenue growth and operating income growth
assumptions were the same as those noted above in the DCF section.
We utilized a median forward EBITDA multiple of 6.3x, which was somewhat below the trailing EBITDA
median multiple of 7.3x. We used a median forward P/E multiple of 12.7x, which was somewhat below the
trailing P/E median multiple of 14.8x. Because AXLL lacks any significant sustainable competitive advantages
relative to its competitors, we determined that multiples above the medians could not be justified. We also
utilized the medians because we could identify no direct competitor with similar market shares and exposures to
AXLL’s three segments. Please refer to Figure 16 for details of the multiples calculations and Figure 17 for the
competitors’ multiples table.
Financial Analysis Prior to analyzing the financial results and financial position of AXLL, we discuss its January 2013 acquisition
of Eagle Spinco, since this acquisition significantly impacts the financial analysis.
Acquisition of Eagle Spinco: On January 28, 2013, Georgia Gulf Corporation acquired substantially all of the
assets and liabilities of Eagle Spinco, a spinoff of PPG Industries’ businesses engaged in the production of
chlorine caustic, soda, and related chemicals. The combined company was renamed Axiall Corporation and
immediately became the third-largest chlor-alkali producer and second-largest vinyl chloride monomer producer
in North America. The acquisition purchase price was approximately $2.8 billion, which was financed through
the assumption of $967 million of debt and the issuance of 35.2 million shares of common stock valued at
approximately $1.8 billion. As a result of the acquisition, AXLL’s shares outstanding essentially doubled to 70
million, while its revenues increased by approximately 40%, virtually all in the Chlorovinyls segment.
In 2012 filings, management anticipated up to $125 million of one-time costs related to the acquisition, of which
$71 million and $25 million were recognized in 2013 and September 2014 YTD, respectively. In the 2012
filings, management predicted $115 million of total annual synergies resulting from the acquisition. In February,
2014, management increased its synergy expectation to $140 million. To date, AXLL has reported $85 million
of realized synergies in 2013 and an additional $70 million in 2014. Management has provided few details of the
realized synergies beyond three categories of synergies: procurement and logistics; operating rate; and general
and administrative reductions. Despite these asserted synergies, the Chlorovinyls segment’s operating income,
which increased from its pre-acquisition level of $174 million in 2012 to $410 million in 2013, is projected to
revert to approximately $174 million in 2014. This level of profits suggests that the Chlorovinyl’s operating
income would be minimal, at less than 1% of sales, without these synergies. Large additional North American
competitor facilities have recently come online and resulted in excess industry capacity, increased price
competition, and significant declines in profit margins.
The primary driver behind the acquisition was the assumption that AXLL would benefit substantially from the
resulting large-scale and consequently low-cost production capabilities, strong export potential, and an
integrated product offering that would leave AXLL positioned to greatly benefit from a housing market
comeback. At the time of the acquisition, AXLL either was unaware of the large competitive plants under
construction or assumed that demand growth would quickly absorb the increased supply. In retrospect, the 2014
declines in the Chlorovinyls segment’s margins indicate that the purchase price paid for Eagle Spinco was
excessive. $444 million of incremental EBITDA is needed justify a $2.8 billion purchase price using a 6.3
forward EBITDA multiple, based on the current median of competitor forward EBITDA multiples. The total of
55%, or $105 million, of the Chlorovinyls segment’s 2014 estimated pro forma operating profits plus $135
million of incremental depreciation and amortization suggests that only $240 million EBITDA (or 54% of the
needed amount) is attributable to Eagle Spinco. Our base case projections for strong growth in 2015 operating
profits still leave us well short of the EBITDA required (67% of the needed amount) to justify the acquisition
price, and even our optimistic case only provides 76% of the needed amount.
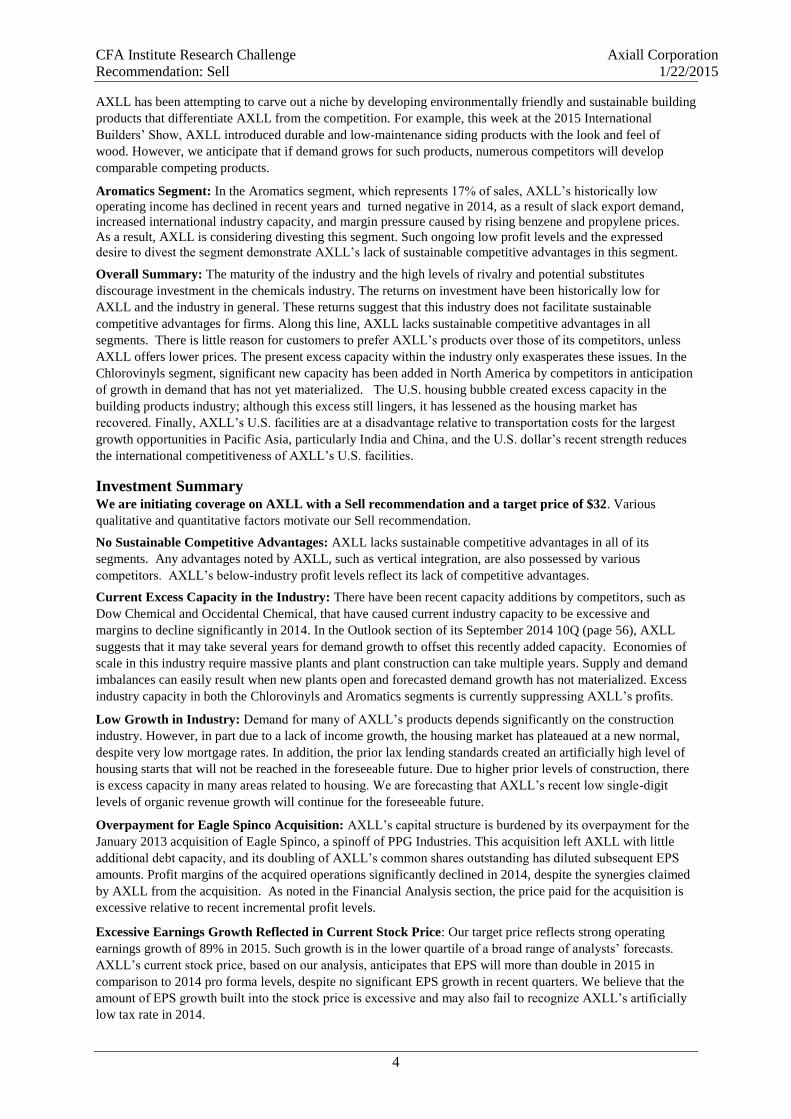
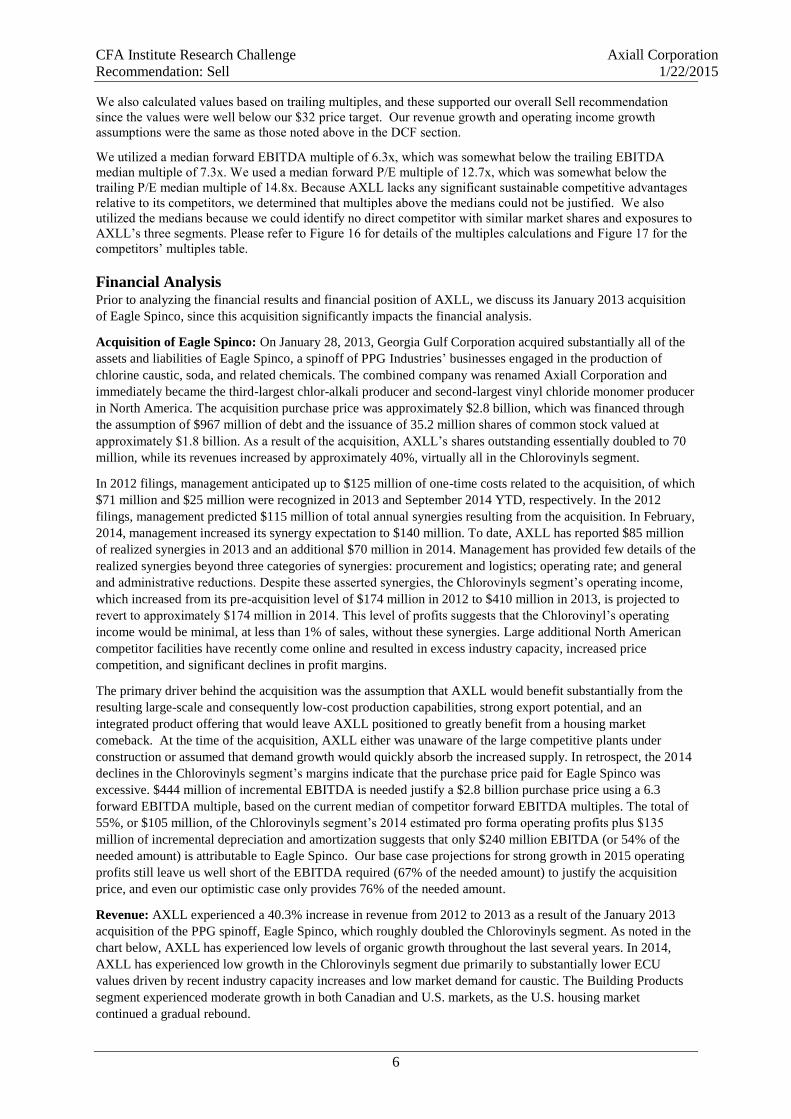
Revenue: AXLL experienced a 40.3% increase in revenue from 2012 to 2013 as a result of the January 2013
acquisition of the PPG spinoff, Eagle Spinco, which roughly doubled the Chlorovinyls segment. As noted in the
chart below, AXLL has experienced low levels of organic growth throughout the last several years. In 2014,
AXLL has experienced low growth in the Chlorovinyls segment due primarily to substantially lower ECU
values driven by recent industry capacity increases and low market demand for caustic. The Building Products
segment experienced moderate growth in both Canadian and U.S. markets, as the U.S. housing market
continued a gradual rebound.
CFA Institute Research Challenge Axiall Corporation
Recommendation: Sell 1/22/2015
7
Revenue Growth by Segment 2012 2013 Pro Forma 2014
Chlorovinyls 2.0% 116.9% 1.1%
Building Products -0.8% -3.1% 5.3%
Aromatics 8.2% -18.6% -12.5%
Consolidated 3.2% 40.3% -0.8%
Source: AXLL financial statements, student estimates
We anticipate continued top-line pressure for the Chlorovinyls segment from weak market demand and capacity
build-up unless there is an industry-wide move to cut capacity. The Building Products segment is likely to
continue its moderate growth in line with the growth in the U.S. housing market. The Aromatics segment
continues to face increasing difficulties as a result of falling phenol and acetone sales due to weak export
demands, margin pressures resulting from increasing benzene and propylene prices, and increased global
capacity. In addition, AXLL’s exports will continue to suffer as a result of the strengthening U.S. dollar.
Gross Margin: AXLL has been able to take advantage of lower energy prices due to the shale gas boom.
Energy costs comprise a significant portion of AXLL’s total cost of production; over the past several years as
the result of this low cost structure, AXLL experienced decreases in Cost of Goods Sold percentages from
90.6% in 2011, to 86.2% in 2012, and 84.1% in 2013. This coupled with top-line growth resulted in gross profit
margin increases of 9.5% in 2011, 40.5% in 2012, and 67.5% in 2013. The recent decreasing trend in oil prices
is likely to pose a significant threat to AXLL as it could result in a decrease of shale gas and the loss of AXLL’s
low cost energy advantage. Competitive pricing pressures due to excess capacity in both the Chlorovinyls and
Aromatics segments has caused the TTM gross profit dollars to decline 22.8% and the gross profit percentage to
decrease from 15.1% in 2013 to 11.8% TTM.
*Pro Forma Operating Margins exclude asset write-downs and acquisition-related costs.
Source: AXLL financial statements, student estimates
Operating Margin: AXLL’s operating profit margins improved from 4.2% in 2011, to 7.7% in 2012 and 9.5%
in 2013 excluding one-time expenses. This growth in the operating margin was tempered by an increase in
SG&A expenses from 5.2% in 2011, to 6.1% in 2012 and 6.4% in 2013. TTM September 2014 shows
significant decreases in operating profit margin that we project to continue through the end of 2014. Excluding
one-time expenses, we project a -52.8% drop in operating profit margin to 4.5% in 2014 as the result of excess
capacity and ongoing pricing pressures in the Chlorovinyls and Aromatics segments. Also, lower ECU values,
an unplanned plant outage that artificially lowered operating rates, increased maintenance costs, and increased
operating costs in the Chlorovinyls segment, and increases in the costs of ethylene and natural gas have reduced
2014 profit margins.
Net Profit Margin: AXLL’s net profit margin increased from 1.8% in 2011 to 3.6% in 2012 and decreased
slightly to 3.5% in 2013. We are projecting a further decrease to approximately 1.6% in 2014 due to lower
operating profits.
EPS: AXLL’s EPS decreased from $3.46 in 2012 to $2.44 in 2013 as a 37% increase in net income was more
than offset by an almost doubling of the share count as a result of the January 2013 acquisition of Eagle Spinco.
We are projecting a further decrease to $1.05 (or $1.30 excluding acquisition-related expenses and asset write-
downs) in 2014 due to aforementioned declines in 2014 profitability.
$-
$1.0
$2.0
$3.0
$4.0
$5.0
2011
A
2012
A
2013
A
2014
E
Revenue by Segment ($ Billions)
Building Products
Aromatics
Chlorvinyls
Chlorovin
yls
Aromatics
Building
Products
Total
AXLL
-2%
0%
2%
4%
6%
8%
10%
12%
14%
16%
2011A 2012A 2013A 2014E
Operating Margins* by Segment
CFA Institute Research Challenge Axiall Corporation
Recommendation: Sell 1/22/2015
8
Tax: In 2012 and 2013, AXLL’s income tax rate averaged 31%. In 2014, one-time accrual adjustments,
including the favorable impacts of changes in uncertain tax positions and of the expiration of statutory time
periods, have resulted in an unsustainably low book tax rate of 17% YTD. We forecast that AXLL’s book tax
rate will revert to 31% in 2015 and subsequently, which will make forecasted growth in EPS more difficult to
achieve. Due to minimal remaining U.S. tax loss carryforwards, we anticipate that future book taxes will
approximate cash taxes.
Cash Flow: Over the past several years, AXLL’s free cash flow and net income have been comparable.
Excluding acquisition-related items, AXLL’s capital expenditures have only slightly exceeded its depreciation.
Also, AXLL’s moderate levels of organic growth have required little incremental net working capital, due to
successful management of inventory and receivables at levels below industry averages.
Balance Sheet and Financing: As of September 2014, AXLL has approximately $1.4 billion in long-term debt
and capitalized lease financings, the bulk of which matures in 2021 and 2023. Moody’s has rated AXLL’s debt
as non-investment grade, with current Moody’s ratings of Ba3 and Ba1, depending on the debt. AXLL’s TIE
ratio of 3.0 and its current non-investment-grade ratings illustrate that AXLL has limited additional debt
capacity. Still, per a recent second amendment and restatement, it was able to increase its asset-based revolving
credit agreement used to fund working capital and operating activities from $500 million to $600 million.
Summary and Management Evaluation: Key conclusions from this financial analysis include the following:
1. The purchase price for Eagle Spinco appears excessive based on recent operating profit results.
2. AXLL’s overall organic growth has been minimal in recent years.
3. Increased costs and pricing pressure due to excess industry capacity have significantly reduced the 2014
profit levels of the Chlorovinyls segment. These factors have offset any reported acquisition synergies
achieved.
4. The Building Products segment has experienced moderate growth and increasing, albeit somewhat low,
operating profit margins. This should continue as the U.S. housing industry experiences moderate growth.
5. Due to weak demand and pricing pressures, the Aromatics segment, which comprises 17% of 2014 sales,
has provided little operating profit contribution to AXLL over the last several years. This may only worsen
going forward as the segment has been shrinking.
6. Anticipated reversion in AXLL’s income tax rate to 31% versus 17% 2014 YTD will reduce growth in EPS.
7. Current debt levels limit AXLL’s financial flexibility going forward.
8. As a result of the 2013 acquisition and the 2014 decline in profitability, AXLL’s investment returns have
declined: ROE from 20.0% in 2012, to 6.3% in 2013 and 4.3% TTM; ROA from 6.7% in 2012, to 2.8% in
2013 and 2.0% TTM; and ROIC from 15.4% in 2012, to 6.5% in 2013 and 4.4% TTM.
Other Considerations Short Positions: AXLL currently has high short positions of 4.2 days and 5.7% of float. 2015 EPS forecasts
have declined and short positions have been steadily rising since the third quarter of 2014, which suggests that
investors are beginning to question the optimistic EPS forecasts upon which AXLL’s current stock price is
based.
Share Repurchases: AXLL does not repurchase shares, nor does it have any plans to do so in the future.
AXLL’s current debt levels will make it difficult for AXLL to engage in significant share repurchases.
Dividends: AXLL’s dividend yield of 1.5% is below average when compared to the market. However, AXLL’s
payout ratio of 38% suggests that its dividend is sustainable. AXLL doubled its quarterly cash dividend in 2013
from $0.08 per share to $0.16 per share. There was no change in the dividend amount in 2014.
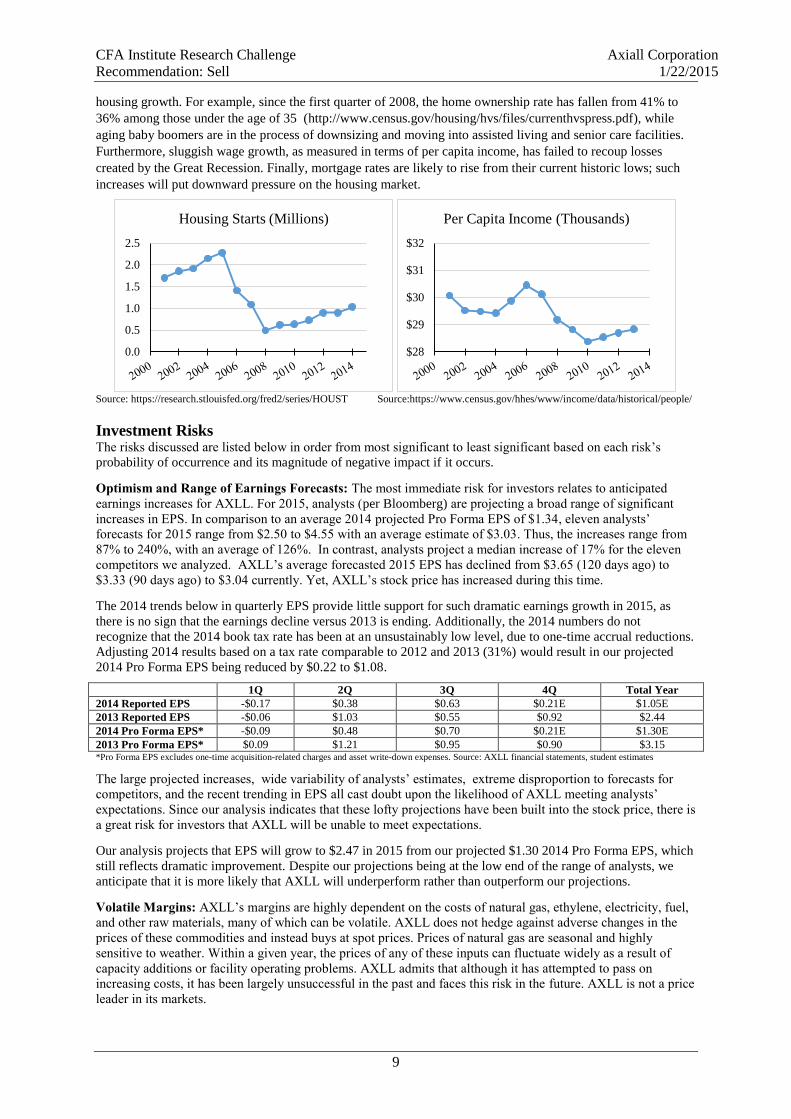
Housing Market Trends: Much of AXLL’s sales and profits are related to the U.S. housing market, either
indirectly in the case of vinyls, resins, paints, and adhesives produced in the Chlorovinyls and Aromatics
segment or directly through its Building Products segment. The burst of the housing bubble caused annual U.S.
housing starts to fall from over 2.2 million in 2005 to 0.5 million in 2008. Subsequently, annual housing starts
have recovered but appear to be plateauing at much lower levels than the bubble amounts. Implicit in many
analysts’ projections for strong earnings growth for AXLL seems to be an anticipated strong rebound in the
housing market to pre-recession levels. In contrast, our forecasts anticipate more tepid growth in housing. We
view recent U.S. housing construction numbers as a new normal that limits AXLL’s growth and profit potential.
This new normal recognizes that the bubble levels were artificially created by lax lending standards and other
factors not likely to be repeated. Current demographic trends and slow wage growth limit the potential for
CFA Institute Research Challenge Axiall Corporation
Recommendation: Sell 1/22/2015
9
housing growth. For example, since the first quarter of 2008, the home ownership rate has fallen from 41% to
36% among those under the age of 35 (http://www.census.gov/housing/hvs/files/currenthvspress.pdf), while
aging baby boomers are in the process of downsizing and moving into assisted living and senior care facilities.
Furthermore, sluggish wage growth, as measured in terms of per capita income, has failed to recoup losses
created by the Great Recession. Finally, mortgage rates are likely to rise from their current historic lows; such
increases will put downward pressure on the housing market.
Source: https://research.stlouisfed.org/fred2/series/HOUST Source:https://www.census.gov/hhes/www/income/data/historical/people/
Investment Risks The risks discussed are listed below in order from most significant to least significant based on each risk’s
probability of occurrence and its magnitude of negative impact if it occurs.
Optimism and Range of Earnings Forecasts: The most immediate risk for investors relates to anticipated
earnings increases for AXLL. For 2015, analysts (per Bloomberg) are projecting a broad range of significant
increases in EPS. In comparison to an average 2014 projected Pro Forma EPS of $1.34, eleven analysts’
forecasts for 2015 range from $2.50 to $4.55 with an average estimate of $3.03. Thus, the increases range from
87% to 240%, with an average of 126%. In contrast, analysts project a median increase of 17% for the eleven
competitors we analyzed. AXLL’s average forecasted 2015 EPS has declined from $3.65 (120 days ago) to
$3.33 (90 days ago) to $3.04 currently. Yet, AXLL’s stock price has increased during this time.
The 2014 trends below in quarterly EPS provide little support for such dramatic earnings growth in 2015, as
there is no sign that the earnings decline versus 2013 is ending. Additionally, the 2014 numbers do not
recognize that the 2014 book tax rate has been at an unsustainably low level, due to one-time accrual reductions.
Adjusting 2014 results based on a tax rate comparable to 2012 and 2013 (31%) would result in our projected
2014 Pro Forma EPS being reduced by $0.22 to $1.08.
1Q 2Q 3Q 4Q Total Year
2014 Reported EPS -$0.17 $0.38 $0.63 $0.21E $1.05E
2013 Reported EPS -$0.06 $1.03 $0.55 $0.92 $2.44
2014 Pro Forma EPS* -$0.09 $0.48 $0.70 $0.21E $1.30E
2013 Pro Forma EPS* $0.09 $1.21 $0.95 $0.90 $3.15 *Pro Forma EPS excludes one-time acquisition-related charges and asset write-down expenses. Source: AXLL financial statements, student estimates
The large projected increases, wide variability of analysts’ estimates, extreme disproportion to forecasts for
competitors, and the recent trending in EPS all cast doubt upon the likelihood of AXLL meeting analysts’
expectations. Since our analysis indicates that these lofty projections have been built into the stock price, there is
a great risk for investors that AXLL will be unable to meet expectations.
Our analysis projects that EPS will grow to $2.47 in 2015 from our projected $1.30 2014 Pro Forma EPS, which
still reflects dramatic improvement. Despite our projections being at the low end of the range of analysts, we
anticipate that it is more likely that AXLL will underperform rather than outperform our projections.
Volatile Margins: AXLL’s margins are highly dependent on the costs of natural gas, ethylene, electricity, fuel,
and other raw materials, many of which can be volatile. AXLL does not hedge against adverse changes in the
prices of these commodities and instead buys at spot prices. Prices of natural gas are seasonal and highly
sensitive to weather. Within a given year, the prices of any of these inputs can fluctuate widely as a result of
capacity additions or facility operating problems. AXLL admits that although it has attempted to pass on
increasing costs, it has been largely unsuccessful in the past and faces this risk in the future. AXLL is not a price
leader in its markets.
0.0
0.5
1.0
1.5
2.0
2.5
Housing Starts (Millions)
$28
$29
$30
$31
$32
Per Capita Income (Thousands)
CFA Institute Research Challenge Axiall Corporation
Recommendation: Sell 1/22/2015
10
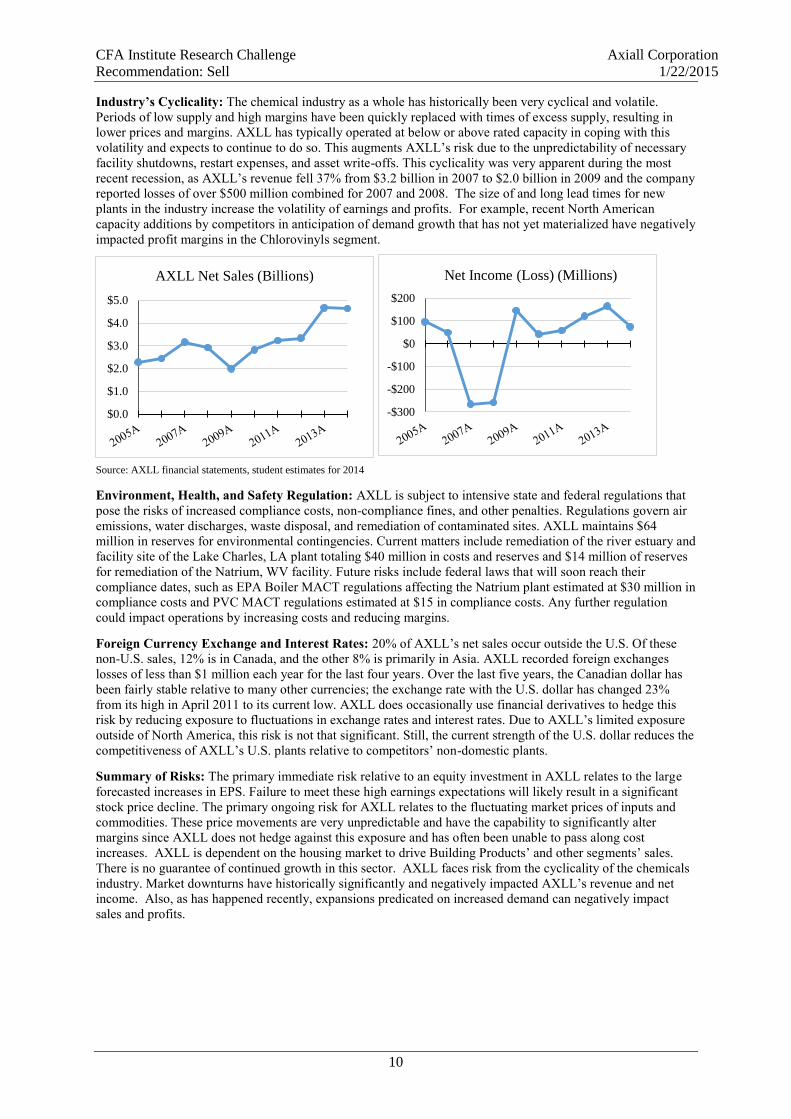
Industry’s Cyclicality: The chemical industry as a whole has historically been very cyclical and volatile.
Periods of low supply and high margins have been quickly replaced with times of excess supply, resulting in
lower prices and margins. AXLL has typically operated at below or above rated capacity in coping with this
volatility and expects to continue to do so. This augments AXLL’s risk due to the unpredictability of necessary
facility shutdowns, restart expenses, and asset write-offs. This cyclicality was very apparent during the most
recent recession, as AXLL’s revenue fell 37% from $3.2 billion in 2007 to $2.0 billion in 2009 and the company
reported losses of over $500 million combined for 2007 and 2008. The size of and long lead times for new
plants in the industry increase the volatility of earnings and profits. For example, recent North American
capacity additions by competitors in anticipation of demand growth that has not yet materialized have negatively
impacted profit margins in the Chlorovinyls segment.
Source: AXLL financial statements, student estimates for 2014
Environment, Health, and Safety Regulation: AXLL is subject to intensive state and federal regulations that
pose the risks of increased compliance costs, non-compliance fines, and other penalties. Regulations govern air
emissions, water discharges, waste disposal, and remediation of contaminated sites. AXLL maintains $64
million in reserves for environmental contingencies. Current matters include remediation of the river estuary and
facility site of the Lake Charles, LA plant totaling $40 million in costs and reserves and $14 million of reserves
for remediation of the Natrium, WV facility. Future risks include federal laws that will soon reach their
compliance dates, such as EPA Boiler MACT regulations affecting the Natrium plant estimated at $30 million in
compliance costs and PVC MACT regulations estimated at $15 in compliance costs. Any further regulation
could impact operations by increasing costs and reducing margins.
Foreign Currency Exchange and Interest Rates: 20% of AXLL’s net sales occur outside the U.S. Of these
non-U.S. sales, 12% is in Canada, and the other 8% is primarily in Asia. AXLL recorded foreign exchanges
losses of less than $1 million each year for the last four years. Over the last five years, the Canadian dollar has
been fairly stable relative to many other currencies; the exchange rate with the U.S. dollar has changed 23%
from its high in April 2011 to its current low. AXLL does occasionally use financial derivatives to hedge this
risk by reducing exposure to fluctuations in exchange rates and interest rates. Due to AXLL’s limited exposure
outside of North America, this risk is not that significant. Still, the current strength of the U.S. dollar reduces the
competitiveness of AXLL’s U.S. plants relative to competitors’ non-domestic plants.
Summary of Risks: The primary immediate risk relative to an equity investment in AXLL relates to the large
forecasted increases in EPS. Failure to meet these high earnings expectations will likely result in a significant
stock price decline. The primary ongoing risk for AXLL relates to the fluctuating market prices of inputs and
commodities. These price movements are very unpredictable and have the capability to significantly alter
margins since AXLL does not hedge against this exposure and has often been unable to pass along cost
increases. AXLL is dependent on the housing market to drive Building Products’ and other segments’ sales.
There is no guarantee of continued growth in this sector. AXLL faces risk from the cyclicality of the chemicals
industry. Market downturns have historically significantly and negatively impacted AXLL’s revenue and net
income. Also, as has happened recently, expansions predicated on increased demand can negatively impact
sales and profits.
$0.0
$1.0
$2.0
$3.0
$4.0
$5.0
AXLL Net Sales (Billions)
-$300
-$200
-$100
$0
$100
$200
Net Income (Loss) (Millions)
CFA Institute Research Challenge Axiall Corporation
Recommendation: Sell 1/22/2015
11
Appendix
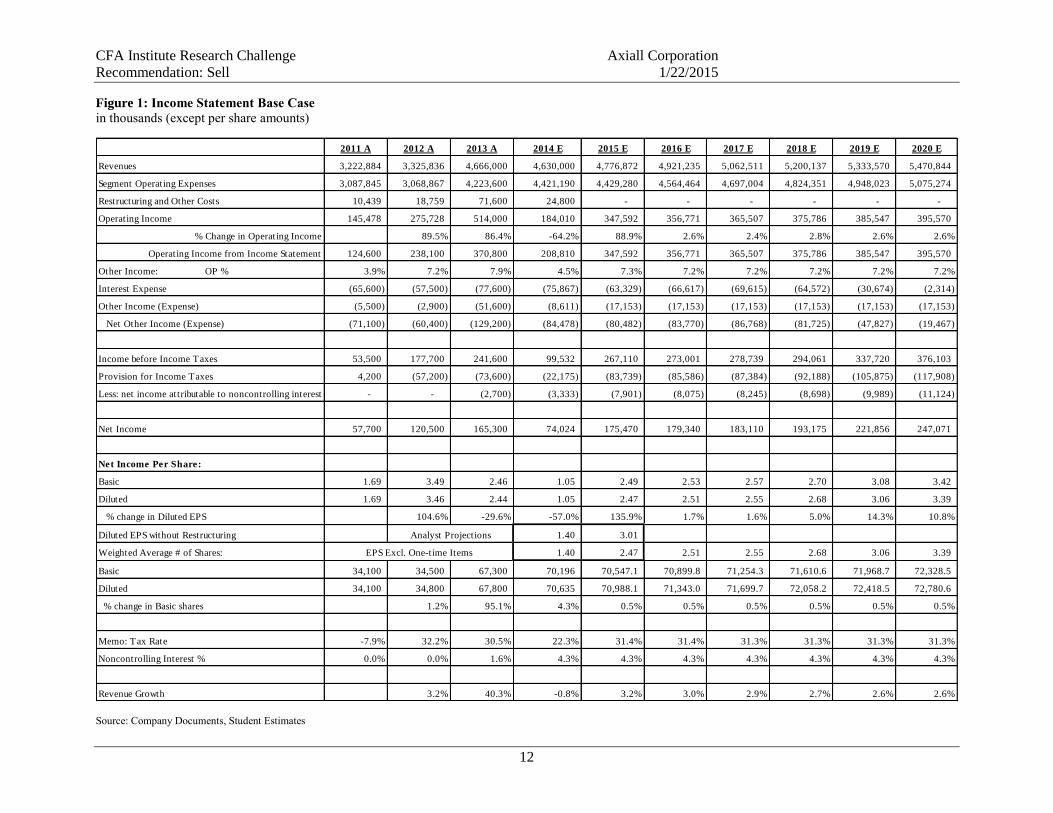
Figure 1: Income Statement Base Case
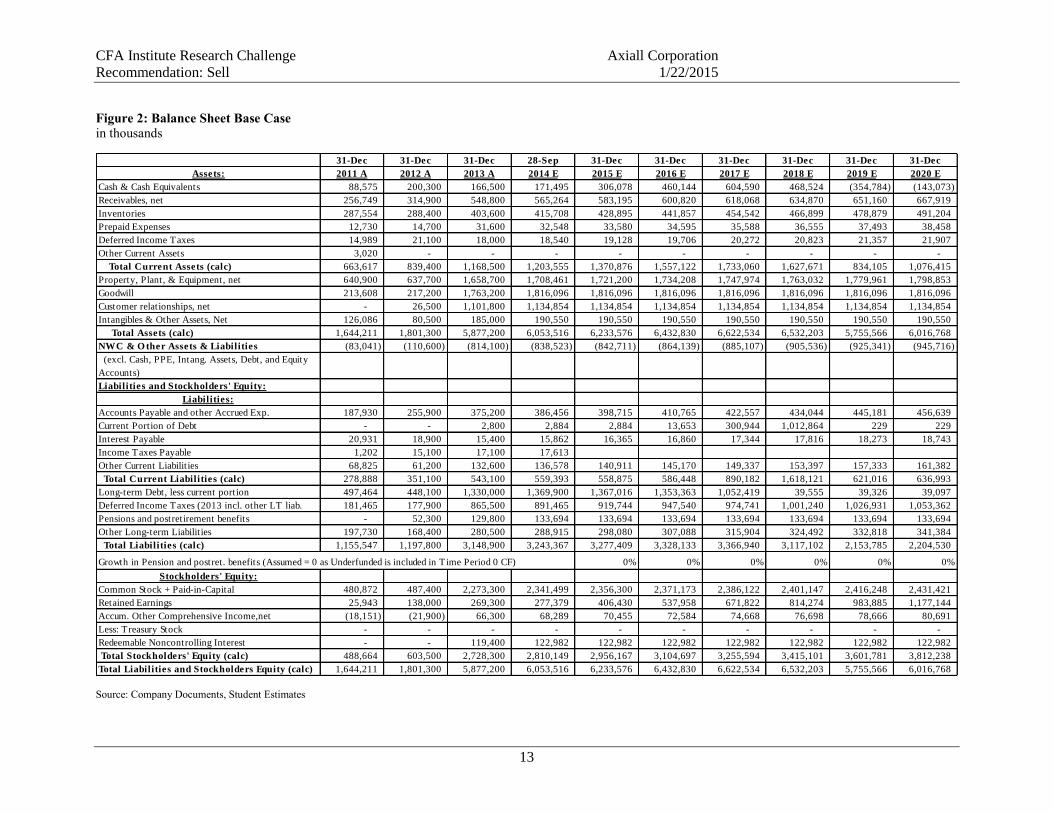
Figure 2: Balance Sheet Base Case
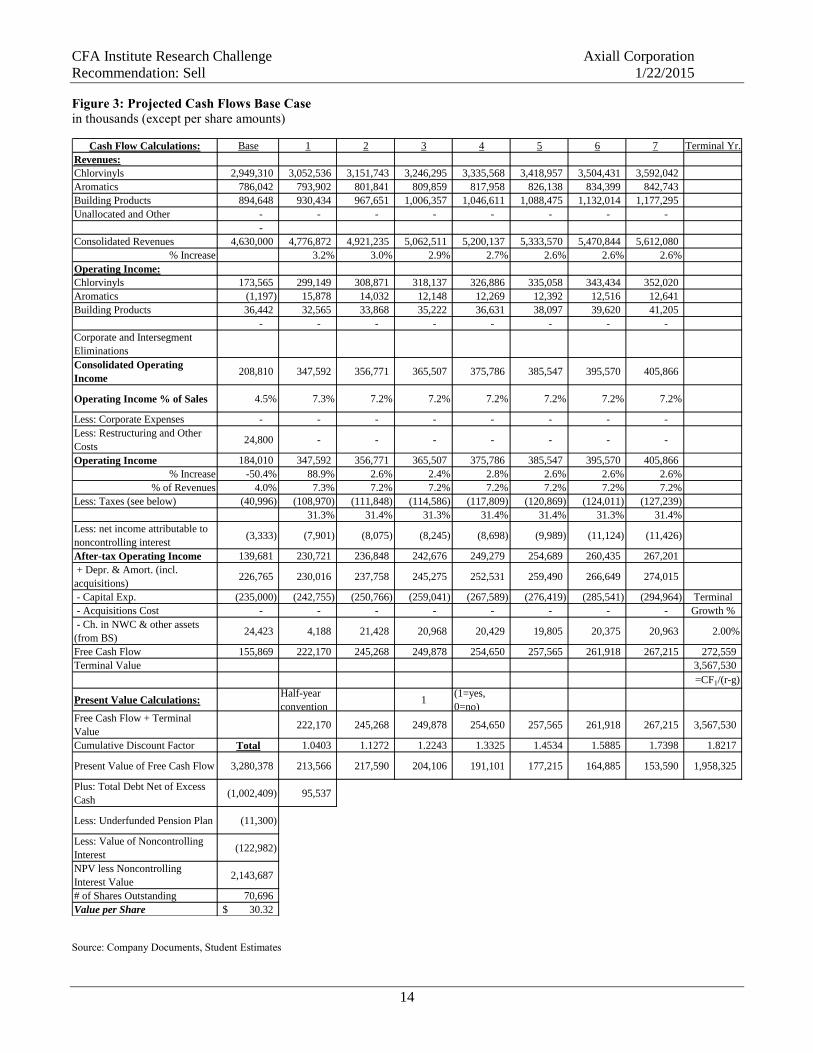
Figure 3: Projected Cash Flows Base Case
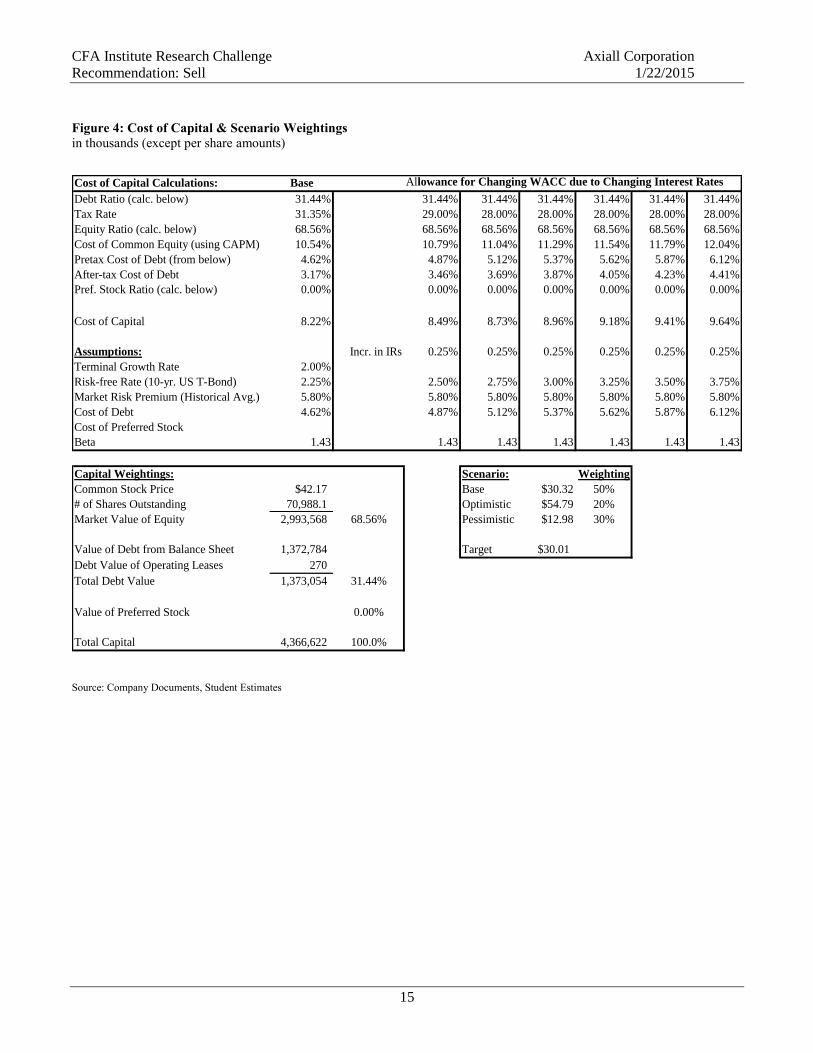
Figure 4: Cost of Capital & Scenario Weightings
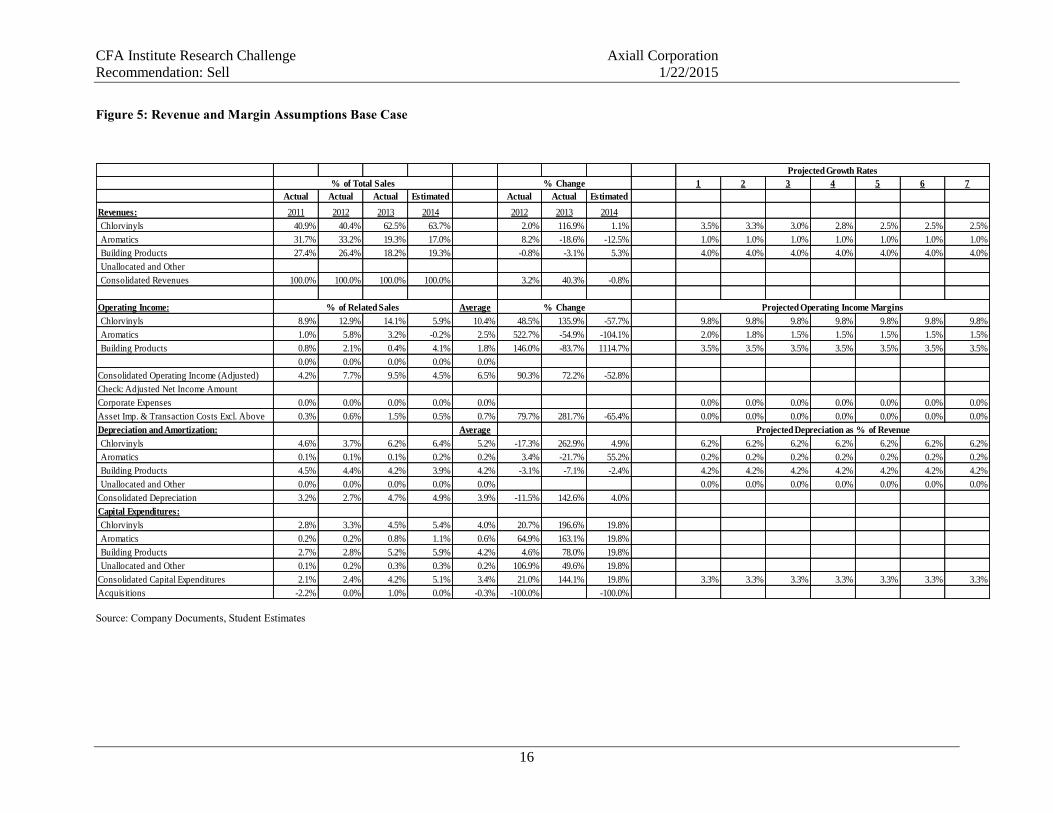
Figure 5: Revenue and Margins Assumptions Base Case
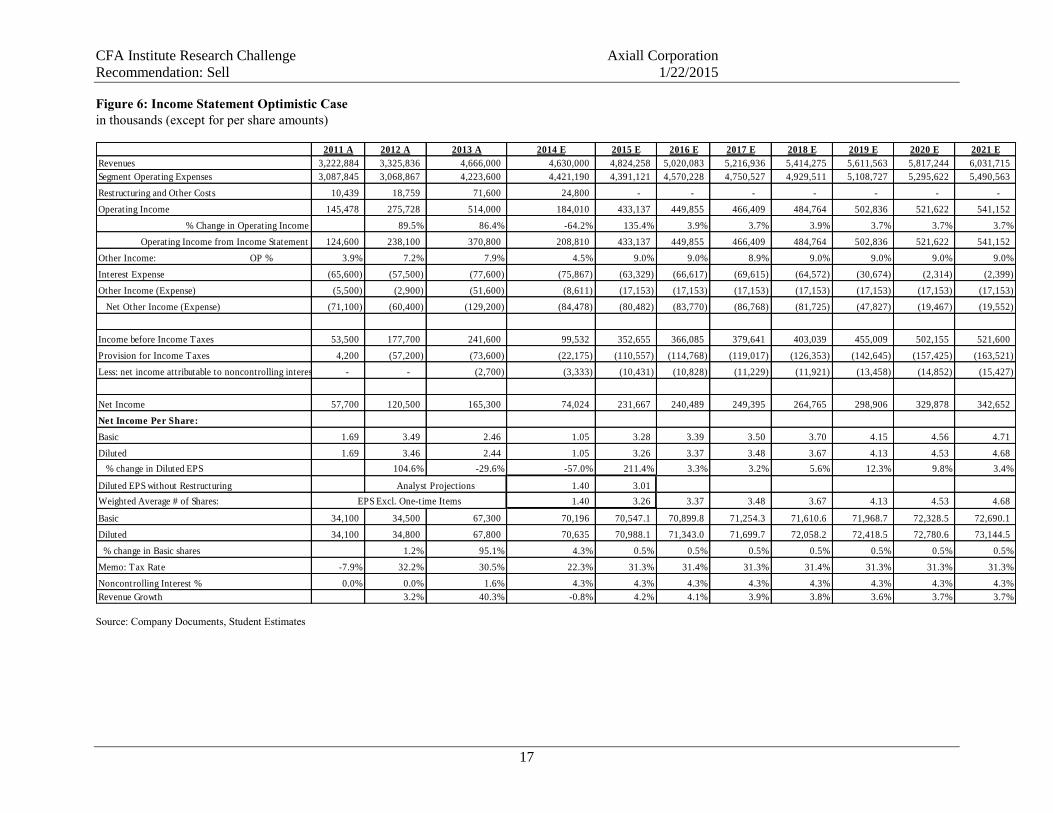
Figure 6: Income Statement Optimistic Case
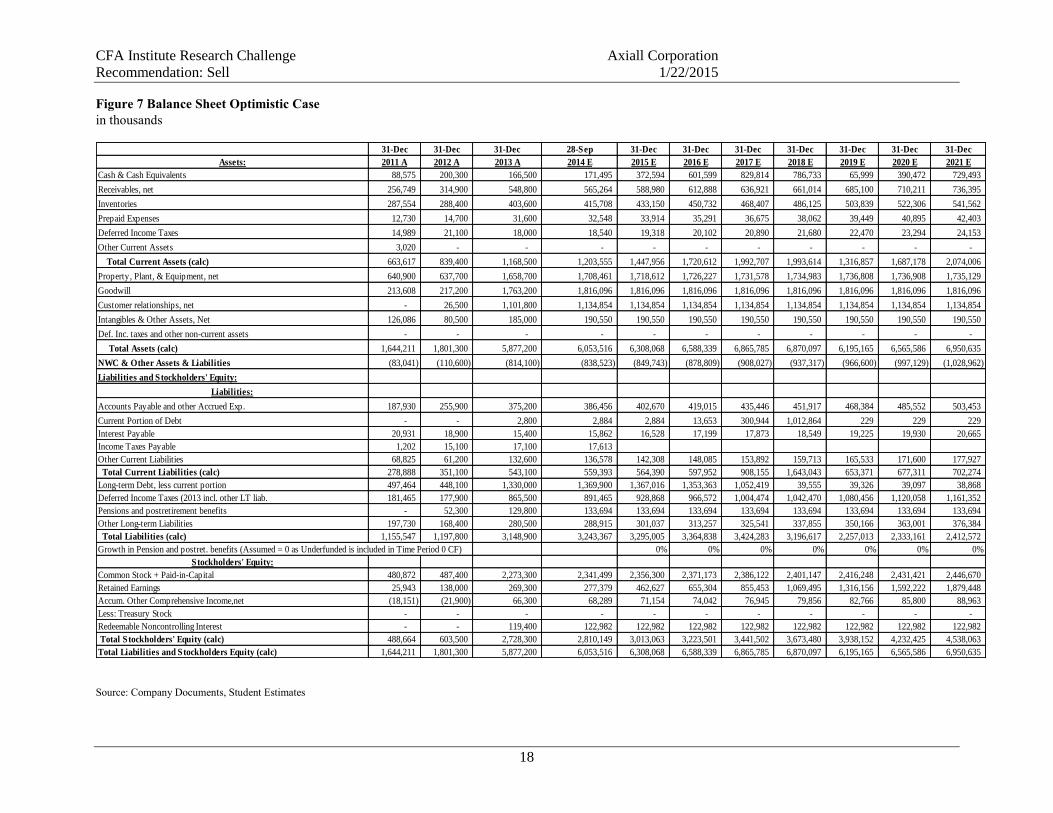
Figure 7: Balance Sheet Optimistic Case
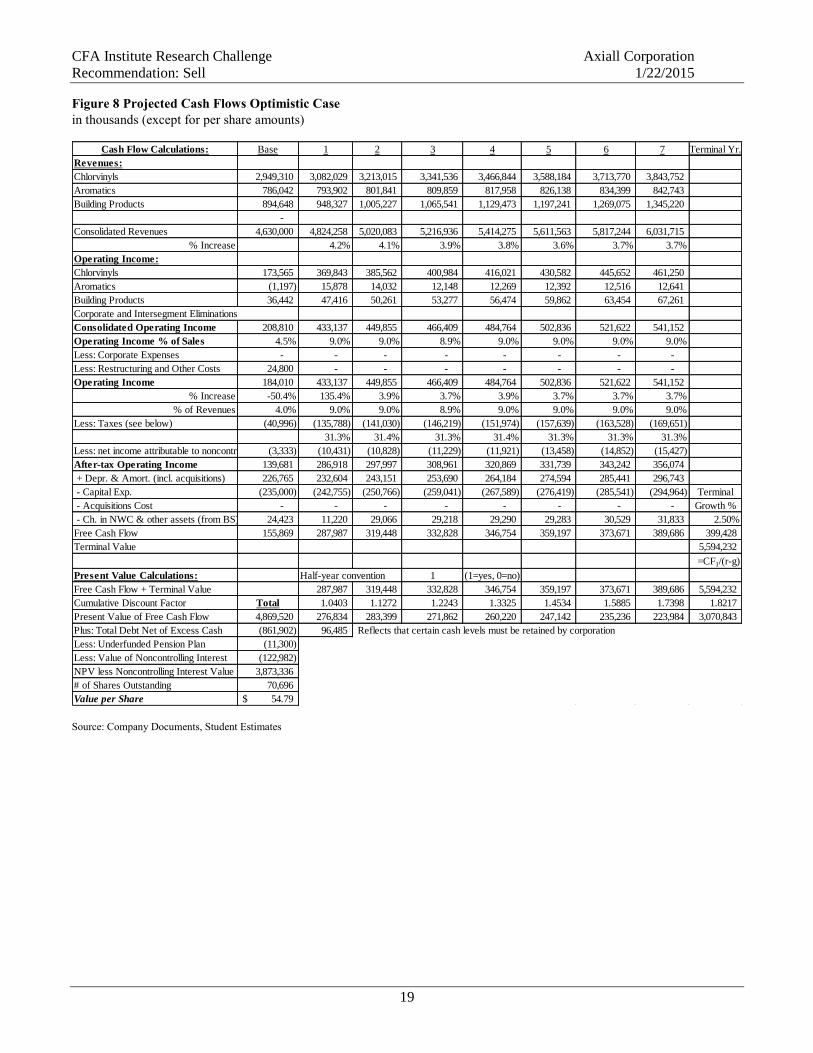
Figure 8: Projected Cash Flows Optimistic Case
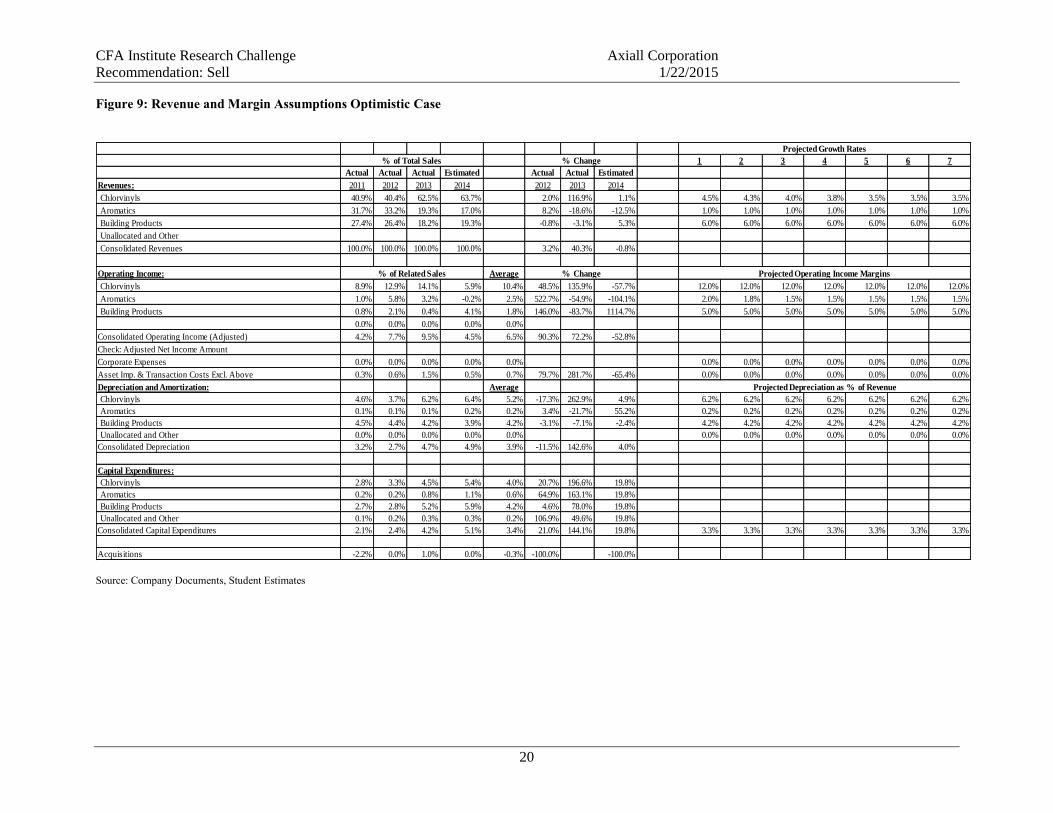
Figure 9: Revenue and Margins Assumptions Optimistic Case
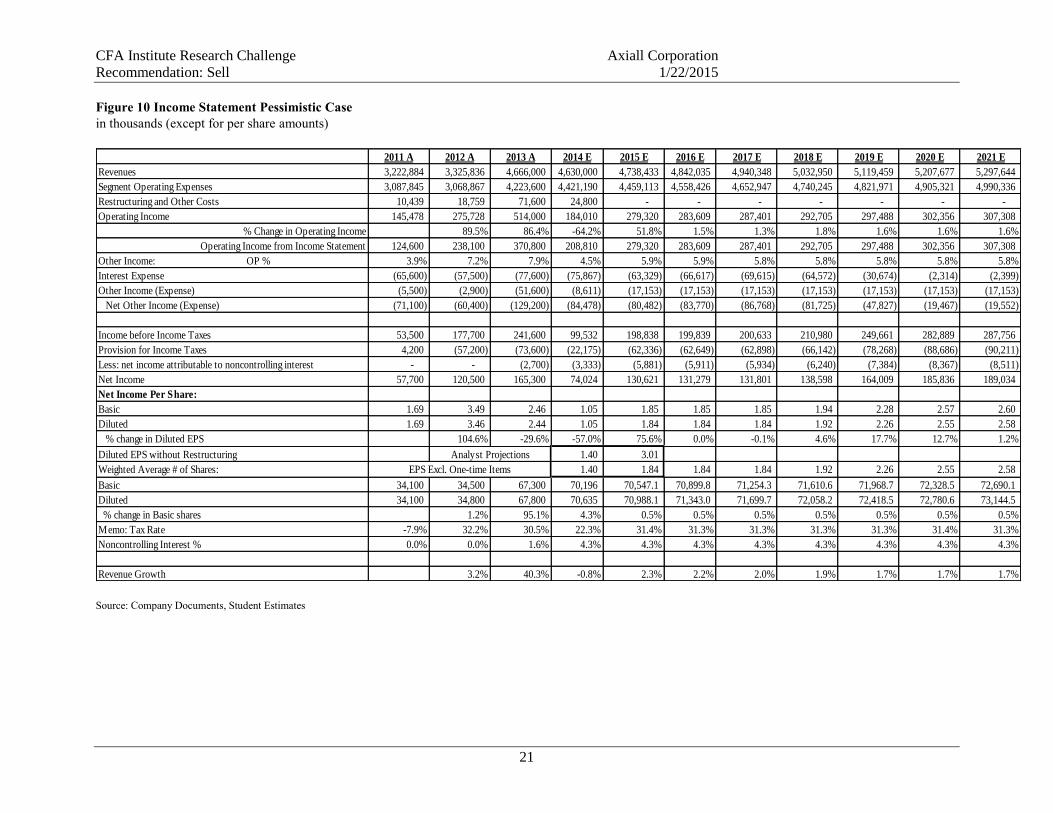
Figure 10: Income Statement Pessimistic Case
Figure 11: Balance Sheet Pessimistic Case
Figure 12: Projected Cash Flows Pessimistic Case
Figure 13: Revenue and Margins Assumptions Pessimistic Case
Figure 14: Financial Ratios
Figure 15: Comparable Company Profit Ratios Analysis
Figure 16: Multiples Analysis and Company Valuation
Figure 17: Analysis of Competitors’ Multiples
CFA Institute Research Challenge Axiall Corporation
Recommendation: Sell 1/22/2015
12
Figure 1: Income Statement Base Case
in thousands (except per share amounts)
Source: Company Documents, Student Estimates
2011 A 2012 A 2013 A 2014 E 2015 E 2016 E 2017 E 2018 E 2019 E 2020 E
Revenues 3,222,884 3,325,836 4,666,000 4,630,000 4,776,872 4,921,235 5,062,511 5,200,137 5,333,570 5,470,844
Segment Operating Expenses 3,087,845 3,068,867 4,223,600 4,421,190 4,429,280 4,564,464 4,697,004 4,824,351 4,948,023 5,075,274
Restructuring and Other Costs 10,439 18,759 71,600 24,800 - - - - - -
Operating Income 145,478 275,728 514,000 184,010 347,592 356,771 365,507 375,786 385,547 395,570
% Change in Operating Income 89.5% 86.4% -64.2% 88.9% 2.6% 2.4% 2.8% 2.6% 2.6%
Operating Income from Income Statement 124,600 238,100 370,800 208,810 347,592 356,771 365,507 375,786 385,547 395,570
Other Income: OP % 3.9% 7.2% 7.9% 4.5% 7.3% 7.2% 7.2% 7.2% 7.2% 7.2%
Interest Expense (65,600) (57,500) (77,600) (75,867) (63,329) (66,617) (69,615) (64,572) (30,674) (2,314)
Other Income (Expense) (5,500) (2,900) (51,600) (8,611) (17,153) (17,153) (17,153) (17,153) (17,153) (17,153)
Net Other Income (Expense) (71,100) (60,400) (129,200) (84,478) (80,482) (83,770) (86,768) (81,725) (47,827) (19,467)
Income before Income Taxes 53,500 177,700 241,600 99,532 267,110 273,001 278,739 294,061 337,720 376,103
Provision for Income Taxes 4,200 (57,200) (73,600) (22,175) (83,739) (85,586) (87,384) (92,188) (105,875) (117,908)
Less: net income attributable to noncontrolling interest - - (2,700) (3,333) (7,901) (8,075) (8,245) (8,698) (9,989) (11,124)
Net Income 57,700 120,500 165,300 74,024 175,470 179,340 183,110 193,175 221,856 247,071
Net Income Per Share:
Basic 1.69 3.49 2.46 1.05 2.49 2.53 2.57 2.70 3.08 3.42
Diluted 1.69 3.46 2.44 1.05 2.47 2.51 2.55 2.68 3.06 3.39
% change in Diluted EPS 104.6% -29.6% -57.0% 135.9% 1.7% 1.6% 5.0% 14.3% 10.8%
Diluted EPS without Restructuring 1.40 3.01
Weighted Average # of Shares: 1.40 2.47 2.51 2.55 2.68 3.06 3.39
Basic 34,100 34,500 67,300 70,196 70,547.1 70,899.8 71,254.3 71,610.6 71,968.7 72,328.5
Diluted 34,100 34,800 67,800 70,635 70,988.1 71,343.0 71,699.7 72,058.2 72,418.5 72,780.6
% change in Basic shares 1.2% 95.1% 4.3% 0.5% 0.5% 0.5% 0.5% 0.5% 0.5%
Memo: Tax Rate -7.9% 32.2% 30.5% 22.3% 31.4% 31.4% 31.3% 31.3% 31.3% 31.3%
Noncontrolling Interest % 0.0% 0.0% 1.6% 4.3% 4.3% 4.3% 4.3% 4.3% 4.3% 4.3%
Revenue Growth 3.2% 40.3% -0.8% 3.2% 3.0% 2.9% 2.7% 2.6% 2.6%
Analyst Projections
EPS Excl. One-time Items
CFA Institute Research Challenge Axiall Corporation
Recommendation: Sell 1/22/2015
13
Figure 2: Balance Sheet Base Case
in thousands
Source: Company Documents, Student Estimates
31-Dec 31-Dec 31-Dec 28-Sep 31-Dec 31-Dec 31-Dec 31-Dec 31-Dec 31-Dec
Assets: 2011 A 2012 A 2013 A 2014 E 2015 E 2016 E 2017 E 2018 E 2019 E 2020 E
Cash & Cash Equivalents 88,575 200,300 166,500 171,495 306,078 460,144 604,590 468,524 (354,784) (143,073)
Receivables, net 256,749 314,900 548,800 565,264 583,195 600,820 618,068 634,870 651,160 667,919
Inventories 287,554 288,400 403,600 415,708 428,895 441,857 454,542 466,899 478,879 491,204
Prepaid Expenses 12,730 14,700 31,600 32,548 33,580 34,595 35,588 36,555 37,493 38,458
Deferred Income Taxes 14,989 21,100 18,000 18,540 19,128 19,706 20,272 20,823 21,357 21,907
Other Current Assets 3,020 - - - - - - - - -
Total Current Assets (calc) 663,617 839,400 1,168,500 1,203,555 1,370,876 1,557,122 1,733,060 1,627,671 834,105 1,076,415
Property, Plant, & Equipment, net 640,900 637,700 1,658,700 1,708,461 1,721,200 1,734,208 1,747,974 1,763,032 1,779,961 1,798,853
Goodwill 213,608 217,200 1,763,200 1,816,096 1,816,096 1,816,096 1,816,096 1,816,096 1,816,096 1,816,096
Customer relationships, net - 26,500 1,101,800 1,134,854 1,134,854 1,134,854 1,134,854 1,134,854 1,134,854 1,134,854
Intangibles & Other Assets, Net 126,086 80,500 185,000 190,550 190,550 190,550 190,550 190,550 190,550 190,550
Total Assets (calc) 1,644,211 1,801,300 5,877,200 6,053,516 6,233,576 6,432,830 6,622,534 6,532,203 5,755,566 6,016,768
NWC & O ther Assets & Liabilities (83,041) (110,600) (814,100) (838,523) (842,711) (864,139) (885,107) (905,536) (925,341) (945,716)
(excl. Cash, PPE, Intang. Assets, Debt, and Equity
Accounts)
Liabilities and Stockholders' Equity:
Liabilities:
Accounts Payable and other Accrued Exp. 187,930 255,900 375,200 386,456 398,715 410,765 422,557 434,044 445,181 456,639
Current Portion of Debt - - 2,800 2,884 2,884 13,653 300,944 1,012,864 229 229
Interest Payable 20,931 18,900 15,400 15,862 16,365 16,860 17,344 17,816 18,273 18,743
Income Taxes Payable 1,202 15,100 17,100 17,613
Other Current Liabilities 68,825 61,200 132,600 136,578 140,911 145,170 149,337 153,397 157,333 161,382
Total Current Liabilities (calc) 278,888 351,100 543,100 559,393 558,875 586,448 890,182 1,618,121 621,016 636,993
Long-term Debt, less current portion 497,464 448,100 1,330,000 1,369,900 1,367,016 1,353,363 1,052,419 39,555 39,326 39,097
Deferred Income Taxes (2013 incl. other LT liab. 181,465 177,900 865,500 891,465 919,744 947,540 974,741 1,001,240 1,026,931 1,053,362
Pensions and postretirement benefits - 52,300 129,800 133,694 133,694 133,694 133,694 133,694 133,694 133,694
Other Long-term Liabilities 197,730 168,400 280,500 288,915 298,080 307,088 315,904 324,492 332,818 341,384
Total Liabilities (calc) 1,155,547 1,197,800 3,148,900 3,243,367 3,277,409 3,328,133 3,366,940 3,117,102 2,153,785 2,204,530
0% 0% 0% 0% 0% 0%
Stockholders' Equity:
Common Stock + Paid-in-Capital 480,872 487,400 2,273,300 2,341,499 2,356,300 2,371,173 2,386,122 2,401,147 2,416,248 2,431,421
Retained Earnings 25,943 138,000 269,300 277,379 406,430 537,958 671,822 814,274 983,885 1,177,144
Accum. Other Comprehensive Income,net (18,151) (21,900) 66,300 68,289 70,455 72,584 74,668 76,698 78,666 80,691
Less: Treasury Stock - - - - - - - - - -
Redeemable Noncontrolling Interest - - 119,400 122,982 122,982 122,982 122,982 122,982 122,982 122,982
Total Stockholders' Equity (calc) 488,664 603,500 2,728,300 2,810,149 2,956,167 3,104,697 3,255,594 3,415,101 3,601,781 3,812,238
Total Liabilities and Stockholders Equity (calc) 1,644,211 1,801,300 5,877,200 6,053,516 6,233,576 6,432,830 6,622,534 6,532,203 5,755,566 6,016,768
Growth in Pension and postret. benefits (Assumed = 0 as Underfunded is included in T ime Period 0 CF)
CFA Institute Research Challenge Axiall Corporation
Recommendation: Sell 1/22/2015
14
Figure 3: Projected Cash Flows Base Case
in thousands (except per share amounts)
Source: Company Documents, Student Estimates
Cash Flow Calculations: Base 1 2 3 4 5 6 7 Terminal Yr.
Revenues:
Chlorvinyls 2,949,310 3,052,536 3,151,743 3,246,295 3,335,568 3,418,957 3,504,431 3,592,042
Aromatics 786,042 793,902 801,841 809,859 817,958 826,138 834,399 842,743
Building Products 894,648 930,434 967,651 1,006,357 1,046,611 1,088,475 1,132,014 1,177,295
Unallocated and Other - - - - - - - -
-
Consolidated Revenues 4,630,000 4,776,872 4,921,235 5,062,511 5,200,137 5,333,570 5,470,844 5,612,080
% Increase 3.2% 3.0% 2.9% 2.7% 2.6% 2.6% 2.6%
Operating Income:
Chlorvinyls 173,565 299,149 308,871 318,137 326,886 335,058 343,434 352,020
Aromatics (1,197) 15,878 14,032 12,148 12,269 12,392 12,516 12,641
Building Products 36,442 32,565 33,868 35,222 36,631 38,097 39,620 41,205
- - - - - - - -
Corporate and Intersegment
Eliminations
Consolidated Operating
Income208,810 347,592 356,771 365,507 375,786 385,547 395,570 405,866
Operating Income % of Sales 4.5% 7.3% 7.2% 7.2% 7.2% 7.2% 7.2% 7.2%
Less: Corporate Expenses - - - - - - - -
Less: Restructuring and Other
Costs24,800 - - - - - - -
Operating Income 184,010 347,592 356,771 365,507 375,786 385,547 395,570 405,866
% Increase -50.4% 88.9% 2.6% 2.4% 2.8% 2.6% 2.6% 2.6%
% of Revenues 4.0% 7.3% 7.2% 7.2% 7.2% 7.2% 7.2% 7.2%
Less: Taxes (see below) (40,996) (108,970) (111,848) (114,586) (117,809) (120,869) (124,011) (127,239)
31.3% 31.4% 31.3% 31.4% 31.4% 31.3% 31.4%
Less: net income attributable to
noncontrolling interest(3,333) (7,901) (8,075) (8,245) (8,698) (9,989) (11,124) (11,426)
After-tax Operating Income 139,681 230,721 236,848 242,676 249,279 254,689 260,435 267,201
+ Depr. & Amort. (incl.
acquisitions)226,765 230,016 237,758 245,275 252,531 259,490 266,649 274,015
- Capital Exp. (235,000) (242,755) (250,766) (259,041) (267,589) (276,419) (285,541) (294,964) Terminal
- Acquisitions Cost - - - - - - - - Growth %
- Ch. in NWC & other assets
(from BS)24,423 4,188 21,428 20,968 20,429 19,805 20,375 20,963 2.00%
Free Cash Flow 155,869 222,170 245,268 249,878 254,650 257,565 261,918 267,215 272,559
Terminal Value 3,567,530
=CF1/(r-g)
Present Value Calculations:Half-year
convention1
(1=yes,
0=no)Free Cash Flow + Terminal
Value222,170 245,268 249,878 254,650 257,565 261,918 267,215 3,567,530
Cumulative Discount Factor Total 1.0403 1.1272 1.2243 1.3325 1.4534 1.5885 1.7398 1.8217
Present Value of Free Cash Flow 3,280,378 213,566 217,590 204,106 191,101 177,215 164,885 153,590 1,958,325
Plus: Total Debt Net of Excess
Cash(1,002,409) 95,537
Less: Underfunded Pension Plan (11,300)
Less: Value of Noncontrolling
Interest(122,982)
NPV less Noncontrolling
Interest Value2,143,687
# of Shares Outstanding 70,696
Value per Share 30.32$
CFA Institute Research Challenge Axiall Corporation
Recommendation: Sell 1/22/2015
15
Figure 4: Cost of Capital & Scenario Weightings
in thousands (except per share amounts)
Source: Company Documents, Student Estimates
Cost of Capital Calculations: Base Allowance for Changing WACC due to Changing Interest Rates
Debt Ratio (calc. below) 31.44% 31.44% 31.44% 31.44% 31.44% 31.44% 31.44%
Tax Rate 31.35% 29.00% 28.00% 28.00% 28.00% 28.00% 28.00%
Equity Ratio (calc. below) 68.56% 68.56% 68.56% 68.56% 68.56% 68.56% 68.56%
Cost of Common Equity (using CAPM) 10.54% 10.79% 11.04% 11.29% 11.54% 11.79% 12.04%
Pretax Cost of Debt (from below) 4.62% 4.87% 5.12% 5.37% 5.62% 5.87% 6.12%
After-tax Cost of Debt 3.17% 3.46% 3.69% 3.87% 4.05% 4.23% 4.41%
Pref. Stock Ratio (calc. below) 0.00% 0.00% 0.00% 0.00% 0.00% 0.00% 0.00%
Cost of Capital 8.22% 8.49% 8.73% 8.96% 9.18% 9.41% 9.64%
Assumptions: Incr. in IRs 0.25% 0.25% 0.25% 0.25% 0.25% 0.25%
Terminal Growth Rate 2.00%
Risk-free Rate (10-yr. US T-Bond) 2.25% 2.50% 2.75% 3.00% 3.25% 3.50% 3.75%
Market Risk Premium (Historical Avg.) 5.80% 5.80% 5.80% 5.80% 5.80% 5.80% 5.80%
Cost of Debt 4.62% 4.87% 5.12% 5.37% 5.62% 5.87% 6.12%
Cost of Preferred Stock
Beta 1.43 1.43 1.43 1.43 1.43 1.43 1.43
Capital Weightings: Scenario: Weighting
Common Stock Price $42.17 Base $30.32 50%
# of Shares Outstanding 70,988.1 Optimistic $54.79 20%
Market Value of Equity 2,993,568 68.56% Pessimistic $12.98 30%
Value of Debt from Balance Sheet 1,372,784 Target $30.01
Debt Value of Operating Leases 270
Total Debt Value 1,373,054 31.44%
Value of Preferred Stock 0.00%
Total Capital 4,366,622 100.0%
CFA Institute Research Challenge Axiall Corporation
Recommendation: Sell 1/22/2015
16
Figure 5: Revenue and Margin Assumptions Base Case
Source: Company Documents, Student Estimates
1 2 3 4 5 6 7
Actual Actual Actual Estimated Actual Actual Estimated
Revenues: 2011 2012 2013 2014 2012 2013 2014
Chlorvinyls 40.9% 40.4% 62.5% 63.7% 2.0% 116.9% 1.1% 3.5% 3.3% 3.0% 2.8% 2.5% 2.5% 2.5%
Aromatics 31.7% 33.2% 19.3% 17.0% 8.2% -18.6% -12.5% 1.0% 1.0% 1.0% 1.0% 1.0% 1.0% 1.0%
Building Products 27.4% 26.4% 18.2% 19.3% -0.8% -3.1% 5.3% 4.0% 4.0% 4.0% 4.0% 4.0% 4.0% 4.0%
Unallocated and Other
Consolidated Revenues 100.0% 100.0% 100.0% 100.0% 3.2% 40.3% -0.8%
Operating Income: Average
Chlorvinyls 8.9% 12.9% 14.1% 5.9% 10.4% 48.5% 135.9% -57.7% 9.8% 9.8% 9.8% 9.8% 9.8% 9.8% 9.8%
Aromatics 1.0% 5.8% 3.2% -0.2% 2.5% 522.7% -54.9% -104.1% 2.0% 1.8% 1.5% 1.5% 1.5% 1.5% 1.5%
Building Products 0.8% 2.1% 0.4% 4.1% 1.8% 146.0% -83.7% 1114.7% 3.5% 3.5% 3.5% 3.5% 3.5% 3.5% 3.5%
0.0% 0.0% 0.0% 0.0% 0.0%
Consolidated Operating Income (Adjusted) 4.2% 7.7% 9.5% 4.5% 6.5% 90.3% 72.2% -52.8%
Check: Adjusted Net Income Amount
Corporate Expenses 0.0% 0.0% 0.0% 0.0% 0.0% 0.0% 0.0% 0.0% 0.0% 0.0% 0.0% 0.0%
Asset Imp. & Transaction Costs Excl. Above 0.3% 0.6% 1.5% 0.5% 0.7% 79.7% 281.7% -65.4% 0.0% 0.0% 0.0% 0.0% 0.0% 0.0% 0.0%
Depreciation and Amortization: Average
Chlorvinyls 4.6% 3.7% 6.2% 6.4% 5.2% -17.3% 262.9% 4.9% 6.2% 6.2% 6.2% 6.2% 6.2% 6.2% 6.2%
Aromatics 0.1% 0.1% 0.1% 0.2% 0.2% 3.4% -21.7% 55.2% 0.2% 0.2% 0.2% 0.2% 0.2% 0.2% 0.2%
Building Products 4.5% 4.4% 4.2% 3.9% 4.2% -3.1% -7.1% -2.4% 4.2% 4.2% 4.2% 4.2% 4.2% 4.2% 4.2%
Unallocated and Other 0.0% 0.0% 0.0% 0.0% 0.0% 0.0% 0.0% 0.0% 0.0% 0.0% 0.0% 0.0%
Consolidated Depreciation 3.2% 2.7% 4.7% 4.9% 3.9% -11.5% 142.6% 4.0%
Capital Expenditures:
Chlorvinyls 2.8% 3.3% 4.5% 5.4% 4.0% 20.7% 196.6% 19.8%
Aromatics 0.2% 0.2% 0.8% 1.1% 0.6% 64.9% 163.1% 19.8%
Building Products 2.7% 2.8% 5.2% 5.9% 4.2% 4.6% 78.0% 19.8%
Unallocated and Other 0.1% 0.2% 0.3% 0.3% 0.2% 106.9% 49.6% 19.8%
Consolidated Capital Expenditures 2.1% 2.4% 4.2% 5.1% 3.4% 21.0% 144.1% 19.8% 3.3% 3.3% 3.3% 3.3% 3.3% 3.3% 3.3%
Acquisitions -2.2% 0.0% 1.0% 0.0% -0.3% -100.0% -100.0%
Projected Growth Rates
Projected Operating Income Margins
Projected Depreciation as % of Revenue
% of Total Sales
% of Related Sales % Change
% Change
CFA Institute Research Challenge Axiall Corporation
Recommendation: Sell 1/22/2015
17
Figure 6: Income Statement Optimistic Case
in thousands (except for per share amounts)
Source: Company Documents, Student Estimates
2011 A 2012 A 2013 A 2014 E 2015 E 2016 E 2017 E 2018 E 2019 E 2020 E 2021 E
Revenues 3,222,884 3,325,836 4,666,000 4,630,000 4,824,258 5,020,083 5,216,936 5,414,275 5,611,563 5,817,244 6,031,715
Segment Operating Expenses 3,087,845 3,068,867 4,223,600 4,421,190 4,391,121 4,570,228 4,750,527 4,929,511 5,108,727 5,295,622 5,490,563
Restructuring and Other Costs 10,439 18,759 71,600 24,800 - - - - - - -
Operating Income 145,478 275,728 514,000 184,010 433,137 449,855 466,409 484,764 502,836 521,622 541,152
% Change in Operating Income 89.5% 86.4% -64.2% 135.4% 3.9% 3.7% 3.9% 3.7% 3.7% 3.7%
Operating Income from Income Statement 124,600 238,100 370,800 208,810 433,137 449,855 466,409 484,764 502,836 521,622 541,152
Other Income: OP % 3.9% 7.2% 7.9% 4.5% 9.0% 9.0% 8.9% 9.0% 9.0% 9.0% 9.0%
Interest Expense (65,600) (57,500) (77,600) (75,867) (63,329) (66,617) (69,615) (64,572) (30,674) (2,314) (2,399)
Other Income (Expense) (5,500) (2,900) (51,600) (8,611) (17,153) (17,153) (17,153) (17,153) (17,153) (17,153) (17,153)
Net Other Income (Expense) (71,100) (60,400) (129,200) (84,478) (80,482) (83,770) (86,768) (81,725) (47,827) (19,467) (19,552)
Income before Income Taxes 53,500 177,700 241,600 99,532 352,655 366,085 379,641 403,039 455,009 502,155 521,600
Provision for Income Taxes 4,200 (57,200) (73,600) (22,175) (110,557) (114,768) (119,017) (126,353) (142,645) (157,425) (163,521)
Less: net income attributable to noncontrolling interest - - (2,700) (3,333) (10,431) (10,828) (11,229) (11,921) (13,458) (14,852) (15,427)
Net Income 57,700 120,500 165,300 74,024 231,667 240,489 249,395 264,765 298,906 329,878 342,652
Net Income Per Share:
Basic 1.69 3.49 2.46 1.05 3.28 3.39 3.50 3.70 4.15 4.56 4.71
Diluted 1.69 3.46 2.44 1.05 3.26 3.37 3.48 3.67 4.13 4.53 4.68
% change in Diluted EPS 104.6% -29.6% -57.0% 211.4% 3.3% 3.2% 5.6% 12.3% 9.8% 3.4%
Diluted EPS without Restructuring 1.40 3.01
Weighted Average # of Shares: 1.40 3.26 3.37 3.48 3.67 4.13 4.53 4.68
Basic 34,100 34,500 67,300 70,196 70,547.1 70,899.8 71,254.3 71,610.6 71,968.7 72,328.5 72,690.1
Diluted 34,100 34,800 67,800 70,635 70,988.1 71,343.0 71,699.7 72,058.2 72,418.5 72,780.6 73,144.5
% change in Basic shares 1.2% 95.1% 4.3% 0.5% 0.5% 0.5% 0.5% 0.5% 0.5% 0.5%
Memo: Tax Rate -7.9% 32.2% 30.5% 22.3% 31.3% 31.4% 31.3% 31.4% 31.3% 31.3% 31.3%
Noncontrolling Interest % 0.0% 0.0% 1.6% 4.3% 4.3% 4.3% 4.3% 4.3% 4.3% 4.3% 4.3%
Revenue Growth 3.2% 40.3% -0.8% 4.2% 4.1% 3.9% 3.8% 3.6% 3.7% 3.7%
Analyst Projections
EPS Excl. One-time Items
CFA Institute Research Challenge Axiall Corporation
Recommendation: Sell 1/22/2015
18
Figure 7 Balance Sheet Optimistic Case
in thousands
Source: Company Documents, Student Estimates
31-Dec 31-Dec 31-Dec 28-Sep 31-Dec 31-Dec 31-Dec 31-Dec 31-Dec 31-Dec 31-Dec
Assets: 2011 A 2012 A 2013 A 2014 E 2015 E 2016 E 2017 E 2018 E 2019 E 2020 E 2021 E
Cash & Cash Equivalents 88,575 200,300 166,500 171,495 372,594 601,599 829,814 786,733 65,999 390,472 729,493
Receivables, net 256,749 314,900 548,800 565,264 588,980 612,888 636,921 661,014 685,100 710,211 736,395
Inventories 287,554 288,400 403,600 415,708 433,150 450,732 468,407 486,125 503,839 522,306 541,562
Prepaid Expenses 12,730 14,700 31,600 32,548 33,914 35,291 36,675 38,062 39,449 40,895 42,403
Deferred Income Taxes 14,989 21,100 18,000 18,540 19,318 20,102 20,890 21,680 22,470 23,294 24,153
Other Current Assets 3,020 - - - - - - - - - -
Total Current Assets (calc) 663,617 839,400 1,168,500 1,203,555 1,447,956 1,720,612 1,992,707 1,993,614 1,316,857 1,687,178 2,074,006
Property, Plant, & Equipment, net 640,900 637,700 1,658,700 1,708,461 1,718,612 1,726,227 1,731,578 1,734,983 1,736,808 1,736,908 1,735,129
Goodwill 213,608 217,200 1,763,200 1,816,096 1,816,096 1,816,096 1,816,096 1,816,096 1,816,096 1,816,096 1,816,096
Customer relationships, net - 26,500 1,101,800 1,134,854 1,134,854 1,134,854 1,134,854 1,134,854 1,134,854 1,134,854 1,134,854
Intangibles & Other Assets, Net 126,086 80,500 185,000 190,550 190,550 190,550 190,550 190,550 190,550 190,550 190,550
Def. Inc. taxes and other non-current assets - - - - - - - - - - -
Total Assets (calc) 1,644,211 1,801,300 5,877,200 6,053,516 6,308,068 6,588,339 6,865,785 6,870,097 6,195,165 6,565,586 6,950,635
NWC & Other Assets & Liabilities (83,041) (110,600) (814,100) (838,523) (849,743) (878,809) (908,027) (937,317) (966,600) (997,129) (1,028,962)
Liabilities and Stockholders' Equity:
Liabilities:
Accounts Payable and other Accrued Exp. 187,930 255,900 375,200 386,456 402,670 419,015 435,446 451,917 468,384 485,552 503,453
Current Portion of Debt - - 2,800 2,884 2,884 13,653 300,944 1,012,864 229 229 229
Interest Payable 20,931 18,900 15,400 15,862 16,528 17,199 17,873 18,549 19,225 19,930 20,665
Income Taxes Payable 1,202 15,100 17,100 17,613
Other Current Liabilities 68,825 61,200 132,600 136,578 142,308 148,085 153,892 159,713 165,533 171,600 177,927
Total Current Liabilities (calc) 278,888 351,100 543,100 559,393 564,390 597,952 908,155 1,643,043 653,371 677,311 702,274
Long-term Debt, less current portion 497,464 448,100 1,330,000 1,369,900 1,367,016 1,353,363 1,052,419 39,555 39,326 39,097 38,868
Deferred Income Taxes (2013 incl. other LT liab. 181,465 177,900 865,500 891,465 928,868 966,572 1,004,474 1,042,470 1,080,456 1,120,058 1,161,352
Pensions and postretirement benefits - 52,300 129,800 133,694 133,694 133,694 133,694 133,694 133,694 133,694 133,694
Other Long-term Liabilities 197,730 168,400 280,500 288,915 301,037 313,257 325,541 337,855 350,166 363,001 376,384
Total Liabilities (calc) 1,155,547 1,197,800 3,148,900 3,243,367 3,295,005 3,364,838 3,424,283 3,196,617 2,257,013 2,333,161 2,412,572
Growth in Pension and postret. benefits (Assumed = 0 as Underfunded is included in Time Period 0 CF) 0% 0% 0% 0% 0% 0% 0%
Stockholders' Equity:
Common Stock + Paid-in-Capital 480,872 487,400 2,273,300 2,341,499 2,356,300 2,371,173 2,386,122 2,401,147 2,416,248 2,431,421 2,446,670
Retained Earnings 25,943 138,000 269,300 277,379 462,627 655,304 855,453 1,069,495 1,316,156 1,592,222 1,879,448
Accum. Other Comprehensive Income,net (18,151) (21,900) 66,300 68,289 71,154 74,042 76,945 79,856 82,766 85,800 88,963
Less: Treasury Stock - - - - - - - - - - -
Redeemable Noncontrolling Interest - - 119,400 122,982 122,982 122,982 122,982 122,982 122,982 122,982 122,982
Total Stockholders' Equity (calc) 488,664 603,500 2,728,300 2,810,149 3,013,063 3,223,501 3,441,502 3,673,480 3,938,152 4,232,425 4,538,063
Total Liabilities and Stockholders Equity (calc) 1,644,211 1,801,300 5,877,200 6,053,516 6,308,068 6,588,339 6,865,785 6,870,097 6,195,165 6,565,586 6,950,635
CFA Institute Research Challenge Axiall Corporation
Recommendation: Sell 1/22/2015
19
Figure 8 Projected Cash Flows Optimistic Case
in thousands (except for per share amounts)
Source: Company Documents, Student Estimates
Cash Flow Calculations: Base 1 2 3 4 5 6 7 Terminal Yr.
Revenues:
Chlorvinyls 2,949,310 3,082,029 3,213,015 3,341,536 3,466,844 3,588,184 3,713,770 3,843,752
Aromatics 786,042 793,902 801,841 809,859 817,958 826,138 834,399 842,743
Building Products 894,648 948,327 1,005,227 1,065,541 1,129,473 1,197,241 1,269,075 1,345,220
-
Consolidated Revenues 4,630,000 4,824,258 5,020,083 5,216,936 5,414,275 5,611,563 5,817,244 6,031,715
% Increase 4.2% 4.1% 3.9% 3.8% 3.6% 3.7% 3.7%
Operating Income:
Chlorvinyls 173,565 369,843 385,562 400,984 416,021 430,582 445,652 461,250
Aromatics (1,197) 15,878 14,032 12,148 12,269 12,392 12,516 12,641
Building Products 36,442 47,416 50,261 53,277 56,474 59,862 63,454 67,261
Corporate and Intersegment Eliminations
Consolidated Operating Income 208,810 433,137 449,855 466,409 484,764 502,836 521,622 541,152
Operating Income % of Sales 4.5% 9.0% 9.0% 8.9% 9.0% 9.0% 9.0% 9.0%
Less: Corporate Expenses - - - - - - - -
Less: Restructuring and Other Costs 24,800 - - - - - - -
Operating Income 184,010 433,137 449,855 466,409 484,764 502,836 521,622 541,152
% Increase -50.4% 135.4% 3.9% 3.7% 3.9% 3.7% 3.7% 3.7%
% of Revenues 4.0% 9.0% 9.0% 8.9% 9.0% 9.0% 9.0% 9.0%
Less: Taxes (see below) (40,996) (135,788) (141,030) (146,219) (151,974) (157,639) (163,528) (169,651)
31.3% 31.4% 31.3% 31.4% 31.3% 31.3% 31.3%
Less: net income attributable to noncontrolling interest(3,333) (10,431) (10,828) (11,229) (11,921) (13,458) (14,852) (15,427)
After-tax Operating Income 139,681 286,918 297,997 308,961 320,869 331,739 343,242 356,074
+ Depr. & Amort. (incl. acquisitions) 226,765 232,604 243,151 253,690 264,184 274,594 285,441 296,743
- Capital Exp. (235,000) (242,755) (250,766) (259,041) (267,589) (276,419) (285,541) (294,964) Terminal
- Acquisitions Cost - - - - - - - - Growth %
- Ch. in NWC & other assets (from BS) 24,423 11,220 29,066 29,218 29,290 29,283 30,529 31,833 2.50%
Free Cash Flow 155,869 287,987 319,448 332,828 346,754 359,197 373,671 389,686 399,428
Terminal Value 5,594,232
=CF1/(r-g)
Present Value Calculations: Half-year convention 1 (1=yes, 0=no)
Free Cash Flow + Terminal Value 287,987 319,448 332,828 346,754 359,197 373,671 389,686 5,594,232
Cumulative Discount Factor Total 1.0403 1.1272 1.2243 1.3325 1.4534 1.5885 1.7398 1.8217
Present Value of Free Cash Flow 4,869,520 276,834 283,399 271,862 260,220 247,142 235,236 223,984 3,070,843
Plus: Total Debt Net of Excess Cash (861,902) 96,485
Less: Underfunded Pension Plan (11,300)
Less: Value of Noncontrolling Interest (122,982)
NPV less Noncontrolling Interest Value 3,873,336
# of Shares Outstanding 70,696
Value per Share 54.79$
Reflects that certain cash levels must be retained by corporation
CFA Institute Research Challenge Axiall Corporation
Recommendation: Sell 1/22/2015
20
Figure 9: Revenue and Margin Assumptions Optimistic Case
Source: Company Documents, Student Estimates
1 2 3 4 5 6 7
Actual Actual Actual Estimated Actual Actual Estimated
Revenues: 2011 2012 2013 2014 2012 2013 2014
Chlorvinyls 40.9% 40.4% 62.5% 63.7% 2.0% 116.9% 1.1% 4.5% 4.3% 4.0% 3.8% 3.5% 3.5% 3.5%
Aromatics 31.7% 33.2% 19.3% 17.0% 8.2% -18.6% -12.5% 1.0% 1.0% 1.0% 1.0% 1.0% 1.0% 1.0%
Building Products 27.4% 26.4% 18.2% 19.3% -0.8% -3.1% 5.3% 6.0% 6.0% 6.0% 6.0% 6.0% 6.0% 6.0%
Unallocated and Other
Consolidated Revenues 100.0% 100.0% 100.0% 100.0% 3.2% 40.3% -0.8%
Operating Income: Average
Chlorvinyls 8.9% 12.9% 14.1% 5.9% 10.4% 48.5% 135.9% -57.7% 12.0% 12.0% 12.0% 12.0% 12.0% 12.0% 12.0%
Aromatics 1.0% 5.8% 3.2% -0.2% 2.5% 522.7% -54.9% -104.1% 2.0% 1.8% 1.5% 1.5% 1.5% 1.5% 1.5%
Building Products 0.8% 2.1% 0.4% 4.1% 1.8% 146.0% -83.7% 1114.7% 5.0% 5.0% 5.0% 5.0% 5.0% 5.0% 5.0%
0.0% 0.0% 0.0% 0.0% 0.0%
Consolidated Operating Income (Adjusted) 4.2% 7.7% 9.5% 4.5% 6.5% 90.3% 72.2% -52.8%
Check: Adjusted Net Income Amount
Corporate Expenses 0.0% 0.0% 0.0% 0.0% 0.0% 0.0% 0.0% 0.0% 0.0% 0.0% 0.0% 0.0%
Asset Imp. & Transaction Costs Excl. Above 0.3% 0.6% 1.5% 0.5% 0.7% 79.7% 281.7% -65.4% 0.0% 0.0% 0.0% 0.0% 0.0% 0.0% 0.0%
Depreciation and Amortization: Average
Chlorvinyls 4.6% 3.7% 6.2% 6.4% 5.2% -17.3% 262.9% 4.9% 6.2% 6.2% 6.2% 6.2% 6.2% 6.2% 6.2%
Aromatics 0.1% 0.1% 0.1% 0.2% 0.2% 3.4% -21.7% 55.2% 0.2% 0.2% 0.2% 0.2% 0.2% 0.2% 0.2%
Building Products 4.5% 4.4% 4.2% 3.9% 4.2% -3.1% -7.1% -2.4% 4.2% 4.2% 4.2% 4.2% 4.2% 4.2% 4.2%
Unallocated and Other 0.0% 0.0% 0.0% 0.0% 0.0% 0.0% 0.0% 0.0% 0.0% 0.0% 0.0% 0.0%
Consolidated Depreciation 3.2% 2.7% 4.7% 4.9% 3.9% -11.5% 142.6% 4.0%
Capital Expenditures:
Chlorvinyls 2.8% 3.3% 4.5% 5.4% 4.0% 20.7% 196.6% 19.8%
Aromatics 0.2% 0.2% 0.8% 1.1% 0.6% 64.9% 163.1% 19.8%
Building Products 2.7% 2.8% 5.2% 5.9% 4.2% 4.6% 78.0% 19.8%
Unallocated and Other 0.1% 0.2% 0.3% 0.3% 0.2% 106.9% 49.6% 19.8%
Consolidated Capital Expenditures 2.1% 2.4% 4.2% 5.1% 3.4% 21.0% 144.1% 19.8% 3.3% 3.3% 3.3% 3.3% 3.3% 3.3% 3.3%
Acquisitions -2.2% 0.0% 1.0% 0.0% -0.3% -100.0% -100.0%
Projected Operating Income Margins
Projected Depreciation as % of Revenue
% of Total Sales
% of Related Sales % Change
% Change
Projected Growth Rates
CFA Institute Research Challenge Axiall Corporation
Recommendation: Sell 1/22/2015
21
Figure 10 Income Statement Pessimistic Case
in thousands (except for per share amounts)
Source: Company Documents, Student Estimates
2011 A 2012 A 2013 A 2014 E 2015 E 2016 E 2017 E 2018 E 2019 E 2020 E 2021 E
Revenues 3,222,884 3,325,836 4,666,000 4,630,000 4,738,433 4,842,035 4,940,348 5,032,950 5,119,459 5,207,677 5,297,644
Segment Operating Expenses 3,087,845 3,068,867 4,223,600 4,421,190 4,459,113 4,558,426 4,652,947 4,740,245 4,821,971 4,905,321 4,990,336
Restructuring and Other Costs 10,439 18,759 71,600 24,800 - - - - - - -
Operating Income 145,478 275,728 514,000 184,010 279,320 283,609 287,401 292,705 297,488 302,356 307,308
% Change in Operating Income 89.5% 86.4% -64.2% 51.8% 1.5% 1.3% 1.8% 1.6% 1.6% 1.6%
Operating Income from Income Statement 124,600 238,100 370,800 208,810 279,320 283,609 287,401 292,705 297,488 302,356 307,308
Other Income: OP % 3.9% 7.2% 7.9% 4.5% 5.9% 5.9% 5.8% 5.8% 5.8% 5.8% 5.8%
Interest Expense (65,600) (57,500) (77,600) (75,867) (63,329) (66,617) (69,615) (64,572) (30,674) (2,314) (2,399)
Other Income (Expense) (5,500) (2,900) (51,600) (8,611) (17,153) (17,153) (17,153) (17,153) (17,153) (17,153) (17,153)
Net Other Income (Expense) (71,100) (60,400) (129,200) (84,478) (80,482) (83,770) (86,768) (81,725) (47,827) (19,467) (19,552)
Income before Income Taxes 53,500 177,700 241,600 99,532 198,838 199,839 200,633 210,980 249,661 282,889 287,756
Provision for Income Taxes 4,200 (57,200) (73,600) (22,175) (62,336) (62,649) (62,898) (66,142) (78,268) (88,686) (90,211)
Less: net income attributable to noncontrolling interest - - (2,700) (3,333) (5,881) (5,911) (5,934) (6,240) (7,384) (8,367) (8,511)
Net Income 57,700 120,500 165,300 74,024 130,621 131,279 131,801 138,598 164,009 185,836 189,034
Net Income Per Share:
Basic 1.69 3.49 2.46 1.05 1.85 1.85 1.85 1.94 2.28 2.57 2.60
Diluted 1.69 3.46 2.44 1.05 1.84 1.84 1.84 1.92 2.26 2.55 2.58
% change in Diluted EPS 104.6% -29.6% -57.0% 75.6% 0.0% -0.1% 4.6% 17.7% 12.7% 1.2%
Diluted EPS without Restructuring 1.40 3.01
Weighted Average # of Shares: 1.40 1.84 1.84 1.84 1.92 2.26 2.55 2.58
Basic 34,100 34,500 67,300 70,196 70,547.1 70,899.8 71,254.3 71,610.6 71,968.7 72,328.5 72,690.1
Diluted 34,100 34,800 67,800 70,635 70,988.1 71,343.0 71,699.7 72,058.2 72,418.5 72,780.6 73,144.5
% change in Basic shares 1.2% 95.1% 4.3% 0.5% 0.5% 0.5% 0.5% 0.5% 0.5% 0.5%
Memo: Tax Rate -7.9% 32.2% 30.5% 22.3% 31.4% 31.3% 31.3% 31.3% 31.3% 31.4% 31.3%
Noncontrolling Interest % 0.0% 0.0% 1.6% 4.3% 4.3% 4.3% 4.3% 4.3% 4.3% 4.3% 4.3%
Revenue Growth 3.2% 40.3% -0.8% 2.3% 2.2% 2.0% 1.9% 1.7% 1.7% 1.7%
Analyst Projections
EPS Excl. One-time Items
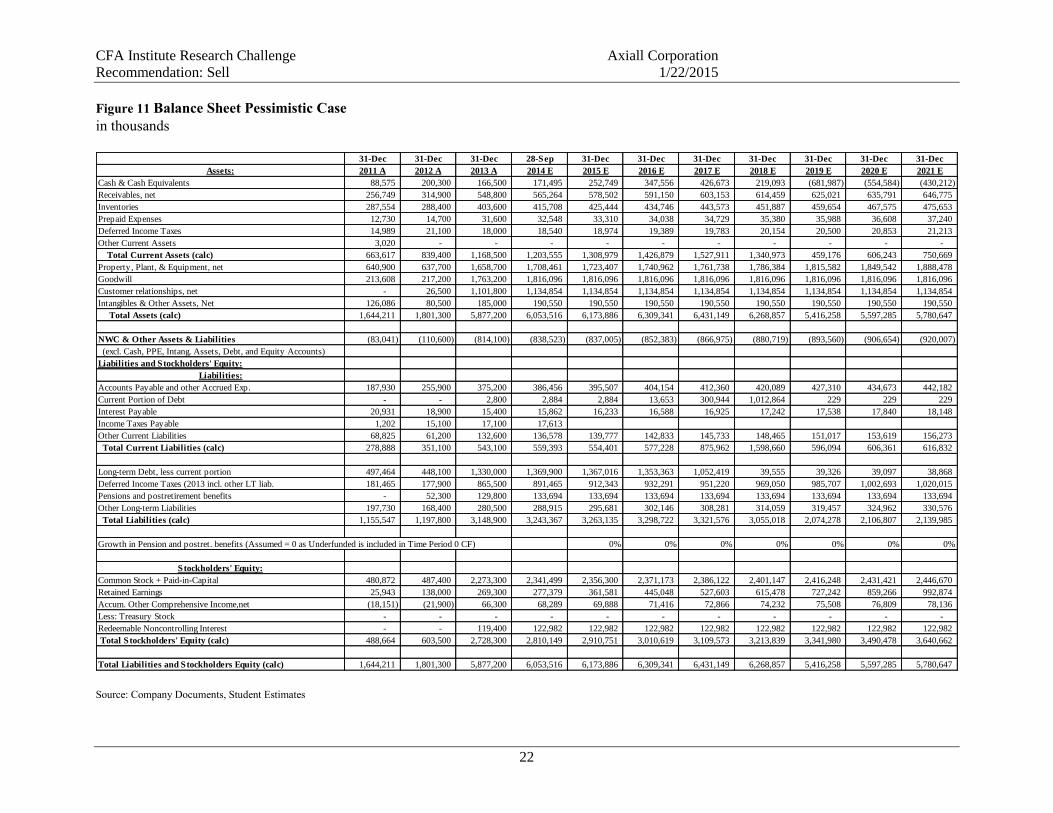
CFA Institute Research Challenge Axiall Corporation
Recommendation: Sell 1/22/2015
22
Figure 11 Balance Sheet Pessimistic Case
in thousands
Source: Company Documents, Student Estimates
31-Dec 31-Dec 31-Dec 28-Sep 31-Dec 31-Dec 31-Dec 31-Dec 31-Dec 31-Dec 31-Dec
Assets: 2011 A 2012 A 2013 A 2014 E 2015 E 2016 E 2017 E 2018 E 2019 E 2020 E 2021 E
Cash & Cash Equivalents 88,575 200,300 166,500 171,495 252,749 347,556 426,673 219,093 (681,987) (554,584) (430,212)
Receivables, net 256,749 314,900 548,800 565,264 578,502 591,150 603,153 614,459 625,021 635,791 646,775
Inventories 287,554 288,400 403,600 415,708 425,444 434,746 443,573 451,887 459,654 467,575 475,653
Prepaid Expenses 12,730 14,700 31,600 32,548 33,310 34,038 34,729 35,380 35,988 36,608 37,240
Deferred Income Taxes 14,989 21,100 18,000 18,540 18,974 19,389 19,783 20,154 20,500 20,853 21,213
Other Current Assets 3,020 - - - - - - - - - -
Total Current Assets (calc) 663,617 839,400 1,168,500 1,203,555 1,308,979 1,426,879 1,527,911 1,340,973 459,176 606,243 750,669
Property, Plant, & Equipment, net 640,900 637,700 1,658,700 1,708,461 1,723,407 1,740,962 1,761,738 1,786,384 1,815,582 1,849,542 1,888,478
Goodwill 213,608 217,200 1,763,200 1,816,096 1,816,096 1,816,096 1,816,096 1,816,096 1,816,096 1,816,096 1,816,096
Customer relationships, net - 26,500 1,101,800 1,134,854 1,134,854 1,134,854 1,134,854 1,134,854 1,134,854 1,134,854 1,134,854
Intangibles & Other Assets, Net 126,086 80,500 185,000 190,550 190,550 190,550 190,550 190,550 190,550 190,550 190,550
Total Assets (calc) 1,644,211 1,801,300 5,877,200 6,053,516 6,173,886 6,309,341 6,431,149 6,268,857 5,416,258 5,597,285 5,780,647
NWC & Other Assets & Liabilities (83,041) (110,600) (814,100) (838,523) (837,005) (852,383) (866,975) (880,719) (893,560) (906,654) (920,007)
(excl. Cash, PPE, Intang. Assets, Debt, and Equity Accounts)
Liabilities and Stockholders' Equity:
Liabilities:
Accounts Payable and other Accrued Exp. 187,930 255,900 375,200 386,456 395,507 404,154 412,360 420,089 427,310 434,673 442,182
Current Portion of Debt - - 2,800 2,884 2,884 13,653 300,944 1,012,864 229 229 229
Interest Payable 20,931 18,900 15,400 15,862 16,233 16,588 16,925 17,242 17,538 17,840 18,148
Income Taxes Payable 1,202 15,100 17,100 17,613
Other Current Liabilities 68,825 61,200 132,600 136,578 139,777 142,833 145,733 148,465 151,017 153,619 156,273
Total Current Liabilities (calc) 278,888 351,100 543,100 559,393 554,401 577,228 875,962 1,598,660 596,094 606,361 616,832
Long-term Debt, less current portion 497,464 448,100 1,330,000 1,369,900 1,367,016 1,353,363 1,052,419 39,555 39,326 39,097 38,868
Deferred Income Taxes (2013 incl. other LT liab. 181,465 177,900 865,500 891,465 912,343 932,291 951,220 969,050 985,707 1,002,693 1,020,015
Pensions and postretirement benefits - 52,300 129,800 133,694 133,694 133,694 133,694 133,694 133,694 133,694 133,694
Other Long-term Liabilities 197,730 168,400 280,500 288,915 295,681 302,146 308,281 314,059 319,457 324,962 330,576
Total Liabilities (calc) 1,155,547 1,197,800 3,148,900 3,243,367 3,263,135 3,298,722 3,321,576 3,055,018 2,074,278 2,106,807 2,139,985
Growth in Pension and postret. benefits (Assumed = 0 as Underfunded is included in Time Period 0 CF) 0% 0% 0% 0% 0% 0% 0%
Stockholders' Equity:
Common Stock + Paid-in-Capital 480,872 487,400 2,273,300 2,341,499 2,356,300 2,371,173 2,386,122 2,401,147 2,416,248 2,431,421 2,446,670
Retained Earnings 25,943 138,000 269,300 277,379 361,581 445,048 527,603 615,478 727,242 859,266 992,874
Accum. Other Comprehensive Income,net (18,151) (21,900) 66,300 68,289 69,888 71,416 72,866 74,232 75,508 76,809 78,136
Less: Treasury Stock - - - - - - - - - - -
Redeemable Noncontrolling Interest - - 119,400 122,982 122,982 122,982 122,982 122,982 122,982 122,982 122,982
Total Stockholders' Equity (calc) 488,664 603,500 2,728,300 2,810,149 2,910,751 3,010,619 3,109,573 3,213,839 3,341,980 3,490,478 3,640,662
Total Liabilities and Stockholders Equity (calc) 1,644,211 1,801,300 5,877,200 6,053,516 6,173,886 6,309,341 6,431,149 6,268,857 5,416,258 5,597,285 5,780,647
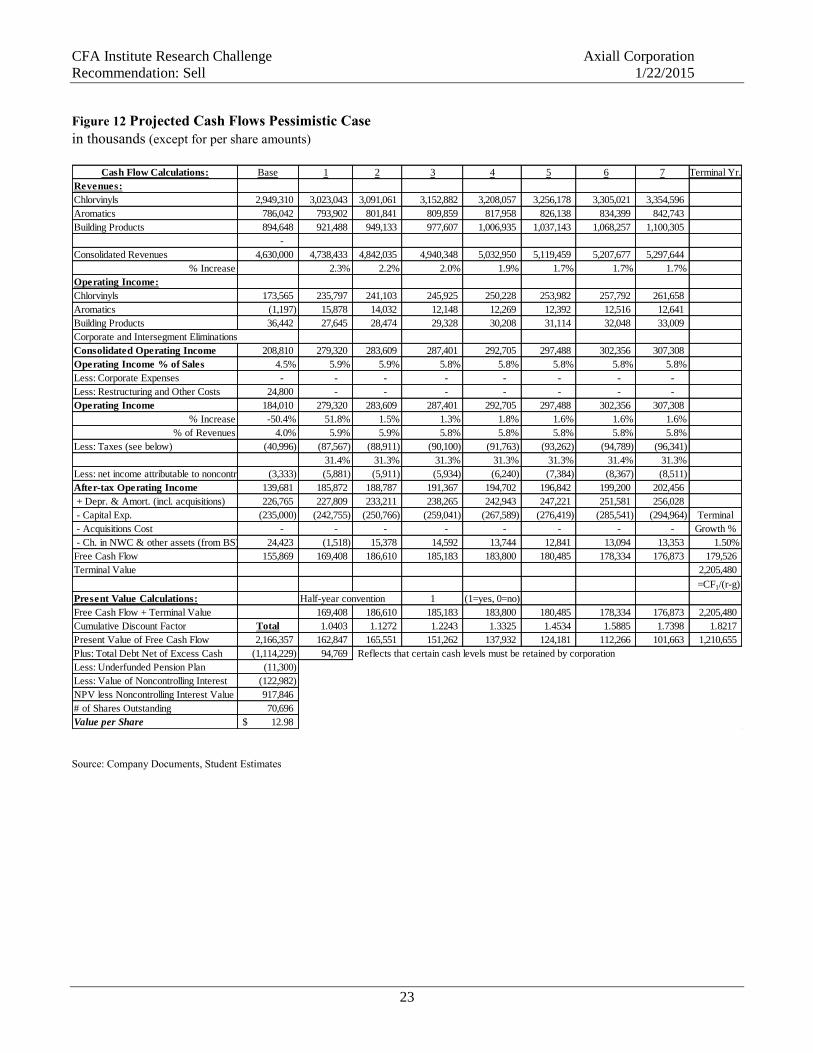
CFA Institute Research Challenge Axiall Corporation
Recommendation: Sell 1/22/2015
23
Figure 12 Projected Cash Flows Pessimistic Case
in thousands (except for per share amounts)
Source: Company Documents, Student Estimates
Cash Flow Calculations: Base 1 2 3 4 5 6 7 Terminal Yr.
Revenues:
Chlorvinyls 2,949,310 3,023,043 3,091,061 3,152,882 3,208,057 3,256,178 3,305,021 3,354,596
Aromatics 786,042 793,902 801,841 809,859 817,958 826,138 834,399 842,743
Building Products 894,648 921,488 949,133 977,607 1,006,935 1,037,143 1,068,257 1,100,305
-
Consolidated Revenues 4,630,000 4,738,433 4,842,035 4,940,348 5,032,950 5,119,459 5,207,677 5,297,644
% Increase 2.3% 2.2% 2.0% 1.9% 1.7% 1.7% 1.7%
Operating Income:
Chlorvinyls 173,565 235,797 241,103 245,925 250,228 253,982 257,792 261,658
Aromatics (1,197) 15,878 14,032 12,148 12,269 12,392 12,516 12,641
Building Products 36,442 27,645 28,474 29,328 30,208 31,114 32,048 33,009
Corporate and Intersegment Eliminations
Consolidated Operating Income 208,810 279,320 283,609 287,401 292,705 297,488 302,356 307,308
Operating Income % of Sales 4.5% 5.9% 5.9% 5.8% 5.8% 5.8% 5.8% 5.8%
Less: Corporate Expenses - - - - - - - -
Less: Restructuring and Other Costs 24,800 - - - - - - -
Operating Income 184,010 279,320 283,609 287,401 292,705 297,488 302,356 307,308
% Increase -50.4% 51.8% 1.5% 1.3% 1.8% 1.6% 1.6% 1.6%
% of Revenues 4.0% 5.9% 5.9% 5.8% 5.8% 5.8% 5.8% 5.8%
Less: Taxes (see below) (40,996) (87,567) (88,911) (90,100) (91,763) (93,262) (94,789) (96,341)
31.4% 31.3% 31.3% 31.3% 31.3% 31.4% 31.3%
Less: net income attributable to noncontrolling interest(3,333) (5,881) (5,911) (5,934) (6,240) (7,384) (8,367) (8,511)
After-tax Operating Income 139,681 185,872 188,787 191,367 194,702 196,842 199,200 202,456
+ Depr. & Amort. (incl. acquisitions) 226,765 227,809 233,211 238,265 242,943 247,221 251,581 256,028
- Capital Exp. (235,000) (242,755) (250,766) (259,041) (267,589) (276,419) (285,541) (294,964) Terminal
- Acquisitions Cost - - - - - - - - Growth %
- Ch. in NWC & other assets (from BS) 24,423 (1,518) 15,378 14,592 13,744 12,841 13,094 13,353 1.50%
Free Cash Flow 155,869 169,408 186,610 185,183 183,800 180,485 178,334 176,873 179,526
Terminal Value 2,205,480
=CF1/(r-g)
Present Value Calculations: Half-year convention 1 (1=yes, 0=no)
Free Cash Flow + Terminal Value 169,408 186,610 185,183 183,800 180,485 178,334 176,873 2,205,480
Cumulative Discount Factor Total 1.0403 1.1272 1.2243 1.3325 1.4534 1.5885 1.7398 1.8217
Present Value of Free Cash Flow 2,166,357 162,847 165,551 151,262 137,932 124,181 112,266 101,663 1,210,655
Plus: Total Debt Net of Excess Cash (1,114,229) 94,769
Less: Underfunded Pension Plan (11,300)
Less: Value of Noncontrolling Interest (122,982)
NPV less Noncontrolling Interest Value 917,846
# of Shares Outstanding 70,696
Value per Share 12.98$
Reflects that certain cash levels must be retained by corporation
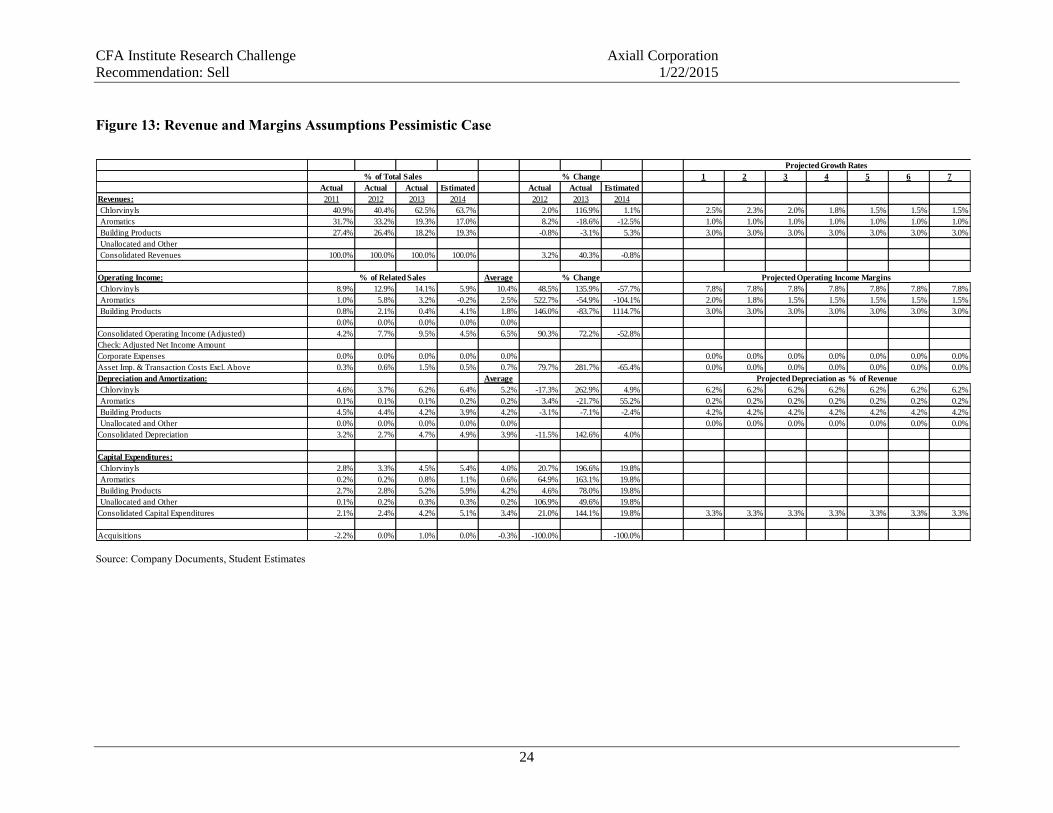
CFA Institute Research Challenge Axiall Corporation
Recommendation: Sell 1/22/2015
24
Figure 13: Revenue and Margins Assumptions Pessimistic Case
Source: Company Documents, Student Estimates
1 2 3 4 5 6 7
Actual Actual Actual Estimated Actual Actual Estimated
Revenues: 2011 2012 2013 2014 2012 2013 2014
Chlorvinyls 40.9% 40.4% 62.5% 63.7% 2.0% 116.9% 1.1% 2.5% 2.3% 2.0% 1.8% 1.5% 1.5% 1.5%
Aromatics 31.7% 33.2% 19.3% 17.0% 8.2% -18.6% -12.5% 1.0% 1.0% 1.0% 1.0% 1.0% 1.0% 1.0%
Building Products 27.4% 26.4% 18.2% 19.3% -0.8% -3.1% 5.3% 3.0% 3.0% 3.0% 3.0% 3.0% 3.0% 3.0%
Unallocated and Other
Consolidated Revenues 100.0% 100.0% 100.0% 100.0% 3.2% 40.3% -0.8%
Operating Income: Average
Chlorvinyls 8.9% 12.9% 14.1% 5.9% 10.4% 48.5% 135.9% -57.7% 7.8% 7.8% 7.8% 7.8% 7.8% 7.8% 7.8%
Aromatics 1.0% 5.8% 3.2% -0.2% 2.5% 522.7% -54.9% -104.1% 2.0% 1.8% 1.5% 1.5% 1.5% 1.5% 1.5%
Building Products 0.8% 2.1% 0.4% 4.1% 1.8% 146.0% -83.7% 1114.7% 3.0% 3.0% 3.0% 3.0% 3.0% 3.0% 3.0%
0.0% 0.0% 0.0% 0.0% 0.0%
Consolidated Operating Income (Adjusted) 4.2% 7.7% 9.5% 4.5% 6.5% 90.3% 72.2% -52.8%
Check: Adjusted Net Income Amount
Corporate Expenses 0.0% 0.0% 0.0% 0.0% 0.0% 0.0% 0.0% 0.0% 0.0% 0.0% 0.0% 0.0%
Asset Imp. & Transaction Costs Excl. Above 0.3% 0.6% 1.5% 0.5% 0.7% 79.7% 281.7% -65.4% 0.0% 0.0% 0.0% 0.0% 0.0% 0.0% 0.0%
Depreciation and Amortization: Average
Chlorvinyls 4.6% 3.7% 6.2% 6.4% 5.2% -17.3% 262.9% 4.9% 6.2% 6.2% 6.2% 6.2% 6.2% 6.2% 6.2%
Aromatics 0.1% 0.1% 0.1% 0.2% 0.2% 3.4% -21.7% 55.2% 0.2% 0.2% 0.2% 0.2% 0.2% 0.2% 0.2%
Building Products 4.5% 4.4% 4.2% 3.9% 4.2% -3.1% -7.1% -2.4% 4.2% 4.2% 4.2% 4.2% 4.2% 4.2% 4.2%
Unallocated and Other 0.0% 0.0% 0.0% 0.0% 0.0% 0.0% 0.0% 0.0% 0.0% 0.0% 0.0% 0.0%
Consolidated Depreciation 3.2% 2.7% 4.7% 4.9% 3.9% -11.5% 142.6% 4.0%
Capital Expenditures:
Chlorvinyls 2.8% 3.3% 4.5% 5.4% 4.0% 20.7% 196.6% 19.8%
Aromatics 0.2% 0.2% 0.8% 1.1% 0.6% 64.9% 163.1% 19.8%
Building Products 2.7% 2.8% 5.2% 5.9% 4.2% 4.6% 78.0% 19.8%
Unallocated and Other 0.1% 0.2% 0.3% 0.3% 0.2% 106.9% 49.6% 19.8%
Consolidated Capital Expenditures 2.1% 2.4% 4.2% 5.1% 3.4% 21.0% 144.1% 19.8% 3.3% 3.3% 3.3% 3.3% 3.3% 3.3% 3.3%
Acquisitions -2.2% 0.0% 1.0% 0.0% -0.3% -100.0% -100.0%
Projected Growth Rates
% of Total Sales % Change
% of Related Sales % Change Projected Operating Income Margins
Projected Depreciation as % of Revenue
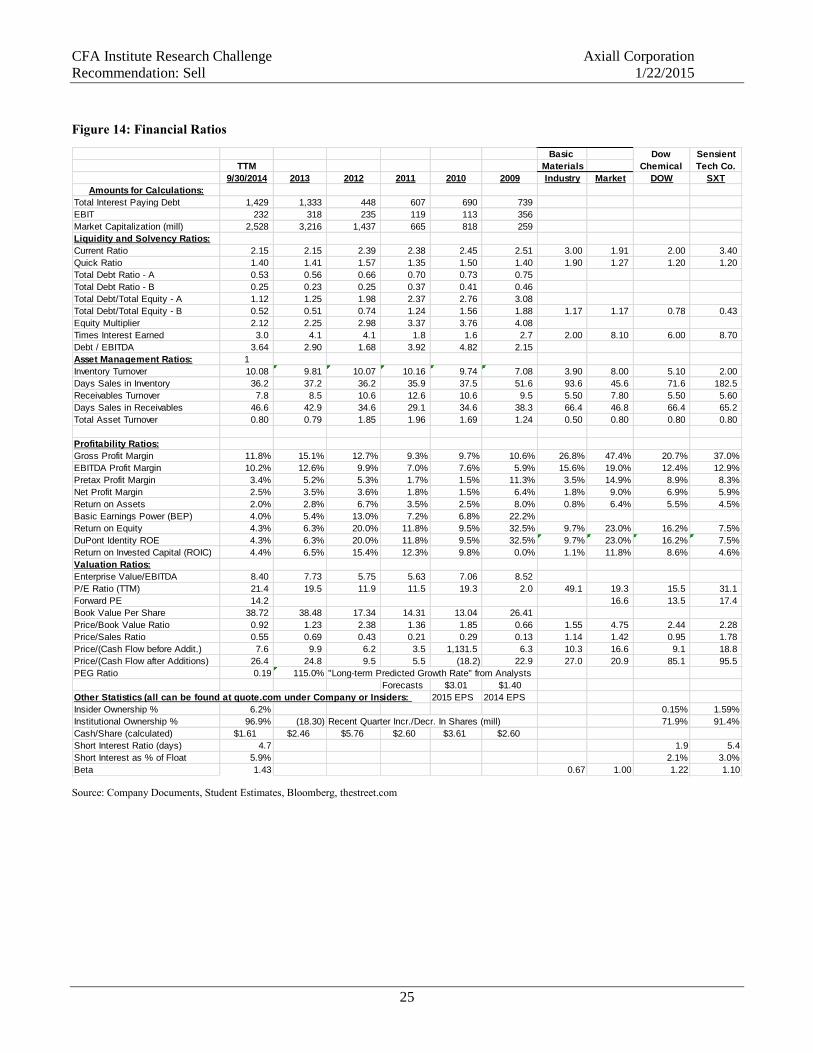
CFA Institute Research Challenge Axiall Corporation
Recommendation: Sell 1/22/2015
25
Figure 14: Financial Ratios
Source: Company Documents, Student Estimates, Bloomberg, thestreet.com
Basic
TTM Materials
9/30/2014 2013 2012 2011 2010 2009 Industry Market DOW SXT
Amounts for Calculations:
Total Interest Paying Debt 1,429 1,333 448 607 690 739
EBIT 232 318 235 119 113 356
Market Capitalization (mill) 2,528 3,216 1,437 665 818 259
Liquidity and Solvency Ratios:
Current Ratio 2.15 2.15 2.39 2.38 2.45 2.51 3.00 1.91 2.00 3.40
Quick Ratio 1.40 1.41 1.57 1.35 1.50 1.40 1.90 1.27 1.20 1.20
Total Debt Ratio - A 0.53 0.56 0.66 0.70 0.73 0.75
Total Debt Ratio - B 0.25 0.23 0.25 0.37 0.41 0.46
Total Debt/Total Equity - A 1.12 1.25 1.98 2.37 2.76 3.08
Total Debt/Total Equity - B 0.52 0.51 0.74 1.24 1.56 1.88 1.17 1.17 0.78 0.43
Equity Multiplier 2.12 2.25 2.98 3.37 3.76 4.08
Times Interest Earned 3.0 4.1 4.1 1.8 1.6 2.7 2.00 8.10 6.00 8.70
Debt / EBITDA 3.64 2.90 1.68 3.92 4.82 2.15
Asset Management Ratios: 1
Inventory Turnover 10.08 9.81 10.07 10.16 9.74 7.08 3.90 8.00 5.10 2.00
Days Sales in Inventory 36.2 37.2 36.2 35.9 37.5 51.6 93.6 45.6 71.6 182.5
Receivables Turnover 7.8 8.5 10.6 12.6 10.6 9.5 5.50 7.80 5.50 5.60
Days Sales in Receivables 46.6 42.9 34.6 29.1 34.6 38.3 66.4 46.8 66.4 65.2
Total Asset Turnover 0.80 0.79 1.85 1.96 1.69 1.24 0.50 0.80 0.80 0.80
Profitability Ratios:
Gross Profit Margin 11.8% 15.1% 12.7% 9.3% 9.7% 10.6% 26.8% 47.4% 20.7% 37.0%
EBITDA Profit Margin 10.2% 12.6% 9.9% 7.0% 7.6% 5.9% 15.6% 19.0% 12.4% 12.9%
Pretax Profit Margin 3.4% 5.2% 5.3% 1.7% 1.5% 11.3% 3.5% 14.9% 8.9% 8.3%
Net Profit Margin 2.5% 3.5% 3.6% 1.8% 1.5% 6.4% 1.8% 9.0% 6.9% 5.9%
Return on Assets 2.0% 2.8% 6.7% 3.5% 2.5% 8.0% 0.8% 6.4% 5.5% 4.5%
Basic Earnings Power (BEP) 4.0% 5.4% 13.0% 7.2% 6.8% 22.2%
Return on Equity 4.3% 6.3% 20.0% 11.8% 9.5% 32.5% 9.7% 23.0% 16.2% 7.5%
DuPont Identity ROE 4.3% 6.3% 20.0% 11.8% 9.5% 32.5% 9.7% 23.0% 16.2% 7.5%
Return on Invested Capital (ROIC) 4.4% 6.5% 15.4% 12.3% 9.8% 0.0% 1.1% 11.8% 8.6% 4.6%
Valuation Ratios:
Enterprise Value/EBITDA 8.40 7.73 5.75 5.63 7.06 8.52
P/E Ratio (TTM) 21.4 19.5 11.9 11.5 19.3 2.0 49.1 19.3 15.5 31.1
Forward PE 14.2 16.6 13.5 17.4
Book Value Per Share 38.72 38.48 17.34 14.31 13.04 26.41
Price/Book Value Ratio 0.92 1.23 2.38 1.36 1.85 0.66 1.55 4.75 2.44 2.28
Price/Sales Ratio 0.55 0.69 0.43 0.21 0.29 0.13 1.14 1.42 0.95 1.78
Price/(Cash Flow before Addit.) 7.6 9.9 6.2 3.5 1,131.5 6.3 10.3 16.6 9.1 18.8
Price/(Cash Flow after Additions) 26.4 24.8 9.5 5.5 (18.2) 22.9 27.0 20.9 85.1 95.5
PEG Ratio 0.19 115.0% "Long-term Predicted Growth Rate" from Analysts
Forecasts $3.01 $1.40
Other Statistics (all can be found at quote.com under Company or Insiders: 2015 EPS 2014 EPS
Insider Ownership % 6.2% 0.15% 1.59%
Institutional Ownership % 96.9% (18.30) Recent Quarter Incr./Decr. In Shares (mill) 71.9% 91.4%
Cash/Share (calculated) $1.61 $2.46 $5.76 $2.60 $3.61 $2.60
Short Interest Ratio (days) 4.7 1.9 5.4
Short Interest as % of Float 5.9% 2.1% 3.0%
Beta 1.43 0.67 1.00 1.22 1.10
Dow
Chemical
Sensient
Tech Co.
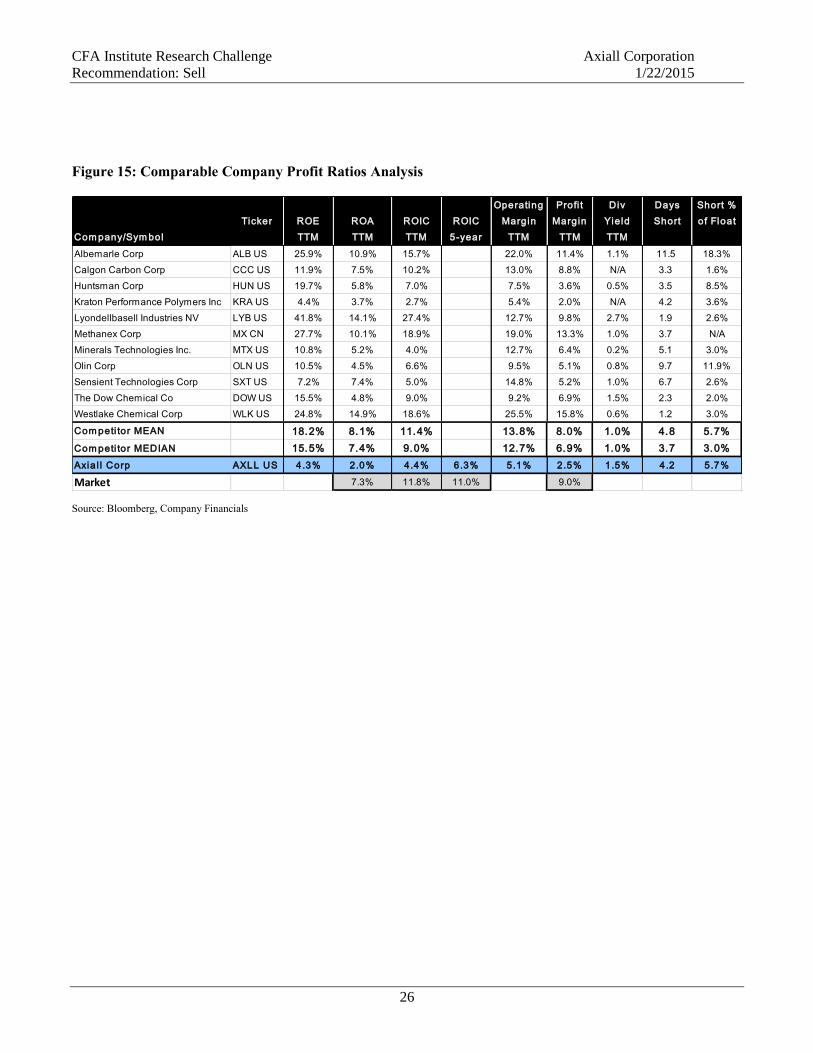
CFA Institute Research Challenge Axiall Corporation
Recommendation: Sell 1/22/2015
26
Figure 15: Comparable Company Profit Ratios Analysis
Source: Bloomberg, Company Financials
Operating Profi t Div Days Short %
Ticker ROE ROA ROIC ROIC Margin Margin Yie ld Short of Float
Com pany/Sym bol TTM TTM TTM 5-year TTM TTM TTM
Albemarle Corp ALB US 25.9% 10.9% 15.7% 22.0% 11.4% 1.1% 11.5 18.3%
Calgon Carbon Corp CCC US 11.9% 7.5% 10.2% 13.0% 8.8% N/A 3.3 1.6%
Huntsman Corp HUN US 19.7% 5.8% 7.0% 7.5% 3.6% 0.5% 3.5 8.5%
Kraton Performance Polymers Inc KRA US 4.4% 3.7% 2.7% 5.4% 2.0% N/A 4.2 3.6%
Lyondellbasell Industries NV LYB US 41.8% 14.1% 27.4% 12.7% 9.8% 2.7% 1.9 2.6%
Methanex Corp MX CN 27.7% 10.1% 18.9% 19.0% 13.3% 1.0% 3.7 N/A
Minerals Technologies Inc. MTX US 10.8% 5.2% 4.0% 12.7% 6.4% 0.2% 5.1 3.0%
Olin Corp OLN US 10.5% 4.5% 6.6% 9.5% 5.1% 0.8% 9.7 11.9%
Sensient Technologies Corp SXT US 7.2% 7.4% 5.0% 14.8% 5.2% 1.0% 6.7 2.6%
The Dow Chemical Co DOW US 15.5% 4.8% 9.0% 9.2% 6.9% 1.5% 2.3 2.0%
Westlake Chemical Corp WLK US 24.8% 14.9% 18.6% 25.5% 15.8% 0.6% 1.2 3.0%
Com peti tor MEAN 18.2% 8.1% 11.4% 13.8% 8.0% 1.0% 4.8 5.7%
Com peti tor MEDIAN 15.5% 7.4% 9.0% 12.7% 6.9% 1.0% 3.7 3.0%
Axia l l Corp AXLL US 4.3% 2.0% 4.4% 6.3% 5.1% 2.5% 1.5% 4.2 5.7%
Market 7.3% 11.8% 11.0% 9.0%
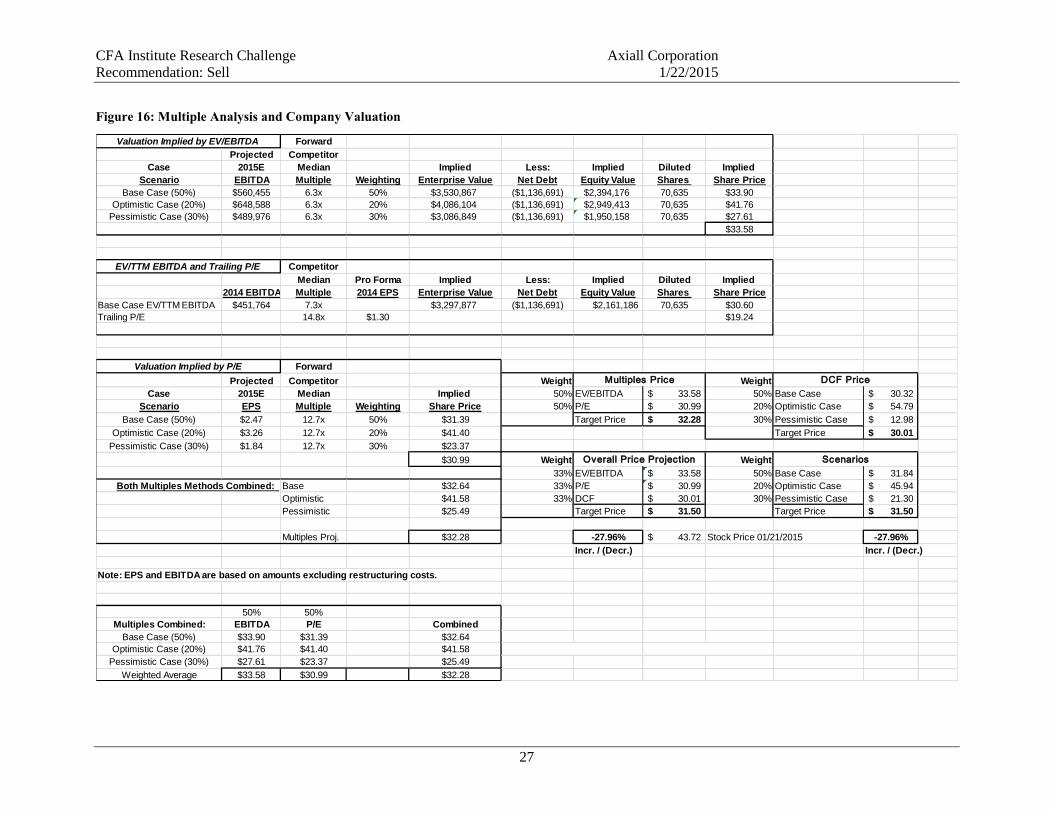
CFA Institute Research Challenge Axiall Corporation
Recommendation: Sell 1/22/2015
27
Figure 16: Multiple Analysis and Company Valuation
Forward
Projected Competitor
Case 2015E Median Implied Less: Implied Diluted Implied
Scenario EBITDA Multiple Weighting Enterprise Value Net Debt Equity Value Shares Share Price
Base Case (50%) $560,455 6.3x 50% $3,530,867 ($1,136,691) $2,394,176 70,635 $33.90
Optimistic Case (20%) $648,588 6.3x 20% $4,086,104 ($1,136,691) $2,949,413 70,635 $41.76
Pessimistic Case (30%) $489,976 6.3x 30% $3,086,849 ($1,136,691) $1,950,158 70,635 $27.61
$33.58
Competitor
Median Pro Forma Implied Less: Implied Diluted Implied
2014 EBITDA Multiple 2014 EPS Enterprise Value Net Debt Equity Value Shares Share Price
Base Case EV/TTM EBITDA $451,764 7.3x $3,297,877 ($1,136,691) $2,161,186 70,635 $30.60
Trailing P/E 14.8x $1.30 $19.24
Forward
Projected Competitor Weight Weight
Case 2015E Median Implied 50% EV/EBITDA 33.58$ 50% Base Case 30.32$
Scenario EPS Multiple Weighting Share Price 50% P/E 30.99$ 20% Optimistic Case 54.79$
Base Case (50%) $2.47 12.7x 50% $31.39 Target Price 32.28$ 30% Pessimistic Case 12.98$
Optimistic Case (20%) $3.26 12.7x 20% $41.40 Target Price 30.01$
Pessimistic Case (30%) $1.84 12.7x 30% $23.37
$30.99 Weight Weight
33% EV/EBITDA 33.58$ 50% Base Case 31.84$
Both Multiples Methods Combined: Base $32.64 33% P/E 30.99$ 20% Optimistic Case 45.94$
Optimistic $41.58 33% DCF 30.01$ 30% Pessimistic Case 21.30$
Pessimistic $25.49 Target Price 31.50$ Target Price 31.50$
Multiples Proj. $32.28 -27.96% 43.72$ Stock Price 01/21/2015 -27.96%
Incr. / (Decr.) Incr. / (Decr.)
Note: EPS and EBITDA are based on amounts excluding restructuring costs.
50% 50%
Multiples Combined: EBITDA P/E Combined
Base Case (50%) $33.90 $31.39 $32.64
Optimistic Case (20%) $41.76 $41.40 $41.58
Pessimistic Case (30%) $27.61 $23.37 $25.49
Weighted Average $33.58 $30.99 $32.28
DCF Price
Valuation Implied by EV/EBITDA
Valuation Implied by P/E
Multiples Price
EV/TTM EBITDA and Trailing P/E
Overall Price Projection Scenarios
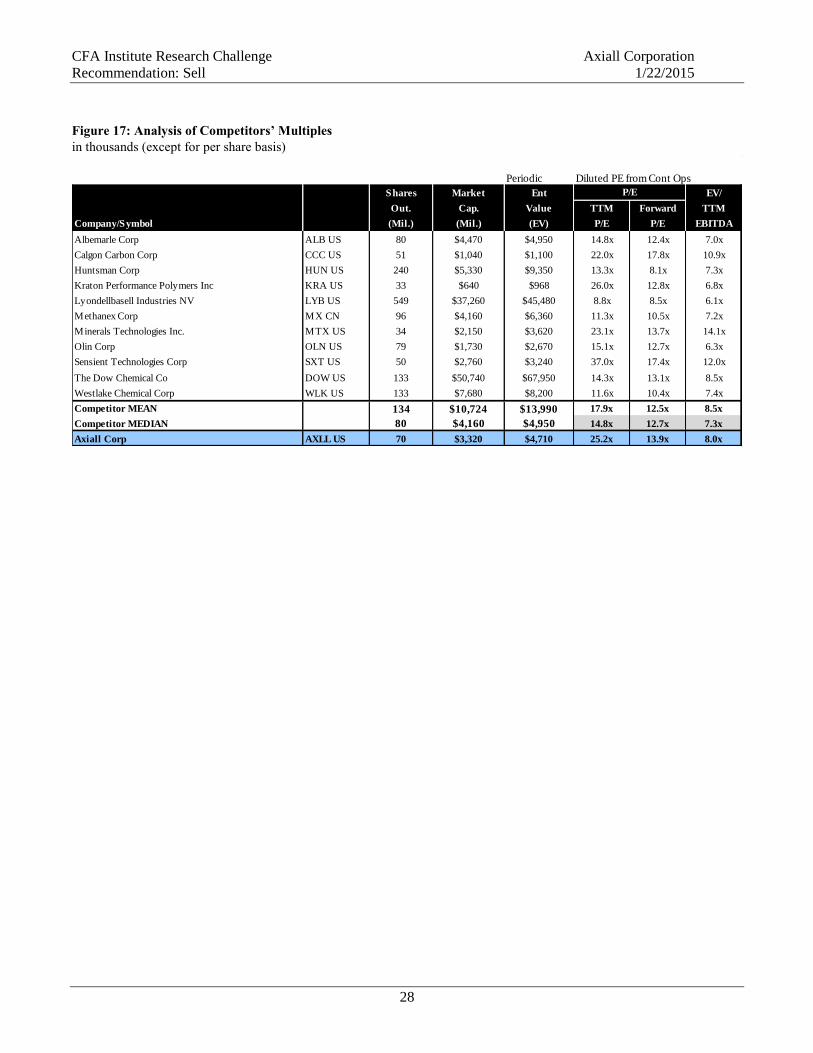
CFA Institute Research Challenge Axiall Corporation
Recommendation: Sell 1/22/2015
28
Figure 17: Analysis of Competitors’ Multiples
in thousands (except for per share basis)
Periodic Diluted PE from Cont Ops
Shares Market Ent EV/
Out. Cap. Value TTM Forward TTM
Company/Symbol (Mil.) (Mil.) (EV) P/E P/E EBITDA
Albemarle Corp ALB US 80 $4,470 $4,950 14.8x 12.4x 7.0x
Calgon Carbon Corp CCC US 51 $1,040 $1,100 22.0x 17.8x 10.9x
Huntsman Corp HUN US 240 $5,330 $9,350 13.3x 8.1x 7.3x
Kraton Performance Polymers Inc KRA US 33 $640 $968 26.0x 12.8x 6.8x
Lyondellbasell Industries NV LYB US 549 $37,260 $45,480 8.8x 8.5x 6.1x
Methanex Corp MX CN 96 $4,160 $6,360 11.3x 10.5x 7.2x
Minerals Technologies Inc. MTX US 34 $2,150 $3,620 23.1x 13.7x 14.1x
Olin Corp OLN US 79 $1,730 $2,670 15.1x 12.7x 6.3x
Sensient Technologies Corp SXT US 50 $2,760 $3,240 37.0x 17.4x 12.0x
The Dow Chemical Co DOW US 133 $50,740 $67,950 14.3x 13.1x 8.5x
Westlake Chemical Corp WLK US 133 $7,680 $8,200 11.6x 10.4x 7.4x
Competitor MEAN 134 $10,724 $13,990 17.9x 12.5x 8.5x
Competitor MEDIAN 80 $4,160 $4,950 14.8x 12.7x 7.3x
Axiall Corp AXLL US 70 $3,320 $4,710 25.2x 13.9x 8.0x
P/E
Disclosures: Ownership and material conflicts of interest:
The author(s), or a member of their household, of this report does not hold a financial interest in the securities of this company.
The author(s), or a member of their household, of this report does not know of the existence of any conflicts of interest that might bias
the content or publication of this report.
Receipt of compensation:
Compensation of the author(s) of this report is not based on investment banking revenue.
Position as an officer or director:
The author(s), or a member of their household, does not serve as an officer, director or advisory board member of the subject
company.
Market making:
The author(s) does not act as a market maker in the subject company’s securities.
Disclaimer:
The information set forth herein has been obtained or derived from sources generally available to the public and believed by the
author(s) to be reliable, but the author(s) does not make any representation or warranty, express or implied, as to its accuracy or
completeness. The information is not intended to be used as the basis of any investment decisions by any person or entity. This
information does not constitute investment advice, nor is it an offer or a solicitation of an offer to buy or sell any security. This report
should not be considered to be a recommendation by any individual affiliated with Atlanta Society of Finance and Investment
Professionals, CFA Society of Alabama, CFA Society of South Carolina, CFA Institute or the CFA Institute Research Challenge with
regard to this company’s stock.
CFA Institute Research Challenge