Embed Size (px)
Citation preview

blueprint for success
2008 annual report
Leadership and People Passion and Dedication
Delivering Profitable Growth Imagination and Innovation Continuous Improvement Excellence in Operating Execution
W M S I N D U S T R I E S , I N C .

Brian R. GamacheChairman and Chief Executive Officer
peopleLeadership
&

Fiscal 2008 was WMS’ best year ever, setting new records for revenues, net income and cash flow
from operations. We achieved this performance by creating high-earning products that casino operators
desire. Through the development of innovative products, we distinguished WMS from our competitors
and increased our market share. We enter Fiscal 2009 with an outstanding pipeline of new products
and significant operating momentum.
WMS’ Fiscal 2008 achievements are the direct result of the collaborative, well-aligned efforts of our
global team of innovative, passionate and talented individuals, who are all driven by the singular goal
of making WMS a truly great global enterprise. Importantly, in this time of economic uncertainty,
our Fiscal 2008 performance resulted in our company ending the year with a healthy balance sheet
capable of supporting continued long-term growth. Our strong operating performance and financial
track record is being recognized by the investment community. Over the last five years, WMS’ stock
price has appreciated 186%, a return to our stockholders that is more than four times greater than
the total return of the S&P 500 Index and five times the average return of our peer group over the
same time period.
dear Fellow StockholderS:
1 w M S I N d U S t r I e S I N c .2
00
8 a
nn
ua
l r
ep
or
t

In Fiscal 2008, a 20% increase in revenue coupled with enhanced operating leverage, as reflected in
our operating margin improving to 16%, drove a 34% increase in annual diluted EPS to $1.15. This
performance clearly demonstrates our ability to generate both revenue traction and operating execution
despite the dual headwinds of a difficult replacement cycle and a challenging economy, particularly in
North America. More importantly, our disciplined approach to operating execution enabled us to
deliver improved financial results, even as we increased our investments to build further long-term
stockholder value. Our investments in innovation, highly focused research and development initiatives
and the creation of intellectual property enable WMS to develop, produce and deliver some of the most
popular and high-earning gaming machines on casino floors today.
Our worldwide unit shipments grew 9% in Fiscal 2008 to nearly 28,000 gaming machines with excep-
tional growth achieved in our international business. Increased international shipments reduce our
reliance upon demand from the North American marketplace. Our gaming operations business also
recorded impressive results, with outstanding performance in all metrics. Our average installed base
of participation gaming machines increased by 20%, or more than 1,000 units, and at June 30, 2008
our footprint was a record 9,321 gaming machines, while our average daily revenue increased 10%
and exceeded $63.00 per unit for the fiscal year.
Our operating success along with our focused effort to contain working capital also led to increased
cash flow from operating activities and, as a result, we ended the fiscal year with cash and cash
equivalents totaling $120 million. In addition, while we are pleased with our successes in managing
inventories and accounts receivable, by benchmarking ourselves to other companies both within and
outside of our industry, we have identified additional opportunities for improvement as we seek to
further enhance our rock-solid balance sheet.
The potent combination of growing cash flow and a solid balance sheet provides a powerful foundation
to fund an impressive array of opportunities to increase stockholder value. We continue to reinvest in
WMS through accelerated internal and external research and development initiatives and share

repurchases. In Fiscal 2008, we incurred a $22 million increase in research and development spending,
spent $20 million on advances for licensed technology and brands and repurchased $40 million of our
common stock.
Our high-return investments in research and development, innovation and technology generate the
expanding pipeline of differentiated, must-have products that are enabling continued global market
share gains in both our for-sale and gaming operations businesses. By focusing on creating great
content, we have consistently developed popular products that, in turn, generate high-earnings and
become must-have products, as casino patrons increasingly seek them out on casino floors. By design-
ing and building the products that players want to play, we create the solutions that give our casino
customers tangible reasons why they should place our products on their casino floor. With consistent
success in the introduction of innovative and high-earning products, we expect to continue to gain
market share in Fiscal 2009.
With meaningful opportunities for profitable growth, reinvesting in WMS’ future through additional
share repurchases is consistent with our focus on building long-term sustainable stockholder value.
To this end, your Board of Directors authorized a $50 million share repurchase plan in August 2007,
and after buying back $40 million under that authorization by June 30, 2008, the Board increased the
repurchase authorization by an additional $100 million in August 2008. Reflecting our confidence in
our future growth prospects, we’ve invested more than $92 million over the past few years repurchasing
approximately 12% of WMS’ outstanding shares.
In Fiscal 2008, we further enhanced our strategic sourcing efforts and expanded the use of lean sigma
practices throughout our operations, all under the banner of continuous improvement. Our lean
sigma initiatives extended beyond the manufacturing floor to business processes, and we used these
principles in the design of our new Bluebird®2 gaming machine, which will launch in Fiscal 2009. Just
as we continue to tap the capabilities of our people to create intellectual property and great games,
so too are we dedicated to being an industry leader in using innovation to improve our production
processes, our customer service and our business processes. We are still in the early phases of
2 » 3 w M S I N d U S t r I e S I N c .2
00
8 a
nn
ua
l r
ep
or
t
implementing these principles company-wide, and through our emphasis on these initiatives we
expect to realize continued productivity that will further enhance our operating margin in Fiscal 2009.
In Fiscal 2008, we implemented a succession plan of reorganization within our Board of Directors
and management. These efforts began with the retirement of Lou Nicastro as Chairman of the Board
after having served WMS with distinction for the past 43 years. Lou will continue to serve on the
Board as Founding Director, allowing the Company and stockholders to benefit from his extensive
experience and invaluable knowledge.
With Lou stepping down, the Board appointed me Chairman in addition to my responsibilities as
CEO. I appreciate the confidence the Board has demonstrated in my appointment, and I will work
tirelessly to guide WMS along the journey that will allow us to reach our full potential. As I look to
the future, our prospects have never been brighter. We have a truly talented organization of creative
and skilled people, our financial position is sound and we have an excellent repository of intellectual
property and an exciting vision for the future. With our innovative, passionate and dedicated team,
I know we will accomplish much more.
Our Board also named Ed Rabin, a member of our Board of Directors since 2005, to the new position
of Lead Director. Additionally during the past year, Robert Bahash, Executive Vice President and
Chief Financial Officer of McGraw Hill; Patricia Nazemetz, Chief Human Resources and Ethics
Officer for Xerox Corporation; and Bobby L. Siller, former member of the Nevada State Gaming
Control Board have joined our Board. Bob, Pat and Bobby are excellent additions to our Board, as
each brings extensive knowledge and leadership experience. At the same time, Harvey Reich became
a Director Emeritus after 25 years of distinguished service to our Board, and we thank him for his
insight and contributions over the years.
With the Board changes, we also made several executive management promotions. Because of the
success of our leadership development efforts, all of these leadership changes were accomplished with

internal advancements. WMS is fortunate to have substantial breadth and depth of talented leadership
across our entire global organization. In the following pages, five of our leaders will share their
perspective on WMS’ competitive strengths and capabilities.
To further support our future growth strategies and employee development efforts, in Fiscal 2008 we
launched a company-wide initiative that promoted additional training and development for every
employee. Our investment in people is behind each of WMS’ accomplishments and strategies. Our
people are our most important resource and by investing in enhancing their skills and capabilities, we
create a truly win-win experience for everyone. We also strive to create an atmosphere where excellence
is recognized and our successes are celebrated and rewarded. This effort has served us well in both
recruiting and retaining creative, talented people around the globe.
WMS also continues to support our local communities through our “Project Lend a Helping Hand”
initiatives. Through this program, WMS works with employees and community organizations to
determine local needs, and then organizes groups of dedicated employees and provides paid time off
to support the efforts of social service organizations, schools and other non-profit organizations. Our
actions have benefited orphanages and children’s homes, child-care and homeless centers, local
schools, and elderly housing in those communities where our facilities are located.
We also expanded our corporate responsibility initiatives with a new focus on “Green” sustainability
programs dedicated to reduce our carbon footprint and waste, while also expanding our recycling
efforts. Each of our major facilities has an employee team that is involved in finding meaningful ways
to make a difference in our daily lives. Through collaborative efforts with our suppliers, we have sub-
stantially reduced our use of corrugated packaging in the last three years. This annual report is
printed on recycled and FSC-Certified paper in accordance with the Forest Stewardship Council. We
must continue to evolve in our processes, in our daily activities and continue to look for new ways that
can make a difference in the way we work, participate in our global environment and support our
local communities.
4 » 5 w M S I N d U S t r I e S I N c .2
00
8 a
nn
ua
l r
ep
or
t

As we look forward to the launch of networked gaming, we are on the verge of substantial industry
change and growth that creates significant opportunities for us to expand and further our progress to
greatness. We believe that WMS is well positioned to benefit from the long-term opportunities that lie
ahead with the adoption of networked gaming. As already demonstrated in the products introduced
over the past two years, we have a clear strategy for the transition path to networked gaming that
generates profitable growth and success—product bank-by-product bank, quarter-by-quarter. With a
clearly defined vision of the benefits made possible in a server-supported, networked gaming environ-
ment, we have achieved notable growth and success in Fiscal 2008. We expect to continue to achieve
further growth in Fiscal 2009, in advance of receiving regulatory approvals of our first commercialized
server-based systems, by producing a consistent f low of unique and exciting products using the
foundational technologies required for success in the networked gaming world.
WMS is a company that has established a consistent record for getting the job done—achieving
superior revenue growth, substantial operating margin improvement and significant acceleration in
cash flow generation. Our focus remains on developing imaginative products and creating intellectual
property; pursuing continuous improvement and operating excellence; and working to create both an
invigorating and inspiring workplace and fulfillment in the lives of our employees. With our innova-
tive, passionate and dedicated team, we are on the path to accomplishing our most ambitious goals in
the years ahead. This focus will continue to create long-term, sustainable stockholder value, and
I look forward to reporting to you on our further progress and results.
Brian R. GamacheChairman of the Board and Chief Executive Officer

Orrin J. Edidin
President
Dedication
Passion
&

8 » 9 w M S I N d U S t r I e S I N c .2
00
8 a
nn
ua
l r
ep
or
t
SUcceSS IN FIScal 2008 reSUlted FroM oUr INveStMeNtS IN INtellectUal property
aNd creatINg the vISIoNary techNology FoUNdatIoN
that we begaN to bUIld MaNy yearS ago, aNd the paSSIoN-
ate dedIcatIoN aNd collaboratIve eFFortS oF the eNtIre
wMS teaM. FroM SkIlled eNgINeerS aNd creatIve gaMe
developMeNt teaMS, to oUr FerveNt FocUS oN reSearch,
to taleNted prodUctIoN aNd dIStrIbUtIoN eMployeeS, to
thoSe IN SaleS aNd ServIce dIlIgeNtly takINg care oF
oUr cUStoMerS, to thoSe workINg behINd the SceNeS to
provIde adMINIStratIve SUpport—It IS oUr people who
are the heroeS MakINg SUcceSS happeN oN a daIly baSIS.
prepared For the FUtUre

we achieved significant progress in the disciplined execution of all five priorities.
We’ve achieved this successful collaboration through commitment and alignment to a set of
measurable, strategic priorities. These five key priorities are: 1) maintaining the growth in
our gaming operations business, while more efficiently investing our capital deployed
in that business; 2) growing our North American market share through innovative new
product offerings; 3) expanding our international business; 4) improving margins; and
5) raising operating cash flow and overall capital returns.
In Fiscal 2008, we achieved significant progress in the disciplined execution of all five
priorities:
1) Our gaming operations revenues grew 32% and the gross margin contribution increased
$45 million, or 33%, over fiscal 2007.

2) We increased our North American new unit ship share in Fiscal 2008, due to the favorable
player and customer response to our innovative new products that marry advancements
in gaming technology with our intellectual property.
3) Our international new unit shipments increased 30% in Fiscal 2008 and represented 35%
of our total shipments, an outstanding achievement driven by strong growth in a wide
range of markets, from Asia to Latin America to Europe.
4) Our operating margin improved to 16% for Fiscal 2008 from 14% a year ago, a signifi-
cant improvement even as our research and development expenses increased by nearly
$22 million, or 38%, to support innovation, the creation of intellectual property and our
expanding line of differentiated products.
1 0 » 1 1 w M S I N d U S t r I e S I N c .2
00
8 a
nn
ua
l r
ep
or
t

5) For Fiscal 2008, our net cash provided by operations increased by $67 million, or 57%
above last year to a record $186 million.
By concentrating on our culture of innovation and creating intellectual properties, by
emphasizing continuous improvement in the execution of our five priorities and by focusing
on being a company that retains, develops and attracts innovative, passionate and dedicated
people, we expect to further strengthen our competitive advantages and positioning for
future growth.
we expect to further strengthen our competitive advantages and positioning for future growth.

Scott D. Schweinfurth
Executive Vice President, Chief Financial Officer and Treasurer
ProfitableGrowth
DeliverinG
1 4 » 1 5 w M S I N d U S t r I e S I N c .2
00
8 a
nn
ua
l r
ep
or
t
IN FIScal 2008, we achIeved oUr FIFth coNSecUtIve year oF doUble-dIgIt growth IN reveNUeS aNd Net INcoMe. we have a healthy
balaNce Sheet wIth $120 MIllIoN IN caSh aNd we have
ShowN great progreSS IN INcreaSINg oUr caSh Flow FroM
operatIoNS. wIth thIS robUSt FINaNcIal FoUNdatIoN, we
are well poSItIoNed to INveSt IN the r&d aNd operatINg
eFFIcIeNcy opportUNItIeS that wIll coNtINUe to drIve
oUr reveNUeS aNd earNINgS growth IN the yearS ahead.
FINaNcIal StreNgth

in millions, except per share amounts 2008 2007 2006
Total Revenues $ 650 $ 540 $ 451
Gross Profit $ 386 $ 305 $ 241
Operating Income $ 104 $ 74 $ 49
Net Income $ 67 $ 49 $ 33
Earnings Per Share—Diluted $1.15 $0.86 $0.63
Stockholders’ Equity $ 511 $ 434 $ 326
Financial highlights
Balanced Revenue Base FY 2008 Revenues
Royalties, VLTs & Other Revenues
4%
10%
International35%
Parts, Game Conversion Kits & Other Sales
Participation Game Revenues
31%North America 65%
New Unit Sales55%

1 6 » 1 7 w M S I N d U S t r I e S I N c .2
00
8 a
nn
ua
l r
ep
or
t
We also took steps in Fiscal 2008 to increase our cash flow by focusing on two areas: better
working capital utilization and improving the financial return and efficiency from capital
deployed in our gaming operations business. Our initiatives to contain working capital during
the past year resulted in a $19 million or 24% reduction in inventory, as inventory turns
increased to 3.1 turns, while our days sales outstanding decreased to 105 days even as we
grew revenues by 20%. By implementing a new disciplined launch strategy for our unique
participation gaming machines, we reduced investment in gaming operations equipment to
$50 million in Fiscal 2008, down 34% from $76 million in the prior year, even as we grew
our average installed base by 20%, or more than 1,000 units.
In aggregate, these focused efforts led to a $66 million increase in total cash and cash
equivalents, even as we also invested $118 million in investing activities and actively repur-
chased shares in Fiscal 2008. Additionally, Stockholders’ Equity grew 18% to $511 million
at June 30, 2008, while our Return on Average Stockholders’ Equity increased to 14%.
With the current uncertainty of a challenging economic environment, WMS’ financial
health provides an added competitive advantage, as we can fund accelerated R&D, continue to
invest in our high-margin gaming operations business, fund intellectual property purchases
and/or licenses, while also retaining substantial financial flexibility to opportunistically
repurchase shares. We are extremely well positioned to continue our growth and increase
stockholder value in the years ahead.

050
100150200250300350400
0
50
100
150
200
250
300
350
$400
Comparison of Cumulative Five-Year Total Return
Dollars
June 2003 June 2004 June 2005 June 2006 June 2007 June 2008
WMS Industries, Inc.
S&P 500 Index
Peer Group$286.43$277.68
$191.48$216.48
$191.15
$157.71
$119.11
$151.00
$126.64
$175.69
$137.57$165.89
$211.26
$144.13
$136.19
Peer Group Companies
Aristocrat Leisure Ltd. | Bally Technologies Inc. | Int’l Game Technology | Progressive Gaming Int’l Corp. | Shuffle Master Inc.
Net Cash Provided by Operating Activites in millions
2008
2007
2006
$186
$119
$103
Operating Margin in percent
2008
2007
2006
16%
14%
11%
Return on Stockholders’ Equity in percent
2008
2007
2006
14%
13%
11%
0 50 100 150 200
0 5 10 15 20
0 3 6 9 12 15
building long-term, Sustainable, profitable growth.

Larry J. Pacey Executive Vice President of Global Products and Chief Innovation Officer
innovationimaGination
&

2 0 » 2 1 w M S I N d U S t r I e S I N c .2
00
8 a
nn
ua
l r
ep
or
t
that IS the hallMark oF wMS. It IS deeply eMbedded IN oUr “cUltUre oF INNovatIoN” aNd FocUSed throUgh the leNS oF oUr prodUct USerS—
oUr playerS. IMportaNtly, It IS INNovatIoN wIth a pUrpoSe.
It IS IMagINatIoN aNd creatIvIty FocUSed oN creatINg
valUe—USINg New techNologIeS aNd INtellectUal property
to eNable UNIqUe, dIFFereNtIated aNd excItINg gaMINg
experIeNceS. ceNtered oN UNderStaNdINg aNd exceedINg
the eNtertaINMeNt expectatIoNS oF caSINo playerS, we dIrect
oUr creatIvIty toward developINg New gaMINg experIeNceS
that provIde UNrIvalled appeal to broad SegMeNtS oF
playerS lookINg For gaMINg eNjoyMeNt.
creatINg great gaMINg experIeNceS
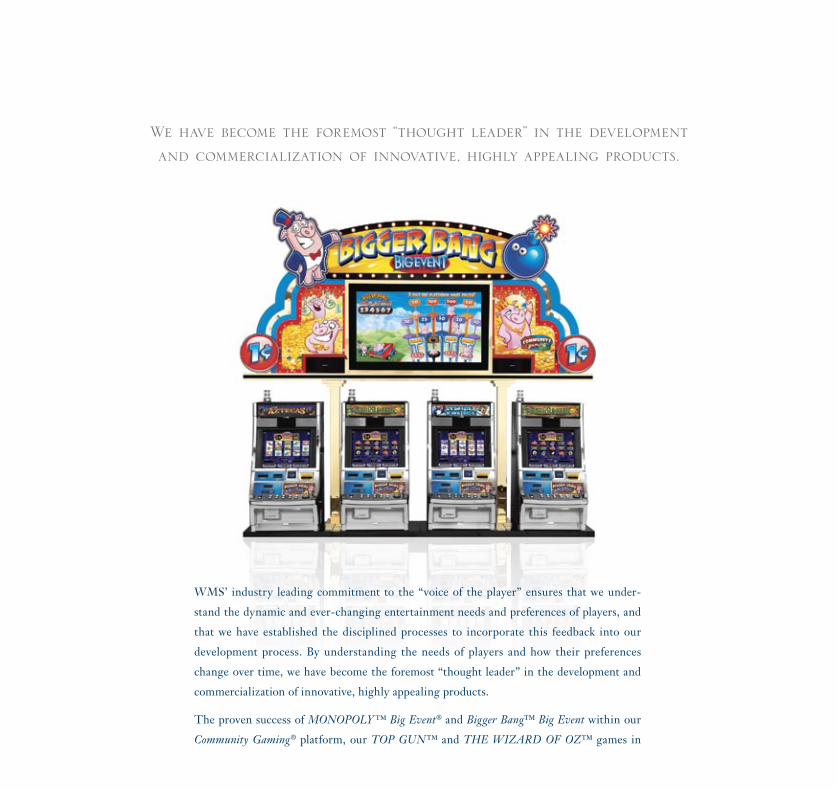
WMS’ industry leading commitment to the “voice of the player” ensures that we under-
stand the dynamic and ever-changing entertainment needs and preferences of players, and
that we have established the disciplined processes to incorporate this feedback into our
development process. By understanding the needs of players and how their preferences
change over time, we have become the foremost “thought leader” in the development and
commercialization of innovative, highly appealing products.
The proven success of MONOPOLY ™ Big Event® and Bigger Bang™ Big Event within our
Community Gaming® platform, our TOP GUN™ and THE WIZARD OF OZ™ games in
we have become the foremost “thought leader” in the development and commercialization of innovative, highly appealing products.

2 2 » 2 3 w M S I N d U S t r I e S I N c .2
00
8 a
nn
ua
l r
ep
or
t
our Sensory Immersion Gaming series and the broad array of games on our Transmissive
Reels™ Gaming platform clearly illustrate how technology advancements can be combined
with imagination to create unique gaming experiences for casino players. WMS is extending
this category-creating success in Fiscal 2009, with the introduction of yet another revolution-
ary platform—the debut of our Adaptive Gaming® platform featuring the STAR TREK™
series of games. Each of these categories of products are enabled by key foundational
technologies that provide the benefits of networked gaming in a singular product format
that can easily extend into casino floor-wide applications as our industry continues to evolve
toward a fully networked, server-enabled environment.

We are also launching our new Bluebird2 gaming machine in Fiscal 2009, which will have
enhanced graphics and audio capabilities and be fully server-ready for the next-generation
technology of networked gaming. It is the result of the collaborative efforts of our engineer-
ing, manufacturing, service and development teams to create our next-generation gaming
platform. Bluebird2 raises the industry standard to a whole new level, and we expect it will
be capable of meeting the needs and preferences of players and casinos for the years ahead.
our bluebird2 gaming platform will have enhanced graphics and audio capabilities, and be fully server-ready for the next-generation technology of networked gaming.

Patricia C. BartenExecutive Vice President of Continuous Improvement
improvementContinuous

2 6 » 2 7 w M S I N d U S t r I e S I N c .2
00
8 a
nn
ua
l r
ep
or
t
eMbracINg chaNge
we begaN oUr joUrNey oF coNtINUoUS IMproveMeNt wIth INItIal FocUS oN eNhaNcINg oUr prodUctIoN proceSSeS. by eNlIStINg the aSSIStaNce oF eMployeeS FroM the
prodUctIoN Floor aNd eMpowerINg croSS-FUNctIoNal teaMS
wIth FUNdaMeNtal proceSS IMproveMeNt SkIllS, we begaN to
StreaMlINe aNd reeNgINeer oUr proceSSeS. the reSUltS are
greater FlexIbIlIty, reSpoNSIveNeSS, lower coStS aNd provIdINg
greater SatISFactIoN to oUr eMployeeS aNd cUStoMerS alIke. Now
we are broadeNINg the deployMeNt oF oUr INItIatIveS acroSS
the coMpaNy aNd acroSS oUr bUSINeSS proceSSeS, aNd INtro-
dUcINg addItIoNal leaN SIgMa toolS aNd other perForMaNce
eNhaNceMeNt MethodologIeS, SUch aS Strategy deployMeNt.

we are effecting positive change and establishing a strong foundation for continued and sustainable improvements.
We have made meaningful progress—in our willingness to embrace change, in prioritizing
our opportunities and in working together across functions. By combining the expanded
use of continuous improvement tools with a greater understanding of our processes, we are
effecting positive change and establishing a strong foundation for continued and sustain-
able improvements.
One such cross-functional team has been instrumental in bringing our new Bluebird2 gaming
platform to life. Through their efforts, this new platform will not only bring a new level of
player delight to the casino floor, but to also ensure a design for effective and efficient

2 8 » 2 9 w M S I N d U S t r I e S I N c .2
00
8 a
nn
ua
l r
ep
or
t
manufacturing and greater ease in servicing by our customers. From the involvement of
suppliers and manufacturing, to the innovative insights of our engineers, to raising the bar
on meeting the needs of players and customers, the Bluebird2 will set a new industry standard
of performance on the casino gaming floor.
Today, we have teams focusing on specific projects for short time periods; while others meet
regularly to bring ongoing focus to broader opportunities that deliver results over longer
periods. Each advancement builds on prior efforts and lays the groundwork for the next

our continuous improvement is our broad “how to” blueprint to the future.
effort. The results achieved are a clear contributor to the improvement in our operating
margin to 16% in Fiscal 2008 from 8% in Fiscal 2005.
Continuous improvement is our broad “How To” blueprint to the future. It is our plan for
building a stronger company with superior operating and financial performance. It is a
journey that we expect will continue to deliver improvements in our margins, our financial
returns and in the workplace environment for our employees. We have seen the benefits
achieved with our continuous improvement efforts to date, and we expect our future efforts
will help us achieve excellence in all that we do.
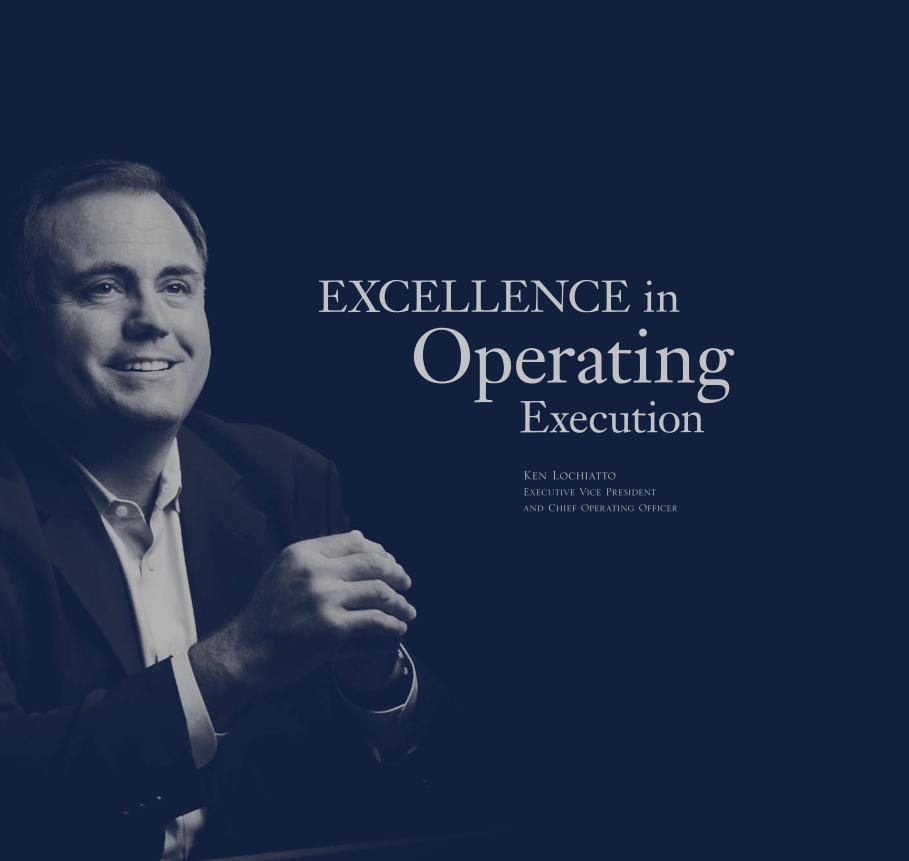
Ken Lochiatto Executive Vice President and Chief Operating Officer
operatingexecution
exCellenCe in

3 2 » 3 3 w M S I N d U S t r I e S I N c .2
00
8 a
nn
ua
l r
ep
or
t
cUStoMer SatISFactIoN
havINg great gaMINg coNteNt alwayS raNkS FIrSt aMoNg oUr cUStoMerS’ pUrchaSe prIorItIeS,
aNd wMS IS well recogNIzed For creatINg oUtStaNdINg
prodUctS that appeal to playerS. addItIoNally, we have
INcreaSed oUr FocUS oN bUIldINg a global teaM that wIll
be eqUally well recogNIzed aS the INdUStry StaNdard
For cUStoMer ServIce aNd operatINg excelleNce. we
have Made SIgNIFIcaNt StrIdeS IN the laSt Few yearS aNd,
dUrINg FIScal 2008, we alIgNed all oF oUr cUStoMer
toUch poINtS to help US realIze theSe goalS.

our commitment is to redefine and raise our customers’ expectations.
By fully aligning and focusing our entire supply chain—from suppliers to production to
distribution to service—we are raising the bar on customer service, while continuing to
drive substantial improvement in operational effectiveness. Our commitment is to redefine
and raise our customers’ expectations—from ease of ordering to ongoing customer service,
providing a customer experience that will rank among the best in any industry.
Our initiatives are not only helping us improve our level of service, they are also driving
increased productivity, quality, improved margins and significantly lower levels of inventory.

3 4 » 3 5 w M S I N d U S t r I e S I N c .2
00
8 a
nn
ua
l r
ep
or
t
This was clearly exhibited in our fiscal 2008 operating performance as revenues grew by
20% while inventories declined by 24%, even as we prepared for the introduction of our
new, innovative Bluebird2 cabinet.
As we improve our operating execution, we also improve our flexibility and ability to address
our customers’ needs and expectations. We know that great products and great customer
service will provide us with a competitive advantage that will help sustain our growth and
enhance stockholder value.

board oF dIrectorS
Louis J. Nicastro, Founding Director
Brian R. Gamache Chairman of the Board and Chief Executive Officer, WMS Industries Inc.
Edward W. Rabin, Jr. Lead Director and Retired President, Hyatt Hotels Corporation
Harold H. Bach, Jr. Private Investor
Robert J. Bahash Executive Vice President and Chief Financial Officer, The McGraw-Hill Companies
Patricia M. Nazemetz Chief Human Resources and Ethics Officer, Xerox Corporation
Neil D. Nicastro Retired President, Chief Executive Officer and Chairman of the Board, Midway Games Inc.
Ira S. Sheinfeld Partner, Hogan & Hartson, LLP (Attorneys-at-Law)
Bobby L. Siller Former Member, Nevada State Gaming Control Board
William J. Vareschi, Jr. Retired Chief Executive Officer and Vice Chairman of the Board, Central Parking Corporation
board coMMItteeS
Audit and Ethics Committee
Harold H. Bach, Jr. Chairman
Robert J. Bahash
Edward W. Rabin, Jr.
William J. Vareschi, Jr.
Compensation Committee
Edward W. Rabin, Jr. Chairman
Robert J. Bahash
Patricia M. Nazemetz
Nominating and Corporate Governance Committee
William J. Vareschi, Jr. Chairman
Patricia M. Nazemetz
Bobby L. Siller
Gaming Compliance Committee
Steve DuCharme Chairman, (non-board member)
Neil D. Nicastro
Bobby L. Siller
oFFIcerS
Brian R. Gamache Chairman of the Board and Chief Executive Officer
Orrin J. Edidin President
Scott D. Schweinfurth Executive Vice President, Chief Financial Officer and Treasurer
Larry Pacey Executive Vice President, Global Products and Chief Innovation Officer
Kenneth Lochiatto Executive Vice President and Chief Operating Officer
Patricia C. Barten Executive Vice President, Continuous Improvement
Kathleen J. McJohn Vice President, General Counsel and Secretary
John P. McNicholas, Jr. Vice President, Controller and Chief Accounting Officer
directors and officers

800 South Northpoint Boulevard
Waukegan, Illinois 60085
847.785.3000
www.wms.com
TRIBUTELouis J. Nicastro (Lou) retired as Chairman of the Board of our Company on July 1,
2008, after serving more than 43 years with WMS or its predecessor companies,
including 35 of those years as Chairman. Lou will remain on the Board of WMS in the
new position of Founding Director.
His career has been distinguished by his visionary leadership, his strategic accomplish-
ments, and his steadfast focus on building a successful and enduring business. During
his tenure with the Company, Lou guided our transformation from an amusement
game company into a global gaming equipment leader renowned for its innovation.
His strategic vision and boundless energy allowed WMS to transform itself into a
growing, world class, international organization well-positioned with significant
opportunities for the future.
Lou leaves not only a legacy of financial and operating success, but of laying the solid
foundation upon which WMS is built—a culture infused with innovation, teamwork,
passion and a mind-set for embracing change.
Lou, on behalf of everyone at WMS—employees, stockholders and our Board of
Directors—we thank you and we wish you continued good health and success.
LOUIS J. NICASTRO
ACkNOWLEDgMENT
&

3 6 » 3 7 W M S I N D U S T R I E S I N C .2
00
8 a
nn
ua
l r
ep
or
t
5-Year Financial Data
Management’s Discussion and Analysis of Financial Condition and Results of Operations
Report of Independent Registered Public Accounting Firm
Management’s Report on Internal Control over Financial Reporting
Report of Independent Registered Public Accounting Firm on Internal Control over Financial Reporting
Consolidated Balance Sheets
Consolidated Statements of Income
Consolidated Statements of Stockholders’ Equity and Comprehensive Income
Consolidated Statements of Cash Flows
Notes to Consolidated Financial Statements
Corporate Information
38
39
63
64
65
66
67
68
70
71
92

5-YEAR FINANCIAL DATA
Fiscal Year Ended June 30, 2008 2007 2006 2005 2004
(in millions of U.S. dollars and millions of shares, except per share amounts)STATEMENT OF OPERATIONS DATA:Product sales revenues $ 421.2 $ 366.3 $ 302.5 $ 278.6 $ 145.9Gaming operations revenues 228.9 173.5 148.7 109.8 84.3
Total revenues 650.1 539.8 451.2 388.4 230.2Operating income (loss) 104.4 74.2 49.0 30.7 (1.8)(Provision) benefit for income taxes (38.1) (22.8) (15.9) (9.1) 2.1Net income (loss)(1)(2)(3)(4) $ 67.5 $ 48.9 $ 33.3 $ 21.2 $ (0.9)
COMMON SHARE SUMMARY:Net income (loss) per share—basic $ 1.34 $ 1.01 $ 0.71 $ 0.46 $ (0.02)Net income (loss) per share—diluted $ 1.15 $ 0.86 $ 0.63 $ 0.41 $ (0.02)Weighted-average common shares outstanding—basic 50.2 48.4 47.1 46.1 44.6Weighted-average common shares and common stock equivalents outstanding—diluted 60.6 59.6 56.9 56.6 44.6CASH FLOW DATA:Net cash provided by (used in): Operating activities $ 186.2 $ 118.9 $ 103.1 $ 6.1 $ (18.0) Investing activities (117.8) (158.8) (94.1) (45.8) (43.6) Financing activities (5.2) 35.6 (4.6) 15.4 22.0BALANCE SHEET DATA:Cash and cash equivalents, restricted cash and short-term investments $ 119.6 $ 53.2 $ 52.7 $ 44.8 $ 116.2Working capital 296.7 255.5 234.2 241.8 237.5Total assets 772.7 655.7 526.4 478.4 395.0Long-term debt 115.0 115.0 115.0 115.0 115.0Stockholders’ equity 510.8 433.6 325.6 285.2 239.5
All share and per share amounts have been retroactively adjusted to reflect the effect of our May 2007 stock split.
(1) Net income in fiscal 2008 includes $9.4 million of after-tax share-based payment expense, compared to $7.7 million, $7.6 million, $2.4 million and $0.5 million in fiscal 2007, 2006, 2005 and 2004, respectively. The increase in share-based payment expense in fiscal 2008, 2007 and 2006 is due to the Company’s adoption of Statement of Financial Accounting Standards (“SFAS”) No. 123R, effective July 1, 2005. See also Note 2, “Principle Accounting Policies” to our Consolidated Financial Statements.
(2) Net income in fiscal 2008 includes a $2.3 million after-tax write-down to net realizable value of a technology license.
(3) Net income in fiscal 2007 includes a $1.0 million after-tax charge for expenses associated with management separation costs during the period and a $0.7 million tax benefit related to the period January 1, 2006 through June 30, 2006, due to the retroactive reinstatement of the research and development tax credit legislation in December 2006.
(4) Net income in fiscal 2005 includes: an after-tax charge of $0.7 million for employee separation costs; an after-tax gain of $0.4 million in other income from the license of certain intellectual property of a discontinued business; pre- and after-tax income of $1.5 million related to final settlement of tax advances with our former subsidiary, Midway Games, which we previously fully reserved; and a non-cash after-tax charge of $2.9 million relating to net inventory charges to reduce legacy inventory to net realiz-able value.
3 8 » 3 9 W M S I N D U S T R I E S I N C .2
00
8 a
nn
ua
l r
ep
or
t
MANAgEMENT’S DISCUSSION AND ANALYSIS OF FINANCIAL CONDITION AND RESULTS OF OPERATIONS
As used in this Report, the terms “we,” “us,” “our,” and “WMS” mean WMS
Industries Inc., a Delaware corporation, and its subsidiaries. All references
to years, unless otherwise noted, refer to our fiscal year, which ends on
June 30. All references to quarters, unless otherwise noted, refer to the
quarters of our fiscal year.
OVERVIEW
Our mission is to create the most entertaining products in the world and
service our customers with uncompromising passion for quality. We design,
manufacture and distribute gaming machines and video lottery terminals
(“VLTs”) for customers in legalized gaming jurisdictions worldwide. Our
products consist primarily of video gaming machines, mechanical reel
gaming machines and VLTs. Our gaming machines are installed in all of the
major regulated gaming jurisdictions in the United States, as well as in over
100 international gaming jurisdictions. We generate revenue in two principal
ways: from product sales and from gaming operations.
Product Sales
Product sales revenue includes the sale of new and used gaming machines
and VLTs, parts, conversion kits (including theme and/or operating system
conversions), amusement-with-prize (“AWP”) gaming machines, gaming-
related systems for smaller international casino operators and equipment
manufactured under original equipment manufacturing (“OEM”) agree-
ments to casinos and other licensed gaming machine operators. We derive
product sales revenue from the sale of the following:
» Multi-line, multi-coin video gaming machines, in our Bluebird® and
Orion Gaming’s TwinstarTM-branded cabinets;
» Mechanical reel-spinning gaming machines in our Bluebird-branded
cabinets;
» Video poker machines in our Bluebird-branded cabinets, which are
primarily offered as a casino-owned daily fee game, where the casino
purchases the base gaming machine and then leases the top box and
game for a lower lease price point;
» Replacement parts and conversion kits for our legacy, Bluebird,
Twinstar and AWP gaming machines, and CPU-NXT® upgrade kits;
» Used gaming machines that are acquired on a trade-in basis or that
were previously placed on a participation basis;
» AWP gaming machines in certain international markets;
» Gaming-related systems, including linked progressive systems and
slot accounting systems applicable to smaller international casinos; and
» Gaming stations in legacy, Bluebird and Twinstar cabinets in limited
cases under OEM agreements to certain third parties.
Gaming Operations
We earn gaming operations revenues from leasing participation games,
gaming machines, and VLTs, and earn royalties that we receive from third
parties under license agreements to use our game content and intellectual
property. Our gaming operations include the following product lines:
» Participation games, which are gaming machines owned by us that
we lease based upon any of the following payment methods: (1) a
percentage of the net win, which is the casino’s earnings generated by
casino patrons playing the gaming machine; (2) fixed daily fees; or (3) in
the case of wide-area progressive gaming machines, a percentage of
the amount wagered or a combination of a fixed daily fee plus a
percentage of the amount wagered. We have the ability to place these
gaming machines on a participation basis because of the superior
performance of the game and/or the popularity of the brand, which
generates higher wagering and net win to the casinos or gaming
machine operators than the gaming machines we sell outright.
Participation games include the following categories:
•Wide-areaprogressiveparticipationgames(“WAP”);
•Local-areaprogressiveparticipationgames(“LAP”);
•Stand-aloneparticipationgames;
» Casino-owned daily fee games, where the casino or gaming machine
operator purchases the base gaming machine and pays a lower daily
lease fee for the top box and game;
» Leased gaming machines;
» Video lottery terminals; and

MANAgEMENT’S DISCUSSION AND ANALYSIS OF FINANCIAL CONDITION AND RESULTS OF OPERATIONS [continued]
» Licensing revenues related to our game content and intellectual
properties.
OUR FOCUS
With the marketplace dynamics of lower replacement demand in fiscal
2008 and 2007, coupled with a slowing economy especially in North
America in fiscal 2008, we remained focused on five key strategic priorities:
(1) continue to grow our gaming operations business with its recurring rev-
enue stream and higher gross profit margins; (2) extend our North American
market share gains through innovative new product offerings; (3) expand
globally to further diversify our revenue mix and reduce our dependence
on North American revenues; (4) increase margins through operating pro-
cess improvements; and (5) continue to generate and grow sustainable,
recurring cash flows.
1. Priority: Continue to pursue the managed expansion of our high-
margin gaming operations business, while working to achieve a
higher return on invested capital in this business.
Fiscal 2008 Result: During the year ended June 30, 2008, our average
installed base of participation gaming machines increased 20% over
the prior year and, at June 30, 2008, our total installed participation
footprint stood at 9,321 units compared to 8,276 units at June 30,
2007. Growth in the installed base was primarily led by our stand-alone
units due to the success of our Big Event® Community Gaming® series
and our WAP products, which at June 30, 2008 comprised 20% of the
footprint compared to 18% at June 30, 2007. A shift in strategy to
focus on return on investment of our gaming operations assets in late
fiscal 2007 resulted in improved revenue per day in fiscal 2008. This
strategy included limiting the number of gaming machines for specific
new games at each casino and redeploying gaming machines from
casinos generating a lower revenue per day to casinos generating a
higher revenue per day. By limiting the initial placement of participation
products, we reduced the capital invested in gaming operations in
fiscal 2008 by $25.5 million or 34% from fiscal 2007. A 10% improve-
ment to $63.34 in the average daily revenue, coupled with the 20%
improvement in the average installed base, produced a 32% year-
over-year increase in revenue from our gaming operations business.
2. Priority: Gain North American product sales market share.
Fiscal 2008 Result: The North American replacement cycle has length-
ened and the economy has slowed, thus overall industry demand has
been reduced. In spite of this, our new unit shipments in North
America were essentially flat in fiscal 2008 due to our continued ability
to gain market share with high earning products in a competitive
marketplace. In fiscal 2008, amended compacts were approved in
California that provide five Native American casinos with expanding
gaming capability, and we believe we achieved approximately 25%
market share for the first gaming machines purchased by these casi-
nos. In addition, our expanded product bandwidth coupled with our
strength in available content contributed directly to the stronger
demand for our game conversions. We are dependent, in part, on
innovative new products, casinos expansions and new market oppor-
tunities to generate growth. We have continued to increase our
spending on research and development activities to be able to offer
creative and high earning products to our customers and for fiscal
2008, such expenses are up $21.8 million or 38% over fiscal 2007.
Expansion and new market opportunities may come from political
action as governments look to gaming to provide tax revenues
in support of public programs and view gaming as a key driver
for tourism.
3. Priority: Continue to expand our international revenue base.
Fiscal 2008 Result: During fiscal 2008, international shipments increased
30%, driven by strong demand across the range of international mar-
kets, from Asia to Latin America to Europe. Shipments to international
markets represented 35% of our total new unit shipments in fiscal
2008, compared with 30% in fiscal 2007. We are accomplishing this
international success through the simultaneous introduction of new
products in both the domestic and international markets, and thereby
capitalizing globally on the popularity and success of our newest
introductions. The addition of Orion Financement Company (“Orion

4 0 » 4 1 W M S I N D U S T R I E S I N C .2
00
8 a
nn
ua
l r
ep
or
t
Gaming”) and Systems in Progress (“SiP”) also contributed to our
expanding worldwide presence through complementary technology
and game development capabilities. In the June 2008 quarter, Orion
Gaming launched its new Twinstar2 gaming machine and its new
N-AbleTM operating system which we expect will drive greater
demand for Orion Gaming products in the future. Also we continue
to achieve benefits from the opening of new international offices and
the addition of new geographically dispersed sales account execu-
tives. We believe we will continue to increase our global market share
in fiscal 2009.
4. Priority: Focus on improving our margins.
Fiscal 2008 Result: Our operating margin improved 240 basis points to
16.1% in fiscal 2008 from 13.7% a year ago even as research and devel-
opment expenses increased year-over-year by $21.8 million, or 38%.
In fiscal 2008 our overall gross profit margin improved by 290 basis
points to 59.4% led by a 260 basis point increase to 48.4% in our prod-
uct sales margin. We are still only in the early stages of implementing
our lean sigma and strategic sourcing initiatives, but we are realizing
positive results, and we believe these initiatives will continue to drive
margin improvement in future years. We expect to benefit from an
expanded volume of business which should result in greater volume
discounts from our suppliers and enable us to spread our overhead
costs over a larger number of units thereby reducing cost per unit. In
addition, through disciplined cost management, we continue to
expect to realize operating leverage from higher revenues as our
total operating costs are not expected to grow at the same percent-
age as revenues. Our research and development spending includes
the ongoing investment we are making to create intellectual property
and advanced technologies that will power our innovative products
in the future and support our existing product lines.
5. Priority: To drive higher cash flow.
Fiscal 2008 Result: For fiscal 2008 net cash provided by operations
increased by $67.3 million to $186.2 million, or 57% higher than in fiscal
2007. A cross functional focus on improving utilization of working
capital resulted in improving our inventory turns to 3.1x and reducing
our days sales outstanding to 105 days. As a result, our changes in
assets and liabilities in our Consolidated Statements of Cash Flows
have improved to an inflow of $0.1 million in fiscal 2008 compared to
a use of $29.8 million in fiscal 2007, despite a 20% increase in reve-
nues. In addition, significant improvement is being made in our abil-
ity to more effectively manage the capital deployed in our gaming
operations business. During fiscal 2008, the installed footprint of par-
ticipation gaming machines increased 1,045 units or 13%, while our
investment in gaming operations equipment totaled $50.4 million,
compared to the $75.9 million invested in fiscal 2007 when our
installed base increased 1,191 units or 17%. Our investment in gaming
operations equipment reflects the continued strong positive
response to our three new participation platforms: Community
Gaming, Sensory Immersion and Transmissive ReelsTM. As a result of our
improving cash flow, our total cash, cash equivalents and restricted
cash as of June 30, 2008, rose 125% to $119.6 million from $53.2 mil-
lion as of June 30, 2007.
The priorities for the utilization of our improving cash flow are to continue
to enhance stockholder value by emphasizing internal and external invest-
ments to create and license advanced technologies and intellectual prop-
erty, continuing to seek acquisitions that can extend our international
presence, increase our intellectual property portfolio, and expand our
earnings potential and, when appropriate, repurchase shares in the open
market or in privately negotiated transactions. In fiscal 2008, our research
and development spending increased $21.8 million over fiscal 2007. We
spent $19.5 million in investments and advances in royalties, licensed tech-
nologies, patents and trademarks, and we funded approximately $35.0 mil-
lion of common share repurchases.
Server-Based Gaming
We believe that server-based gaming (“SBG”) will be the next significant
technology development in the gaming machine industry. SBG refers to a
networked gaming system that links groups of server-enabled gaming
machines to a remote server in the casino data center. Once the gaming
machines are on the server-based network, new applications, game func-
tionality, and system-wide features can be enabled. SBG networks will

MANAgEMENT’S DISCUSSION AND ANALYSIS OF FINANCIAL CONDITION AND RESULTS OF OPERATIONS [continued]
require regulatory approval in gaming jurisdictions prior to any implemen-
tation and will represent a significant addition to our existing portfolio of
product offerings. We have been introducing the foundational technolo-
gies and hardware for SBG to the market for the past two years and we will
continue to implement this strategy in fiscal 2009 leading up to the launch
of our WAGE-NET® SBG system in fiscal 2010.
Our vision for SBG expands on the basic functionality of downloadable
games, remote configuration of betting denominations and central deter-
mination of game outcomes and emphasizes enhanced game play and
excitement for the player. In a networked environment, we believe game
play will no longer be limited to an individual gaming machine; rather, we
believe SBG will permit game play to be communal among many players.
We also expect that with networked gaming machines that we will be able
to offer system wide features and game functionality along with applica-
tions that add value to casino operators’ operations. We will continue SBG
development, working with our competitors and customers to ensure the
future is powered by an open, networked environment that uses industry
standard communication protocols which will enable products from multi-
ple suppliers to efficiently work together with limited investment in addi-
tional programming or interfaces.
Our path to the server-enabled marketplace takes elements of our technol-
ogy road map and converts them into commercializable products in
advance of the launch of the full functionality of SBG systems. Fiscal 2007
was highlighted by the successful launch of Community Gaming, made
possible by using a server outside the gaming machine to drive the bonus-
ing activity for an entire bank of games, thereby creating a true communal
gaming experience. In fiscal 2007, we also commercialized the next step
forward in computing power and capability with our CPU-NXT2 operating
system and platform that will be the basis for our server-enabled Bluebird2
gaming machines. CPU-NXT2 drives our Transmissive Reels platform and
real-time, 3D graphics and surround sound capabilities for our Sensory
Immersion platform. Further, we combined an interactive see-through LCD
with the traditional appeal of authentic mechanical spinning reels to make
Transmissive Reels a potential fixture for mechanical reel gaming machines
on the server-based slot floor. We launched Adaptive Gaming®, another key
component to our server-based technology in July 2008. The commercial
launch of the Bluebird2 cabinet, which is server ready, is expected to begin
in the December 2008 quarter. At the G2E® trade show in November 2007
and the ICE trade show in January 2008, we also demonstrated the inter-
operability of our WAGE-NET system, Bluebird2 cabinets and CPU-NXT2
operating system with other manufacturers’ products and systems using
the open access of the industry standard communication protocols devel-
oped by the Gaming Standards Association: G2S® and S2S®.
In February 2008, we entered into a ten-year non-exclusive, royalty-bearing
patent cross-license agreement with IGT. This agreement provides for a
cross license of intellectual property evidenced by certain patents owned
by each of us relating to computing and SBG infrastructures. Also in
February 2008 we received GLI approval on the first-point release of our
WAGE-NET server-based system, incorporating GSA communication stan-
dards and basic server-based functionality, which was placed for field trial
at a popular tribal casino. In July 2008 we received similar approval from
the Nevada gaming regulators and began a field trial at a popular Las Vegas
strip casino. While basic in functionality, this system represents the first
step in the process to receive regulatory approval of the first commercial
version of WAGE-NET. We are pleased with the feedback and field test
results thus far; and we continue to expect final approval of the first com-
mercial version of the WAGE-NET system in fiscal 2010.
OTHER KEY FISCAL 2008 ACTIVITIES
Acquisition of Systems in Progress
On July 19, 2007, we completed the acquisition of 100% of the outstanding
stock of privately held SiP, an Austrian-based company focused on devel-
oping and selling gaming related systems, including linked progressive
systems and slot accounting systems applicable for smaller international
casino operators. The total consideration for SiP, including acquisition costs,
was $4.9 million. SiP’s former majority shareholder is a customer of ours
and $4.5 million of the total consideration resulted from extinguishing
trade accounts receivable owed by that customer to us for the customer’s
entire equity ownership in SiP. Two minority shareholders were paid equal
value in cash and shares of our common stock that in total aggregated

4 2 » 4 3 W M S I N D U S T R I E S I N C .2
00
8 a
nn
ua
l r
ep
or
t
approximately $0.2 million. The final purchase price allocation resulted in
$3.1 million of identifiable intangible assets and $1.8 million of goodwill.
The transaction was immaterial to our fiscal 2008 Consolidated Financial
Statements and, therefore, pro forma financial information is not provided.
See Note 4, “Business Acquisitions” to our Consolidated Financial Statements.
Common Stock Repurchase Program
On August 4, 2008, our Board of Directors authorized the repurchase of an
additional $100 million of our common stock over the following twenty-
four months. This authorization increases the existing program, previously
authorized on August 6, 2007, from $50 million to $150 million. As of
August 26, 2008, we have a total open authorization of approximately $107
million. Pursuant to the authorization, purchases may be made from time
to time in the open market, through block purchases or in privately negoti-
ated transactions. The timing and actual number of shares repurchased
will depend on market conditions. During the fiscal year ended June 30,
2008, we purchased 1,208,971 shares for approximately $40 million at an
average cost of $33.08 per share. As of June 30, 2008, prior to the recent
authorization increase, we had approximately $10 million available under
the then existing program.
CRITICAL ACCOUNTINg POLICIES AND ESTIMATES
Our accounting policies are more fully described in Note 2, “Principal
Accounting Policies” to our Consolidated Financial Statements. The prepa-
ration of financial statements in conformity with U.S. generally accepted
accounting principles requires management to make estimates and
assumptions about future events that affect the amounts reported in our
Consolidated Financial Statements and accompanying Notes. Actual results
could differ significantly from those estimates. We believe that the following
discussion addresses our most critical accounting policies, which are those
that are most important to the portrayal of our financial condition and
results of operations and require management’s most difficult, subjective
and complex judgments. We have discussed the development, selection
and disclosure of our critical accounting policies and estimates with the
Audit Committee of our Board of Directors.
Revenue Recognition
Our revenue recognition principle for both product sales and gaming
operations is to record revenue when all the following criteria are met:
» Persuasive evidence of an agreement exists;
» The price to the customer is fixed or determinable;
» The product is delivered; and
» Collectibility is reasonably assured.
The application of revenue recognition policies is critical due to the nature
of the product sales contracts we execute. When multiple product deliver-
ables are included under a sales contract, we allocate revenue to each
product based upon its respective fair value against the total contract
value and defer revenue recognition on those deliverables where we have
not met all requirements of revenue recognition. Fair value is determined
based on the prices charged when each element is sold separately.
Revenues are recognized in accordance with our accounting policies for
the separate elements when the products have value on a stand-alone
basis and fair value of the separate elements exists. While determining fair
value and identifying separate elements requires judgment, generally fair
value and the separate elements are readily identifiable as we also sell
those elements unaccompanied by other elements. In accordance with
Emerging Issues Task Force Issue 00-21, Accounting for Revenue Arrange-
ments with Multiple Deliverables, we allocate revenue to each unit of
accounting based upon its fair value as determined by “vendor specific
objective evidence.” Vendor specific objective evidence of fair value for all
elements of an arrangement is based upon the normal pricing and dis-
counting practices for those products and services when sold individually.
For LAP and stand-alone participation gaming machines, revenues are cal-
culated based on gaming machine performance data provided to us by
our customers (such as a percentage of the amount of a gaming machine’s
win per day or fixed fee based on the actual number of days the gaming
machine was on the casino floor). Due to the timing of the receipt of such
performance data, we are required to make estimates of our LAP and
stand-alone participation revenue based on an analysis of the historical

MANAgEMENT’S DISCUSSION AND ANALYSIS OF FINANCIAL CONDITION AND RESULTS OF OPERATIONS [continued]
data reported to us and taking into account anticipated or known events
that may affect the historical trend, such as contract cancellations or addi-
tional gaming machine placements at a particular customer’s facility. We
compare our estimates to the actual data, once received, and adjust our
revenue estimates accordingly.
We currently do not apply the provisions of Statement of Position 97-2,
Software Revenue Recognition (“SOP 97-2”), to sales of our products. The
sales of our gaming machines includes games and an operating system,
which are an integral part of a gaming machine, but are “incidental” under
the guidance of SOP 97-2 and, as such, we apply the revenue recognition
principles discussed in Note 2, “Principal Accounting Policies” to our
Consolidated Financial Statements. We do apply SOP 97-2 to gaming-
related systems revenues generated by SiP. We will continually monitor the
application of SOP 97-2 to our business as we receive final regulatory
approval of our SBG system.
The application of this policy affects the level of our product sales and
gaming operations revenue, cost of product sold, cost of gaming opera-
tions, accounts receivable, deferred revenue and accrued expenses. In fiscal
2008, 2007 and 2006, we had no material changes in the critical accounting
estimates arising from the application of this policy and we do not anticipate
material changes in the near term.
Income Tax Accounting
We account for income taxes using the asset and liability method. Under
this method, income taxes are provided for amounts currently payable and
for amounts deferred as tax assets and liabilities based upon differences
between the financial statement carrying amount and the tax basis of
existing assets and liabilities. Deferred income taxes are measured using
the enacted tax rates that are assumed will be in effect when the differ-
ences reverse.
Determining the consolidated provision for income tax expense, income
tax liabilities and deferred tax assets and liabilities involves judgment. We
calculate and provide for income taxes in each of the tax jurisdictions in
which we operate. This involves estimating current tax exposures in each
jurisdiction as well as making judgments regarding the recoverability of
deferred tax assets. Tax exposures can involve complex issues and may
require an extended period to resolve. Changes in the geographic mix or
estimated level of annual income before taxes can affect the overall effec-
tive tax rate.
We apply an estimated annual effective tax rate to our quarterly operating
results to calculate the provision for income tax expense. In the event there
is a significant, unusual or infrequent item recognized in our quarterly
operating results, the tax attributable to that item is recorded in the interim
period in which it occurs. We modify our annual effective tax rate if facts
and circumstances change between quarters. Our effective tax rates for
fiscal 2008, 2007 and 2006 were 36%, 32% and 32%, respectively.
No taxes have been provided on certain undistributed foreign earnings
that are planned to be indefinitely reinvested. If future events, including
material changes in estimates of cash, working capital and long-term
investment requirements, necessitate that these earnings be distributed,
an additional provision for withholding taxes may apply, which could mate-
rially affect our future effective tax rate.
As a matter of course, we are regularly audited by various taxing authorities,
and sometimes these audits result in proposed assessments where the
ultimate resolution may result in our owing additional taxes. We establish
reserves when, despite our belief that our tax return positions are appropri-
ate and supportable under local tax law, we believe certain positions are
likely to be challenged and we may not succeed in realizing the tax benefit.
We evaluate these reserves each quarter and adjust the reserves and the
related interest in light of changing facts and circumstances regarding the
probability of realizing tax benefits, such as the progress of a tax audit or
the expiration of a statute of limitations. We believe the estimates and
assumptions used to support our evaluation of tax benefit realization are
reasonable. However, final determinations of prior-year tax liabilities, either
by settlement with tax authorities or expiration of statutes of limitations,
could be materially different than estimates reflected in our Consolidated
Balance Sheets and historical income tax provisions in our Consolidated
Statements of Income. The outcome of these final determinations could
have a material effect on our income tax provision, net income, or cash
flows in the period in which that determination is made. We believe our tax

4 4 » 4 5 W M S I N D U S T R I E S I N C .2
00
8 a
nn
ua
l r
ep
or
t
positions comply with applicable tax law and that we have adequately
provided for any known tax contingencies.
Prior to fiscal 2008, we recognized income tax accruals with respect to
uncertain tax positions based upon Statement of Financial Accounting
Standards (“SFAS”) No. 5, Accounting for Contingencies. In fiscal 2008, we
adopted Financial Accounting Standards Board (“FASB”) Interpretation
No. (“FIN”) 48, Accounting for Uncertainty in Income Taxes and we recorded a
$1.8 million increase in our liability for unrecognized tax benefits that are
accounted for as a reduction in our retained earnings as of July 1, 2007.
Under FIN 48, the benefits of tax positions that are more likely than not of
being sustained upon audit based on the technical merits of the tax posi-
tion are recognized in our Consolidated Financial Statements; positions
that do not meet this threshold are not recognized. For tax positions that
are at least more likely than not of being sustained upon audit, the largest
amount of the benefit that is more likely than not of being sustained is
recognized in our Consolidated Financial Statements.
The application of this policy affects the level of our tax expense, current
income tax receivables and liabilities, and current and non-current deferred
tax assets and liabilities. Other than the $1.8 million impact from the
adoption of FIN 48 effective July 1, 2007, in fiscal 2008, 2007 and 2006, we
had no material changes in the critical accounting estimates arising from
the application of this policy and we do not anticipate material changes in
the near term.
Share-Based Compensation Expense
We account for share-based compensation in accordance with the provi-
sions of SFAS No. 123R. Pre-tax share-based compensation expense was
$15.2 million, $12.4 million and $12.2 million for fiscal 2008, 2007 and 2006,
respectively. In fiscal 2008, we recorded a provision for equity-base perfor-
mance units outstanding of $2.7 million that relate to the thirty-six month
periods ended June 30, 2009 and 2010, based on the current assessment of
achievement of the performance goals. Additional charges will be recorded
in future periods depending on the assessment of achievement of the
performance goals. Prior to fiscal 2008, we concluded that the achievement
of the performance goals was not probable and therefore a provision related
to the awards was not required. As of June 30, 2008, we had $8.6 million of
total stock option compensation expense related to nonvested stock
options not yet recognized, which is expected to be recognized over a
weighted-average period of 2.6 years. Also, as of June 30, 2008, we had $6.8
million of total restricted share compensation expense related to nonvested
awards not yet recognized, which is expected to be recognized over a
weighted-average period of 2.6 years.
Under the fair value recognition provisions of SFAS No. 123R, stock-based
compensation cost is estimated at the grant date based on the fair value of
the award and is recognized as expense ratably over the requisite service
period of the award. Determining the appropriate fair value model and
calculating the fair value of share-based awards requires judgment, includ-
ing estimating stock price volatility, forfeiture rates and expected life. If
actual results differ significantly from these estimates, share-based com-
pensation expense and our results of operations could be materially
impacted. See Note 2, “Principal Accounting Policies” to our Consolidated
Financial Statements.
The application of this policy affects the level of our cost of product sales,
cost of gaming operations, research and development expenses, selling
and administrative expenses, additional paid-in capital and income tax
expense. During fiscal 2008, 2007 and 2006, we had no material changes in
the critical accounting estimates arising from the application of this policy
and we do not anticipate material changes in the near term.
Allowances for Slow-Moving and Obsolete Inventories
We value inventory based on estimates of potentially excess and obsolete
inventory after considering forecasted demand and forecasted average
selling prices. However, forecasts are subject to revisions, cancellations and
rescheduling. Actual demand may differ from anticipated demand, and
such differences may have a material effect on our Consolidated Financial
Statements. Demand for parts inventory is subject to technical obsoles-
cence. Inventory on hand in excess of forecasted demand is written down
to net realizable value.
An active market exists mostly outside of North America for used gaming
machines. When we receive a gaming machine on trade-in, we estimate a

MANAgEMENT’S DISCUSSION AND ANALYSIS OF FINANCIAL CONDITION AND RESULTS OF OPERATIONS [continued]
carrying value for the gaming machine. The value is based upon an estimate
of the condition of the gaming machine, as well as our experience in sell-
ing used gaming machines and could change due to changes in demand
in general for used gaming machines. We either sell these trade-ins as-is or
renovate the gaming machines before resale. We also sell participation
gaming machines as used gaming machines when we no longer need
them in our gaming operations business. Therefore, we review our used
gaming machine inventory for impairment on a routine basis. Actual
demand for new and used gaming machines may differ from anticipated
demand, and such differences may have a material effect on our
Consolidated Financial Statements.
We sold over 4,500 and over 6,600 used gaming machines in fiscal 2008
and 2007, respectively. At June 30, 2008 and 2007, our inventories included
748 and 951 legacy gaming machines, respectively, and $1.4 million and
$8.5 million of total legacy inventory, respectively.
The application of this policy affects the amount of our inventory and cost
of product sales. In fiscal 2008, 2007 and 2006, we had no material changes
in the critical accounting estimates arising from the application of this policy
and we do not anticipate material changes in the near term.
Participation Gaming Machine Depreciation
We depreciate the Bluebird participation gaming machines over a three-
year useful life to residual value, while we depreciate the top boxes over a
one-year useful life. A material adverse impact could occur if the actual
useful life of the participation gaming machines or top boxes is less than
what was used in estimating depreciation expense, or if actual residual
value is less than the anticipated residual value.
The application of this policy affects the level of our gaming operations
equipment, accumulated depreciation on gaming operations equipment,
depreciation expense, income tax expense and deferred tax assets and
liabilities. In fiscal 2008, 2007 and 2006, we had no material changes in the
critical accounting estimates arising from the application of this policy and
we do not anticipate material changes in the near term.
Intellectual Property and Licensed Technology Valuations
We license intellectual property and technologies from third parties that
we use in our games and gaming machines. At June 30, 2008 and 2007, we
had $67.1 million and $66.7 million capitalized on our Consolidated Balance
Sheets for such costs, along with commitments not on our Consolidated
Balance Sheets for an additional $21.0 million and $27.3 million, respectively,
including contingent payments. As part of our contracts with the licensors,
we typically provide a minimum guaranteed commitment and prepay roy-
alties and license fees, usually at the time the contract is signed, even
though the product may not be introduced until months or years later. We
capitalize the royalty and license fee advances as intangible assets.
When products using the licensed intellectual property or technology
begin to generate revenue, we begin amortization of the amount
advanced. In cases where the advance represents a paid up license, the
advance is amortized based on the estimated life of the asset. In those
cases where the license agreement provides for a royalty to be earned by
the licensor for each gaming machine sold or placed on a lease, the
advance is amortized based on the royalty rates provided in the license
agreement. In both cases the amortization of the advances are included in
cost of product sales if related to a product sale or cost of gaming opera-
tions if related to placement or lease of gaming operations equipment. We
regularly evaluate the estimated future benefit of royalty and license fee
advances, as well as minimum commitments not yet paid, to determine
amounts unlikely to be realized from forecasted sales or placements of our
gaming machines. If actual or revised forecasts fall below the initial esti-
mate, then we may need to revise the remaining useful life and/or record
an impairment charge or write down to net realizable value as we did in
the June 2008 quarter when we recorded a $3.7 million pre-tax write-down
to net realizable value for a licensed technology.
See Note 7, “Intangible Assets” and Note 13, “Commitments, Contingencies,
and Indemnifications,” to our Consolidated Financial Statements for further
information.
The application of this policy affects the level of our current assets, non-
current assets, current liabilities, cost of product sales, cost of gaming
operations, research and development expense and selling and general

4 6 » 4 7 W M S I N D U S T R I E S I N C .2
00
8 a
nn
ua
l r
ep
or
t
expense. Other than the fiscal year 2008 pre-tax write down of $3.7 million
to net realizable value for a licensed technology, in fiscal 2008, 2007 and
2006, we had no material changes in the critical accounting estimates arising
from the application of this policy and we do not anticipate material
changes in the near term.
RECENTLY ISSUED ACCOUNTINg STANDARDS
In September 2006, the FASB issued SFAS No. 157, Fair Value Measurements
(“SFAS 157”). SFAS 157 defines fair value, establishes a framework for measur-
ing fair value in accordance with generally accepted accounting principles,
and expands disclosures about fair value measurements. SFAS 157 does
not require any new fair value measurements, but provides guidance on
how to measure fair value by providing a fair value hierarchy used to classify
the source of the information. Subsequent to the issuance of SFAS 157, the
FASB issued FASB Staff Positions (“FSP”) 157-2 Effective Date of FASB Statement
No. 157 (“FSP 157-2”). FSP 157-2 delays the effective date of SFAS 157 for all
nonfinancial assets and nonfinancial liabilities, except those that are recog-
nized or disclosed at fair value in the financial statements on a recurring basis.
For the instruments subject to the effective date delay under FSP 157-2, the
effective date to adopt the fair value provisions for us will be July 1, 2009.
We will continue to evaluate the impact of the provisions of SFAS 157 on
our Consolidated Financial Statements.
In February 2007, the FASB issued SFAS No. 159, The Fair Value Option for
Financial Assets and Financial Liabilities—including an amendment of
SFAS 115, (“SFAS 159”). SFAS 159 permits entities to choose to measure many
financial instruments and certain other items at fair value that are not cur-
rently required to be measured at fair value. The objective of SFAS 159 is to
reduce both complexity in accounting for financial instruments and the
volatility in earnings caused by measuring related assets and liabilities
using different measurement techniques. The fair value measurement
provisions are elective and can be applied to individual financial instru-
ments. SFAS 159 requires additional disclosures related to the fair value
measurements included in the entity’s financial statements. We are required
to adopt this statement beginning July 1, 2008 and we currently expect no
material impact from the provisions of SFAS 159 on our Consolidated
Financial Statements.
RESULTS OF OPERATIONS
Gulf Coast Hurricanes
During the September 2005 quarter, two hurricanes devastated the Gulf
Coast of Louisiana and Mississippi, which affected the Company’s facilities
and its customers’ facilities. We reopened our Gulfport facility in November
2005, but incurred, and continue to incur hurricane-related revenue loss.
Historically, our participation revenue per day in the Mississippi and
Louisiana markets is over 40% higher than the Company’s overall average.
We carry both property and business interruption insurance. We expect
damage to our leased facility in Gulfport to be covered by our property
insurance, after the deductible. In fiscal 2005, we received the first property
insurance payment from the insurance company. We have assessed the
usability of the inventory and participation gaming machines damaged in
our Gulfport facility and added damaged items to our property claim.
The property insurance carries a deductible that was expensed in fiscal
2005. There is no deductible for the business interruption insurance and
this coverage began 48 hours after elected officials ordered the evacuation
of the areas. During fiscal 2006, we received business interruption insur-
ance proceeds of $1.0 million, representing an initial reimbursement for
losses arising from Hurricane Katrina, which we recorded in interest and
other income, net in our Consolidated Statements of Income. We began
litigation against the insurance company in the Mississippi courts in the
September 2006 quarter. We continue to pursue our insurance claims, but
cannot presently estimate the amount or timing of any additional payment,
or the results of any litigation. We have not recorded and will not record
any amount for unreimbursed business interruption claims until an agree-
ment is reached with our insurer as to the amount of the recovery.
Seasonality
Sales of our gaming machines to casinos are generally strongest in the
spring and slowest in the summer months, while gaming operations
revenues are generally strongest in the spring and summer. In addition,
quarterly revenues and net income may increase when we receive a larger
number of approvals for new games from regulators than in other quarters,
when a game that achieves significant player appeal is introduced or if
gaming is permitted in a significant new jurisdiction.

MANAgEMENT’S DISCUSSION AND ANALYSIS OF FINANCIAL CONDITION AND RESULTS OF OPERATIONS [continued]
Fiscal Year Ended June 30, 2008 Compared to Fiscal Year Ended June 30, 2007
Revenues, Gross Margins and Key Performance Indicators are as follows (in millions, except unit data):
PercentYear Ended June 30, Increase Increase2008 2007 (Decrease) (Decrease)
Product Sales Revenues New unit sales revenues $ 358.0 $ 317.0 $ 41.0 12.9% Other product sales revenues 63.2 49.3 13.9 28.2
Total product sales revenues $ 421.2 $ 366.3 $ 54.9 15.0
New units sold 27,931 25,613 2,318 9.1 Average sales price per new unit $ 12,817 $ 12,378 $ 439 3.5 Gross profit on product sales revenues(1) $ 203.9 $ 167.7 $ 36.2 21.6 Gross margin on product sales revenues(1) 48.4% 45.8% 260 bp 5.7
Gaming Operations Revenues Participation revenues $ 203.4 $ 153.6 $ 49.8 32.4 Other gaming operations revenues 25.5 19.9 5.6 28.1
Total gaming operations revenues $ 228.9 $ 173.5 $ 55.4 31.9
WAP games at period end 1,820 1,507 313 20.8 LAP games at period end 2,134 2,333 (199) (8.5) Stand-alone games at period end 5,367 4,436 931 21.0
Total installed participation base at period end 9,321 8,276 1,045 12.6
Average participation installed base 8,771 7,299 1,472 20.2 Average revenue per day per participation machine $ 63.34 $ 57.66 $ 5.68 9.9 Installed casino-owned daily fee games at period end 819 760 59 7.8 Average casino-owned daily fee games installed base 776 728 48 6.6 Gross profit on gaming operations revenues(1) $ 182.3 $ 137.3 $ 45.0 32.8 Gross margin on gaming operations revenues(1) 79.6% 79.1% 50 bp 0.6
Total Revenues $ 650.1 $ 539.8 $110.3 20.4Total Gross Profit(1) $ 386.2 $ 305.0 $ 81.2 26.6Total Gross Margin(1) 59.4% 56.5% 290 bp 5.1
bp basis point
(1) As used herein, gross profit and gross margin exclude depreciation and distribution expense.
4 8 » 4 9 W M S I N D U S T R I E S I N C .2
00
8 a
nn
ua
l r
ep
or
t
Revenues and Gross Profit
Total revenues for fiscal 2008 increased 20.4%, or $110.3 million, over fiscal
2007, reflecting:
» A $41.0 million, or 12.9%, increase in new unit sales revenue as a
result of:
» A 2,318 unit, or 9.1%, increase in new units sold.
•International new units sold increased 30.2% over the prior
year, reflecting growth in China with our Mandarin-based
games and continued growth throughout Europe, South Africa
and South America.
•NorthAmericannewunitssold in fiscal2008wereessentially
flat to fiscal 2007 due to the continued sluggish North American
replacement market and the slowing of the economy offset-
ting a higher number of new casino openings and expansions
in fiscal 2008.
•TheNorthAmericannewunit sales in fiscal 2008benefitted
from shipments of new units to five California casinos as a
result of amended compacts while fiscal 2007 benefited from
initial and ongoing shipments of new units to properties located
in the newly opened Pennsylvania and Broward County, Florida
jurisdictions, as well as a strong contribution from Oklahoma
which was a new market for us at the time.
•Sales of mechanical reel products totaled 8,344 units, or
approximately 29.9% of total new units sold compared to 25.4%
of units sold in the prior fiscal year.
» A 3.5% increase in the average selling price of new gaming units,
principally reflecting the benefit of higher list prices.
» A $13.9 million, or 28.2%, increase in other product sales revenues,
reflecting strong sales of conversion kits and used gaming machines.
» We earned revenue on more than 9,000 conversion kits in fiscal
2008, compared to over 7,200 conversion kits in the fiscal 2007
period, due to the positive response to our new video and mechan-
ical reel games.
» We sold approximately 4,500 used gaming machines at higher
prices in fiscal 2008, compared to nearly 6,600 used gaming machines
in fiscal 2007.
» A $49.8 million, or 32.4%, growth in participation revenues due
primarily to:
» A 20.2% increase in the average installed base of participation
gaming machines, driven by the growth in our WAP and stand-alone
installed bases. The WAP units in the installed base as of June 30,
2008 was 313 units higher than at June 30, 2007, reflecting continued
strong performance of our Sensory Immersion and Transmissive Reels
platforms in fiscal 2008. Our controlled roll-out strategy has led to
the desired result of a higher level of incremental footprint for the
WAP units. The WAP installed base accounted for 20% and 18% of
the installed base at June 30, 2008 and 2007, respectively.
» Overall average revenues per day increased by $5.68, or 9.9%,
principally reflecting favorable player response to the new games
for our three innovative participation platforms.
» A $5.6 million, or 28.1%, increase in other gaming operations reve-
nues as we experienced a net increase in royalty revenue from third
party licensees.

MANAgEMENT’S DISCUSSION AND ANALYSIS OF FINANCIAL CONDITION AND RESULTS OF OPERATIONS [continued]
Total gross profit, as used herein excluding distribution and depreciation
expense, increased 26.6%, or $81.2 million, to $386.2 million for the fiscal
2008 period from $305.0 million for the fiscal 2007 period. Our gross
margins may not be comparable to those of other entities as we include
the costs of distribution in selling and administrative expenses. This
improvement reflects:
» Gross margin on product sales revenues of 48.4% for the fiscal 2008
period, compared to 45.8% for the fiscal 2007 period. Gross margin for
the fiscal 2008 period reflects continued success with the ongoing
implementation of our lean sigma process improvement and strategic
sourcing initiatives, the benefits from a higher volume of business,
greater sales of higher-margin conversion kits, and a higher average
selling price for new gaming machines, partially offset by a lower mix of
premium-priced products than a year ago.
» Gross margin on gaming operations revenues of 79.6% in the fiscal
2008 period was up slightly from fiscal 2007, reflecting the positive
influence of the high performing Community Gaming, Sensory Immersion
and Transmissive Reels games and favorable overall WAP jackpot experi-
ence offset by the greater number of WAP gaming machines in the
installed base.
We expect to generate solid revenue growth in fiscal 2009 and fiscal 2010
as we continue to increase our market share globally, increase our average
selling price with the introduction of our Bluebird2 platform in the
December 2008 quarter and continue to grow our participation installed
base through the introduction of new participation games and platforms.
Royalty revenues may decline in fiscal 2009 as our licensing arrangement
with Stargames Corporation Pty. Ltd. ended January 31, 2008 commencing
an agreed upon sell-off period. We expect continued improvements in our
product sales gross margin, resulting from the ongoing implementation of
process improvements throughout the entire organization with the utiliza-
tion of lean sigma tools, results from our strategic sourcing initiatives and
the benefits from higher unit volumes and ongoing leveling of the pro-
duction schedule throughout each quarter.
Operating Expenses
Operating expenses were as follows (in millions of dollars):
Year Ended June 30,
2008 2007
As % of As % of Increase
Dollar Revenue Dollar Revenue Dollar Percent
Research and development $ 79.9 12.3% $ 58.1 10.8% $21.8 37.5%Selling and administrative 130.0 20.0 109.8 20.3 20.2 18.4Depreciation 71.9 11.1 62.9 11.7 9.0 14.3
Total operating expenses $ 281.8 43.4% $ 230.8 42.8% $51.0 22.1%

5 0 » 5 1 W M S I N D U S T R I E S I N C .2
00
8 a
nn
ua
l r
ep
or
t
Research and development expenses increased $21.8 million to $79.9 million
in fiscal 2008, compared to $58.1 million in the prior year. The year-over-
year increase reflects:
» our expanded product development initiatives for the continued
creation of intellectual property and the ongoing expansion of our
product portfolio;
» higher payroll-related costs resulting from headcount increases and
performance based incentives associated with improved operating
performance;
» higher costs to accelerate new systems and enterprise-wide system
applications for our suite of innovative, high-value products in prepara-
tion for the advent of SBG;
» a $3.7 million pre-tax write down to net realizable value related to a
licensed technology; and
» the inclusion of research and development expenses for SiP since
the mid-July 2007 acquisition.
During fiscal 2008, we introduced 55 new WMS-branded games for sale
and 25 new participation and casino-owned daily fee games, compared to
the introduction in fiscal 2007 of 49 new games for sale and 28 new partici-
pation and casino-owned daily fee games.
Selling and administrative expenses increased $20.2 million to $130.0 mil-
lion in fiscal 2008 compared to $109.8 million in fiscal 2007. The increase
includes:
» higher marketing, promotion and distribution costs related to the
roll-out of new products and branding initiatives;
» increased payroll-related costs associated with headcount increases
to support international expansion and overall growth in our business
and performance based incentives associated with improved operating
performance during the past twelve months;
» higher spending on customer service activities to support our larger
participation installed base and increased customer touch points; and
» higher legal expenses and non-cash charges for bad debt expense,
as well as the impact of consolidating SiP results since the mid-July
2007 acquisition.
Depreciation expense increased $9.0 million to $71.9 million in fiscal 2008
compared to $62.9 million in fiscal 2007. This reflects the steady increase in
the installed base of participation games throughout fiscal 2007 and 2008,
as evidenced in the 20.2% year-over-year increase in the average installed
base of participation machines. The increase also reflects depreciation
related to SiP. We invested $50.4 million in gaming operations gaming
machines, top boxes and related equipment during fiscal 2008, $75.9 million
during fiscal 2007, and $68.7 million during fiscal 2006.
For fiscal 2009 and 2010, we expect to increase research and development
spending to support our expanding portfolio of innovative and differenti-
ated product offerings, further our progress with our SBG initiatives, and for
new game development tools, technological advancements and innova-
tions in game play. The increased spending is also anticipated to support
further growth of our game library and enhance the productiveness of our
development efforts. Selling and administrative expenses are anticipated
to increase more modestly in fiscal 2009 and 2010 and are expected to
decline slightly as a percent of revenues in fiscal 2009 and 2010. In line with
the more moderate rate of growth expected for our installed participation
footprint, we anticipate our capital investment in gaming operations equip-
ment to flatten in fiscal 2009 and 2010, and estimate capital expenditures
for property, plant and equipment to increase modestly in fiscal 2009 and

MANAgEMENT’S DISCUSSION AND ANALYSIS OF FINANCIAL CONDITION AND RESULTS OF OPERATIONS [continued]
2010. In aggregate, we expect continued improvement in our operating
margin, even with the additional spending on research and development
initiatives.
Interest Expense
We incurred interest expense of $4.0 million and $5.1 million for fiscal 2008
and 2007, respectively, primarily related to our 2.75% convertible subordi-
nated notes, amortization of debt issuance costs and, in fiscal 2007, interest
and fees on borrowings under our revolving credit facility.
Interest and Other Income, Net
Interest and other income, net increased by $2.6 million to $5.2 million
primarily due to higher interest income earned on cash in fiscal 2008 as a
result of higher average cash balances and better short-term cash manage-
ment in fiscal 2008.
Income Taxes
The effective income tax rates were approximately 36% and 32% for fiscal
2008 and 2007, respectively.
The fiscal 2008 effective tax rate reflects:
» increased income;
» the domestic manufacturing deduction;
» the research and development tax credit expiration on December 31,
2007; and
» the impact of unrecognized tax benefits resulting from the imple-
mentation of FIN 48 effective July 1, 2007.
The fiscal 2007 effective tax rate reflects:
» utilization of the export sales deduction, which expired in
December 2006;
» the domestic manufacturing deduction; and
» the effect of the retroactive reinstatement of the research and devel-
opment tax credit legislation which was reinstated in December 2006,
retroactive to January 1, 2006. The effective tax rate includes the credit
earned from January 1, 2006 thru June 30, 2006, which aggregated $0.01
per diluted share, in addition to the tax credit earned during fiscal 2007.
At the end of each interim period, we make our best estimate of the effec-
tive tax rate expected to be applicable for the full fiscal year and the impact
of discrete items, if any, and adjust the quarterly tax rate, as necessary. As the
research and development tax credit legislation expired on December 31,
2007, we expect our effective tax rate for fiscal 2009 to range between 36%
and 37%.
Earnings Per Share
Diluted earnings per share increased to $1.15 for fiscal 2008 from $0.86 for
fiscal 2007. The increase in earnings per share is attributable to increased
net income in fiscal 2008 partially offset by a higher diluted share count,
primarily resulting from the issuance of common shares upon exercise of
stock options.
Impact of Inflation
During the past three years, the general level of inflation affecting us has
been relatively low. Our ability to pass on future cost increases in the form
of higher sales prices will depend on the prevailing competitive environ-
ment and the acceptance of our products in the marketplace.
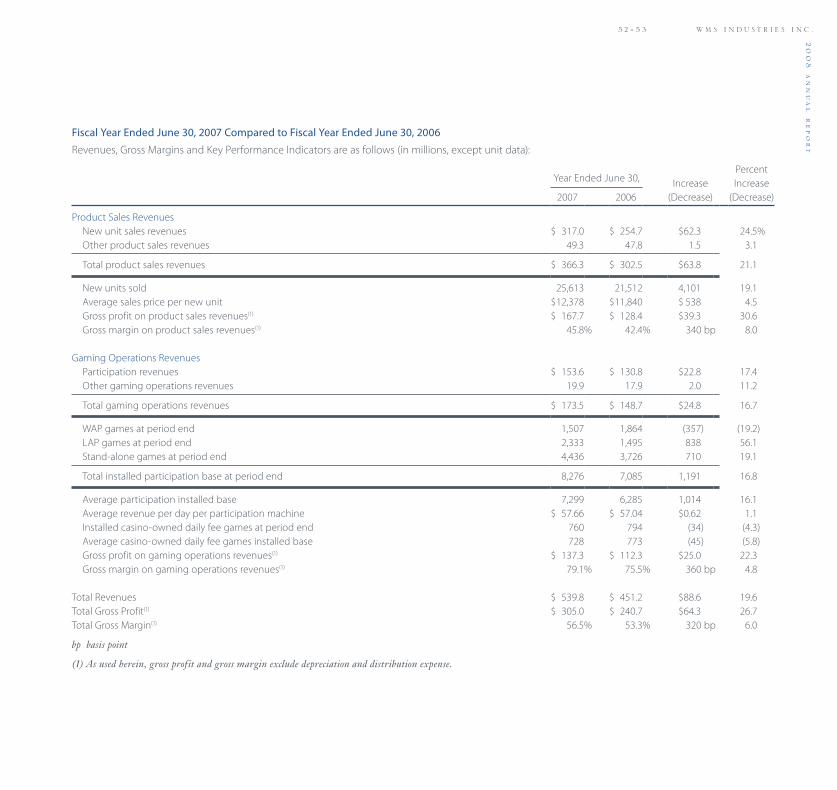
5 2 » 5 3 W M S I N D U S T R I E S I N C .2
00
8 a
nn
ua
l r
ep
or
t
Fiscal Year Ended June 30, 2007 Compared to Fiscal Year Ended June 30, 2006
Revenues, Gross Margins and Key Performance Indicators are as follows (in millions, except unit data):
PercentYear Ended June 30, Increase Increase2007 2006 (Decrease) (Decrease)
Product Sales Revenues New unit sales revenues $ 317.0 $ 254.7 $62.3 24.5% Other product sales revenues 49.3 47.8 1.5 3.1
Total product sales revenues $ 366.3 $ 302.5 $63.8 21.1
New units sold 25,613 21,512 4,101 19.1 Average sales price per new unit $ 12,378 $ 11,840 $ 538 4.5 Gross profit on product sales revenues(1) $ 167.7 $ 128.4 $39.3 30.6 Gross margin on product sales revenues(1) 45.8% 42.4% 340 bp 8.0
Gaming Operations Revenues Participation revenues $ 153.6 $ 130.8 $22.8 17.4 Other gaming operations revenues 19.9 17.9 2.0 11.2
Total gaming operations revenues $ 173.5 $ 148.7 $24.8 16.7
WAP games at period end 1,507 1,864 (357) (19.2) LAP games at period end 2,333 1,495 838 56.1 Stand-alone games at period end 4,436 3,726 710 19.1
Total installed participation base at period end 8,276 7,085 1,191 16.8
Average participation installed base 7,299 6,285 1,014 16.1 Average revenue per day per participation machine $ 57.66 $ 57.04 $0.62 1.1 Installed casino-owned daily fee games at period end 760 794 (34) (4.3) Average casino-owned daily fee games installed base 728 773 (45) (5.8) Gross profit on gaming operations revenues(1) $ 137.3 $ 112.3 $25.0 22.3 Gross margin on gaming operations revenues(1) 79.1% 75.5% 360 bp 4.8
Total Revenues $ 539.8 $ 451.2 $88.6 19.6Total Gross Profit(1) $ 305.0 $ 240.7 $64.3 26.7Total Gross Margin(1) 56.5% 53.3% 320 bp 6.0
bp basis point
(1) As used herein, gross profit and gross margin exclude depreciation and distribution expense.

MANAgEMENT’S DISCUSSION AND ANALYSIS OF FINANCIAL CONDITION AND RESULTS OF OPERATIONS [continued]
Revenues and Gross Profit
Total revenues for fiscal 2007 increased 19.6%, or $88.6 million, over fiscal
2006, reflecting:
» A $62.3 million increase in new unit sales revenue as a result of:
» A 19.1% increase in new units sold worldwide. North American
new units sold increased 13.2%, reflecting:
•the introduction of new products and game segmentation
strategies, such as our G+® video games;
•the initial andongoing shipments into thenewPennsylvania
and Broward County, Florida markets;
•openingsofnewcasinosintheMidwest;
•steadydemandfromNativeAmericantribaloperators,particu-
larly in Oklahoma;
•thefulfillmentofapreviouslyannouncedstatelotterycommis-
sion contract;
•thelaunchofseveralnewproducts;and
•allofwhichwerepartiallyoffsetbythesluggishNorthAmerican
replacement market.
» International new units sold increased 36.1% over the prior year,
reflecting the positive contribution of Orion Gaming, growth in
China and the broader pan-Asian market, and continued growth
throughout Europe, South Africa and Latin America.
» Demand for our mechanical reel products continues to increase
and accounted for 25% of new unit sales in fiscal 2007 compared to
14% in fiscal 2006.
» A 4.5% year-over-year increase in average selling price, due to an
increase in list prices and higher sales of premium priced products.
» A $1.5 million increase in other product sales, as an increase in con-
version revenues, top box revenues, parts revenues, Orion Gaming AWP
revenues and Orion Gaming OEM revenues were partially offset by a
reduction in OEM revenues from Multimedia Games, Inc., used gaming
machines revenues and the fact that fiscal 2006 benefited from $1.8
million of revenue from an earn-out provision under a lottery contract.
» We sold over 6,600 used gaming machines in fiscal 2007 with a
greater percentage being higher-priced refurbished units, compared
to over 8,200 used gaming machines in fiscal 2006.
» We earned revenue on the sale of over 7,200 conversion kits in
fiscal 2007, compared to over 6,200 conversion kits in fiscal 2006.
» A 16.7% growth in total gaming operations revenues due to:
» A 16.1% increase in the average installed base of participation
gaming machines, driven by our newer products, such as
MONOPOLYTM Big Event stand-alone gaming machines, GREEN
ACRESTM and Life of Luxury® LAP gaming machines, as well as the
initial success of our TOP GUNTM and MONOPOLY Super Money Grab®
WAP gaming machines, partially offset by declines in our other
stand-alone and POWERBALL® WAP participation games.
» Overall average revenues per day increased slightly, reflecting a
higher average installed base of higher-earning WAP gaming
machines during fiscal 2007 than in fiscal 2006.
Total gross profit, as used herein excluding distribution and depreciation
expense, increased 26.7%, or $64.3 million, to $305.0 million for fiscal 2007
from $240.7 million for fiscal 2006. Our gross margins may not be compa-
rable to those of other entities as we include the costs of distribution in
selling and administrative expenses. This improvement reflects:
» Gross margin on product sales revenues was 45.8% for fiscal 2007
compared to 42.4% for fiscal 2006. Gross margin for fiscal 2007 reflects
operating leverage from higher volume, the favorable impact from
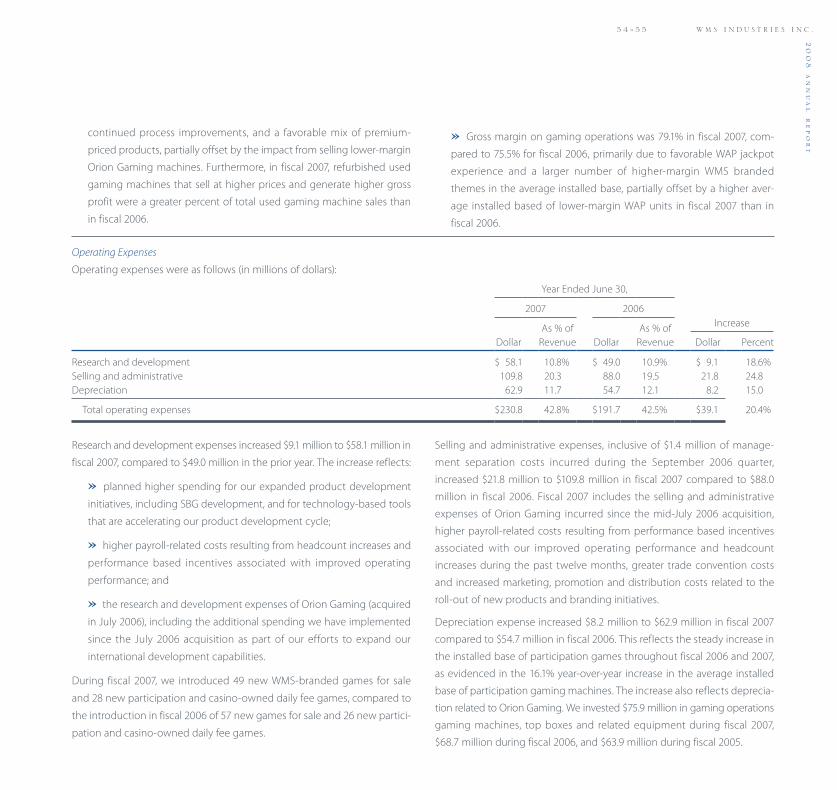
5 4 » 5 5 W M S I N D U S T R I E S I N C .2
00
8 a
nn
ua
l r
ep
or
t
continued process improvements, and a favorable mix of premium-
priced products, partially offset by the impact from selling lower-margin
Orion Gaming machines. Furthermore, in fiscal 2007, refurbished used
gaming machines that sell at higher prices and generate higher gross
profit were a greater percent of total used gaming machine sales than
in fiscal 2006.
» Gross margin on gaming operations was 79.1% in fiscal 2007, com-
pared to 75.5% for fiscal 2006, primarily due to favorable WAP jackpot
experience and a larger number of higher-margin WMS branded
themes in the average installed base, partially offset by a higher aver-
age installed based of lower-margin WAP units in fiscal 2007 than in
fiscal 2006.
Operating Expenses
Operating expenses were as follows (in millions of dollars):
Year Ended June 30,
2007 2006
As % of As % of Increase
Dollar Revenue Dollar Revenue Dollar Percent
Research and development $ 58.1 10.8% $ 49.0 10.9% $ 9.1 18.6%Selling and administrative 109.8 20.3 88.0 19.5 21.8 24.8Depreciation 62.9 11.7 54.7 12.1 8.2 15.0
Total operating expenses $ 230.8 42.8% $ 191.7 42.5% $39.1 20.4%
Research and development expenses increased $9.1 million to $58.1 million in
fiscal 2007, compared to $49.0 million in the prior year. The increase reflects:
» planned higher spending for our expanded product development
initiatives, including SBG development, and for technology-based tools
that are accelerating our product development cycle;
» higher payroll-related costs resulting from headcount increases and
performance based incentives associated with improved operating
performance; and
» the research and development expenses of Orion Gaming (acquired
in July 2006), including the additional spending we have implemented
since the July 2006 acquisition as part of our efforts to expand our
international development capabilities.
During fiscal 2007, we introduced 49 new WMS-branded games for sale
and 28 new participation and casino-owned daily fee games, compared to
the introduction in fiscal 2006 of 57 new games for sale and 26 new partici-
pation and casino-owned daily fee games.
Selling and administrative expenses, inclusive of $1.4 million of manage-
ment separation costs incurred during the September 2006 quarter,
increased $21.8 million to $109.8 million in fiscal 2007 compared to $88.0
million in fiscal 2006. Fiscal 2007 includes the selling and administrative
expenses of Orion Gaming incurred since the mid-July 2006 acquisition,
higher payroll-related costs resulting from performance based incentives
associated with our improved operating performance and headcount
increases during the past twelve months, greater trade convention costs
and increased marketing, promotion and distribution costs related to the
roll-out of new products and branding initiatives.
Depreciation expense increased $8.2 million to $62.9 million in fiscal 2007
compared to $54.7 million in fiscal 2006. This reflects the steady increase in
the installed base of participation games throughout fiscal 2006 and 2007,
as evidenced in the 16.1% year-over-year increase in the average installed
base of participation gaming machines. The increase also reflects deprecia-
tion related to Orion Gaming. We invested $75.9 million in gaming operations
gaming machines, top boxes and related equipment during fiscal 2007,
$68.7 million during fiscal 2006, and $63.9 million during fiscal 2005.

MANAgEMENT’S DISCUSSION AND ANALYSIS OF FINANCIAL CONDITION AND RESULTS OF OPERATIONS [continued]
Interest Expense
We incurred interest expense of $5.1 million and $4.3 million for fiscal 2007
and 2006, respectively, primarily related to our 2.75% convertible subordi-
nated notes, amortization of debt issuance costs and, in fiscal 2007, interest
and fees on borrowings under our revolving credit facility.
Interest and Other Income, Net
Interest and other income, net decreased by $1.9 million primarily due to
lower interest income earned on cash in fiscal 2007 as a result of lower
average cash balances, and the fact that, in fiscal 2006, we received business
interruption insurance proceeds of $1.0 million, representing an initial reim-
bursement for business interruption losses arising from Hurricane Katrina.
Income Taxes
The effective tax rate for fiscal 2007 was 32%, consistent with the rate for
fiscal 2006.
The fiscal 2007 effective rate reflects:
» increased income
» utilization of the export sales deduction, which expired in December
2006;
» the domestic manufacturing deduction; and
» the effect of the retroactive reinstatement of the research and devel-
opment tax credit legislation back to January 1, 2006. Since the research
and development tax credit legislation was reinstated in December
2006, retroactive to January 1, 2006, the effective tax rate includes the
credit earned for the period January 1, 2006 through June 30, 2006,
which aggregated $0.01 per diluted share, in addition to the tax credit
earned during fiscal 2007.
The fiscal 2006 effective rate reflects:
» increased income;
» lower export sales deductions; and
» lower utilization of tax credits as a result of the December 31, 2005
expiration of the research tax credit.
Earnings Per Share
Diluted earnings per share increased to $0.86 for fiscal 2007 from $0.63 for
fiscal 2006. The increase in earnings per share attributable to increased net
income in fiscal 2007 was partially offset by a higher diluted share count
resulting from the issuance of common shares upon the exercise of
employee stock options and an increase in the dilutive effect of employee
stock options due to the increase in the market price of our WMS’ common
stock during fiscal 2007.
LIQUIDITY AND CAPITAL RESOURCES
Our use of cash flow from operations is largely for working capital to
support our revenue base. Therefore, in any given reporting period, the
amount of cash consumed or generated by operations will primarily relate
to the rate of revenue increase or decrease, causing a corresponding
change in working capital. In periods when revenues are increasing, the
expanded working capital needs will be funded from available cash, cash
equivalents, short-term investments, cash from operations, and, if neces-
sary, proceeds from additional borrowings or additional equity offerings.
Capital commitments are made for property, plant and equipment and
gaming operations equipment; other commitments made relate primarily
to licensing or technology agreements to obtain access to third-party
brands, intellectual properties or technologies that we have not developed
internally. Also, we will from time to time issue or retire borrowings or
repurchase equity in an effort to maintain a cost-effective capital structure
consistent with our anticipated capital requirements.
Our primary sources of liquidity are:
» Existing cash and cash equivalents;
» Cash flows from operations; and
» Debt capacity available under our revolving credit facility.

5 6 » 5 7 W M S I N D U S T R I E S I N C .2
00
8 a
nn
ua
l r
ep
or
t
Selected balance sheet accounts at June 30 are summarized as follows
(in millions):Increase
2008 2007 Dollar Percent
Total cash, cash equivalents, and restricted cash(1) $119.6 $ 53.2 $ 66.4 124.8%Total current assets (A) 413.3 342.2 71.1 20.8Total assets 772.7 655.7 117.0 17.8Total current liabilities (B) 116.6 86.7 29.9 34.5Long-term debt 115.0 115.0 — —Stockholders’ equity 510.8 433.6 77.2 17.8Net working capital (A)–(B) 296.7 255.5 41.2 16.1
(1) Includes restricted cash of $18.8 million and $16.0 million as of June 30, 2008 and June 30, 2007, respectively. Cash required for funding WAP systems jackpot payments is considered restricted cash and is not available for general corporate purposes.
Our net working capital increased $41.2 million from June 30, 2007, and
was primarily affected by the following components:
» An increase in cash, cash equivalents and restricted cash of $66.4
million due primarily to our increased profitability and better manage-
ment of working capital;
» An increase in total current accounts and notes receivable, net, of
$24.6 million or 14.1%, to $198.5 million compared to $173.9 million at
June 30, 2007, even though our revenues increased 20.4% during fiscal
2008 as we achieved a reduction in our days sales outstanding to 105 days;
» A decrease in inventories of $19.4 million to $59.9 million due to
focused efforts on increasing inventory turns which was 3.1 at June 30,
2008; and
» An increase in accounts payable of $8.2 million due to additional
working capital management and international expansion, coupled
with a $5.1 million increase in accrued compensation and related
benefits due to performance based incentives associated with improved
operating performance, and a $16.6 million increase in other accrued
liabilities due to increased current income taxes payable.
We have not experienced significant bad debt expense in any of the peri-
ods presented. In fiscal 2008, we placed increased emphasis on more
effectively utilizing working capital elements, in particular greater cross-
functional team focus on better managing inventory, current accounts and
notes receivable and accounts payable. We believe there continues to be
opportunities to free up additional cash through greater focus and better
management of these working capital categories. We also increased our
emphasis on the effective use of capital deployed in general, and in
specific, the amount of capital used in our gaming operations. We believe
there continues to be opportunities to utilize lean sigma tools to further
improve operating performance and achieve greater efficiencies in the
deployment of capital associated with working capital and gaming opera-
tions equipment.
As described in Note 13, “Commitments, Contingencies and Indemnifi ca-
tions” to our Consolidated Financial Statements, we have royalty and
license fee commitments for brand, intellectual property and technology
licenses of $21.0 million including contingent payments that are not
recorded in our Consolidated Balance Sheets.
We believe that total cash and cash equivalents of $119.6 million at June 30,
2008, inclusive of $18.8 million of restricted cash, and cash flow from opera-
tions will be adequate to fund our anticipated level of expenses, capital
expenditures, cash to be invested in gaming operations equipment, the
levels of inventories and receivables required in the operation of our busi-
ness, and any repurchases of common stock for the next year. In fiscal 2009
and 2010, we expect cash flow from operations to continue to be strong.
We do not believe we will need to raise a significant amount of additional
capital in the short term or long term, and we have access to our $100 mil-
lion revolving credit facility. We will, however, assess market opportunities
as they arise.
Convertible Subordinated Notes
At June 30, 2008, we had $115 million of convertible subordinated notes
outstanding, bearing interest at 2.75%, maturing on July 15, 2010. The notes
are convertible at any time into an aggregate of 8.7 million shares of our
common stock at a conversion price of $13.19 per share, subject to adjust-
ment. The notes are not callable. We pay interest on the notes semi-annually
on January 15 and July 15 of each year, aggregating $3.2 million annually.
The conversion of the 2.75% convertible subordinated notes to common

MANAgEMENT’S DISCUSSION AND ANALYSIS OF FINANCIAL CONDITION AND RESULTS OF OPERATIONS [continued]
stock is dependent on individual holders’ choices to convert, which is
dependent on the spread of the market price of our stock above the
conversion strike price of $13.19 per share, and would reduce our annual
interest expense. None of the holders have converted any of their convert-
ible subordinated notes into our common stock. Our convertible notes are
conventional convertible debt instruments in which the holder may only
realize the value of the conversion option by exercising the option and
receiving a fixed number of shares of our common stock.
Revolving Credit Facility
We have a multi-year revolving credit agreement, as amended, that pro-
vides for $100 million of unsecured borrowing through December 31, 2009,
including the potential to expand the line up to $125 million. Up to $10
million of the credit facility is available for the issuance of letters of credit.
The credit agreement requires that we maintain certain financial ratios,
which could limit our ability to acquire companies, declare dividends or
make distributions to holders of any shares of capital stock, or purchase or
otherwise acquire shares of our common stock. At June 30, 2008, approxi-
mately $103.4 million was available for such purposes under the most
restrictive of these covenants. During fiscal year 2008, we did not borrow
any funds against this facility.
Common Stock Repurchase Program
On August 4, 2008, our Board of Directors authorized the repurchase of an
additional $100 million of our common stock over the following twenty-
four months. This authorization increases the existing program, previously
authorized on August 6, 2007, from $50 million to $150 million. As of
August 26, 2008, we had total open authorization of approximately $107
million. Pursuant to the authorization, purchases may be made from time
to time in the open market, through block purchases or in privately negoti-
ated transactions. The timing and actual number of shares repurchased
will depend on market conditions. During the fiscal year ended June 30,
2008, we purchased 1,208,971 shares for approximately $40 million at an
average cost of $33.08 per share.
Cash Flows Summary
Cash flows from operating, investing and financing activities, as reflected in our Consolidated Statements of Cash Flows, are summarized in the following
table (in millions):
2008 to 2007 toYear Ended June 30, 2007 2006
2008 2007 2006 Change Change
Net cash provided by (used in): Operating activities $ 186.2 $ 118.9 $ 103.1 $ 67.3 $ 15.8 Investing activities (117.8) (158.8) (94.1) 41.0 (64.7) Financing activities (5.2) 35.6 (4.6) (40.8) 40.2Effect of exchange rates on cash and cash equivalents 0.4 2.4 (0.5) (2.0) 2.9
Net increase (decrease) in cash and cash equivalents $ 63.6 $ (1.9) $ 3.9 $ 65.5 $ (5.8)
Operating Activities:
The $67.3 million increase in cash provided by operating activities in the
fiscal 2008 year compared to the fiscal 2007 year resulted from:
» A positive impact from the $18.6 million increase in net income and
a $9.0 million increase in depreciation;
» A positive impact from a $16.2 million increase in non-cash items,
including share-based compensation, amortization of intangibles and
other assets and other non-cash items; and
» A positive impact from improved utilization of working capital indi-
cated by a $29.9 million net decrease in changes in operating assets

5 8 » 5 9 W M S I N D U S T R I E S I N C .2
00
8 a
nn
ua
l r
ep
or
t
and liabilities, as the fiscal 2008 period decrease in inventories and
increase in current liabilities was only partially offset by an increase in
accounts and notes receivable and other current assets.
The $15.8 million increase in cash provided by operating activities in fiscal
2007 compared to fiscal 2006 resulted from several factors, including:
» A positive impact from the $15.6 million increase in net income and
a $8.2 million increase in depreciation;
» A positive impact from a $13.1 million increase in non-cash items,
including share-based compensation, amortization of intangibles and
other assets and other non-cash items, partially offset by:
» A negative impact from the $24.3 million net increase in changes in
operating assets and liabilities, due to the impact of inventory being
flat from fiscal 2006 to fiscal 2007, as compared to the decrease from
fiscal 2005 to fiscal 2006, partially offset by the smaller increase in our
restricted cash from fiscal 2006 to fiscal 2007. While we continued to
add new WAP links during fiscal 2007, we had established significantly
more new WAP links during fiscal 2006, driving the growth in restricted
cash during that period. The growth in our total receivables had a simi-
lar impact on cash flow from operations in fiscal 2007 and fiscal 2006.
Investing Activities:
The $41.0 million decrease in cash used by investing activities in fiscal 2008
compared to the fiscal 2007 year was primarily due to:
» Lower cash used in purchasing businesses by $20.7 million as only
$0.2 million of cash was used for the acquisition of SiP in the fiscal 2008
period compared to net cash of $20.9 million used for the acquisition of
Orion Gaming during fiscal 2007;
» A $25.5 million decrease in the amount invested in gaming operations
machines, top boxes and related equipment during the fiscal 2008
period to $50.4 million. We expect the rate of investment in gaming
operations equipment to continue to moderate in fiscal 2009 and 2010;
» An $8.4 million reduction in investments and advances in royalties,
licensed technologies, patents and trademarks to $19.5 million in the
fiscal 2008 period as we entered into fewer new agreements, partially
offset by:
» A $14.2 million increase in the amount invested in property, plant and
equipment during the fiscal 2008 period to $48.3 million, due primarily
to the acquisition of land and buildings near our Chicago technology
campus to provide for future expansion, higher spending on informa-
tion technology, renovation of our Waukegan, Illinois facility, as well as
investments in manufacturing tools and internally developed and
purchased software. We expect that capital expenditures for property,
plant and equipment will increase modestly in fiscal 2009 and 2010.
The $64.7 million increase in cash used by investing activities in fiscal 2007
compared to fiscal 2006 was primarily due to:
» The acquisition on July 13, 2006, of 100% of the outstanding stock of
privately held Orion Gaming. The acquisition resulted in a net use of
cash of $20.9 million, including debt retirement, cash consideration paid
and acquisition costs, net of cash acquired;
» A $7.2 million increase in the amount invested in gaming operations
machines, top boxes and related equipment during fiscal 2007 to
$75.9 million;
» An $18.5 million increase in the amount invested in property, plant
and equipment during fiscal 2007 to $34.1 million, due primarily to the
expansion of our Waukegan, Illinois facility to consolidate outside ware-
housing and support our continued process improvement initiatives, as
well as investments in internally developed and purchased software;
» A $12.0 million increase in investment and advances in royalties,
licensed technologies, patents, and trademarks as we continued to
license and acquire innovative and creative technologies and intellec-
tual property;

MANAgEMENT’S DISCUSSION AND ANALYSIS OF FINANCIAL CONDITION AND RESULTS OF OPERATIONS [continued]
» Net cash of $6.1 million was provided from the redemption of short-
term investments during fiscal 2006, with no redemptions of such
investments in fiscal 2007.
Financing Activities:
The $40.8 million decrease in cash provided by financing activities in fiscal
2008 compared to fiscal 2007 was primarily due to:
» The use of $35.0 million in fiscal 2008 to repurchase common stock
compared to none in fiscal 2007;
» A $5.8 million reduction in the cash received and tax benefit from
the exercised stock options. The amount we receive from the exercise
of stock options is dependent on individuals’ choices to exercise options,
which are dependent on the spread of the market price of our stock
above the exercise price of vested options.
The $40.2 million increase in cash provided by financing activities in fiscal
2007 compared to fiscal 2006 was primarily due to:
» The receipt of $26.7 million from the exercise of stock options in
fiscal 2007, compared to $4.2 million in fiscal 2006, along with the
related tax benefit of $8.9 million in fiscal 2007 and $1.2 million in fiscal
2006. The amount we receive from the exercise of stock options is
dependent on individuals’ choices to exercise options, which are
dependent on the spread of the market price of our stock above the
exercise price of vested options;
» $10.0 million in repurchases of our common stock during the fiscal
2006, with no similar repurchases during fiscal 2007.
OFF-BALANCE SHEET ARRANgEMENTS AND CONTRACTUAL OBLIgATIONS
We are not dependent on off-balance sheet financing arrangements to
fund our operations. We utilize financing arrangements for operating leases
of equipment and facilities, none of which are in excess of our current
needs. We also have minimum guaranteed royalty payments for intellectual
property and technologies that are not recorded on our Consolidated
Balance Sheets. Typically, we are obligated to make minimum commitment
royalty payments over the term of our licenses and to advance payment
against those commitments.
Our obligations under these arrangements, under our convertible subordinated notes and other contractual obligations at June 30, 2008, were as follows
(in millions):Less Morethan 1–3 3–5 than
Contractual Obligations Total 1 Year Years Years 5 Years
Operating leases $ 24.4 $ 3.9 $ 6.8 $6.3 $7.4Royalty and license fee payments 21.0 9.6 10.9 0.5 —Non-cancelable raw material purchase orders 2.1 2.1 — — —Accrued WAP jackpot liability 11.3 11.3 — — —Convertible subordinated notes 115.0 — 115.0 — —Interest payments 7.9 3.2 4.7 — —Performance bonds 1.0 1.0 — — —Other, including guaranteed minimums in employment agreements and capital expenditures 21.0 14.0 4.8 1.4 0.8
Total $ 203.7 $45.1 $ 142.2 $8.2 $8.2

6 0 » 6 1 W M S I N D U S T R I E S I N C .2
00
8 a
nn
ua
l r
ep
or
t
The total potential royalty and license fee commitments decreased to $21.0
million at June 30, 2008 from $27.3 million at June 30, 2007, due to advances
and payments made on existing commitments, partially offset by a slight
increase in gross commitments. Potential royalty and license fee commit-
ments could increase in the future as we enter into new intellectual property,
technology or brand licensing agreements. See Note 13, “Commitments,
Contingencies and Indemnifications” to our Consolidated Financial Statements.
Non-cancelable raw materials purchase orders decreased to $2.1 million as
of June 30, 2008 from $6.3 million as of June 30, 2007, due to the reevalua-
tion of our purchasing practices and procedures as part of our alignment
with lean sigma principles.
We have performance bonds outstanding of $1.0 million at June 30, 2008,
to one customer, related to product sales, and we are liable to the issuer in
the event of exercise due to our non-performance under the contract.
Events of non-performance do not include the financial performance of
our products.
Indemnifications
We have agreements in which we may be obligated to indemnify other
parties with respect to certain matters. Generally, these indemnification
provisions are included in sales orders and agreements arising in the
normal course of business under which we customarily agree to hold the
indemnified party harmless against claims arising from a breach of repre-
sentations related to matters such as title to assets sold and licensed, defec-
tive equipment or certain intellectual property rights. Payments by us
under such indemnification provisions are generally conditioned on the
other party making a claim. Such claims are typically subject to challenge
by us and to dispute resolution procedures specified in the particular sales
order or contract. Further, our obligations under these agreements may be
limited in terms of time and/or amount and, in some instances, we may
have recourse against third parties. It is not possible to predict the maxi-
mum potential amount of future payments under these indemnification
agreements due to the conditional nature of the obligations and the unique
facts of each particular agreement. Historically, we have not made any
payments under these agreements that have been material individually or
in the aggregate. As of June 30, 2008, we were not aware of any obligations
arising under indemnification agreements that would require material
payments except for the matter disclosed in Note 14, “Litigation,” to our
Consolidated Financial Statements.
We have agreements with our directors and certain officers that require us,
among other things, to indemnify them against certain liabilities that may
arise by reason of their status or service as directors or officers. We have
also agreed to indemnify certain former officers and directors of acquired
companies. We maintain director and officer insurance, which may cover
our liabilities arising from these indemnification obligations in certain
circumstances. As of June 30, 2008, we were not aware of any obligations
arising under these agreements that would require material payments.
We do not have any special purpose entities for investment or the conduct
of our operations. We have not entered into any derivative financial instru-
ments, although we have granted stock options, restricted stock, equity
based performance units and deferred stock units to our employees, officers,
directors and consultants and warrants to a licensor, and we have issued
convertible subordinated notes.
Self-Insurance
We are self-insured for various levels of workers’ compensation, electronic
errors and omissions liability, automobile collision insurance, as well as
employee medical, dental, prescription drug and disability coverage. We
purchase stop-loss coverage to protect against unexpected claims.
Accrued insurance claims and reserves include estimated settlements for
known claims, and estimates of claims incurred but not reported.
SUBSEQUENT DEVELOPMENTS
Share Repurchase Authorization
On August 4, 2008, our Board of Directors authorized the repurchase of an
additional $100 million of our common stock over the following twenty-
four months. This authorization increases the existing program from
$50 million to $150 million. As of August 26, 2008, we had a total open
authorization of approximately $107 million. Pursuant to the authorization,
purchases may be made from time to time in the open market, through
block purchases or in privately negotiated transactions. The timing and
actual number of shares repurchased will depend on market conditions.

MANAgEMENT’S DISCUSSION AND ANALYSIS OF FINANCIAL CONDITION AND RESULTS OF OPERATIONS [continued]
QUANTITATIVE AND QUALITATIVE DISCLOSURES ABOUT MARKET RISK
We are subject to market risks in the ordinary course of our business, pri-
marily associated with interest rate and foreign currency fluctuations. We
do not currently hedge either of these risks, or utilize financial instruments
for trading or other speculative purposes.
Interest Rate Risk
We have exposure to interest rate risk from our convertible subordinated
notes and revolving credit facility. The notes are at a fixed rate and the
revolving credit facility is at a variable rate.
As of June 30, 2008, we had $115.0 million of convertible fixed-rate debt
with an interest rate of 2.75% and a fair value of $259.6 million. Using a
discounted cash flow model, and assuming no change in the market price
of our common stock into which the debt is convertible, we currently
estimate that a 50 basis point change in the prevailing market interest rates
would impact the fair value of our fixed rate debt by approximately $1.0
million, but would not impact our cash flows or future results of opera-
tions. However, the fair value of our convertible fixed rate debt is more
significantly dependent on the market price of our common stock into
which it can be converted.
We have a multi-year revolving credit agreement that provides for $100
million of unsecured borrowing through December 31, 2009, including the
potential to expand the line up to $125 million. Borrowings under this
facility bear interest at a certain percentage above the agent’s prime rate,
or above the LIBOR rate. There were no outstanding borrowings under this
facility as of June 30, 2008.
Foreign Currency Risk
We have subsidiaries in Australia, Austria, Canada, China, the Netherlands,
Slovakia, Spain, South Africa, and the United Kingdom for distribution and
development operations. These subsidiaries transact business in their
respective foreign currencies and are exposed to risks resulting from fluc-
tuations in foreign currency exchange rates. We estimate that a hypothetical
10% strengthening (or weakening) of the U.S. dollar for fiscal 2008 would
have resulted in a pretax loss (or gain) of approximately $0.7 million.
The net assets of these subsidiaries are exposed to foreign currency
translation gains and losses, which are included as a component of accu-
mulated other comprehensive income in stockholders’ equity in our
Consolidated Balance Sheets. Such translation resulted in unrealized gains
of $6.8 million and $3.2 million for fiscal 2008 and 2007, respectively.
In addition, foreign governments could impose restrictions on currency
movements that might make it costly or impossible to repatriate earnings
to the U.S.
Forward-Looking Statement
This Report contains forward-looking statements concerning our future busi-
ness performance, strategy, outlook, plans, liquidity, pending regulatory matters
and outcomes of contingencies including legal proceedings, among others.
Forward-looking statements may be typically identified by such words as “may,”
“will,” “should,” “expect,” “anticipate,” “seek,” “believe,” “estimate,” “plan” and
“intend,” among others. These forward-looking statements are subject to risks
and uncertainties that could cause our actual results to differ materially from
the expectations expressed in the forward-looking statements. Although we
believe that the expectations reflected in our forward-looking statements are
reasonable, any or all of our forward-looking statements may prove to be incor-
rect. Consequently, no forward-looking statements are guaranteed. Factors that
could cause our actual results to differ from our expectations include the risk
factors set forth under Item 1. “Business” and Item 7. “Management’s Discussion
and Analysis of Financial Condition and Results of Operations,” among other
items in our Form 10-K. Forward-looking statements express the expectations
only as of the date of this Report.

6 2 » 6 3 W M S I N D U S T R I E S I N C .2
00
8 a
nn
ua
l r
ep
or
t
REPORT OF INDEPENDENT REgISTERED PUBLIC ACCOUNTINg FIRM
The Board of Directors and Stockholders of
WMS Industries Inc.
We have audited the accompanying consolidated balance sheets of WMS Industries Inc. (the “Company”) as of June 30, 2008 and 2007, and the related
consolidated statements of income, stockholders’ equity and comprehensive income, and cash flows for each of the three years in the period ended June 30,
2008. These financial statements are the responsibility of the Company’s management. Our responsibility is to express an opinion on these financial state-
ments based on our audits.
We conducted our audits in accordance with the standards of the Public Company Accounting Oversight Board (United States). Those standards require
that we plan and perform the audit to obtain reasonable assurance about whether the financial statements are free of material misstatement. An audit
includes examining, on a test basis, evidence supporting the amounts and disclosures in the financial statements. An audit also includes assessing the
accounting principles used and significant estimates made by management, as well as evaluating the overall financial statement presentation. We believe
that our audits provide a reasonable basis for our opinion.
In our opinion, the financial statements referred to above present fairly, in all material respects, the consolidated financial position of WMS Industries Inc. at
June 30, 2008 and 2007, and the consolidated results of its operations and its cash flows for each of the three years in the period ended June 30, 2008, in
conformity with U.S. generally accepted accounting principles.
As discussed in Note 2 to the consolidated financial statements, effective July 1, 2007, the Company adopted Financial Accounting Standards Board (FASB)
Interpretation No. (FIN) 48, Accounting for Uncertainty in Income Taxes.
We also have audited, in accordance with the standards of the Public Company Accounting Oversight Board (United States), WMS Industries Inc.’s internal
control over financial reporting as of June 30, 2008, based on criteria established in Internal Control—Integrated Framework issued by the Committee of
Sponsoring Organizations of the Treadway Commission and our report dated August 28, 2008 expressed an unqualified opinion thereon.
Chicago, Illinois
August 28, 2008

Our management is responsible for establishing and maintaining adequate internal control over financial reporting, as such term is defined in Exchange Act
Rule 13a-15(f). Our internal control over financial reporting is designed to provide reasonable assurance regarding the preparation and fair presentation of
published financial statements. Because of its inherent limitations, internal control over financial reporting may not prevent or detect misstatements.
Therefore, even those systems determined to be effective can provide only reasonable assurance with respect to financial statement preparation and
presentation. Under the supervision and with the participation of our management, including our principal executive officer and principal financial officer,
we conducted an evaluation of the effectiveness of our internal control over financial reporting based on the framework in Internal Control—Integrated
Framework, issued by the Committee of Sponsoring Organizations of the Treadway Commission. Based on our evaluation under the framework in Internal
Control—Integrated Framework, our management concluded that our internal control over financial reporting was effective as of June 30, 2008.
The effectiveness of our internal control over financial reporting as of June 30, 2008 has been audited by Ernst & Young LLP, an independent registered
public accounting firm, as stated in their report included herein.
Brian R. Gamache
Chairman and Chief Executive Officer
Scott D. Schweinfurth
Executive Vice President,
Chief Financial Officer and Treasurer
August 28, 2008
MANAgEMENT’S REPORT ON INTERNAL CONTROL OVER FINANCIAL REPORTINg
6 4 » 6 5 W M S I N D U S T R I E S I N C .2
00
8 a
nn
ua
l r
ep
or
t
REPORT OF INDEPENDENT REgISTERED PUBLIC ACCOUNTINg FIRMON INTERNAL CONTROL OVER FINANCIAL REPORTINg
The Board of Directors and Stockholders of
WMS Industries Inc.
We have audited WMS Industries Inc.’s internal control over financial reporting as of June 30, 2008, based on criteria established in Internal Control—
Integrated Framework issued by the Committee of Sponsoring Organizations of the Treadway Commission (the COSO criteria). WMS Industries Inc.’s manage-
ment is responsible for maintaining effective internal control over financial reporting, and for its assessment of the effectiveness of internal control over
financial reporting included in the accompanying Management’s Report on Internal Control over Financial Reporting. Our responsibility is to express an opinion
on the company’s internal control over financial reporting based on our audit.
We conducted our audit in accordance with the standards of the Public Company Accounting Oversight Board (United States). Those standards require that
we plan and perform the audit to obtain reasonable assurance about whether effective internal control over financial reporting was maintained in all material
respects. Our audit included obtaining an understanding of internal control over financial reporting, assessing the risk that a material weakness exists,
testing and evaluating the design and operating effectiveness of internal control based on the assessed risk, and performing such other procedures as we
considered necessary in the circumstances. We believe that our audit provides a reasonable basis for our opinion.
A company’s internal control over financial reporting is a process designed to provide reasonable assurance regarding the reliability of financial reporting
and the preparation of financial statements for external purposes in accordance with generally accepted accounting principles. A company’s internal
control over financial reporting includes those policies and procedures that (1) pertain to the maintenance of records that, in reasonable detail, accurately
and fairly reflect the transactions and dispositions of the assets of the company; (2) provide reasonable assurance that transactions are recorded as necessary
to permit preparation of financial statements in accordance with generally accepted accounting principles, and that receipts and expenditures of the
company are being made only in accordance with authorizations of management and directors of the company; and (3) provide reasonable assurance
regarding prevention or timely detection of unauthorized acquisition, use, or disposition of the company’s assets that could have a material effect on the
financial statements.
Because of its inherent limitations, internal control over financial reporting may not prevent or detect misstatements. Also, projections of any evaluation
of effectiveness to future periods are subject to the risk that controls may become inadequate because of changes in conditions, or that the degree of
compliance with the policies or procedures may deteriorate.
In our opinion, WMS Industries Inc. maintained, in all material respects, effective internal control over financial reporting as of June 30, 2008, based on the
COSO criteria.
We also have audited, in accordance with the standards of the Public Company Accounting Oversight Board (United States), the consolidated balance
sheets of WMS Industries Inc. as of June 30, 2008 and 2007, and the related consolidated statements of income, stockholders’ equity and comprehensive
income, and cash flows for each of the three years in the period ended June 30, 2008 of WMS Industries Inc. and our report dated August 28, 2008
expressed an unqualified opinion thereon.
Chicago, Illinois
August 28, 2008

2008 2007
(in millions of U.S. dollars and millions of shares)ASSETSCURRENT ASSETS: Cash and cash equivalents $ 100.8 $ 37.2 Restricted cash 18.8 16.0
Total cash, cash equivalents, and restricted cash 119.6 53.2 Accounts receivable, net of allowances of $3.0 and $2.5, respectively 131.8 114.5 Notes receivable 66.7 59.4 Inventories 59.9 79.3 Deferred income tax assets 7.3 9.4 Other current assets 28.0 26.4
Total current assets 413.3 342.2NON-CURRENT ASSETS: Gaming operations equipment, net 75.4 90.0 Property, plant and equipment, net 125.7 91.9 Intangible assets 106.3 97.0 Deferred income tax assets 34.9 19.9 Other assets 17.1 14.7
Total non-current assets 359.4 313.5
TOTAL ASSETS $ 772.7 $ 655.7
LIABILITIES AND STOCKHOLDERS’ EQUITYCURRENT LIABILITIES: Accounts payable $ 47.0 $ 38.8 Accrued compensation and related benefits 22.6 17.5 Other accrued liabilities 47.0 30.4
Total current liabilities 116.6 86.7NON-CURRENT LIABILITIES: Deferred income tax liabilities 16.2 9.4 Long-term debt 115.0 115.0 Other non-current liabilities 14.1 11.0
Total non-current liabilities 145.3 135.4Commitments, contingencies and indemnifications (see Note 13) — —STOCKHOLDERS’ EQUITY: Preferred stock (5.0 shares authorized, none issued) — — Common stock (100.0 shares authorized, 51.0 and 50.0 shares issued, respectively) 25.5 25.0 Additional paid-in capital 298.1 269.1 Retained earnings 203.9 138.2 Accumulated other comprehensive income 8.1 1.3 Treasury stock, at cost (0.8 and zero shares, respectively) (24.8) —
Total stockholders’ equity 510.8 433.6
TOTAL LIABILITIES AND STOCKHOLDERS’ EQUITY $ 772.7 $ 655.7
The accompanying Notes are an integral part of these Consolidated Financial Statements.
CONSOLIDATED BALANCE SHEETSJune 30, 2008 and 2007

6 6 » 6 7 W M S I N D U S T R I E S I N C .2
00
8 a
nn
ua
l r
ep
or
t
CONSOLIDATED STATEMENTS OF INCOMEFor the Years Ended June 30, 2008, 2007 and 2006
2008 2007 2006
(in millions of U.S. dollars and millions of shares, except per share amounts)
REVENUES: Product sales $ 421.2 $ 366.3 $ 302.5 Gaming operations 228.9 173.5 148.7
Total revenues 650.1 539.8 451.2COSTS AND EXPENSES: Cost of product sales(1) 217.3 198.6 174.1 Cost of gaming operations(1) 46.6 36.2 36.4 Research and development 79.9 58.1 49.0 Selling and administrative 130.0 109.8 88.0 Depreciation(1) 71.9 62.9 54.7
Total costs and expenses 545.7 465.6 402.2
OPERATINg INCOME 104.4 74.2 49.0Interest expense (4.0) (5.1) (4.3)Interest and other income, net 5.2 2.6 4.5
Income before income taxes 105.6 71.7 49.2Provision for income taxes 38.1 22.8 15.9
NET INCOME $ 67.5 $ 48.9 $ 33.3
Earnings per share: Basic $ 1.34 $ 1.01 $ 0.71
Diluted $ 1.15 $ 0.86 $ 0.63
Weighted-average common shares: Basic common stock outstanding 50.2 48.4 47.1
Diluted common stock and common stock equivalents 60.6 59.6 56.9
(1) Cost of product sales and cost of gaming operations exclude the following amounts of depreciation, which are included separately in the depreciation line item:Cost of product sales $ 3.7 $ 2.4 $ 2.3Cost of gaming operations $ 59.5 $ 53.3 $ 45.8
The accompanying Notes are an integral part of these Consolidated Financial Statements.
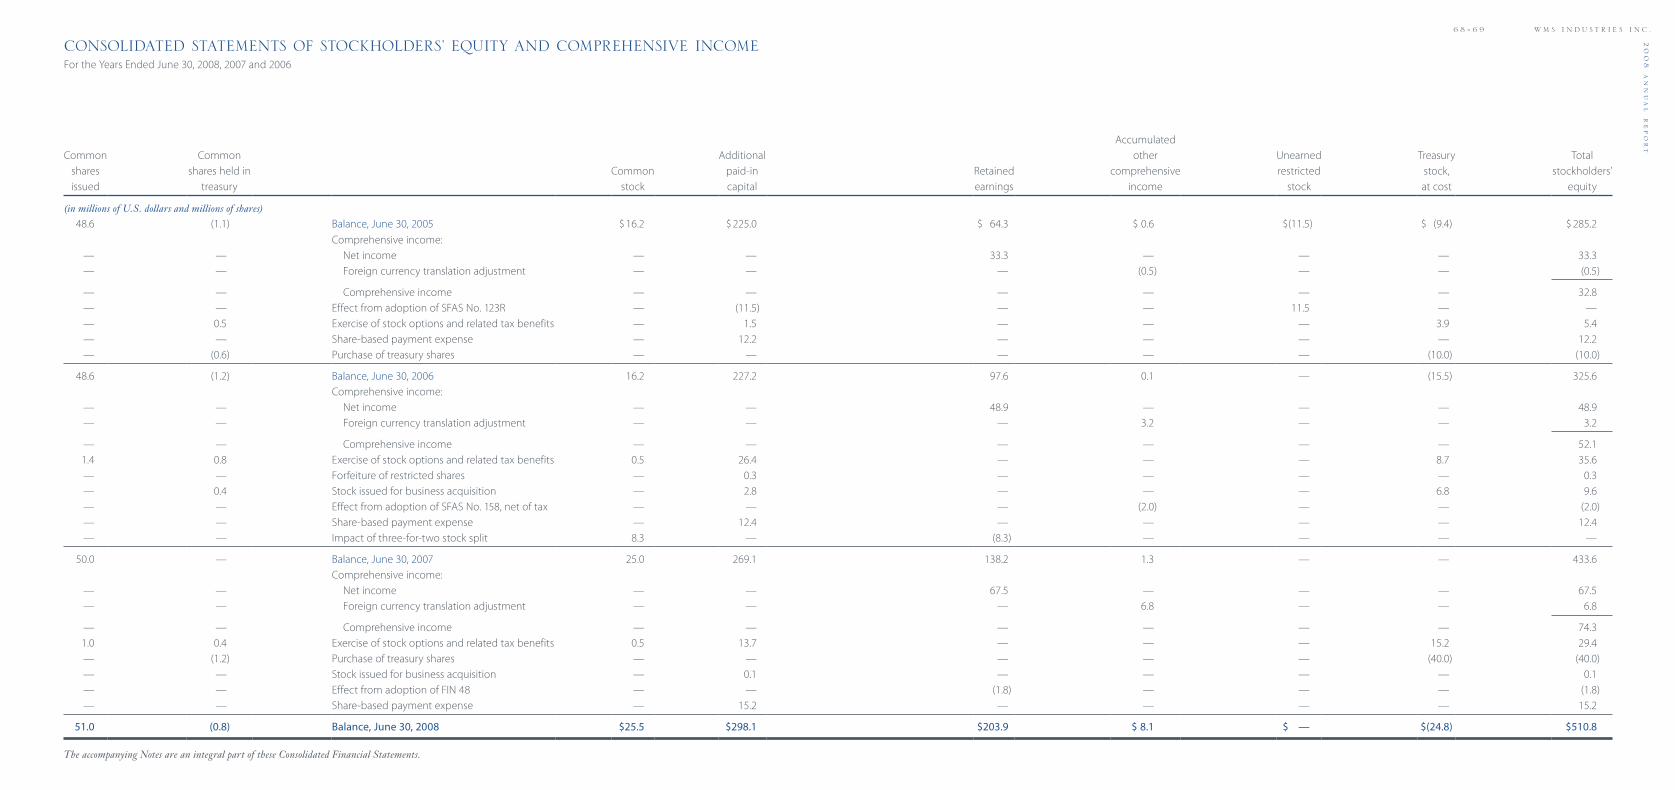
6 8 » 6 9 W M S I N D U S T R I E S I N C .2
00
8 a
nn
ua
l r
ep
or
t
CONSOLIDATED STATEMENTS OF STOCKHOLDERS’ EQUITY AND COMPREHENSIVE INCOMEFor the Years Ended June 30, 2008, 2007 and 2006
AccumulatedCommon Common Additional other Unearned Treasury Total
shares shares held in Common paid-in Retained comprehensive restricted stock, stockholders’issued treasury stock capital earnings income stock at cost equity
(in millions of U.S. dollars and millions of shares)
48.6 (1.1) Balance, June 30, 2005 $ 16.2 $ 225.0 $ 64.3 $ 0.6 $(11.5) $ (9.4) $ 285.2Comprehensive income:
— — Net income — — 33.3 — — — 33.3— — Foreign currency translation adjustment — — — (0.5) — — (0.5)
— — Comprehensive income — — — — — — 32.8— — Effect from adoption of SFAS No. 123R — (11.5) — — 11.5 — —— 0.5 Exercise of stock options and related tax benefits — 1.5 — — — 3.9 5.4— — Share-based payment expense — 12.2 — — — — 12.2— (0.6) Purchase of treasury shares — — — — — (10.0) (10.0)
48.6 (1.2) Balance, June 30, 2006 16.2 227.2 97.6 0.1 — (15.5) 325.6Comprehensive income:
— — Net income — — 48.9 — — — 48.9— — Foreign currency translation adjustment — — — 3.2 — — 3.2
— — Comprehensive income — — — — — — 52.11.4 0.8 Exercise of stock options and related tax benefits 0.5 26.4 — — — 8.7 35.6— — Forfeiture of restricted shares — 0.3 — — — — 0.3— 0.4 Stock issued for business acquisition — 2.8 — — — 6.8 9.6— — Effect from adoption of SFAS No. 158, net of tax — — — (2.0) — — (2.0)— — Share-based payment expense — 12.4 — — — — 12.4— — Impact of three-for-two stock split 8.3 — (8.3) — — — —
50.0 — Balance, June 30, 2007 25.0 269.1 138.2 1.3 — — 433.6Comprehensive income:
— — Net income — — 67.5 — — — 67.5— — Foreign currency translation adjustment — — — 6.8 — — 6.8
— — Comprehensive income — — — — — — 74.31.0 0.4 Exercise of stock options and related tax benefits 0.5 13.7 — — — 15.2 29.4— (1.2) Purchase of treasury shares — — — — — (40.0) (40.0)— — Stock issued for business acquisition — 0.1 — — — — 0.1— — Effect from adoption of FIN 48 — — (1.8) — — — (1.8)— — Share-based payment expense — 15.2 — — — — 15.2
51.0 (0.8) Balance, June 30, 2008 $25.5 $298.1 $203.9 $ 8.1 $ — $(24.8) $510.8
The accompanying Notes are an integral part of these Consolidated Financial Statements.
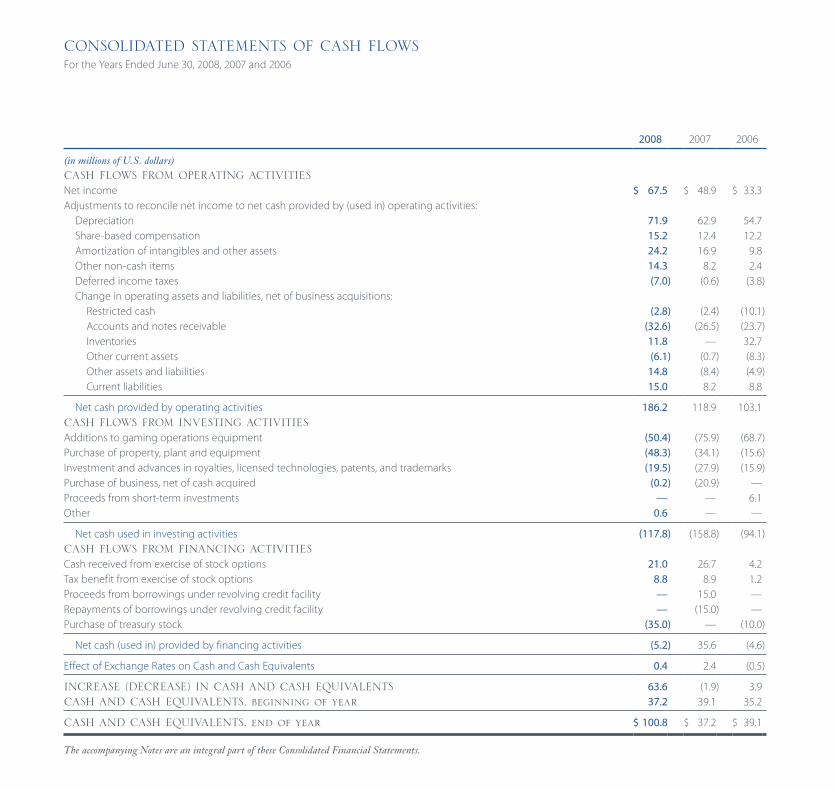
2008 2007 2006
(in millions of U.S. dollars)CASH FLOWS FROM OPERATINg ACTIVITIESNet income $ 67.5 $ 48.9 $ 33.3Adjustments to reconcile net income to net cash provided by (used in) operating activities: Depreciation 71.9 62.9 54.7 Share-based compensation 15.2 12.4 12.2 Amortization of intangibles and other assets 24.2 16.9 9.8 Other non-cash items 14.3 8.2 2.4 Deferred income taxes (7.0) (0.6) (3.8) Change in operating assets and liabilities, net of business acquisitions: Restricted cash (2.8) (2.4) (10.1) Accounts and notes receivable (32.6) (26.5) (23.7) Inventories 11.8 — 32.7 Other current assets (6.1) (0.7) (8.3) Other assets and liabilities 14.8 (8.4) (4.9) Current liabilities 15.0 8.2 8.8
Net cash provided by operating activities 186.2 118.9 103.1CASH FLOWS FROM INVESTINg ACTIVITIESAdditions to gaming operations equipment (50.4) (75.9) (68.7)Purchase of property, plant and equipment (48.3) (34.1) (15.6)Investment and advances in royalties, licensed technologies, patents, and trademarks (19.5) (27.9) (15.9)Purchase of business, net of cash acquired (0.2) (20.9) —Proceeds from short-term investments — — 6.1Other 0.6 — —
Net cash used in investing activities (117.8) (158.8) (94.1)CASH FLOWS FROM FINANCINg ACTIVITIESCash received from exercise of stock options 21.0 26.7 4.2Tax benefit from exercise of stock options 8.8 8.9 1.2Proceeds from borrowings under revolving credit facility — 15.0 —Repayments of borrowings under revolving credit facility — (15.0) —Purchase of treasury stock (35.0) — (10.0)
Net cash (used in) provided by financing activities (5.2) 35.6 (4.6)
Effect of Exchange Rates on Cash and Cash Equivalents 0.4 2.4 (0.5)
INCREASE (DECREASE) IN CASH AND CASH EQUIVALENTS 63.6 (1.9) 3.9CASH AND CASH EQUIVALENTS, beginning of year 37.2 39.1 35.2
CASH AND CASH EQUIVALENTS, end of year $ 100.8 $ 37.2 $ 39.1
The accompanying Notes are an integral part of these Consolidated Financial Statements.
CONSOLIDATED STATEMENTS OF CASH FLOWSFor the Years Ended June 30, 2008, 2007 and 2006

7 0 » 7 1 W M S I N D U S T R I E S I N C .2
00
8 a
nn
ua
l r
ep
or
t
1. BUSINESS OVERVIEW
We are engaged in one business segment: the design, manufacture, and
distribution of gaming machines (video and mechanical reel type) and
video lottery terminals (“VLTs”) for customers in legalized gaming jurisdic-
tions worldwide. We have production facilities in the United States and the
Netherlands, with development and distribution offices located in the
United States, Argentina, Australia, Austria, China, Italy, the Netherlands,
South Africa, Spain, and the United Kingdom.
We market our gaming machines in two principal ways. First, product sales
include the sales of new and used gaming machines and VLTs, conversion
kits, parts, amusement-with-prize gaming machines, equipment manufac-
tured under original equipment manufacturing agreements to casinos and
other gaming machine operators and gaming related systems for smaller
international casino operators. Second, we license our game content and
intellectual property to third parties for distribution and we lease gaming
machines and VLTs to casinos and other licensed gaming machine opera-
tors for payments based upon (1) a percentage of the net win, which is the
earnings generated by casino patrons playing the gaming machine, (2) fixed
daily fees or (3) in the case of gaming machines on a wide-area progressive
(“WAP”) jackpot system, a percentage of the amount wagered or a combi-
nation of a fixed daily fee and a percentage of the amount wagered. We
categorize our lease arrangements into five groups: WAP participation
gaming machines; local-area progressive (“LAP”) participation gaming
machines; stand-alone participation gaming machines; casino-owned daily
fee games; and gaming machine and VLT leases. We refer to WAP, LAP and
stand-alone participation gaming machines as “participation games” and
when combined with casino-owned daily fee games, royalties we receive
under license agreements with third parties to utilize our game content
and intellectual property, and gaming machine, VLT and other lease reve-
nues, we refer to this business as our “gaming operations.”
Data for product sales and gaming operations is only maintained on a con-
solidated basis as presented in our Consolidated Financial Statements, with
no additional separate data maintained for product sales and gaming
operations (other than the revenues and costs of revenues information
included in our Consolidated Statements of Income and cost of gaming
equipment and related accumulated depreciation included in our
Consolidated Balance Sheets).
Common Stock Split
On May 7, 2007, our Board of Directors authorized a three-for-two stock
split of our common stock, effected in the form of a stock dividend. All
stockholders received one additional share for every two shares of our
common stock owned as of the close of business on the record date of
May 29, 2007. The additional 16,624,363 shares of $0.50 par value common
stock were issued on June 14, 2007 and recorded as a reduction to retained
earnings in the amount of $8.3 million. Our common stock began trading
on the split-adjusted basis on June 15, 2007. Earnings per share, stock prices
and all other common share data have been retroactively adjusted, as
appropriate, to reflect the effect of this stock split.
2. PRINCIPAL ACCOUNTINg POLICIES
Basis of Presentation and Consolidation Policy
Our Consolidated Financial Statements have been prepared in accordance
with U.S. generally accepted accounting principles and, pursuant to the
rules and regulations of the Securities and Exchange Commission, include
all adjustments necessary to fairly present our consolidated financial posi-
tion, results of operations, and cash flows for each period presented. Our
Consolidated Financial Statements include the accounts of WMS Industries
Inc. and its wholly owned subsidiaries (“WMS” or the “Company”). All signifi-
cant intercompany accounts and transactions have been eliminated.
Reclassifications
Certain amounts within net cash provided by operating activities included
in the prior years’ Consolidated Statements of Cash Flows have been reclas-
sified to conform with the current year’s presentation. These reclassifications
did not affect the reported amounts of total net cash provided by operat-
ing activities included in our Consolidated Statements of Cash Flows.
NOTES TO CONSOLIDATED FINANCIAL STATEMENTS (tabular amounts in millions of U.S. dollars and millions of shares, except per share amounts)
NOTES TO CONSOLIDATED FINANCIAL STATEMENTS (tabular amounts in millions of U.S. dollars and millions of shares, except per share amounts)
[continued]
Revenue Recognition
Our revenue recognition policy for both product sales and gaming opera-
tions is to record revenue when all the following criteria are met:
» Persuasive evidence of an agreement exists;
» The price to the customer is fixed or determinable;
» The product is delivered; and
» Collectibility is reasonably assured.
Product Sales
We sell gaming machines and VLTs typically with payment terms of 30 to
90 days. In certain circumstances we may offer extended payment terms
typically for one year but in limited cases up to three years, which obliga-
tion may be secured by the related equipment and may accrue interest
recognized at market rates. Revenues are reported net of incentive rebates
or discounts.
When multiple product deliverables are included under a sales contract, in
accordance with Emerging Issues Task Force Issue 00-21 (“EITF 00-21”),
Revenue Arrangements with Multiple Deliverables, we allocate revenue to
each unit of accounting based upon its respective fair value against the
total contract value and defer revenue recognition on those deliverables
where we have not met all requirements of revenue recognition. We
allocate revenue to each unit of accounting based upon its fair value as
determined by “vendor specific objective evidence.” Vendor specific objec-
tive evidence of fair value for all elements of an arrangement is based upon
the normal pricing and discounting practices for those products and
services when sold individually.
We recognize revenue when the product is delivered and defer revenue for
any undelivered units of accounting. Deliverables are divided into separate
units of accounting if:
» each item has value to the customer on a stand-alone basis;
» we have objective and reliable evidence of the fair value of the
undelivered items; and
» delivery of any undelivered item is considered probable and substan-
tially in our control.
If we cannot objectively determine the fair value of any undelivered units
of accounting included in the arrangement, all revenues are deferred until
all of the items are delivered and services have been performed, or until
fair value can objectively be determined for any remaining undelivered
units of accounting.
Our services for initial installation, as well as standard warranty and technical
support, are not separately priced components of our sales arrangements
and are included in our revenues when the associated product sales
revenue is recognized. Labor costs for gaming machine installs and partici-
pation placements, as well as labor costs associated with performing
routine maintenance on participation gaming machines are included in
selling and administrative expenses. We accrue for the cost of installing
gaming machines sold to our customers at the time of sale, based on the
percent of such gaming machines that we expect to install for our custom-
ers. We capitalize the costs to install gaming operations equipment.
We currently do not apply the provisions of Statement of Position (“SOP”)
97-2, Software Revenue Recognition (“SOP 97-2”), to sales of our products.
The sales of our gaming machines includes games and an operating
system, which are an integral part of the gaming machine, but are
“incidental” under the guidance of SOP 97-2 and, as such, we apply the
revenue recognition principles outlined above. We do apply SOP 97-2 to
gaming-related systems revenues generated by our subsidiary Systems in
Progress GmbH (“SiP”). See Note 4 “Business Acquisitions.”
Gaming Operations
We earn gaming operations revenues from leasing participation gaming
machines and VLTs, and earn royalties from third parties under license
agreements to use our game content and intellectual property. Gaming
operations revenues under operating-type lease agreements are estimated
and recognized as earned when collectibility is reasonably assured.
For WAP leasing agreements, revenues are recognized for each gaming
machine based upon a percentage of coin-in, which is the amount of coins,
currency and credits wagered on the gaming machine or a combination of
a fixed daily fee and a percentage of coin-in. Participating casinos pay a
percentage of the coin-in from WAP gaming machines directly to us for
services related to the design, assembly, installation, operation, maintenance,
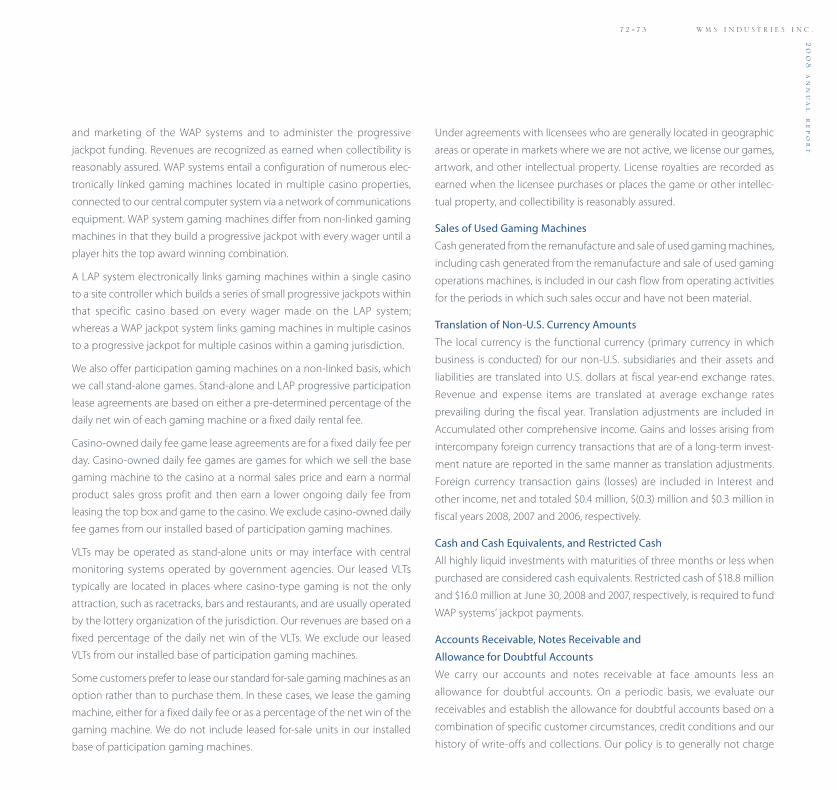
7 2 » 7 3 W M S I N D U S T R I E S I N C .2
00
8 a
nn
ua
l r
ep
or
t
and marketing of the WAP systems and to administer the progressive
jackpot funding. Revenues are recognized as earned when collectibility is
reasonably assured. WAP systems entail a configuration of numerous elec-
tronically linked gaming machines located in multiple casino properties,
connected to our central computer system via a network of communications
equipment. WAP system gaming machines differ from non-linked gaming
machines in that they build a progressive jackpot with every wager until a
player hits the top award winning combination.
A LAP system electronically links gaming machines within a single casino
to a site controller which builds a series of small progressive jackpots within
that specific casino based on every wager made on the LAP system;
whereas a WAP jackpot system links gaming machines in multiple casinos
to a progressive jackpot for multiple casinos within a gaming jurisdiction.
We also offer participation gaming machines on a non-linked basis, which
we call stand-alone games. Stand-alone and LAP progressive participation
lease agreements are based on either a pre-determined percentage of the
daily net win of each gaming machine or a fixed daily rental fee.
Casino-owned daily fee game lease agreements are for a fixed daily fee per
day. Casino-owned daily fee games are games for which we sell the base
gaming machine to the casino at a normal sales price and earn a normal
product sales gross profit and then earn a lower ongoing daily fee from
leasing the top box and game to the casino. We exclude casino-owned daily
fee games from our installed based of participation gaming machines.
VLTs may be operated as stand-alone units or may interface with central
monitoring systems operated by government agencies. Our leased VLTs
typically are located in places where casino-type gaming is not the only
attraction, such as racetracks, bars and restaurants, and are usually operated
by the lottery organization of the jurisdiction. Our revenues are based on a
fixed percentage of the daily net win of the VLTs. We exclude our leased
VLTs from our installed base of participation gaming machines.
Some customers prefer to lease our standard for-sale gaming machines as an
option rather than to purchase them. In these cases, we lease the gaming
machine, either for a fixed daily fee or as a percentage of the net win of the
gaming machine. We do not include leased for-sale units in our installed
base of participation gaming machines.
Under agreements with licensees who are generally located in geographic
areas or operate in markets where we are not active, we license our games,
artwork, and other intellectual property. License royalties are recorded as
earned when the licensee purchases or places the game or other intellec-
tual property, and collectibility is reasonably assured.
Sales of Used Gaming Machines
Cash generated from the remanufacture and sale of used gaming machines,
including cash generated from the remanufacture and sale of used gaming
operations machines, is included in our cash flow from operating activities
for the periods in which such sales occur and have not been material.
Translation of Non-U.S. Currency Amounts
The local currency is the functional currency (primary currency in which
business is conducted) for our non-U.S. subsidiaries and their assets and
liabilities are translated into U.S. dollars at fiscal year-end exchange rates.
Revenue and expense items are translated at average exchange rates
prevailing during the fiscal year. Translation adjustments are included in
Accumulated other comprehensive income. Gains and losses arising from
intercompany foreign currency transactions that are of a long-term invest-
ment nature are reported in the same manner as translation adjustments.
Foreign currency transaction gains (losses) are included in Interest and
other income, net and totaled $0.4 million, $(0.3) million and $0.3 million in
fiscal years 2008, 2007 and 2006, respectively.
Cash and Cash Equivalents, and Restricted Cash
All highly liquid investments with maturities of three months or less when
purchased are considered cash equivalents. Restricted cash of $18.8 million
and $16.0 million at June 30, 2008 and 2007, respectively, is required to fund
WAP systems’ jackpot payments.
Accounts Receivable, Notes Receivable and
Allowance for Doubtful Accounts
We carry our accounts and notes receivable at face amounts less an
allowance for doubtful accounts. On a periodic basis, we evaluate our
receivables and establish the allowance for doubtful accounts based on a
combination of specific customer circumstances, credit conditions and our
history of write-offs and collections. Our policy is to generally not charge

NOTES TO CONSOLIDATED FINANCIAL STATEMENTS (tabular amounts in millions of U.S. dollars and millions of shares, except per share amounts)
[continued]
interest on trade receivables after the invoice becomes past due. A receiv-
able is considered past due if payments have not been received within
agreed upon invoice terms. With regard to notes receivable, interest
income is recognized ratably over the life of the note receivable and any
related fees or costs to establish the notes are charged to expense as
incurred, as they are considered insignificant. Imputed interest, if any, is
determined based on current market rates at the time the note originated
and is recorded in Interest and other income, net.
The fair value of notes receivable is estimated by discounting expected
future cash flows using current interest rates at which similar loans would
be made to borrowers with similar credit ratings and remaining maturities.
As of June 30, 2008 and 2007, the fair value of the notes receivable approxi-
mated the carrying value.
Inventories
Inventories are valued at the lower of cost (determined by the first-in, first-
out method) or market. We value inventory based on estimates of poten-
tially excess and obsolete inventory after considering forecasted demand
and forecasted average selling prices. However, forecasts are subject to
revisions, cancellations and rescheduling. Actual demand may differ from
anticipated demand, and such differences may have a material effect on
our financial statements. Demand for parts inventory is subject to technical
obsolescence. Inventory on hand in excess of forecasted demand is written
down to net realizable value.
An active market exists mostly outside of North America for used gaming
machines. When we receive a gaming machine on trade-in, we estimate a
carrying value for the gaming machine. The value is based upon an estimate
of the condition of the gaming machine, as well as our experience in sell-
ing used gaming machines and could change due to changes in demand
in general for used gaming machines. We either sell these trade-ins as-is or
renovate the gaming machines before resale. We also sell participation
gaming machines as used gaming machines when we no longer need
them in our gaming operations business. Therefore, we review our used
gaming machine inventory for impairment on a routine basis. Actual
demand for new and used gaming machines may differ from anticipated
demand, and such differences may have a material effect on our financial
statements.
Freight-out and Warehousing Costs
Freight-out and warehousing costs are included in cost of product sales in
our Consolidated Statements of Income. Freight-out costs for gaming
operations equipment are capitalized and depreciated over the useful life
of the related asset.
Research and Development Costs, including Software
Development Costs
We account for research and development costs in accordance with
Statement of Financial Accounting Standards (“SFAS”) No. 2, Accounting for
Research and Development Costs. Accordingly, costs associated with product
development are included in Research and development and are generally
expensed as incurred.
We account for amounts paid to third parties for purchased or licensed
software under SFAS No. 86, Accounting for the Costs of Computer Software
to be Sold, Leased or Otherwise Marketed, (“SFAS No. 86”). Under these
arrangements, we have alternative future uses for purchased software and
we generally have the right to sub-license this software to third parties. See
Note 13, “Commitments, Contingencies and Indemnifications.” In addition,
according to SFAS No. 86, costs incurred in creating a computer software
product are charged to expense when incurred as research and develop-
ment until “technological feasibility” has been established for the product,
after which point costs are capitalized. Our products reach technological
feasibility when a working model of the software is available, which is
shortly before release to manufacturing for production.
We incur significant regulatory approval costs for our games. Such costs
are capitalized once technological feasibility has been established and are
amortized over the estimated product life cycle, generally two years.
Regulatory approval costs related to projects that are discontinued are
expensed when such determination is made. Capitalized regulatory
approval costs net, were $6.3 million and $5.4 million as of June 30, 2008
and 2007, respectively which are included in other noncurrent assets.
Amortization expense for previously capitalized amounts totaled $5.2
million, $2.1 million and $0.1 in fiscal 2008, 2007 and 2006, respectively.

7 4 » 7 5 W M S I N D U S T R I E S I N C .2
00
8 a
nn
ua
l r
ep
or
t
We account for costs incurred to develop software for internal use in
accord ance with SOP 98-1, Accounting for the Costs of Computer Software
Developed or Obtained for Internal Use. Consequently, any costs incurred
during preliminary project stages are expensed; costs incurred during the
application development stages are capitalized and costs incurred during
the post-implementation/operation stages are expensed. Unamortized
capitalized software costs were approximately $17.6 million and $7.4 million
as of June 30, 2008 and 2007, respectively which are included in Property,
plant and equipment, net.
Gaming Operations Equipment and Property, Plant and Equipment
Property, plant and equipment and gaming operations equipment are
stated at cost, net of accumulated depreciation. Depreciation of these
assets is computed on a straight-line basis over the following estimated
useful lives:
Buildings and improvements 10 to 40 yearsLeasehold improvements Lesser of term of lease or useful lifeMachinery and equipment 3 to 10 yearsGaming operations base gaming machines 3 yearsGaming operations top boxes 1 yearFurniture and fixtures 10 years
Significant replacements and improvements are capitalized. Other mainte-
nance and repairs are expensed.
We review the carrying amount of these assets when events or changes in
circumstances indicate that the carrying amount of an asset may not be
recoverable. An impairment loss would be recognized when estimated
future cash flows expected to result from the use of the asset and its even-
tual disposition are less than its carrying amount. When an impairment loss
is to be recognized for an asset, it is measured by comparing the carrying
value to the fair value. Fair value is generally measured as the present value
of estimated future cash flows.
Intangible Assets
In accordance with SFAS No. 142, Goodwill and Other Intangible Assets, we
classify intangible assets into three categories: (1) intangible assets with
finite lives subject to amortization; (2) intangible assets with indefinite lives
not subject to amortization; and (3) goodwill. We do not amortize intangible
assets with indefinite lives and goodwill. We test intangible assets with
finite lives for impairment when conditions exist that indicate the carrying
value may not be recoverable. For intangible assets with indefinite lives
and goodwill, we perform tests for impairment at least annually or more
frequently when events or circumstances indicate that assets might be
impaired. We perform our impairment tests of goodwill at our reporting
unit level which is at the consolidated level. Such impairment tests for
goodwill include comparing the fair value with its carrying value, including
goodwill. The fair value of a reporting unit refers to the amount at which
the unit as a whole could be bought or sold in a current transaction
between willing parties. Fair values are derived using discounted cash flow
analyses. When appropriate, we consider the assumptions that we believe
hypothetical marketplace participants would use in estimating future cash
flows. In addition, where applicable, an appropriate discount rate is used,
based on our cost of capital rate or location-specific economic factors. In
case the fair value is less than the carrying value of the assets, we record an
impairment charge to reduce the carrying value of the assets to fair value.
We determine the useful lives of our identifiable finite lived intangible
assets after considering the specific facts and circumstances related to
each intangible asset. Factors we consider when determining useful lives
include the contractual term of any agreement, the history of the asset, our
long-term strategy for the use of the asset, any laws or other local regula-
tions which could impact the useful life of the asset and, other economic
factors, including competition and specific market conditions. Intangible
assets that are deemed to have definite lives are amortized, generally on a
straight-line basis, over their useful lives. See Note 7, “Intangible Assets.”
We capitalize advances for royalty and licensing fees made in connection
with licensing agreements we have for the use of third party intellectual
property and technologies. When the products using the licensed intellec-
tual property or technology begin to generate revenue, we begin amorti-
zation of the amount advanced. In cases where the advance represents a
paid up license, the advance is amortized based on the estimated life of
the asset. In those cases where the license agreement provides for a royalty
to be earned by the licensor for each gaming machine sold or placed on a
lease, the advance is amortized based on the royalty rates provided in the

NOTES TO CONSOLIDATED FINANCIAL STATEMENTS (tabular amounts in millions of U.S. dollars and millions of shares, except per share amounts)
[continued]
license agreement. In both cases the amortization of the advances is
included in cost of product sales if related to a product sale, or cost of
gaming operations if related to placement or lease of gaming machines or
licenses in gaming operations revenues. To the extent we determine that
the products developed would not fully recover the minimum commit-
ment amounts, we will record an immediate impairment charge in our
Consolidated Statements of Income at the time of such determination.
WAP Jackpot Liabilities and Expenses
We record a WAP jackpot liability based on the actual volume of coin-in or
gaming machine play plus the initial progressive meter liability (“reset”) on
each system in each jurisdiction, discounted to net present value for
non-instant pay jackpots. Jackpots are payable either immediately in the
case of instant pay progressive jackpots or in equal installments over a
20-year period. For non-instant pay jackpots, winners may elect to receive
a single payment for the present value of the jackpot, discounted at appli-
cable interest rates, in lieu of annual installments. We defer jackpot expense
for the reset liability on each WAP linked system, which is subsequently
amortized as jackpot expense in cost of gaming operations as revenues are
generated from the coin-in or gaming machine play. Our jackpot liabilities
totaled $11.3 million and $11.6 million at June 30, 2008 and 2007, respectively.
Our jackpot expense was $17.9 million, $13.3 million and $13.3 million for
fiscal 2008, 2007 and 2006, respectively. To fund our jackpot liabilities we
maintain restricted cash, as described above.
Advertising Expense
The cost of advertising is charged to expense as incurred. The cost of
advertising for fiscal 2008, 2007 and 2006 was $1.0 million, $1.0 million and
$0.9 million, respectively.
Accounting for Income Taxes
Effective July 1, 2007, we adopted Financial Accounting Standards Board
(“FASB”) Interpretation No. (“FIN”) 48, Accounting for Uncertainty in Income
Taxes. Under FIN 48, the benefits of tax positions that are more likely than
not of being sustained upon audit based on the technical merits of the tax
position are recognized in our Consolidated Financial Statements; positions
that do not meet this threshold are not recognized. For tax positions that
are at least more likely than not of being sustained upon audit, the largest
amount of the benefit that is more likely than not of being sustained is
recognized in our Consolidated Financial Statements. Upon the adoption
of FIN 48, we recorded a $1.8 million increase in our liability for unrecog-
nized tax benefits that was accounted for as a reduction in our retained
earnings as of July 1, 2007.
We account for income taxes using the asset and liability method. Under
this method, income taxes are provided for amounts currently payable and
for amounts deferred as income tax assets and liabilities based upon differ-
ences between the financial statement carrying amounts and the tax bases
of existing assets and liabilities. Deferred income taxes are measured using
the enacted tax rates that are assumed to be in effect when the differences
reverse. We recognize accrued interest and penalties associated with
uncertain tax positions as part of income tax expense.
Share-Based Compensation
The fair value of each option grant is estimated on the date of grant using
the Black-Scholes option-pricing model with the following weighted-
average assumptions used for grants in fiscal 2008, 2007 and 2006:
2008 2007 2006
Risk-free interest rate 3.3% 4.8% 4.6%Expected life of options (in years) 4.75 5.16 6.13Expected volatility 0.35 0.36 0.37Dividend yield 0.0% 0.0% 0.0%
For fiscal 2008, 2007 and 2006, the expected life of each award granted
was calculated using the “simplified method” in accordance with Staff
Accounting Bulletin (“SAB”) No. 107 and as amended in SAB No. 110. The
expected volatility rate has been calculated based on weekly closing prices
of WMS common shares from July 1, 2003. In accordance with the guidance
in SFAS No. 123 (revised 2004), Share-Based Payment (“SFAS 123R”) we
estimate expected volatility based on the historical realized volatility giving
consideration to how future experience might reasonably be expected to
differ from historical experience. We calculate the historical volatility begin-
ning July 1, 2003, as we believe our stock price volatility prior to that date
would be expected to differ significantly from subsequent stock price
volatility as, prior to July 1, 2003, we focused on resolving issues in our
legacy operating system software, whereas after that date we began
introducing our new operating system, new gaming cabinet and new

7 6 » 7 7 W M S I N D U S T R I E S I N C .2
00
8 a
nn
ua
l r
ep
or
t
game themes, and re-emerging as the business we are today. See Note 12,
“Equity Compensation Plan.” The risk-free interest rate is based on the
implied yield currently available on U.S. Treasury zero coupon issues with a
remaining term that approximates the expected life of the award. Expected
dividend yield is based on historical dividend payments.
Cost of Product Sales, Cost of Gaming Operations and Selling and
Administrative Expenses
Cost of product sales consists primarily of raw materials, labor and over-
head. These components of cost of product sales also include licensing
and royalty charges, inbound and outbound freight charges, purchasing
and receiving costs, inspection costs, and internal transfer costs.
Cost of gaming operations consists primarily of telephone costs, licensing
and royalty charges, wide-area progressive jackpot expenses, gaming
operations taxes and fees and parts.
Selling and administrative expenses consist primarily of sales, marketing,
distribution, installation and corporate support functions such as adminis-
tration, information technology, legal, regulatory compliance, human
resources and finance. The costs of distribution were $20.4 million, $17.2
million and $16.2 million for the fiscal year ended 2008, 2007 and 2006,
respectively.
Use of Estimates
Our Consolidated Financial Statements have been prepared in conformity
with U.S. generally accepted accounting principles. Such preparation
requires us to make estimates and assumptions that affect the amounts
reported in our Consolidated Financial Statements and Notes thereto.
Actual results could differ from those estimates.
Concentrations of Credit Risk
Financial instruments, which potentially subject us to concentrations of
credit and market risk, consist primarily of cash equivalents and accounts
and notes receivable. By policy, we place our cash equivalents only in high
credit quality securities and limit the amounts invested in any one security.
However, our overnight cash balances are held by our main commercial
bank. The accounts and notes receivable are generally from a large num-
ber of customers with no significant concentration other than in the State
of Nevada. No customer accounted for more than 10% of consolidated
revenues in fiscal 2008, 2007 and 2006.
As of June 30, 2008, approximately 18% of our employees are covered by a
collective bargaining agreement which expires on June 30, 2011.
Recently Issued Accounting Standards
In September 2006, the FASB issued SFAS No. 157, Fair Value Measurements
(“SFAS 157”). SFAS 157 defines fair value, establishes a framework for measur-
ing fair value in accordance with generally accepted accounting principles,
and expands disclosures about fair value measurements. SFAS 157 does
not require any new fair value measurements, but provides guidance on
how to measure fair value by providing a fair value hierarchy used to classify
the source of the information. Subsequent to the issuance of SFAS 157, the
FASB issued FASB Staff Position (“FSP”) 157-2 Effective Date of FASB Statement
No. 157 (“FSP 157-2”). FSP 157-2 delays the effective date of SFAS 157 for all
nonfinancial assets and nonfinancial liabilities, except those that are recog-
nized or disclosed at fair value in the financial statements on a recurring
basis. For the instruments subject to the effective date delay under
FSP 157-2, the effective date to adopt the fair value provisions for us will be
July 1, 2009. We will continue to evaluate the impact of the provisions of
SFAS 157 on our Consolidated Financial Statements.
In February 2007, the FASB issued SFAS No. 159, The Fair Value Option
for Financial Assets and Financial Liabilities—including an amendment of
SFAS 115, (“SFAS 159”). SFAS 159 permits entities to choose to measure many
financial instruments and certain other items at fair value that are not
currently required to be measured at fair value. The objective of SFAS 159 is
to reduce both complexity in accounting for financial instruments and the
volatility in earnings caused by measuring related assets and liabilities
using different measurement techniques. The fair value measurement
provisions are elective and can be applied to individual financial instru-
ments. SFAS 159 requires additional disclosures related to the fair value
measurements included in the entity’s financial statements. We are required
to adopt this statement beginning July 1, 2008 and we currently expect no
material impact from the provisions of SFAS 159 on our Consolidated
Financial Statements.
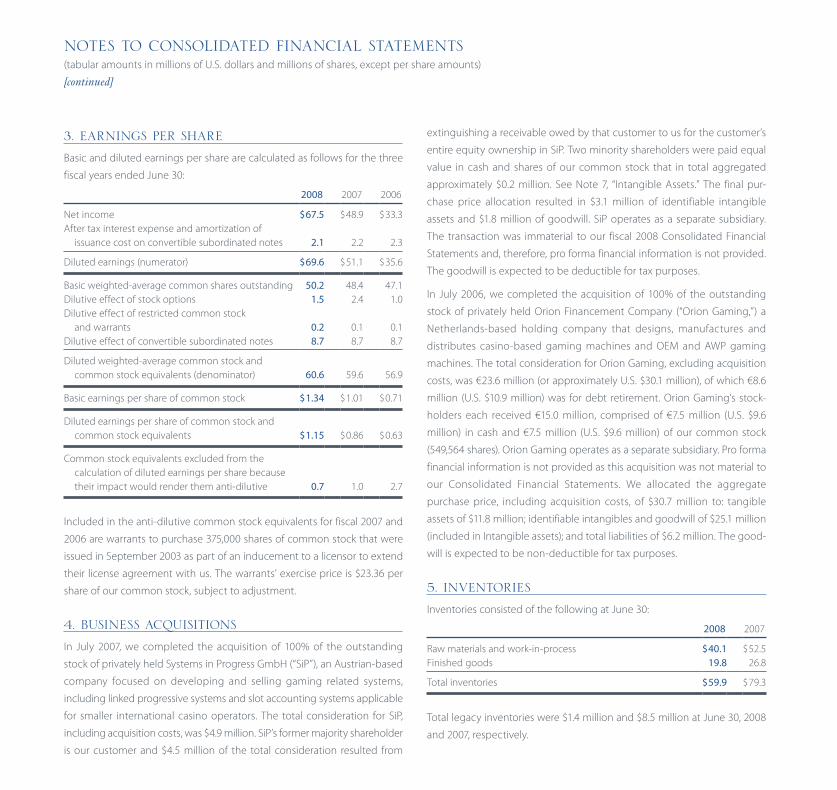
NOTES TO CONSOLIDATED FINANCIAL STATEMENTS (tabular amounts in millions of U.S. dollars and millions of shares, except per share amounts)
[continued]
3. EARNINgS PER SHARE
Basic and diluted earnings per share are calculated as follows for the three
fiscal years ended June 30:
2008 2007 2006
Net income $ 67.5 $ 48.9 $ 33.3After tax interest expense and amortization of issuance cost on convertible subordinated notes 2.1 2.2 2.3
Diluted earnings (numerator) $ 69.6 $ 51.1 $ 35.6
Basic weighted-average common shares outstanding 50.2 48.4 47.1Dilutive effect of stock options 1.5 2.4 1.0Dilutive effect of restricted common stock and warrants 0.2 0.1 0.1Dilutive effect of convertible subordinated notes 8.7 8.7 8.7
Diluted weighted-average common stock and common stock equivalents (denominator) 60.6 59.6 56.9
Basic earnings per share of common stock $ 1.34 $ 1.01 $ 0.71
Diluted earnings per share of common stock and common stock equivalents $ 1.15 $ 0.86 $ 0.63
Common stock equivalents excluded from the calculation of diluted earnings per share because their impact would render them anti-dilutive 0.7 1.0 2.7
Included in the anti-dilutive common stock equivalents for fiscal 2007 and
2006 are warrants to purchase 375,000 shares of common stock that were
issued in September 2003 as part of an inducement to a licensor to extend
their license agreement with us. The warrants’ exercise price is $23.36 per
share of our common stock, subject to adjustment.
4. BUSINESS ACQUISITIONS
In July 2007, we completed the acquisition of 100% of the outstanding
stock of privately held Systems in Progress GmbH (“SiP”), an Austrian-based
company focused on developing and selling gaming related systems,
including linked progressive systems and slot accounting systems applicable
for smaller international casino operators. The total consideration for SiP,
including acquisition costs, was $4.9 million. SiP’s former majority shareholder
is our customer and $4.5 million of the total consideration resulted from
extinguishing a receivable owed by that customer to us for the customer’s
entire equity ownership in SiP. Two minority shareholders were paid equal
value in cash and shares of our common stock that in total aggregated
approximately $0.2 million. See Note 7, “Intangible Assets.” The final pur-
chase price allocation resulted in $3.1 million of identifiable intangible
assets and $1.8 million of goodwill. SiP operates as a separate subsidiary.
The transaction was immaterial to our fiscal 2008 Consolidated Financial
Statements and, therefore, pro forma financial information is not provided.
The goodwill is expected to be deductible for tax purposes.
In July 2006, we completed the acquisition of 100% of the outstanding
stock of privately held Orion Financement Company (“Orion Gaming,”) a
Netherlands-based holding company that designs, manufactures and
distributes casino-based gaming machines and OEM and AWP gaming
machines. The total consideration for Orion Gaming, excluding acquisition
costs, was €23.6 million (or approximately U.S. $30.1 million), of which €8.6
million (U.S. $10.9 million) was for debt retirement. Orion Gaming’s stock-
holders each received €15.0 million, comprised of €7.5 million (U.S. $9.6
million) in cash and €7.5 million (U.S. $9.6 million) of our common stock
(549,564 shares). Orion Gaming operates as a separate subsidiary. Pro forma
financial information is not provided as this acquisition was not material to
our Consolidated Financial Statements. We allocated the aggregate
purchase price, including acquisition costs, of $30.7 million to: tangible
assets of $11.8 million; identifiable intangibles and goodwill of $25.1 million
(included in Intangible assets); and total liabilities of $6.2 million. The good-
will is expected to be non-deductible for tax purposes.
5. INVENTORIES
Inventories consisted of the following at June 30:
2008 2007
Raw materials and work-in-process $ 40.1 $ 52.5Finished goods 19.8 26.8
Total inventories $ 59.9 $ 79.3
Total legacy inventories were $1.4 million and $8.5 million at June 30, 2008
and 2007, respectively.

7 8 » 7 9 W M S I N D U S T R I E S I N C .2
00
8 a
nn
ua
l r
ep
or
t
6. gAMINg OPERATIONS EQUIPMENT AND PROPERTY, PLANT AND EQUIPMENT
The components of Gaming operations equipment were as follows at
June 30:
2008 2007
Gaming operations equipment $ 245.3 $ 219.3Less accumulated depreciation (169.9) (129.3)
Net gaming operations equipment $ 75.4 $ 90.0
The components of Property, plant and equipment were as follows at
June 30:
2008 2007
Land $ 11.3 $ 5.2Buildings and improvements 59.5 43.5Machinery and equipment 88.0 71.4Furniture and fixtures 14.3 10.1Construction in process 24.8 19.6
197.9 149.8Less accumulated depreciation (72.2) (57.9)
Net property, plant and equipment $ 125.7 $ 91.9
7. INTANgIBLE ASSETS
Goodwill
The changes in the carrying amount of goodwill during fiscal 2008 include:
Goodwill balance at June 30, 2007 $17.4Impact of SiP acquisition 1.8Foreign currency translation adjustment 2.7
Goodwill balance at June 30, 2008 $21.9
Other Intangible Assets
The following table summarizes additions to other intangible assets during
fiscal 2008. Other additions include capitalized legal costs and expendi-
tures to third parties.
Business Other TotalCombination Additions Additions
Finite lived intangibles: Royalty advances for licensed brands and other $ — $11.6 $11.6 Licensed or acquired technologies 3.1 3.3 6.4 Patents — 4.3 4.3 Customer relationships — — — Trademarks — 0.3 0.3
Total $3.1 $19.5 $22.6
Indefinite lived intangibles: Acquired brand names $ — $ — $ —
Additions to royalty advances and licensed or acquired technologies have
a weighted-average life of 5.3 years. Technologies acquired as part of a
business combination will be amortized over a period of five years. A
majority of the other patent additions pertain to unissued patent applica-
tions and we anticipate that a majority of these patents will be amortized
over four to seventeen years beginning in approximately July 2009.
Certain of our intangible assets are denominated in foreign currency and,
as such, include the effects of foreign currency translation.

NOTES TO CONSOLIDATED FINANCIAL STATEMENTS (tabular amounts in millions of U.S. dollars and millions of shares, except per share amounts)
[continued]
Other intangible assets consisted of the following as of June 30:
2008 2007
Accumulated AccumulatedCost Amortization Net Cost Amortization Net
Finite lived intangible assets: Royalty advances for licensed brands and other $ 72.9 $(37.6) $ 35.3 $ 65.5 $(31.5) $ 34.0 Licensed or acquired technologies 39.2 (7.4) 31.8 35.1 (2.4) 32.7 Patents 18.5 (2.1) 16.4 14.4 (0.9) 13.5 Customer relationships 5.2 (1.7) 3.5 4.4 (0.7) 3.7 Trademarks 0.9 (0.3) 0.6 0.7 (0.1) 0.6
Total $ 136.7 $(49.1) $ 87.6 $ 120.1 $(35.6) $ 84.5
Indefinite lived intangible assets: Acquired brand names $ 3.6 $ — $ 3.6 $ 3.0 $ — $ 3.0
General
The following table reconciles Goodwill and Other intangible assets
presented above to Intangible assets recorded on our Consolidated Balance
Sheets at June 30:
2008 2007
Goodwill $ 21.9 $ 17.4Finite lived intangible assets, net 87.6 84.5Indefinite lived intangible assets 3.6 3.0Less: royalty advances and licensed or acquired technologies, short-term (6.8) (7.9)
Total intangible assets $ 106.3 $ 97.0
Amortization expense for royalty advances and licensed or acquired tech-
nologies, patents and trademarks was $19.9 million, $13.3 million and $8.7
million for fiscal 2008, 2007 and 2006, respectively. Fiscal 2008 includes a
$3.7 million pre-tax write-down to net realizable value of a technology
license. If all of our remaining licensed or required technologies were to have
no further value to us, we would record a charge of up to $31.8 million.
The estimated aggregate amortization expense for finite lived intangible
assets for each of the next five years is as follows:
Year ended June 30,
2009 $ 8.22010 7.02011 10.42012 10.32013 10.5
The estimated aggregate future intangible amortization as of June 30, 2008
does not reflect the significant commitments we have for future payments
for royalty advances and licensed or acquired technologies. See Note 13,
“Commitments, Contingencies and Indemnifications.”

8 0 » 8 1 W M S I N D U S T R I E S I N C .2
00
8 a
nn
ua
l r
ep
or
t
8. OTHER ACCRUED LIABILITIES
The components of other accrued liabilities were as follows at June 30:
2008 2007
Accrued WAP jackpot liability $11.3 $11.6Current income taxes payable 9.2 1.0Accrued royalties and licensing fees 7.8 6.5Accrued common stock repurchase 5.0 —Other accrued liabilities 13.7 11.3
Total other accrued liabilities $47.0 $30.4
9. INCOME TAXES
The following is a summary of income before income taxes of U.S. and
international operations for the fiscal years ended June 30:
2008 2007 2006
United States $ 106.1 $69.4 $ 48.0International (0.5) 2.3 1.2
Total $ 105.6 $71.7 $ 49.2
Significant components of the provision for income taxes were as follows
for the fiscal years ended June 30:
2008 2007 2006
Current: Federal $ 32.2 $ 12.4 $ 17.1 State 3.7 1.0 1.2 Foreign 0.4 1.1 0.2
Total current 36.3 14.5 18.5Deferred: Federal (6.1) (0.2) (2.7) State (0.5) (0.4) (0.6) Foreign (0.4) — (0.5)
Total deferred (7.0) (0.6) (3.8)Tax benefit from exercise of stock options 8.8 8.9 1.2
Income tax provision, net $ 38.1 $ 22.8 $ 15.9
Deferred income taxes reflect the net tax effects of temporary differences
between the amount of assets and liabilities for financial reporting purposes
and the amounts used for income tax purposes. Significant components of
our deferred income tax assets and liabilities at June 30 were:
2008 2007
Deferred income tax assets resulting from: Current: Receivables valuation $ 1.2 $ 0.8 Inventory valuation 2.5 3.4 Accrued liabilities and other items not currently deductible 3.6 5.2
Total current deferred income tax assets 7.3 9.4 Non-current: Share-based payment expense 10.8 6.7 Book over tax depreciation 20.7 13.0 Other non-current 3.4 0.2
Total non-current deferred income tax assets 34.9 19.9
Deferred tax liabilities resulting from: Capitalized regulatory approval and software development costs (8.1) (4.5) Capitalized patents and trademarks (8.1) (4.9)
Total non-current deferred income tax liabilities (16.2) (9.4)
Total net deferred income tax assets $ 26.0 $ 19.9
No deferred tax provision has been recorded for United States taxes related
to approximately $11.1 million of undistributed earnings of certain foreign
subsidiaries, which are considered to be permanently reinvested.
Determination of the deferred income tax liability on these unremitted
earnings is not practicable because such liability, if any, is dependent on
circumstances existing if and when the remittance occurs.
In assessing the realizability of deferred tax assets, management considers
whether it is more likely than not that some portion or all of the deferred
tax assets will not be realized. The ultimate realization of deferred tax assets
is dependent upon the generation of future taxable income during the
periods in which those temporary differences become deductible.
Management considers the scheduled reversal of deferred tax liabilities,
projected future taxable income, and tax planning strategies in making
this assessment.

NOTES TO CONSOLIDATED FINANCIAL STATEMENTS (tabular amounts in millions of U.S. dollars and millions of shares, except per share amounts)
[continued]
The provision for income taxes differs from the amount computed using
the statutory United States Federal income tax rate as follows for the fiscal
years ended June 30:
2008 2007 2006
Statutory Federal income tax rate 35.0% 35.0% 35.0%State income taxes, net of Federal benefit 2.9 2.8 2.9Manufacturer’s deduction (1.7) (0.7) (1.3)Research and development tax credits (1.4) (4.1) (2.0)Permanent items 0.5 0.5 0.8Change of prior years’ taxes 0.9 (0.2) (0.4)Export sales deductions — (0.8) (1.7)Reversal of valuation allowance, primarily relating to South African losses — — (1.2)Other, net (0.1) (0.7) 0.2
Effective tax rate 36.1% 31.8% 32.3%
Effective July 1, 2007, we adopted FIN 48. Under FIN 48, the benefits of tax
positions that are more likely than not of being sustained upon audit based
on the technical merits of the tax position are recognized in our Consoli-
dated Financial Statements; positions that do not meet this threshold are
not recognized. For tax positions that are at least more likely than not of
being sustained upon audit, the largest amount of the benefit that is more
likely than not of being sustained is recognized in our Consolidated
Financial Statements. Upon the adoption of FIN 48, we recorded a $1.8
million increase in our liability for unrecognized tax benefits that was
accounted for as a reduction in our retained earnings as of July 1, 2007. The
reconciliation of the beginning and ending gross unrecognized tax bene-
fits, excluding accrued interest and penalties of $0.6 million, is as follows:
Balance at July 1, 2007—date of adoption $ 5.2Additions related to prior year tax positions —Reductions related to prior year tax positions (0.2)Additions related to current year positions 0.8Reductions due to settlements and payments —Reductions due to lapse of statute —
Balance at June 30, 2008 $ 5.8
Of the total unrecognized tax benefits, including accrued interest and pen-
alties of $0.6 million, $6.2 million (net of the federal benefit) represents the
portion that, if recognized, would reduce the effective tax rate. Of this total,
$0.3 million of interest and penalties was recorded in our Consolidated
Statements of Income for the year ended June 30, 2008. We file tax returns
in various jurisdictions and do not anticipate a significant change in the
amount of unrecognized tax benefits within the next twelve months.
We, or one of our subsidiaries, files income tax returns in the U.S. federal,
various state, local and foreign jurisdictions. We are no longer subject to
any significant U.S. federal, state, local or foreign income tax examinations
by tax authorities for years before fiscal 2004.
10. CONVERTIBLE SUBORDINATED NOTES AND REVOLVINg CREDIT FACILITY
Convertible Subordinated Notes
At June 30, 2008, we had $115 million of convertible subordinated notes
outstanding, bearing interest at 2.75% maturing on July 15, 2010. The notes
are exchangeable at any time into an aggregate of 8.7 million shares of our
common stock at a conversion price of $13.19 per share, subject to adjust-
ment. The notes are subordinated in right of payment to all existing and
future senior debt and are effectively subordinated to all of the indebted-
ness and liabilities of our subsidiaries. The notes are not callable. We pay
interest on the notes semi-annually on January 15 and July 15 of each year,
aggregating $3.2 million annually. The conversion of the 2.75% convertible
subordinated notes to common stock is dependent on individual holders’
choices to convert, which is dependent on the spread of the market price
of our stock above the conversion strike price of $13.19 per share, and such
conversion would reduce our annual interest expense. None of the holders
have converted any of their convertible subordinated notes into our
common stock. Our convertible notes are conventional convertible debt
instruments in which the holder may only realize the value of the conver-
sion option by exercising the option and receiving a fixed number of shares
of our common stock.

8 2 » 8 3 W M S I N D U S T R I E S I N C .2
00
8 a
nn
ua
l r
ep
or
t
As of June 30, 2008, the fair value of the convertible subordinated notes
was $259.6 million. The fair value of our convertible fixed rate debt is signifi-
cantly dependent on the market price of our common stock into which it
can be converted.
We have no maturities of debt or sinking fund requirements through
June 30, 2010.
Revolving Credit Facility
We have a multi-year revolving credit agreement, as amended, that
provides for $100 million of unsecured borrowing through December 31,
2009, including the potential to expand the line up to $125 million. Up to
$10 million of the credit facility is available for the issuance of letters of
credit. The credit agreement requires that we maintain certain financial
ratios, which could limit our ability to acquire companies, declare dividends
or make any distribution to holders of any shares of capital stock, or pur-
chase or otherwise acquire such shares of our common stock. At June 30,
2008, approximately $103.4 million was available for such purposes under
the most restrictive of these covenants. On June 30, 2008, we amended
our revolving credit agreement to allow for an increase in annual capital
expenditures over the life of the agreement. No amounts were outstanding
under the revolving credit facility as of June 30, 2008 and 2007.
11. STOCKHOLDERS’ EQUITY
General
Our authorized common stock consists of 100.0 million shares at $0.50 par
value. Additionally, we have 5.0 million shares of $0.50 par value preferred
stock authorized. The preferred stock is issuable in series, and the relative
rights and preferences and the number of shares in each series are to be
established by our Board of Directors.
Common Stock Repurchase Program
During the fiscal year ended June 30, 2008, we purchased 1,208,971 shares
of our common stock for approximately $40 million at an average cost of
$33.08 per share. On August 4, 2008, our Board of Directors authorized the
repurchase of an additional $100 million of our common stock over the
following twenty-four months. See Note 19, “Subsequent Events.” As of
June 30, 2008, prior to such authorization increase, we had approximately
$10 million available under the then existing program.
12. EQUITY COMPENSATION PLAN
General
We currently have one equity compensation plan under which new grants
may be made: our Amended and Restated 2005 Incentive Plan (the “Plan”),
which was originally approved by our stockholders in fiscal 2005 and
approved, as amended, in fiscal 2007. The Plan consolidated shares avail-
able under our previous stock option plans into the new Plan, although
outstanding equity grants under the previous plans are still governed by
those individual plans. The Plan permits us to grant options to purchase
shares of our common stock, restricted stock, and other stock awards.
Options may be granted as incentive stock options, designed to meet the
requirements of Section 422 of the Internal Revenue Code or they may be
“non-qualified” options that do not meet the requirements of that section.
The Compensation Committee of our Board of Directors determines, or at
times recommends to the Board: which of the eligible directors, officers,
employees, consultants and advisors receive equity awards; the terms,
including any vesting periods or performance requirements of the awards;
and the size of the awards. The non-employee members of our Board of
Directors determine any award made to non-employee directors.
We issue new shares and shares from treasury for shares delivered under
the Plan. The parameters of our share repurchase activity are not estab-
lished solely with reference to the dilutive impact of deliveries made under
the Plan. However, we expect that, over time, share purchases may partially
offset the dilutive impact of deliveries to be made under the Plan.
A maximum of 12.8 million shares were authorized for awards under our
plans. As of June 30, 2008, 2.4 million shares of common stock remained
available for possible future issuance under our Plan.
The purpose of the Plan is to encourage our employees, non-employee
directors, consultants and advisors to acquire an ownership interest in our
common stock and to enable these individuals to realize benefits from an
increase in the value of our common stock. We believe that this benefit

NOTES TO CONSOLIDATED FINANCIAL STATEMENTS (tabular amounts in millions of U.S. dollars and millions of shares, except per share amounts)
[continued]
provides these individuals with greater incentive to work to improve our
business and encourages their continued provision of services to us and,
generally, promotes our interests and those of our stockholders.
A summary of information with respect to share-based compensation is as
follows, for the fiscal years ended June 30:
2008 2007 2006
Share-based compensation expense included in pre-tax income $ 15.2 $ 12.4 $ 12.2Income tax benefit related to share-based compensation (5.8) (4.7) (4.6)
Share-based compensation expense included in net income $ 9.4 $ 7.7 $ 7.6
Diluted earnings per share impact of share-based compensation expense $ 0.16 $ 0.13 $ 0.13
Stock Options
Pursuant to the Plan, for stock options, the exercise price per share with
respect to each option is determined by the Compensation Committee
and is not less than the fair market value of our common stock on the date
on which the stock option is granted. The Plan has a term of 10 years,
unless terminated earlier, and stock options granted under the Plan prior to
December 2006 have terms up to 10 years, whereas stock options granted
under the Plan beginning in December 2006 have terms up to 7 years.
Vesting generally occurs equally over one to four years on the grant-date
anniversary. Compensation expense is recognized on a straight-line basis
over the requisite service period for each separately vesting portion of the
award. On occasion, we may issue stock options that immediately vest, in
which case compensation expense equal to the total fair value of the
option grant is immediately recognized. Stock option activity was as follows
for fiscal 2008:
Weighted-Weighted- Average
Average RemainingNumber Exercise Contractual Aggregateof Stock Price per Term IntrinsicOptions Share (in years) Value(1)
Stock options outstanding at June 30, 2007 5.3 $18.16 Granted 0.7 32.29 Exercised (1.3) 16.41 Expired or Cancelled — — Forfeited (0.1) 24.45
Stock options outstanding at June 30, 2008 4.6 $20.53 6.1 $44.2
Stock options exercisable at June 30, 2008 2.8 $17.93 5.7 $33.7
(1) Intrinsic value is defined as the amount by which the fair value of the underlying stock exceeds the exercise price of a stock option.

8 4 » 8 5 W M S I N D U S T R I E S I N C .2
00
8 a
nn
ua
l r
ep
or
t
Other information pertaining to stock options was as follows for the years
ended June 30:
2008 2007 2006
Weighted-average grant-date fair value per share of stock options granted $10.73 $8.40 $7.97Total grant-date fair value of stock options vested 8.3 7.9 8.2Total intrinsic value of stock options exercised 23.4 23.0 3.1
For fiscal 2008, 2007 and 2006, cash received from the exercise of stock
options was $21.0 million, $26.7 million and $4.2 million, respectively, and the
income tax benefit realized from exercise of stock options was $8.8 million,
$8.9 million and $1.2 million, respectively. As of June 30, 2008, there was
$8.6 million of total stock option compensation expense related to
nonvested stock options not yet recognized, which is expected to be
recognized over a weighted-average period of 2.6 years.
In fiscal 2005, the Board of Directors approved a Director Emeritus Program
for directors who reach age 75 or have served on the Board of Directors for
at least 20 years. The Director Emeritus Program is being phased in to
maintain continuity and avoid losing the benefit of valuable experience.
For fiscal 2008, 2007 and 2006, 37,500, 37,500 and 37,500, respectively, fully
vested five-year stock options were issued to three directors emeritus upon
their retirement from the Board.
Restricted Stock Grants
Upon the recommendation of our Compensation Committee, our Board of
Directors has, on occasion, granted restricted stock to our employees,
officers, or directors to motivate them to devote their full energies to our
success, to reward them for their services and to align their interests with
the interests of our stockholders.
Under the Plan, participants may be granted restricted stock, representing
an unfunded, unsecured right, which is nontransferable except in the event
of death of the participant, to receive shares of our common stock on the
date specified in the participant’s award agreement. The restricted stock
granted under this plan is subject to vesting generally occurring equally
over three to five years on the grant-date anniversary. Compensation
expense is recognized on a straight-line basis over the vesting period for
the entire award. Restricted stock activity was as follows:
Weighted-Average
Restricted Grant-Stock Date Fair
Shares Value(1)
Nonvested balance at June 30, 2007 0.3 $23.09 Granted 0.2 30.65 Vested (0.2) 21.75
Nonvested balance at June 30, 2008 0.3 $27.60
(1) For restricted stock, grant-date fair value is equal to the closing market price of a share of our common stock on the grant date.
As of June 30, 2008, there was $6.8 million of total restricted share compen-
sation expense related to nonvested awards not yet recognized, which is
expected to be recognized over a weighted-average period of 2.6 years.
Equity-Based Performance Units
As of June 30, 2008, there were 267,311 equity-based performance units
outstanding with a weighted-average grant-date fair value per unit of
$21.50. The equity-based performance units contain performance goals set
by the Board of Directors based on certain performance criteria over the
following periods: thirty-six month period ending June 30, 2009 for 177,400
units and thirty-six month period ending June 30, 2010 for 89,911 units. The
number of shares of stock to be awarded to participants is dependent
upon the achievement of the performance goals and the extent to which
each goal is achieved or exceeded, requires a minimum threshold perfor-
mance before any shares are issued and can result in shares issued up to
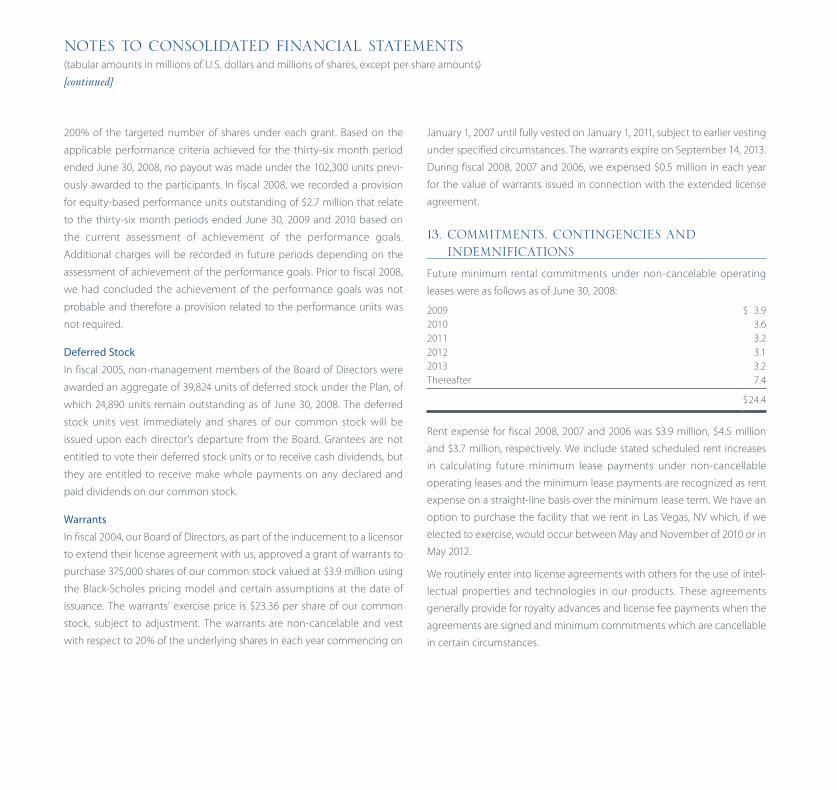
200% of the targeted number of shares under each grant. Based on the
applicable performance criteria achieved for the thirty-six month period
ended June 30, 2008, no payout was made under the 102,300 units previ-
ously awarded to the participants. In fiscal 2008, we recorded a provision
for equity-based performance units outstanding of $2.7 million that relate
to the thirty-six month periods ended June 30, 2009 and 2010 based on
the current assessment of achievement of the performance goals.
Additional charges will be recorded in future periods depending on the
assessment of achievement of the performance goals. Prior to fiscal 2008,
we had concluded the achievement of the performance goals was not
probable and therefore a provision related to the performance units was
not required.
Deferred Stock
In fiscal 2005, non-management members of the Board of Directors were
awarded an aggregate of 39,824 units of deferred stock under the Plan, of
which 24,890 units remain outstanding as of June 30, 2008. The deferred
stock units vest immediately and shares of our common stock will be
issued upon each director’s departure from the Board. Grantees are not
entitled to vote their deferred stock units or to receive cash dividends, but
they are entitled to receive make whole payments on any declared and
paid dividends on our common stock.
Warrants
In fiscal 2004, our Board of Directors, as part of the inducement to a licensor
to extend their license agreement with us, approved a grant of warrants to
purchase 375,000 shares of our common stock valued at $3.9 million using
the Black-Scholes pricing model and certain assumptions at the date of
issuance. The warrants’ exercise price is $23.36 per share of our common
stock, subject to adjustment. The warrants are non-cancelable and vest
with respect to 20% of the underlying shares in each year commencing on
January 1, 2007 until fully vested on January 1, 2011, subject to earlier vesting
under specified circumstances. The warrants expire on September 14, 2013.
During fiscal 2008, 2007 and 2006, we expensed $0.5 million in each year
for the value of warrants issued in connection with the extended license
agreement.
13. COMMITMENTS, CONTINgENCIES AND INDEMNIFICATIONS
Future minimum rental commitments under non-cancelable operating
leases were as follows as of June 30, 2008:
2009 $ 3.92010 3.62011 3.22012 3.12013 3.2Thereafter 7.4
$ 24.4
Rent expense for fiscal 2008, 2007 and 2006 was $3.9 million, $4.5 million
and $3.7 million, respectively. We include stated scheduled rent increases
in calculating future minimum lease payments under non-cancellable
operating leases and the minimum lease payments are recognized as rent
expense on a straight-line basis over the minimum lease term. We have an
option to purchase the facility that we rent in Las Vegas, NV which, if we
elected to exercise, would occur between May and November of 2010 or in
May 2012.
We routinely enter into license agreements with others for the use of intel-
lectual properties and technologies in our products. These agreements
generally provide for royalty advances and license fee payments when the
agreements are signed and minimum commitments which are cancellable
in certain circumstances.
NOTES TO CONSOLIDATED FINANCIAL STATEMENTS (tabular amounts in millions of U.S. dollars and millions of shares, except per share amounts)
[continued]

8 6 » 8 7 W M S I N D U S T R I E S I N C .2
00
8 a
nn
ua
l r
ep
or
t
At June 30, 2008, we had total royalty and license fee commitments,
advances and payments made and potential future royalty and license fee
payments as follows:
MinimumCommitments
Total royalty and license fee commitments, including contingent payments of $3.2 million $ 130.0Advances and payments made (109.0)
Potential future payments, including contingent payments of $3.2 million $ 21.0
See Note 7, “Intangible Assets” for the related assets that are recorded on
our Consolidated Balance Sheets.
As of June 30, 2008, we estimate that potential future royalty payments in
each fiscal year will be as follows:
MinimumCommitments
2009 $ 9.62010 5.62011 5.32012 0.42013 0.1Thereafter —
Total $21.0
Indemnifications
We have agreements in which we may be obligated to indemnify other
parties with respect to certain matters. Generally, these indemnification
provisions are included in sales orders and agreements arising in the
normal course of business under which we customarily agree to hold the
indemnified party harmless against claims arising from a breach of
representations related to matters such as title to assets sold and licensed,
defective equipment or certain intellectual property rights. Payments by
us under such indemnification provisions are generally conditioned on the
other party making a claim. Such claims are typically subject to challenge
by us and to dispute resolution procedures specified in the particular sales
order or contract. Further, our obligations under these agreements may be
limited in terms of time and/or amount and, in some instances, we may
have recourse against third parties. It is not possible to predict the maxi-
mum potential amount of future payments under these indemnification
agreements due to the conditional nature of the obligations and the
unique facts of each particular agreement. Historically, we have not made
any payments under these agreements that have been material individu-
ally or in the aggregate. As of June 30, 2008, we were not aware of any
obligations arising under indemnification agreements that would require
material payments, except for the matter disclosed in Note 14, “Litigation.”
We have agreements with our directors and certain officers that require us,
among other things, to indemnify them against certain liabilities that may
arise by reason of their status or service as directors or officers. We have
also agreed to indemnify certain former officers and directors of acquired
companies. We maintain director and officer insurance, which may cover
our liabilities arising from these indemnification obligations in certain
circumstances. As of June 30, 2008, we were not aware of any obligations
arising under these agreements that would require material payments.
Performance Bonds
We have performance bonds outstanding of $1.0 million at June 30, 2008
to one customer related to product sales, and we are liable to the issuer in
the event of exercise due to our non-performance under the contract.
Events of non-performance do not include the financial performance of
our products.

NOTES TO CONSOLIDATED FINANCIAL STATEMENTS (tabular amounts in millions of U.S. dollars and millions of shares, except per share amounts)
[continued]
Self-Insurance
We are self-insured for various levels of workers’ compensation, electronic
errors and omissions liability, automobile collision insurance, as well as
employee medical, dental, prescription drug and disability coverage.
We purchase stop-loss coverage to protect against unexpected claims.
Accrued insurance claims and reserves include estimated settlements for
known claims, and estimates of claims incurred but not reported.
14. LITIgATION
On October 2, 2003, La Societe de Loteries du Quebec (“Loto-Quebec”)
filed claims against us and Video Lottery Consultants Inc., a subsidiary of
IGT (“VLC”) in the Superior Court of the Province of Quebec, Quebec City
District (200-06-000017-015). The pleadings allege that Loto-Quebec would
be entitled to be indemnified by the manufacturers of Loto-Quebec’s VLTs,
specifically WMS and VLC, if the class action plaintiffs, described below, are
successful in the pending class action lawsuit against Loto-Quebec. In July
2008, we entered into a settlement agreement with Loto-Quebec under
which Loto-Quebec agreed to suspend the action in warranty against us in
exchange for our agreement to continue cooperating with the defense of
the class action lawsuit against Loto-Quebec and, in the event of an
adverse outcome in such lawsuit against Loto-Quebec, to arbitration of
any warranty claim by Loto-Quebec. The settlement agreement reserves
all of our defenses against Loto-Quebec.
The class action lawsuit discussed in Loto-Quebec’s claim was brought on
May 18, 2001 against Loto-Quebec in the Superior Court of the Province of
Quebec. It alleges that the members of the class developed a pathological
gambling addiction by using Loto-Quebec’s VLTs and that Loto-Quebec, as
owner, operator and distributor of VLTs, failed to warn players of the alleged
dangers associated with VLTs. Spielo Manufacturing Inc., another manufac-
turer of VLTs, voluntarily intervened to support Loto-Quebec’s position.
Class status was granted by the Court on May 6, 2002, authorizing Jean
Brochu to act as the representative plaintiff. The class, which is currently
undetermined, but potentially comprising more than 119,000 members, is
requesting damages totaling almost $700 million Canadian dollars, plus
interest. The trial is set to begin in September 2008. It is too early to assess
the outcome of these actions and to determine whether any further
claim will be pursued by Loto-Quebec under the terms of our settlement
agreement.
15. INFORMATION ON gEOgRAPHIC AREAS
Revenues derived from customers in the United States accounted for
approximately 76%, 75% and 79% of our total revenues for the fiscal years
ended June 30, 2008, 2007 and 2006, respectively. The United States had
more than 90% of our total long-lived assets as of June 30, 2008, 2007 and
2006. No other country in which we conduct business had greater than
10% of our total revenues or long-lived assets for the periods presented.
Geographic revenue information is determined by country of destination.
Our operations outside the United States include: gaming operations
equipment located in Canada, Europe and South Africa; sales and distribu-
tion offices in Argentina, Austria, Canada, China, Italy, South Africa, Spain
and the United Kingdom; a sales, distribution and production facility in the
Netherlands; and game development studios in Australia, the Netherlands
and the United Kingdom. Substantially all of our revenues from customers
outside the United States are denominated in U.S. dollars. At June 30, 2008,
2007 and 2006, 27.3%, 21.6% and 37.1%, respectively, of trade accounts and
notes receivable were from customers located outside of the United States.

8 8 » 8 9 W M S I N D U S T R I E S I N C .2
00
8 a
nn
ua
l r
ep
or
t
16. RETIREMENT PLANS
We sponsor 401(k) defined contribution plans within the United States. The
plans cover full-time employees and provide for our contributions of up to
4.5 percent of covered employees’ compensation as defined in the plan.
Our expense for the defined contribution plans totaled $3.7 million, $2.6
million and $2.3 million in fiscal 2008, 2007 and 2006, respectively.
We have two frozen defined benefit pension plans related to previously
discontinued operations. Pension expense for these plans was not signifi-
cant in the aggregate. In September 2006, the FASB issued SFAS No. 158,
Employers’ Accounting for Defined Benefit Pension and Other Postretirement
Plans—an amendment of FASB Statements No. 87, 88, 106, and 132(R). This
statement requires an employer to recognize the over-funded or under-
funded status of a defined benefit and postretirement plan as an asset or
liability in its statement of financial position and to recognize changes in
that funded status in the year in which the changes occur through com-
prehensive income. The adoption of SFAS No. 158 had no material effect
on our net income or cash flows.
17. SUPPLEMENTAL DISCLOSURE OF CASH FLOW INFORMATION
Additional cash flow information was as follows for the fiscal years ended
June 30:
2008 2007 2006
Income taxes paid $21.9 $15.5 $17.4Interest paid 3.4 3.4 3.2Gaming operations equipment transferred to inventory 1.9 4.4 4.8
18. HURRICANE DAMAgE
During the September 2005 quarter, two hurricanes devastated the Gulf
Coast of Louisiana and Mississippi, which affected our facilities and our cus-
tomers’ facilities. We reopened our Gulfport facility in November 2005, but
incurred, and continue to incur hurricane-related revenue loss. Historically,
our participation revenue per day in the Mississippi and Louisiana markets
is over 40% higher than our overall average.
We carry both property and business interruption insurance. We expect
damage to our leased facility in Gulfport to be covered by our property
insurance, after the deductible. In fiscal 2005, we received the first property
insurance payment from the insurance company. We have assessed the
usability of the inventory and participation gaming machines damaged in
our Gulfport facility and added damaged items to our property claim.
The property insurance carries a deductible that was expensed in fiscal
2005. There is no deductible for the business interruption insurance and
this coverage began 48 hours after elected officials ordered the evacuation
of the areas. During fiscal 2006, we received business interruption insur-
ance proceeds of $1.0 million, representing an initial reimbursement for
losses arising from Hurricane Katrina, which we recorded in interest and
other income, net on our Consolidated Statements of Income. We began
litigation against the insurance company in the Mississippi courts in the
September 2006 quarter. We continue to pursue our insurance claims, but
cannot presently estimate the amount or timing of any additional payment,
or the results of any litigation. We have not recorded and will not record
any amount for unreimbursed business interruption claims until an agree-
ment is reached with our insurer as to the amount of the recovery.
19. SUBSEQUENT EVENTS
Share Repurchase Authorization
On August 4, 2008, our Board of Directors authorized the repurchase of an
additional $100 million of our common stock over the following twenty-
four months. This authorization increases the existing program, previously
authorized on August 6, 2007, from $50 million to $150 million and, as of
August 26, 2008, we have a total open authorization of approximately $107
million. Pursuant to the authorization, purchases may be made from time
to time in the open market, through block purchases or in privately negoti-
ated transactions. The timing and actual number of shares repurchased
will depend on market conditions.

20. QUARTERLY FINANCIAL INFORMATION (UNAUDITED)
Summarized quarterly financial information is as follows for fiscal 2008 and 2007:
Sept. 30 Dec. 31 Mar. 31 June 302007 2007 2008 2008
Fiscal 2008 QuartersRevenues $132.5 $159.2 $172.8 $185.6Gross profit, excluding depreciation expense 79.6 93.5 101.4 111.7Net income 11.1 16.0 18.8 21.6Earnings per share: Basic $ 0.22 $ 0.32 $ 0.37 $ 0.43
Diluted $ 0.19 $ 0.27 $ 0.32 $ 0.36
Weighted-average common shares: Basic 49.8 50.2 50.5 50.5
Diluted 60.8 61.0 60.9 60.8
Sept. 30 Dec. 31 Mar. 31 June 302006 2006 2007 2007
Fiscal 2007 QuartersRevenues $ 110.6 $ 134.6 $ 136.6 $ 158.0Gross profit, excluding depreciation expense 62.6 73.5 77.7 91.2Net income 7.1 12.2 12.9 16.7Earnings per share: Basic $ 0.15 $ 0.25 $ 0.26 $ 0.34
Diluted $ 0.13 $ 0.22 $ 0.23 $ 0.29
Weighted-average common shares: Basic 47.6 48.0 49.1 49.5
Diluted 57.5 58.7 59.6 60.3
NOTES TO CONSOLIDATED FINANCIAL STATEMENTS (tabular amounts in millions of U.S. dollars and millions of shares, except per share amounts)
[continued]
The June 2008 quarter includes a $2.3 million after-tax, or $.04 per diluted
share, impact to write down to net realizable value a licensed technology.
The September 2007 and December 2007 quarters include tax benefits
arising from research and development tax credit legislation which expired
December 31, 2007.
The September 2006 quarter includes a $1.0 million after-tax, or $0.02 per
diluted share, impact for charges associated with management separation costs.
The December 2006 quarter includes a $0.7 million, or $0.01 per dilutive
share benefit related to the period January 1, 2006 through June 30, 2006,
due to the retroactive reinstatement of the research and development tax
credit legislation.

9 0 » 9 1 W M S I N D U S T R I E S I N C .2
00
8 a
nn
ua
l r
ep
or
t
Our common stock, par value $0.50, trades publicly on the New York Stock
Exchange under the symbol “WMS.” On August 26, 2008, there were
approximately 642 holders of record of our common stock. On May 7, 2007,
our Board of Directors authorized a three-for-two stock split of our common
stock, effected in the form of a stock dividend. All stockholders received
one additional share for every two shares of our common stock owned as
of the close of business on the record date of May 29, 2007. The additional
16,624,363 shares of $0.50 par value common stock were issued on June 14,
2007 and recorded as a reduction to retained earnings in the amount of
$8.3 million. Our common stock began trading on the split-adjusted basis
on June 15, 2007. Earnings per share, stock prices and all other common
share data presented have been retroactively adjusted, as appropriate, to
reflect the effect of this stock split.
The following table shows the high and low sale prices of our common
stock for the two most recent fiscal years, as reported on the NYSE:
High Low
Fiscal Year Ended June 30, 2008 First Quarter $ 33.10 $ 24.61 Second Quarter 37.14 30.89 Third Quarter 40.78 31.66 Fourth Quarter 38.74 29.45
Fiscal Year Ended June 30, 2007 First Quarter $ 20.21 $ 16.40 Second Quarter 24.92 19.35 Third Quarter 27.51 23.41 Fourth Quarter 31.20 25.73
Dividend Policy
Except for cash paid in lieu of fractional shares in connection with our fiscal
2007 stock split, no cash dividends were declared or paid on our common
stock during fiscal 2008 or 2007. Our ability to pay future cash dividends
will depend upon, among other things, our earnings, anticipated expansion,
capital requirements and financial condition. We do not expect to pay cash
dividends in the foreseeable future.
We have agreed to make additional payments of interest on our convertible
subordinated notes if we declare a cash dividend on our common stock.
The amount of the additional payments will be equal to the cash dividends
that would be payable to the holders of the notes if the holders had con-
verted their notes into shares of our common stock on the record date for
the dividend. However, no such payment need be made if the dividend
that would otherwise trigger the payment causes an adjustment to the
note conversion rate. As a result of the three-for-two stock split discussed
above, the note conversion rate was adjusted proportionately.
We have a multi-year revolving credit agreement, as amended, that provides
for $100 million of unsecured borrowing through December 31, 2009,
including the potential to expand the line up to $125 million. Up to $10
million of the credit facility is available for the issuance of letters of credit.
The credit agreement requires that we maintain certain financial ratios,
which could limit our ability to acquire companies, declare dividends or
make any distribution to holders of any shares of capital stock, or repur-
chase or otherwise acquire shares of our common stock. At June 30, 2008,
approximately $103.4 million was available for such purposes under the
most restrictive of these covenants.
MARKET FOR REgISTRANT’S COMMON EQUITY AND RELATED STOCKHOLDER MATTERS

Designed by Curran & Connors, Inc. / www.curran-connors.com
CORPORATE INFORMATION
Executive Office
800 S. Northpoint Boulevard Waukegan, IL 60085 (847) 785-3000
Website
www.wms.com
Independent Registered Public Accounting Firm
Ernst & Young LLP 233 South Wacker Drive Chicago, IL 60606
Counsel to the Company
Blank Rome LLP The Chrysler Building405 Lexington AvenueNew York, NY 10174
Transfer Agent and Registrar
Stockholder Inquiries: American Stock Transfer & Trust Co. Operations Center 6201 15th Avenue Brooklyn, NY 11219 (800) 937-5449 www.amstock.com e-mail: [email protected]
Investor Relations
William H. Pfund Vice President, Investor Relations (847) 785-3167
Publications
A copy of our Annual Report on Form 10-K is available without charge upon written request to:
WMS Industries Inc.Attn: Investor Relations800 S. Northpoint BoulevardWaukegan, IL 60085
Our Board of Directors has adopted corporate charters for our Audit and Ethics Committee, our Compensation Committee and our Nominating and Corporate Governance Committee. It also has adopted Corporate Governance Guidelines and a Code of Conduct. These documents describe the responsibilities of our directors and executive officers and other key corporate governance matters. We will provide a copy of these documents to our stock-holders, without charge, upon written request addressed to us at 800 S. Northpoint Boulevard, Waukegan, IL 60085, Attention: Investor Relations. These documents also can be viewed on the Corporate Governance page of our website at: www.wms.com.
Certifications
We have submitted to the New York Stock Exchange the certification of our CEO for the prior year stating that he was not aware of any violation by our Company of the New York Stock Exchange corporate governance listing standards. We have filed with the Securities and Exchange Commission, as an exhibit to our most recently filed Annual Report on Form 10-K, the Sarbanes-Oxley Act Section 302 certifications regarding the quality of our public disclosure.
Legal Notices
Product names mentioned or shown in this Report are trademarks or registered trademarks of our subsidiary, WMS Gaming Inc., except for the following marks:
CLINT EASTWOOD is a registered trademark of Clint Eastwood.DEAN MARTIN™ & © Dean Martin Family Trust. Used with permission. All rights reserved.DIRTY HARRY ® & © Warner Bros. Consumer Products Inc. G2E is a trademark of Reed Elsevier Inc. and the American Gaming Association.G2S and S2S are trademarks of the Gaming Standards Association.GREEN ACRES is a trademark of Orion Pictures Corporation.HAPPY DAYS: TM & © 2008 CBS Studios Inc. All rights reserved. HAPPY DAYS and related marks are trademarks of CBS Studios Inc.MONOPOLY is a trademark of Hasbro. Used with permission. © 2008 Hasbro. All rights reserved.POWERBALL is a trademark of Multi-State Lottery Association.PRESS YOUR LUCK is a trademark of FremantleMedia Operations BV.STAR TREK: TM & © 2008 CBS Studios Inc. All rights reserved. STAR TREK and related marks are trademarks of CBS Studios Inc.THE WIZARD OF OZ and all related characters and elements are trademarks of and © Turner Entertainment Co.TOP GUN™ & © Paramount Pictures Corporation.
© 2008 WMS Industries Inc.

17.
16.
15.
14. 13.
11.
12.
9.
10.8.
7.
6.5.
4.3.
2. 1.
ExEcutivE committEE1. Scott Schweinfurth, Executive Vice President, Chief Financial Officer and Treasurer
2. Brian Gamache, Chairman and Chief Executive Officer
3. orrin Edidin, President
4. Laurie Lasseter, Vice President of Engineering and Chief Technical Officer
5. Larry Pacey, Executive Vice President of Global Products and Chief Innovation Officer
6. Steve cramer, Vice President of Supply Chain and Commercial Operations
7. Phil Gelber, Vice President of Game Development
8. Kathleen mcJohn, Vice President, General Counsel and Secretary
9. Dave vitullo, Vice President of Commercial Finance
10. Patty Barten, Executive Vice President of Continuous Improvement
11. Sebastian Salat, President of WMS International
12. Ron Dinola, Vice President of Gaming Operations
13. Rob Siemasko, Vice President of Product Management
14. Rob Bone, Vice President of Marketing
15. Dean Ehrlich, Vice President of North American Sales
16. Ken Lochiatto, Executive Vice President and Chief Operating Officer
17. mike Komenda, Vice President of Human Resources