Embed Size (px)
Citation preview

WM4 Instrumental analysis

The 3 key instrumental techniques
How do we know that salicylic acid contains –OH and –COOH groups?
Mass spectroscopy (m.s.). Infrared (i.r.) spectroscopy. Nuclear magnetic resonance (n.m.r.)
spectroscopy.
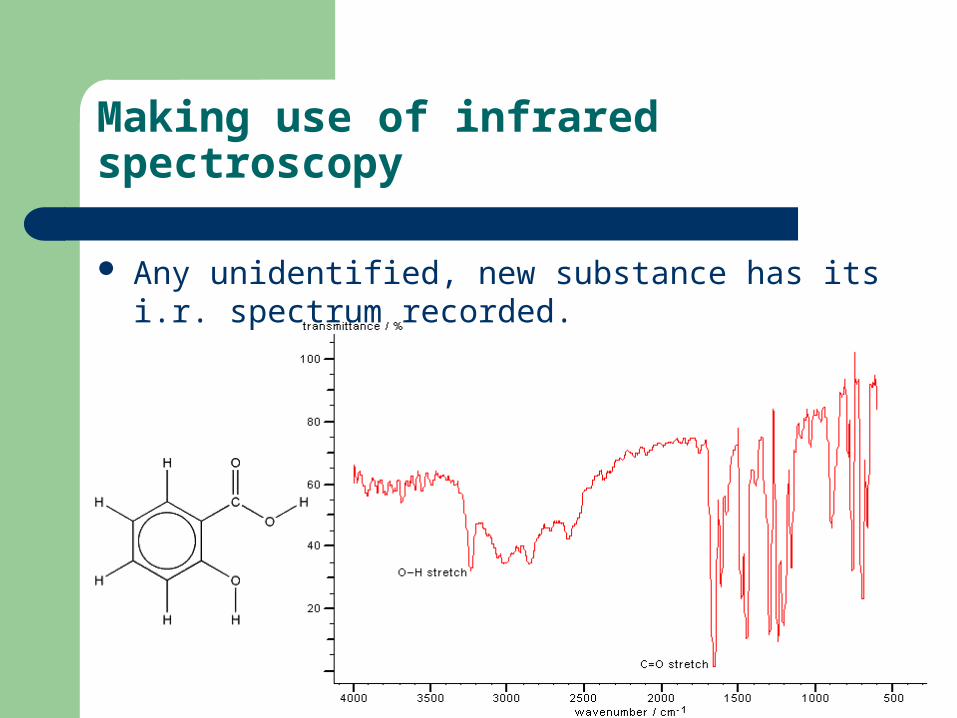
Making use of infrared spectroscopy
Any unidentified, new substance has its i.r. spectrum recorded.
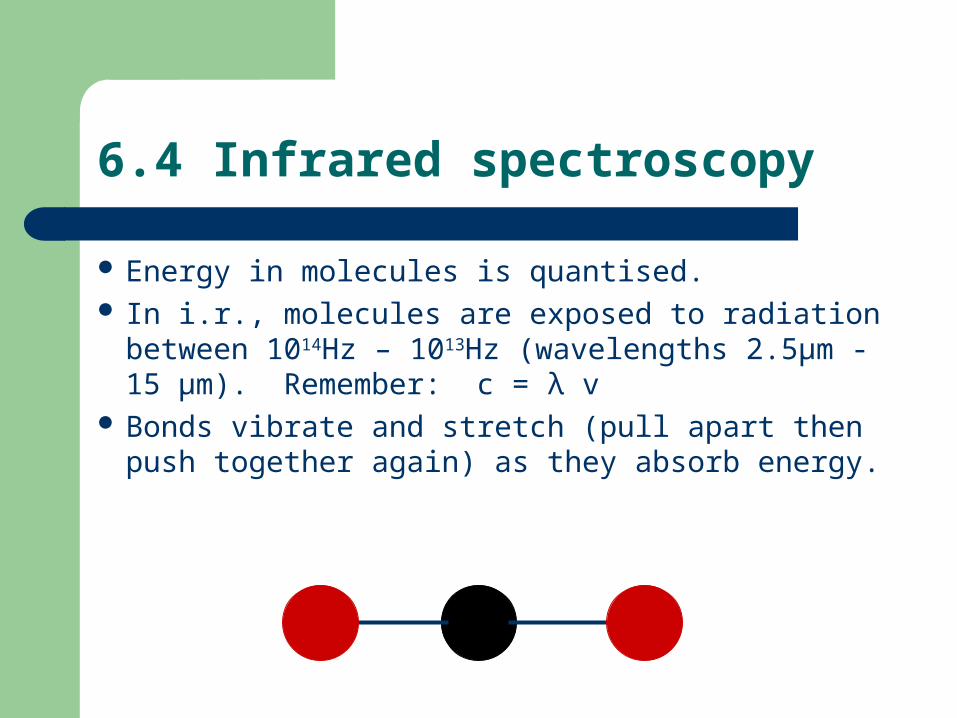
6.4 Infrared spectroscopy
Energy in molecules is quantised. In i.r., molecules are exposed to radiation
between 1014Hz – 1013Hz (wavelengths 2.5µm -15 µm). Remember: c = λ v
Bonds vibrate and stretch (pull apart then push together again) as they absorb energy.

Vibrational changes of CO2
Asymmetric stretch
Symmetric stretch
bending

Infrared spectra: signals = stretches
An IR spectrum hangs down from a baseline (100% transmittance = no absorbtion).
The signals (look like ‘icicles’) on an IR spectra correspond to bonds absorbing a packet of energy and vibrating more.
The –OH and –CO bonds in salicylic acid absorb energy at specific wavelengths (λ)/µm and so wavenumbers (1/ λ)/ cm-1.

Generally, particular bonds can be matched to a particular absorption region.
Bond Location Wavenumber/cm-1 IntensityC-H Alkanes 2850 -2950 M-S
C=C Alkenes 1620 – 1680 M
Arenes Sev peaks 1450-1650 Variable
C C Alkynes 2100 – 2260 M
C=O Aldehydes 1720 – 1740 S
C-O Alcohols, ethers phenols
1050 - 1300 S
C-F fluoroalkanes 1000 – 1400 S
O-H Alcohols 3600 – 3640 S
N-H 1o amines 3300 - 3500 M-S

Interpreting spectra: 2-ethylbut-1-ene
?
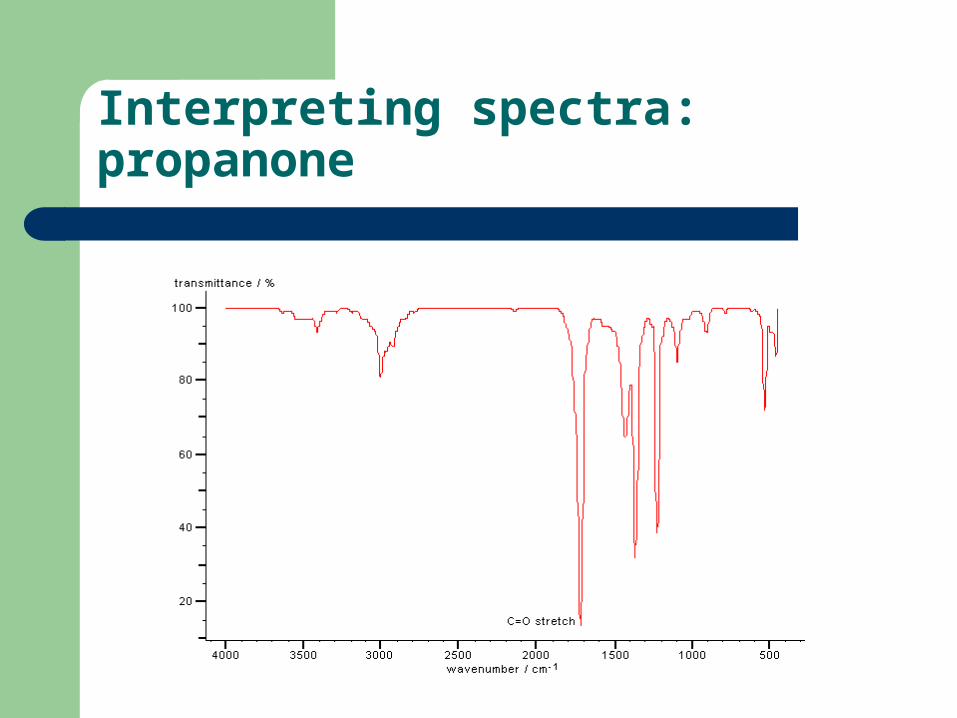
Interpreting spectra: propanone
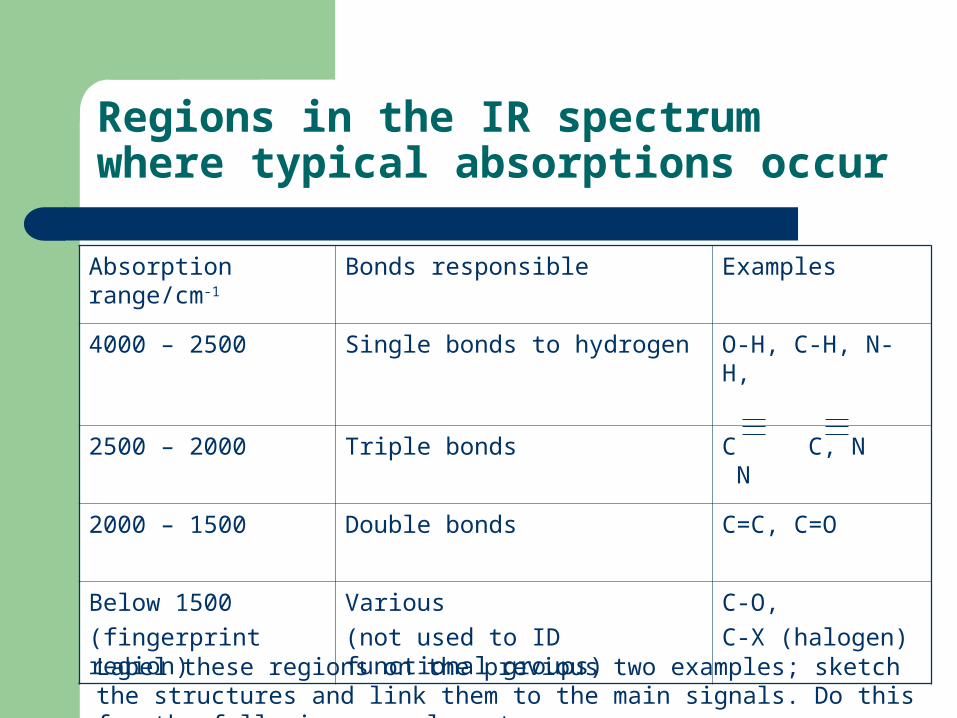
Regions in the IR spectrum where typical absorptions occur
Absorption range/cm-1 Bonds responsible Examples
4000 – 2500 Single bonds to hydrogen O-H, C-H, N-H,
2500 – 2000 Triple bonds C C, N N
2000 – 1500 Double bonds C=C, C=O
Below 1500
(fingerprint region)
Various
(not used to ID functional groups)
C-O,
C-X (halogen)
Label these regions on the previous two examples; sketch the structures and link them to the main signals. Do this for the following examples, too.
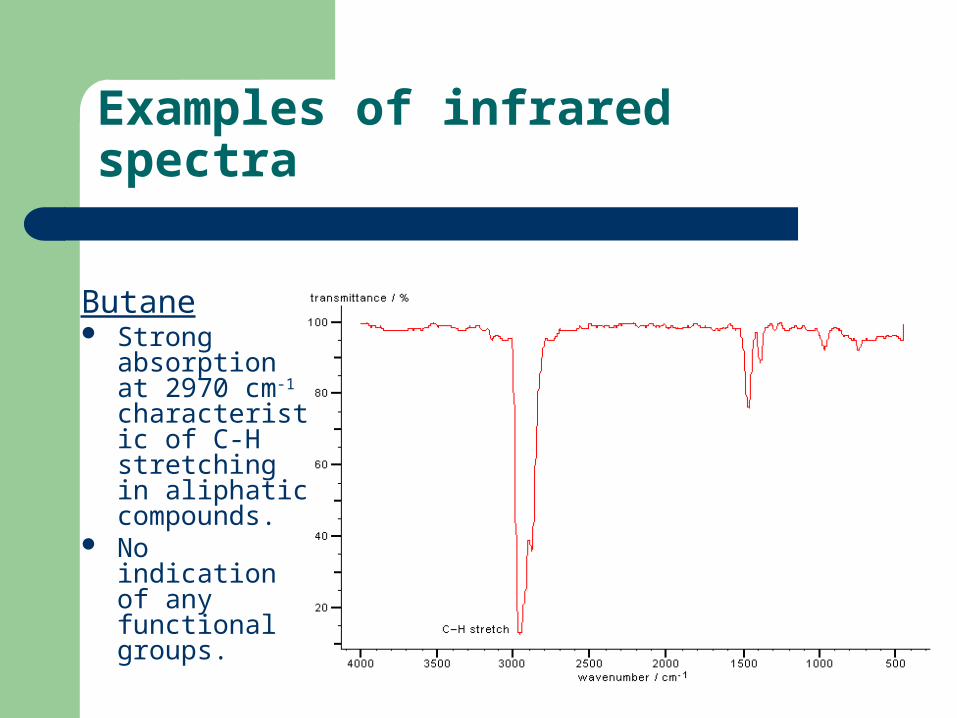
Examples of infrared spectra
Butane Strong
absorption at 2970 cm-1 characteristic of C-H stretching in aliphatic compounds.
No indication of any functional groups.

Examples of infrared spectra
Methylbenzene 2 types of C-H
absorption ~3000 cm-1 (above = C-H on benzene; below = C-H on methyl group).
No indication of any functional groups.
Absorption pattern ~700 cm-1 is typical of a benzene ring with a substituted group.
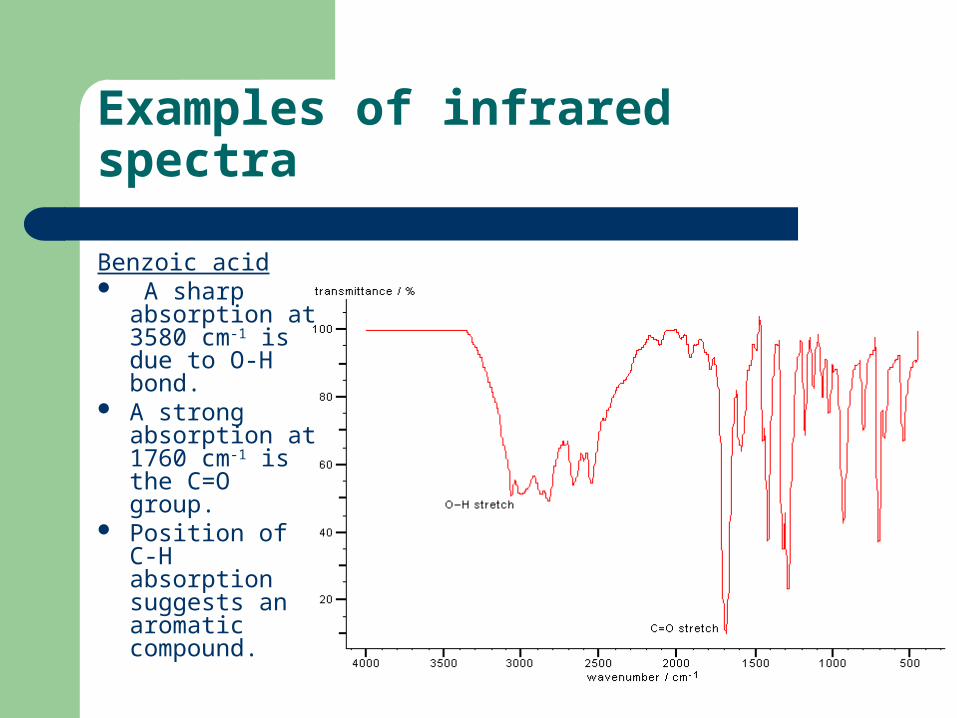
Examples of infrared spectra
Benzoic acid A sharp
absorption at 3580 cm-1 is due to O-H bond.
A strong absorption at 1760 cm-1 is the C=O group.
Position of C-H absorption suggests an aromatic compound.

Summary of IR spectroscopy
An IR spectrum measures the extent to which electromagnetic radiation is transmitted through a sample of substance.
Frequency ranges absorbed give clues about functional groups which are present.
IR spectrum of salicylic acid gives evidence of C=O and –OH groups.
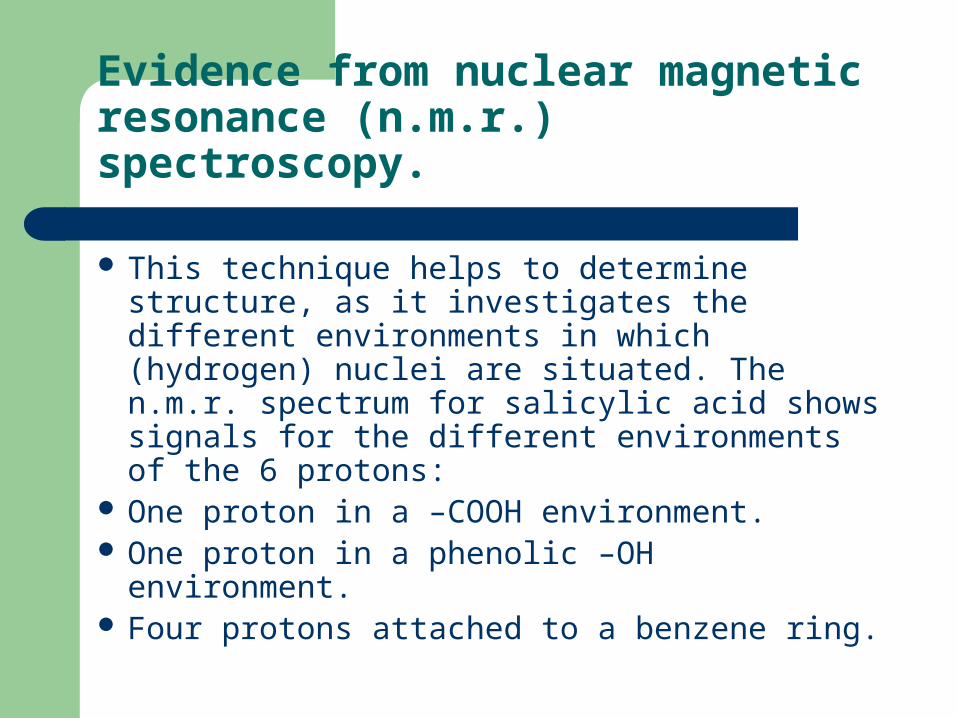
Evidence from nuclear magnetic resonance (n.m.r.) spectroscopy.
This technique helps to determine structure, as it investigates the different environments in which (hydrogen) nuclei are situated. The n.m.r. spectrum for salicylic acid shows signals for the different environments of the 6 protons:
One proton in a –COOH environment. One proton in a phenolic –OH environment. Four protons attached to a benzene ring.

n.m.r. spectrum for salicylic acid
12 11
Ab
sorp
tion

The evidence so far….
A combination of i.r. and n.m.r. spectroscopy shows that salicylic acid has an –OH group and –COOH group both attached to a benzene ring; we can now rename it HYDROXYBENZOIC ACID.
However, it could be one of 3 possible isomers: 2-hydroxybenzoic acid, 3-hydroxybenzoic acid and 4-hydroxybenzoic acid.
Mass spectroscopy can determine which isomer we have.

The mass spectrum of salicylic acid
Signals correspond to positively charged ions formed from the parent compound, and fragment ions.
Parent or molecular ion
The fragmentation pattern is characteristic of a particular compound…the fragment at 120 can only come from 2-hydroxybenzoic acid…can you see why?
mass
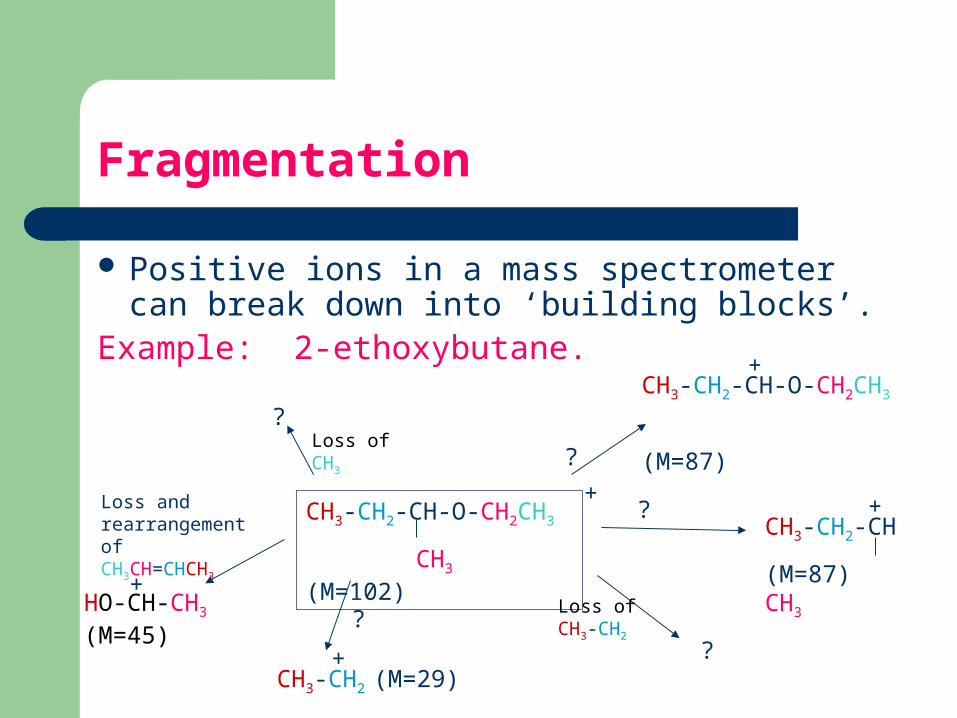
Fragmentation
Positive ions in a mass spectrometer can break down into ‘building blocks’.
Example: 2-ethoxybutane.
CH3-CH2-CH-O-CH2CH3
CH3 (M=102)
+
CH3-CH2-CH-O-CH2CH3
(M=87)?
+
HO-CH-CH3 (M=45)
Loss and rearrangement of CH3CH=CHCH3
+
CH3-CH2-CH
(M=87) CH3
?
Loss of CH3-CH2
?
?
?
+
Loss of CH3
CH3-CH2 (M=29)+
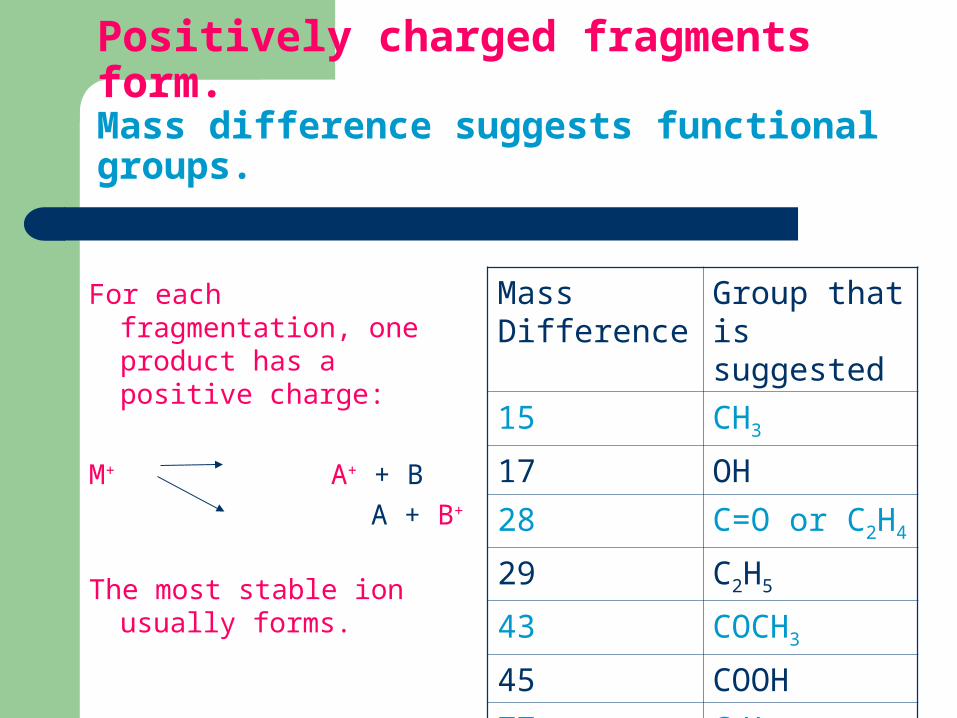
Positively charged fragments form.Mass difference suggests functional groups.
For each fragmentation, one product has a positive charge:
M+ A+ + B
A + B+
The most stable ion usually forms.
Mass Difference
Group that is suggested
15 CH3
17 OH
28 C=O or C2H4
29 C2H5
43 COCH3
45 COOH
77 C6H5

Isotope peaks: heights are in the same ratio of abundance for particular elements.
Pairs of peaks correspond to isotopes of 35Cl and 37Cl in the ratio of 75%:25% ie. 3:1. Highlight these.
mass

Now it’s over to you!
Do activity WM4: use accurate Mr values, isotope peaks and a database to lead you to the formula of salicylic acid.
It shows you how chemists use fragmentation patterns to deduce or confirm a molecular structure.
Do assignments 1 and 2 C.S. p110-111 Do ‘Problems for 6.5’ on mass spectrometry,
C.I., p145-146.


![blog. · Web viewANSWER: B ANSWER: C [CI`(H2O)4C1(NO2)]CI COON HOOC-CH2\N_CCH~_CH___N/H Ml ` | ` \' ' CH2 CH2 -COOH HOOC' HOOC`.."CHZ CH2"COOH \ I /N-CH2-CH2-N\ HOOC""CH2 CH2-COOH](https://img.pdfslide.us/doc/110x75/5ab561c67f8b9a0f058cbd1a/blog-viewanswer-b-answer-c-cih2o4c1no2ci-coon-hooc-ch2ncchchnh.jpg)