Embed Size (px)
Citation preview
WM2013 Conference, February 24 – 28, 2013, Phoenix, Arizona USA
1
Development of an Integrated Raman and Turbidity Fiber Optic Sensor for the In-Situ Analysis of High Level Nuclear Waste – 13532
Christina Gasbarro*, Job Bello*, Samuel Bryan**, Amanda Lines**, and Tatiana Levitskaia** EIC Laboratories, Inc., 111 Downey St., Norwood, MA, 02062,
Pacific Northwest National Laboratory, PO Box 999, Richland, WA, 99352
ABSTRACT
Stored nuclear waste must be retrieved from storage, treated, separated into low- and high-level waste streams, and finally put into a disposal form that effectively encapsulates the waste and isolates it from the environment for a long period of time. Before waste retrieval can be done, waste composition needs to be characterized so that proper safety precautions can be implemented during the retrieval process. In addition, there is a need for active monitoring of the dynamic chemistry of the waste during storage since the waste composition can become highly corrosive. This work describes the development of a novel, integrated fiber optic Raman and light scattering probe for in situ use in nuclear waste solutions. The dual Raman and turbidity sensor provides simultaneous chemical identification of nuclear waste as well as information concerning the suspended particles in the waste using a common laser excitation source.
INTRODUCTION
The US Department of Energy (DOE) has 332 underground tanks used to process and store over 100 million gallons of radioactive and mixed chemical waste. Most of the tanks are single shell, carbon steel structures, with concrete surrounding all the surfaces, and some are double shell, with an annulus between the two shells. Major concerns have been the possibility that the waste might be released into the environment and contaminate the water, soil, and air around a storage facility. To guard against such an occurrence, stored waste must be retrieved from storage, treated, separated into low- and high-level waste streams, and then processed for disposal. Before waste retrieval can be done, however, certain physical properties of the waste will need to be characterized so that proper safety precautions can be implemented during the retrieval process. Since the waste is usually radioactive, all characterization must be done remotely. Thus, a sensor that allows in situ monitoring of these chemical composition and physical properties of the stored waste, without sampling operations that may expose personnel, is therefore desirable.
There is also a need for active monitoring of the dynamic chemistry of the waste during storage since the composition of the waste can become highly corrosive. Corrosion is of particular concern because many of the tanks contain high concentrations of nitrate, which attacks steel. To minimize the effects of nitrate, the tank contents are maintained at elevated pH and at an optimum nitrite level. In order to ensure that the chemistry in a waste tank is being maintained to
WM2013 Conference, February 24 – 28, 2013, Phoenix, Arizona USA
2
minimize corrosion, the concentrations of nitrate, nitrite and hydroxide are periodically monitored. If significant changes in the concentrations are observed, then appropriate measures can be exercised to restore optimum, and anti-corrosive conditions. There are also other waste processing activities, such as waste retrieval and treatment, where an on-line, real-time process monitoring system of waste constituents is needed.
Current analytical protocols for high-level waste tanks (HLW) involve liquid sampling, preservation, transport, storage, preparation, and analysis with ion chromatography and titration in a hot cell. These steps are slow, expensive, and dangerous for site personnel and analysts. High costs serve to limit the number of samples collected at any one tank. There is also considerable opportunity for sample composition to change from the time it is collected to when it is prepared for analysis, and the results tend to provide only a sporadic picture of the materials being monitored. Thus, there is a need for a remote, on-line, and real-time analytical sensor that allows in situ characterization of the waste without sample retrieval. In addition, a sensor that can be left and sealed inside the tank through a riser opening and performs reliably for long periods without calibration would be ideal. This would allow tank personnel to analyze the tank waste safely without the hazard of being exposed to radiation and chemicals.
Small, inexpensive devices that can be sacrificed, if necessary, are most appealing as in situ sensors. Optical techniques employing fiber optic probes are promising for this application because they are affected less by radiation than electronic devices and are “passive” with no failure-prone electronic/mechanical components. The important challenges for in situ fiber optic sensors is that they provide reliable analytical data at relevant concentrations under radiation exposure, elevated temperature, and corrosive conditions. Furthermore, for a chemical monitoring sensor, the measurements of the specified analytes must be performed in turbid solutions (in some cases sludge) without interference from other sample components.
Raman spectroscopy is an optical technique that produces a unique spectrum for every molecule. A typical Raman measurement consists of exciting a sample with monochromatic light, collecting the scattered light and focusing it into a spectrograph, and measuring the spectrum with an appropriate light detection device at the spectrograph’s focal plane. Typically in unenhanced Raman measurement, about 10-3 % of the excitation light impinging on a molecule will be scattered, mostly elastically at the laser excitation frequency (Rayleigh scattered). However, about 1% of the scattered light will be at frequencies corresponding to combinations of the exciting light and the molecular vibration frequencies (the Raman effect). Spectral resolution of the scattered light will yield a series of sharp lines, which, like the infrared spectrum, give information about the bonding and structure. The scattered light spectrum contains peaks that arise from the normal vibrational modes of the chemical bonds comprising the sample’s molecular or crystalline structure. As such, the spectrum provides a “fingerprint” of the sample. Its spectral features are sharp, so multiple components of mixtures can often be differentiated
WM2013 Conference, February 24 – 28, 2013, Phoenix, Arizona USA
3
without physically separating them. Until fairly recently, Raman spectroscopy had been underutilized in chemical analysis due to the size and complexity of the laser and spectrograph necessary to obtain sufficient excitation intensity, reproducible sampling geometry, spectral resolution, and separation of the weak Raman spectrum from the intense Rayleigh line. However, in the last decade, compact, field portable Raman instrumentation has been developed using small scale solid-state laser technology and charge coupled device detectors and in fiber optic sampling, all of which supports the wider application of the technique in a variety of new arenas such as the present application.
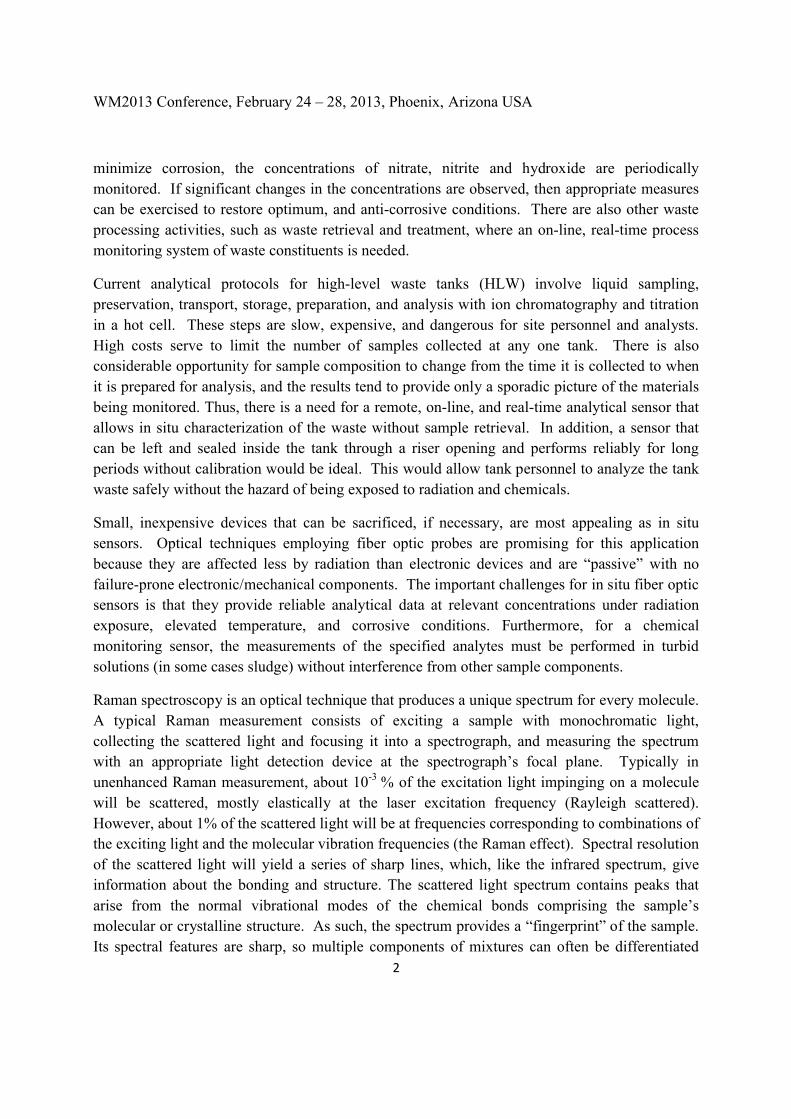
Figure 1 shows Raman spectra of actual waste samples from different Savannah River Site (SRS) tanks obtained with a Raman probe inside a shielded cell. It can be seen in Figure 1 that various oxyanions such as nitrate, nitrite, aluminate, hydroxide, chromate, and sulfate can readily be identified from the Raman spectra of the waste samples. This illustrates the potential of Raman for the in situ characterization of HLW tanks (1). The Raman probe that was employed in the SRS corrosion Raman sensor system is based on EIC's patented backscattering Raman probe geometry (2), where the Raman emission scattered back towards the probe is collected by the same optical lens used to focus the laser excitation beam. This Raman probe geometry also allows placing laser light scattering detectors at multiple angles in front of the probe’s optical path. This will then allow the probe to measure turbidity of the waste sample. Most turbidity measurement instruments used in water and wastewater analysis are of a single beam design employing a 90° detection angle. A single beam design, however, suffers from its inability to correct for color or absorbing sample solutions as well as fluctuations in laser intensity. A more robust approach is to measure turbidity at multiple angles and employ a ratio scattering intensity measurement algorithm to determine turbidity. The ratio turbidity measurement approach will correct for absorption or changes in laser intensity.
Figure 1. Raman spectra of actual waste samples from different Savannah River Site (SRS) tanks obtained with a Raman probe inside a shielded cell.
0
200
400
600
800
600 800 1000 1200 1400 1600 1800 2000
Ram an Shift (cm )-1
Inte
ns
ity
Al(OH)4-
NO3-
NO2-
CrO42-
SO42-
NO3-
NO2-
2800 3000 3200 3400 3600
OH-
WM2013 Conference, February 24 – 28, 2013, Phoenix, Arizona USA
4
DESCRIPTION
Development of the Fiber Optic RamanTurboProbe™
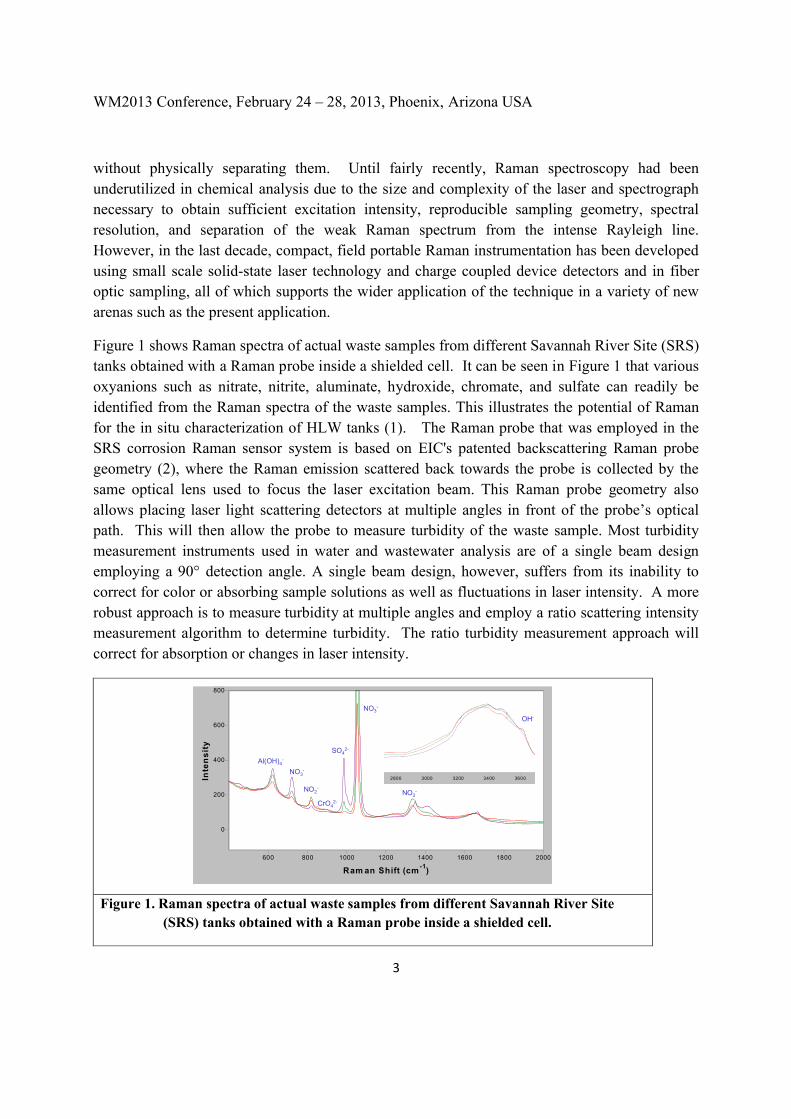
In this work, we have developed a fiber probe head capable of measuring simultaneously the Raman and light scattering properties of HLW solutions. Figure 2A shows a schematic layout of the design of the RamanTurboProbe™. In this design, the dual (Raman/turbidity) sensor utilizes a miniature fiber optic Raman probe (671 nm excitation) for Raman collection as well as providing the excitation source for the turbidity sensor. The backscattering Raman probe is fixed above the turbidity-sensing region. A quartz window in front of the Raman probe internal optics protects and seals the Raman probe from the surrounding sample solution. The focus of the Raman probe is adjusted so that it is situated at the edge of the radius of the 10 mm circle collection region of the turbidity sensor, where the laser beam will start to diverge when it enters the turbidity collection circle. Four fiber optic channels (50 μm core, 0.22 numerical aperture) are arranged at different angles around the light scattering collection radius. These turbidity collection angles are 180° (transmitted), 135° (forward scatter), 90° (side scatter), and 45° (back scatter). The optical fibers are all equidistant (10 mm) from the center of the turbidity collection circle. Figure 2B shows a close-up of the sensing region of the RamanTurboProbe™, showing the turbidity optical fibers and the Raman probe. Figure 2B shows photographs of the finished RamanTurboProbe™. The probe is 12” long and 2” diameter.
A B
Figure 2. Integrated Raman/turbidity fiber optic probe. A. Schematic layout; B. Photograph of the RamanTurboProbe™
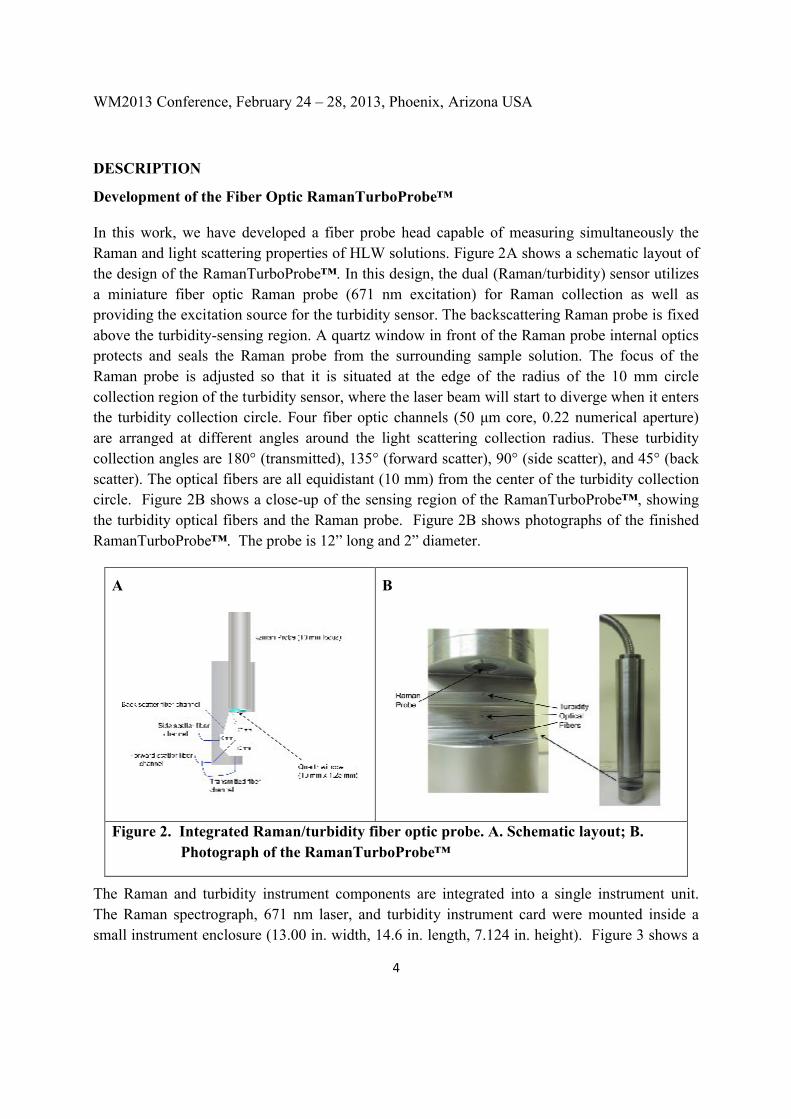
The Raman and turbidity instrument components are integrated into a single instrument unit. The Raman spectrograph, 671 nm laser, and turbidity instrument card were mounted inside a small instrument enclosure (13.00 in. width, 14.6 in. length, 7.124 in. height). Figure 3 shows a
WM2013 Conference, February 24 – 28, 2013, Phoenix, Arizona USA
5
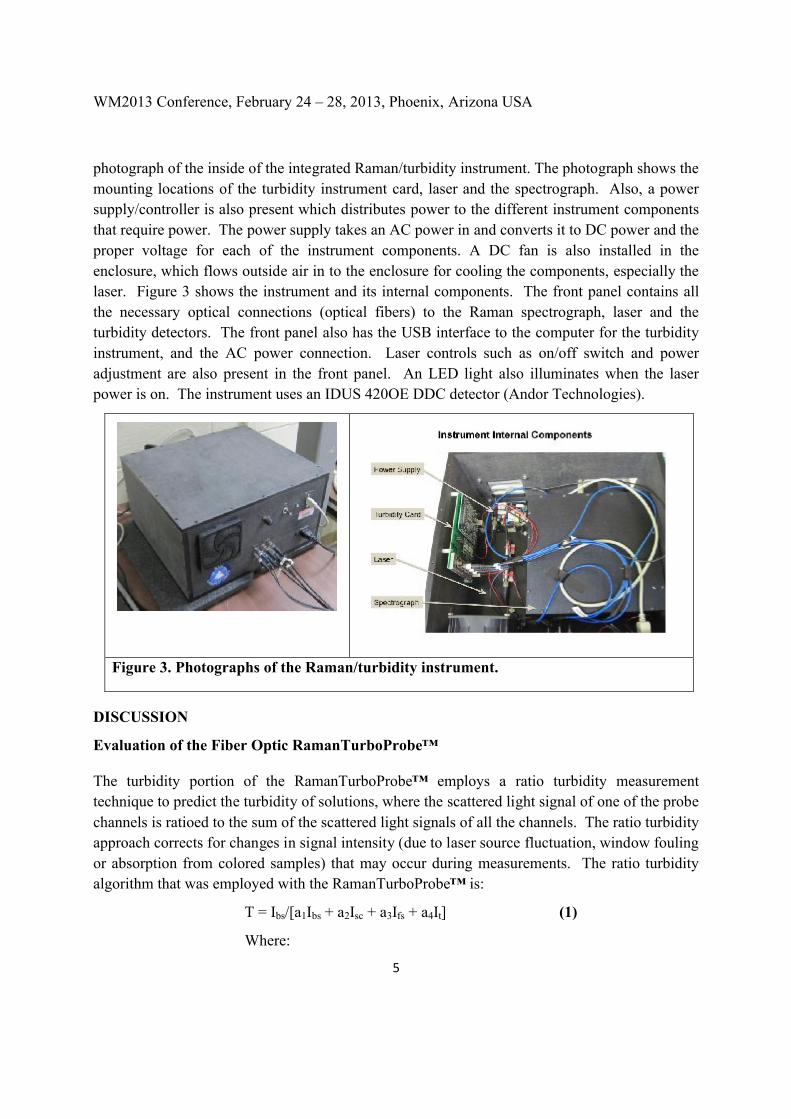
photograph of the inside of the integrated Raman/turbidity instrument. The photograph shows the mounting locations of the turbidity instrument card, laser and the spectrograph. Also, a power supply/controller is also present which distributes power to the different instrument components that require power. The power supply takes an AC power in and converts it to DC power and the proper voltage for each of the instrument components. A DC fan is also installed in the enclosure, which flows outside air in to the enclosure for cooling the components, especially the laser. Figure 3 shows the instrument and its internal components. The front panel contains all the necessary optical connections (optical fibers) to the Raman spectrograph, laser and the turbidity detectors. The front panel also has the USB interface to the computer for the turbidity instrument, and the AC power connection. Laser controls such as on/off switch and power adjustment are also present in the front panel. An LED light also illuminates when the laser power is on. The instrument uses an IDUS 420OE DDC detector (Andor Technologies).
Figure 3. Photographs of the Raman/turbidity instrument.
DISCUSSION
Evaluation of the Fiber Optic RamanTurboProbe™
The turbidity portion of the RamanTurboProbe™ employs a ratio turbidity measurement technique to predict the turbidity of solutions, where the scattered light signal of one of the probe channels is ratioed to the sum of the scattered light signals of all the channels. The ratio turbidity approach corrects for changes in signal intensity (due to laser source fluctuation, window fouling or absorption from colored samples) that may occur during measurements. The ratio turbidity algorithm that was employed with the RamanTurboProbe™ is:
T = Ibs/[a1Ibs + a2Isc + a3Ifs + a4It] (1)
Where:
WM2013 Conference, February 24 – 28, 2013, Phoenix, Arizona USA
6
T = turbidity, NTU unitsa1, a2, a3, a4 = calibration coefficientsIbs = back scatter (45°) intensityIsc = side scatter (90°) intensityIfs = forward scatter (135°) intensityIt = transmitted (180°) intensity
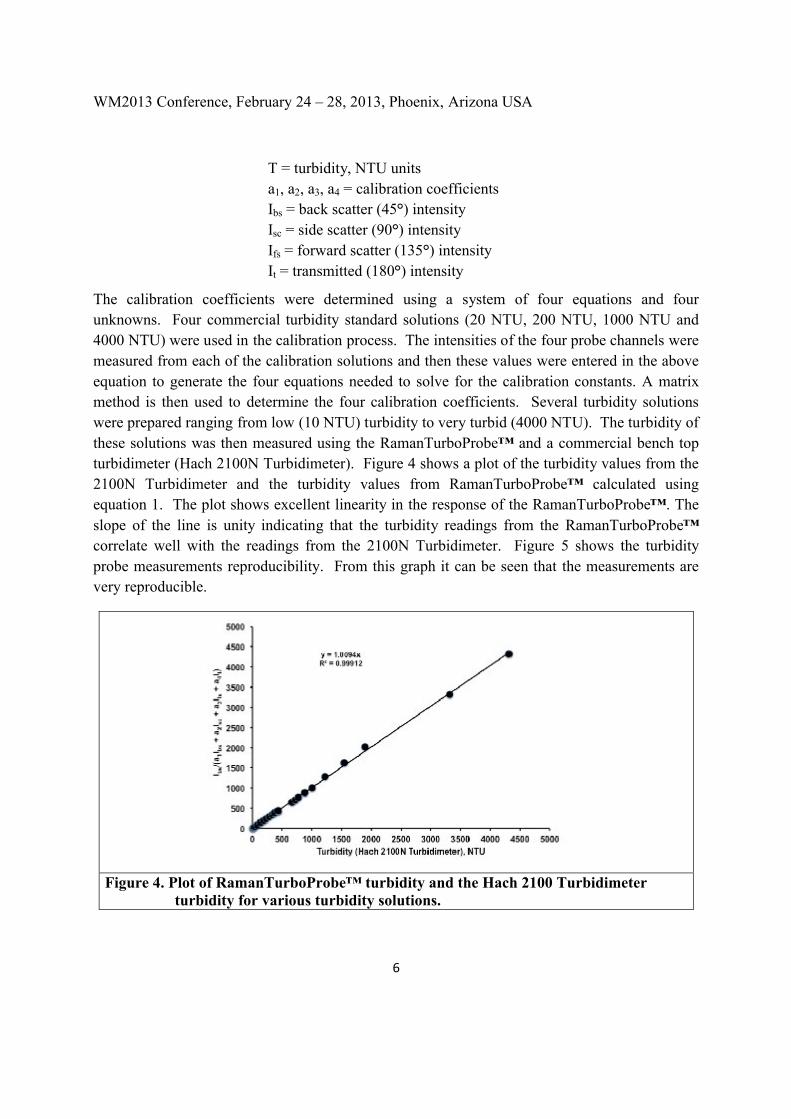
The calibration coefficients were determined using a system of four equations and four unknowns. Four commercial turbidity standard solutions (20 NTU, 200 NTU, 1000 NTU and 4000 NTU) were used in the calibration process. The intensities of the four probe channels were measured from each of the calibration solutions and then these values were entered in the above equation to generate the four equations needed to solve for the calibration constants. A matrix method is then used to determine the four calibration coefficients. Several turbidity solutions were prepared ranging from low (10 NTU) turbidity to very turbid (4000 NTU). The turbidity of these solutions was then measured using the RamanTurboProbe™ and a commercial bench top turbidimeter (Hach 2100N Turbidimeter). Figure 4 shows a plot of the turbidity values from the 2100N Turbidimeter and the turbidity values from RamanTurboProbe™ calculated using equation 1. The plot shows excellent linearity in the response of the RamanTurboProbe™. The slope of the line is unity indicating that the turbidity readings from the RamanTurboProbe™correlate well with the readings from the 2100N Turbidimeter. Figure 5 shows the turbidity probe measurements reproducibility. From this graph it can be seen that the measurements are very reproducible.
Figure 4. Plot of RamanTurboProbe™ turbidity and the Hach 2100 Turbidimeter turbidity for various turbidity solutions.
WM2013 Conference, February 24 – 28, 2013, Phoenix, Arizona USA
7
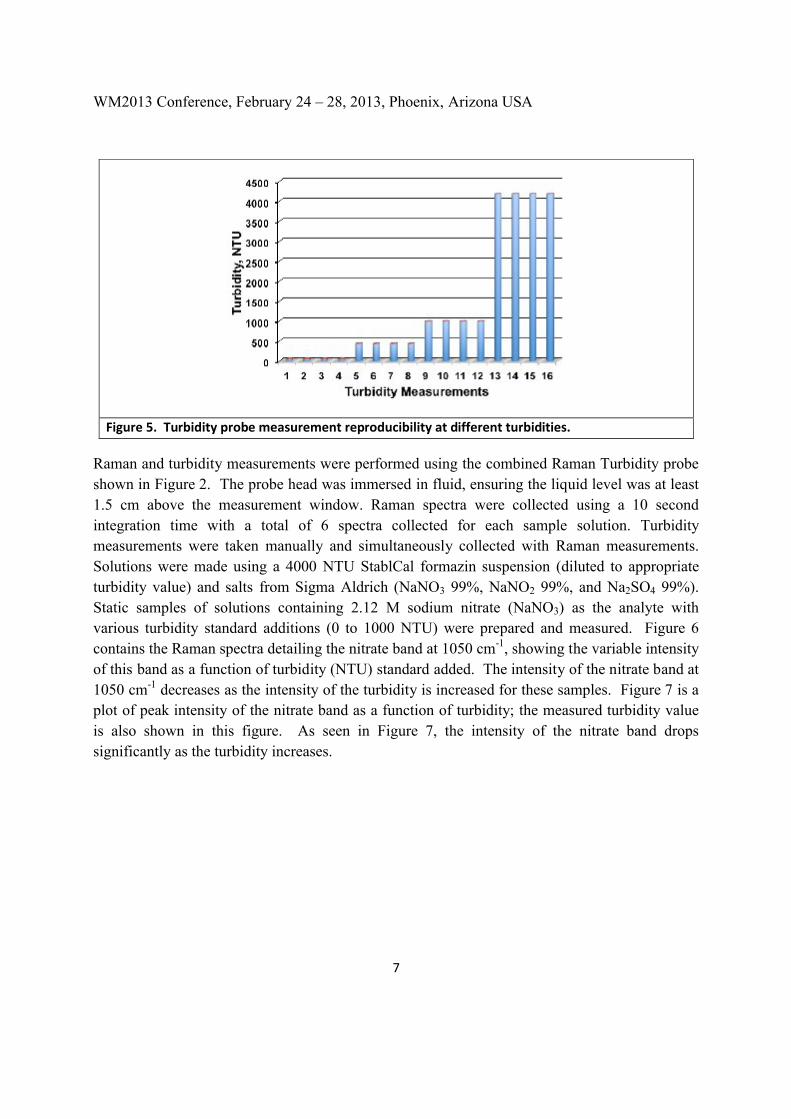
Figure 5. Turbidity probe measurement reproducibility at different turbidities.
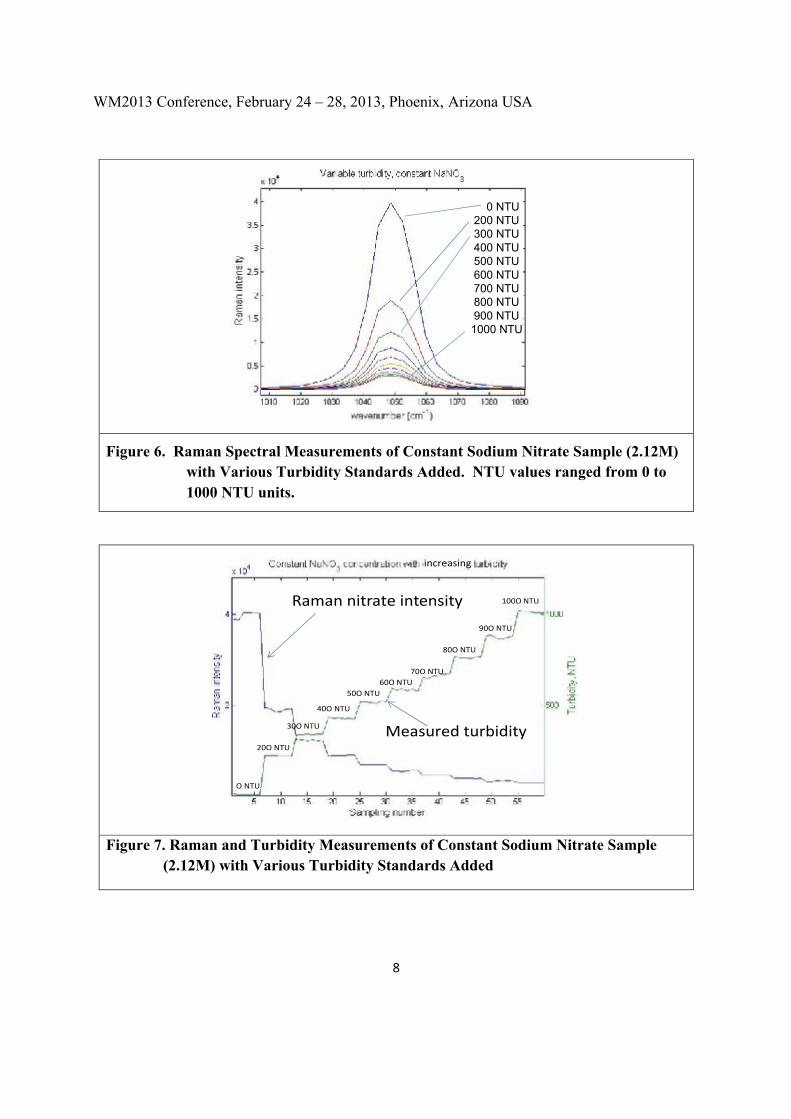
Raman and turbidity measurements were performed using the combined Raman Turbidity probe shown in Figure 2. The probe head was immersed in fluid, ensuring the liquid level was at least 1.5 cm above the measurement window. Raman spectra were collected using a 10 second integration time with a total of 6 spectra collected for each sample solution. Turbidity measurements were taken manually and simultaneously collected with Raman measurements. Solutions were made using a 4000 NTU StablCal formazin suspension (diluted to appropriate turbidity value) and salts from Sigma Aldrich (NaNO3 99%, NaNO2 99%, and Na2SO4 99%). Static samples of solutions containing 2.12 M sodium nitrate (NaNO3) as the analyte with various turbidity standard additions (0 to 1000 NTU) were prepared and measured. Figure 6 contains the Raman spectra detailing the nitrate band at 1050 cm-1, showing the variable intensity of this band as a function of turbidity (NTU) standard added. The intensity of the nitrate band at 1050 cm-1 decreases as the intensity of the turbidity is increased for these samples. Figure 7 is a plot of peak intensity of the nitrate band as a function of turbidity; the measured turbidity value is also shown in this figure. As seen in Figure 7, the intensity of the nitrate band dropssignificantly as the turbidity increases.
WM2013 Conference, February 24 – 28, 2013, Phoenix, Arizona USA
8
0 NTO
0 NTU200 NTU 300 NTU400 NTU500 NTU600 NTU700 NTU800 NTU900 NTU1000 NTU
Figure 6. Raman Spectral Measurements of Constant Sodium Nitrate Sample (2.12M) with Various Turbidity Standards Added. NTU values ranged from 0 to 1000 NTU units.
O NTU
20O NTU
30O NTU
40O NTU
50O NTU60O NTU
70O NTU
80O NTU
90O NTU
100O NTURaman nitrate intensity
Measured turbidity
increasing
Figure 7. Raman and Turbidity Measurements of Constant Sodium Nitrate Sample (2.12M) with Various Turbidity Standards Added
WM2013 Conference, February 24 – 28, 2013, Phoenix, Arizona USA
9
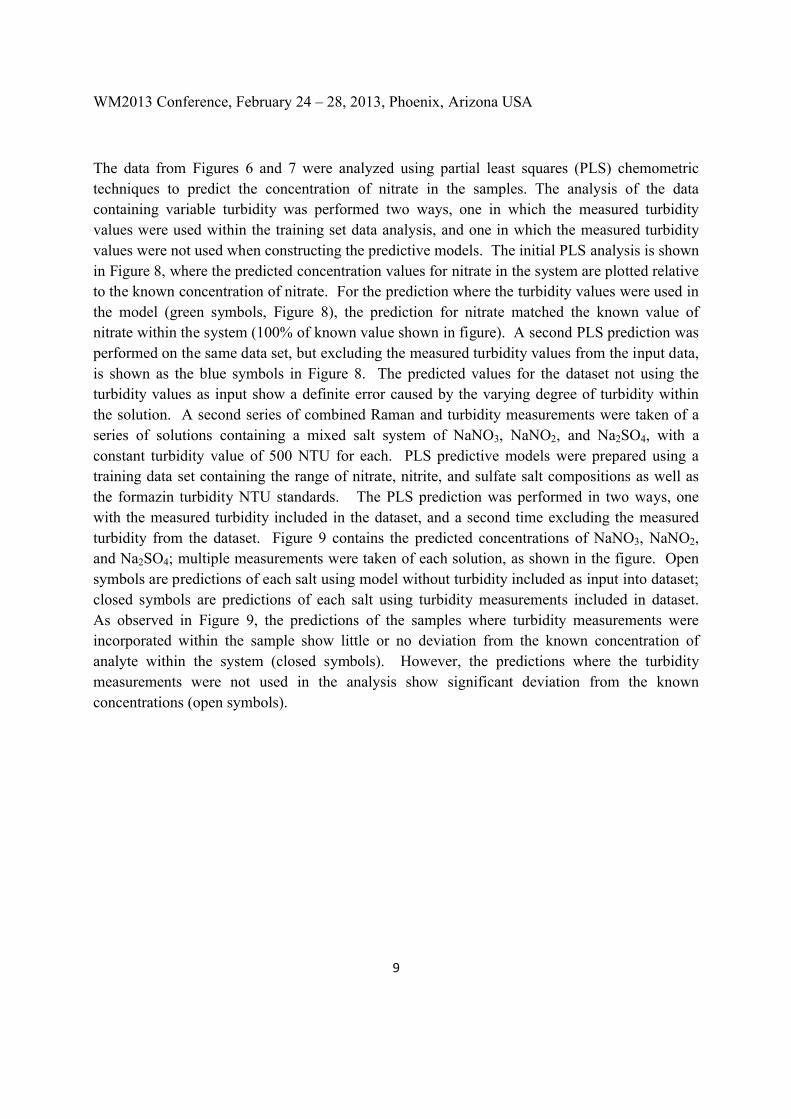
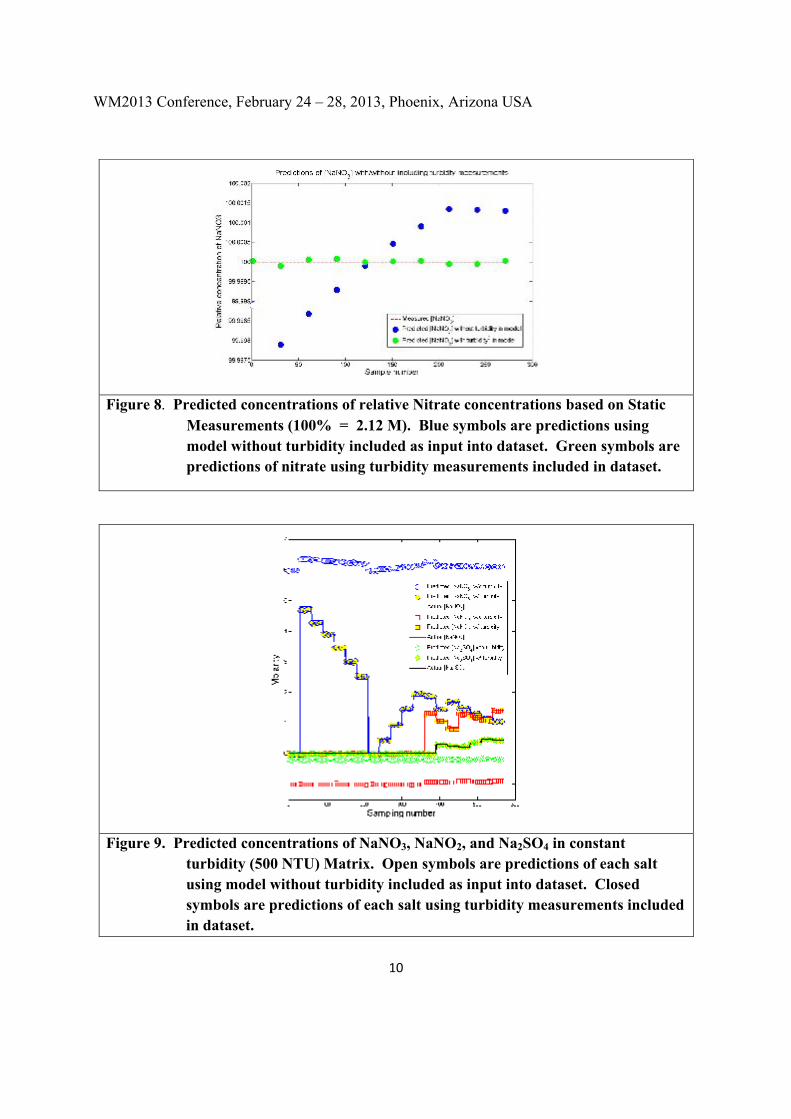
The data from Figures 6 and 7 were analyzed using partial least squares (PLS) chemometric techniques to predict the concentration of nitrate in the samples. The analysis of the data containing variable turbidity was performed two ways, one in which the measured turbidity values were used within the training set data analysis, and one in which the measured turbidity values were not used when constructing the predictive models. The initial PLS analysis is shown in Figure 8, where the predicted concentration values for nitrate in the system are plotted relative to the known concentration of nitrate. For the prediction where the turbidity values were used in the model (green symbols, Figure 8), the prediction for nitrate matched the known value of nitrate within the system (100% of known value shown in figure). A second PLS prediction was performed on the same data set, but excluding the measured turbidity values from the input data, is shown as the blue symbols in Figure 8. The predicted values for the dataset not using the turbidity values as input show a definite error caused by the varying degree of turbidity within the solution. A second series of combined Raman and turbidity measurements were taken of a series of solutions containing a mixed salt system of NaNO3, NaNO2, and Na2SO4, with a constant turbidity value of 500 NTU for each. PLS predictive models were prepared using a training data set containing the range of nitrate, nitrite, and sulfate salt compositions as well as the formazin turbidity NTU standards. The PLS prediction was performed in two ways, one with the measured turbidity included in the dataset, and a second time excluding the measured turbidity from the dataset. Figure 9 contains the predicted concentrations of NaNO3, NaNO2, and Na2SO4; multiple measurements were taken of each solution, as shown in the figure. Open symbols are predictions of each salt using model without turbidity included as input into dataset; closed symbols are predictions of each salt using turbidity measurements included in dataset. As observed in Figure 9, the predictions of the samples where turbidity measurements were incorporated within the sample show little or no deviation from the known concentration of analyte within the system (closed symbols). However, the predictions where the turbidity measurements were not used in the analysis show significant deviation from the known concentrations (open symbols).
WM2013 Conference, February 24 – 28, 2013, Phoenix, Arizona USA
10
Figure 8. Predicted concentrations of relative Nitrate concentrations based on Static Measurements (100% = 2.12 M). Blue symbols are predictions using model without turbidity included as input into dataset. Green symbols are predictions of nitrate using turbidity measurements included in dataset.
Figure 9. Predicted concentrations of NaNO3, NaNO2, and Na2SO4 in constant turbidity (500 NTU) Matrix. Open symbols are predictions of each salt using model without turbidity included as input into dataset. Closed symbols are predictions of each salt using turbidity measurements included in dataset.
WM2013 Conference, February 24 – 28, 2013, Phoenix, Arizona USA
11
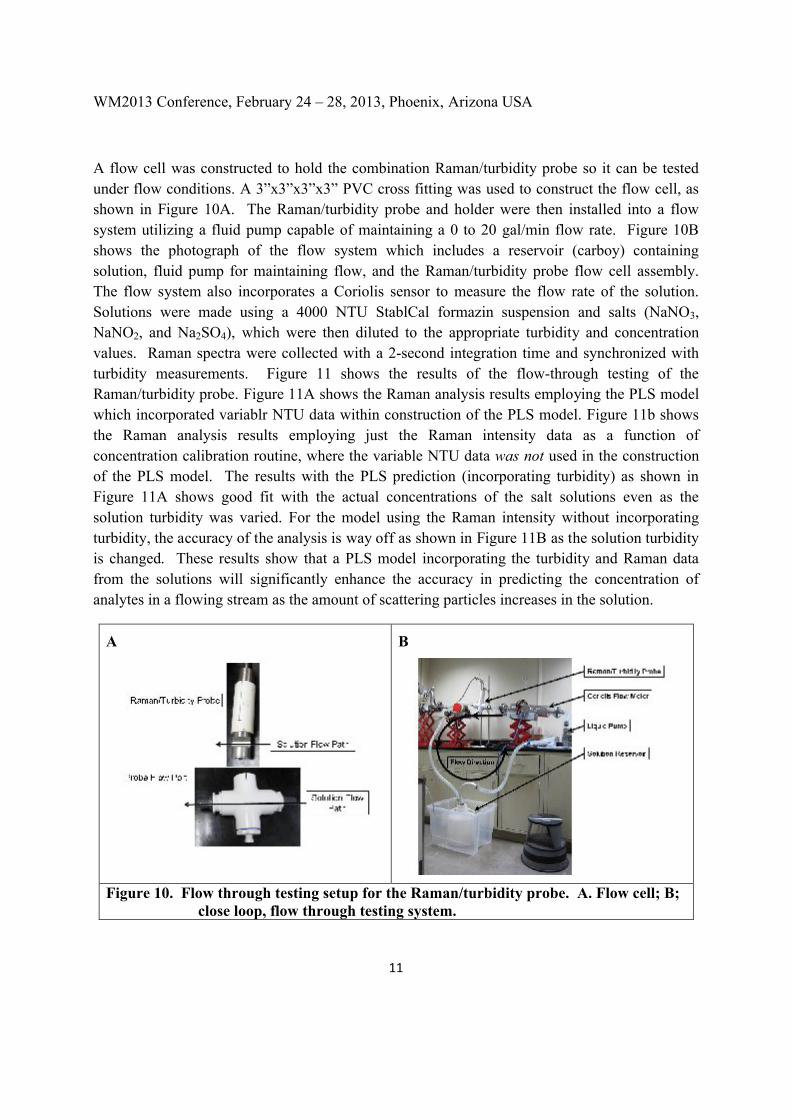
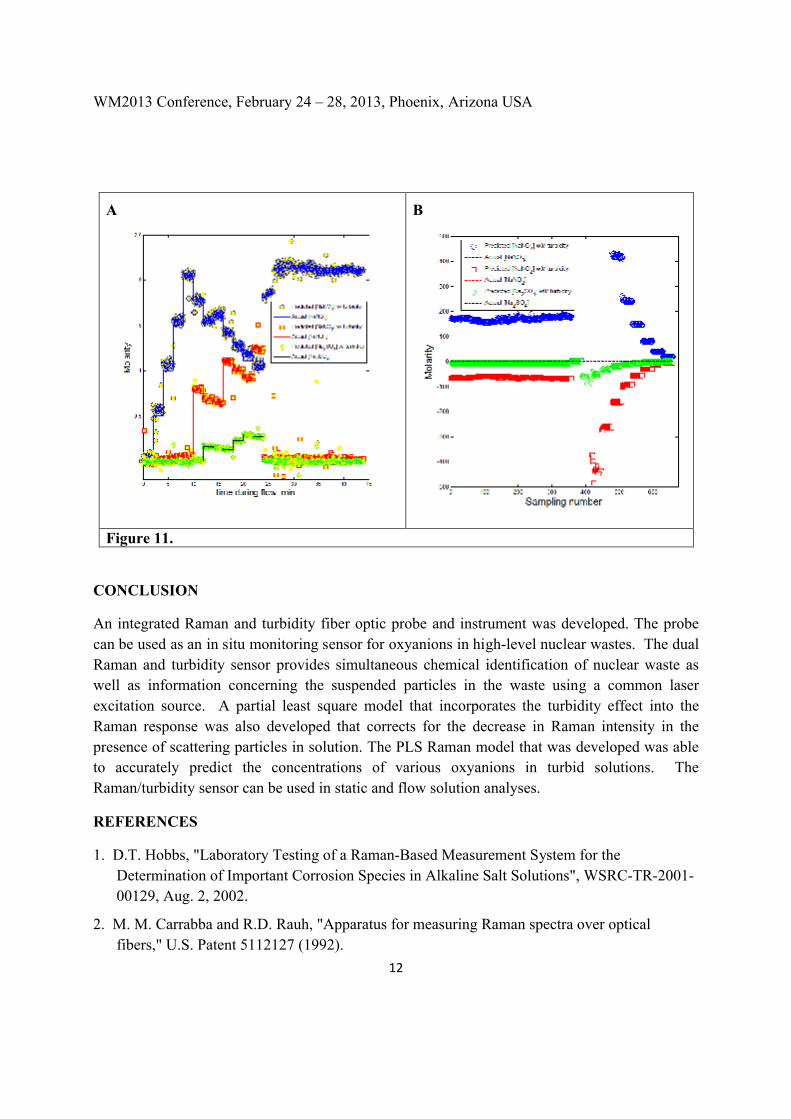
A flow cell was constructed to hold the combination Raman/turbidity probe so it can be tested under flow conditions. A 3”x3”x3”x3” PVC cross fitting was used to construct the flow cell, as shown in Figure 10A. The Raman/turbidity probe and holder were then installed into a flow system utilizing a fluid pump capable of maintaining a 0 to 20 gal/min flow rate. Figure 10B shows the photograph of the flow system which includes a reservoir (carboy) containing solution, fluid pump for maintaining flow, and the Raman/turbidity probe flow cell assembly. The flow system also incorporates a Coriolis sensor to measure the flow rate of the solution. Solutions were made using a 4000 NTU StablCal formazin suspension and salts (NaNO3, NaNO2, and Na2SO4), which were then diluted to the appropriate turbidity and concentration values. Raman spectra were collected with a 2-second integration time and synchronized with turbidity measurements. Figure 11 shows the results of the flow-through testing of the Raman/turbidity probe. Figure 11A shows the Raman analysis results employing the PLS modelwhich incorporated variablr NTU data within construction of the PLS model. Figure 11b shows the Raman analysis results employing just the Raman intensity data as a function of concentration calibration routine, where the variable NTU data was not used in the construction of the PLS model. The results with the PLS prediction (incorporating turbidity) as shown in Figure 11A shows good fit with the actual concentrations of the salt solutions even as the solution turbidity was varied. For the model using the Raman intensity without incorporating turbidity, the accuracy of the analysis is way off as shown in Figure 11B as the solution turbidity is changed. These results show that a PLS model incorporating the turbidity and Raman data from the solutions will significantly enhance the accuracy in predicting the concentration of analytes in a flowing stream as the amount of scattering particles increases in the solution.
A B
Figure 10. Flow through testing setup for the Raman/turbidity probe. A. Flow cell; B; close loop, flow through testing system.
WM2013 Conference, February 24 – 28, 2013, Phoenix, Arizona USA
12
A B
Figure 11.
CONCLUSION
An integrated Raman and turbidity fiber optic probe and instrument was developed. The probe can be used as an in situ monitoring sensor for oxyanions in high-level nuclear wastes. The dual Raman and turbidity sensor provides simultaneous chemical identification of nuclear waste as well as information concerning the suspended particles in the waste using a common laser excitation source. A partial least square model that incorporates the turbidity effect into the Raman response was also developed that corrects for the decrease in Raman intensity in the presence of scattering particles in solution. The PLS Raman model that was developed was able to accurately predict the concentrations of various oxyanions in turbid solutions. The Raman/turbidity sensor can be used in static and flow solution analyses.
REFERENCES
1. D.T. Hobbs, "Laboratory Testing of a Raman-Based Measurement System for the Determination of Important Corrosion Species in Alkaline Salt Solutions", WSRC-TR-2001-00129, Aug. 2, 2002.
2. M. M. Carrabba and R.D. Rauh, "Apparatus for measuring Raman spectra over optical fibers," U.S. Patent 5112127 (1992).

WM2013 Conference, February 24 – 28, 2013, Phoenix, Arizona USA
13
ACKNOWLEDGEMENTS
This research is funded by a US Department of Energy STTR program (Contract #: DE-SC0001231).