Embed Size (px)
Citation preview
3/10/2017
1
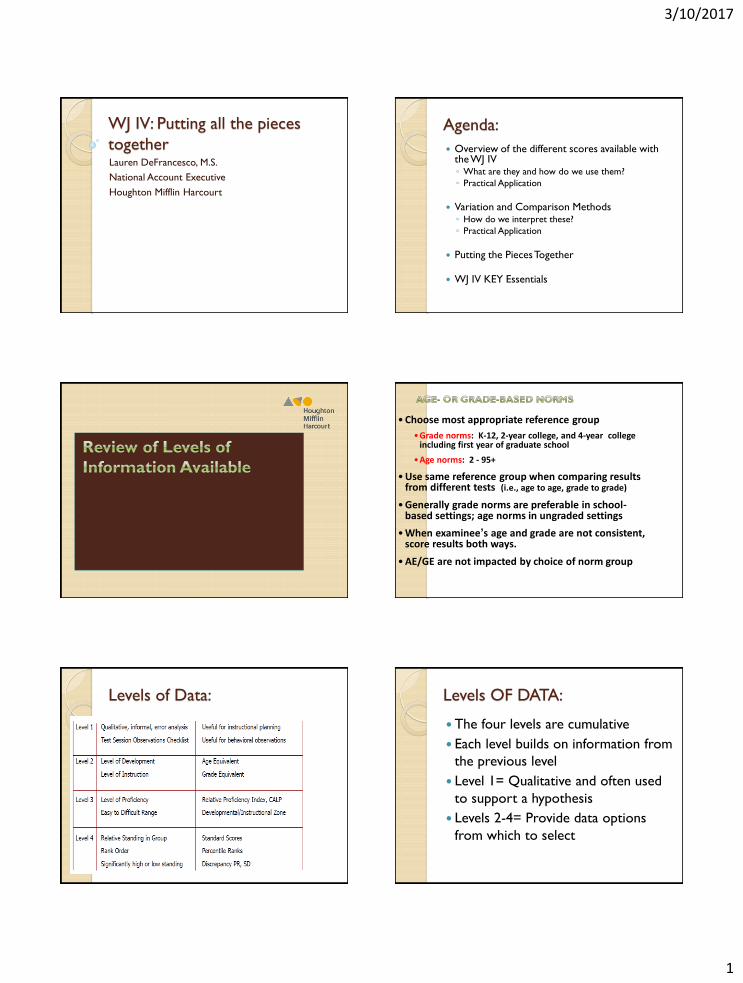
WJ IV: Putting all the pieces
together Lauren DeFrancesco, M.S.
National Account Executive
Houghton Mifflin Harcourt
Agenda:
Overview of the different scores available with the WJ IV ◦ What are they and how do we use them?
◦ Practical Application
Variation and Comparison Methods ◦ How do we interpret these?
◦ Practical Application
Putting the Pieces Together
WJ IV KEY Essentials
• Choose most appropriate reference group
•Grade norms: K-12, 2-year college, and 4-year college including first year of graduate school
•Age norms: 2 - 95+
• Use same reference group when comparing results from different tests (i.e., age to age, grade to grade)
• Generally grade norms are preferable in school-based settings; age norms in ungraded settings
• When examinee’s age and grade are not consistent, score results both ways.
• AE/GE are not impacted by choice of norm group
Levels of Data:
Levels OF DATA:
The four levels are cumulative
Each level builds on information from
the previous level
Level 1= Qualitative and often used
to support a hypothesis
Levels 2-4= Provide data options
from which to select
3/10/2017
2
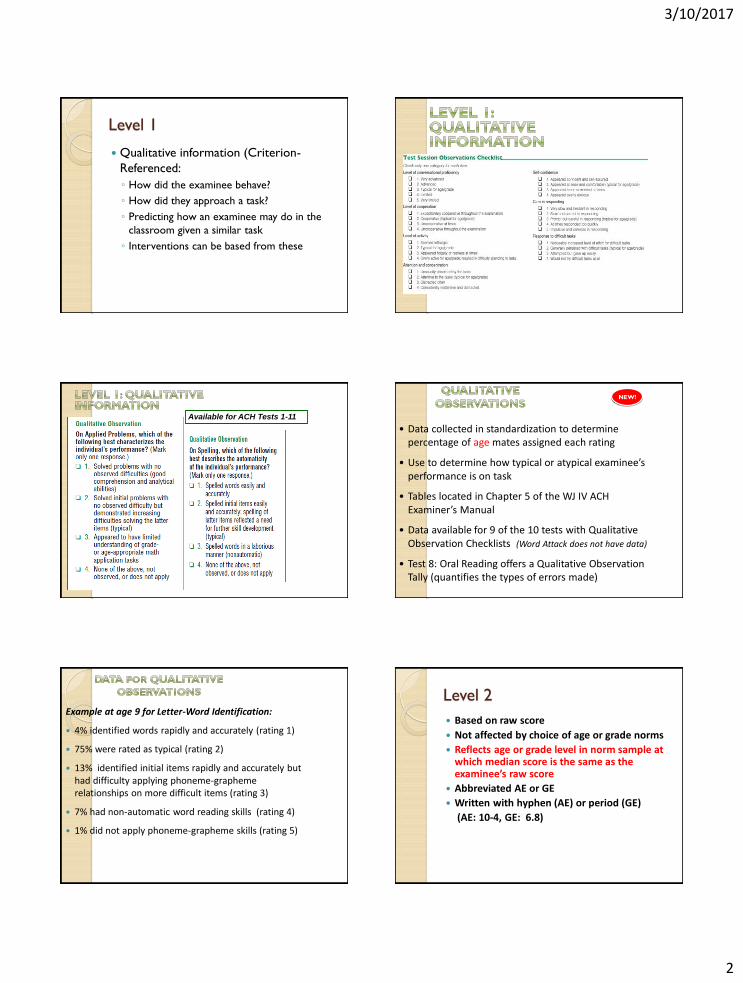
Level 1
Qualitative information (Criterion-
Referenced:
◦ How did the examinee behave?
◦ How did they approach a task?
◦ Predicting how an examinee may do in the
classroom given a similar task
◦ Interventions can be based from these
Available for ACH Tests 1-11
• Data collected in standardization to determine percentage of age mates assigned each rating
• Use to determine how typical or atypical examinee’s performance is on task
• Tables located in Chapter 5 of the WJ IV ACH Examiner’s Manual
• Data available for 9 of the 10 tests with Qualitative Observation Checklists (Word Attack does not have data)
• Test 8: Oral Reading offers a Qualitative Observation Tally (quantifies the types of errors made)
NEW!
Example at age 9 for Letter-Word Identification:
4% identified words rapidly and accurately (rating 1)
75% were rated as typical (rating 2)
13% identified initial items rapidly and accurately but had difficulty applying phoneme-grapheme relationships on more difficult items (rating 3)
7% had non-automatic word reading skills (rating 4)
1% did not apply phoneme-grapheme skills (rating 5)
Level 2
Based on raw score
Not affected by choice of age or grade norms
Reflects age or grade level in norm sample at which median score is the same as the examinee’s raw score
Abbreviated AE or GE
Written with hyphen (AE) or period (GE)
(AE: 10-4, GE: 6.8)
3/10/2017
3
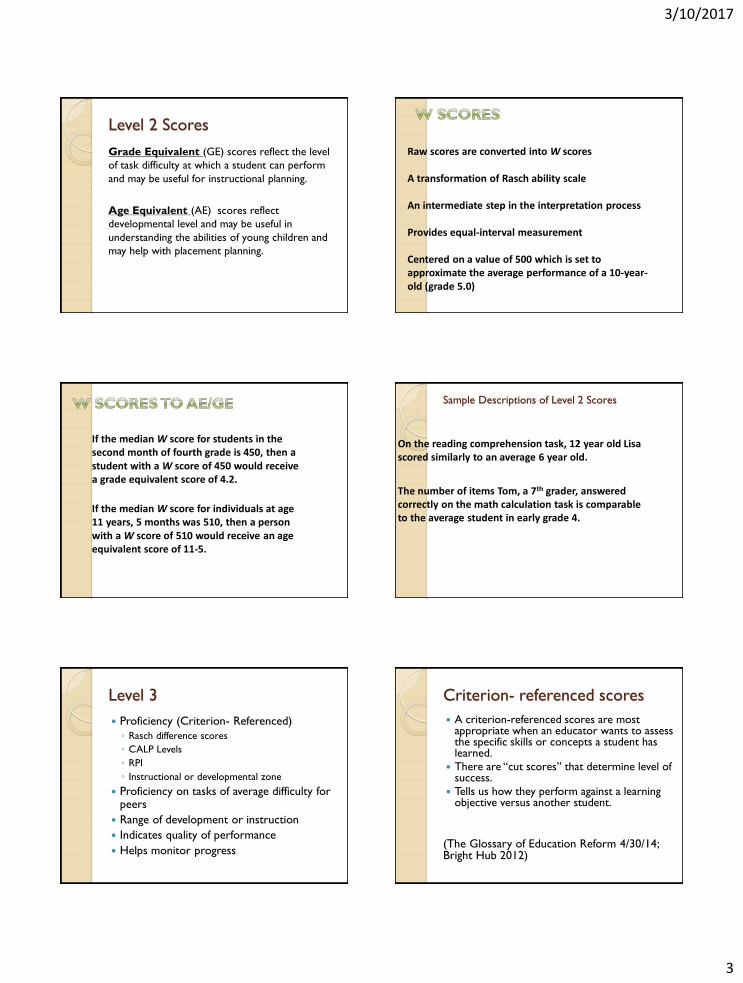
Level 2 Scores
Grade Equivalent (GE) scores reflect the level
of task difficulty at which a student can perform
and may be useful for instructional planning.
Age Equivalent (AE) scores reflect
developmental level and may be useful in
understanding the abilities of young children and
may help with placement planning.
Raw scores are converted into W scores A transformation of Rasch ability scale An intermediate step in the interpretation process Provides equal-interval measurement Centered on a value of 500 which is set to approximate the average performance of a 10-year-old (grade 5.0)
If the median W score for students in the second month of fourth grade is 450, then a student with a W score of 450 would receive a grade equivalent score of 4.2.
If the median W score for individuals at age 11 years, 5 months was 510, then a person with a W score of 510 would receive an age equivalent score of 11-5.
On the reading comprehension task, 12 year old Lisa scored similarly to an average 6 year old.
The number of items Tom, a 7th grader, answered correctly on the math calculation task is comparable to the average student in early grade 4.
Sample Descriptions of Level 2 Scores
Level 3
Proficiency (Criterion- Referenced)
◦ Rasch difference scores
◦ CALP Levels
◦ RPI
◦ Instructional or developmental zone
Proficiency on tasks of average difficulty for peers
Range of development or instruction
Indicates quality of performance
Helps monitor progress
Criterion- referenced scores
A criterion-referenced scores are most appropriate when an educator wants to assess the specific skills or concepts a student has learned.
There are “cut scores” that determine level of success.
Tells us how they perform against a learning objective versus another student.
(The Glossary of Education Reform 4/30/14; Bright Hub 2012)
3/10/2017
4
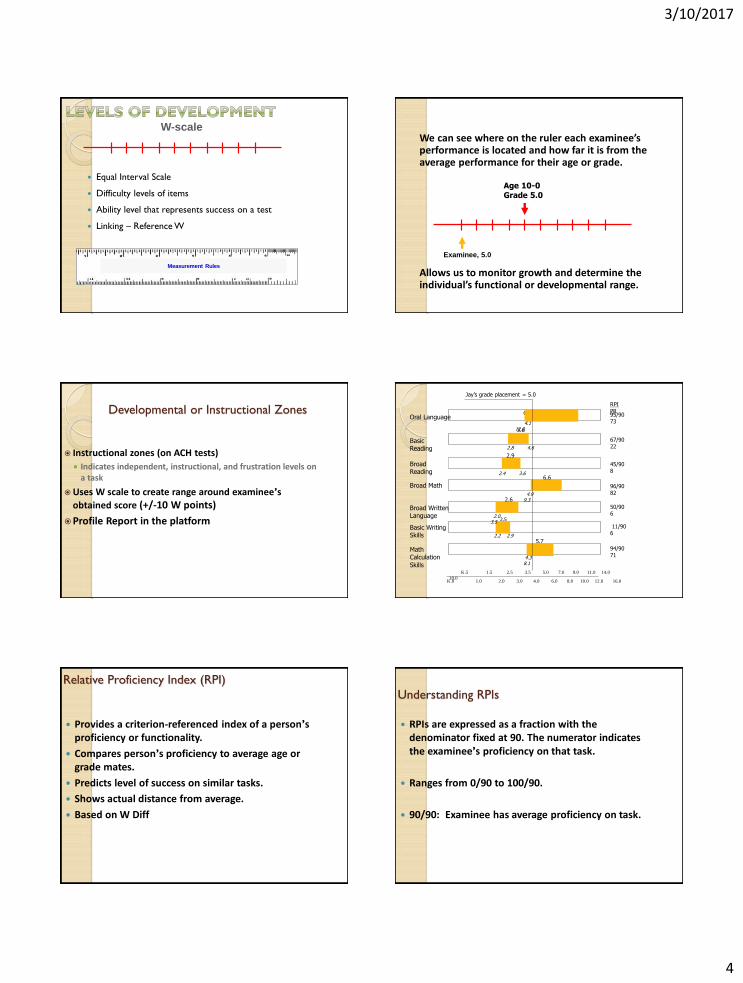
Equal Interval Scale
Difficulty levels of items
Ability level that represents success on a test
Linking – Reference W
W-scale
Measurement Rules
Allows us to monitor growth and determine the individual’s functional or developmental range.
Age 10-0 Grade 5.0
Examinee, 5.0
We can see where on the ruler each examinee’s performance is located and how far it is from the average performance for their age or grade.
Instructional zones (on ACH tests)
Indicates independent, instructional, and frustration levels on a task
Uses W scale to create range around examinee’s
obtained score (+/-10 W points)
Profile Report in the platform
Developmental or Instructional Zones
2.5
6.9
3.6
2.9
6.6
2.6
5.7
Oral Language
Basic Reading
Broad Reading
Broad Math
Broad Written Language
Basic Writing Skills
Math Calculation
Skills
Jay’s grade placement = 5.0
4.1 12.3
2.8 4.6
2.4 3.6
4.9 9.3
2.0 3.5
2.2 2.9
4.3 8.1
95/90 73
67/90 22
45/90 8
96/90 82
50/90 6
11/90 6
94/90 71
RPI PR
K.0 1.0 2.0 3.0 4.0 6.0 8.0 10.0 12.0 16.0
K.5 1.5 2.5 3.5 5.0 7.0 9.0 11.0 14.0
18.0
Relative Proficiency Index (RPI)
Provides a criterion-referenced index of a person’s proficiency or functionality.
Compares person’s proficiency to average age or grade mates.
Predicts level of success on similar tasks.
Shows actual distance from average.
Based on W Diff
Understanding RPIs
RPIs are expressed as a fraction with the denominator fixed at 90. The numerator indicates the examinee’s proficiency on that task.
Ranges from 0/90 to 100/90.
90/90: Examinee has average proficiency on task.
3/10/2017
5
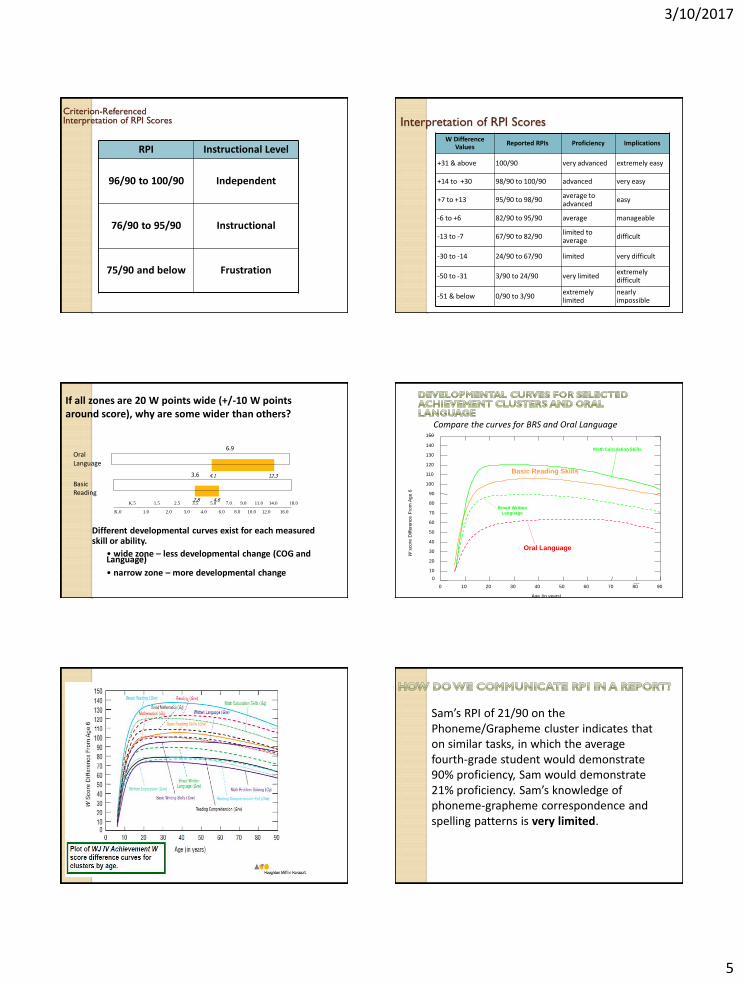
Criterion-Referenced Interpretation of RPI Scores
RPI Instructional Level
96/90 to 100/90
Independent
76/90 to 95/90
Instructional
75/90 and below
Frustration
Interpretation of RPI Scores
W Difference Values
Reported RPIs Proficiency Implications
+31 & above 100/90 very advanced extremely easy
+14 to +30 98/90 to 100/90 advanced very easy
+7 to +13 95/90 to 98/90 average to advanced
easy
-6 to +6 82/90 to 95/90 average manageable
-13 to -7 67/90 to 82/90 limited to average
difficult
-30 to -14 24/90 to 67/90 limited very difficult
-50 to -31 3/90 to 24/90 very limited extremely difficult
-51 & below 0/90 to 3/90 extremely limited
nearly impossible
If all zones are 20 W points wide (+/-10 W points around score), why are some wider than others?
Different developmental curves exist for each measured skill or ability.
• wide zone – less developmental change (COG and Language)
• narrow zone – more developmental change
4.1 12.3
2.8 4.6
6.9
K.0 1.0 2.0 3.0 4.0 6.0 8.0 10.0 12.0 16.0
K.5 1.5 2.5 3.5 5.0 7.0 9.0 11.0 14.0 18.0
3.6
Oral Language
Basic Reading
0 10 20 30 40 50 60 70 80 90
0
10
20
30
40
50
60
70
80
90
100
110
120
130
140
150
Math Calculation Skills
Basic Reading Skills
Broad Written
Language
Oral Language
W s
core
Diff
ere
nce F
rom
Ag
e 6
Age (in years)
Compare the curves for BRS and Oral Language
Sam’s RPI of 21/90 on the Phoneme/Grapheme cluster indicates that on similar tasks, in which the average fourth-grade student would demonstrate 90% proficiency, Sam would demonstrate 21% proficiency. Sam’s knowledge of phoneme-grapheme correspondence and spelling patterns is very limited.
3/10/2017
6
*RPI uses average W for age or grade on task as beginning
reference.
**RPI is determined by how many W points above or below
that reference W the individual’s score falls.
(Reminder:The GE and AE are also calculated this way)
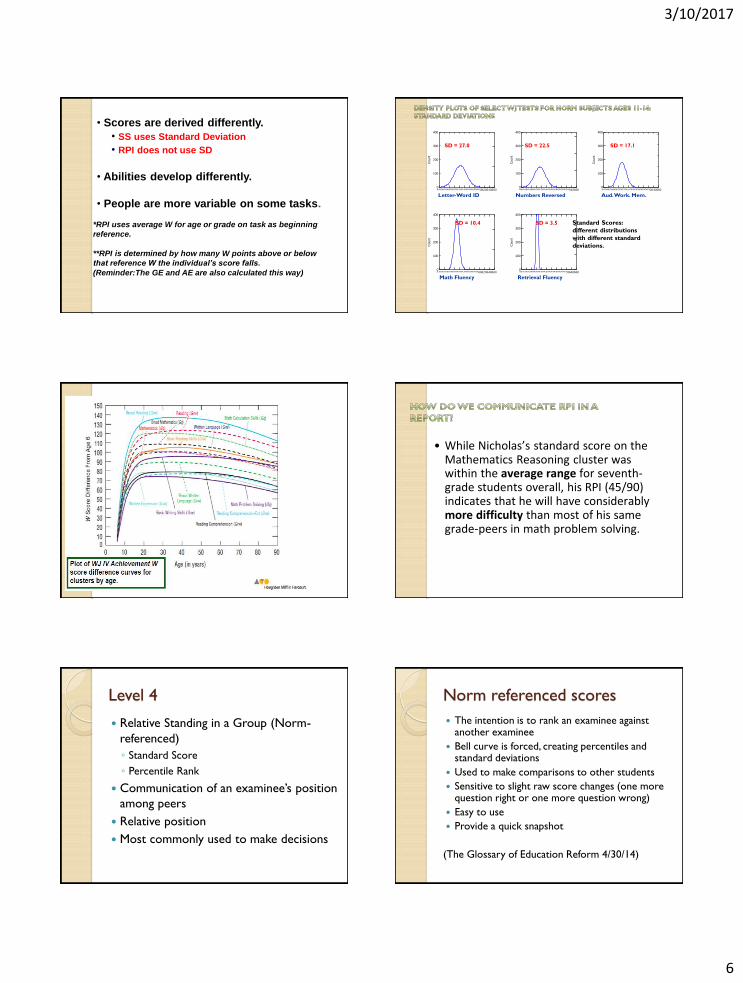
• Scores are derived differently.
• SS uses Standard Deviation
• RPI does not use SD
• Abilities develop differently.
• People are more variable on some tasks.
440460480500520540560580600620640660
LWIDNTW
0
100
200
300
400
Count
440460480500520540560580600620640660
NUMREVW
0
100
200
300
400
Count
440460480500520540560580600620640660
AWKMEMW
0
100
200
300
400
Count
440460480500520540560580600620640660
MTHFLUW
0
100
200
300
400
Count
440460480500520540560580600620640660
RETFLUW
0
100
200
300
400
Count
SD = 27.0 SD = 17.1 SD = 22.5
SD = 10.4 SD = 3.5
Letter-Word ID
Retrieval Fluency Math Fluency
Numbers Reversed Aud. Work. Mem.
Standard Scores:
different distributions
with different standard
deviations.
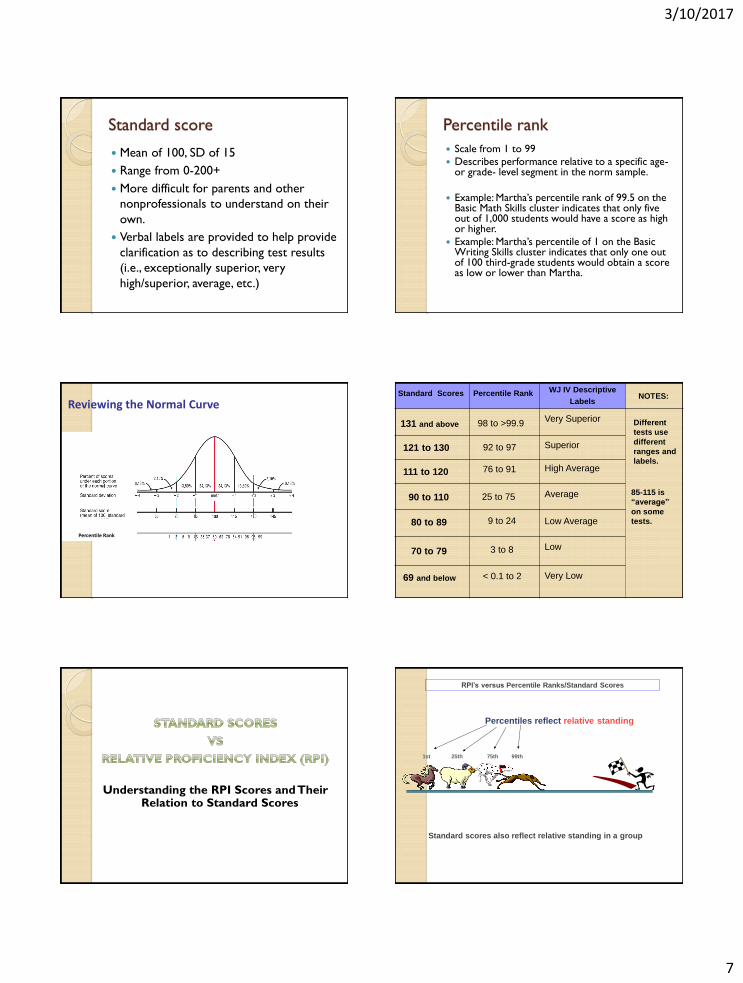
• While Nicholas’s standard score on the Mathematics Reasoning cluster was within the average range for seventh-grade students overall, his RPI (45/90) indicates that he will have considerably more difficulty than most of his same grade-peers in math problem solving.
Level 4
Relative Standing in a Group (Norm-
referenced)
◦ Standard Score
◦ Percentile Rank
Communication of an examinee’s position
among peers
Relative position
Most commonly used to make decisions
Norm referenced scores
The intention is to rank an examinee against another examinee
Bell curve is forced, creating percentiles and standard deviations
Used to make comparisons to other students
Sensitive to slight raw score changes (one more question right or one more question wrong)
Easy to use
Provide a quick snapshot
(The Glossary of Education Reform 4/30/14)
3/10/2017
7
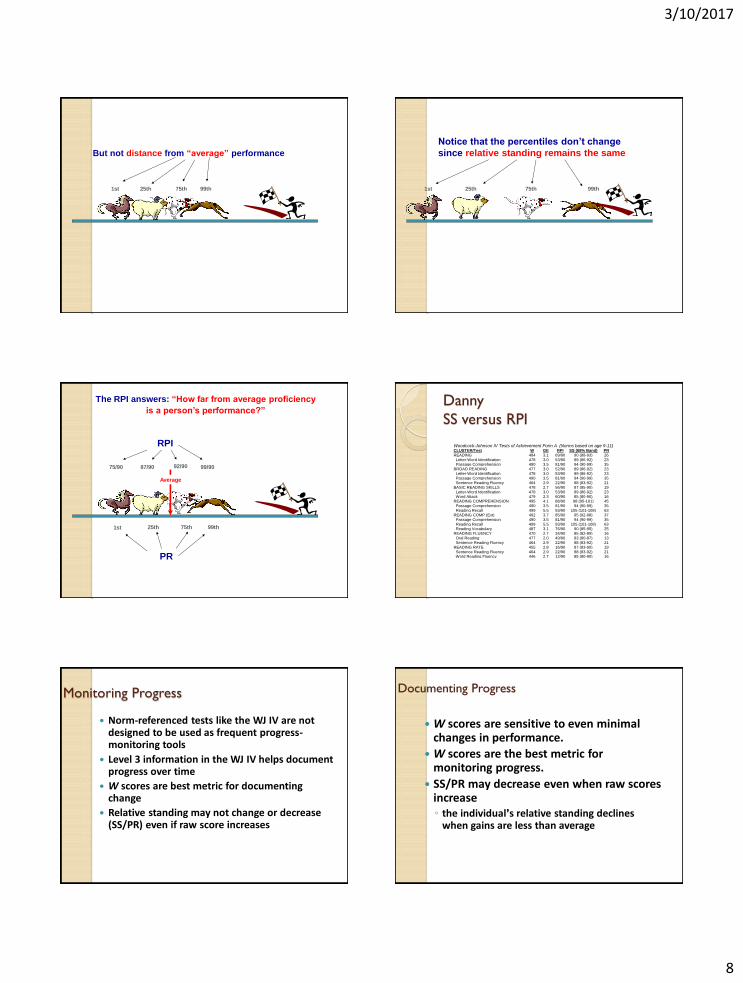
Standard score
Mean of 100, SD of 15
Range from 0-200+
More difficult for parents and other
nonprofessionals to understand on their
own.
Verbal labels are provided to help provide
clarification as to describing test results
(i.e., exceptionally superior, very
high/superior, average, etc.)
Percentile rank
Scale from 1 to 99
Describes performance relative to a specific age- or grade- level segment in the norm sample.
Example: Martha’s percentile rank of 99.5 on the Basic Math Skills cluster indicates that only five out of 1,000 students would have a score as high or higher.
Example: Martha’s percentile of 1 on the Basic Writing Skills cluster indicates that only one out of 100 third-grade students would obtain a score as low or lower than Martha.
Reviewing the Normal Curve
Percentile Rank
Low Average
9 to 24 80 to 89
Average 25 to 75 90 to 110
Very Superior 98 to >99.9 131 and above
WJ IV Descriptive
Labels Percentile Rank Standard Scores
121 to 130 Superior 92 to 97
76 to 91 111 to 120 High Average
Low 3 to 8 70 to 79
Very Low
< 0.1 to 2 69 and below
85-115 is
“average”
on some
tests.
NOTES:
Different
tests use
different
ranges and
labels.
Understanding the RPI Scores and Their
Relation to Standard Scores
25th 1st 75th 99th
Percentiles reflect relative standing
Standard scores also reflect relative standing in a group
RPI’s versus Percentile Ranks/Standard Scores
3/10/2017
8
But not distance from “average” performance
25th 1st 75th 99th 25th 1st 75th 99th
Notice that the percentiles don’t change
since relative standing remains the same
The RPI answers: “How far from average proficiency
is a person’s performance?”
75/90 87/90 92/90 99/90
RPI
1st 25th 75th 99th
PR
Average
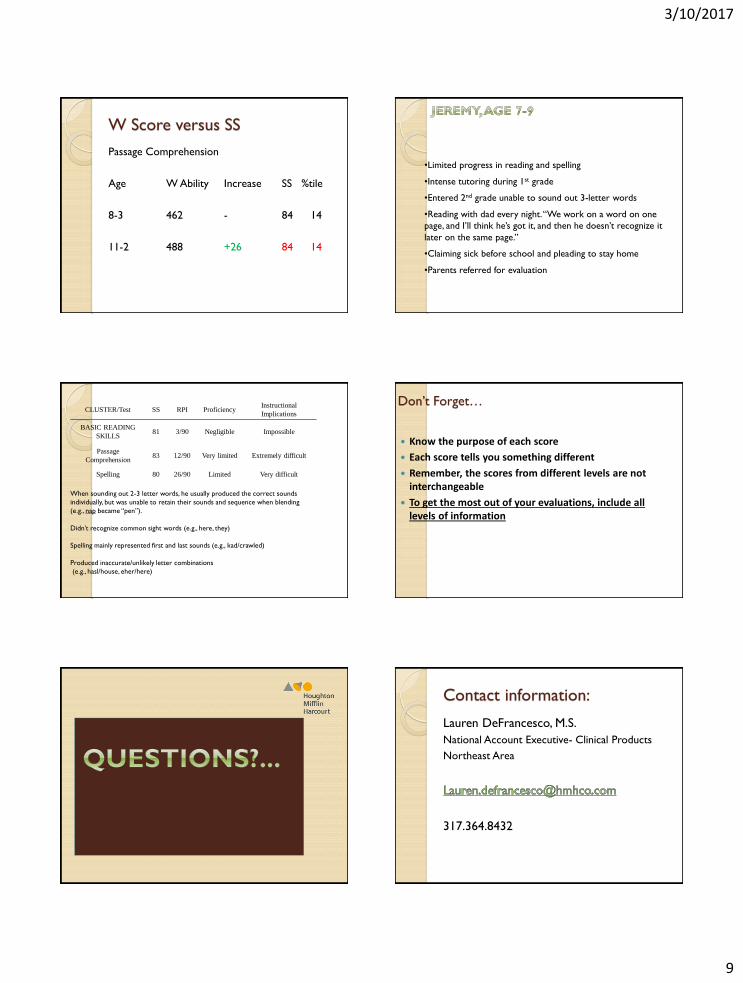
Danny
SS versus RPI
Woodcock-Johnson IV Tests of Achievement Form A (Norms based on age 9-11) CLUSTER/Test W GE RPI SS (68% Band) PR READING 484 3.1 69/90 90 (88-93) 26 Letter-Word Identification 478 3.0 53/90 89 (86-92) 23 Passage Comprehension 490 3.5 81/90 94 (90-99) 35 BROAD READING 477 3.0 52/90 89 (86-92) 23 Letter-Word Identification 478 3.0 53/90 89 (86-92) 23 Passage Comprehension 490 3.5 81/90 94 (90-99) 35 Sentence Reading Fluency 464 2.9 22/90 88 (83-92) 21 BASIC READING SKILLS 478 2.7 56/90 87 (85-90) 19 Letter-Word Identification 478 3.0 53/90 89 (86-92) 23 Word Attack 479 2.3 60/90 85 (80-90) 16 READING COMPREHENSION 495 4.1 88/90 98 (95-101) 45 Passage Comprehension 490 3.5 81/90 94 (90-99) 35 Reading Recall 499 5.5 93/90 105 (101-108) 63 READING COMP (Ext) 492 3.7 85/90 95 (92-98) 37 Passage Comprehension 490 3.5 81/90 94 (90-99) 35 Reading Recall 499 5.5 93/90 105 (101-108) 63 Reading Vocabulary 487 3.1 76/90 90 (85-95) 25 READING FLUENCY 470 2.7 34/90 85 (82-89) 16 Oral Reading 477 2.0 49/90 83 (80-87) 13 Sentence Reading Fluency 464 2.9 22/90 88 (83-92) 21 READING RATE 455 2.8 16/90 87 (83-90) 19 Sentence Reading Fluency 464 2.9 22/90 88 (83-92) 21 Word Reading Fluency 446 2.7 12/90 85 (80-90) 16
Monitoring Progress
Norm-referenced tests like the WJ IV are not designed to be used as frequent progress-monitoring tools
Level 3 information in the WJ IV helps document progress over time
W scores are best metric for documenting change
Relative standing may not change or decrease (SS/PR) even if raw score increases
Documenting Progress
W scores are sensitive to even minimal changes in performance.
W scores are the best metric for monitoring progress.
SS/PR may decrease even when raw scores increase ◦ the individual’s relative standing declines
when gains are less than average
3/10/2017
9
W Score versus SS
Passage Comprehension
Age W Ability Increase SS %tile
8-3 462 - 84 14
11-2 488 +26 84 14
•Limited progress in reading and spelling
•Intense tutoring during 1st grade
•Entered 2nd grade unable to sound out 3-letter words
•Reading with dad every night. “We work on a word on one
page, and I’ll think he’s got it, and then he doesn’t recognize it
later on the same page.”
•Claiming sick before school and pleading to stay home
•Parents referred for evaluation
CLUSTER/Test SS RPI Proficiency Instructional
Implications
BASIC READING
SKILLS 81 3/90 Negligible Impossible
Passage
Comprehension 83 12/90 Very limited Extremely difficult
Spelling 80 26/90 Limited Very difficult
When sounding out 2-3 letter words, he usually produced the correct sounds
individually, but was unable to retain their sounds and sequence when blending
(e.g., nap became “pen”).
Didn’t recognize common sight words (e.g., here, they)
Spelling mainly represented first and last sounds (e.g., kad/crawled)
Produced inaccurate/unlikely letter combinations
(e.g., hasl/house, eher/here)
Don’t Forget…
Know the purpose of each score
Each score tells you something different
Remember, the scores from different levels are not interchangeable
To get the most out of your evaluations, include all levels of information
Contact information:
Lauren DeFrancesco, M.S.
National Account Executive- Clinical Products
Northeast Area
317.364.8432