Embed Size (px)
DESCRIPTION
Lean manufacturing
Citation preview


Lean at Wits 2

Lean at Wits 3

‘All models are wrong; some models are useful’ (George Box, a likely candidate for the sta>s>cian of the 20th Century.)
Lean at Wits 4

World Class Priorities...
Lean at Wits
Lean Operations
Six Sigma
Supply Chain
Lean Thinking Sy
stem
s
Thin
king
5

Process Thinking
Lean at Wits 6
MRP MRPII ERP
TOYOTA LEAN
DEMING TQC TQM SIX SIGMA
TAYLOR MASS BATCH
COLT FORD
TPM
TOC Factory Physics
AGILE Lean Startup

Different Starting Points
Lean at Wits
TOYOTA LEAN
DEMING TQC TQM SIX SIGMA
AGILE Lean Startup
TPM
TOC Factory Physics
TAYLOR MASS BATCH
VARIANCE
VOLATILITY
LEAD TIME
AVAILABILITY
BOTTLENECKS
UTILISATION
P. CONTROL MRP MRPII ERP
7

See The Lean Toolbox, Chronology
Lean at Wits
Whitney Taylor Gilbreth Ford Ohno Shingo Toyoda
8

1950 to 1975 What was Toyota doing? Ohno? Shingo? (See ‘Art of Lean’ website) Beware….
Lean at Wits 9

Lean at Wits 10
Sea temperature is influenced by currents of the business environment
…
….and by natural laws that cannot be broken
(like Kingman’s equation)
If these change, the
Iceberg melts…
irrespective of tools and
culture!

The purpose of the Toyota Manufacturing System (or Lean Manufacturing) was defined by Taiichi Ohno (1988) to be ‘. . . looking at the ,meline from the moment the customer gives us an order to the point when we collect the cash. And we are reducing that ,me line by removing the non-‐value-‐added wastes’.
Lean at Wits 11
Order Cash (reduce by removing non-value added wastes)
Toyota Production System Time Line
A modification ? ‘Idea to Cash’

Lean at Wits 12 D.Wayne, 2007. Deming Management Philosophy and so called Six Sigma Quality.

Lean at Wits 13 D.Wayne, 2007. Deming Management Philosophy and so called Six Sigma Quality.

The ‘Adjacent Possible’ § Darwin’s Paradox § Ci>es § Prin>ng § Journals and Tim Berners-‐Lee
Lean futures?
Lean at Wits 14
‘Fortune favours the prepared mind’
‘Adjacent Possible’ is discussed at length in Steven Johnson, Where Good Ideas Come From, Penguin, 2010

Lean at Wits
15
Engines Daimler & Benz
Standardisation of parts
Electric Motors
Job Specialisation
Ford and the Assembly Line
Moving Line and
Disassembly
Juran and Deming Quality and ’94/6’
People
The Loom
Line stop
Small batches Cash
Shortages Toyota Production System
Pull & Kanban
Hawthorne Bicycles and
Roads
Innovation and parts reduction, but then
becoming more rigid
Strikes but leading to teams and job
security

Who was Malcolm McLean? Who was Billy Durant?
Lean at Wits 16
William Durant McLean
Lean at Wits 17

Lean at Wits
18
After Rother and Liker

Lean at Wits 19
After Rother and Liker

Lean at Wits 20
After Rother and Liker

“My favourite word is ‘understanding’” Don’t use consultants. They will bring old ideas. For breakthrough you need to develop ideas yourself Humans are addicted to hoarding. This goes back to the security required by ancient man. But it is a habit that must be broken, because excessive inventory is a severe waste The greatest waste is overproduc>on
Have we forgotten?
Lean at Wits
21

JIT and automa>on. Both are needed equally. But in the West far more a`en>on has been given to JIT The two dis>nguishing features of TPS that makes it different from mass produc>on are small lot sizes and levelling the schedule Standardiza>on should never get in the way of crea>ve thinking
Have we forgotten
Lean at Wits
22

Sakichi Toyoda as a great inventor. He developed may machines by experimenta>on There are three levels of schedule. The annual plan, monthly plan, and daily schedule. All must be capable of change if required. But only if there is significant change. Stability is required. The plant should be like the human body. The nervous system works automa>cally responding to changes in the environment without having to refer to higher level decision making.
Lean at Wits 23

Excessive informa>on must be suppressed. Computers are useful and fast calcula>on tools, but should never be allowed to take over decision making from people. Computers generate huge volumes of informa>on, much of it unnecessary for running a plant. TPS is profit based industrial engineering
?
Lean at Wits 24

First published in 1859 ‘The spirit of self help is the root of all genuine growth in the individual; and, exhibited in the lives of many, it cons>tutes the true source of na>onal vigor and strength’
By learning to be more efficient, employees could improve the quality of their own lives and those of co-‐workers. They could also improve the quality of life for the people who used the products they made, which were consequently of more use and value.
‘The greatest results in life are usually a`ained by the exercise of ordinary quali>es… they who are the most persistent, and work with the truest spirit, will usually be the most successful.’
It is the only book on display at Sakichi Toyoda’s birthplace
Lean at Wits 25

Some Chapters Self Help -‐ many great mean of humble origins, and self
taught Leaders and inventors -‐ who learned by doing and
observa>on The Po`ers -‐ searching for the secrets Applica>on and perseverance -‐ ‘genius is pa>ence’ Helps and opportuni>es -‐ Wa`, Brunel, Newton, Priestly -‐
observing with intelligence (at gemba) Ar>sts -‐ wealth not the ruling mo>ve Energy and courage -‐ the force of purpose, and
promp>tude of ac>on -‐ Wellington, Napoleon, Dr Livingstone
Men of Business -‐ a`en>on to detail, economy of >me, accuracy, punctuality -‐ Wordsworth, Shakespeare, Walter Sco`, Dr Johnson
Money -‐ living within means, frugality, riches no proof of wealth, independence a`ainable
Lean at Wits
See also Terence Keely Sex, Science and Profits
26

Specify what creates value from the customers perspec>ve Iden>fy all steps across the whole value stream Make those ac>ons that create value flow Only make what is pulled by the customer just-‐in-‐>me Strive for perfec,on by con>nually removing successive layers of waste
Lean at Wits 27

Lean at Wits 28

Lean at Wits 29
0 200 400 600 800
1000
iPad 4 64G US$

Lean at Wits 30
Source: Ma`hias Holweg and 3 Day Car

Lean at Wits 31 Source: Ma`hias Holweg and 3 Day Car
0 10 20 30 40 50 60 70 80 90
100 R
aw M
ater
ial
Bou
ght-o
ut P
arts
In-h
ouse
bui
lt P
arts
Pre
-Ass
embl
y W
IP
Ass
embl
y W
IP
Fini
shed
Com
pone
nts
Inbo
und
Tran
sit
On-
site
Par
t (V
M)
Vehi
cle
Pro
duct
ion
WIP
Load
ing
&
Des
patc
h O
utbo
und
Tran
sit
Mar
ketp
lace
Cus
tom
er
Day
s of
Inve
ntor
y
Max Average Min
First Tier Suppliers Vehicle
Manufacturers Distribution & Retail Outbound
Logistics Inbound Logistics

Solve my problem completely Don’t waste my >me Get me exactly what I want Provide value where I want it Solve my problem when I want Get me the solu>on I REALLY WANT
Lean at Wits 32

How do we know what the customer’s real problem is? § Drills or holes? § ‘Bed blocking’ § Customer’s actual >ming requirements or the salesman’s incen>ve?
Study it, by direct observa>on. Remember, all Demand is not ‘work’
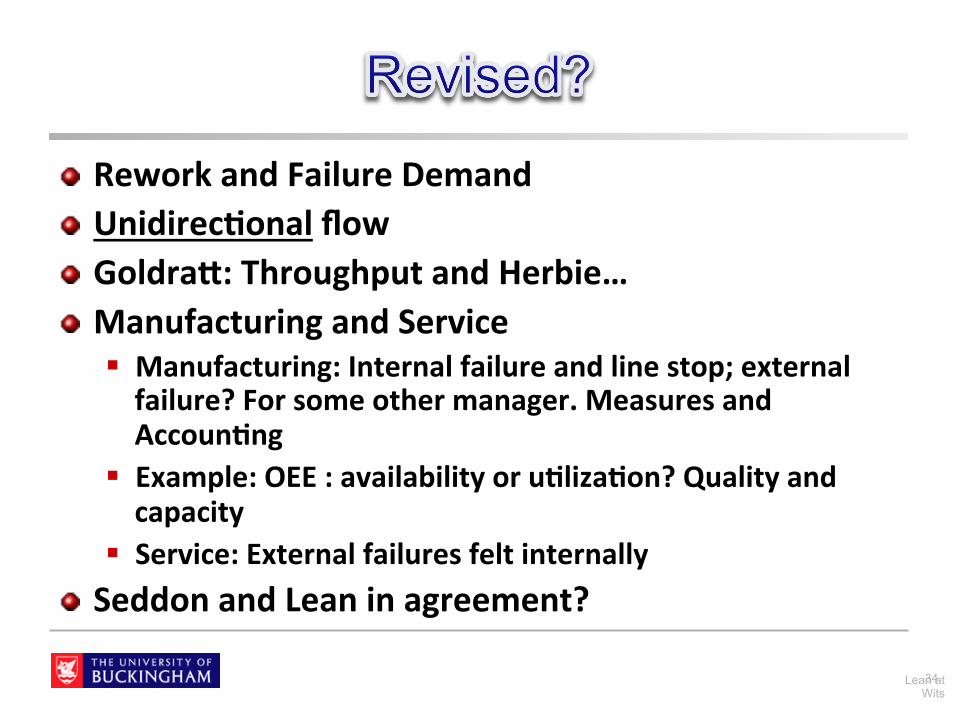
Rework and Failure Demand Unidirec>onal flow Goldra`: Throughput and Herbie… Manufacturing and Service § Manufacturing: Internal failure and line stop; external failure? For some other manager. Measures and Accoun>ng
§ Example: OEE : availability or u>liza>on? Quality and capacity
§ Service: External failures felt internally Seddon and Lean in agreement?
Lean at Wits 34

Customers and Value § for Customers and all
Stakeholders § Benefit / (Costs + Harm); § Value demand vs Failure
Demand (or Rework) People § Deming’s 94 /6 § Trust § Mo>va>on and ‘small wins’
§ The brain and thinking. Bias.
System § end-‐to-‐end value streams § holis>c, integrated, with
feedback Process efficiency
§ Flow efficiency not resource efficiency
§ Con>nuous improvement § The ‘big five’ opera>ons
concepts § Timing
Innova>on § S curves and the need for
breakthrough
Lean at Wits 35

Customers and Value § for Customers and all
Stakeholders § Benefit / (Costs + Harm); § Value demand vs Failure
Demand (or Rework) People § Deming’s 94 /6 § Trust § Mo>va>on and ‘small wins’
§ The brain and thinking. Bias.
System § end-‐to-‐end value streams § holis>c, integrated, with
feedback Process efficiency
§ Flow efficiency not resource efficiency
§ Con>nuous improvement § The ‘big five’ opera>ons
concepts § Timing
Innova>on § S curves and the need for
breakthrough
Lean at Wits 36

TRIZ is the Russian acronym for Teoriya Resheniya Izobreatatelskikh Zadatch
Lean at Wits 37
Genrich Altshuler 1926-1998

Lean at Wits 38
Exploration
Exploitation
The whats
The hows
Unknown Unknowns?
Known Unknowns?

Backgrounds: Increasing risk § Short termism
• Discounted cash flow • Vast R&D investments and risk of failure • Mashmallow effect
§ Health and Safety and Li>ga>on Failure of Big (IT) Projects
Lean at Wits 39

Waterfall
IT Design Factory Scheduling People and Motivation Projects
Agile
SCRUM
Stage Gates
Big Transformation
Plans
Kaizen Blitz
Kata
Optimization, OR, LP
MRP, TOC Batches
Kanban Heijunka
Change whole culture
Top down KPI’s
Small wins
CPA, PERT
Last Planner
Simultaneous and
Concurrent Eng
Set Based
Lean Startup
Lean at Wits 40

John Bicheno 2015 41

Lean at Wits 42
breakthrough

Lean at Wits 43
(Lord) William Armstrong Cragside, Northumberland (Later Vickers-Armstrong,
Later BAe systems)
The Accumulator
Efficient Power Collection

Lean at Wits 44
What happens if: You insert a mouse? You insert a burning candle? You insert a mint plant? You insert a burning candle, then later a mint plant, Then after a month, a mouse?
Reference: Steven Johnson, The Invention of Air, Riverhead, 2008
Why do this? What is needed to do this?
What are the implications?
Joseph Priestley

time
performance
Beat competitors with functionality and reliability
Beat competitors with speed, responsiveness and convenience
Following Clayton Christensen ‘The Innovators Solution’ HBS Press, 2003
Products are ‘not good enough’
Products are ‘good enough’
Lean at Wits 45
Time
Customer expecta>ons

Clayton Christensen video
Lean at Wits 46

Lean at Wits 47

Customers and Value § for Customers and all
Stakeholders § Benefit / (Costs + Harm); § Value demand vs Failure
Demand (or Rework) People § Deming’s 94 /6 § Trust § Mo>va>on and ‘small wins’
§ The brain and thinking. Bias.
System § end-‐to-‐end value streams § holis>c, integrated, with
feedback Process efficiency
§ Flow efficiency not resource efficiency
§ Con>nuous improvement § The ‘big five’ opera>ons
concepts § Timing
Innova>on § S curves and the need for
breakthrough
Lean at Wits 48

Lean at Wits 49

Lean at Wits 50

‘Ford was both the most brilliant and the most senseless marketer in American history. He was senseless because he refused to give the customer anything but a black car. He was brilliant because he fashioned a production system designed to fit market needs. We habitually celebrate him for the wrong reason: for his production genius. His real genius was marketing. We think he was able to cut his selling price and therefore sell millions of $500 cars because his invention of the assembly line had reduced the costs. Actually, he invented the assembly line because he had concluded that at $500 he could sell millions of cars. Mass production was the result, not the cause, of his low prices.…’
Lean at Wits
Theodore Levitt, ‘Marketing Myopia’, Harvard Business Review, July / Aug 1960
51

Lean at Wits
Quality Flexibility Service
Costs Response Times
Variability
52

53 Lean at Wits

Absent
High Satisfaction
“enragers”
“Delighted”
Neutral
Low Satisfaction
High quality performance
Quality or performance not achieved
“Disgusted”
Fully Implemented
“delighter”
“more is better” “must be”
54 Lean at Wits

Lean at Wits 55
1 5
Performance and Cost
Human Fit (Ergonomics)
Craftsmanship
Emotional Appeal
Elegance and Sophistication
Symbolism and Cultural Values
Global Fit (Environment)
From James L Adams, “Good Products, Bad Products”, McGraw Hill, 2012

The customer, and the supply chain!
56 Lean at Wits

Customers and Value § for Customers and all
Stakeholders § Benefit / (Costs + Harm); § Value demand vs Failure
Demand (or Rework) People § Deming’s 94 /6 § Trust § Mo>va>on and ‘small wins’
§ The brain and thinking. Bias.
System § end-‐to-‐end value streams § holis>c, integrated, with
feedback Process efficiency
§ Flow efficiency not resource efficiency
§ Con>nuous improvement § The ‘big five’ opera>ons
concepts § Timing
Innova>on § S curves and the need for
breakthrough
Lean at Wits 57

Seeking not to be reduc>onist. Wholes not Parts Understanding about rela>onships and interdependencies Engaging in mul>ple perspec>ves Reflec>ng on the boundaries Learning
(These are closely linked concepts)
Lean at Wits 58

Purpose ‘Doing the right thing and doing things right’ (Ackoff) The Whole greater than the sum of the parts
§ ‘The Systems Approach seeks not be to reduc>onist’ (Checkland) Interconnec>ons: Silos and Streams System boundary Subop>misa>on
Feedback CATWOE
§ Clients, Actors, Transforma>on, Weltanschauung, Owners, Environment Vic>ms and Beneficiaries Viewpoints (Tops, Middles, Bo`oms, Customers)
§ ‘The Systems Approach begins when you first see the world through the eyes of another’ (Churchman)
Lean at Wits 59

Lean at Wits 60
Fred Emery Eric Trist
Ackoff Kurt Lewin Tavistock Institute (Univ of London)
Complexity Interaction
‘Systems Thinking’ (1969) Self directed teams Socio Tech Design Open Systems Movement
Job Enrichment Job Enlargement Job Rotation Work Design
Not the technical system alone (like Taylor)
But interactions between Technical systems (plural)
and Social systems (plural)

61 Lean at Wits

62
£
“What Matters?”
£ If we don’t understand the Customer we are in danger of doing more than is necessary OR assume that things are important that are not (e.g.: Flowers and Chocolate)This costs money.
If we don’t understand the Customer we are likely to not do something, or not do it right resulting in failure demand, rework and complaints. All cost money.
Lean at Wits

Lean at Wits 63
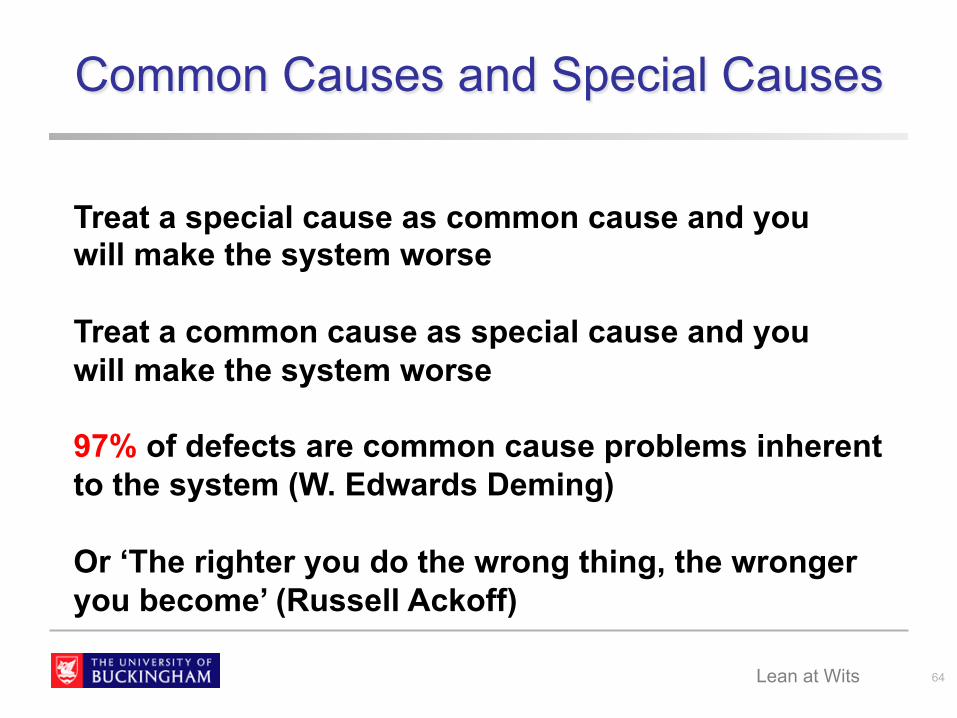
Treat a special cause as common cause and you will make the system worse Treat a common cause as special cause and you will make the system worse 97% of defects are common cause problems inherent to the system (W. Edwards Deming) Or ‘The righter you do the wrong thing, the wronger you become’ (Russell Ackoff)
Common Causes and Special Causes
Lean at Wits 64

‘Learning to See’ HB as a System
Inspect
Sort Scan Index
Decide
Allocate
Notify
Hand out forms Take in documents
Pay
22%V 78%F
44%V 56%F
34%V 66%F
99% claims ‘dirty’ No case ownership CTax fragmentation
1-10 cycles to clean (ave.4) 95% cases over-specified 20% docs. duplicated
60% errors Rework
Multiple Sorts & Checks Cases fragmented Scanning/Indexing errors
64% passed back Manage queues
Letters unclear
0-152 days to pay 3% visit once
Handoff
HO
HO
HO HO HO
“I want to claim”
Workers’ activity ‘managed’
Lean at Wits 65

66
External Influences
IT Systems Budgets Policy & Procedure Functional Specialisation Repair request info Budget commitment Cost of works
completed Schedule labour
and material Repair info carried out
W/o completion info. & customer satisfaction
Repair received
Contractor receives job
Operative receives job
Obtain materials Attend repair Works order
processed Invoice received
Invoice paid
Hand off Hand off Hand off Hand off Hand off Hand off Hand off
Order part and re-book
Wrong address
50 - 100 p.a.
Wrong trade
1%
Invoice without V.O.
5 - 10%
No access 15 - 20%
Overbooking 3%
10%
Post inspection Up to 4 week delay
Further works required
20%
Inaccurate contact details
30%
Invoice match fail 1 - 2 p.m.
Lack of time 2%
Wrong office 10% in CS
Wrong or no part 50 - 80%
No w/o issued 2 - 3%
No contact for Cat E 20 - 25%.
V.O. authorisation
30 - 40%
Wrong Contractor
1 - 2%
Not on Contract
20 p.a.
Hold payment as job incomplete
1 - 2%
Lean at Wits

Age of Inventory
‘Pressure’ on Capacity
Returns
Bigger Batches
Increased Order Book
Demand for Higher
Utilization
Earlier Orders
Reduced Maintenance
Shortages of some SKU’s
More breakdowns
See ‘Industrial Dynamics’ Forrerster, MIT, 1960’s – 1970’s
Changes to the
Schedule
Lean at Wits 67

Lean at Wits 68
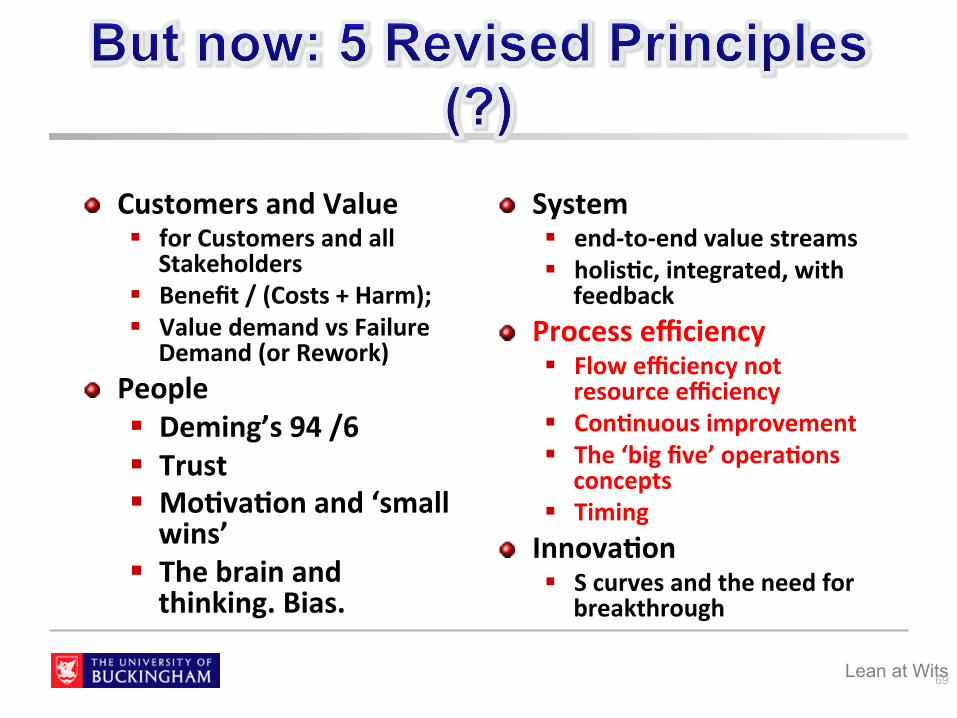
Customers and Value § for Customers and all
Stakeholders § Benefit / (Costs + Harm); § Value demand vs Failure
Demand (or Rework) People § Deming’s 94 /6 § Trust § Mo>va>on and ‘small wins’
§ The brain and thinking. Bias.
System § end-‐to-‐end value streams § holis>c, integrated, with
feedback Process efficiency
§ Flow efficiency not resource efficiency
§ Con>nuous improvement § The ‘big five’ opera>ons
concepts § Timing
Innova>on § S curves and the need for
breakthrough
Lean at Wits 69

Lean at Wits

Lean at Wits 71

Adjusts Expedites Measures Repairs Sets up
Approves Files Monitors Requests Updates
Assigns Identifies Moves Returns Verifies
Changes Inspects Receives Reviews Waits for
Copies Labels Reconciles Revises
Distributes Maintains Records Selects
William E. Trischler; Understanding and Applying Value-Added Assessment
72 Lean at Wits

Lean at Wits 73

Lean at Wits 74

Waste of Human Poten>al ‘Not bringing your brain to work’
Lean at Wits 75

Waste of energy and natural resources
Becoming the most important waste of all?
Hunter Lovins see Hawkin, Lovins, Lovins, Natural Capitalism, Li`le Brown, 1999
Lean at Wits 76

How many of the wastes are pure waste, and how many are tradeoff wastes?
Lean at Wits 77

‘I spent most of my money on women, booze and gambling….’
…the rest I wasted.
Lean at Wits 78

Transport Inventory Mo>on Wai>ng Overproduc>on Overprocessing Defects Employees Green
Lean at
Wits 79
Lean at Wits 80
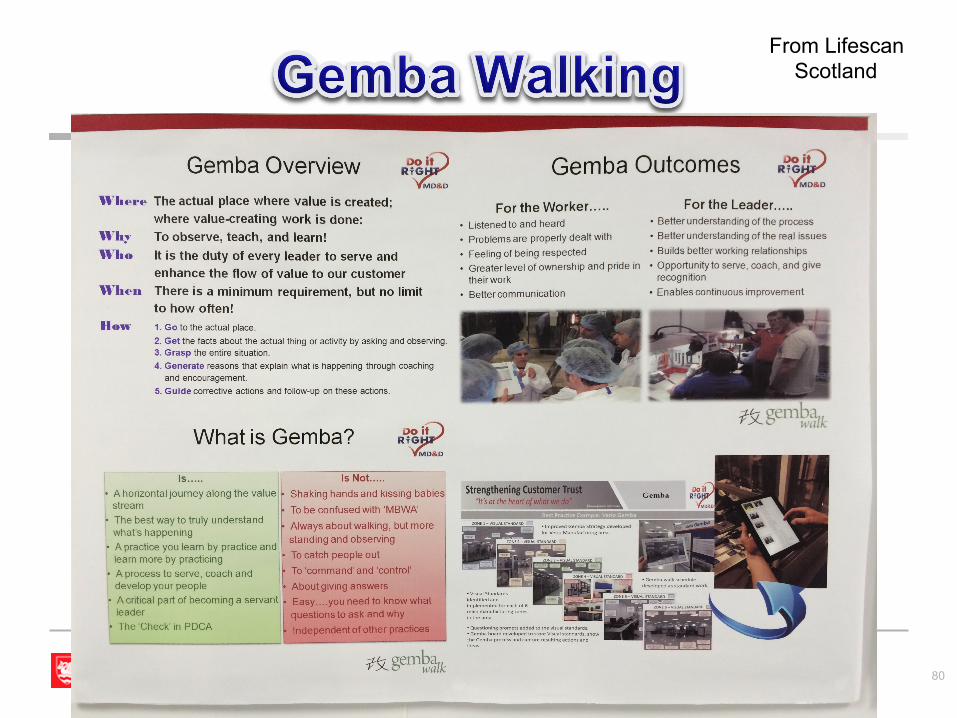
From Lifescan Scotland

The Seven Green Wastes § Energy § Water § Materials § Garbage § Transport § Emissions § Biodiversity (impact on surrounding area – wildlife, birds, bugs, plants and trees, water table)
Do VSMs with the data boxes containing these wastes Document Input / Output Set up kaizens and A3’s for countermeasures for each type
Lean at Wits Reference: Brett Wills, Green Intentions, CRC Press, 2010 81

n Appropriate work shall be specified as to content, sequence, gg, & outcome � Standardisa>on in detail,
fixing a seat n Every customer-‐supplier
connec>on must be direct, & there must be one unambiguous way to send requests & receive responses • Immediate requests for
assistance, solving within takt
Lean at Wits 82

The pathway for every product & service must be simple & direct • One specific route means con>nuous experimenta>on
Any improvement must be made in accordance with the scien>fic method, under the guidance of a teacher, at the lowest possible level in the organisa>on • Predict & test improvements
Toyota South Africa Story
Lean at Wits 83

The Management was sa>sfied, even delighted But Lionel Aldworth was not! Not so much what was achieved, but HOW it was achieved Using (mental?) models to surface your knowledge deficiencies PDCA is Win, Win Puwng in place a Learning System, not just solving problems, or making ‘savings’ “If you want to understand TPS then you must first understand the scien>fic method and thinking behind the system” (Dr. Shingo)
Lean at Wits 84

These three steps must go in a circle instead of in a straight line, . . . It may be helpful to think of the three steps in the mass produc,on process as steps in the scien,fic method. In this sense, specifica,on, produc,on, and inspec,on correspond respec,vely to making a hypothesis, carrying out an experiment, and tes,ng the hypothesis. The three steps cons,tute a dynamic scien,fic process of acquiring knowledge
Lean at Wits 85

Lesson 1: There’s no subs>tute for direct observa>on. Lesson 2: Proposed changes should always be structured as experiments. Seeking to fully understand the problem and solu>on, even ques>oning if a solu>on is more successful than projected. Lesson 3: Workers and managers should experiment as frequently as possible. As confidence grows experiments will change from single factor / single machine issues to look at linking processes and sub-‐systems. Lesson 4: Managers should coach, not fix.
Lean at Wits 86

The US Nuclear Submarine Propulsion Program and the Soviet Nuclear submarine Fleet Columbia’s fatal mission Alcoa
Steven Spear Chasing the Rabbit McGraw Hill, 2009
Lean at Wits 87

Spear’s 4 Capabili>es 1. Capturing the best collec>ve knowledge and making problems visible
2. Building knowledge by swarming and solving problems
3. Spreading lessons learned to the whole organiza>on 4. Leading by developing capabili>es 1, 2, and 3 in others.
Lean at Wits 88

• While doing supplierdevelopment with Toyota early in my research, I was challenged to "stop thinking and start doing." Why? My mentors saw I was trying to solve problems by shear thought. The difficulty was that the whole reason I had the problem in the first place was because I didn't know enough to get something to run well. More thinking trapped me in a loop of not knowing enough but thinking more so not doing anything.
• The subtle elegance of their approach was that by doing something, even quick, cheap, and non-‐intrusive, I might have that extra cycle of learning to discover the answer.
• In today's markets, no one knows enough to make great calls consistently. Those who will emerge less scathed are those who recognize that what they currently know is inadequate, so they will start discovering and developing others to discover with relentless ferocity.
Lean at Wits 89

Kingman’s equa>on Li`le’s Law Three Types of Buffer Inventory – Fill Rate Curve Pull
Lean at Wits 90
Capacity
Inventory Time
Entities = Entities/Time x Time
Que
ue
Utilization
Inve
ntor
y $
Fill Rate

The Tortoise and the Hare (Ohno) Financial games: build up or run down at end of year or month
KPI >ming Design: take longer but do be`er? Orders: End of month hockey s>ck?
Inventory and Capacity: Chase vs Level
Delays in communica>on, and mapping
Religious holidays; industry fairs
Report when a project is half complete.
Differences in perceived >me (by situa>on, by customer, by culture)
Repor>ng periods (too fast or too slow?)
MRP net change New Manager? End of quarter repor>ng? Car registra>on periods Is there a ‘first mover advantage’ ? Necessity: Falklands ships PARKINSON!
Lean at Wits 91 See Stuart Albert ‘When’ ;and Frank Partnow “Wait’

Kingman’s equa>on Li`le’s Law Three Types of Buffer Inventory – Fill Rate Curve Pull
Lean at Wits 92
Capacity
Inventory Time
Entities = Entities/Time x Time
Que
ue
Utilization
Inve
ntor
y $
Fill Rate

‘Whenever there is varia>on, someone or something will wait’
Lean at Wits 93

Because they affect.. ….. ….. ……
Lean at Wits 94

Lean at Wits 95
lead
time
30% Utilisation ρ 100%
Moderate variation
Zero variation
High uncertainty
Some uncertainty

Muda -‐ waste -‐ non value added Muri -‐ overburden -‐ pushing a machine, person, or process beyond ‘natural limits’. (See also Factory Physics). Mura -‐ unevenness – varia>on, non steady flow; interrup>ons, instability, ‘unnatural’ work Mura and Muri are ozen the cause of Muda
Lean at Wits 96
Muri – South Africa Style ‘Don’t worry, be happy’
Load affects Speed!

L = (C2a + C2e)/2 x (ρ / (1-‐ ρ)) x te + te C2a is arrival variance; C2e is process variance ρ is u>liza>on (load / capacity or arrival rate / service rate)
MURA MURI Ave Process Leadtime
Lean at Wits 97

The Highway § What do highway engineers do? § Op>mal throughput: speed and density
The importance of rework and failure demand Sensi>vity: u>liza>on and varia>on. Above and below ρ = 0.5 When is six sigma worthwhile? Arrivals at bo`leneck Rework, load, and the Goldra`’s Herbie CV is standard devia>on / >me: Implica>ons The order: Muri, Mura, Muda (NOT Muda, Mura, Muri!)
Lean at Wits 98

The broader and deeper meanings behind them are:
Muri -‐ Difficult to Do (See, Hear, Reach, Understand, Teach, Develop, Find, Develop, Manage, etc, etc., etc.), Beyond Current Capacity or Capability, Physical, Mental, Psychological Overburden or Unreasonableness, No Reason or Principle Mura -‐ Fluctua>ons, Varia>on, Interrup>ons, Instability, Inequality or Unnatural work Muda -‐ Non Value Added, Not Needed Organiza>ons that are truly people / par>cipa>on focused will also understand that the order must be Muri, Mura and lastly Muda. First iden>fy and start elimina>ng or reducing the difficult and frustra>ng and you can think about how to get people involved. Some things you may want to also classify as Mura or Muda will also be eliminated. Mura is not about measuring varia>on on graphs, it is about seeing varia>on as it happens. Eliminate or reduce Instability, Unpredictability and Interrup>ons and you also impact the psyche of the Team involved. Muda will also be eliminated. The key skill is not to know specific tools to get rid of the 3 Mu's, but to develop and prac>ce seeing and recognizing them in all or specific parts of processes, systems or organiza>ons.
Lean at Wits 99
From Erik Hager, TPS Network, Linkedin

Parkinson’s Law?
Lean at Wits 100

Lean at Wits 101

Lean at Wits
Capacity
Load
Utilization =
Value Demand
Failure Demand +
Base Capacity Waste -
Arrival Variation
Process Variation
102

Server Customer
System
Lean at Wits 103
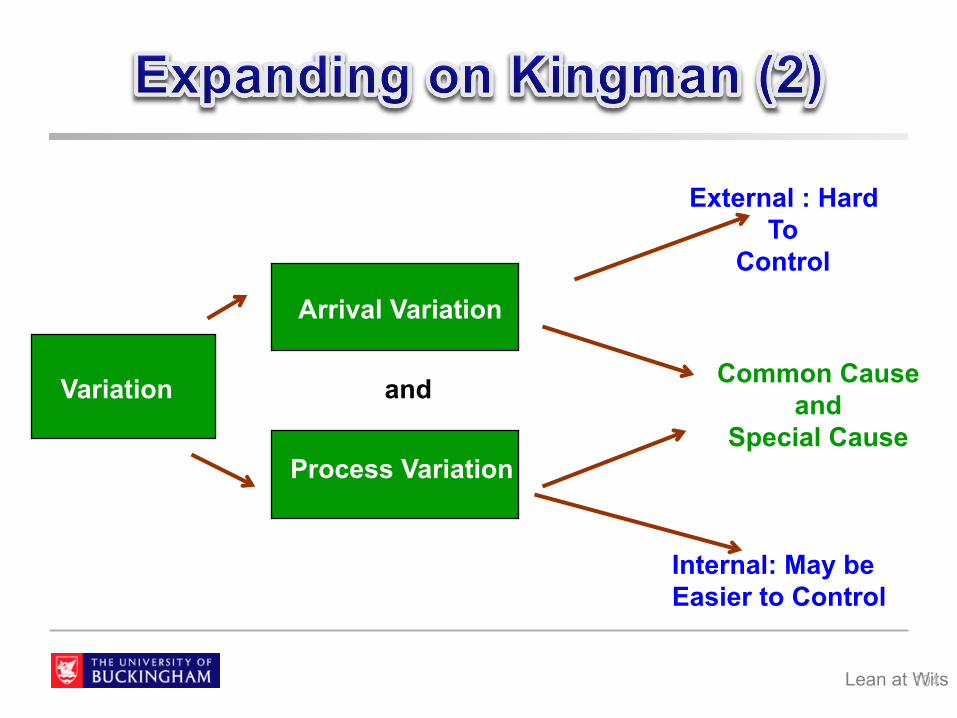
Lean at Wits
Capacity
Arrival Variation
Variation and
Process Variation
Common Cause and
Special Cause
External : Hard To
Control
Internal: May be Easier to Control
104

Utilisation 100%
lead
time
production feasible
not feasible
Traditional Lean (?)
lead
time
Utilisation 100%
Lean at Wits 105

Lean at Wits 106
Time
De
ma
nd
A Steady Demand
Time
De
ma
nd
B Seasonal Demand
Time
De
ma
nd
C High Variation Demand
Time
De
ma
nd
D Low Variation Demand
From Kevin Duggan, Creating Mixed Model Value Streams, Productivity, 2002
From Garry Hencher, MSc Dissertation, 2011

Frances Frei, in Harvard Business Review, describes five types of ‘customer-‐introduced variability’: arrival variability (the >me between arrivals), request variability (within arrivals), capability variability (customer skill) effort variability (how much effort has the customer made – say before airport security)
‘subjec>ve preference variability’ (different customer expecta>ons).
Lean at Wits 107
from Frances Frei, ‘The Four Things a Service Business must get right’ Harvard Business Review, April 2008

Lean at Wits 108
Cycle time (days)18161412108642 2826242220 30 38363432
0.02
Den
sitie
s
System 1
0.04
0.06
0.08
0.10
0.12
0.14
0.16
0.18
System 2
Lead Time System 1 = 14 days
Lead Time System 2 = 23 days
Both systems have an average lead time of 10 days But for a 90% service level, System 1 must quote 14 days, System 2 23 days
From Wallace Hopp, Supply Chain Science
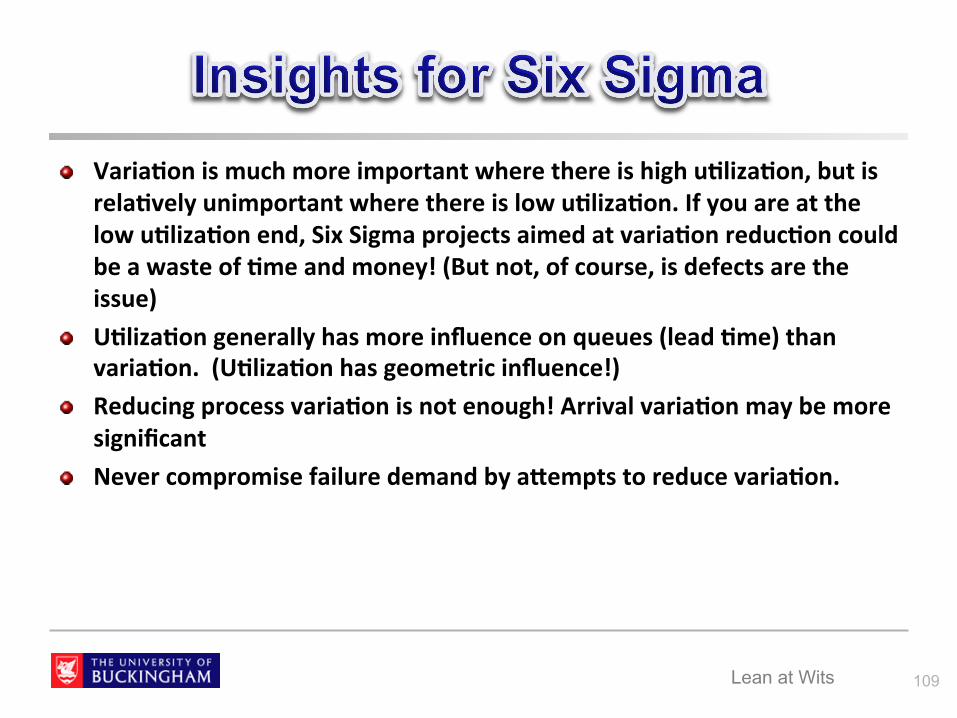
Varia>on is much more important where there is high u>liza>on, but is rela>vely unimportant where there is low u>liza>on. If you are at the low u>liza>on end, Six Sigma projects aimed at varia>on reduc>on could be a waste of >me and money! (But not, of course, is defects are the issue)
U>liza>on generally has more influence on queues (lead >me) than varia>on. (U>liza>on has geometric influence!)
Reducing process varia>on is not enough! Arrival varia>on may be more significant
Never compromise failure demand by a`empts to reduce varia>on.
Lean at Wits 109

The coefficient of varia>on (C in the formula) is σ / t § Where σ is the standard devia>on of the process >me § Where t is the average process >me
It is not absolute varia>on (σ) that is important, but the ra>o. So… Varia>on is much more important in short cycle opera>ons (typically volume manufacturing) than long cycle opera>ons (many types of service and administra>on)
Where opera>on >mes are long, it is MUCH more important to ‘get it right first >me’ than to focus on reducing varia>on.
Lean at Wits 110

Constraint iden>fica>on should take both varia>on and u>liza>on into account. § Red has longer average cycle >me and is therefore likely to be the
constraint, but blue has greater varia>on…. Protec>ng the constraint with a >me buffer is a tradeoff decision
§ If inventory is very expensive, a permanent buffer may not be a great idea
§ Would the loss in throughput compensate for the cost of inventory? § A buffer is a queue that affects lead >me: is this worth it?
The resource upstream of the constraint determines the arrival varia>on at the constraint. (See the linking spreadsheet.)
Lean at Wits 111
Cycle time: Which is the Constraint?

OEE All factors the same? MTTR and MTBF
Lean at Wits 112

Kingman’s equa>on Li`le’s Law Three Types of Buffer Inventory – Fill Rate Curve Pull
Lean at Wits 113
Capacity
Inventory Time
Entities = Entities/Time x Time
Que
ue
Utilization
Inve
ntor
y $
Fill Rate

‘It may be li`le but it is the law’ (Wally Hopp) Robust! Applies widely § Inventory and throughput § Hospitals and health § Service § Design § …
Lean at Wits 114

Lean at Wits 115
Cycle Time = WIP
Throughput
Throughput TH = WIP
Cycle Time
Entities = entities / day x days
WIP = WIP / day x days
(so, patients = patients / day x days )
(so, inventory (e.g. jobs) = jobs / day x days )
OR
OR
Little’s Law is completely general, but • Applies to the long-term steady-state, average, not to the short term • The process must be stable (e.g. no ramp up in production rate)
OR weeks = units
units / week

Consider a single machine over 20 hours, doing 4 jobs: A, B, C, D
Throughput: 4 jobs in 20 hours; TH=4/20 = 1/5 jobs per hour
Cycle Hme: A is 4 hours in system; B is 7;C is 8; D is 5; Total 24 hours; average is 24/4 = 6 hrs
Average WIP = 24/20 = 6/5 LiPle’s Law: WIP = TH x CT or 6/5 = 1/5 x 6
Lean at Wits 116
Job Arrives at (hr) Takes (hrs) A 2 4 B 3 4 C 5 3 D 15 5
1 2 3 4 5 6 7 8 9 10 11 12 13 14 15 16 17 18 19 20
A A A A B B B B C C C D D D D D

Lean at Wits
Parcel Co has a throughput of 1400 parcels per day and a lead-‐>me of 34 days. They state that their total WIP across the process is 30k parcels. Is this plausible? A manager claims that her inventory turns three >mes per year. She also states that everything the company buys gets processed and leaves within six weeks. Is this consistent?
117

Lean at Wits
WIP = Throughput x Cycle >me = 1400 x 34 = 47600
But they claim WIP is 30 K so it is inconsistent!
118

Lean at Wits
Inventory Turns = Throughput
WIP
3 / year = once every 52 / 3 = 17 weeks Against 6 weeks claimed So, inconsistent!
Another way, by Little’s Law
Cycle time = WIP
Throughput
Cycle time
Throughput
WIP =
1
6 weeks c.f. 3 per year
1
6 c.f. 3 per year
52 per year
119 See ‘Slow’ and ‘W

Throughput: the rate at which en>>es are processed e.g. pa>ents / day WIP: the number of en>>es in the system e.g. pa>ents Cycle >me: average >me taken end-‐to-‐end, including rework e.g. days (Hence en>>es = en>>es per >me x >me) (e.g.400 pa>ents in a hospital = 40 discharged per day x 10 day stay) Capacity = base capacity – detractors (or as Ohno said, (actual) work + waste) U>liza>on = rate / capacity ( or load / capacity)
Lean at Wits 120

Kingman’s equa>on Li`le’s Law Three Types of Buffer Inventory – Fill Rate Curve Pull
Lean at Wits 121
Capacity
Inventory Time
Entities = Entities/Time x Time
Que
ue
Utilization
Inve
ntor
y $
Fill Rate

Lean at Wits
Capacity
Inventory
Variation Is
Buffered by
Time
Capacity
or
or And in no other way
122

Kingman’s equa>on Li`le’s Law Three Types of Buffer Inventory – Fill Rate Curve Pull
Lean at Wits 123
Capacity
Inventory Time
Entities = Entities/Time x Time
Que
ue
Utilization
Inve
ntor
y $
Fill Rate

Kingman’s equa>on Li`le’s Law Three Types of Buffer Inventory – Fill Rate Curve Pull
Lean at Wits 124
Capacity
Inventory Time
Entities = Entities/Time x Time
Que
ue
Utilization
Inve
ntor
y $
Fill Rate

Is not just Kanban ‘A pull system is one in which work is released based on the status of the system and thereby places an inherent limit on WIP’ (Hopp and Spearman) Mul>-‐stage pull (DBR, CONWIP) Does not have to be linked with the customer (Note Womack and Jones wrong interpreta>on?) The Lean Startup (Eric Reis) Lean Design Pulling in Labour as needed (Tesco) Pulling in manager help (Andon, Seddon) Training as needed (TWI)
Lean at Wits 125

5 S
As much to do with the mind as with the physical situaHon
Lean at Wits 126

TWI is a System!
JI
JR
JM
JS
Lean at Wits 127

Quotes
‘To my amazement, the program that Toyota was going to great expense to transfer to NUMMI, was exactly that which the Americans had taught the Japanese decades before’ (Shook) ‘You will not become Lean by doing TWI, but you will not become Lean without doing TWI’ (Huntzinger)
Quoted in Jim Huntzinger,’TWI Case Study: Ohno’s Vehicle to TPS’, TWI Summit, 2008
Lean at Wits 128

Jim Huntzinger – The Roots of Lean
Lean at Wits 129

Job Breakdown A key tool used for this is the job breakdown sheet (refer to Figure). Not to be confused with a standard
work combinaHon sheet that focus on labour allocaHon, sequencing & balancing tasks, a job breakdown sheet is a training aid that ensures the criHcal knowledge of a job is transferred to the trainee creaHng a stable repeatable outcome.
Percentage of total work
Importance Effect on work
15-20% Critical Š work must be highly consistent.
Definite effect on the results if performed out of range.
60% Important Š work must be consistent within a slightly wider range
Probable effect on results if performed out of range.
20% Low Importance Š work method may be variable
Not likely to affect results regardless of method.
After Liker & Meier, Toyota Talent, 2007, p 144
Lean at Wits 130
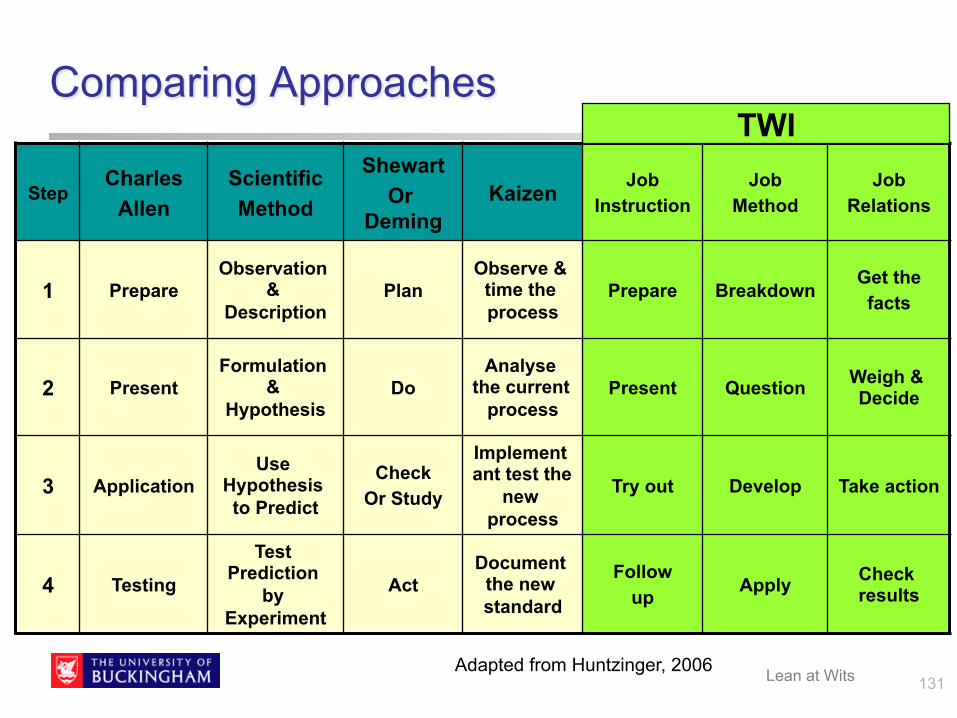
Comparing Approaches
Step Charles
Allen Scientific Method
Shewart Or
Deming Kaizen Job
Instruction Job
Method Job
Relations
1 Prepare Observation
& Description
Plan Observe &
time the process
Prepare Breakdown Get the facts
2 Present Formulation
& Hypothesis
Do Analyse
the current process
Present Question Weigh & Decide
3 Application Use
Hypothesis to Predict
Check Or Study
Implement ant test the
new process
Try out Develop Take action
4 Testing
Test Prediction
by Experiment
Act Document
the new standard
Follow up Apply Check
results
TWI
Adapted from Huntzinger, 2006 Lean at Wits 131

Lean at Wits 132 From Suzanne Nuttall, MSc Dissertation 2011 / 2012

TWI Effectiveness (from Dinero, p4-5)
Lean at Wits 133

Lean at Wits
Standards and SOPS
134

Lean at Wits
Standards
“To standardise a method is to choose out of many methods the best one, and use it. What is the best way to do a thing? It is the sum of all the good ways we have discovered up to the present. It, therefore becomes the standard. Today’s standardisaHon is the necessary foundaHon on which tomorrow’s improvement will be based. If you think of ‘standardisaHon as the best we know today, but which is to be improved tomorrow -‐ you get somewhere. But if you think of standards as confining, then progress stops.” Henry Ford, Today and Tomorrow, 1926
135

Lean at Wits
Standards - another quote
“In a Western company the standard operaHon is the property of management or the engineering department. In a Japanese company it is the property of the people doing the job. They prepare it, work to it, and are responsible for improving it. Contrary to Taylor’s teaching, the Japanese combine thinking and doing, and thus achieve a high level of involvement and commitment.” Peter Wickens, 1995
136

… & from Ohno
“A proper (standard) procedure cannot be wriPen from a desk. It must be tried & revised many Hmes in the producHon plant. Furthermore, it must be a procedure that anybody can understand on sight For producHon people to be able to write a standard work sheet that others can understand, they must be convinced of its importance.”
137 Lean at Wits

Standard Work & Work Standards
Standard Work relies mostly on the efforts of shop floor teams to develop standards.
Work Standards are developed by staff specialists & engineers -‐ usually with no involvement from the shop floor -‐ & are imposed standards.
138 Lean at Wits

Lean at Wits
Purpose of a Standard
Make it easier for people to do a job Avoid known pikalls Assure safe operaHons Make it easier to teach new employees Make it easier to track down the cause of a problem Reduce unnecessary variaHon
139

Lean at Wits
Standardisation and Management
Top
Middle
Supervisor
Operator
140

Lean at Wits
Standardised Work Procedure
Is not a set of rules Should not be confused with safety standards, health standards, BS, etc. Is not fixed in stone
But Is the current best known way to do a job safely and easily It documents know-‐how Allows measurement and improvement WriPen by operators for operators
141
Lean at Wits
Standards: Characteristics
Use verb plus noun -‐ or picture One moHon, one step Kept at the point of use Comparing actual to standard uncovers waste or problems; a problem is a deviaHon from standard If there are no changes to SOPs there has been no improvement
142

Misunderstanding Standards
Lean at Wits
From Mike Rother
143

Holding the Gains?
Lean at Wits 144

Lean at Wits
Examples of Standards
FootprinHng Painted levels of min & max inventory Sample board SOP (3 types -‐ see later) One-‐point lessons ProducHon control board Checklist Equipment operaHon
145

Lean at Wits
Managerial Standards
AdministraHve rules Personnel guidelines Budgets Delivery schedules Project plans
Equipment checks Quality assurance (ISO 9000) Reference samples Safety instrucHons

Window Analysis
Party X
Party Y
Known
Practised Un-Practised Unknown
Kno
wn
Unk
now
n Pr
actis
ed
Un-
Prac
tised
147 Lean at Wits

Visuality: How Visual Can Change Behaviour (1)
Lean at Wits 148
What do you see? How does this change behaviour for Students, bus driver, car drivers?

Visuality: How Visual Can Change Behaviour (2)
Lean at Wits 149
Stage 1
Stage 2
Stage 3 What does this do to reduce waste?

Visuality
Lean at Wits 150

Visuality: A vital part of Lean! 5S Schedule TPM Leader Standard Work Inventory Defects B/neck status Ideas ….
Lean at Wits 151
Not just information But What behaviours would you like to change?
Exercise:

Careful….
Lean at Wits 152

Visual Management
Lean at Wits 153
Viagra HQ

Mapping
Lean at Wits 154

Five Stage Mapping
1. Top Level Preliminary Analysis and PrioriHzaHon 2. High level Current State Value Stream Analysis 3. Future State: Layout and Detailed Scheduling 4. ExecuHon and Control 5. ImplementaHon of the ‘AcHon Plan’
• For ‘first Hme around’, go straight to Step 2
Lean at Wits 155

1. The opera>ons sequence, 2. Informa>on flows 3. Physical flows and layout (Spaghew) 4. A financial map 5. A map of zones of responsibility 6. Time line, Pareto and postponement 7. Inventory investment and Fill rate curve 8. Demand profile: repea>ng, non repea>ng, plateaus 9. Amplifica>on Map 10. Demand Categories 11. Part and Component Usage.
Lean at Wits 156

Lean at Wits 157

Basic Mapping Tools (1)
Lean at Wits
Blank
Pres
s
Pres
s
Pres
s
Welding
Store
SPAGHETTI DIAGRAM
Supplier
BLANK
I C/T = 3 sec
C/O = 15min 2 shifts
1% scrap
PRESS SHIP
I
Customer
C/T = 10 sec C/O = 30min
3 shifts 2% scrap
C/T = 2 sec C/O = nil
1 shift 0% scrap
500 parts 1 day
1000 parts 2 days
PRODN CONTROL
MRP
WEEKLY DAILY Daily Schedules Weekly Schedule
Monthly orders
Forecast
Daily Call
LEARNING TO SEE: CURRENT STATE PROCESS STEPS
INFORMATION FLOWS
158

Basic Mapping Tools (2)
Lean at Wits
Qua
ntity
Time (days)
Steel delivery
press
assby orders
AMPLIFICATION MAP
159
Inve
ntor
y $
Fill Rate INVENTORY INVESTMENT /
FILL RATE CURVE

Supplier 1
Production Control MPS - MRP
£10K
Daily requirements
Daily Production Schedules
£12k/day
Supplier 2
Customer
Press Assemble 2 Assemble 1 Weld 2 Weld 1 Ship
W/house
£16K £40k £30K £15k £70k
Daily requirements
Daily requirements
Daily Shipments £35k
£105k
£95k
Daily Shipments £210k
Daily Shipments £85k
£8k/day £7k/day £4k/day £4k/day
WIP: 32 days RM: 16 days FGI: 8 days Credit granted: 30 days
Operation financing: 28 days Payment terms - 30 days
Manager Responsibility
Zones
Value Stream Financing
Lean at Wits 160

Mapping and Transformation Stage 1 (Top Level A3)(‘Value Streams’ not decided as yet)
• ContribuHon analysis • Demand profile – repeaHng and non-‐repeaHng orders • Demand profile – arrival variaHon • Demand plateaus • Target uHlizaHon policy • Shipment frequency and aPainment • LiPle’s Law for overall lead Hme • Delivery achievement • Outline physical process map • AmplificaHon Map • Inventory Investment and Fill rate curve • Supply chain analysis? • People Issues? • Priori>es?
Lean at Wits 161

Mapping and Transformation (2)
Stage 2 (Level 2 A3) • Break down into value streams • Map the current state : Sequence • Map the current state: InformaHon • Map the current state: Physical layout and spagheu • Map the current state: Financial • Map the current state: Zones of responsibility • Lead Hme: Time line, Pareto, Postponement • Buffers and Scheduling Points • Priori>es?
Lean at Wits 162

Mapping and Transformation (3a)
Æ Waste ReducHon • 7 Classic wastes • Changeover reducHon • Ergonomics • Visuality
Æ Layout • CreaHvity and the physical process
Lean at Wits 163
Stage 3: Future State: Layout and Detailed Scheduling
Waste Reduction and Layout

Layout Opportunities for Future State?
Change the sequence? Choose the right duraHons for each step – slower or faster? Create a new sequence to minimise risk or maximise flexibility – a parallel line ? redundancy? Change the locaHon – of a machine, a sequence, a supermarket, a facility ? Skip a step or join two steps ? Giving customers choice – discounts for early orders, or regular orders, or standard products?
Lean at Wits Adapted from Stuart Albert, ‘When’, Jossey Bass, 2013 164

Mapping and Transformation (3b)
Æ Batch sizing and Resource Scheduling • Batch sizing • Constraints and buffer locaHons
• Supermarket sizing • EPEI calculaHons • Pull and scheduling system to be used
Æ Value Streams • Buffer sizing for make to order and to stock
• Takt and cycle Hmes • Mixed model schedules • CONWIP and kanban loops • Supermarket sizing • EPEI calculaHons • Line balance
Lean at Wits 165
Stage 3: Future State: Layout and Detailed Scheduling
Scheduling
plus, Linking the Loops and the Pacemaker

Mapping and Transformation (3c)
Æ Skill shorkalls? Æ Alignment between value streams and organisaHon structure
Æ KPI’s Æ Role of managers?
• Inventory reducHon impact?
• Cash flow? • Standard cosHng? • Plain English accounts?
Lean at Wits 166
Stage 3: Future State: Layout and Detailed Scheduling
The Future Organisation. The Financials

Mapping and Transformation (4)
Stage 4 : ExecuHon and Control • Visual management • CommunicaHons board design • KPI’s • Day by hour schedules • Day by hour problem highlight • Feedback
Lean at Wits 167

Mapping and Transformation (5)
ImplementaHon Plan: Internal ImplementaHon Plan: External
Lean at Wits 168

Mapping and Transformation
Lean at Wits 169

A Different sort of Value Stream Map
Lean at Wits 170

Top Level Scheduling 1
Lean at Wits 171

Moments of Truth:
SAB Miller India
Lean at Wits 172

Defects and Problems
Lean at Wits
Variation Mistakes Complexity
Man Machine Material Method Information
Individual differences; motivation
Wrong Instructions;
Misreads
Verbose; Interpretation
Wrong method
Execution methods
Gage Accuracy
Material variation
Difficult method
Difficult to work
or assemble
Wrong material or part
Difficult setup
Incorrect Setup;
Software errors
Tool wear; Vibration
Omission; Dropped
parts
Training Experience
173

Toyota Kata
What is a Kata? How does this relate to the Human brain? What is a ‘Target CondiHon’? What is not a ‘Target CondiHon’? What do we assume about geung to the target condiHon?
Lean at Wits 174

Kata from Rother
Not Daily management + improvement But Daily management = improvement
Target and Target CondiHon Target is an outcome Target condiHon is a descripHon of a process operaHng in a way required to achieve the outcome
Lean at Wits 175

Kata: The Five Questions
1. What is the target condiHon? 2. What is the actual condiHon now? 3. What obstacles are prevenHng us from reaching the
target condiHon? 4. What is the next step?
• And, how can we test this step or idea as quickly as possible? An experiment?
5. When can we go see what we have learned in taking the step?
• Reflect on what actually happened
Lean at Wits 176

Target Condition Without a target condiHon we could have lots of ideas:
• Reduce setup Hme… • Introduce kanban… • Set up a cell…
A target condiHon could be ‘what is prevenHng us from a MTTR less than 5 minutes?’. This could lead to the next acHon e.g. ‘improve signaling system’ A target condiHon should not be too trivial or too difficult Note the similariHes with Maurer, Amabile, Expectancy Theory Then another small step. RepeHHon. Coaching So moHvaHon! (and Tools are used to develop people!)
Lean at Wits 177
A long list! As from a VSM But what to do first?
Confusing? Demotivating?
From Mike Rother, Toyota Kata, McGraw Hill, 2010

Two Types of Kata: (1) Improvement
• Establish the target condiHon (note: ‘a target is an outcome; a target condiHon is a descripHon of a process operaHng in a way required to achieve the desired outcome’)
• Without a target condiHon: ‘we could reduce setup Hme, start %s, apply kanban,…’ • With a target condiHon: ‘What is prevenHng us from compleHng a part every 2 minutes?’
The NEXT target condiHon. Step by step. Not the final (see next slide)
• Examples of NOT a target condiHon ‘implement’ (vague),’apply’ (countermeasure), ‘minimise’ (vague, must be related to a point in Hme),’ reduce’ (an outcome)
It is PDCA; rapid experimentaHon, not the workers fault. The Five QuesHons
• What is the target condiHon? • What is the actual condiHon now? • What obstacles are prevenHng you from reaching the target condiHon? • What is your next step? • When can we go see what you have learned from taking the step?
Lean at Wits 178
See Mike Rother, Toyota Kata, McGraw Hill

The problem path
Lean at Wits
The Current
Condition The
Target Condition
The next step
The way through the grey zone is unclear; but get started, don’t debate The torch analogy (You can only see so far) The Heuristic (Keep climbing) Predict and Lean (like PDSA and Steve Spear) Establish the small next step (not threatening); not the ideal (too difficult!)
179

Tools and Kata
Not ‘I have a toolbox so let me look for areas where I can apply them’ or ‘I know about 5S so let us apply that’
But ‘I have a target condiHon, so let me find an appropriate tool to use’
So (For me) not a quesHon of ‘Toolheads’ or not, but how tools are selected and used
Lean at Wits 180

Two Types of Kata: (2) Coaching Kata
Philosophy • If a problem occurs, Do it now! (Why?) • Who should learn and follow up ? (The team leader, not the worker who
does not have the Hme; so smaller span) The mentor, mentee dialog A3 problem solving
• ‘if the worker hasn’t learned the instructor hasn’t taught’ • ‘it takes two to A3’ • Toyota 8 step methodology: a way to focus and clarify the specific (small)
problem – by dialog • Define, break down into chunks, i/d root cause, set next target, select soluHon from
several alternaHves, implement, check, adjust and standardise • Go and see together (not report back); show me • Focus on understanding, not the countermeasure • Focus on the process, not the people • Fact based, test and see
Lean at Wits 181 See Mike Rother, Toyota Kata, McGraw Hill

Learner or Knower?
Lean at Wits 182
From Flinchbaugh (2013)

After Action Reviews US Army Do it immediately, every Hme; NOT an evaluaHon or a criHque! The four steps are:
1. ObjecHve. What did we set out to do? (What was planned?) 2. Reality: What actually happened? (Note: this is not judgmental or
an evaluaHon. It is simply the facts about what happened at each stage of the game or project.)
3. Learning: Why did it happen that way? What went right and wrong. What did not meet expectaHons. What went well? Again, sHck to the facts. It should not be personal. No blame. This is a learning step so ask what caused the results to turn out the way they did.
4. Next Hme. What should be changed next Hme: planning, processes, behaviours. What should be kept
Senge on why this is the best, but o}en fails
Lean at Wits 183 See detailed description in David Garvin, Leaning in Action, HBS Press, 1999, pp 106-116

A3 Problem Solving
Issue
Background
Problem Analysis
Current Condition
Why? Cost
Why?
Why?
what who when outcome
Countermeasures
Implementation Plan
Target Condition
Cost / Benefit Test
To customer To organization
Follow up
Stamps
184 Lean at Wits

A3 Problem Solving (this is PDCA!)
Issue
Background
Problem Analysis
Current Condition
Why? Cost
Why?
Why?
what who when predicted outcome
Countermeasures
Implementation Plan
Target Condition
Cost / Benefit Test
To customer To organization
Follow up
Stamps
Through the eyes of the customer
Sketch or Current state
VSM
Run diagram, Fishbone,
5 why
Sketch or Future state
VSM
Study cost, Implementation cost Note both
All who have seen
Now; Soon
How to move towards The ideal state
185 Lean at Wits

186 Lean at Wits

Lean at Wits 187

A3 and ‘Rapid Response’ at Lifescan, Scotland
Lean at Wits 188

Improvement Types
Lean at Wits 189

Standardisation and Management
Lean at Wits
Top
Middle
Supervisor
Operator
Point Kaizen means establishing new standards
190

Kaizen: One Small Step at a Time :Why?
Lean at Wits 191

Kaizen: One Small Step at a Time :Why?
Non threatening Immediate Leads to habit Builds confidence Linked with ritual Empowers staff Less fear of failure Reduce stress (‘How do you eat an elephant?) Encourages experimentaHon (The drunk, his lost item, and the streetlamp)
Lean at Wits 192

Kaizen, Small Steps and the Brain
Lean at Wits
Large Goal > fear > access to cortex restricted > failure
Small Goal > fear bypassed > cortex engaged > success
Three Stages of brain
Reference: Robert Maurer, One Small Step Can Change Your Life: The Kaizen Way, Workman, 2004
193

Small Steps: Maurer Suggests Ask liPle quesHons Set small goals (‘Take one less bite at the chocolate; Not 5S but one minute per day to Hdy) Solve small problems Learn to see small opportuniHes and rouHne (What colour car is parked..) An org structure that makes small ideas easy to implement Learn to anHcipate (Deming, Spear) Break down big problems into small ones Small ideas repeated have bePer retenHon (Think exams!) Don’t keep problems to yourself. Encourage discussion
Lean at Wits Reference: Robert Maurer, One Small Step Can Change Your Life: The Kaizen Way, Workman, 2004 194

Rewards and Small Steps
Why are suggesHon schemes, in general A failure in the West? A success in Japan?
Lean at Wits 195

Pokayoke
For Six Sigma perfecHon, standards and SPC may not be enough You can have high process capability, but sHll fail due to mistakes
hence 100% automaHc inspecHon together with warning or stop
Lean at Wits 196

Absolutely Excellent Web Site on Pokayoke!
Lean at Wits
http://www.campbell.berry.edu/faculty/jgrout/pokayoke.shtml
197

Everyday Pokayokes
Lean at Wits 198

Suggest a Pokayoke
Lean at Wits
Truck jammed Smoke detector that Is not working
199

Implementing Pokayoke
Lean at Wits
Simplify Mistake- Proof Convert adjustment to settings Control Variation
Product Process Tools & Equipt
1 2 3
Fixture setup
Use repair
Assmby simplif
Product simplif
Process flow
Process exec
Process control
SPC Six Sigma
Simple equipmt
Mistake proof equipment
“The priority in applying quality paradigms should proceed from top to bottom and right to left in the order shown” Martin Hinckley Make No Mistake! Productivity, 2001
200

Another pokayoke…
These men have just finished installing poles to prevent cars parking on the sidewalk
Lean at Wits 201

Why are Manhole Covers round?
202 Lean at Wits

….and Checklists
Boeing B17 TWI
Lean at Wits 203

Checklists
Lean at Wits 204

Pokayoke Methods and Examples
Lean at Wits
Contact Fixed Value Motion Step
Control Warning
Parking height bars Armrests on seats
Staff mirrors Shop entrance bell
French fry scoop Pre-dosed medication
Trays with indentations
Airline lavatory doors Spellcheckers Beepers on ATMs
from : Richard Chase and Douglas Stewart, Mistake Proofing Based on Shigeo Shingo
205

Pokayoke Cycles
“LiPle pokayoke” • Immediate detecHon and stop or warning • Short term prevenHon
“Big pokayoke” • Geung a}er the root cause of the problem • Long term prevenHon and problem solving • Accumulate the evidence
Lean at Wits
PDC
A
P
DC
A
206

Pokayoke References
Shigeo Shingo, Zero Quality Control: Source InspecAon and the Pokayoke System, ProducHvity, 1983 Nikkan Kogyo (ed), Poke-‐Yoke, ProducHvity, 1989 Web site by John Grout (excellent)
• See Quality 75 C. MarHn Hinckley, Make No Mistake!, ProducHvity, 2001
Lean at Wits 207

Ideas?
Lean at Wits 208
Your Experience?

Idea Management..
Lean at Wits 209
Ideas are evaluated by shop floor operators across all 3 shifts
Lifescan, Scotland

Idea Management..
Lean at Wits 210
Lifescan, Scotland

Idea Management..
Lean at Wits 211
Implemented ideas. (Now shown on Touchscreen TV)
Lifescan, Scotland

TPM
Lean at Wits 212

Nothing said about schedule a`ainment Changeover! Cost factors
§ Reducing OEE (& esp changeover at great cost may not be worthwhile § OEE is in terms of >me, not cost -‐ for example, quality may be minor wrt
OEE, but a major cost
Do not measure OEE plant wide Use a control chart, for common & special causes A boast like ‘we have improved OEE by 20%’ should be treated with cau>on § Overproducing? Bo`leneck? Appropriate? Bigger batches?
Lean at Wits 213

OEE is best used for shop floor problem iden>fica>on, but less good when used as a top-‐down imposed measure No such thing as world-‐class OEE -‐ depends on industry (in process industry 85% is poor) Loca>on of the bo`leneck -‐ downstream more cri>cal because higher part value Is .9 x .7 x .9 same as .7 x .9 x .9 ? (depends on policy advantage)
Lean at Wits 214

Lean at Wits
OEE
Quality
Speed
Availability
=
X
X
215

Lean at Wits
OEE
Quality
Speed
Availability
=
X
X
Utilization
216

Lean at Wits
OEE
Quality
Speed
Availability
=
X
X
MTBF
MTTR + MTBF
=
217

Machine MTTF (hr) MTTR (hr) Defect % OEE %
1 90 10 10 81%
2 9 1 10 81%
3 85 15 5 81%
4 8.5 1.5 5 81%
Lean at Wits 218

Lean at Wits
OEE
Quality
Speed
Availability
=
X
X
Productivity
219

Case A: Quality = 80%; availability and speed both 100% Case B: Availability is 80%; quality and speed both 100% OEE is the same in both cases: 80% Output is the same in both cases: 80% of poten>al BUT Inputs (e.g. Raw Material) is different So, Produc>vity (Output / Input) is different!
Lean at Wits 220

Lean at Wits 221
After Teresa Hayes MSc Lean, 2013

Lean at Wits 222

Lean Layout
Lean at Wits 223

224 Lean at Wits
PRODUCT LAYOUT PROCESS LAYOUT
1 DescripHon SequenHal arrangement of machines
FuncHonal grouping of machines
2 Type of Process ConHnuous, mass producHon mainly assembly
IntermiPent, job shop batch producHon, mainly fabricaHon
3 Product Standardized made to stock
Varied made to order
4 Demand Stable FluctuaHng
5 Volume High Low
6 Equipment Special purpose General purpose
7 Workers Limited skills Varied skills

225 Lean at Wits
PRODUCT LAYOUT PROCESS LAYOUT
8 Inventory Low in-‐process high finished goods
High in-‐process low finished goods
9 Storage space Small Large
10 Material handling Fixed path (conveyor) Variable path (forkli})
11 Aisles Narrow Wide
12 Scheduling Part of balancing Dynamic
13 Layout decision Line balancing Machine locaHon
14 Goal Equalize work at each staHon Minimize material handling cost
15 Advantage Efficiency Flexibility

Proc
ess
project job shop batch cell line flow
one off low repetitive high continuous volume volume flow
226 Lean at Wits

Proc
ess
one off low repetitive high continuous volume volume flow
APS + Lean
Lean + MRP?
Lean
LP/MP
CPA+ Lean project job shop cell line flow
227 Lean at Wits

Process
project job shop cell line flow
one off low repetitive high continuous volume volume flow
Professional Services
(a la carte, corporate lending)
Service Shops
(Pizza Hut, Personal banking)
Mass Services
(McD, Subway, ATMs)
228 Lean at Wits

cost demands Process
variety demands
cost demands
market demands
one off low repetitive high continuous volume volume flow
project job shop cell line flow
229 Lean at Wits

Loca>on Plant Layout Cell Layout Worksta>on Layout
230 Lean at Wits

Loca>on Plant Layout Cell Layout Worksta>on Layout
231 Lean at Wits

The very big picture Map the external flows Focus § The Great Nuclear Fizzle at old B&W
232 Lean at Wits

To support an organisa>on’s vision Safety, comfort, convenience and job sa>sfac>on for employees Effec>ve u>lisa>on of equipment and resources to facilitate the manufacturing process Flexibility of opera>on and ease of maintenance Minimising capital expenditure & maximising ROI Minimise material handling and make economical use of the building/site space
(Adapted from Apple 1977 and Tompkins et al. 1996)
Lean at Wits 233

1. Changes in the design of exis>ng product, the elimina>on of products from the product line, and the introduc>on of new products.
2. Changes in the processing sequences for exis>ng products, replacements of exis>ng processing equipment, and changes in the use of general-‐purpose and special-‐purpose equipment.
3. Changes in produc>on quan>>es and associated produc>on schedules, resul>ng in the need for capacity changes.
4. Changes in the organiza>onal structure as well as changes in management philosophies concerning produc>on strategies...”
(Tompkins et al 1996, p. 307) Uniq Evercreech current reality
Material Machinery Man Movement Wai>ng Service Buildings Change
(Taken from Muther 1955)
“The need for a facility layout study can arise under a variety of circumstances...
The 8 factors that influence layout:
Lean at Wits 234

The General Hospital Vs Sholdice Hospital, Toronto
235 Lean at Wits

100%
Contribution
Ranked Products
Invest ? Provided they
are future products
Reorganise ? Go Lean !!!
Cut ?
But how similar is this profile to the next….
236 Lean at Wits

Lean at Wits 237
Ranked contribution
per bottleneck
minute
Ranked Products
You don’t want to be making products which make low
contribution, and which tie up precious bottleneck capacity!
Note these!

Loca>on Plant Layout Cell Layout Worksta>on Layout
238 Lean at Wits

Richard Muther began to develop the SLP process in the 1950’s; it has con>nued to evolve and can be found as the base framework for many other layout approaches (e.g. Moore 1962, Apple 1977, Tompkins et al. 1996, )
SLP is a ‘scien>fic’ approach to layout and involves: § A clear statement of the problem or
task § Facts that can be measured § Restatement or reclarifica>on of the
task in light of the facts § An objec>ve analysis, leading to a
decision § Ac,on for approval and installa>on § Follow-‐up or check
(Muther 1955, p. 143)
Background Systema>c Layout Planning Pa`ern*
Lean at Wits 239

Uniq Evercreech is to receive an addi>onal 35 Sku’s during 2012 as its M&S desserts business is transferred from its Shropshire site; Evercreech has an integrated Manufacturing, Innova>on and People strategy, which it aims to deliver between 2010 and 2013 – these involve an innova>on-‐led, flexible opera>on with engaged people as its key lever to drive change;
The acquisi>on of Uniq by Greencore in 2011 has led to an increased focus on results delivery as well as the approval of capex to make building changes.
Richard Muther & Associates 2005
Lean at Wits 240

Rule of thumb: § Maximum area -‐ around 200,000 square z; 20,000 sq m § Maximum people -‐ 500 § Maximum SKU’s -‐ 2,000 § For fab / assembly -‐ cut all numbers by 4 (except steel, auto, etc.)
Why ? § Internal flows become too complex § Access to central areas -‐ even with mul> docks § People cease to feel like a family § Loss of focus § Management structures too complex, too remote § Examples: Nypro, 3M, HP, Solectron, Celes>ca -‐ Telford, mi`lestand
Lean at Wits 241
After Richard Schonberger, Let’s Fix It!

Shape § Rectangular 60:40 offers many op>ons § Long and narrow, very few op>ons § Square may not offer enough side-‐to-‐side distances for some, too much for others
Flow Pa`erns
After Richard Schonberger
Good Less Good
242 Lean at Wits

Not end-‐to-‐end, but mul>-‐dock around the outside For flexibility Dell demolishing a two year old plant to create mul>-‐access. 50% of outside walls are receiving and shipping docks -‐ for 5 inventory turns a day – § (Tom Peters, AME, 2001) and Ford, Wixom MI (one of the most profitable in world)
Lean at Wits 243
After Richard Schonberger, Let’s Fix It!

Collect the opinions of the par>cipants Summarise onto the REL chart using AEIOUX Ac>vity Arrangement diagram -‐ eyeball method Space rela>onship diagram -‐ fiwng the rela>ve loca>ons into the available space Physical model and discussion
Lean at Wits 244

A Absolutely necessary E Essen>al I Important O Ordinary U Unimportant X Must not be located together
Make the diagram cooler!
245 Lean at Wits

Production
Offices
Stockroom
Shipping and Receiving
Locker Room
Toolroom
A A
A O
O
OO
O
U
U U
U
E X
I
246 Lean at Wits

247 Lean at Wits

248 Lean at Wits

Format taken from Richard Muther & Associates . Colour Key taken from A. G. Raymond & Company.
RELATIONSHIP CHART Plant (Company)
Charted by
Date
Reference
Uniq Evercreech (Greencore)
Carolyn Hobdey
Jan-12
SLP_CH_2012
With
Project
n/a
Site Layout: Module 3
Sheet of 11
111 Offices (inc. HR & Finance)
1CLOSENESS No. of
Ratings1 Value1 Offices (inc. HR & Finance) 2
1CLOSENESS No. of
Ratings1 Value1 Offices (inc. HR & Finance) 2
ECLOSENESS No. of
Ratings1 Value1 Offices (inc. HR & Finance) 2
3ECLOSENESS
A
No. of Ratings
14
1
2
Value1
2
Offices (inc. HR & Finance)
Planning, Purchasing & Technical Offices
35EU A 1422 Planning, Purchasing &
Technical Offices
34
5 U A 1422 Planning, Purchasing & Technical Offices I
4_O
5 U
E
A 14
8
22 Planning, Purchasing & Technical Offices I
4_O 5 E 8
2
3
2
3
Planning, Purchasing & Technical Offices
Changing Rooms A 2I_
6O
6I5
ImportantI
E 83
133 Changing Rooms A
62
7E
6
A6I
2 I Important
O
I
22
133
4
Changing Rooms
Business Unit 'A' Production
61A
78
EA6
2 I2A I
O 224 Business Unit 'A' Production1A 8
9
6
UAA
2A6 A6
I5 O
U
22
9 Unimportant
4
5
Business Unit 'A' Production
Warehouse & Distribution9
10IU
E 6A6
A_
6 A6
I15
I
X
U 9 Unimportant
0Not desirable
5 Warehouse & Distribution 10IO5
11E 6
O
6
A
_
E6I2
1
AI1
X 0Not desirable
5
6
Warehouse & Distribution
Business Unit 'B' Production
O511
124 EA O
OA1 4
E2
62
I1A 1
U X 0
66
Not desirable
Total = =56 Business Unit 'B' Production
1312
U
4 EAI
O41
1
E E
4
U
2I2
1
AU_
66Total = =5
Dairy
6
7
Business Unit 'B' Production
1314
U_UO
I_
41
O2 21E E U
IA
2A1
_
15Dairy7 14
_UO2 O _
_O2 2
OI
1
AI4U 1
A14
16Packaging Store15
Dairy
8
7
22 O _
44OI
OA
I
4
O3U_
1
O
4
1617
Packaging Store8 22
IO 444O
4I O3
O3_
OO
1718
Packaging Store
Innovation Centre
8
9 O
2 IO 434
4 O4
3
AO4 O 18Innovation Centre9 O 34
O 44A
3 O
4
O 4O 18
19Innovation Centre9
O 43 OO 419
Innovation Centre
Rest Room/Canteen
9
103 O 4O 4
43 OO 4
E 2019
Rest Room/Canteen103 O 44 E
1
20Rest Room/Canteen
Engineering Department
10
11
U_
3 O4
44
4O
E2
U 12
Engineering Department11_4
OU_ 2
3
Engineering Department
Main Parking Area
11
12
O4
_
34
Main Parking Area124
45
Main Parking Area12
13 56
136
714
13
78
148
9
14
15 910
15
Code REASON
1011
15
16 Code REASON1 Flow of material
1112
161 Flow of material
2 Management communication
1216
17 13 2 Management communication
3 Internal service delivery1417 13
3 Internal service delivery
4 Convenience
1415
17
18 4 Convenience
5 Financial control
1516
185 Financial control
6 Food safety/legislative requirements
1617
18
19 6 Food safety/legislative requirements
7
1718
1978
181920
19
89
1920
20
RICHARD MUTHER & ASSOCIATES - 130
92020
Reasons in code (below)
Importance of relationship (top)
This block shows relationbetween "1" and "3"
"Closeness"Rating
Reasons behind the
"Closeness" Value
N x (N-1)2
NecessaryAbsolutely
ImportantEspecially
OrdinaryCloseness OK
Lean at Wits 249

Bad
Be`er
Much Be`er
Lean at Wits 250

Bad (conveyor)
S>ll Bad (forkliz)
Much Be`er (tugger)
Best (hand trolley)
Lean at Wits 251

Material handling spine Communica>on / people spine Services grid Flexible cell areas Local receiving docks
E.g. HP Corvallis Printer Plant
Lean at Wits 252

Lean at Wits 253
!

T1
T2
F1
F2
C1
C3
C2
Inspection
Final Testing
Paint shop240 meter
80 meter
Training space
1. Flow line is cut up - large buffer capacity between
2. The system capacity is high
3. “Autonomous Complete Process”
Toyota Motomachi plant and Toyota Tahara plant
254 Lean at Wits

Lozy ceiling makes large one-‐touch inventory lineside buffers (and clear floors) possible Large inter-‐segment buffers (up to 15 cars); 8 segments Rela>vely long distance between cars (5 – 6 m) High system capacity / low assembly density Operators can use double the regular cycle >me without disturbing colleagues
Lean at Wits 255

Lean at Wits 256

Lean at Wits 257

Lean at Wits 258

This self regula>ng, near op>mal, system can be used wherever operators are cross trained to do all jobs (or most jobs) in a cell or line.
Method: Operators walk upstream un>l they meet another operator, then they work downstream un>l either they meet another operator or they reach the end of the line. Then repeat.
Star>ng off: n operators occupy the first n posi>ons in a line. Operator 1 passes work to operator 2 and so on un>l the last operator. The last operator progresses work through all following worksta>ons un>l the end of the line. Then walks back to operator 2 (who is by then working further downstream). Then revert to step 2.
This method is useful for mixed model, for frequent breaks, for automa>c coverage, etc. Very robust and flexible.
Arranging workers from slowest (at the start) to fastest is shown to be best. This method originated at Seiki Sewn products (a Toyota subsidiary) See Bartholdi and Eisenstein, ‘A Produc>on Line that Balances Itself’, Opera,ons Research, v44, n1, 22-‐34, 1996
Lean at Wits 259

Lean at Wits 260

Production Plan
Master Production Schedule
Material Requirements
Planning
Purchasing
Resource Plan
Rough Cut Capacity
Evaluation
Capacity Requirements
Plan
Detailed Scheduling
Input/Output Control
(Shop Floor Control)
Simulation
Accounting
Lean at Wits 261

Production Plan
Master Production Schedule
Material Requirements
Planning plan only
Purchasing
Resource Plan
Rough Cut Capacity
Evaluation
Capacity Requirements
Plan
Detailed Scheduling
Input/Output Control
(Shop Floor Control)
Simulation
Accounting
Lean at Wits 262

Production Plan
Master Production Schedule
Material Requirements
Forecast
Purchasing Advance Warning
Resource Plan
Rough Cut Capacity
Evaluation Shop Floor
Cell Capacity Planning
Detailed Daily
Schedules
Detailed Scheduling,
and Execution including Kanban
operations Heijunka
and call off
Mixed Model
Sequence
Improvement Targets
Central
Cell Lean at Wits 263

MPS
MRP
Supplier Press Shop Assembly Dispatch Customer
Mixed Model or Heijunka
forecast
forecast
call off
advisory
kanban kanban
Supermarket
advisory
Lean at Wits 264

Utilisation 100%
lead
time
production feasible
not feasible
Traditional Lean (?)
lead
time
Utilisation 100%
Lean at Wits 265

Definition (Push and Pull): § A pull system is one in which work is released
based on the status of the system and thereby places inherent limit on WIP.
§ A push system is one in which work is released without consideration of system status and hence does not inherently limit WIP.
Lean at Wits 266

Iden>fy the system constraint § the part of the system that cons>tutes its weakest link can be either physical or
a policy
Decide how to exploit the constraint § obtain as much capability as possible from a constraining component, without
undergoing expensive changes or upgrades § e.g. eliminate down>me at bo`leneck
Subordinate everything else § adjust non-‐constraint sewngs to enable constraint to operate at maximum
efficiency
Elevate the constraint § take whatever ac>on necessary to eliminate the constraint § only if step 2 and 3 not successful
Return to step 1 -‐ avoid iner>a!
Lean at Wits 267

Drum: constraint, works to customer demand Buffer: located in front of drum to keep it working at maximum output Rope: drum is roped to release point, work is pulled through system Synchronised with demand Constant tuning of policy buffers ensures minimum inventory Is TOC disguised pull system?
Lean at Wits 268

1 2 3 6 5 4
GYR
GYR Constraint Rope
Backlog Rope
269 Lean at Wits

1. Eliminate obvious waste n Scrap, rework, poor layout, excessive changeovers
2. Swop Buffers n Swop inventory buffers for capacity buffers: by working
more hours at key resources, in fact all the tac>cs in ‘The Goal’
3. Reduce Variability n Six Sigma, Standard Work, 5S
4. Con>nuously improve n Kaizen ac>vi>es; TOC 5 steps
Lean at Wits 270

1. Schedule your plant at 100% of capacity 2. Start working. Variability happens. 3. Cycle >mes increase, WIP piles up, delivery dates
are missed 4. Add capacity (over>me? subcontract?), or reduce
the number of jobs in the plant 5. Things get back under control. 6. So you go go back to step 1
Lean at Wits 271
Varia>on is much more important where there is high u>liza>on, but is rela>vely unimportant where there is low u>liza>on. If you are at the low u>liza>on end, Six Sigma projects aimed at varia>on reduc>on could be a waste of >me and money! U>liza>on generally has more influence on queues (lead >me) than varia>on. Reducing process varia>on is not enough! Arrival varia>on may be more significant Never compromise failure demand by a`empts to reduce varia>on.
Lean at Wits 272

The coefficient of varia>on (C in the formula) is σ / t § Where σ is the standard devia>on of the process >me § Where t is the average process >me
It is not absolute varia>on (σ) that is important, but the ra>o. So… Varia>on is much more important in short cycle opera>ons (typically volume manufacturing) than long cycle opera>ons (many types of service and administra>on) Where opera>on >mes are long, it is MUCH more important to ‘get it right first >me’ than to focus on reducing varia>on.
Lean at Wits 273

Lean at Wits 274
Variabilty Reduction
Excess Inventory
Excess Inventory
ExcessCapacity
ExcessCapacity
DelayTime
DelayTime
From Wallace Hopp, Supply Chain Science

Constraint iden>fica>on should take both varia>on and u>liza>on into account.
Protec>ng the constraint with a >me buffer is a tradeoff decision
The resource upstream of the constraint determines the arrival varia>on at the constraint.
Lean at Wits 275
Which is the Constraint?

Eight Building Blocks Ten Lean Scheduling Concepts
§ See Lean Toolbox 4th edi>on
Lean at Wits 276

A is a bottleneck or pacemaker, B is a non-bottleneck
A B
Where to place buffer inventory ?
Lean at Wits 277

A is a bottleneck or pacemaker, B is a non-bottleneck
A B
Where to place buffer inventory ?
Lean at Wits 278
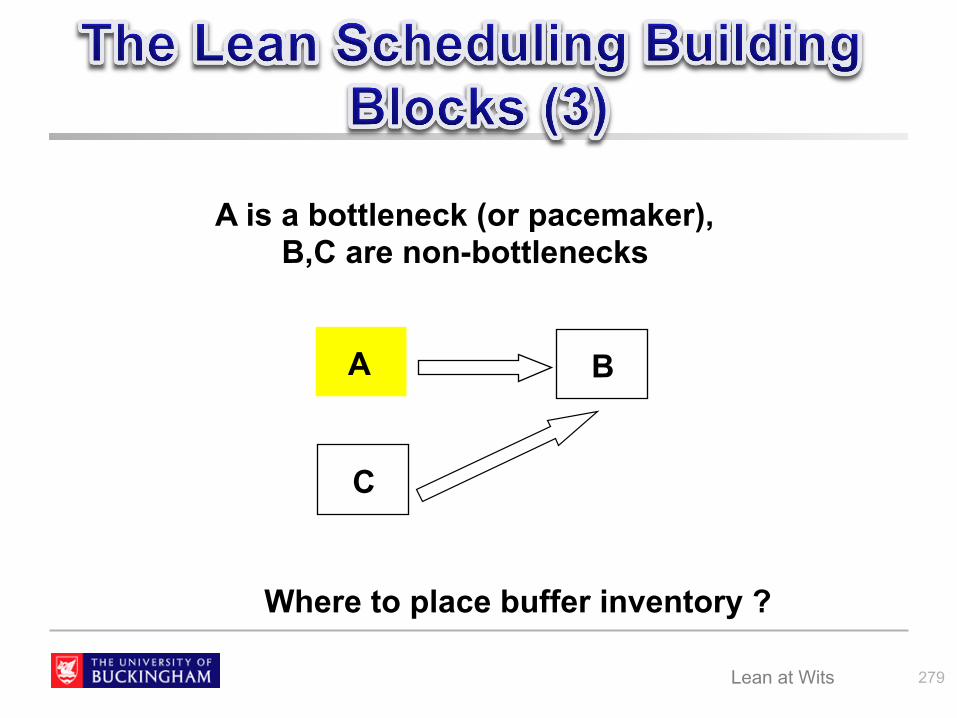
A is a bottleneck (or pacemaker), B,C are non-bottlenecks
A B
Where to place buffer inventory ?
C
Lean at Wits 279

Buffer
X
X
X Assembly Constraint Work station
Example from Tomlinson, TPMI
Lean at Wits 280

A requires relatively long changeover, B has short or nil c/o
A C
Where to place a supermarket ? How does A know what to work on ?
D
B
Lean at Wits 281

A is a bottleneck (or pacemaker), B,C are non-bottlenecks
A B
How much inventory in front of A ? Other questions? (from B, from C, from both?)
C
Lean at Wits 282

A, B, C, D are sequential operations
B C
What is the first question to ask ? What determines the location of supermarkets?
A D
Lean at Wits 283

A
C
B
A is a bottleneck, so needs to be protected by inventory What are other considerations?
A, B and C all have
Changeovers
Lean at Wits 284

What are the buffer considerations along the Two sections of power conveyor?
A is a bottleneck
B and C are Non-
bottlenecks The three are
joined by conveyors
A C B
For example, a bottling plant:
Lean at Wits 285

Demand Smoothing Takt and Pitch ONE Pacemaker Supermarkets and FIFO Lanes Runners, Repeaters, Strangers Mixed Model Scheduling Pull and Kanban Smaller Batch Sizes and EPE Regular Material Handling Route (‘Runner’) Levelling and Heijunka Authorisa>on
Reference: The New Lean Toolbox Pages 103 - 120
Lean at Wits 286

Iden>fy the most constrained machines or processes List the products that go through the process, their weekly demand and their unit cycle >mes. Calculate the sum of (weekly demand x cycle >mes) Divide by available working >me per week. Where this ra>o is >1, more than 1 machine or over>me is needed. Where the ra>o is above approx 0.8 take care (remember queuing theory and dice game!).
Lean at Wits 287

buffe
r
Quality Demand
Smoothed demand
Perfect quality
Occasional longer customer waits (but note some customers don’t mind waiting)
Zero tolerance of defects Very strict, receiving, requirements
…and never pass on a defect, even if it means waiting
…and never cause amplification
Lean at Wits 288

Takt time =
Net available time is total time less planned downtime
Required production quantity per day
Net available production time per day
Pitch time = Takt time x Container quantity
Container quantity could be the final packing quantity or the container move quantity. Often “human movable”
Lean at Wits 289

Helps avoid Unsynchronised opera>ons Amplifica>on Data processing schedule and inventory inaccuracies
Lean at Wits 290

Reference: Lean Lexicon, LEI
Lean at Wits 291

If a subsequent opera>on has a changeover (or inspec>on) but shorter cycle, calculate the number required to catch up If the next opera>on has a longer cycle >me, or inspec>on, takt >me should govern -‐ but a short FIFO lane could be appropriate to allow the previous opera>on longer ‘breathing space’.
Lean at Wits 292

Runners : dedicate facili>es; may be worth doing irrespec>ve of volume for >me compe>tors Repeaters : build the schedule around them; give them regular slots; make as ozen as possible § repeaters are by regularity, not volume § two types : high frequency -‐ put them into regular slots; and low frequency -‐ use priority kanban
Strangers : fit them around repeaters; batch size may be determined by order quan>ty, but transfer quan>ty may differ
Lean at Wits 293

Product Jan Feb Mar Apr May Jun Jul Aug Sep Oct Nov Grand Total Frequency Freq Type Culm % Culm Useage12008CABLE ASSY, 3/D/2362, ISS 6 9 12 11 9 9 9 11 14 10 14 6 114 11 Runner 9.53% 11412020CABLE ASSY, 3/D/2492 ISS 3 13 8 4 8 9 11 8 8 5 10 7 91 11 Runner 17.14% 20512057CABLE ASSY RDS KEYPAC ISS 2 11 8 14 11 10 8 5 5 5 10 87 10 Runner 24.41% 29212077CABLE TAMPER LEAD ISS 2 2 3 7 6 8 8 4 9 9 7 9 72 11 Runner 30.43% 364205XFMR (E/K1000), ISSUE 11 6 6 8 4 5 4 4 5 4 5 4 55 11 Runner 35.03% 41912091Cable Assembly, Earth Lead, PAC202 ISSUE 1 1 1 5 2 6 7 3 8 4 6 4 47 11 Runner 38.96% 466218XFMR (11226), ASSEM,ISSUE 14 4 3 4 5 4 4 4 3 4 3 3 41 11 Runner 42.39% 50712087Cable Assembly, GSM Modem, EK1000/2200 6 5 4 2 2 3 3 6 1 4 4 40 11 Runner 45.74% 547176XFMR,COIL, STANDARD RDR,ISSUE4 6 3 3 2 4 4 3 4 3 4 2 38 11 Runner 48.91% 58512110Cable Assembly, E/K Printer 4/E/2431 Issue 0 3 3 8 3 2 4 2 3 4 3 35 10 Runner 51.84% 620164XFMR,UNIVERSAL COIL 1 3 6 3 6 6 2 1 3 31 9 Runner 54.43% 65112078Cable Battery Lead PAC 2200 Issue 2 1 2 5 4 2 2 3 4 3 3 1 30 11 Runner 56.94% 681235Transformer, 240/16.5V 3/D/1947 issue 2 1 3 1 4 3 3 1 2 3 1 4 26 11 Runner 59.11% 70712076Cable SWB To SWB PAC 2284 Issue 2 1 1 4 3 1 2 3 3 2 2 1 23 11 Runner 61.04% 730
12518Cable Assembly, PC Reader Issue 1 2 1 2 1 3 1 1 11 7 Died 87.37% 104512090Cable Assembly, 3/E/2727 Issue B 2 1 1 1 1 2 1 1 10 8 Runner 88.21% 105512085Cable Assembly, Micro Reader, 4/E/2714/iss0 1 2 2 2 2 9 5 Repeater 88.96% 106412051Cable Assembly, 4/E/2511 Issue 2 1 1 1 1 1 1 1 1 8 8 Runner 89.63% 1072216XFMR (19401), ASSEM,ISUE 14 1 1 1 1 1 1 1 1 8 8 Runner 90.30% 108012029CABLE ASSY, 3/E/0350 ISS 3 2 1 1 1 1 1 1 8 7 Runner 90.97% 1088168AFMRAIRCOIL, EKEY, MKII,ISSUE3 1 2 1 1 1 1 1 8 7 Repeater 91.64% 109612028CABLE ASSY, 3/E/0350 ISS 3 1 1 1 1 1 1 1 7 7 Runner 92.22% 110312112COIL CABLE, 4/D/2512 ISS 1 1 1 1 1 1 1 1 7 7 Repeater 92.81% 1110175XFMR, COIL, PAC-KEY SLIMLINE RD 1 1 1 1 1 1 1 7 7 Runner 93.39% 111712518Cable Assembly PC Reader Issue 1 1 1 2 2 6 4 Runner 93.90% 11231863Cable Assy PSU To NTWK Cont Issue 4 1 1 1 1 1 5 5 Repeater 94.31% 112812517E/K Battery Leads - Issue 1 1 1 1 1 4 4 Repeater 94.65% 1132179XFMR COIL,L/P RDR,ISSUE 7 1 1 1 1 4 4 Stranger 94.98% 11361870Cable Assembly, Earth Lead Assembly D7112-X01 - Issue 1 1 1 1 1 4 4 Stranger 95.32% 1140161XFMR COIL,FF 4000,ISSUE 5 1 2 1 4 3 Stranger 95.65% 114412519Cable Assembly, PC Reader Cable 6 Core 1 1 1 3 3 Stranger 95.90% 1147203XFMR Reader (19256), Issue 14 1 1 1 3 3 Stranger 96.15% 1150
Example from Tomlinson, TPMI Lean at Wits 294

Runners Repeaters Strangers
A B C 2 bin
tight kanban
2 bin
MRP
MRP ?
2 bin MRP ?
tight kanban MRP ?
“loose” kanban
tight kanban
Lean at Wits 295

Runners Repeaters Strangers
A B C
MRP
Short L/T
Short L/T
Short L/T
Long L/T
Long L/T
Long L/T
Tight kanban
VMI
2 bin + SS
MRP
MRP
VMI
Kanban
Kanban Kanban
Kanban + SS
Kanban
Kanban + SS MRP
2 bin + SS 2 bin + SS
2 bin
2 bin
Lean at Wits 296

Lean at Wits 297

Lean at Wits 298

Conver>ng Strangers into Repeaters § Design and G.T. § Product line ra>onalisa>on § Working lower down in the BOM § Changeover / Batch size reduc>on § Thinking Heijunka (work slots)
Conver>ng Repeaters into Runners § As above, plus § Crea>ng cells § Choosing machines or capacity rather than inventory
Lean at Wits 299

Why is ABCABCABC be`er than AAABBBCCC ? Uniform material flow Balance Reduced inventory § In FGI § In WIP
Lean at Wits 300

“Don’t make anything until it is needed, and then make it very quickly.”
Womack and Jones
“The thing to do is to keep everything in motion, and take the work to the man and not the man to the work.”
Henry Ford, Today and Tomorrow, 1926
Lean at Wits 301

Withdrawal (Move) kanban § From finished good supermarket to shipping § Authorise movement § May be ini>ated by Heijunka slots
Produc>on kanban § At workcentres, to authorise produc>on § Indicate parts to be replenished to a finished goods supermarket
Signal kanban § Authorise batch produc>on. Ozen triangles § Tell how many units have been pulled from the supermarket
Lean at Wits 302

Kanban
Production
Signal / Triangle In plant Supplier
Move or “withdrawal”
Production card
Adapted from Suzaki The New Manufacturing Challenge Free Press
Lean at Wits 303

Kanban movements
Material movements
Op 1 Op 2 Op 3
Adapted from Bonvik, web.mit.edu
Lean at Wits 304

Kanban movements
Material movements
Op 1 Op 2 Op 3
Adapted from Bonvik, web.mit.edu
Pulling a red leads to replacement of red Pulling a blue leads to replacement of blue
red or blue red or blue red or blue
Lean at Wits 305

Kanban movements
Material movements
Op 1 Op 2 Op 3
Adapted from Bonvik, web.mit.edu
Pulling a red leads to replacement of red Pulling a blue leads to replacement of blue, etc BUT with many products, WIP becomes excessive SO…..
Lean at Wits 306

Kanban movements
Material movements
Op 1 Op 2 Op 3
Adapted from Bonvik, web.mit.edu
So, Card indicates a replacement, but what to make comes from the Schedule at gateway workcentre Other workcentres work on a FIFO basis
Lean at Wits 307

Kanban movements
Material movements
Op 1 Op 2 Op 3
Adapted from Bonvik, web.mit.edu
Lean at Wits 308

Lean at Wits 309

Lean at Wits 310

Product based and Capacity based Squares Single card Dual card Priority Heijunka board (10 minute capacity) Other signals § golf ball, faxban, e-‐ban
CONWIP and POLCA
Why all
these?
Lean at Wits 311

Number of kanbans =
Daily demand x (EPE frequency + Lead time) + Safety stock
Container size
Lean at Wits 312

Number of kanbans =
Daily demand x (EPE frequency + Lead time) + Safety Stock
Container size
EPE is given in days
(see EPE section)
The replenishment interval from sending the signal to receipt
This is a variable, used to adjust the no of kanbans to a feasible replenish-
ment interval
Used to compensate for
process uncertainties & demand variation
Lean at Wits 313

Don’t forget to review kanban quan>>es periodically Especially when demand, lead >me, or supplier performance changes This is where a computer system can be useful -‐ to track significant changes and give warnings.
Lean at Wits 314

No of batches x changeover >me = constant Maximum number of changeovers = (total >me -‐ >me for produc>on) internal setup >me but note if total external setup >me is longer than prodn and maint >me, this is the deciding factor
Changeover >me + (batch x cycle) = (batch x takt) gives target changeover and min. batch Minimum batch = Weekly demand / max changeovers
Lean at Wits 315

Start with the available >me per day (allowing for rou>ne main, OEE) Subtract the total required run >me per day to give >me available for changeover Maximum changeovers per day = >me available / average changeover >me Distribute the maximum changeovers per day between all the parts. More changeovers for A parts (perhaps more than 1 per day), less changeovers for C parts (perhaps less than one per day). Leave a li`le slack >me.
Lean at Wits 316

8 hour net working day; 6 products with daily demand (in produc>on >me) 2, 1, 1, 1, 0.5, 0.5 hours (total 6) per day; changeover >me = 1 hour 1 day EPE not feasible 2 day EPE not feasible 3 day EPE just feasible (over>me req’d?) 4 day EPE OK; can run A twice 5 day EPE OK; can run A every day (just)
Lean at Wits 317

Available >me per day = 7 x 60 mins = 420 mins.
8 products (A to H); total run >me for one days demand = 300 mins
Demand / day = 200, 100, 100, 50, 50, 30, 20, 20
Time remaining for changeover = 120 mins
Ave changeover >me = 20 mins No of changeovers per day = 120/20 = 6
Changeover Schedule Prod C/overs Batch EPE A 2 / day 100 0.5 B 1 100 1 C 1 100 1 D 0.5 100 2 E 0.5 100 2 F 0.3 90 3 G 0.3 60 3 H 0.3 60 3
Lean at Wits 318

Replenishment Interval (or EPEI Interval)
EPEI (the basis is): available resource Hme per day -‐ Hme to run a day’s quanHty of parts
= daily changeover Hme available Then make best use of this Hme to reduce batch size
Lean at Wits
EPEI = Total available time per day -
∑ (changeover time per campaign)
∑ (run times per day)
This gives the EPEI in days and batch size EPEI x daily demand
319

Batch sizing issues The EPEI calculaHon is a check in itself: if batch sizes work out larger than currently being run then the data is incorrect
Different machines may of course have different batch sizes. If there are skilled sePers who do the changeovers, use their net available Hme, not the machine available Hme
Sequence dependent changeover Hmes: Get an indicaHon of the batch size as above, but then use constant sequence, variable quanHty ( that is, when next due make up to the target level -‐ fix this at 2 x the batch size?)
If you have a flow sequence, say of 3 machines, take the largest batch on any machine.
Lean at Wits 320

Supermarkets Two possible locaHons for supermarkets
• At the supplier workcentre • At the point of use
Point of use is simpler for visibility But may have to locate at the supplier due to material handling consideraHons, or for mulHple branching
Note there are inventory implicaHons on supermarket sizing because the replenishment Hme may be longer if located at the point of use. This is a reason for locaHng at the supplier point.
SomeHmes both, to achieve both the above. Then link via move kanbans. Make to order inventory does not go in a supermarket
Lean at Wits 321

Sizing of Supermarkets
Covers the batch quanHty (EPEI) Covers customer demand during the normal replenishment transport lead Hme (order to receipt)
Covers buffer stock for customer demand variaHon
Covers safety stock in case of internal failure or breakdown
Lean at Wits
Note this variant of the standard Supermarket symbol:

Lead times and Order Points Replenishment Lead Hme = Total Transport Time + setup and make Hme SomeHmes the setup and make Hme needs to be replaced by the full EPEI interval, when there is likely to be a queue of work waiHng. Another factor is whether other products are being used by the customer workcentre during the lead Hme -‐ if so, no demand takes place during this Hme, and the queue Hme can be omiPed.
Transport Hme is the Hme to physically collect the kanban and to return the batch a}er processing. It is the worst case for the runner route -‐ note that a runner may someHmes collect a kanban every second route.
Order Point is customer demand *( lead Hme + safety stock)
Lean at Wits 323
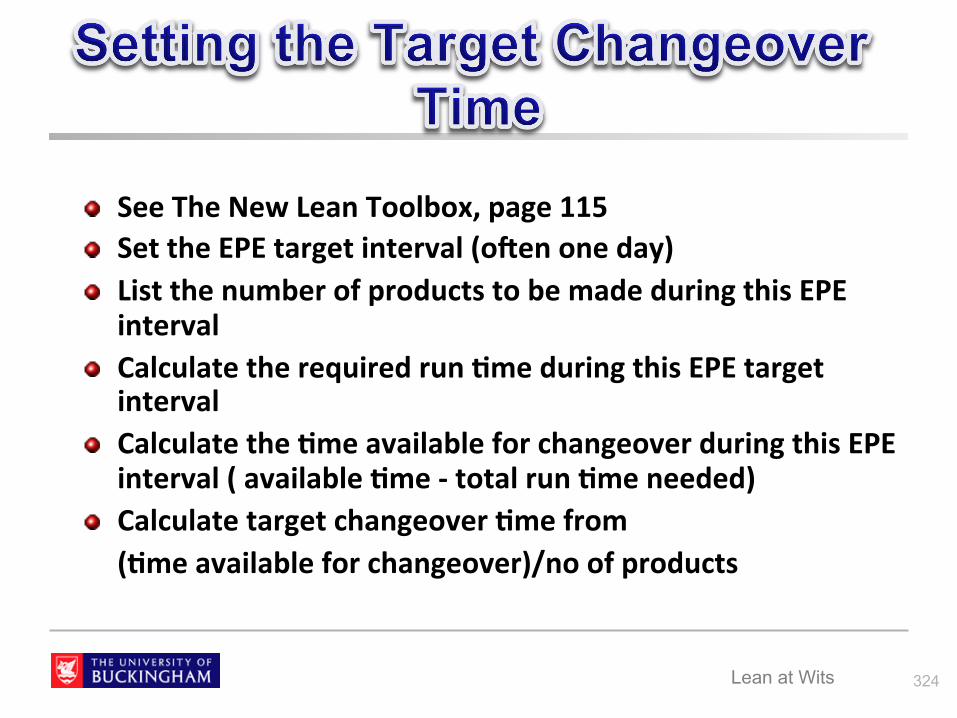
See The New Lean Toolbox, page 115 Set the EPE target interval (ozen one day) List the number of products to be made during this EPE interval Calculate the required run >me during this EPE target interval Calculate the >me available for changeover during this EPE interval ( available >me -‐ total run >me needed) Calculate target changeover >me from (>me available for changeover)/no of products
Lean at Wits 324
The pacemaker of the whole system Maintains the pitch Completes a collect and delivery cycle every pitch increment Starts at Heijunka box, and collects the authorised “work order”; goes the supermarket and picks this up; takes kanbans to cells; delivers material; moves material; returns to Heijunka
Lean at Wits 325

Lean at Wits 326

Lean at Wits 327

Products
A B C D E F G H I
Red Zone
Green Zone
Yellow Zone
Black Zone
Spike Demands
Calculate Capacity by Zone Daily
c/o times + run times
If black can’t cope then overtime
Then calculate the time horizon to complete all red and all yellow
Lean at Wits 328

Pitch Increments Today 8 9 10 11 12 13 14 15 16 17 Next Week Week After
Part A
M T W Th F M T W Th F
Part B
Part C
9 10 11 12 13 14 15 16 17 18
Pitches Missed 4
Missed Pitches Analysis No Reason
Lean at Wits 329

Heijunka Extensions: Different Pack out Quantities and Pitch (2)
Lean at Wits
Pitch
Product 8:00 8:15 8:30 8:45 9:00 9:15 9:30 9:45 10:00
Red Break
Green
Blue
Yellow
Red, Green, Yel have different
Pitches to Blue
Two cards per Pitch, except when Blue
May be balanced for 3 pitches
if very different; Otherwise ignore
330

Day-by-the-Hour (or Tally) Board
Use as an interim on the road to Heijunka Target
Accum Actual
Accum Ahead +
Behind - Causes and
Countermeasures
8:00
9:00 Breakdown
Red card issued
10:00
11:15 Caught up with Extra manning
100
50
50 50
50
50 150
50
50
200
40
70
50
90
140
210
0
-10
+10
-10
Lean at Wits 331

Day by Hour Board: Lake Region
Lean at Wits 332

Lean at Wits 333

Wide aisle 4m
Turning machines
Priority Kanban boards
Lean at Wits 334

Boxes With products accumulate on a roller FIFO
Lane
If boxes accumulate into the red zone, Operators
must stop working on other products and start working on this one, until
the red zone is clear
Lean at Wits 335

Tugger collects Components at 10am
Tugger collects Finished Products
at 11:30am
Production between
10:30 and 11:00
Inside are Details of
the products to be made
And the components
required
Tugger (Runner) goes around
once per hour, but
production is In half hour
increments; so Tugger
collects two Tablets per
round Clear Plastic Tablet,
Perhaps 120mm x 200mm
Lean at Wits 336

Can be linked to long-‐cycle opera>ons § Using standard work packages § Some work packages may repeat several >mes
Can be used for warehouse opera>ons § The Heijunka box determines the pick cycles § Can use >me mul>ples e.g. 12, 24, 36 minute pick cycles
Can be used to synchronise various converging paths § Each box slot contains cards which go to several routes
Lean at Wits 337

The Lean Toolbox, 4th edi>on, relevant sec>ons Jeff Liker, The Toyota Way, McGraw Hill, 2004, Chaps 8 – 10 Hopp and Spearman, Factory Physics, Irwin, 2007 (3rd ed) Kevin Duggan, Crea,ng Mixed Model Value Streams, Produc>vity, 2002
Goldra` and Cox, The Goal See www.factory-physics.com/
Lean at Wits 338

Highly seasonal Major product families Some customized Some machining with changeover >mes Large items (2 – 4 m) MRP with MPS Quality Issues
Laser cuwng, Welding, Pain>ng, Assembly of products Job shop in above areas. Frequent delivery failures 5 x 8 hr. week with frequent over>me. What to do?
Lean at Wits 339

Three stages Job Shop TOC Lean Flow
Lean at Wits 340

Lean at Wits 341

Lean at Wits 342

Customers and Value § for Customers and all
Stakeholders § Benefit / (Costs + Harm); § Value demand vs Failure
Demand (or Rework) People § Deming’s 94 /6 § Trust § Mo>va>on and ‘small wins’
§ The brain and thinking. Bias.
System § end-‐to-‐end value streams § holis>c, integrated, with
feedback Process efficiency
§ Flow efficiency not resource efficiency
§ Con>nuous improvement § The ‘big five’ opera>ons
concepts § Timing
Innova>on § S curves and the need for
breakthrough
Lean at Wits
343

Change…
Lean at Wits 344
“And let it be noted that there is no more delicate matter to take in hand, nor more dangerous to conduct, nor more doubtful in its success, than to set up as a leader in the introduction of changes. For he who innovates will have for his enemies all those who are well off under the existing order of things, and only the lukewarm supporters in those who might be better off under the new. This lukewarm temper arises partly from the fear of adversaries who have the laws on their side and partly from the incredulity of mankind, who will never admit the merit of anything new, until they have seen it proved by the event”. Niccolo Machiavelli

The Physics of (Lean) Change? “Physical laws apply everywhere, whether or not you choose to believe in them’ says astronomer
Neil deGasse Tyson. In 1918 Emmy Noether proved that the laws of physics are consequences of deep symmetries. ‘A
thing is symmetrical if there is something you can do to it so that, a}er you have finished doing it, it looks the same as before’ (Like some Lean ‘transformaHons’…)
Newton’s Laws First law: An object remains at rest or conHnues to move at constant velocity unless acted on by an
external force Second law: F = ma. The sum of forces on an object is equal to the mass of the object mulHplied by
the acceleraHon of the object. Third law: When one body exerts a force on a second body, the second body simultaneously exerts a force equal in magnitude and opposite in direcHon on the first body.
Third Law. For every acHon there is an equal and opposite reacHon
Thermodynamics The Second Law states that "in all energy exchanges, if no energy enters or leaves the system, the
potenHal energy of the state will always be less than that of the iniHal state." This is also commonly referred to as entropy.
Lean at Wits 345

Hawthorne Studies
‘…in other words, the mystery seemed to lie within the worker, rather than within the system. This impulse to blame – or credit – the individual person, rather than the system within whiich he or she works, although completely anHtheHcal to quality management principles, persists to this day.’ • Quoted in John Butman, ‘Juran: A lifeHme of Influence’, Wiley, 1997 – drawing on Elton Mayo.
Lean at Wits 346
Does this sound like Deming’s 94 / 6 Rule?

Drive out Fear
Lean at Wits 347

A Lean Leader’s First Duty
To culHvate a culture that is intolerant to Systemic Failure And reduces Process Ignorance. Problems are opportuniHes to be solved and not to be ignored.
Lean at Wits 348
From Steve Spear

Leadership Styles
Lean at Wits 349
From Liker and Hoseus, Toyota Culture, 1998, p334

Jack Smith…
Learning to Lead at Toyota..
Lean at Wits 350
Jack Smith: Parts A, B, C Harvard Business School Case Study

Leadership ‘moves’ for Lean
Number Leadership Moves
1 Leaders must be teachers
2 Build tension, not stress
3 Eliminate fear and comfort
4 Lead through visible parHcipaHon, not proclamaHon
5 Build lean into personal pracHce
Lean at Wits 351
From Flinchbaugh and Carlino, The Hitchhikers Guide to Lean, 2006, page 32

Three interacting concepts…
352
Kata Repetition
‘Small and varied Wins’
‘Yet’
Rituals e.g. church Frequency
and Severity
‘Filters’
Maths Army
recruits Students
Amygdala and Cortex
The Progress Principle
‘Pygmalion’ Effect
Myth of Genius
and Talent
Habit and Practice
‘Brainwash’ Nazis &
Jews Korea
prisoners
Lean at Wits

Three interacting concepts…
353
Kata Repetition
‘Small and
varied Wins’
Yet
Kaizen
PDSA
Respect
Leader Standard
Work
Idea Feedback
Feedback from others and
from work itself
Ongoing Mentoring
Genuine Listening
‘Zero Tolerance’ of
Defects, mess
Heijunka
Andon
A3: break into small chunks
Learning cycles: single and
double
Go see
Reflection Hansei
AARs
TWI Practice not Talent
Lean at Wits

Excellence and Habit
“We are what we repeatedly do. Excellence, then, is not an act, but a habit” • Aristotle
Lean at Wits 354

Three interacting concepts…
Lean at Wits 355
Kata Repetition
‘Small Wins’
Yet and Confirmation
Bias
Kaizen
PDSA
Respect
Leader Standard
Work
Idea Feedback
Feedback from others and
from work itself
Ongoing Mentoring
Genuine Listening
‘Zero Tolerance’ of
Defects, mess
Heijunka
Andon
A3: break into small chunks
Learning cycles: single and
double
Go see
Reflection Hansei
AARs
TWI Practice not Talent

Kaizen, Leader Standard Work, Kata, Repetition
David Mann Leader Standard Work Mike Rother Toyota Kata Steve Spear Chasing the Rabbit, Uncovering Deming PDSA Schwartz Sony: PracHcing Simple Rituals
» Daily walks, breaks, no e mails
Gladwell ‘10,000 hour rule’ for Mastery » ‘How do you get to Carnegie Hall?’ » List of 75 innovators and inventors » David Shenk, The Genius in All of Us’, Icon, 2010
Lean at Wits 356

More on..Kaizen, Kata, Repetition, Learning, Motivation
Colvin TWI
AAR Amabile
Koenigsaecker Duhigg
Talent is Overrated Do it again; ConHnue unHl you know they know Every Hme, not judgmental Small step, conHnuous feedback as moHvator MulHple Kaizens Habit
Lean at Wits 357

Lean at Wits 358

Lean at Wits 359

Dilbert knows about bias..
Lean at Wits 360

Avoiding Bias
You can’t do it yourself! It is intuiHve (or System One) thinking. AutomaHc. Unconscious. So, never self contradicted and hence is believed. Context dependent. (e.g. What does ‘walk to the bank’ mean to you?) System Two Thinking is slow, efforkul, deliberate. But you can check for System One bias with your people or teams. See the 12 tests in Daniel Kahneman, ‘Before You Make that Big Decision’, HBR, June 2011, pp51-‐60
Lean at Wits 361

Beware Halo Effect and Saliency Bias
Halo: Companies deemed ‘excellent’ are frequently circled by Halos. Once branded as excellent, people tend to assume that ALL their pracHces are exemplary. The same goes for ‘excellent’ leaders. A company’s success is frequently aPributed to a leader – and success will conHnue as long as that leader is in place. • See Phil Rosenzweig, ‘The Halo Effect’
Saliency Bias: A past successful case study is taken as evidence of or analogy for good pracHce. Of course, the circumstances likely to be different. • See Daniel Kahneman, ‘Fast or Slow’
Lean at Wits 362

David Mann on Culture and Lean Leadership
David Mann considers the culture of an organizaHon to be: “…the sum of peoples’ habits related to how they get their work done”. He defines the term as “…a concept we make up to organize and get a handle on what we have seen or experienced.” There are four elements:
1. Leader standard work – where a rouHne ‘checklist’ is developed to standardize a porHon of a team leader or supervisor’s day to ensure that essenHal elements of their job are performed.
2. Visual controls – to enable the leader to monitor performance at a glance by walking around the area. To visually manage their area through observing what is in control and what is out of control.
3. Daily accountability process – acHng upon performance as observed through the visual controls and ensuring correcHve measures are put in place for items idenHfied as being out of control.
4. Leadership discipline – ensuring standard work is adhered to, guaranteeing the integrity of the process is controlled and all other elements are sustained.
363 Lean at Wits

Daily Accountability Board
Lean at Wits 364

Creating and Sustaining Improvement: Example of System Dynamics
capability
Pressure to do Work
Time spent on improvement
Investment in capability
Work Harder
Desired Performance
Performance Gap
Pressure to improve
Work Smarter
Shortcuts
Actual performance Time spent
working
Reinvestment
delay
After Repenning and Sterman, ‘Nobody ever gets credit for fixing problems that never happened’, California Management Review, Summer 2001, pp 64 - 88 Lean at Wits 365

From Nelson Repenning and John Sterman, ‘Nobody Ever Gets Credit for Fixing Problems that Never Happened: Creating and Sustaining Process Improvement’ California Management Review Summer 2001
Lean at Wits 366

From Lake Region Manufacturing, Ireland Lean at Wits 367

Deming on Pay and Measures
“Reward for good performance may be the same as reward to the weatherman for a pleasant day” The New Economics, p 28
“A numerical goal accomplishes nothing. Only the method is important, not the goal. By what method? A numerical goal leads to distorHon and faking, especially when the system is not capable to meet the goal” The New Economics, p 31
“IncenHve pay and pay for performance, among others, are forces of destrucHon. These forces cause humiliaHon, fear, self-‐defence, compeHHon for gold star, high grade, high raHng on the job. They lead anyone to play to win, not for fun. They crush out joy in learning, on the job, in innovaHon. Extrinsic moHvaHon gradually replaces intrinsic moHvaHon, self esteem, dignity” The New Economics, p 121
Lean at Wits 368

Seddon’s view:
Lean at Wits 369
Conventional Thinking Better Thinking
Purpose
Measures
Method
Begin here: Think Purpose from the customer’s view
Derive measures
Creates de facto purpose
Liberates
Begin here: Impose targets And standards
Constrains method
From John Seddon, The Whitehall Effect, Triachy Press, 2015

Motivation Flowchart
370
Is the task mostly
routine?
1. Offer a rationale for
why the task is
necessary
Can you increase the task’s challenge or variety, make it
less routine, or connect it to a larger
purpose?
Concentrate on building a healthy, long-term motivational environment that pays
people fairly and fosters autonomy, mastery and purpose. Avoid ‘if then’ rewards in almost all circumstances.
Consider unexpected, noncontingent ‘now that’ rewards. And those rewards will be
more effective if:
Yes, I can
That’s pretty hard
Use rewards, even ‘if then’
rewards, but be sure to:
2. Acknowledge that the task is
boring
3. Allow people to complete the task in their own
way
2. They provide useful information,
rather than an attempt to control
1. They offer praise and
feedback rather than things
people can touch or spend
Yes
No
From: Daniel H Pink, Drive, Canongate 2009
Lean at Wits

Deming’s Profound Knowledge (or, Why Things Go Wrong!)
System • HolisHc, opHmizing a part does not…, feedback • relaHonships between the parts are crucial
VariaHon • Is a fact of life; snapshots are not valid observaHons • Common or special causes
Theory of Knowledge • ‘without theory knowledge has no meaning’ • Do PDCA against a hypothesis; otherwise can’t learn • Be interested in failures that disprove – more valuable than success stories
Psychology • Only intrinsic moHvaHon moHvates in the long term • Extrinsic moHvators undermine in the long term • Management must create the condiHons for intrinsic moHvaHon – a gemba style helps
with this.
Lean at Wits 371

X: Cross Functional Working
EssenHal to Lean, but a problem of experHse Socio-‐Technical Working…..
Lean at Wits 372

Lean at Wits 373

Measures
Lean at Wits 374

Targets and Measures
Lean at Wits 375

Process and Person Measures
Lean at Wits 376

Measures should… Provide short-‐term indicators of problems and no-‐problems Be part of a feedback loop of surfacing and resolving problems Focus on improving performance Be capable of being acted upon. Relate to learning or capability of the process or people
Lean at Wits 377

The Power of Measurement ‘What gets rewarded gets done’ Michael LeBoeuf’s ‘GMP’ But ‘You get what you measure’ -‐ more fundamental? ‘Most individuals and organizaHons don’t get what they want because they don’t measure what they really want’. Examples…..
(see Michael Blastland and Andrew Dilnot, The Tiger that Isn’t, Profile, 2007 and Dean Spitzer, Transforming Performance Measurement, AmaCom, 2007)
Lean at Wits 378

Two types of Mesures
1. InformaHonal measurement -‐ used for informaHonal purposes
2. MoHvaHonal measurement -‐ used for rewards and punishment
The first can be a powerful aid; the second almost invariably negaHve.
Lean at Wits
Adapted from Dean Spitzer, Transforming Performance Measurement, AmaCom, 2007
379

Two other types of Measures
ObjecHve -‐ fact based; can be observed and verified SubjecHve -‐ a maPer of opinion or judgement, and an opportunity for revenge, prejudice, fear, etc.
It is the second that gives big problems. Looking good as opposed to being good. Who is measuring whom? (Witgenstein’s ruler) Measurement should be a non-‐judgemental process of collecHng, analysing, and most
importantly understanding what is being measured.
Lean at Wits
Adapted from Dean Spitzer, Transforming Performance Measurement, AmaCom, 2007
380

Dysfunctional Measurement
CheaHng (see for example LeviP in Freakonomics, 2006) Measuring too much -‐ and ignoring most of the signals -‐ a complete waste or delusion
Driving behaviour that favors the individual but is dysfuncHonal to the organizaHon.
Whether measurement dysfuncHons occur has less to do with the number and more to do with how people respond to the measure.
Almost everyone has experienced negaHve measurement used to expose negaHve
things -‐ errors, cost overruns etc -‐ and trigger negaHve emoHons -‐ fear, threat, blame, defensiveness
Lean at Wits
Adapted from Dean Spitzer, Transforming Performance Measurement, AmaCom, 2007
381

Four Keys to Transformational Measurement
Context • Everything that surrounds the measurement -‐ social, psychological -‐ effecHve
measurement can only occur in a posiHve context. Process not person.
Focus • Measure the right thing, don’t measure too much, the vital few
IntegraHon • A framework, balanced, aligned, adapHve
InteracHvity • About ongoing measures, acted upon in real Hme, using feedback loops. ‘A social
process, not a technical process’.
Lean at Wits
Adapted from Dean Spitzer, Transforming Performance Measurement, AmaCom, 2007
382

‘Four Steps to Redemption’
1. Select the right things to measure n End to end processes, not verHcal silos n Determine the ‘drivers of enterprise’. (e.g having the right stock available when needed.)
2. Measure these right things in the right way n Value and Failure Demand (e.g call compleHon rates.) n Precision, Accuracy, Overhead, Reliability, Validity, Robustness n MulHple measures (OEE and schedule aPainment)
3. Embed the metrics in a disciplined process for improvement, not blame n Ways in which the measures will be acted on: who, visual progress n Problems with process design; problems with execuHon. These need different responses;
which of these is the cause? (Deming 94/6 rule) 4. Create an organizaHonal value system that uses the measures for ongoing
performance measurement n Role modeling, rewards, implementaHon, arHculaHon, commitment
Lean at Wits
From: Michael Hammer, ‘The 7 Deadly Sins’, MIT Sloan Management Review Spring 2007
383

Problem
P sells for £ 90; demand is 100 units / week Q sells for £100; demand is 50 units / week There are four resources -‐ A, B, C, D, each with the same fixed cost. Work Hme is 40 hrs per week (2400 mins) Total fixed costs (labour and rent) is £6000 / week
Lean at Wits 384

We have a simple BOM and Routing
Lean at Wits
P Q
D 15 min
Purchase Part
£5/unit D
5 min
C 10 min
C 5 min
B 15 min
A 15 min
B 15 min
A 10 min
RM1 £20/u
RM2 £20/u
RM3 £20/u
385

Contribution
P: £90 -‐ £ 40 -‐ £5 = £45 / unit Q: £100 -‐ £40 = £60 / unit
Make Q !
Lean at Wits 386

Extensions
By purchasing tooling for £2000 we can increase the load on C (central) from 5 to 7 minutes, which reduces the load on B (central) from 15 to 14 minutes Should we go with this?
Lean at Wits 387

Extensions (2)
ConvenHonal CosHng: The total Hme to make a Q has increased! -‐ so No!
“Lean AccounHng” Looking at the LP, C is irrelevant; but any improvement in B will go directly to the boPom line. A saving of 130 units x 1 min = 130 min. Means 130/30=4 units @ £60 = £240 for an outlay of £2000 -‐ an 8 week payback!
Lean at Wits 388

Problem 2: Before and After..
Lean at Wits
Adapted from Brian Maskell
CNC Machine
Inspect & Pack
Drill
Grind
Inspect & Pack
Grind
Drill Turn on Lathe
U Batch of 3000
One piece flow
1 minute
4 minute
6 minute
4 minute
4 minute
6 minute
4 minute
4 minute
Labour time = 15 mins Labour Cost = £5 Overhead = £5 x 3 = £15 Material = £2 Total £22
Lead time = 6 weeks Inventory 25 days Batch size = 3000 On-time deliv = 82%
Labour time = 18 mins Labour Cost = £6 Overhead = £6 x 3 = £18 Material = £2 Total £26
Lead time = 2 days Inventory = 2 days Batch = 300 (1 day) On time deliv = 99%
389

Accounting for Lean and the New Kitchen
In 2007 we had a new kitchen installed, a}er a flood. The costs, of course, must be apporHoned between all future meals. It is now too expensive to eat at home. So cooking must be outsourced…..
Lean at Wits 390

Basic Measures
Customer Service or saHsfacHon Lead Time Schedule Adherance Inventory Turns (WIP to SWIP)
Lean at Wits 391

QCDMMS
Lean at Wits 392

Cell Measures (by day)
Day by the hour Schedule aPainment • And deviaHon reasons
First Time Through • ROTIF aPainment • (Start -‐ (Scrap + Rework)) at each workstaHon mulHplied
WIP to SWIP • Actual vs. Standard work in process audited daily
OEE • On selected machines • For the cell as a whole?
Lean at Wits From Maskell & Baggaley Practical Lean Accounting 393

Value Stream Measures (by week)
Sales per Person On-‐Hme Shipment
• Orders in full shipped against customer requirements
Dock-‐to-‐dock Time • (RM+WIP+FGI) / (products shipped / hours in week) • Can use representaHve components e.g. unit containers
First Hme through • (Start -‐ (Scrap + Rework)) at each workstaHon mulHplied
Average cost per unit • See next page
Accounts receivable days outstanding
Lean at Wits From Maskell & Baggaley Practical Lean Accounting 394

Features of Hoshin 3 Levels of review (tasks, strategies, system) Use real feedback on last periods’ actual planning process, and deployment. Avoid blame (“It is my fault that you are doing the wrong job” -‐ system not person) (No blame does NOT mean no-‐one gets fired)
Ask if the work that is being done right now is the right thing to do Modifying the objecHves part way through if necessary If 30% of the projects are late, you need to know why. If 0% are late, you also need to know why
Real research is required -‐ that is why you cannot have more than a few suppliers involved, a more than a few Hoshins. Hoshin focuses on breakthrough.
Lean at Wits 395

What do you need to do to win an Olympic Medal?
__________________ __________________ __________________ __________________ __________________
Lean at Wits 396

Policy Deployment Exercise Pick an achievement that you or your (sport?) team are aiming at Using the matrix, work through the
• Aims • Projects • Delivery • Results
Establish the relaHonships between the elements IdenHfy responsibiliHes
Lean at Wits 397

Hoshin Cascade
Lean at Wits
Middle Management
Horizontal Deployment And Understanding
Senior Management Create Policy
Implementation Level Devise Implementation Plans
deploy
goals
means
deploy
actions
means
review
review
398

Unipart Policy Deployment
Lean at Wits
aims
projects
results
delivery
What are the policy
Objectives? Why is success
Important?
What are the Project
Deliverables? What are the
SMART KPI’s
What projects are the team Expected to complete so as
To achieve the aims?
Market, operational and Financial Benefits expected by period end
To what extent Do the projects
Contribute to the aims?
To what extent Do the results
Contribute to the aims? To what extent
Does each deliverable Contribute to the results
What will each project Deliver?
To what extent?
399

Deployment
Lean at Wits 400

Hoshin and A3
Lean at Wits
Purpose
Current and 5 whys
Future state
implement
Purpose
Current and 5 whys
Future state
implement
Purpose
Current and 5 whys
Future state
implement
Purpose
Current and 5 whys
Future state
implement
Purpose
Current and 5 whys
Future state
implement
401


Ford 1: From Jan Krafkik in Womack ‘Gemba Walks’ 2nd ed
Ford’s system, all three producHon lines were converted to a steady pace, powered by moving chains. The plant employed go/no-‐go gauges to catch defecHve parts at the source and assure complete interchangeability, cellularized parts fabricaHon with operaHons located in process sequence, a crude pull system for managing the movement of parts toward their point of use on the line, and standardized work at a steady pace. All in a new building designed with con,nuous flow as its central objec,ve. Most of the individual elements had been previously tried in some form: it was their combinaHon in a complete system that produced Highland Park’s remarkable leap in producHvity and velocity. These events of 1914 deserve to be celebrated for their transformaHon of world industrial pracHce. And I hope someone at Ford will seize the opportunity on the occasion of the centennial. The Lean Community should celebrate too, because what happened at Highland Park was foundaHonal for lean thinking. Henry Ford and his associates were the first truly systemaHc lean thinkers, with a passion for dramaHcally increasing value while eliminaHng waste through careful process analysis from raw materials to finished product. Much of what Toyota achieved later was built on Ford’s shoulders, as Taiichi Ohno at Toyota freely acknowledged. Because of its enormous achievements, for a long Hme Highland Park existed in my mind’s eye as Ford’s stately Temple of Flow. This bubble was rudely popped a few years ago when I took a Gemba walk and found a sadly dilapidated and largely empty structure. Since my visit I have asked myself: What happened a}er the great breakthrough of 1914? What can we learn from what happened? And what might happen next at Highland Park. As Ford’s plant was reaching its zenith in the 1920s, Henry was racing to complete his new complex – the Rouge – on the southwest edge of Detroit. While Highland Park was dedicated to a single vehicle, with the idea of maximizing the velocity of product flow from start to finish, the Rouge complex was dedicated to scale. Parts for many types of vehicles, to be assembled all over the world, were cranked out -‐-‐ not in process villages within one plant but in process factories on the massive site. The buildings needed for each category of item – engines, transmissions, bodies, various types of parts – and more massive buildings for transformaHons of materials– steel mills, foundries, forges – were connected by conveyors under central control. This seemed impressive to visitors, but in pracHce large buffers of parts were needed at many points to insure steady producHon. While Ford could claim that the plant started with iron ore on day one and produced a finished vehicle 2.5 days later, this was simply the sum of the Hme needed for the value creaHng steps. Actual start-‐to-‐finish Hme, including waits in buffers, was many Hmes longer and for the vehicles assembled elsewhere – up to 90%
Lean at Wits 403

Ford 2: From Jan Krafkik in Womack ‘Gemba Walks’ 2nd ed
But the Rouge was a compelling idea in an age of industrial concentraHon and scale economies. If a lot was good, then even more was bePer, and the Rouge was the most anyone could imagine. When the new facility completed in 1927 in Hme for the Model A, Ford also offered a new name – “mass producHon”—to tout his achievement. The term “flow producHon” that Ford had coined earlier to describe Highland Park quickly disappeared from use.
(It bears men>on that Ford’s concept of “mass produc>on” at the Rouge was where Toyota started its thinking about lean produc>on and was the concept our MIT automo>ve team set out with in our global survey of manufacturing performance. In the 1980s we were simply unaware of the significance of the system created earlier at Highland Park.)
Once the Rouge was in place, Highland Park became an anachronism. Too small for the body shop needed for stamped steel vehicles, seemingly too ramped with its machines crowded Hghtly together to minimize movement, too focused on a single product. Highland Park simply didn’t scale in an age of scale. So, when Model T producHon came to an end in 1926, Ford converted Highland Park to high-‐volume producHon of certain categories of parts (for shipment to assembly plants around the world) and to low-‐volume assembly of a few vehicles such as delivery trucks for the Post Office.
Over Hme, as Ford’s original objecHve of auto ownership for everyone became widespread, workers could drive to new plants far away from the high land costs of the city. Cheap land on the city’s edge made it possible to spread out producHon on one level, making Highland Park look too verHcal, with its five floors and gravity slides that moved parts from fabricaHon in the top of the building to final assembly at the boPom. In just a few years Highland Park had become the picture of the old-‐fashioned factory.
A}er 1930, producHon declined slowly at Highland Park, and with it the populaHon of the Hny (3 square miles) city surrounding the plant, which had grown from 4,000 in 1910 just as the plant opened to a peak of 53,000 in 1930. Decline was checked for a while by the presence of Chrysler’s corporate headquarters and engineering center a few blocks away, but Highland Park’s descent accelerated a}er the boom years of World War II when all capacity of any type was needed. By 1973 Ford disconHnued manufacturing at Highland Park and in 1974 the property was sold to a developer who tore down a few of the buildings to create a shopping mall (which also failed.) A}er Chrysler le} for the northern suburbs in 1993, to be close to the homes of its managers and engineers, the trend gathered speed and by 2012 Highland Park had a fi}h of the populaHon (11,000) of the peak.
Lean at Wits 404

Ford 3: From Jan Krafkik in Womack ‘Gemba Walks’ 2nd ed
Today the buildings on the site are mostly empty except for some document storage for Ford and a garment warehouse. In 2011 the City of Highland Park removed two thirds of its street lamps due to inability to pay the electric bill. Forty percent of the remaining populaHon is living below the poverty level. In 100 years the Temple of Flow transiHoned from the most dynamic industrial site in the world in a rapidly expanding city, to an abandoned industrial relic in one of the poorest and most dangerous places in America. Is there any way out of this smoking crater? I think there is, and for reasons that go far beyond any consideraHons of urban redevelopment. In recent decades the car industry has progressed from a collecHon of naHonal industries to a completely globalized acHvity with a few massive companies selling the same products in many markets. As product technology has converged on stamped steel bodies and every manufacturer strives to sell in every market, the scale requirements for each vehicle “plakorm” (on which a number of body styles are o}en based) have risen to a million – or even two million – vehicles per year. In this situaHon, massive assembly plants -‐-‐ with 250,000 to 500,000 units of capacity -‐-‐ make imminent sense. A facility with the scale of Highland Park has no place. However, the massive scale requirements of this strategy leave many white spaces in the market where smaller numbers of buyers may want vehicles with very different capabiliHes. These vehicles can’t be produced on the five or six standard plakorms of every car maker. AlternaHve power vehicles, high-‐end sports cars, specialty trucks, and city cars are examples. The common characterisHc of these vehicles is that they are suited for extruded aluminum or fiber-‐composite body structures with plasHc surface panels, which are cost effecHve at scales of up to about 50,000 units per year. A recently announced example is the BMW i3, an all-‐electric vehicle with a fiber composite tub for the passenger compartment, extruded aluminum structures at both ends for the engine and the storage compartment, and a snap-‐on plasHc skin. BMW plans to build it in a Hny, dedicated factory in Munich near the delivery center it has created for customers to receive its top-‐of-‐the line vehicles. (By contrast Tesla and Fysker opted for new moHve power vehicles but with convenHonal metal bodies and chose to build them in abandoned tradiHonal car plants: NUMMI in Fremont, California, in the case of Tesla, and GM’s Wilmington, Delaware, light truck plant for Fysker’s aborHve effort to develop a second, high-‐volume vehicle. With luck, Tesla might generate enough volume to jusHfy a high-‐scale plant. A bePer approach for those who follow is to use a new technology body as well, and target lower volumes, building addiHonal modules of producHon if necessary.) Looking at Highland Park in this new situaHon, one can see a double opportunity: A producer could use the exisHng building to fabricate major components on the upper floors and drop them to final assembly on the ground floor, at a modest investment compared with current car industry norms. The building is already there and the state and federal governments would doubtless help with the
Lean at Wits 405

Innovation, Design and NPD Overlaps
John Bicheno 2015 406
Innovation
Design Process
Cost Reduction
New Product Introduction
‘Design Thinking’
‘Lean Startup’

Innovation…
John Bicheno 2015 407
Innovation
“Adjacent Possible”
Disruptive Technology
TRIZ
…and many others
‘Adjacent Possible’ is discussed at length in Steven Johnson, Where Good Ideas Come From, Penguin, 2010
Creativity: • Insight • Improvisation • Divergent Thinking

Design Process…
John Bicheno 2015 408
Design Process
Reinertsen and Kingman
Concurrent and
Simultaneous Engineering
‘LAMDA’
Risk
‘The Innovators Method’ ‘Set Based’
And Cadence (Toyota)
Tradeoffs: Product Price, Product Cost,
Production Cost, Time to Market
Design for Manufacture
(DFM) Learning Cycles
And Rapid Prototyping

Design Cost Reduction..
John Bicheno 2015 409
Cost Reduction
Value Engineering
Group Technology
Target Costing
“Variety Effectiveness Process”
Market Analysis Product Analysis
Part Analysis
Design Wastes
Variety Analysis Tools (VAT) (Galsworth)
From Gwendolyn Galsworth, Smart Simple Design Reloaded, Visual Lean Enterprise Press, 2015
Contribution analysis And
Contribution / b-neck minute

Design Thinking..
John Bicheno 2015 410
‘Design Thinking’
IDEO
Service Design
Systems Thinking
Vanguard?
Lean Consumption ‘Good Product /
Bad Product’ (Adams)
‘Double Diamond’
(Exploration and Exploitation)

New Product Introduction..
John Bicheno 2015 411
New Product Introduction
3P
Experimentation
Ramp Up: One feature at a time; Phase in transition
Supplier Partnership

Lean Startup
John Bicheno 2015 412
‘Lean Startup’
Agile Software
SCRUM
Lean Customer
Development
Kanban for
Software

Innovation: Recent Articles in HBR
‘Build an InnovaHon Engine in 90 days’, HBR, Dec 2014, p60 ‘The Discipline of Business ExperimentaHon’, Dec 2014, p70 (Useful for dissertaHons!) ‘Leading your team into the unknown’, HBR, Dec 2014. p80 (This is a summary of the book ‘The Innovator’s Method) ‘How I did it…Intuit’s CEO on Building a Design-‐Driven company’, Jan 2015, p35
John Bicheno 2015 413

John Bicheno 2015 414

Creativity Insight
• The goat problem • Right and le} brain • What do pine, crab, source have in common? • No such thing as a single sudden flash; rather brain working in
background Improvising
• The brick test: how many uses of a brick? (Gilford and USAF during WW2). Points 1 to 5 for creaHve uses
• IQ and creaHvity Divergent Thinking
• Jazz • Switch one of the steps (like puung marmalade then rubbing the
toast) • RouHne, easy, non-‐thinking tasks ; relax and do something different
John Bicheno 2015 415
Move one stick to make a different goat

Creativity…and Kata
Kata: reinforcing and building pathways and habits • ‘The more you do something, the more likely you are to do it again’ (Gilbert)
CreaHvity: breaking pathways and habits • Seeing things differently; establishing new pathways
System 1 and System 2 ?
John Bicheno 2015 416