Embed Size (px)
Citation preview
WITNESS STATEMENT
OF
IAN CROSS
OMB FILE NO: PL100206
__________________________
Ian Cross, MCIP, RPP
Program Manager, Research and Forecasting
Policy Development and Urban Design Branch
Planning and Growth Management Department
City of Ottawa
December 3, 2010
2 Witness Statement of Ian Cross - 3 Dec 2010
WITNESS STATEMENT OF IAN CROSS, RPP, MCIP
A. INTRODUCTION
Present Position
I am currently employed as the Program Manager, Research and Forecasting Unit in the
policy development and urban design division of the Planning and Growth Management
Department of the City of Ottawa. This unit is responsible for undertaking data collection,
analysis and forecasts of changes in population, housing, land use and employment in the
city of Ottawa and sub-areas thereof. These results are widely used in policy development
and other planning work throughout the municipal corporation as well as by other agencies
and the private sector.
Experience
I have 30 years of planning experience and have specialized in projections of population,
housing, employment and land use for the former Regional Municipality of Ottawa-
Carleton and the new City of Ottawa since 1985. I have also been extensively involved
with planning policy issues over the same period, in particular issues related to the
management of urban growth. I have held my present position with the City of Ottawa
since September 2001. My résumé is attached as Appendix A to this witness statement.
I have appeared before the Board on several occasions and have been qualified as an expert
witness with a specialization in growth projections and planning research.
Scope of Witness Statement
This statement provides the projections and planning research context for the appeals, it
identifies the issues that this witness statement addresses, it describes the process and
analysis leading up to the identification of urban land requirements and related
intensification and density targets, and it provides a planning opinion on the issues.
A list of documents which may be referred to in my evidence is included as Appendix B.
Where documents are referred to my witness statement they are included in the Book of
Documents.

3 Witness Statement of Ian Cross - 3 Dec 2010
B. ISSUES LIST
The following issues are addressed by this witness statement:
3. Did the City use appropriate population and housing growth projections for the urban
residential land needs analysis? If not, what are the appropriate projections?
4. Were the assumptions used by the City regarding the contribution of net international
migration to projected population growth reasonable and defensible, based on available
research and empirical data?
5. Were the assumptions used by the City regarding the dwelling type propensities of
residents over the projection period reasonable and defensible, based on available
research and empirical data?
6. Are the proposed housing mix and minimum density provisions within OPA 76 for
residential development within the urban boundary appropriate and reasonable to
accommodate the projected growth?
7. Are the proposed intensification and density targets within OPA 76 appropriate and
consistent with the 2005 Provincial Policy Statement?
8. Is the proposed requirement in Policy 3E in Section 2.2.1 that ―an urban expansion will
only be considered if the intensification target of this plan has been met‖ consistent with
the 2005 Provincial Policy Statement, in conformity with other policies in the City of
Ottawa Official Plan, and does it represent good planning?
9. In determining the amount of land that should be added to the urban boundary, has OPA
76 taken full account of available vacant land within the urban boundary?
10. Is the decision to add 230 hectares of land to the City’s urban boundary consistent with
the 2005 Provincial Policy Statement, in conformity with the City’s Official Plan, and
does it represent good planning?
11. Does OPA 76 add sufficient land within the City of Ottawa’s Urban Area to meet
projected residential/housing needs for the City and, if not, how much land should be
added to the Urban Area to meet projected residential/housing needs?
4 Witness Statement of Ian Cross - 3 Dec 2010
C. PLANNING CONTEXT
This section provides an overview of planning history and research in Ottawa.
The Ottawa area has a long history of regional-scale planning, dating back as far as 1915
with the publication of the federally-commissioned Holt Report. The 1950 Gréber Plan
was a landmark report and led to the creation of the federal Greenbelt, which has been a
defining feature of the city’s urban structure ever since. The Gréber Plan had a 50-year
planning horizon.
The Regional Municipality of Ottawa-Carleton (RMOC) was created in 1968 and the first
Regional Official Plan (ROP) was adopted by Regional Council in 1974. The 1974 ROP
was based on the region reaching a threshold population of one million, which it was
estimated to reach as early as 1998 or as late as 2015, with a median of 2006. The planning
period therefore ranged from 24 to 41 years, with a mean of 32 years, depending when the
million threshold was reached. The Plan projected urban land requirements over the
planning period and it conceptually identified Principle Urban Areas. The urban area
designation in the ROP was to be implemented through local official plans and zoning by-
laws.
The Urban Area was clearly designated on Schedule A of the subsequent 1988 Regional
Official Plan. Changes to the boundary of the Urban Area required an Official Plan
amendment. The 1988 Plan extended to 2011, a planning horizon of 23 years. It provided
more urban land than was required over the planning period, originally estimated as a five
year surplus. After the addition of a large urban expansion in the east end of the Region
(the Orleans Expansion Area, OPA 1), the estimated surplus rose to 15 years.
The 1997 Regional Official Plan, replacing the 1988 Plan, further strengthened urban
boundary policies and emphasized a growth strategy involving residential intensification.
Its planning horizon was 2021, a planning period of 24 years. It also recognized there was
a surplus of urban land, and addressed this by designating some land for a later phase of
development (the South Urban Centre Future Development designation applied to an area
of almost 1,000 hectares of urban land south of the Greenbelt).
5 Witness Statement of Ian Cross - 3 Dec 2010
The amalgamated City of Ottawa, created from the RMOC and the 11 local municipalities
within it, came into being on January 1, 2001. The first Official Plan for the new city was
by Council adopted in 2003. It also planned to 2021, an 18-year planning period. It further
emphasized the concept of a firm urban boundary and promoted higher suburban densities
and urban intensification.
The most recent Official Plan review was completed in 2009 and resulted in Amendment
76. One of its purposes was to ensure the OP conformed with the 2005 Provincial Policy
Statement (PPS). It also introduced new growth projections for 2031, and added
approximately 254 hectares (230 developable hectares) of land to the urban area. OPA 76
provides for approximately 18 years of land supply for single and semi-detached housing,
and a longer supply for employment and medium and high density housing. OPA 76 is
now before the Board.
It can be seen that over the past 35 years that the planning time frame in OP’s has been
shrinking. From a planning horizon of more than 30 years in 1974, it dropped to 23 and 24
years in 1988 and 1997, to 18 years in the 2003 OP and now 18 years (for lower density
residential) under OPA 76. This largely reflects changes to the Planning Act and Provincial
Policy Statement. Because municipalities are now required to update their plans every five
years, a tighter planning cycle allows official plans to plan for shorter time periods.
Planning Research in Ottawa
Coupled with Ottawa’s planning legacy is a history of planning research activity. The City
(and former Region) has invested considerable time and effort to consistently maintain
detailed monitoring of land use and development activity. This is undertaken through the
following surveys and reports:
1. Land Use Survey. One has been done every five years since 1975. The most recent
survey was in 2010.
2. Employment Survey. The first comprehensive survey was in 1976, and every five
years since then. The most recent survey was in 2006.
3. Vacant Urban Residential Land Survey (VURLS). This has been undertaken annually
since 1982. This provides a wide range of detailed information, including:
6 Witness Statement of Ian Cross - 3 Dec 2010
A parcel-level inventory of residential land supply by approval status, number
and type of units, ownership, and planned density.
Annual residential land consumption in net hectares and built densities by
dwelling type.
Analysis of whether the residential land supply meets the requirements of
Policy 1.4.1a of the PPS regarding the provision of a 10-year supply of land for
housing. The land supply has always met the PPS requirement.
Analysis of whether the approved and serviced land supply meets the
requirements of Policy 1.4.1b of the PPS regarding the provision of a 3-year
supply of residential land. The approved and serviced supply has always met
the PPS requirement.
Because the survey only includes vacant parcels 0.8 hectares and larger, VURLS
primarily monitors suburban residential land. It is not intended to monitor the supply
of intensification sites, although a few are included because they meet the criteria for
inclusion (they are vacant, planned for residential use and at least 0.8 ha). The most
recent survey is for 2009.
4. Inventory of Vacant Industrial and Business Park Lands. This has been undertaken
biannually since 1984. It provides similar data for employment land as VURLS does
for residential land. The most recent is for 2007-08.
5. Rural Residential Land Survey. It commenced in 2004 and provides an inventory of
residential land supply and consumption in the rural area of Ottawa biannually,
including villages. The most recent survey reported data for 2007 and 2008.
6. Annual Development Report. It monitors a wide range of indicators, including
population growth both within and adjacent to Ottawa, migration to and from Ottawa,
employment and the economy, residential and non-residential building activity,
housing affordability, and residential intensification activity. It has been undertaken
annually since 2002.
Increasing computerization, and in particular the widespread use of Geographic
Information Systems (GIS) in the last decade, has significantly increased the spatial
7 Witness Statement of Ian Cross - 3 Dec 2010
accuracy of the above-noted research. It has also facilitated the integrated analysis of data
from different sources to inform planning policy and research work.
In addition to City-initiated research, staff also monitor a series of outside research reports
including those by Canada Mortgage and Housing Corporation (CMHC) on housing starts
and completions, rental vacancy rates and other housing-related topics, Statistics Canada
data and research on a wide range of demographic and economic subjects, the Conference
Board of Canada’s Metropolitan Outlook service, new home sales reports by local research
firms, and other sources of information relevant to current and future trends potentially
affecting the planning of the city.
Much of the above information is used in developing projections of growth in population,
housing, and employment and their associated land requirements.
D. POPULATION PROJECTIONS
Projections have been done by staff since the early 1970’s. The only exception was the
projection done in 2001, which was carried out by consultants. The first projections using a
more sophisticated ―cohort survival‖ methodology were incorporated into the 1988
Official Plan. Since that time (with the exception of the 2001 consultant projection) staff
projections have had good record of accuracy. I was responsible for the projections
completed in 1990, 1995 and 2007. The track record of projections since 1988 is
summarized below.
1988 Projection
The original 1988 ROP projection, based on the 1981 Census, failed to anticipate the rapid
growth of the region in the late 1980’s and was replaced two years later.
Table 1. 1988 population projection, based on 1981 Census
Year Census 1988 Projection % difference pop.
difference
1986 606,639 596,000 -1.8% -10,639
1991 678,147 643,000 -5.2% -35,147
1996 721,135 685,300 -5.0% -35,835
2001 774,072 725,000 -6.3% -49,072
2006 812,135 759,000 -6.5% -53,135
8 Witness Statement of Ian Cross - 3 Dec 2010
1990 Projection
The projection developed in 1990 was incorporated into the 1988 ROP by Amendment 22,
adopted by Council in January 1991. It was approved by the Ministry without appeal. For
the years 1996 and 2001 the projection almost perfectly matched the census. By 2006, 20
years after the 1986 base year, the projection was several thousand higher than the census.
Table 2. 1990 population projection, based on 1986 Census
Year Census 1990 Projection % difference pop.
difference
1991 678,147 664,612 -2.0% -13,535
1996 721,135 721,056 0.0% -79
2001 774,072 773,828 0.0% -244
2006 812,135 823,000 1.3% 10,865
1995 Projection
The projection developed in 1995 was adopted as part of the 1997 ROP and approved by
the Ministry without appeal. It used a more detailed model that, unlike the previous model,
provided results by single year of age and sex. For the years 1996 and 2001 the projection
tracked several thousand above the census counts. By 2006, the projection was exceeding
the census by an increasing margin.
Table 3. 1995 population projection, based on 1991 Census
Year Census 1995 Projection % difference pop.
difference
1996 721,135 736,351 2.1% 15,216
2001 774,072 790,213 2.1% 16,141
2006 812,135 847,958 4.4% 35,823
2001 Projection
The 2001 projection developed by the Centre for Spatial Economics was prepared during
Ottawa’s boom in advanced technology employment. It used an economic-based ―Business
Investment‖ model which was especially sensitive to the then-current investment boom in
new construction It was the first projection to be based on the concept of ―post-censal‖
population, which is the census population adjusted for under-counting. In Ottawa, the
post-censal estimate has been about four per cent higher than the census count. The
9 Witness Statement of Ian Cross - 3 Dec 2010
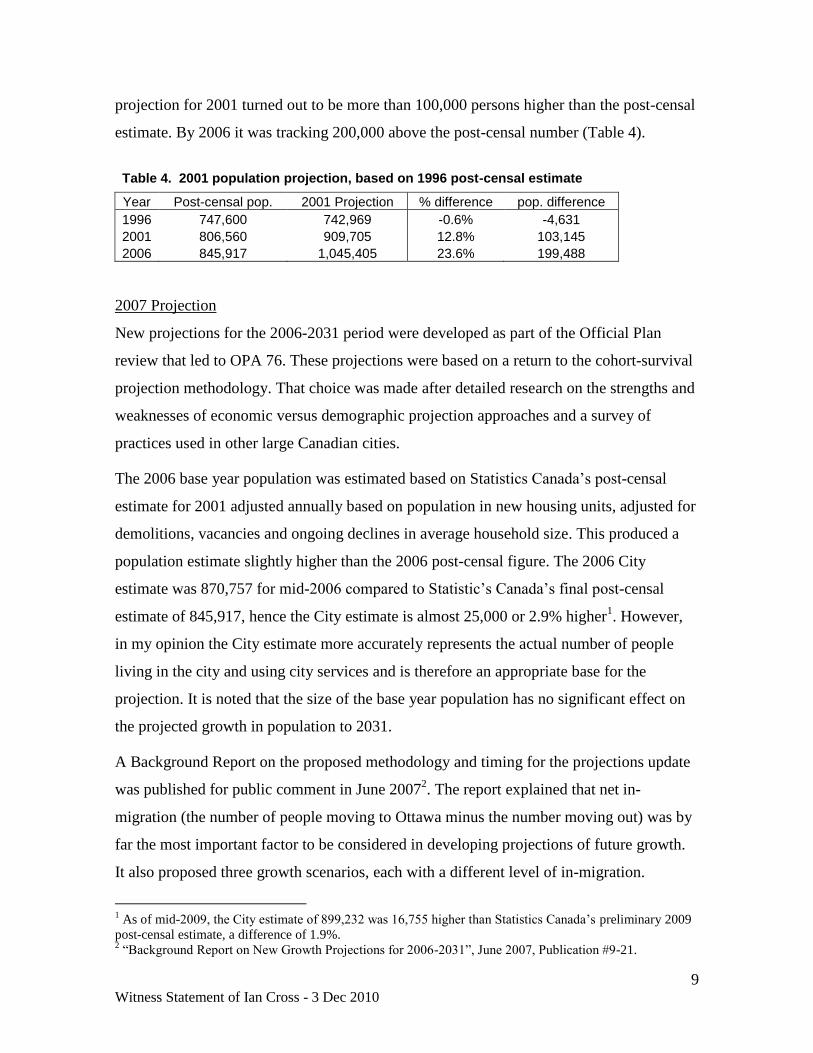
projection for 2001 turned out to be more than 100,000 persons higher than the post-censal
estimate. By 2006 it was tracking 200,000 above the post-censal number (Table 4).
Table 4. 2001 population projection, based on 1996 post-censal estimate
Year Post-censal pop. 2001 Projection % difference pop. difference
1996 747,600 742,969 -0.6% -4,631
2001 806,560 909,705 12.8% 103,145
2006 845,917 1,045,405 23.6% 199,488
2007 Projection
New projections for the 2006-2031 period were developed as part of the Official Plan
review that led to OPA 76. These projections were based on a return to the cohort-survival
projection methodology. That choice was made after detailed research on the strengths and
weaknesses of economic versus demographic projection approaches and a survey of
practices used in other large Canadian cities.
The 2006 base year population was estimated based on Statistics Canada’s post-censal
estimate for 2001 adjusted annually based on population in new housing units, adjusted for
demolitions, vacancies and ongoing declines in average household size. This produced a
population estimate slightly higher than the 2006 post-censal figure. The 2006 City
estimate was 870,757 for mid-2006 compared to Statistic’s Canada’s final post-censal
estimate of 845,917, hence the City estimate is almost 25,000 or 2.9% higher1. However,
in my opinion the City estimate more accurately represents the actual number of people
living in the city and using city services and is therefore an appropriate base for the
projection. It is noted that the size of the base year population has no significant effect on
the projected growth in population to 2031.
A Background Report on the proposed methodology and timing for the projections update
was published for public comment in June 20072. The report explained that net in-
migration (the number of people moving to Ottawa minus the number moving out) was by
far the most important factor to be considered in developing projections of future growth.
It also proposed three growth scenarios, each with a different level of in-migration.
1 As of mid-2009, the City estimate of 899,232 was 16,755 higher than Statistics Canada’s preliminary 2009
post-censal estimate, a difference of 1.9%. 2 ―Background Report on New Growth Projections for 2006-2031‖, June 2007, Publication #9-21.
10 Witness Statement of Ian Cross - 3 Dec 2010
Migration patterns were analysed for the previous 25 years (1980-2005) using data from
Statistics Canada3. The first scenario proposed that net in-migration be based on Ottawa
attracting the same share of immigration to Canada that it had since 1992. Future
immigration was based on Statistics Canada 2005 population projection for Canada.
Scenarios 2 and 3 were based on Ottawa attracting a gradually increasing share of
immigration. The migration assumptions did not attempt to account for emigration. The
same migration assumptions were applied in the draft and final projection reports.
Following receipt of detailed age-sex data from the 2006 Census, preliminary projections
were published for consultation in September 2007. That presented three growth scenarios
for discussion; Low, Reference (proposed to be used in the OP review), and High,
corresponding to the migration assumptions outlined above. The report also included
projections to 2031 for areas adjacent to Ottawa in Ontario and Quebec. Draft projection
results were presented to a public meeting on September 17, 2007 and to representatives of
the Greater Ottawa Home Builders Association (GOHBA) for comment and discussion.
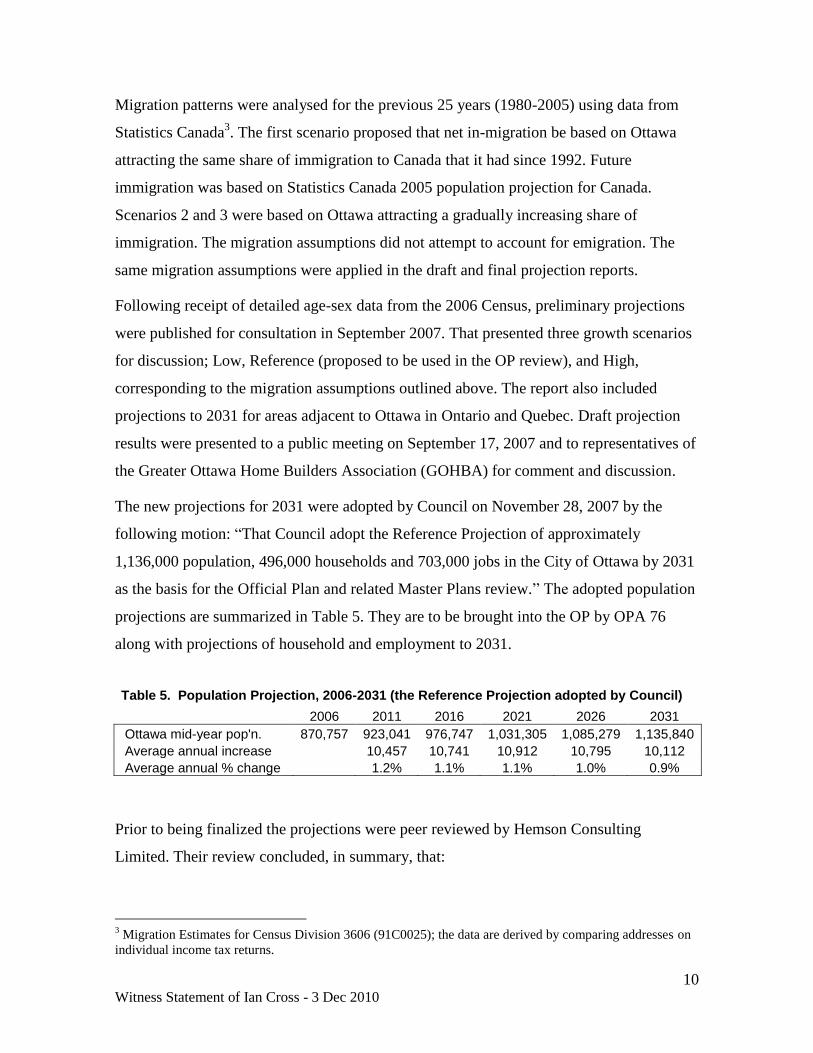
The new projections for 2031 were adopted by Council on November 28, 2007 by the
following motion: ―That Council adopt the Reference Projection of approximately
1,136,000 population, 496,000 households and 703,000 jobs in the City of Ottawa by 2031
as the basis for the Official Plan and related Master Plans review.‖ The adopted population
projections are summarized in Table 5. They are to be brought into the OP by OPA 76
along with projections of household and employment to 2031.
Table 5. Population Projection, 2006-2031 (the Reference Projection adopted by Council)
2006 2011 2016 2021 2026 2031
Ottawa mid-year pop'n. 870,757 923,041 976,747 1,031,305 1,085,279 1,135,840
Average annual increase
10,457 10,741 10,912 10,795 10,112
Average annual % change 1.2% 1.1% 1.1% 1.0% 0.9%
Prior to being finalized the projections were peer reviewed by Hemson Consulting
Limited. Their review concluded, in summary, that:
3 Migration Estimates for Census Division 3606 (91C0025); the data are derived by comparing addresses on
individual income tax returns.
11 Witness Statement of Ian Cross - 3 Dec 2010
―the overall forecast method for population, housing and employment are sound
approaches based on established techniques and standard methods in the industry.
Where methods and approaches have been developed to address specific
characteristics of Ottawa (such as addressing migration within a metropolitan area
straddling a provincial boundary), the methods are reasonable and supportable. The
total population, household and employment forecasts for the City to 2031 are a
reasonable outlook for growth in the City and represent a sound basis for long-term
infrastructure and land use planning in the City.‖
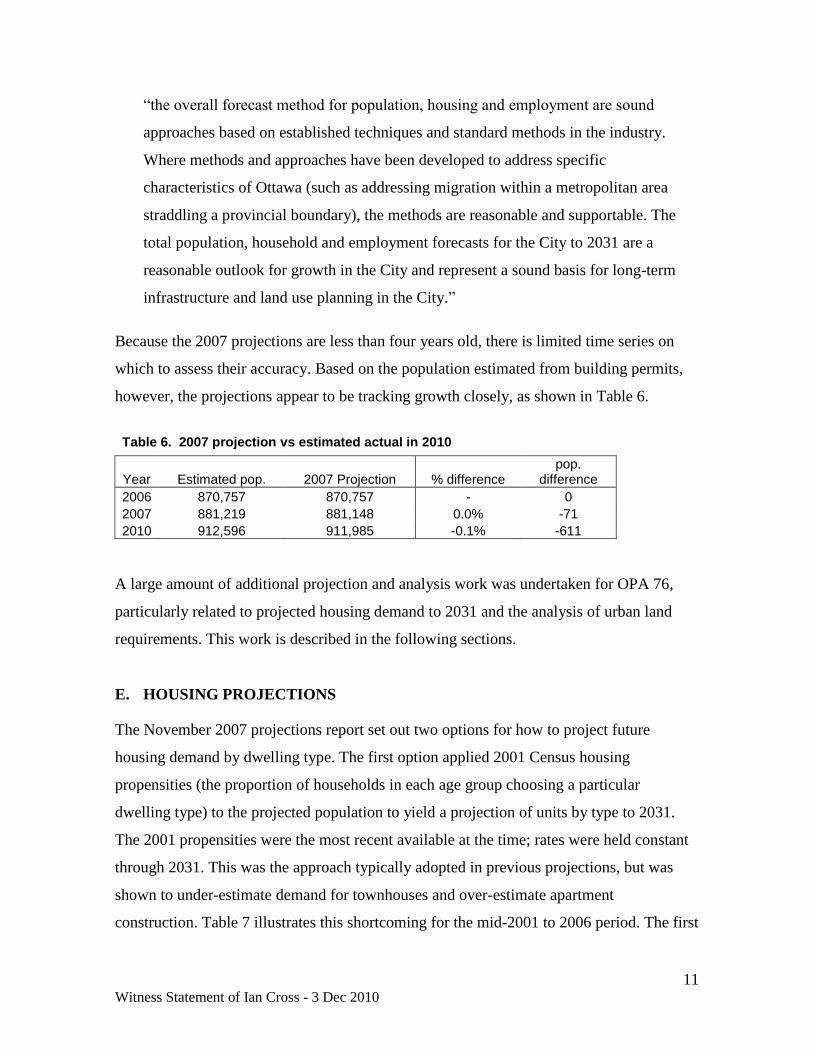
Because the 2007 projections are less than four years old, there is limited time series on
which to assess their accuracy. Based on the population estimated from building permits,
however, the projections appear to be tracking growth closely, as shown in Table 6.
Table 6. 2007 projection vs estimated actual in 2010
Year Estimated pop. 2007 Projection % difference pop.
difference
2006 870,757 870,757 - 0
2007 881,219 881,148 0.0% -71
2010 912,596 911,985 -0.1% -611
A large amount of additional projection and analysis work was undertaken for OPA 76,
particularly related to projected housing demand to 2031 and the analysis of urban land
requirements. This work is described in the following sections.
E. HOUSING PROJECTIONS
The November 2007 projections report set out two options for how to project future
housing demand by dwelling type. The first option applied 2001 Census housing
propensities (the proportion of households in each age group choosing a particular
dwelling type) to the projected population to yield a projection of units by type to 2031.
The 2001 propensities were the most recent available at the time; rates were held constant
through 2031. This was the approach typically adopted in previous projections, but was
shown to under-estimate demand for townhouses and over-estimate apartment
construction. Table 7 illustrates this shortcoming for the mid-2001 to 2006 period. The first
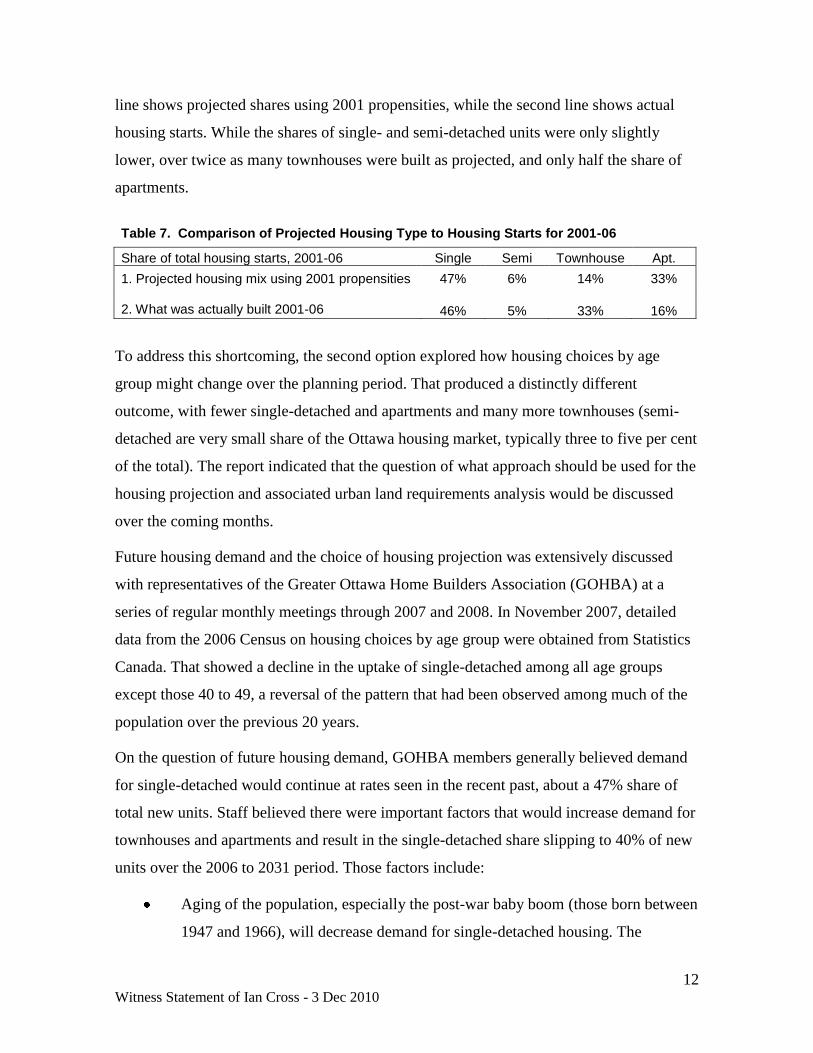
12 Witness Statement of Ian Cross - 3 Dec 2010
line shows projected shares using 2001 propensities, while the second line shows actual
housing starts. While the shares of single- and semi-detached units were only slightly
lower, over twice as many townhouses were built as projected, and only half the share of
apartments.
Table 7. Comparison of Projected Housing Type to Housing Starts for 2001-06
Share of total housing starts, 2001-06 Single Semi Townhouse Apt.
1. Projected housing mix using 2001 propensities 47% 6% 14% 33%
2. What was actually built 2001-06 46% 5% 33% 16%
To address this shortcoming, the second option explored how housing choices by age
group might change over the planning period. That produced a distinctly different
outcome, with fewer single-detached and apartments and many more townhouses (semi-
detached are very small share of the Ottawa housing market, typically three to five per cent
of the total). The report indicated that the question of what approach should be used for the
housing projection and associated urban land requirements analysis would be discussed
over the coming months.
Future housing demand and the choice of housing projection was extensively discussed
with representatives of the Greater Ottawa Home Builders Association (GOHBA) at a
series of regular monthly meetings through 2007 and 2008. In November 2007, detailed
data from the 2006 Census on housing choices by age group were obtained from Statistics
Canada. That showed a decline in the uptake of single-detached among all age groups
except those 40 to 49, a reversal of the pattern that had been observed among much of the
population over the previous 20 years.
On the question of future housing demand, GOHBA members generally believed demand
for single-detached would continue at rates seen in the recent past, about a 47% share of
total new units. Staff believed there were important factors that would increase demand for
townhouses and apartments and result in the single-detached share slipping to 40% of new
units over the 2006 to 2031 period. Those factors include:
Aging of the population, especially the post-war baby boom (those born between
1947 and 1966), will decrease demand for single-detached housing. The
13 Witness Statement of Ian Cross - 3 Dec 2010
occupancy of single-detached units peaks at ages 55 to 59. As the baby boom
ages they are likely to increasingly occupy townhouses and apartments. The
counter-argument was made that with better health and more wealth aging
boomers will stay where they are.
Housing choices of a population with increasing incidence of disability, which
increases with age. Similar counter-arguments as the preceding were made.
Older households are smaller, typically one or two people, and do not require
large homes. Some will downsize to smaller units such as townhouses and
apartments. This will be facilitated by an increasing range of choices.
Immigration is projected to become the major source of Ottawa’s population
growth and immigrants choose to live in higher density housing at a much
higher rate than the Canadian-born population. The argument was made that
over time immigrant housing choices increasingly resemble those of the
Canadian-born population. However, this change takes several decades and there
are indications that recent immigrants are less financially well-off than their
counterparts in earlier periods.
The growing appeal of the urban lifestyle will make new apartment and other
infill development downtown and on mainstreets more attractive.
The cost of replacing aging infrastructure can be partly defrayed by encouraging
new development through intensification which generates development charges.
The increasing cost of energy, in particular gasoline and electricity, will
encourage the choice of energy-efficient housing forms and more central
locations with excellent transit and options for walking and cycling.
Increasing awareness of environmental issues such as climate change will
encourage people to choose more centrally-located and higher-density housing
to reduce their environmental footprint.
After extensive discussion with GOHBA, staff conclusions on the housing projection were
set out in the report ―Residential Land Strategy for Ottawa 2006-2031‖, the conclusions of
which were presented in draft form to GOHBA representatives in October 2008. A draft
report was issued in November 2008 in a report to Planning and Environment Committee
for consultation and a revised final version was published in February 2009.
14 Witness Statement of Ian Cross - 3 Dec 2010
In addition to the projected shift in housing demand referred to above, the final housing
projections also removed institutional residents from projected demand, a step that was not
included in the 2007 draft housing-type projections. Institutional residents are primarily
comprised of people living in nursing homes, long-term care facilities, and hospitals.
Given the projected increase in the population 65 and over by 2031 (48% of total 2006-31
population growth is projected to be in the 65+ cohort), this group warranted separating
from overall housing demand. The institutional population is projected to almost double,
from 11,425 in 2006 to 20,700 in 2031.
Projected dwelling unit requirements also took account of the need to provide a vacancy
rate in both the rental and ownership housing stock and the need to replace units that were
demolished during the planning period.
In summary, projected housing demand for the 2006-31 planning period, including an
allowance for vacancies and replacement of demolitions, is shown in Table 8.
Table 8. Projected Housing Requirements, 2006 to 2031 Housing Type Single Semi Row Apt. Total
New dwellings, 2006-31 57,891 7,060 38,345 40,916 144,211
% units by type 40.1% 4.9% 26.6% 28.4% 100.0%
Tracking of housing starts4 since the start of the projection period (mid-2006) shows that to
date actual single-detached starts are well below the 47% share anticipated by GOHBA
representatives and even below the City projection of 42.6% for 2006-115. As shown in
Table 9, the single-detached share to date is slightly under 40%. Apartment starts to date
match the City projection exactly, and row units are well above the 23% share projected.
Table 9. Housing Starts, City of Ottawa, mid-2006 to Nov. 2010
Year Single Semi Row Apt. 2
nd half 2006 38.0% 5.7% 27.3% 29.0%
2007 43.8% 4.7% 31.4% 20.1%
2008 40.6% 3.0% 32.0% 24.3%
2009 40.3% 5.1% 34.2% 20.4% 2010 YTD Nov. 33.6% 5.7% 35.7% 25.1% Total 39.7% 4.7% 32.4% 23.2% Source: CMHC
4 Housing starts understate total new dwelling units, especially apartments, as they do not include units
created through conversions or additions. 5 See Residential Land Strategy, Appendix 2, p. A2-13 for dwelling projections by five-year time period.
15 Witness Statement of Ian Cross - 3 Dec 2010
F. ANALYSIS OF URBAN LAND REQUIREMENTS
Estimating urban land requirements involves a series of steps, described in the following
paragraphs and summarized in Table 12 on page 19. The analysis of urban land
requirements focused solely on the demand and supply for residential land since a previous
study, the Employment Lands Study Strategy (November 2008), had concluded there was
sufficient land provided for employment within the existing urban boundary.
a) Total dwelling unit requirements by unit type over the 2006-2031 period was the
starting point of the analysis, described in Section E of this witness statement.
These units are shown at Step 1 in Table 12.
b) Rural Share of Development: The rural area was assigned a 9% share of future city-
wide housing units, based on the average of the previous 20 years. At the time this
allocation was made there was no moratorium in effect on country lot development.
This step is shown at Step 2 of Table 12.
c) Urban dwellings are total units minus rural units, shown at Step 3 of Table 12.
d) Intensification Rate: This is the proportion of future urban units built through
intensification, as defined in the PPS. The appropriate rate of intensification to be
used in the analysis was the subject of extensive discussion with GOHBA, but no
consensus was achieved.
The staff view was that the factors listed in Part E of the witness statement affecting
the housing market in combination with development activity observed since 2001
provided good grounds on which to project that the intensification rate would
continue to gradually increase. The staff view on intensification was also supported
by two City of Ottawa reports. This first was research on the potential ―on the
ground‖ for intensification, titled ―Where Will We Live? Housing Potential in
Ottawa 2002‖, published in 2004 (the year 2002 was the date of the land use data
used). For the 2009 OP review the analysis was updated to 2006 to reflect current
OP designations and to remove sites that had developed since 2002. The updated
research concluded there was still a large potential for intensification,
16 Witness Statement of Ian Cross - 3 Dec 2010
approximately 67,000 units. The second report was an analysis of observed
intensification, titled ―Residential Intensification in Ottawa, 2001-2006‖, published
in September 2008. It concluded that over that five-year period (mid-year to mid-
year) 36% of new housing in the urban area had been built through intensification.
To establish the intensification target required by Policy 1.1.3.5 of the PPS, the
conclusion reached was that over the planning period a target of 36% for 2006 to
2011, 40% for 2011 to 2021, and 44% for 2021 to 2031 was appropriate. These
targets are incorporated in Policy 5 of Section 2.2.2 of OPA 76. That policy also
states the overall average target is 40% for the planning period. Coincidentally, this
is the same number as the province established in the Growth Plan for the Greater
Golden Horseshoe, although there are two differences. First, the Growth Plan target
applies to all residential development, whereas the Ottawa figure applies to only to
residential development in the urban area (the 40% share of new urban units is
equivalent to 36.4% of total city-wide growth including the rural area). Second, the
Growth Plan target is for 2015 and each year thereafter, whereas the Ottawa targets
are expressed in five and ten-year periods starting at the beginning of the projection
period in 2006. (It is noted that in fact the three rates stated in Policy 5 yield an
average intensification rate of 41% over the 2006 to 2031 timeframe.)
Since 2006, intensification activity has been monitored and reported annually. As
shown in Table 10 for the 2001 to 2010 period, while there was a brief drop in
activity in 2009 due to the economic slowdown, intensification in the first half of
2010 has rebounded to the highest rate on record, 43.6% of new urban units. Since
the middle of 2006, the start of the projection period, intensification has averaged
36.6%, higher than the 36% target for the 2006-2011 period.
Table 10. Intensification Share of New Urban Dwelling Units, 2001-2010
2001 2002 2003 2004 2005 2006 2007 2008 2009
2010 1H*
Intensification units 1,506 2,599 2,237 2,323 1,545 1,785 2,878 2,339 1,609 1,469
Total urban units 5,551 7,091 5,953 6,740 4,551 5,117 7,228 6,521 5,333 3,372
% Intensification 27.1% 36.7% 37.6% 34.5% 33.9% 34.9% 39.8% 35.9% 30.2% 43.6%
Source: building permits
* first half of 2010
17 Witness Statement of Ian Cross - 3 Dec 2010
In addition to the physical opportunity for further intensification and observed
activity, staff also took account of provincial policy in the PPS which seeks to
encourage intensification.
A final question is the mix of dwelling unit types expected to be built through
intensification. The projection assumes over 70% will be apartments, reflecting the
types of opportunities that are available, but a number of townhouses and, to a
lesser extent, single and semi-detached units can be expected, mostly on scattered
small sites. Intensification units are shown at Step 4 of Table 12.
e) Greenfield Housing Demand: This step subtracted intensification units (Step 4)
from total urban demand (Step 3) to produce demand on greenfield land. This is
shown at Step 5 of Table 12.
f) Greenfield Housing Supply: The analysis presented in the Residential Land
Strategy (RLS) report was based on the unit inventory on urban land outside the
Greenbelt reported in the 2006 VURLS survey. In order to provide as much detail
as possible on the supply for specific dwelling types, the VURLS inventory was
supplemented by information from Community Design Plans (CDPs) that had been
completed for suburban greenfield areas. The December 2006 summary supply
table was provided to GOHBA participants for their review and comment. The final
version used in the land requirements analysis was dated September 18, 2008.
Greenfield supply from that table is shown at Step 6 of Table 12.
g) Greenfield Supply versus Demand by Unit Type: This compared housing demand
on greenfield land (Step 5) to greenfield housing supply (Step 6) and concluded
there was a shortage of land for single and semi-detached units of approximately
6,700 and 1,700 units respectively. This is shown at Step 7 of Table 12.
h) Densities for each unit type were applied to the theoretical shortfall in single and
semi-detached to estimate how much land was required to accommodate the
shortfall in units. Densities were based on achieving significant increases in density
for these unit types compared with historical densities as measured by VURLS. For
example, the analysis used a single-detached density of 26 units per net hectare
(units/net ha), compared to the average for the last five years (2005-09) of 21.4
18 Witness Statement of Ian Cross - 3 Dec 2010
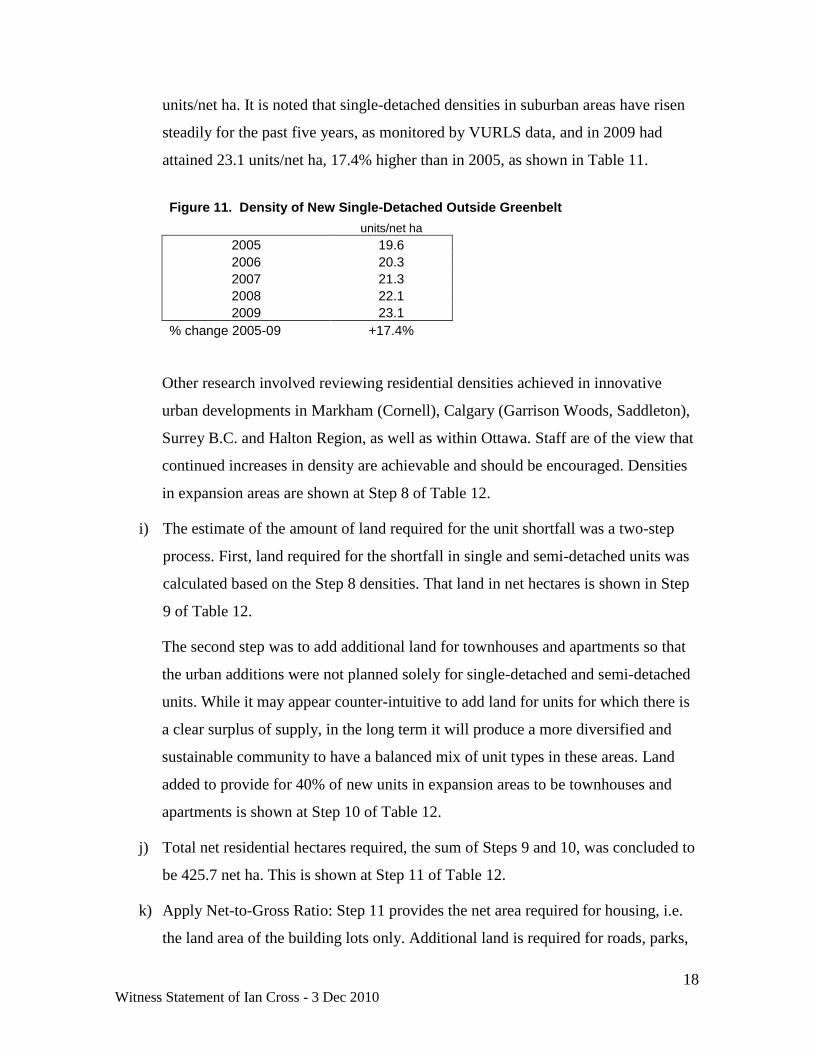
units/net ha. It is noted that single-detached densities in suburban areas have risen
steadily for the past five years, as monitored by VURLS data, and in 2009 had
attained 23.1 units/net ha, 17.4% higher than in 2005, as shown in Table 11.
Figure 11. Density of New Single-Detached Outside Greenbelt
units/net ha
2005 19.6 2006 20.3 2007 21.3 2008 22.1 2009 23.1 % change 2005-09 +17.4%
Other research involved reviewing residential densities achieved in innovative
urban developments in Markham (Cornell), Calgary (Garrison Woods, Saddleton),
Surrey B.C. and Halton Region, as well as within Ottawa. Staff are of the view that
continued increases in density are achievable and should be encouraged. Densities
in expansion areas are shown at Step 8 of Table 12.
i) The estimate of the amount of land required for the unit shortfall was a two-step
process. First, land required for the shortfall in single and semi-detached units was
calculated based on the Step 8 densities. That land in net hectares is shown in Step
9 of Table 12.
The second step was to add additional land for townhouses and apartments so that
the urban additions were not planned solely for single-detached and semi-detached
units. While it may appear counter-intuitive to add land for units for which there is
a clear surplus of supply, in the long term it will produce a more diversified and
sustainable community to have a balanced mix of unit types in these areas. Land
added to provide for 40% of new units in expansion areas to be townhouses and
apartments is shown at Step 10 of Table 12.
j) Total net residential hectares required, the sum of Steps 9 and 10, was concluded to
be 425.7 net ha. This is shown at Step 11 of Table 12.
k) Apply Net-to-Gross Ratio: Step 11 provides the net area required for housing, i.e.
the land area of the building lots only. Additional land is required for roads, parks,
19 Witness Statement of Ian Cross - 3 Dec 2010
schools, local retail, stormwater facilities and other uses commonly found within a
residential community. The conversion from net to gross land involves a factor
termed the net-to-gross ratio. This also was the subject of discussion with GOHBA
representatives. In past VURLS reports, staff had applied a 60% net-to-gross ratio,
based on analysis of residential subdivisions built in the 1980’s and 1990’s.
Homebuilders argued that the ratio had dropped due to increased requirements for
stormwater facilities and protection of natural areas. For the OP review analysis an
estimated net-to-gross ratio of 50% was therefore applied. That is shown at Step 12
of Table 12.
l) Conclusion: The gross residential land requirement of 851.4 hectares is shown at
Step 13 of Table 12.
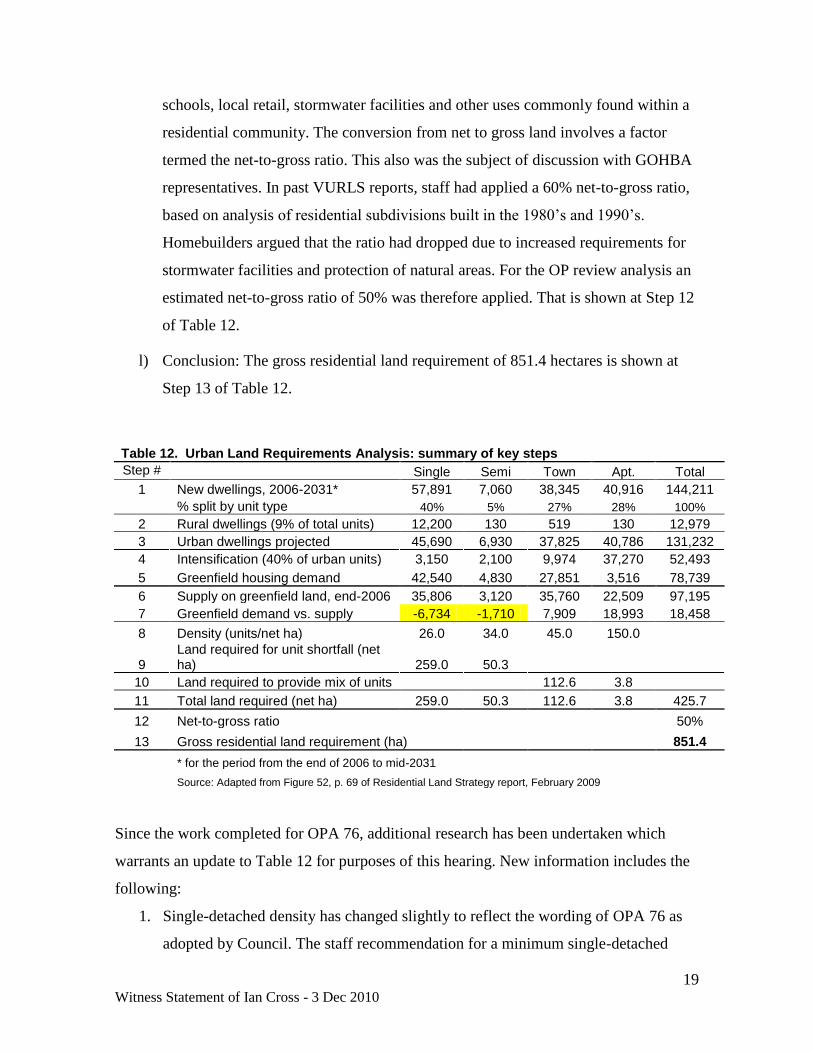
Table 12. Urban Land Requirements Analysis: summary of key steps Step # Single Semi Town Apt. Total
1 New dwellings, 2006-2031* 57,891 7,060 38,345 40,916 144,211
% split by unit type 40% 5% 27% 28% 100%
2 Rural dwellings (9% of total units) 12,200 130 519 130 12,979
3 Urban dwellings projected 45,690 6,930 37,825 40,786 131,232
4 Intensification (40% of urban units) 3,150 2,100 9,974 37,270 52,493
5 Greenfield housing demand 42,540 4,830 27,851 3,516 78,739
6 Supply on greenfield land, end-2006 35,806 3,120 35,760 22,509 97,195
7 Greenfield demand vs. supply -6,734 -1,710 7,909 18,993 18,458
8 Density (units/net ha) 26.0 34.0 45.0 150.0
9 Land required for unit shortfall (net ha) 259.0 50.3
10 Land required to provide mix of units 112.6 3.8
11 Total land required (net ha) 259.0 50.3 112.6 3.8 425.7
12 Net-to-gross ratio 50%
13 Gross residential land requirement (ha) 851.4
* for the period from the end of 2006 to mid-2031
Source: Adapted from Figure 52, p. 69 of Residential Land Strategy report, February 2009
Since the work completed for OPA 76, additional research has been undertaken which
warrants an update to Table 12 for purposes of this hearing. New information includes the
following:
1. Single-detached density has changed slightly to reflect the wording of OPA 76 as
adopted by Council. The staff recommendation for a minimum single-detached
20 Witness Statement of Ian Cross - 3 Dec 2010
density of 26 units/net hectare was changed by a Committee motion to the wording
contained in Policy 17 of S. 2.2.2 of OPA 76, which states:
―For lands outside of the Greenbelt that are included in a community design
plan approved by Council after June 10, 2009 the following housing mix and
density provisions apply:
a. At least 45% single detached but not more than 55% single detached, at
least 10 per cent apartment dwellings and the remainder multiple
dwellings, other than apartments.
b. Overall residential development will meet a minimum average density
of target of 34 units per net hectare. Net residential density is based on the
area in exclusively residential use, including lanes and parking areas
internal to developments but excluding public streets, rights-of-way and all
non-residential uses.‖
The policy could be met with a range of single-detached densities from roughly 24
to 26 (or higher) units/per net ha. For purposes of the updated analysis a mid-range
figure of 25 units/net ha is used. The policy also requires a minimum 10% of units
to be in the form of apartments. The original analysis had assumed 4% of units
would be apartments.
2. The net-to-gross ratio is also revised based on research documented in the report
―Comparative Analysis of Residential Development Ratios in the City of Ottawa‖,
published in November 2010. That report compared net-to-gross ratios in areas
developed in 1980’s and 1990’s to areas developed in 2000 and after. It concluded
that the ratio had in fact declined, from just under 61% in older areas to 53% in
newer areas. The decrease was due to more land being used for stormwater
facilities, natural area protection, schools and roads. The staff analysis of expansion
lands had excluded natural environment and other constraint land that was not
developable in order to be able to compare alternatives on a standardised
―developable hectares‖ basis. To be consistent with that approach the effective net-
to-gross ratio from the 2010 study would be approximately 56.2%. A slightly
21 Witness Statement of Ian Cross - 3 Dec 2010
conservative net-to-gross ratio of 55% is applied to the updated land requirement
analysis. That will have the effect of marginally reducing the land requirement.
Applying the above revisions to the land needs analysis in Table 12 results in an revised
urban land requirement of 769 hectares rather than 851.
However, staff are currently engaged with consultants for the development industry in an
effort to reach consensus on updating the land supply, taking into account changes that
have occurred since the end of 2006. This complicated and detailed analysis will likely
result in changes to the greenfield supply in Line 6 of Table 12. When further information
respecting the greenfield supply is available these conclusions will be incorporated in an
update to Table 12.
G. LAND SUPPLY PROVIDED BY OPA 76
OPA 76 added an additional 256 gross hectares (ha) to the urban area, of which 230 ha are
estimated to be developable, a reduction of 10.2%. Areas removed were 10 ha designated
Natural Environment Area, 9 ha of floodplain, and 7 ha of hydro right-of-way.
In order to assess compliance with the Policy 1.4.1a requirement of the PPS for a 10-year
land supply for housing to be maintained, it is necessary to estimate the number of years of
supply that is provided by the amendment in addition to the existing supply of land.
First, housing potential on the 230 developable ha added is estimated. Applying a 55% net-
to-gross ratio yields 126.5 net ha of residential land. Achieving the 34 units/ha minimum
density policy, the land added could accommodate at least 4,300 dwelling units. Assuming
about 45% of units to be single-detached (the minimum share) and 10% to be semi-
detached produces 1,935 singles and 430 semis.
Applying those numbers to the theoretical unit shortfall from Table 12 yields a revised
shortfall of 4,799 singles and 1,280 semis by 2031, as shown at line ―1‖ in Table 13. The
next step is to compare that supply to projected demand. Housing demand projections on
greenfield land by unit type are contained in Appendix 3 of the Residential Land Strategy
report (p. A3-2) and listed at line ―2‖ of Table 13. At the projected rate of consumption,
the land supply is estimated to be short of 2031 (mid-year) by approximately 3.5 years for
22 Witness Statement of Ian Cross - 3 Dec 2010
singles and 6.5 years for semis (line ―3‖). In terms of a year, that corresponds to mid-2027
(line ―4‖) on average or just over 18 years of supply from mid-2009 (line ―5‖). As noted
above, this conclusion will be revisited when updated information on the greenfield
housing supply is available.
Table 13. Estimate of Years of Land Supply for Singles and Semi-Detached Provided by OPA 76
Single Semi Total Unit shortfall from Table 13, Step 7 -6,734 -1,710 -8,444 OPA 76 additions 1,935 430 2,366 1. Net shortfall after OPA 76 -4,799 -1,280 -6,078
2. Greenfield demand/yr post-2026 1,382 196 1,578 3. Years of supply short at 2031 -3.5 -6.5 -3.9 4. Approx. date of depletion 2027.5 2024.5 2027.1 5. Years of supply from mid-2009 18.5 15.5 18.1
H. DENSITY TARGETS
PPS Policy 1.2.2 requires municipalities to identify density targets for areas adjacent to
transit corridors. Other polices (e.g. 1.6.5, 1.8.1) promote a mix of uses and compact
development integrated with the transit system.
OPA 76 implements these policies through Policy 6 of Section 2.2.2. Figure 2.3 of the
policy establishes density targets for the Central Area, Mixed-Use Centres, Town Centres
and Riverside South Community Core, and several Arterial Mainstreets. Targets are
measured as people and jobs (combined) per gross hectare, based on a document provided
to the City by the Ministry of Municipal Affairs and Housing6. That document defines a
series of six density ranges according to their potential to support various levels of transit
service. For example, a density range 120 to 200 people and jobs per hectare was
categorized as having the potential for higher order transit (bus rapid transit (BRT) or
LRT). That range of density targets applies to most of the areas defined in Policy 6.
6 ―Transportation Trends and Outlooks for the Greater Toronto Area and Hamilton – Needs and
Opportunities‖, IBI Group, January 29, 2007. Density ranges are reproduced in the Residential Land Strategy
report on p. 37.
23 Witness Statement of Ian Cross - 3 Dec 2010
Targets were established based on two considerations. First, research was undertaken to
measure the density in 2006 of people and jobs per hectare at various locations. The 2006
density of each target location is listed in Figure 2.3 of the amendment. Second, existing
and planned rapid transit service was reviewed based on the Transportation Master Plan
(TMP) to identify locations, such as the Hurdman Mixed-Use Centre, which may not
currently have achieved any significant density but which have the potential to attract a
significant amount of development in future.
Density targets were applied according to a hierarchy. The highest target is for the Central
Area, at 500 people and jobs per hectare. This was based on its already high level in 2006
of 396 and recognizing that it has potential to add a significant amount of high density
housing and employment by 2031. Mixed-Use Centres that already had high densities in
2006 (Tunney’s-Quad and Lees) were assigned the next target level of 250 people and jobs
per hectare by 2031. Mixed-Use Centres located at key transfer stations between existing
or planned BRT and LRT systems received the next order of magnitude of 200. At some
centres 2006 densities were well below the target, and in consequence the target is set to be
reached at some point after 2031. In the interim, the targets will serve to direct new
development so that the target is eventually reached for the entire Mixed-Use Centre.
Emerging Mixed-Use Centres, such as Kanata West and Mer Bleue, and Town Centres
were assigned targets of 120 recognizing that existing densities are low. Similar
considerations were applied to targets for Arterial Mainstreets.
I. PLANNING OPINION
Issue No. 3:
Did the City use appropriate population and housing growth projections for the
urban residential land needs analysis? If not, what are the appropriate projections?
Projections of population and housing are discussed in Parts C and D of this witness
statement. The projections were extensively researched and consulted on, and were
supported by a peer review. They are tracking actual growth well. In my opinion the City
24 Witness Statement of Ian Cross - 3 Dec 2010
used appropriate population and housing growth projections for the analysis of urban
residential land needs.
Issue No. 4:
Were the assumptions used by the City regarding the contribution of net
international migration to projected population growth reasonable and defensible,
based on available research and empirical data?
As discussed in Part D of the witness statement, the assumptions used by the City are
reasonable and defensible.
Issue No. 5:
Were the assumptions used by the City regarding the dwelling type propensities of
residents over the projection period reasonable and defensible, based on available
research and empirical data?
As discussed in Part E of the witness statement, the City’s assumptions regarding dwelling
type propensities were extensively researched. It is my opinion that the assumptions used
are reasonable and defensible based on available research and empirical data.
Issue No. 6:
Are the proposed housing mix and minimum density provisions within OPA 76 for
residential development within the urban boundary appropriate and reasonable to
accommodate the projected growth?
The housing mix and minimum density provisions in Policy 17 of Section 2.2.2 of OPA 76
are discussed in Part F of the witness statement. The Fernbank CDP was approved under
these policies and was able to achieve all requirements. In my opinion the provisions are
appropriate and reasonable to accommodate the projected growth.
OPA 76 also contains minimum density provisions for residential development within
Enterprise Areas (Policy 4b of Section 3.6.5). This requires townhouses to achieve a
minimum of 45 units/net ha, stacked townhouses minimum 110 units/net ha, and
apartments minimum 190 units/net ha. The required townhouse densities are only seven
25 Witness Statement of Ian Cross - 3 Dec 2010
per cent higher than the average of what has been built outside the Greenbelt over the past
five years (42.1 u/ha over 2005-09). The density minimum for stacked townhouses is
actually lower than the average of what was built in the last five years (121.6 u/ha).
Apartment densities are 22% higher than what was built since 2005 (155.7 u/ha).
In my opinion the policies are appropriate and reasonable.
Issue No. 7:
Are the proposed intensification and density targets within OPA 76 appropriate and
consistent with the 2005 Provincial Policy Statement?
Policy 1.1.3.6 of the PPS requires that ―Planning authorities shall establish and implement‖
targets for intensification. Intensification targets are discussed in Part F of the witness
statement. Density targets are discussed in Part G.
In addition to 1.1.3.6, the following policies of the PPS also support the proposed
intensification and density targets in OPA 76:
―1.1.1 Healthy, liveable and safe communities are sustained by:
a) Promoting efficient development and land use patterns which sustain the financial
well-being of the Province and municipalities over the long term;
b) Accommodating an appropriate range and mix of residential, employment
(including industrial, commercial and institutional uses), recreational and open
space uses to meet long-term needs;
c) Avoiding development and land use patterns which may cause environmental or
public health and safety concerns;
d) (not relevant to the Issue);
e) Promoting cost-effective development standards to minimize land consumption and
servicing costs‖
―1.1.3.2 Land use patterns within settlement areas shall be based on:
a) densities and a mix of land uses which:
1. efficiently use land and resources;
26 Witness Statement of Ian Cross - 3 Dec 2010
2. are appropriate for, and efficiently use, the infrastructure and public service
facilities which are planned or available, and avoid the need for their unjustified
and/or uneconomical expansion; and
3. minimize negative impacts to air quality and climate change, and promote
energy efficiency in accordance with policy 1.8; and
b) a range of uses and opportunities for intensification and redevelopment in
accordance with the criteria in policy 1.1.3.3.‖
―1.1.3.3 Planning authorities shall identify and promote opportunities for intensification
and redevelopment where this can be accommodated taking into account existing building
stock or areas, including brownfield sites, and the availability of suitable existing or
planned infrastructure and public service facilities required to accommodate projected
needs.‖
―1.1.3.4 Appropriate development standards should be promoted which facilitate
intensification, redevelopment and compact form, while maintaining appropriate levels of
public health and safety.‖
―1.1.3.5 Planning authorities shall establish and implement minimum targets for
intensification and redevelopment within built-up areas. However, where provincial targets
are established through provincial plans, the provincial target shall represent the minimum
target for affected areas.‖
―1.1.3.7 New development taking place in designated growth areas should occur adjacent
to the existing built-up area and shall have a compact form, mix of uses and densities that
allow for the efficient use of land, infrastructure and public service facilities.‖
―1.4.3 Planning authorities shall provide for an appropriate range of housing types and
densities to meet projected requirements of current and future residents of the regional
market area by:
d) promoting densities for new housing which efficiently use land, resources,
infrastructure and public service facilities, and support the use of alternative

27 Witness Statement of Ian Cross - 3 Dec 2010
transportation modes and public transit in areas where it exists or is to be
developed; and
e) establishing development standards for residential intensification, redevelopment
and new residential development which minimize the cost of housing and facilitate
compact form, while maintaining appropriate levels of public health and safety.‖
The intensification and density targets in OPA 76 represent the City’s effort to be
consistent with the requirements of the PPS as set out in the above-noted policies. They are
appropriate given recent development patterns and given the policy direction of the PPS.
Issue No. 8:
Is the proposed requirement in Policy 3E in Section 2.2.1 that “an urban expansion
will only be considered if the intensification target of this plan has been met”
consistent with the 2005 Provincial Policy Statement, in conformity with other
policies in the City of Ottawa Official Plan, and does it represent good planning?
This issue is also addressed by the witness statement of Bruce Finlay. Policy 3e of Section
2.2.1 is one of several items to be considered at the time of the comprehensive five-year
review to assess the need to designate additional urban land. Policy 3e represents the City’s
application of the requirements of policy 1.1.3.6 of the PPS, which states:
―Planning authorities shall establish and implement phasing policies to ensure that
specified targets for intensification and redevelopment are achieved prior to, or
concurrent with, new development within designated growth areas.‖
As required by the PPS policy, OPA 76 sets targets for intensification. These are contained
in Section 2.2.2, policy 5 of the OP, as amended by OPA 76.
The PPS requirement that intensification targets be achieved prior to or concurrent with
new development in ―designated growth areas‖, which is a defined term in the PPS, was
interpreted to refer to the expansion of the urban boundary. The alternative meaning, based
on a literal reading of the definition of designated growth areas, would essentially require
the City to achieve its intensification targets prior to approving any new development
within the urban boundary. As this was judged impractical in a large, growing city such as
28 Witness Statement of Ian Cross - 3 Dec 2010
Ottawa since it would be highly disruptive to the development process, the policy was
therefore taken to apply to urban expansions.
It is important to note that the Plan provides for a large supply of vacant greenfield land for
housing within the approved urban boundary. As noted in Table 12 of Part F of this
witness statement, there is sufficient land for over 70,000 single-detached, semi-detached
and townhouse units, plus opportunity for many thousands of apartments.
Issue No. 9:
In determining the amount of land that should be added to the urban boundary, has
OPA 76 taken full account of available vacant land within the urban boundary?
As described in Part C of this witness statement, the Research and Forecasting Unit
monitors the supply of vacant land by means of a series of reports (the annual Vacant
Urban Residential Land Survey, the Inventory of Vacant Industrial and Business Park
Lands, the ―Where Will We Live?‖ report, and the Land Use Survey). Taken together,
these surveys provide a comprehensive inventory of available vacant land within the urban
boundary.
Issue No. 10:
Is the decision to add only 230 hectares of land to the City’s urban boundary
consistent with the 2005 Provincial Policy Statement, and does it represent good
planning?
This issue is also addressed by the witness statement of Bruce Finlay. The PPS has two
policies regarding land supply.
First, Policy 1.1.2 states that:
―Sufficient land shall be made available through intensification and redevelopment
and, if necessary, designated growth areas, to accommodate an appropriate range
and mix of employment opportunities, housing and other land uses to meet projected
needs for a time horizon of up to 20 years. However, where an alternate time period
has been established for specific areas of the Province as a result of a provincial
29 Witness Statement of Ian Cross - 3 Dec 2010
planning exercise or a provincial plan, that time frame may be used for
municipalities within the area.‖
The policy is clear that the planning horizon should not be more than 20 years and that it
may be less than 20 (i.e. ―up to 20‖). Part F of this witness statement demonstrated that
OPA 76 provides for approximately a 18-year supply of greenfield land. This conforms to
the PPS policy.
It is also noted that the policy states ―sufficient land shall be made available through
intensification and redevelopment and, if necessary, designated growth areas”. Sufficient
land is available through intensification and redevelopment for 20 years of projected
housing needs (and in fact more). There is also a 20-year supply of land to accommodate a
range and mix of employment opportunities.
Second, Policy 1.4.1a states that planning authorities shall:
―Maintain at all times the ability to accommodate residential growth for a minimum
of 10 years through residential intensification and redevelopment and, if necessary,
lands which are designated and available for residential development.‖
As described in Part F of this witness statement, Council’s addition of land provides for a
10-year supply of residential land to be maintained over the next five years as of the date
of adoption of OPA 76. Council’s decision is therefore also consistent with this policy of
the PPS.
The 18-year supply also represents good planning because it does not over-designate the
supply of urban land. While builders may feel more constrained than they would wish with
respect to the supply of urban land for lower density housing, both the Plan and provincial
policy seek to encourage more compact development. By limiting the land supply for
single and semi-detached units to 18 years, builders will be encouraged to make more
efficient use of the existing land supply by building at higher densities. Because the
Planning Act requires the City to review its Official Plan every five years, there are regular
opportunities to introduce incremental additions of urban land in future if there is a
demonstrated need. In my opinion the decision to add 230 hectares of land to the urban
boundary represents good planning.
30 Witness Statement of Ian Cross - 3 Dec 2010
Issue No. 11:
Does OPA 76 add sufficient land within the City of Ottawa’s Urban Area to meet
projected residential/housing needs for the City and, if not, how much land should be
added to the Urban Area to meet projected residential/housing needs?
This issue is also addressed by the witness statement of Bruce Finlay. As described in Part
G of my witness statement, OPA 76 adds sufficient land for approximately 18 years of
projected housing demand as of the date of Council adoption (mid-2009). This is sufficient
to meet the requirements of the PPS, as explained in the response to Issue No. 10.
Conclusions
1. The growth forecast for 2006-31 used for the Official Plan review and Amendment
76 was based on the best information and analysis available at the time and
represents a sound basis for long-term planning.
2. The intensification and density targets in OPA 76 are appropriate and consistent
with the PPS.
3. The land supply provided in the Official Plan including Amendment 76 meets the
tests of the Provincial Policy Statement with respect to providing a 10-year supply
of residential land and up to a 20-year supply of land.
4. The growth projections and targets for intensification and density contained in OPA
76 should be approved by the Board. The urban boundary aspects of OPA 76
should also be approved by the Board except the issue of the location of the
expansion lands, which will be dealt with in Phase 2 of this hearing.

31 Witness Statement of Ian Cross - 3 Dec 2010
Appendix A
Résumé of Ian Cross, MCIP, RPP

32 Witness Statement of Ian Cross - 3 Dec 2010
IAN CROSS, MCIP, RPP
EDUCATION
Master of Urban Planning, McGill University 1980
Bachelor of Arts (Geography), Trent University 1974
PROFESSIONAL MEMBERSHIPS
Member, Canadian Institute of Planners (MCIP)
Ontario Professional Planners Institute (OPPI), Registered Professional Planner (RPP)
WORK EXPERIENCE
Program Manager, Research and Forecasting Unit 2001-present
Policy Development and Urban Design Branch, Planning and Growth Management
Department, City of Ottawa
Manager of a team of planners and technical staff responsible for analysis,
projections and monitoring of population, housing, employment and land use.
Coordination of research, analysis and projections for the 2003 Official Plan and
2009 OP review (Amendment 76).
Economic Planning Analyst 1997-2001
Business Development Branch, Development Services Department, Regional Municipality
of Ottawa-Carleton (RMOC)
Analysis and projection of jobs, labour force, employment land and other variables.
Project manager on a range of economic studies.
Manager, Regional Development Strategy (acting) 1995-96
Planning and Property Department, RMOC
Regional Development Strategy (RDS) for Regional Official Plan review; principal
author of reports on the RDS and Chapter 2 of 1997 Regional Plan.
Demographic, employment and land use modelling for the 1997 Regional Official
Plan and integration with Transportation, Water and Wastewater Master Plans.
Manager, Planning Policy (acting) 1994-95
Planning Department, RMOC
Projections of population, housing, jobs and urban land to 2021, which
formed the basis of 1997 Regional Official Plan.
Manager of Regional housing policy and programs.
Regional Planner 1990-94
Planning Department, RMOC
Co-ordinated Orleans Expansion (OPA 1) planning and approval process (1989-93);
plan for 15,000 dwellings and 18,000 jobs.
Author of 1992 Monitoring Report on the Regional Plan and other research reports.
33 Witness Statement of Ian Cross - 3 Dec 2010
Manager, Planning Policy (acting) 1989-90
Planning Department, RMOC
Revised growth projections for 1986-2011 (population, jobs and housing),
incorporated into 1988 Regional Plan by ROPA 22.
Planner for ―at no cost‖ policy discussions and subsequent ROPA 23.
Intermediate Planner 1987-89
Planning Department, RMOC
Demographic and employment projections for a variety of projects.
Amendments to Regional Official Plan; various planning studies.
Planning and research work with: 1980-87
City of Ottawa, City of Vanier, RMOC, National Capital Commission (NCC), and
Canada Mortgage and Housing Corporation (CMHC).

34 Witness Statement of Ian Cross - 3 Dec 2010
Appendix B
List of Documents
35 Witness Statement of Ian Cross - 3 Dec 2010
a) City of Ottawa reports:
Annual Development Report, 2009, September 2010 report
Annual Development Report, 2004 to 2008 reports
Background Report on New Projections for 2006-2031, June 2007 report
Central Area Development Capacity Analysis 2009: Estimated Office and Employment
Potential in Downtown Ottawa, October 2010 report
City of Ottawa Older Adult Plan: Demographic Characteristics Forecast 2006-2031,
Hemson Consulting Ltd., November 2010 report
City of Ottawa Population, Employment, Household and Dwelling Projections 2006 to
2031, November 2007 report
Community Design Plans for Barrhaven South, East Urban Community, Fernbank,
Leitrim, Mer Bleue and Mer Bleue Mixed Use Centre, Riverside South, and South Nepean
Town Centre
Comparative Analysis of Residential Development Ratios in the City of Ottawa,
November 2010 report
Comparative Municipal Fiscal Impact Analysis, Hemson Consulting Ltd., January 2009
report
Data Handbook, December 2008 report
Demographic-Economic Facts, June 2009 report
Employment in Ottawa: Results of the 2006 Employment Survey
Employment Land Study Strategy, Phase 1 Final Report, Metropolitan Knowledge
International, November 10, 2008
Faces of Ottawa Immigration Report, March 2007 report
Growth Projections for Ottawa 2006-2031: Prospects for Population, Housing and Jobs –
Consultation Draft, September 2007.
Inventory of Vacant Industrial and Business Park Lands, 2006-07 Update
History of Population Projections in Ottawa, 1915-2001, March 2004 report
Land Use Survey 2005, April 2006 report
Ottawa Counts, all issues (2003 to present)
36 Witness Statement of Ian Cross - 3 Dec 2010
Partnerships for Prosperity: Ottawa’s Five-Year Investment Strategy for Sustainable
Economic Prosperity, 2010 report
Peer Review of Growth Projection: ―Review of City-Wide Population, Employment and
Housing Forecasts‖, letter from Hemson Consulting Ltd. dated October 17, 2007
Residential Intensification in Ottawa, 2001-2006, September 2008 report
Residential Land Strategy for Ottawa 2006-2031, February 2009 report
Rural Residential Land Survey, 2007-2008 Update
Understanding Residential Density, October 2005 report
Vacant Urban Residential Land Survey, 2002 Update
Vacant Urban Residential Land Survey, 2006 Update
Vacant Urban Residential Land Survey, 2009 Update
Where Will We Live? Housing Potential in Ottawa 2002, October 2004 report
b) Other reports:
2008 Canadian Immigrant Labour Market: Analysis of Quality of Employment, Statistics
Canada, Cat. No. 71-606-X, No. 5
Decline of the Immigrant Homeownership Advantage: Life-Cycle, Declining Fortunes and
Changing Housing Careers in Montreal, Toronto and Vancouver, 1981-2001, Statistics
Canada, 2005, Cat. No. 11F0019-MIE — No. 238
Greater Ottawa New Home Market Report, PMA Brethour Group, monthly issues for 2010
Growth Plan for the Greater Golden Horseshoe, 2006
Housing for Immigrants to Ontario’s Medium-Sized Cities, CPRN Research Report,
September 2008
Housing Market Outlook: Ottawa, Canada Mortgage and Housing Corporation (CMHC),
Fall 2010
Housing Now, Canada Mortgage and Housing Corporation (CMHC), monthly reports
Housing Transitions of Seniors, Canadian Social Trends, Winter 2005, Cat. No. 11-008
Immigrants in Canada’s Census Metropolitan Areas, Statistics Canada, 2004, Cat. No. 89-
613-MIE, No. 003
37 Witness Statement of Ian Cross - 3 Dec 2010
Implementing Residential Intensification Targets: Lessons from Research on
Intensification Rates in Ontario, The Neptis Foundation, February 2010
Kanata West Concept Plan, Volume 1, and related Land Use Analysis, FoTenn Consultants
Inc. et al, August 2002
Ontario Population Projections Update, Ontario Ministry of Finance, reports for 2005 to
2010
Ottawa Long-term Housing Outlook, CMHC, November 2008 (PowerPoint slides)
Portrait of Seniors in Canada 2006, Statistics Canada, 2007, Cat. No. 89-519-XIE
Retirement Homes Report, Ontario, Canada Mortgage and Housing Corporation (CMHC),
2007 and 2008 reports
Seniors Housing Report, Ontario, Canada Mortgage and Housing Corporation (CMHC),
2009 and 2010 reports
Transportation Trends and Outlooks for the Greater Toronto Area and Hamilton – Needs
and Opportunities‖, IBI Group, January 29, 2007