Embed Size (px)
Citation preview

© 2010 Municipal Tax Equity (MTE) Consultants Inc.
COMPARING THE TAX BURDEN OF MULTIPLE-UNIT RESIDENTIAL PROPERTIES
Prepared For: The City of Ottawa
Prepared By: Municipal Tax Equity (MTE) Consultants Inc.
12005 Steeles Ave, R. R. # 3 Georgetown, ON L7G 4S6
www.mte.ca
Final Version March 4th, 2010

© 2010 Municipal Tax Equity (MTE) Consultants Inc.
Disclaimer and Caution The information, views, data and discussions in this document and related material are provided for general reference purposes only. Regulatory and statutory references are, in many instances, not directly quoted excerpts and the reader should refer to the relevant provisions of the legislation and regulations for complete information. The discussion and commentary contained in this report do not constitute legal advice or the provision of legal services as defined by the Law Society Act, any other Act, or Regulation. If legal advice is required or if legal rights are, or may be an issue, the reader must obtain an independent legal opinion. Decisions should not be made in the sole consideration of or reliance on the information and discussions contained in this report. It is the responsibility of each individual in either of a decision-making or advisory capacity to acquire all relevant and pertinent information required to make an informed and appropriate decision with regards to any matter under consideration concerning municipal finance issues. MTE is not responsible to the municipality, nor to any other party for damages arising based on incorrect data or due to the misuse of the information contained in this study, including without limitation, any related, indirect, special or consequential damages.
© 2010 Municipal Tax Equity (MTE) Consultants Inc. 3
TABLE OF CONTENTS
INTRODUCTION .................................................................................................... 1
Overview ...................................................................................................................... 1
Scope Limited to Municipal Policy Options ................................................................... 2
PART ONE: QUALITATIVE ISSUE OVERVIEW .............................................................. 3
Distinguishing Among Different Types of Multi-Unit Residential Complexes ................. 3
Differential Tax Treatment – Municipal Tax Ratios ....................................................... 3
Inter-Municipal Comparison .......................................................................................... 5
Multi-Residential Tax Rates for Municipal vs. Education Purposes ............................... 8
Differing Assessment Methodologies and Value Considerations .................................. 8
Impacts of Market Update and Tax Ratio Considerations ............................................. 9
PART TWO: MEASURING RELATIVE TAX BURDEN – QUANTITATIVE ANALYSIS ............... 12
Methodological Considerations ................................................................................... 12
Per Unit Assessment and Tax Analysis ...................................................................... 18
Per Square Foot Assessment and Tax Analysis ......................................................... 22
Summary of Core Quantitative Findings ..................................................................... 24
New Multi-Residential Property Class ......................................................................... 25
PART THREE: TAX RATIO SENSITIVITY ANALYSIS .................................................... 27
Moving Tax Ratios ...................................................................................................... 27
Sensitivity Analysis ..................................................................................................... 28
CONCLUSION AND NEXT STEPS ............................................................................. 31
Summary of Study Observations and Findings ........................................................... 31
Potential Next Steps and Further Analysis.................................................................. 32

© 2010 Municipal Tax Equity (MTE) Consultants Inc. 1
INTRODUCTION Overview Each year upper and single-tier municipalities in the Province of Ontario are charged with the task of establishing a host of property tax policies to apportion the tax burden both within and between tax classes. Of the myriad challenges created by this responsibility, the City of Ottawa has for several years been particularly interested in the tax burden borne by multi-residential properties and this relationship to properties classified and taxed as residential. For the 2005 tax year, the assistance of Municipal Tax Equity (MTE) Consultants Inc. was enlisted to augment the body of research available for the consideration of Council surrounding this issue, and to assist the City in evaluating the tax situation of comparable higher density residential units/properties that are classified and treated differently for tax purposes. The results of MTE’s initial research project were released in April of 2005 in a report entitled “Comparing the Tax Burden of Multiple-Unit Residential Properties: City of Ottawa”. In April of 2006, MTE prepared and published an update to the original report to demonstrate changes in property tax circumstance for the 2006 tax year attributable to the province-wide reassessment campaign, which was based on a January 1, 2005 effective valuation date. Municipal Tax Equity (MTE) Consultants Inc. has once again been engaged to update our research efforts in respect of this issue, and to assist the City in evaluating current tax circumstances. In order to fully explore the issue and to illustrate the potential implications of any changes to the City’s current tax policy regime, MTE has prepared the following report to systematically address a number of key questions, which include: 1. How are different multi-unit residential properties treated under Ontario’s assessment
and property tax system? 2. What flexibility do municipalities have in apportioning the taxes between types of
properties? 3. Are all multi-unit residential buildings being taxed at similar levels, or are there
differences/inequities in tax burden depending on ownership type and classification? 4. What are the potential impacts of adjusting the tax ratio for the multi-residential
property class? In order to comprehensively address these questions, and to provide City staff and decision-makers with an understanding of the implications of tax ratio changes, the study has been organized into three distinct sections, each of which examines a unique aspect of the issues and policy challenges at hand. Part 1: Qualitative Issue Overview Part One of the report provides a qualitative overview of how different multi-unit residential properties are assessed and taxed in Ontario. In this section, Provincial rules

© 2010 Municipal Tax Equity (MTE) Consultants Inc. 2
and policies, as well as the local tax policy regime within the City of Ottawa, are considered. The discussion addresses such specific issues as: The definition and distinction in Ontario’s property tax system of multi-residential
(MT), new multi-residential (NT), and condominium (RT) properties; Differences in assessment methodologies that are applied to residential and multi-
residential properties, and general value considerations; Municipal tax ratio flexibility and options, and the specific tax policy regime currently
being applied within the City of Ottawa. The local regime is described and ratios, rates and general policy options are compared among select Ontario municipalities; and
Differential treatment of multi-residential tax rates for municipal and education purposes (uniform residential education rate vs. variable municipal tax rates).
Part 2: Measuring Relative Tax Burden – Quantitative Analysis Within this section, MTE examines the relative tax burden borne by various types of multi-unit residential properties. Because potential differences in taxation between multi-residential and condominium properties cannot simply be evaluated based on the tax ratios and rates applied to each type of property, this study looks at the tax levy on a broad sample of properties relying on both per unit and per square foot measures of tax liability for comparative purposes. Part 3: Tax Ratio Sensitivity Analysis In order to provide a well rounded discussion and overview of the issues at hand, Part Three of the report provides a sensitivity model to highlight the potential impacts of altering the current tax ratio scheme. Under this scenario, MTE has estimated the inter-class tax shifts that may be anticipated if an alternate ratio were to be applied to the multi-residential class based on 2009 assessment and budget circumstances for municipal purposes. In addition to these three core components of the study, MTE has also prepared a general conclusion to highlight and summarize the most critical qualitative and quantitative findings. Where avenues of additional study have been identified, suggestions in respect of possible next steps are included. Scope Limited to Municipal Policy Options The purpose and mandate of this study is to provide an update to the earlier studies previously undertaken by MTE in respect of these issues, and to further advance an understanding of the issues that are relevant to establishing a fair and equitable tax ratio for the multi-residential class in relation to the residential tax class. The ultimate goal is to support Council in making enlightened decisions regarding the elements of the property tax regime that are within the scope of their authority. It has been designed and drafted to examine the prevailing issues within the context and scope of local decision making responsibilities and powers. It does not, and is not intended to, address more fundamental questions regarding the appropriateness of property taxation in general.

© 2010 Municipal Tax Equity (MTE) Consultants Inc. 3
PART ONE: QUALITATIVE ISSUE OVERVIEW Distinguishing Among Different Types of Multi-Unit Residential Complexes
All properties in Ontario are taxed based on their current value assessment (CVA), multiplied by the applicable tax rates for municipal and education purposes. The manner in which a property is assessed and the tax rate that it will attract depends on the property class that it is assigned to on the assessment roll. Properties in the multi-residential, commercial and industrial tax classes are also subject to the mandatory, province-wide tax capping protection program, which may further affect individual property tax levels. Multi-unit residential properties can be considered all those made up of multiple, self-contained units used for residential purposes; they may take the form of townhouses, row-houses, converted or divided single family homes, or more traditional apartment buildings. However, in accordance with the provisions of Ontario Regulation 282/98, multi-unit residential complexes will be categorized into one of three property classes and as such, will receive different assessment and taxation treatment depending on whether they are classified as residential (RT), multi-residential (MT) or new multi-residential (NT). Multi-unit residential buildings with six or fewer units fall into the residential property class. Condominiums, however, regardless of the size of the building or development, or the ownership of the unit(s), are also classified as residential because title to each unit is individually held. For a building to be placed in the multi-residential property class it must contain seven or more residential rental units and title must be held under single ownership. The new multi-residential class is an optional property class that each upper or single-tier jurisdiction may employ in order to provide differential treatment to new properties that would otherwise default into the traditional multi-residential property class. Once a municipality adopts the new multi-residential class, and a building is designated as such, that property retains the classification for a period of 35 years. The central issue to be addressed within this report is the distinction between buildings assessed and taxed as multi-residential properties, and those classified as condominiums. In the purest sense, this distinction is intended to reflect the typical ownership and occupancy patterns of these two types of property based on the premise that a multi-residential building is owned by an entity, which is engaged in the business of renting residential units, while condominiums are owned individually and normally owner-occupied. This is reflected in the current Provincial policy regime under which multi-residential properties are treated more like business class properties, in terms of both assessment and taxation, while condominiums are treated in the same manner as other residential properties. Differential Tax Treatment – Municipal Tax Ratios
Property taxes are based on the assessed value of a property multiplied by the applicable tax rates for municipal and education purposes. While education rates for properties in the multi-residential, new multi-residential and residential classes are

© 2010 Municipal Tax Equity (MTE) Consultants Inc. 4
uniform, tax rates for municipal purposes can and do vary by class based on a system of tax ratios. The tax ratio for a class expresses the relationship of the class’s tax rate to the rate applicable to the residential class, which is the base for determining all other rates. Each year upper and single-tier municipalities are required to establish tax ratios for all prescribed and any optional classes via by-law. Established ratios will ultimately govern the relationship between the rate of taxation for each affected class and the tax rate for the residential property class. The tax ratio for the residential class is legislated at 1.0, while the farm and managed forest classes have a prescribed tax ratio of 0.25. The farm ratio may be reduced to a level of 0.0, however, any reduction only applies to the municipal portion of the tax bill. In setting tax ratios for all other property classes, municipalities must do so within guidelines prescribed by the Province. Council may choose to adopt either the current tax ratio for any class, or establish a new tax ratio for the year that is closer to or within the Range of Fairness, as shown in Table 1.
Table 1 City of Ottawa 2009 Tax Ratios and Provincial Limits
Realty Tax Class 2009 Tax
Ratios
Ranges of Fairness Threshold Ratios
Lower Limit
Upper Limit
Threshold Subject to
Levy
Restriction
Residential 1.000000 1.0000 1.0000 - -
New Multi-Residential 1.000000 1.0000 1.1000 - -
Multi-Residential 1.700000 1.0000 1.1000 2.74 No
Commercial- Broad Class 2.163992 0.6000
1.1000
1.98
Yes
Commercial Residual 2.056746
Shopping Centre 1.710810
Office Building 2.484783
Parking Lot 1.347621
Industrial - Broad Class 2.540956 0.6000
1.1000
2.63
No
Industrial Residual 2.699963
Large Industrial 2.318575
Farm 0.200000 0.0000 0.2500 - -
Managed Forest 0.250000 0.2500 0.2500 - -
Pipeline 1.541311 0.6000 0.7000 - -
In addition to these two standing options, municipalities have also been provided with increased tax ratio flexibility in each of the last three reassessment cycles (2004, 2006 and 2009). To assist municipalities in countering inter-class tax shifts, which are an inevitable impact of reassessment, the Province has provided avenues by which maximum ratios could be reset to maintain the distribution of the tax burden at pre-reassessment levels on a class by class basis. While this option presented the City of Ottawa with the opportunity to increase the multi-residential tax ratio in 2004, 2006 and 2009 Council chose not to increase the ratio in these tax years.

© 2010 Municipal Tax Equity (MTE) Consultants Inc. 5
In contrast, the City of Ottawa has undertaken a deliberate and concerted effort to reduce its multi-residential tax ratio over the past several years. This is evident in reviewing Table 2 below, which shows that the City has reduced this ratio on a consistent basis since amalgamation occurred in 2001. Prior to amalgamation, a ratio of 2.3359 applied to the multi-residential class across the former Region of Ottawa-Carleton.
Table 2 City of Ottawa Multi-Residential Tax Ratio History
Tax Year (s) Multi-Residential
Tax Ratio
Revenue Neutral
Ratios
1998, 1999 and 2000 (pre-amalgamation) 2.3359 N/A
2001, 2002 and 2003 2.1780 N/A
2004 2.1520 2.373000
2005 2.1520 N/A
2006 1.8000 1.844983
2007 1.8000 N/A
2008 1.7500 N/A
2009 1.7000 1.754268
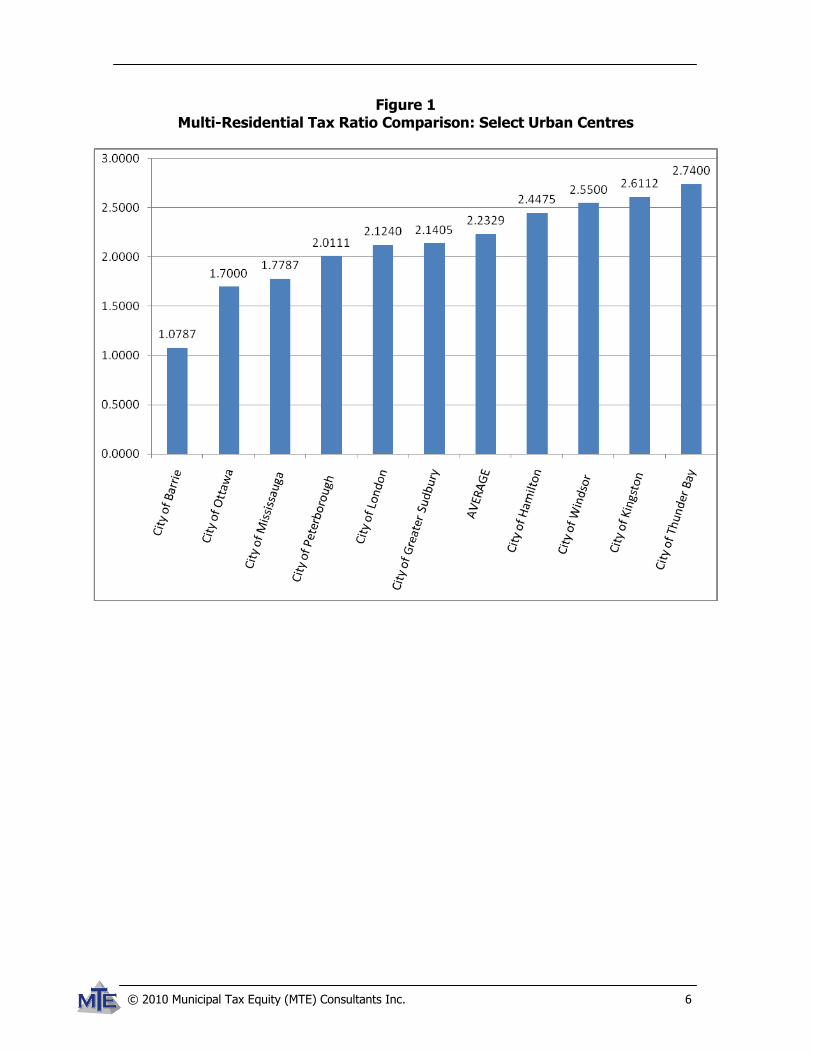
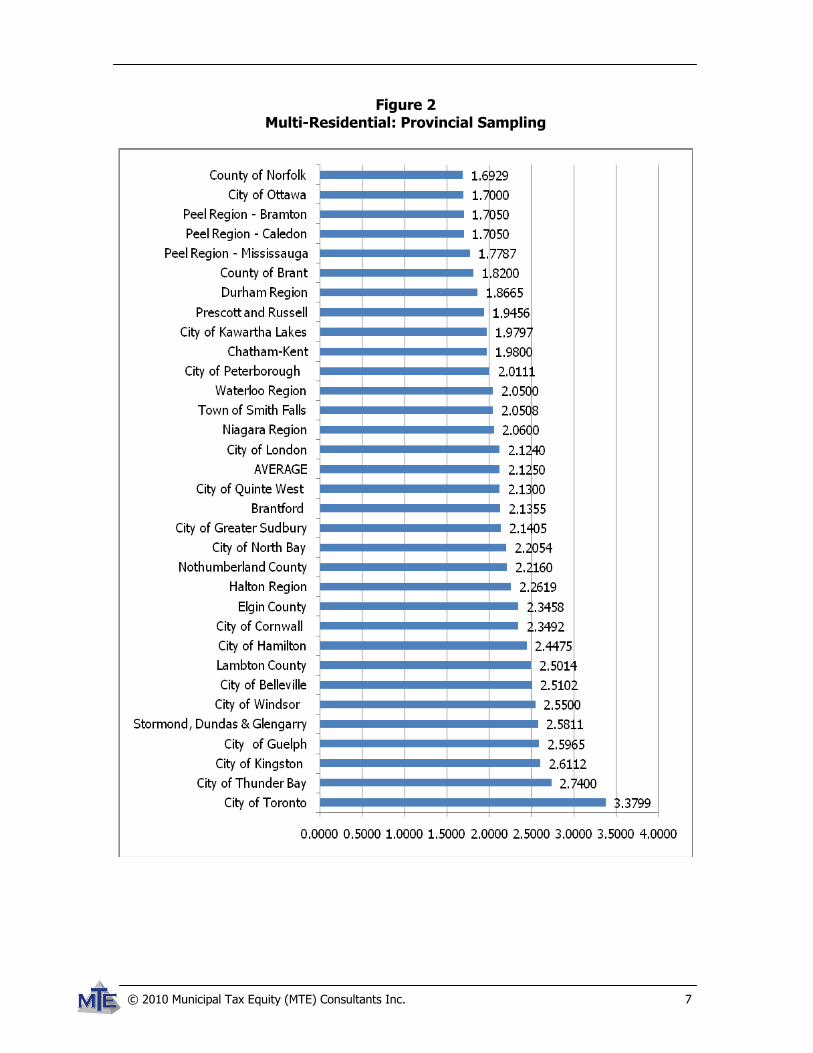
Since the 2002 taxation year, the City has also maintained the new multi-residential property class, and consistently applied a tax ratio of 1.0 throughout the intervening years. Inter-Municipal Comparison A survey of multi-residential tax ratios from other single and upper-tiers across the province demonstrates that Ottawa’s current multi-residential tax ratio of 1.7000 is quite low in comparison to the average ratio applied in other key urban centres and across the broader sample group. Further, Ottawa’s multi-residential ratio falls well below the Provincial Threshold (Average) Ratio for the class of 2.74 as prescribed by the Ontario Regulation 73/03, and is only higher than a small sampling of other municipalities. This is demonstrated in Figures 1 and 2. The first provides a comparison against other key urban municipalities located throughout the province. Figure 2 benchmarks the City’s ratio in relation to a broader cross-section. Regardless of whether or not a differential should exist between the residential and multi-residential tax ratios, when the City’s multi-residential tax ratio circumstance is compared to other jurisdictions, the tax ratio in Ottawa does appear to be very modest in comparison to prevailing trends witnessed across Ontario.
© 2010 Municipal Tax Equity (MTE) Consultants Inc. 6
Figure 1 Multi-Residential Tax Ratio Comparison: Select Urban Centres
© 2010 Municipal Tax Equity (MTE) Consultants Inc. 7
Figure 2 Multi-Residential: Provincial Sampling

© 2010 Municipal Tax Equity (MTE) Consultants Inc. 8
Multi-Residential Tax Rates for Municipal vs. Education Purposes As previously noted, the tax rate for education purposes is constant across the residential, multi-residential and new multi-residential classes. These classes are subject to the uniform residential education rate that applies province-wide. Table 3 below illustrates the differential in tax treatment in terms of the tax rates that are applied to properties in each of the residential and multi-residential classes.
Table 3
2009 Municipal and Education Tax Rates and Ratios
Jurisdiction Residential and
New Multi-Residential
Rate
Multi-Residential
Rate Tax Ratio
Total Urban Rate 1.004472% 1.707604% 1.7000
Education 0.252000% 0.252000% 1.0000
Total 1.256472% 1.959604% 1.5596
As can be seen, the 2009 municipal tax rates for the multi-residential class are 1.7 times higher than those for the residential and new multi-residential property classes. As the education rate for all classes is uniform, the overall net multi-residential ratio is 1.5596. Therefore, on every dollar of CVA, a multi-residential property will be subject to approximately 1.5596 times the rate of taxation than a dollar of residential CVA; this represents the final ratio of tax rates between these classes. The net ratio for the new multi-residential class is 1.0. Differing Assessment Methodologies and Value Considerations
In addition to the differential in tax treatment among these classes, the manner in which the different types of properties are assessed must be considered. Multi-residential and new multi-residential properties (i.e. with 7 or more rental units) are assessed by the Municipal Property Assessment Corporation (MPAC) using the income capitalization approach. This practice involves evaluating the income stream, or revenue generated from rents paid by occupants of the building. Location, building age and condition are also considered. Condominiums and residential properties with fewer than seven units are assessed by MPAC using the sales comparison approach to valuation. That is, sales data of similar properties are used to determine the assessment of a property; this is consistent with the practice employed to estimate the value of single unit residential properties. The two differing approaches can and do result in different values for properties that may be similar or nearly identical in terms of physical characteristics. This approach is strongly supported by the appraisal community, which maintains that purchasers of multiple unit buildings are very different from those looking to buy an individual unit, hence the appropriateness of a different valuation technique. In the latter instance, because of the greater number of buyers possible for a single unit than an entire

© 2010 Municipal Tax Equity (MTE) Consultants Inc. 9
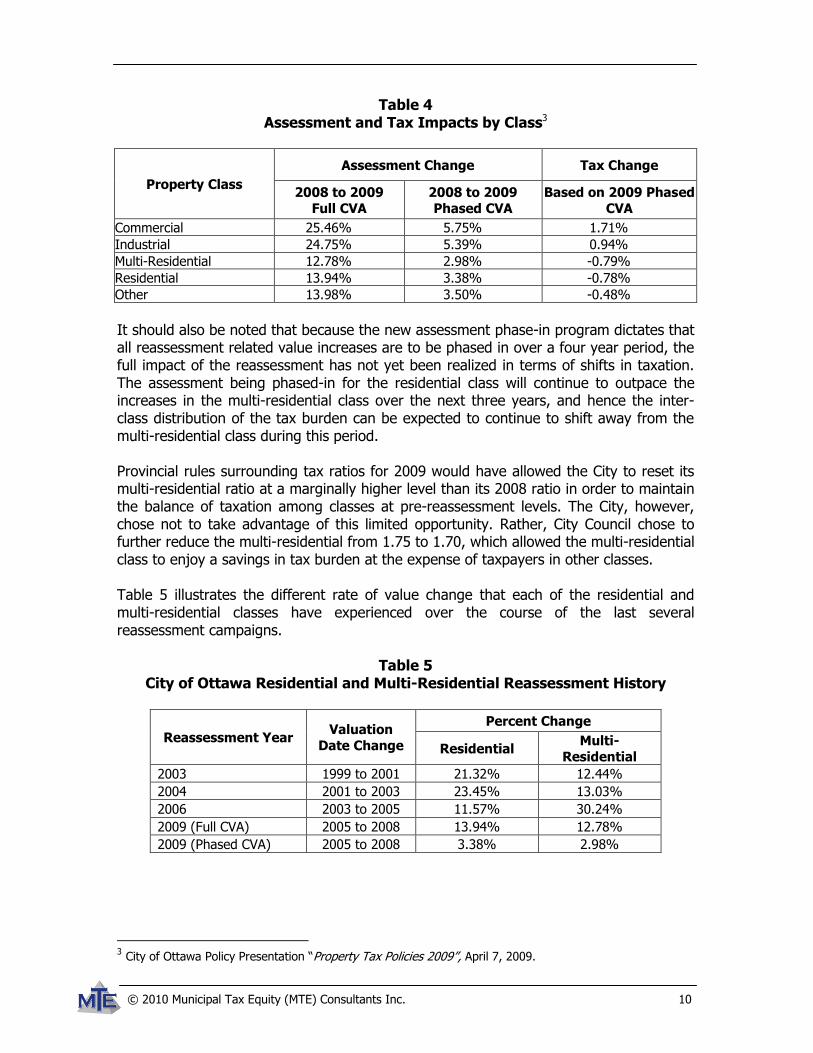
building, the market value/purchase price for condominiums will be higher. Moreover, potential purchasers would require “discounts” if purchasing blocks of units.1 A court decision in Alberta with respect to this issue (City of Calgary v. Lougheed & Company, 2001, ABOB 371), which maintained that differences in valuation treatment for assessment purposes should not be permitted between these two types of property, has been hotly refuted by the appraisal community, which argues that analogous assessment treatment of apartments and condominiums is in “contradiction with standard assessment practice of a fair and equitable burden of taxation”.2 The different assessment methodology used for the valuation of multi-residential properties and residential properties can offset any differences in tax rates or intensify their affect. This is one of the primary questions to be addressed in this study. Is the bottom line tax burden of similar properties that are subject to different tax and assessment treatment equitable? Does the assessment methodology result in an offsetting of the higher multi-residential tax rate? As this study bears out, differing tax rates do serve as a method to adjust or compensate for the diverse assessment methodologies used to determine values for these two types of property. Regardless of the appraisal technique employed, assessed values have been shown to be highly variable. Looking at trends over the last several reassessment campaigns supports this, and clearly demonstrates that multi-residential and residential properties are distinct in the market place. These differences are reflected not only in the actual value of the properties, but by their rate of change at the class level. The specifics of this phenomenon are explored in greater detail in the next section of this report. Impacts of Market Update and Tax Ratio Considerations In theory, when a market update or reassessment occurs, the new values assigned to properties reflect changes in the market value of property that have occurred during the period of time that has elapsed since the previous reassessment. Because real estate market conditions vary for different types of properties, it can be anticipated that each class of property within the municipality will experience a unique rate of assessment change with each reassessment. Because the rate of change will be inconsistent from property class to property class, the proportion of total assessment (CVA) held by each class will change and shift in response. These reassessment related changes will inevitably result in tax shifts between individual properties and among tax classes. The following two tables effectively demonstrate this phenomenon. Table 4 demonstrates that different rates of assessment change among classes will necessarily alter the balance of taxation among those classes. The volatility of this relationship is enhanced by the fact that each class is subject to different rates of taxation.
1 Wyton, Randy. “Assessment of multi-family condominium and rental property”. Canadian Appraiser, 2003, pages 42-45. 2 Ibid.
© 2010 Municipal Tax Equity (MTE) Consultants Inc. 10
Table 4 Assessment and Tax Impacts by Class3
Property Class
Assessment Change Tax Change
2008 to 2009
Full CVA
2008 to 2009
Phased CVA
Based on 2009 Phased
CVA
Commercial 25.46% 5.75% 1.71%
Industrial 24.75% 5.39% 0.94%
Multi-Residential 12.78% 2.98% -0.79%
Residential 13.94% 3.38% -0.78%
Other 13.98% 3.50% -0.48%
It should also be noted that because the new assessment phase-in program dictates that all reassessment related value increases are to be phased in over a four year period, the full impact of the reassessment has not yet been realized in terms of shifts in taxation. The assessment being phased-in for the residential class will continue to outpace the increases in the multi-residential class over the next three years, and hence the inter-class distribution of the tax burden can be expected to continue to shift away from the multi-residential class during this period. Provincial rules surrounding tax ratios for 2009 would have allowed the City to reset its multi-residential ratio at a marginally higher level than its 2008 ratio in order to maintain the balance of taxation among classes at pre-reassessment levels. The City, however, chose not to take advantage of this limited opportunity. Rather, City Council chose to further reduce the multi-residential from 1.75 to 1.70, which allowed the multi-residential class to enjoy a savings in tax burden at the expense of taxpayers in other classes. Table 5 illustrates the different rate of value change that each of the residential and multi-residential classes have experienced over the course of the last several reassessment campaigns.
Table 5 City of Ottawa Residential and Multi-Residential Reassessment History
Reassessment Year Valuation
Date Change
Percent Change
Residential Multi-
Residential
2003 1999 to 2001 21.32% 12.44%
2004 2001 to 2003 23.45% 13.03%
2006 2003 to 2005 11.57% 30.24%
2009 (Full CVA) 2005 to 2008 13.94% 12.78%
2009 (Phased CVA) 2005 to 2008 3.38% 2.98%
3 City of Ottawa Policy Presentation “Property Tax Policies 2009”, April 7, 2009.

© 2010 Municipal Tax Equity (MTE) Consultants Inc. 11
These differentials in market change, as witnessed over the last few reassessment cycles, have triggered ongoing changes to the balance or difference in taxation between condominiums and traditional multiple unit residential properties as market/assessed values of property respond and are updated over time. It is important to note that the relationship between the rate of change among the classes differs significantly from reassessment to reassessment. This is a critical observation when contemplating an “appropriate” tax ratio for the multi-residential class because it solidifies the fact that the relationship between these two classes is not static and is also somewhat unpredictable. A tax ratio that might seem appropriate in one year could exacerbate the impact of reassessment in the next, and/or produce a counter intuitive result. As tax ratio movement does carry with it a degree of permanence, Council may not possess the ability to alter tax ratios at their discretion in order to maintain the desired relationship in the future. Revisiting these trends from past reassessments helps to demonstrate that not only do tax relationships among classes change from year to year, attempting to balance the tax burden by moving tax ratios can be problematic. The assessment and the tax relationship among classes is a moving target; what appears to be the correct ratio to compensate for assessment changes in one year, could serve to compound or offset future trends.

© 2010 Municipal Tax Equity (MTE) Consultants Inc. 12
PART TWO: MEASURING RELATIVE TAX BURDEN – QUANTITATIVE ANALYSIS Methodological Considerations Acknowledging that differences in both taxation and assessment treatment exist, comparing the relative tax burden between traditional multi-residential properties and other multi-unit residential properties is not an easy task. Because of the distinct treatment each type of property receives, differences in taxation between multi-residential and condominium properties cannot be evaluated solely on a straight CVA comparison or the effective tax rate applied to each type of property. Rather, it is the actual, final tax liability of the properties in question that must be considered. Many attempts have been made to examine these issues in a variety of ways across many jurisdictions. Earlier efforts have included trying to identify properties in both classes that are sufficiently similar to validate direct comparison of relative tax burdens; other methods have tried to establish proxy assessment values for rented condominium units based on the methodology used to assess multi-residential properties. In some jurisdictions, were sufficient data has been available, analysis has included a review of buildings that have been converted from multi-residential to condominium. In these efforts, the analysis has focused on comparing the assessment and tax burden, on a per unit or per building basis, before and after the conversion. For the purposes of this study, and earlier efforts undertaken on behalf of the City, MTE has chosen to base the assessment and tax comparisons on a per unit and a per square foot basis. As with other methodologies utilized or contemplated for comparing the relative tax burden between these different types of residential properties, there are limitations associated with these approaches, however, we assert that these methodologies do effectively overcome a number of the critical obstacles associated with this specific analytical challenge. Of paramount importance is the ability to establish units of measurement that are consistent across all types of property under discussion. The per unit and per square foot approaches are relatively effective at meeting this challenge. In order to assist in illustrating why MTE has relied on the methodologies employed herein, the following is a general discussion of some of the other methodologies that have been used and proposed in regards to the comparison of relative tax burden between traditional multi-residential properties and condominiums. Each has been used or suggested as either the foundation for, or to supplement, a similar investigation. As well as briefly describing each approach, we will also highlight some of the key limitations, or weaknesses that MTE believes are inherent in each, which preclude them from being viable models. For ease of reference, and to facilitate a comparative view among the various methods, we have also include a Strengths and Weaknesses matrix at the end of this section, which provides a high-level comparison of the various approaches.
Per Dollar (dollar unit) of Assessment Comparing the taxes paid on each dollar of CVA or a set CVA value would be the most simplistic method of comparing the taxes between traditional multi-residential buildings and condominiums, however, no real insight can be gained by such an analysis as it

© 2010 Municipal Tax Equity (MTE) Consultants Inc. 13
would give no consideration to the types of properties being compared, or more importantly to the differential assessment methodologies applied to each property. Such an exercise would be equivalent to a simple comparison of the tax rates for each class, and would not provide any insight into actual relative tax burden.
Comparing Similar Building/Units Under this simplistic approach, the analytical task would involve identifying a sample of properties there were deemed to be “similar”, but classified into different property classes. For example, one might choose to compare two eight unit buildings on the same street with similar physical characteristics, where one is assessed and taxed as a multi-residential property and one as a condominium. This approach, while relatively straight forward, does not take into account a number of critical variables, such as assessment methodology, that must be considered as part of a valid comparison of relative tax liability. In addition, one the most limiting aspects of this approach is related to the difficulties involved in identifying equivalent buildings or units that are sufficient in number to form a robust and representative sample group. Consequently, these types of comparisons have not proven to be effective or compelling. Condominium Conversions: Pre vs. Post Conversion As part of developing and executing an investigation into the relative tax treatment of multi-residential and multi-unit condominium properties, it can be beneficial to add a layer of analysis to examine the manner in which the Municipal Property Assessment Corporation (MPAC) has treated properties converted from traditional multi-residential buildings to condominiums. Reviewing the circumstances surrounding such conversions can allow the analyst to consider the actual assessment treatment of a single property under the two differing assessment methodologies. Specifically, the value relationship before and after conversion can explicitly demonstrate how the difference in assessment method utilized for properties coded as condominium vs. multi-residential will produce different values for taxation purposes that may offset or exacerbate the disparity between the tax rate for municipal purposes. The key limitations and difficulties involved with this approach relate to the availability of sample properties and data. MTE has utilized this approach to supplement our analysis in other jurisdictions, but it has only been practical where a significant number of conversions have occurred. Further, the circumstances of each conversion can complicate such analysis. If the property undergoes significant renovations and upgrades as part of the conversion process, it reduces that property’s appropriateness for the sample. Proxy Assessment Values Other efforts have been undertaken to calculate proxy assessment values using rental data from a subjectively selected sample of buildings, analysts have attempted to estimate the CVA that MPAC would place on the buildings if they were classified and assessed as multi-residential. A comparison is then made between the actual (condominium) taxes paid on the building, and the hypothetical multi-residential taxes that have been calculated using the proxy assessments. In addition to this methodology being highly dependent on information from the landlord, it also requires a great deal of information and expertise be called upon if the

© 2010 Municipal Tax Equity (MTE) Consultants Inc. 14
proxy assessments are to be considered appropriate and representatives. MPAC employs a very sophisticated system for the assessment of multi-residential properties, and simply relying on a selection of the main elements of that methodology, cannot be expected to produce reliable results. Further, due to the information requirements, and the fact that this can only be done for condominium properties where the units are rented as traditional multi-residential units, the sample will necessarily be extremely limited and may not be representative of the broader condominium stock. Sales Analysis A review of sales values in comparison to assessed values can lend a specific layer of insight to an investigation of this nature. For example, if the results of a sales to CVA analysis were to indicate that multi-residential properties were being systematically assessed at 80% of actual market value, it could be argued that the tax being calculated against the CVA values, already represents a reduced tax burden. In and of itself, this does not represent a viable approach to comparing the relative tax burden between the two types of properties, however, it can indicate if the assessment system itself or the quality of specific assessment values are exacerbating, or mitigating the final differential. Per Unit Assessment and Tax Analysis A comparison of assessment and taxes on a per unit basis can be an effective strategy for overcoming the differences in assessment methodology and tax rates applied to these two types of properties. One of the great strengths of this approach is that it allows for a large or even universal sample of properties to be employed, which overcomes the challenges and limitations posed by many of the other methodologies discussed above where insufficient or subjective samples are being used. The only significant variable that this methodology does not explicitly address is differential in unit sizes. Per Square Foot Assessment and Tax Analysis MTE asserts that one of the most effective methods of comparison is one based on taxes per square foot. Adopting this approach overcomes any concerns about finding identical buildings, and/or units within. It also permits quantification of property tax liabilities and differences in tax burden for an extensive and robust sample of affected properties in the City of Ottawa in both the multi-residential and residential classes, effectively overcoming the many concerns and limitations related to defining what constitutes “comparable buildings”. The specific application of per unit and per square foot analytical models within this study is further discussed in the Study Methodology section below.

© 2010 Municipal Tax Equity (MTE) Consultants Inc. 15
Methodology Matrix Comparative
Methodology Main Strengths Main Weaknesses
Per Dollar (dollar unit)
of Assessment
- Simplistic, does not require any property specific
information
- Does not address any factor other than tax rate differential
- No real comparative value
Comparing Similar Buildings/Units
- Can be undertaken with minimal data & limited property information
- Simplistic methodology and easy to execute
- Limited availability of “comparable” properties may result in small sample size
- Results cannot be taken as representative of entire property population
- May involve subjective judgments regarding “comparability”
Condominium Conversions
- Can overcome challenges related to finding similar properties
- Provides empirical evidence of how one property is
actually treated for assessment and tax purposes under the two classifications
- Sample size may be too limited to draw conclusions - Where condition of property has changed as part of
conversion, a direct comparison may not be possible
Proxy Assessment
Values
- Can overcome challenges related to finding similar properties
- Requires a disclosure of property and financial information by landlord,
- Limited to condominium properties that are fully rented,
- Due to these two points, property selection is generally very limited and subjective
- It is difficult to “re-create” the sophisticated methodology utilized by MPAC
Sales Analysis
- May be of assistance in determining if the assessment
system / assessment quality is responsible for any differential in taxation
- Cannot be relied on solely to explain or measure
differentials in tax treatment
Per Unit Assessment
and Tax Analysis
- Very objective
- When used with a large, or universal property sample, it
overcomes many challenges related to sample size, sample selection, and comparability of specific properties
- Does not explicitly account for differences in unit size or
quality
- Requires access to a large volume of assessment and tax data
Per Square Foot
Assessment and Tax Analysis
- Marked by all the strengths of per unit analysis, plus
- Assists in overcoming differences in unit size
- Requires access to a large volume and wide range of
assessment data, including square foot details that are not available in every jurisdiction
- Does not explicitly account for differences in unit quality

© 2010 Municipal Tax Equity (MTE) Consultants Inc. 16
Study Methodology A review of the preceding matrix quickly reveals that there is no one methodology that will perfectly account for all variables and that can be held up as the one “correct and precise” model to be employed for such an exercise. MTE does, however, believe that the combination of applying both a per unit and per square foot comparison models does provide a solid foundation for analysis. The following is a more detailed explanation of these approaches, and how they have been applied within this study. The quantitative results presented in this section include:
1. Assessment ratios to illustrate any value differences among multi-residential and condominium properties on a per unit/per square foot,
2. Average per unit/per square foot assessment and tax liabilities, and differentials among the various property types, and
3. Effective tax ratios to achieve per unit/per square foot tax parity. The central analytical models set out below are based on 2009 actual tax rates and assessment, however, as this report represents an update to work undertaken in previous years, results in respect of 2004, 2005 and 2006 have also been included. The results shown for 2004 and 2005 match those published in previous studies, while the 2006 tax details have been updated based on actual tax rates, which were ratified after the publication of the previous update in April of that year. Incorporating these prior year results not only assists in relating this report to previous analytical efforts, it also serves to address and highlight the fact that these relationships are subject to change as assessment and tax rates vary from year to year. Further, these particular years effectively cover the three most recent valuation cycles, and provide a perspective on how the variables have behaved in relation to one another over a six year period. Because of the City’s unique access to a complete and comprehensive database containing relevant information for all property potentially affected by Council’s tax policy decisions – namely, the assessment roll – it has been possible to quantify property tax liabilities and differences in tax burden, if any, for a significant number of properties in the City coded as multi-residential and condominium, rather than a select or very limited sample group. The availability of and capacity to analyze such a comprehensive dataset has allowed this study to overcome some of the analytical challenges or obstacles faced by other stakeholders with more restricted information access and/or limited analytical ability. To appropriately measure the relative property tax burden of properties that are similar in nature and character, it was necessary to carefully identify the property types being examined. After much review and consideration, the properties included in this study have been refined to those with the property codes of 340 (multi-residential, with more than six self-contained units, excluding row housing), 341 (multi-residence, more than six self-contained units: with small commercial unit(s)), 336 (residential property with six self contained units) and 370 (residential condominium) on the assessment roll as returned for each year under examination. Selecting on the basis of these criteria provides a uniquely robust sample on which to base this analysis. This method circumvents the challenges and inherent weaknesses posed by using a data set that has been generated by selecting specific properties based

© 2010 Municipal Tax Equity (MTE) Consultants Inc. 17
on a random sampling method, or a subjective and qualitative judgment regarding comparability. In reviewing the data statistics set out in Tables 6 and 7, it becomes clear that this analysis is more akin to an examination of empirical data, rather than an exercise of statistical analysis and inference. Among the advantages of adopting this approach, it effectively overcomes a myriad concerns and limitations related to defining what constitutes “comparable buildings”.
Table 6
Study Data by Property Class: All Years
Taxation Year Multi-Residential Sample Condominium Sample
2004 38,758 units in 615 buildings 18,408 units
2005 38,612 units in 610 buildings 19,534 units
2006 38,592 units in 609 buildings 20,549 units
2009 38,373 units in 605 buildings 21,581 units
Table 7 2009 Study Data Statistics by Property Code
Property
Class
Property
Code Description
Property
Count
% of Properties
in Class
CVA % of
CVA in
Class
Multi-
Residential 340
multi-residence, more than six self-contained units: does
not include row housing
551 40.60% 2,066,645,485 36.89%
Multi-Residential
341 multi-residence, more than
six self-contained units: with
small commercial unit(s)
54 3.98% 758,510,516 13.54%
Residential 336 residential property with six
self contained units 23 0.01% 11,832,688 0.02%
Residential 370 residential condominium 21,443 8.09% 4,382,917,875 6.09%

© 2010 Municipal Tax Equity (MTE) Consultants Inc. 18
Per Unit Assessment and Tax Analysis One method for overcoming the differential in assessment methodologies and tax ratios/rates to facilitate a comparison between traditional multi-residential properties and condominiums is to calculate the per unit current value assessment (CVA) for both types of properties. For the condominium class, this is accomplished by dividing the sum of the CVA for all condominium properties in the sample by the total number of property units in the data set. For the multi-residential class, the average CVA by unit has been similarly weighted and calculated by:
Step 1: Calculating the per unit assessment based on the number of units contained in
each multi-residential building. While this information can be garnered from the data contained on the assessment roll, there is no explicit expression of per unit assessment.
Step 2: Once the building level breakdown has been completed, the average
assessment per unit is calculated by dividing the total CVA for all sample multi-residential properties by the total number of units identified in Step 1.
The results of this exercise are set in Table 8 for the 2004, 2005, 2006 and 2009 taxation years respectively. For each year, MTE has set out the per unit CVA for both condominium and multi-residential properties and also the ratio of CVA, which is an expression of the relationship between the two unit types. The ratio of CVA has been calculated by dividing the average condominium CVA by the average multi-residential CVA.
Table 8 Average CVA Per Unit
Tax Year
Average CVA Per Unit
Condominium Multi-Residential Assessment Ratio
(Condo/MR)
2004 171,375 55,031 3.114154
2005 173,187 55,059 3.145480
2006 188,043 71,604 2.626152
2009 203,640 73,624 2.765946
In order to confirm the appropriateness of these average values, and to verify that they have not been skewed by outlier unit values within the sample population, MTE has plotted the distribution of unit values across the City’s assessment base. Figures 3 and 4 demonstrate that unit values are normally distributed across the sample.

© 2010 Municipal Tax Equity (MTE) Consultants Inc. 19
Figure 3 2009 Distribution of Residential Condominium Properties by CVA Per Unit
Figure 4 2009 Distribution of Multi-Residential Properties by CVA Per Unit

© 2010 Municipal Tax Equity (MTE) Consultants Inc. 20
As the City maintains a fairly sophisticated regime of general purpose and special area tax rates, calculation of the average taxes per unit required that an actual tax calculation be undertaken for each property in the data set using the City’s Total Urban tax rate. Once this was completed, the average taxes per unit were calculated using the same methodology employed for calculating average CVA’s per unit, with the exception that the total tax amount was used as the numerator in the equation rather than total CVA. The results of this exercise are reported as average taxes per unit for both municipal and education tax purposes. Table 9 contains comparisons between the multi-residential and condominium samples for all of the subject taxation years. Of critical significance in these tables is the tax per unit ratio, which has been calculated by dividing the average per unit tax for multi-residential by the average per unit tax for condominiums. This is an effective demonstration of the relationship between the taxes paid on a multi-residential unit in comparison to a condominium unit. These results are further elucidated, and the differential impact of the municipal and education rates highlighted, when the total levies are set out in detail in Table 9.

© 2010 Municipal Tax Equity (MTE) Consultants Inc. 21
Table 9 Average Assessment and Tax Per Unit
2004
Condominium Multi-
Residential
Effective Tax
Ratio
(MR/Condo)
Average CVA By Unit 171,375 55,031
Average Municipal Taxes per Unit $1,692.57 $1,159.72 0.6852
Average Education Taxes per Unit $507.27 $162.89 0.3211
Education + Municipal $2,199.84 $1,322.61 0.6012
2005
Condominium Multi-
Residential
Effective Tax Ratio
(MR/Condo)
Average CVA By Unit 173,187 55,059
Average Municipal Taxes per Unit $1,777.76 $1,206.66 0.6788
Average Education Taxes per Unit $512.63 $162.97 0.3179
Education + Municipal $2,290.40 $1,369.64 0.5980
2006
Condominium Multi-
Residential
Effective Tax
Ratio
(MR/Condo)
Average CVA By Unit 188,043 71,604
Average Municipal Taxes per Unit $1,745.16 $1,196.15 0.6854
Average Education Taxes per Unit $496.43 $189.03 0.3808
Education + Municipal $2,241.59 $1,385.19 0.6179
2009
Condominium Multi-
Residential
Effective Tax Ratio
(MR/Condo)
Average CVA By Unit 203,640 73,624
Average Municipal Taxes per Unit $2,045.50 $1,257.20 0.6146
Average Education Taxes per Unit $513.17 $185.53 0.3615
Education + Municipal $2,558.68 $1,442.73 0.5639
Median CVA By Unit 174,250 70,873
Median Municipal Taxes per Unit $1,750.29 $1,210.22 0.6914
Median Education Taxes per Unit $439.11 $178.60 0.4067
Education + Municipal $2,189.40 $1,388.82 0.6343

© 2010 Municipal Tax Equity (MTE) Consultants Inc. 22
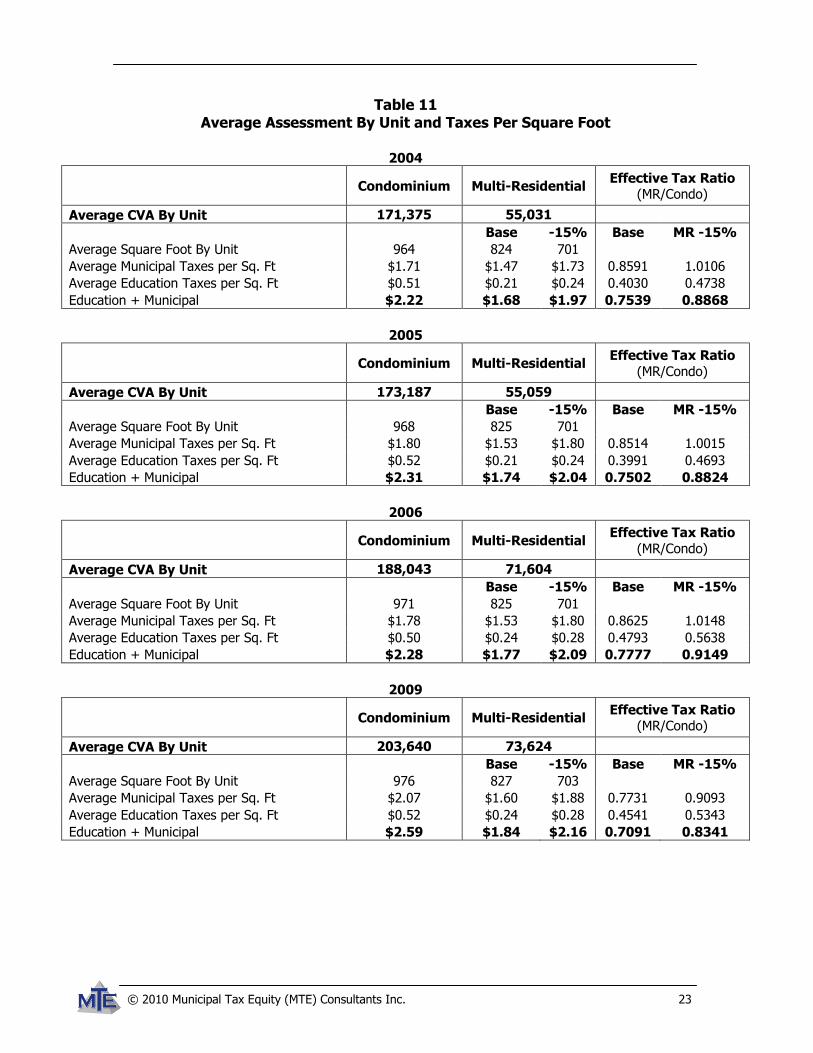
Per Square Foot Assessment and Tax Analysis Taxes calculated on a per square footage basis appears to be widely accepted by practitioners in many sectors as a universal and readily comparable unit of measurement. Because this approach can be applied and substantiated for both types of property in question as part of this study, comparisons have been made on a taxes per square footage basis relying on the City’s Total Urban tax rate. Adopting this approach further overcomes concerns about finding identical buildings, and/or units within. Subsequent to the release of MTE’s first study on this subject for the City of Ottawa in 2005, input was provided from stakeholders within the multi-residential community that a “size adjustment” should be made to the gross building areas extracted from the City’s assessment database as part of the square footage calculations. In response to these concerns, an addendum to the 2005 and 2006 base reports was prepared to illustrate the effect of both a 15% and 20% reduction in the building areas reported for multi-residential property and the relative impact on the study’s results. To support the current analytical efforts, assessment and tax comparisons on a per square foot basis have again been produced based on size adjusted building areas. We have, however, limited this exercise to the 15% reduction scenario as research undertaken by the City to investigate this concern since the publication of our last report indicates that this is the more reasonable of the two scenarios. For purposes of this analysis, MTE has calculated average values for both multi-unit residential and condominium units on the basis of assessment by square foot, and taxes paid by square foot for both municipal and education tax purposes. The results of MTE’s analytical exercise for all subject taxation years are presented in Tables 10 and 11 below.
Table 10 Average CVA Per Square Foot
(Based on Size Adjusted MR)
Tax Year
Average CVA Per Square Foot
Condominium Multi-
Residential Assessment Ratio
(Condo/MR)
2004 178 79 2.264545
2005 179 79 2.277874
2006 194 102 1.895914
2009 209 105 1.992275
© 2010 Municipal Tax Equity (MTE) Consultants Inc. 23
Table 11 Average Assessment By Unit and Taxes Per Square Foot
2004
Condominium Multi-Residential
Effective Tax Ratio (MR/Condo)
Average CVA By Unit 171,375 55,031
Base -15% Base MR -15%
Average Square Foot By Unit 964 824 701
Average Municipal Taxes per Sq. Ft $1.71 $1.47 $1.73 0.8591 1.0106
Average Education Taxes per Sq. Ft $0.51 $0.21 $0.24 0.4030 0.4738
Education + Municipal $2.22 $1.68 $1.97 0.7539 0.8868
2005
Condominium Multi-Residential
Effective Tax Ratio
(MR/Condo)
Average CVA By Unit 173,187 55,059
Base -15% Base MR -15%
Average Square Foot By Unit 968 825 701
Average Municipal Taxes per Sq. Ft $1.80 $1.53 $1.80 0.8514 1.0015
Average Education Taxes per Sq. Ft $0.52 $0.21 $0.24 0.3991 0.4693
Education + Municipal $2.31 $1.74 $2.04 0.7502 0.8824
2006
Condominium Multi-Residential
Effective Tax Ratio
(MR/Condo)
Average CVA By Unit 188,043 71,604
Base -15% Base MR -15%
Average Square Foot By Unit 971 825 701
Average Municipal Taxes per Sq. Ft $1.78 $1.53 $1.80 0.8625 1.0148
Average Education Taxes per Sq. Ft $0.50 $0.24 $0.28 0.4793 0.5638
Education + Municipal $2.28 $1.77 $2.09 0.7777 0.9149
2009
Condominium Multi-Residential
Effective Tax Ratio (MR/Condo)
Average CVA By Unit 203,640 73,624
Base -15% Base MR -15%
Average Square Foot By Unit 976 827 703
Average Municipal Taxes per Sq. Ft $2.07 $1.60 $1.88 0.7731 0.9093
Average Education Taxes per Sq. Ft $0.52 $0.24 $0.28 0.4541 0.5343
Education + Municipal $2.59 $1.84 $2.16 0.7091 0.8341

© 2010 Municipal Tax Equity (MTE) Consultants Inc. 24
Summary of Core Quantitative Findings The results of these two exercises demonstrate that the difference in the assessment methodologies and the values attributable to these two types of property does indeed mitigate the effects of the higher, multi-residential tax rate. For 2009, the average condominium unit is assessed approximately 2.766 times higher than the average multi-residential unit. Results based on the square foot analysis show a similar pattern with each square foot of condominium being assessed at approximately 1.99 times higher than a square foot of multi-residential. Further, these relationship patterns appear to have remained relatively consistent over the last three reassessments, as can be seen in Figure 5.
Figure 5 Assessment and Tax Ratios
Thus, because the average assessed value of a multi-residential unit tends to be less than half of that assigned to the average condominium unit, the higher effective tax rate applied to the multi-residential class is offset. Looking at the results for all years, multi-residential properties are paying less than condominiums. This is clearly demonstrated in Figure 5 where the relationship of actual, effective per unit and per square foot taxes for multi-residential properties are compared against condominium properties across the four sample years.

© 2010 Municipal Tax Equity (MTE) Consultants Inc. 25
New Multi-Residential Property Class Although the central focus of this study is a comparison between condominiums (residential) and traditional multi-residential properties, it is recognized that the City of Ottawa does maintain the new multi-residential property class. As such, it has been deemed appropriate to include a summary of how the results calculated in respect of the multi-residential class compare to those for the new multi-residential class. This comparison was only possible using the per unit level of analysis, as reliable square footage data was not available for the new multi-residential properties. The results of applying this analytical model are summarized in Table 12, which provides a comparison against the results in respect of the traditional multi-residential class.

© 2010 Municipal Tax Equity (MTE) Consultants Inc. 26
Table 12 Average Assessment and Taxes By Unit
2004
New Multi-Residential
Multi-Residential
Effective Tax
Ratio
(MR/NT)
Average CVA By Unit 76,387 55,031
Total Number of Units 226 38,758
Average Municipal Taxes per Unit $754.43 $1,159.72 1.5372
Average Education Taxes per Unit $226.10 $162.89 0.7204
Education + Municipal $980.53 $1,322.61 1.3489
2005
New
Multi-Residential
Multi-
Residential
Effective Tax Ratio
(MR/NT)
Average CVA By Unit 95,930 55,059
Total Number of Units 1,204 38,612
Average Municipal Taxes per Unit $984.72 $1,206.66 1.2254
Average Education Taxes per Unit $283.95 $162.97 0.5739
Education + Municipal $1,268.68 $1,369.64 1.0796
2006
New
Multi-Residential
Multi-
Residential
Effective Tax
Ratio (MR/NT)
Average CVA By Unit 134,517 71,604
Total Number of Units 1,131 38,592
Average Municipal Taxes per Unit $1,248.41 $1,196.15 0.9581
Average Education Taxes per Unit $355.13 $189.03 0.5323
Education + Municipal $1,603.53 $1,385.19 0.8638
2009
New
Multi-Residential
Multi-
Residential
Effective Tax
Ratio (MR/NT)
Average CVA By Unit 129,490 73,624
Total Number of Units 1,559 38,373
Average Municipal Taxes per Unit $1,300.69 $1,257.20 0.9666
Average Education Taxes per Unit $326.32 $185.53 0.5686
Education + Municipal $1,627.01 $1,442.73 0.8867

© 2010 Municipal Tax Equity (MTE) Consultants Inc. 27
PART THREE: TAX RATIO SENSITIVITY ANALYSIS Moving Tax Ratios
As discussed in Part 1 of this report, tax ratios govern the relationship between the rate of taxation for each affected class and the tax rate for the residential property class, which has a Provincially prescribed ratio of 1.0. While tax ratio changes are typically approved to either relieve a tax burden that is perceived to be creating competitive disadvantage or inequity for properties in one or more classes, tax ratio increases are generally approved to re-balance the burden between classes to compensate for reassessment impacts. When considering any tax ratio change, it is absolutely critical to be cognisant of the fact that a change to the tax ratio for any one class will impact the tax burden for properties in all other classes. Therefore, if a ratio reduction for the multi-residential class were to be approved, any tax savings passed onto that class will result in higher tax rates and tax shifts to ratepayers in other classes. These inter-class shifts must be quantified in order to fully understand the scope and magnitude of impacts associated with a ratio change for the multi-residential property class. The actual impact that a tax ratio adjustment for any one class will have on the apportionment of taxes to other classes is dependant on both the quantum of the actual change and the proportion of the overall tax levy carried by the subject class. A ratio change for a class that shoulders a large share of the overall tax burden is going to have a greater impact than the same change made in respect of a class that only carries a modest share of the total burden. As shown in Table 13, the multi-residential property class in Ottawa currently represents approximately 8.3% of the total tax levy and as a result, a change to its tax ratio will have a material impact on the overall taxation landscape. This expectation is confirmed in the results of the sensitivity scenario that follows.

© 2010 Municipal Tax Equity (MTE) Consultants Inc. 28
Table 13 Distribution of CVA and Urban Levy
Realty Tax Class 2009 CVA (Phased)
% of Total CVA
2009 Urban Levy % of Total
Levy
Residential 71,955,393,358 76.43% $722,771,778.77 62.68%
New Multi-Residential 205,580,403 0.22% $2,064,997.59 0.18%
Multi-Residential 5,602,580,953 5.95% $95,669,896.46 8.30%
Commercial 6,772,473,747 7.19% $136,079,648.77 11.80%
Shopping Centre 2,469,603,526 2.62% $41,370,352.97 3.59%
Office Building 4,810,194,162 5.11% $117,138,099.81 10.16%
Parking Lot 332,528,595 0.35% $4,392,755.94 0.38%
Industrial 739,831,653 0.79% $17,790,988.49 1.54%
Large Industrial 492,782,906 0.52% $11,400,820.26 0.99%
Farm 539,892,819 0.57% $1,084,601.48 0.09%
Managed Forest 6,935,928 0.01% $17,417.43 0.00%
Pipeline 219,448,078 0.23% $3,397,503.92 0.29%
Total (Taxable) 94,147,246,128 100.00% $1,153,178,861.89 100.00%
Sensitivity Analysis
To assist in evaluating the impact of changing the multi-residential tax ratio, MTE has prepared a sensitivity model to highlight the potential impacts of altering the current tax ratio scheme. For the purposes of this analysis, MTE has utilized the City’s Total Urban tax rate scheme and actual 2009 assessment values. The municipal levy has been calculated using a revised multi-residential ratios, and the results of that exercise are compared against the taxes and tax distribution calculated using the City’s actual 2009 rates. This method of comparison provides a solid basis for analysis as it eliminates the influence of any other variables, such as assessment changes, growth, or levy differences from impacting the results. Due to the fact that they City’s commercial classes are subject to levy restriction, this analysis has been prepared using the actual, or effective 2009 tax rate relationships between the commercial classes and the residential classes. This effectively demonstrates what the starting point for 2010 taxation would be in the absence of any other tax policy decisions or the impact of the phase-in program. All other ratios have been held constant. This scenario has been prepared to demonstrate the impact of reducing the multi-residential tax ratio to 1.0. This change would effectively equalize the rate of taxation applied to all multi-residential properties in the City with that of the residential class. As can be seen in Table 14, the contemplated ratio decrease of over 40% will result in a 39.10% tax decrease for the multi-residential class, or approximately $37.4 million, which will be shifted onto all other classes at a rate increase of about 3.54%.

© 2010 Municipal Tax Equity (MTE) Consultants Inc. 29
Table 14 Inter-Class Shifts of Urban Levy
Tax Class Status Quo Multi-Residential Ratio @ 1.0000
Tax By Class Revised CVA Tax $ Change % Change
Residential $722,771,778.77 $748,335,545.84 $25,563,767.06 3.54%
New Multi-Residential $2,064,997.59 $2,138,034.63 $73,037.05 3.54%
Multi-Residential $95,669,896.46 $58,266,799.47 -$37,403,096.99 -39.10%
Commercial $136,079,648.77 $140,892,658.83 $4,813,010.06 3.54%
Shopping Centre $41,370,352.97 $42,833,583.87 $1,463,230.91 3.54%
Office Building $117,138,099.81 $121,281,165.62 $4,143,065.81 3.54%
Parking Lot $4,392,755.94 $4,548,123.65 $155,367.70 3.54%
Industrial $17,790,988.49 $18,420,225.58 $629,237.09 3.54%
Large Industrial $11,400,820.26 $11,804,044.86 $403,224.60 3.54%
Farm $1,084,601.48 $1,122,976.25 $38,374.76 3.54%
Managed Forest $17,417.43 $18,033.40 $615.97 3.54%
Pipeline $3,397,503.92 $3,517,669.90 $120,165.98 3.54%
Total (Taxable) $1,153,178,861.89 $1,153,178,861.89 $0.00 0.00%
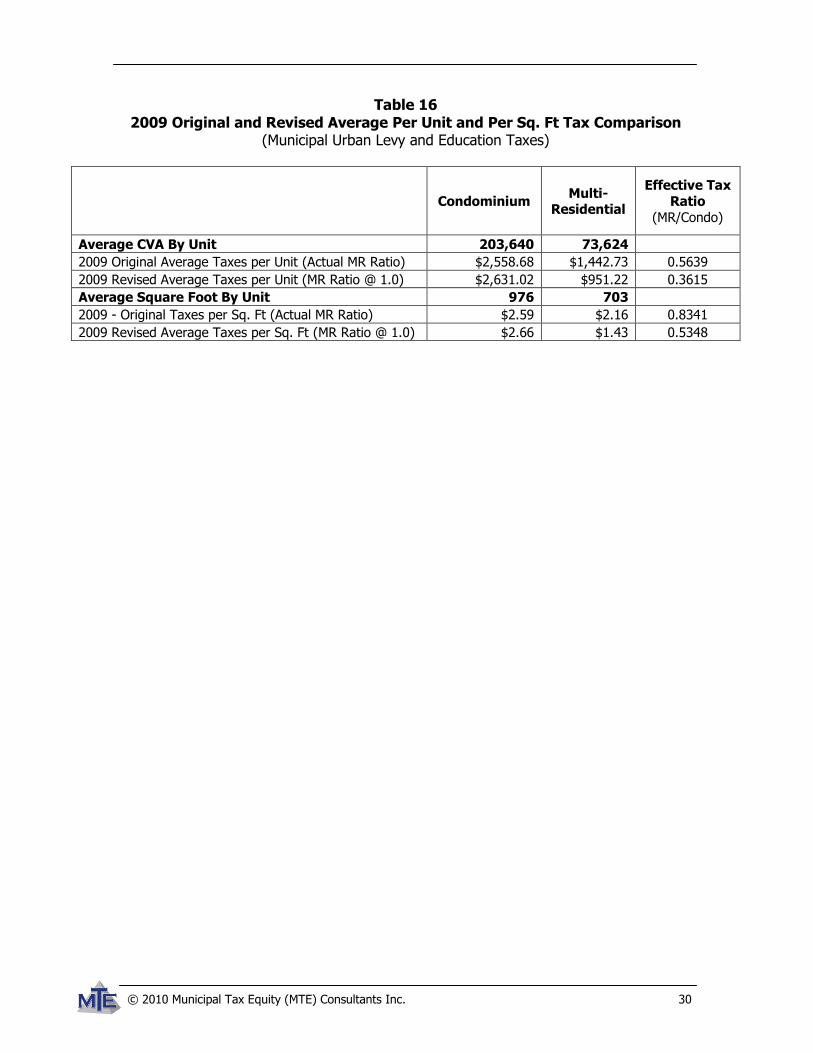
Table 15 and 16 have been prepared to quantify the impact of this tax ratio adjustment scenario on the per unit and per square foot tax liabilities of condominiums and multi-residential properties included in Part 2 of this study. Table 15 is based on the municipal portion of the tax bill, while Table 16 includes both the municipal and education portions.
Table 15 2009 Original and Revised Average Per Unit and Per Sq. Ft Tax Comparison
(Municipal Urban Levy Only)
Condominium Multi-
Residential
Effective Tax
Ratio (MR/Condo)
Average CVA By Unit 203,640 73,624
2009 Original Average Taxes per Unit (Actual MR Ratio) $2,045.50 $1,257.20 0.6146
2009 Revised Average Taxes per Unit (MR Ratio @ 1.0) $2,117.85 $765.68 0.3615
Average Square Foot By Unit 976 703
2009 - Original Taxes per Sq. Ft (Actual MR Ratio) $2.07 $1.88 0.9093
2009 Revised Average Taxes per Sq. Ft (MR Ratio @ 1.0) $2.14 $1.15 0.5349
© 2010 Municipal Tax Equity (MTE) Consultants Inc. 30
Table 16 2009 Original and Revised Average Per Unit and Per Sq. Ft Tax Comparison
(Municipal Urban Levy and Education Taxes)
Condominium Multi-
Residential
Effective Tax
Ratio
(MR/Condo)
Average CVA By Unit 203,640 73,624
2009 Original Average Taxes per Unit (Actual MR Ratio) $2,558.68 $1,442.73 0.5639
2009 Revised Average Taxes per Unit (MR Ratio @ 1.0) $2,631.02 $951.22 0.3615
Average Square Foot By Unit 976 703
2009 - Original Taxes per Sq. Ft (Actual MR Ratio) $2.59 $2.16 0.8341
2009 Revised Average Taxes per Sq. Ft (MR Ratio @ 1.0) $2.66 $1.43 0.5348

© 2010 Municipal Tax Equity (MTE) Consultants Inc. 31
CONCLUSION AND NEXT STEPS The central purpose and mandate of this study has been to provide an update to previous analytical exercises to augment the body of research in respect of the tax treatment of comparable higher density residential units/properties that are classified and treated differently for tax rate purposes. In meeting this mandate, MTE has focused on the distinction between buildings assessed and taxed as multi-residential properties, and those classified as condominiums. While condominiums represent only a sub-set of the larger, residential property class, the examination of this relationship has been designed to assist City staff and decision makers in understanding the impact and equity of the current tax ratios applied to the multi-residential and residential property classes. A simple review of the City’s multi-residential tax ratio in comparison to the ratios being employed by neighboring jurisdictions and a broader provincial sample provide an initial indication that the current multi-residential tax ratio of 1.70 is quite low on a comparative basis. The City also applies a tax ratio of 1.0 to the new multi-residential class, which further confirms the City’s commitment to the multi-residential sector and not only benefits a number of rate payers, but encourages further development of such properties. Despite these circumstances, as discussed throughout this study, a simple evaluation of the tax ratio applied to the multi-residential property class does not provide the information and insight required to determine if that ratio is effectively meeting the City’s goals and objectives in respect of balancing and distributing the tax burden among different tax classes and property types. To overcome this shortcoming, and account for the differences in assessment and tax treatment of various types of multi-unit residential properties, a more detailed level of analysis is required. Consequently, to compare the relative tax burden of traditional multi-residential properties and other multi-unit residential properties, MTE has employed a sophisticated strategy to compare both CVA and tax liability, each of which has been analyzed and compared on a per unit and per square foot basis for a significant number of properties in the City. Adopting this multi-faceted approach has allowed MTE to effectively overcome many of the shortcomings of other studies on this issue. Summary of Study Observations and Findings The results of the analysis set out in this report reveal that, over time, differences in tax ratios and ever-changing assessment relationships between the residential and multi-residential property classes have resulted in a shifting and highly variable relationship between these two types of properties. The specific findings of this analytical exercise may be summarized as follows.
Of particular interest were the erratic reassessment impacts experienced by these two groups of properties over the past several years. As witnessed in Part One, the last three reassessment cycles have triggered on-going changes to the balance of assessment and differentials in taxation between condominiums and traditional multiple unit residential properties as market/assessed values of property respond to updates over time.

© 2010 Municipal Tax Equity (MTE) Consultants Inc. 32
Revisiting these trends from past reassessments has helped to demonstrate that the tax relationship among property classes is non-static. This in and of itself solidifies MTE’s assertion that the examination or identification of an “appropriate” or “equitable” tax ratio, is purely a “point in time” exercise as the balance of taxation among classes is constantly changing. This in mind, the per unit and per square foot comparison exercises did shed a significant amount of light on the existing and historical relationship between the two types of properties. As per the results set out in Part Two of this report, it is evident that the assumption that a tax ratio of 1.70 would result in a substantially higher yield from multi-residential ratepayers does not appear to hold true when comparisons are made on the basis of taxes paid on a per unit or per square foot basis. Rather, the average effective taxation per unit for the multi-residential class in 2009 was calculated to be 61% of the amount being paid by the average condominium unit when the municipal portion of the tax bill is considered. The same relationship calculated on a per square foot basis showed multi-residential properties paying 91% of the burden in comparison to residential condominiums. Those considering the issue of tax parity between these two types of properties should also be mindful of the difference in education tax liabilities that exist, even when both types of property are subject to the same tax rate/ratio for this purpose. It should be noted that education tax rates are a Provincial responsibility, and City Council has no discretion or authority over this component of the tax bill. When the education portion of the tax bill is added into the equation, the percentage of multi-residential to residential tax drops to 56% and 83% on a per unit and per square foot basis respectively. While this relationship has changed over time as a result of reassessment/market value behaviour, the study’s results demonstrate that the effective ratio of tax on multi-residential properties has remained consistently lower than the taxes paid on condominium properties. This was shown to be the case using both the per unit and per square foot measures. Based on these observations, tax ratio relationships do not appear to directly translate into corresponding, intuitive tax level outcomes because of the influence of other variables affecting tax liability (e.g. market/current value assessments). Potential Next Steps and Further Analysis Should the City wish to expand its investigation, it may be beneficial to add a layer of analysis to examine the manner in which MPAC is treating the various types of multi-unit residential properties. A targeted review of the assessment treatment and the state, quality and condition of various properties by an assessment expert could lend valuable insight to any future project of this nature, and could also be useful in identifying any potential errors or mistreatment of these properties by MPAC. The City may also wish to expand the inter-jurisdictional review contained in this report, and extend it beyond the comparison of raw tax ratios into an investigation of comparative per unit tax liabilities. Although the City’s current multi-residential tax ratio
© 2010 Municipal Tax Equity (MTE) Consultants Inc. 33
is lower than most of the jurisdictions in either of the sample groups, the competitiveness of the actual tax outcomes remains unknown until such time as an inter-jurisdictional comparison of multi-residential taxes is undertaken. For this exercise, the per unit level of measurement would be very effective, however, the City would have to request and secure certain assessment details from the groups of comparator jurisdictions. Finally, if the City plans to entertain any changes to existing tax ratios, quantification of the impacts of any proposed tax ratio scheme on all classes of property will be a critical decision making input to understand how tax burdens and levels would move for either 2010 and/or for subsequent taxation years. Before Council considers any tax ratio changes for future taxation, it is strongly recommended that the necessary resources be allocated to estimate the implications of ratio changes on specific classes of property, and relative tax competitiveness with other municipal jurisdictions.