Embed Size (px)
Citation preview

Surgical Volume Trends, 2009 Within and Beyond Wait Time Priority Areas

Production of this report is made possible by financial contributions from Health Canada
and provincial and territorial governments. The views expressed herein do not necessarily
represent the views of Health Canada or any provincial or territorial government.
The contents of this publication may be reproduced in whole or in part, provided
the intended use is for non-commercial purposes and full acknowledgement
is given to the Canadian Institute for Health Information.
Canadian Institute for Health Information
495 Richmond Road, Suite 600
Ottawa, Ontario K2A 4H6
Phone: 613-241-7860
Fax: 613-241-8120
www.cihi.ca
ISBN 978-1-55465-553-3 (PDF)
© 2009 Canadian Institute for Health Information
How to cite this document:
Canadian Institute for Health Information, Surgical Volume Trends, 2009—Within and Beyond
Wait Time Priority Areas (Ottawa, Ont.: CIHI, 2009).
Cette publication est aussi disponible en français sous le titre Tendances relatives au volume
d’interventions chirurgicales 2009 — en lien ou non avec les domaines prioritaires associés
aux temps d’attente.
ISBN 978-1-55465-555-7 (PDF)
Surgical Volume Trends, 2009 Within and Beyond Wait Time Priority Areas
Table of Contents
About CIHI ............................................................................................................. iii Acknowledgements .................................................................................................iv Introduction ............................................................................................................ 1 Has There Been Sustained Growth in Priority Procedures?............................................. 4
Overview............................................................................................................. 4 Changes in Priority Procedures Across the Country ................................................... 5 Changes by Priority Area ....................................................................................... 6
Joint Replacements............................................................................................ 7 Revascularization ............................................................................................... 8 Cataract Surgery ............................................................................................... 9 Cancer ............................................................................................................. 9
Have There Been Repercussions in Other Parts of the Health Care System Related to the Focus on Priority Area Surgery? ................................................................... 11
Surgery Outside Priority Areas.............................................................................. 12 Specialist Consultations....................................................................................... 14
Has the Increase in Priority Area Surgery Yielded Benefits Beyond Reduced Wait Times?... 15 Volumes and Outcomes....................................................................................... 15
Knee Replacements.......................................................................................... 15 Cataract Surgery ............................................................................................. 17
Geographic Access ............................................................................................. 17 For More Information ............................................................................................. 19 References ........................................................................................................... 20 Appendix 1—Provincial Information.......................................................................... 22 Appendix 2—Data Sources, Methodology and Data Limitations for Surgical Volumes Analysis ............................................................................... 38 Appendix 3—Data Sources and Methodology for Surgeon Volume and Consultation Analyses.................................................................................... 44


Surgical Volume Trends, 2009—Within and Beyond Wait Time Priority Areas
CIHI 2009 iii
About CIHI The Canadian Institute for Health Information (CIHI) collects and analyzes information on health and health care in Canada and makes it publicly available. Canada’s federal, provincial and territorial governments created CIHI as a not-for-profit, independent organization dedicated to forging a common approach to Canadian health information. CIHI’s goal: to provide timely, accurate and comparable information. CIHI’s data and reports inform health policies, support the effective delivery of health services and raise awareness among Canadians of the factors that contribute to good health. As of May 2009, members of CIHI’s Board of Directors are:
Mr. Graham W. S. Scott, C.M., Q.C. Chair of the Board, CIHI; President, Graham Scott Strategies Inc.
Ms. Anne McFarlane (ex officio) Interim President and Chief Executive Officer, CIHI
Dr. Peter Barrett Physician and Faculty, University of Saskatchewan Medical School
Dr. Luc Boileau President and Director General, Institut national de santé publique du Québec
Dr. Karen Dodds Assistant Deputy Minister, Health Canada
Dr. Chris Eagle Chief Operating Officer, Urban, Alberta Health Services
Mr. Kevin Empey Chief Executive Officer, Lakeridge Health Corporation
Mr. Donald Ferguson Deputy Minister, Department of Health, New Brunswick
Dr. Vivek Goel President and Chief Executive Officer, Ontario Agency for Health Protection and Promotion
Ms. Alice Kennedy Chief Operating Officer, Long Term Care, Eastern Health, Newfoundland and Labrador
Mr. Denis Lalumière Assistant Deputy Minister, Strategic Planning, Evaluation and Quality, ministère de la Santé et des Services sociaux du Québec
Mr. Gordon Macatee Deputy Minister, Ministry of Health Services, British Columbia
Dr. Cordell Neudorf Chair, CPHI Council; Chief Medical Health Officer, Saskatoon Health Region
Dr. Brian Postl Vice Chair of the Board, CIHI; President and Chief Executive Officer, Winnipeg Regional Health Authority
Mr. Ron Sapsford Deputy Minister, Ministry of Health and Long-Term Care, Ontario
Mr. Munir Sheikh Chief Statistician of Canada, Statistics Canada
Mr. Howard Waldner President and Chief Executive Officer, Vancouver Island Health Authority
Surgical Volume Trends, 2009—Within and Beyond Wait Time Priority Areas
iv CIHI 2009
Acknowledgements The Canadian Institute for Health Information (CIHI) would like to thank the many individuals and organizations that contributed to the development of this report. Production of this report involved many people throughout CIHI. The editorial committee consisted of Helen Angus, Kathleen Morris, Tracy Johnson and Jenny Lineker. Analytic contributions were made by Jennifer Frood and Jennifer Walker. We also want to thank other staff for their contribution to this report, including individuals from Clinical Administrative Databases and the National Physician Database. In addition, we would like to acknowledge the work of our external consultant, Jan Walker. This analysis could not have been completed without the generous support and assistance of several other individuals and organizations, including representatives from ministries of health who reviewed the methodology and validated preliminary results.
Surgical Volume Trends, 2009—Within and Beyond Wait Time Priority Areas
CIHI 2009 1
Introduction Reducing wait times for surgery and other health services is a prominent policy and service delivery challenge. Canada’s 10-Year Plan to Strengthen Health Care, agreed to by first ministers in 2004, identified investments to better manage wait times and reduce waits that are longer than medically acceptable. The plan highlighted five priorities for wait time reduction: cancer, heart, diagnostic imaging, joint replacements and sight restoration. The objective was to achieve meaningful reductions in wait times for these priority areas.i, 1 Since 2006, CIHI has released annual reports based on wait times reported by provinces. The studies highlight important differences in definitions, inclusion criteria and data collection approaches, giving essential context to the wait time information provided. CIHI’s most recent report on this topic (Wait Time Tables—A Provincial Comparison, 2009) noted that, while there are still some challenges with comparability, provinces have made progress in their efforts to report, manage and reduce wait times. This report was the first to provide information on progress towards the wait time benchmarks that were jointly announced by governments in 2005. Emerging data indicate that waits are within benchmarks for radiation therapy. The same is true for cardiac procedures, although more detailed comparative data are not yet available to determine if recommended waits are being met by priority level. Fewer patients are receiving care within benchmarks for joint replacement or cataract surgery, but early data show large reductions in wait times for these procedures. Data on diagnostic imaging are more limited, but early trends show some areas of improvement in reported wait times. In addition to consolidating information on provincially reported wait times, CIHI has reported on whether the number of priority area procedures has increased, as this was a strategy adopted by many provinces to improve access. Initially, the analysis was viewed as an interim measure until comprehensive and comparable wait time data were available. Today, although wait time information has greatly improved, the questions addressed by an updated surgical volumes analysis are still relevant. The information can fill information gaps where wait time data are not fully available and help round out our understanding of access to care even where wait time information exists. This report addresses the following questions:
• Has there been sustained growth in priority procedures? Previous CIHI analysis showed that many provinces increased the number of priority procedures to reduce waits for care. In 2005–2006, the first full year after the identification of wait time priorities, age-adjusted rates across the combination of all four surgical priority areas grew by 7%. This report looks at whether growth was sustained and explores whether there is any emerging information on the relationship between number of priority procedures and reported waits.
i. In the companion agreement, Asymmetrical Federalism That Respects Quebec’s Jurisdiction, it was noted
that Quebec would apply its own wait time reduction plan, in accordance with the objectives, standards and criteria established by the relevant Quebec authorities. (Canadian Intergovernmental Conference Secretariat, Asymmetrical Federalism That Respects Quebec’s Jurisdiction, [online], cited April 9, 2008, from <http://www.scics.gc.ca/cinfo04/800042012_e.pdf>.)
Surgical Volume Trends, 2009—Within and Beyond Wait Time Priority Areas
2 CIHI 2009
• Have there been repercussions in other parts of the health care system related to the focus on priority area surgery? Proponents of increased surgical volumes say that they are an important way to reduce the number of patients waiting for care. Others question whether it is possible to increase the number of procedures in a limited number of priority areas without crowding out other types of care. If physicians are busy doing more priority procedures, are patients waiting longer for other types of care, such as consultations with specialists? Has a focus on more inpatient priority surgery inadvertently contributed to the challenges with emergency department wait times?
• Has the increase in priority area surgery yielded benefits beyond reduced wait times? For example, in some priority areas, greater procedure volumes have been associated with lower rates of mortality and/or complications.2 As a result of the increase in priority procedures, are more patients being treated by surgeons who have reached volume thresholds associated with better outcomes? Is the same true for hospitals that have reached similar thresholds? Another possible benefit of additional surgical volume may be improved geographic access to care. Are people travelling shorter distances to receive priority area surgery?
Surgical Volume Trends, 2009—Within and Beyond Wait Time Priority Areas
CIHI 2009 3
The Fine Print Appendices 2 and 3 provide more information on data sources, methodology and data limitations. However, a few points are worth highlighting to provide context for the findings: Data sources: Hospitalization statistics come from the Canadian Institute for Health Information’s databases, as well as ambulatory data collected by Alberta Health and Wellness. While these data sets capture the majority of surgical hospitalizations that occur outside of Quebec, some gaps are noted in Appendix 2. Physician consultation data come from the National Physician Database (NPDB). What is a surgical procedure? There are a number of approaches available to identify surgical patients, which give similar but not identical results. In this analysis, surgical procedures were identified by a combination of diagnosis and intervention codes, which led patients to be assigned to a surgical Case Mix Group (CMG+) or qualifying Day Procedure Group (DPG 2007). To enhance comparability, adjustments were applied to address the variations in provincial guidelines for reporting day surgery (see Appendix 2). Despite these efforts, some variation in the day surgery definitions persists across jurisdictions. Quebec data: Quebec data for 2006 to 2008 were not available to CIHI at the time this analysis was conducted, and data from earlier years were collected under classifications systems that could not be grouped to CMG+ or DPG 2007. Provincial/territorial reporting: All analysis is based on where patients live, not where they received surgery. Data from Prince Edward Island and the three territories are included in the overall totals; however, because of small volumes, we do not report specific results for these jurisdictions. Specific procedures considered: Many types of surgery exist, but recent pan-Canadian efforts to reduce surgical wait times have focused primarily on four priority areas. In this analysis, we examined the following high-volume procedures within each priority area:
• Cancer: surgical cases where the patient’s most responsible diagnosis was listed as cancer (in addition to operations for cancer treatment, this definition also includes some advanced diagnostic procedures and reconstructive surgery provided to patients with cancer).
• Heart: revascularization procedures, which include bypass surgery and angioplasty.
• Joint replacement: hip and knee replacements.
• Sight restoration: cataract surgery. What is a physician consultation? The analysis examined the number of consultations performed by specialists working in wait time priority areas. The focus was on specialists in orthopedics, ophthalmology and cardiac care, with detailed selection criteria described in Appendix 3. All consults for these physicians were counted, as the NPDB cannot identify where consultations and visits are directly linked to particular surgical procedures. Because cancer surgery is performed by a broad range of surgical specialties, it was not included in this analysis. What about diagnostic imaging? This analysis focuses on changes in surgical procedures. Trends in diagnostic imaging are examined in CIHI’s report Medical Imaging in Canada, 2007, which provides information on the supply and distribution of selected imaging devices in Canada, their age, technological characteristics, costs and utilization and the professionals who make imaging services possible.
Surgical Volume Trends, 2009—Within and Beyond Wait Time Priority Areas
4 CIHI 2009
Has There Been Sustained Growth in Priority Procedures? In this section we look at changes in the number and rate of wait time priority procedures over two time frames:
• A three-year trend which looks at changes from 2004–2005 (when wait time priorities were first identified) to 2007–2008 (the most recent year for which we have data). This time frame allows us to understand big-picture changes, independent of when specific wait time reduction strategies were implemented.
• Year-over-year change from 2006–2007 to 2007–2008, the most recent year for which we have data. This time frame provides the most current picture and may help identify emerging themes.
We look at how trends over both of these time frames varied by individual priority area, as well as in different parts of the country.
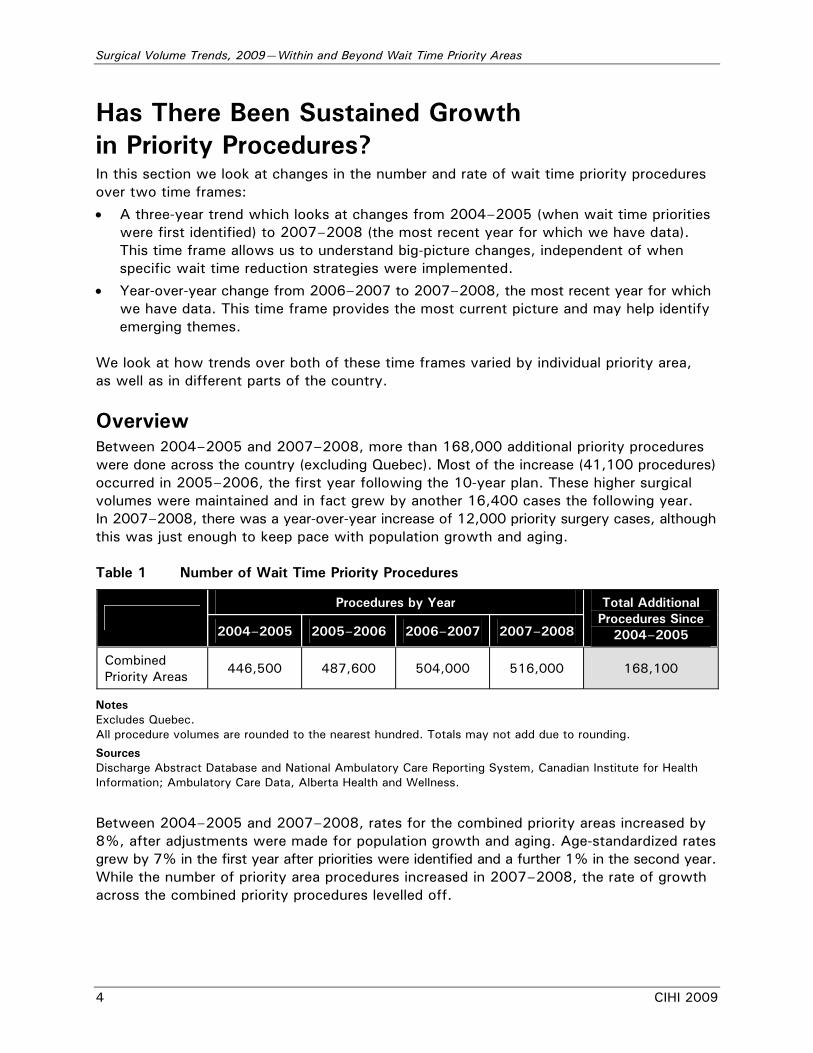
Overview Between 2004–2005 and 2007–2008, more than 168,000 additional priority procedures were done across the country (excluding Quebec). Most of the increase (41,100 procedures) occurred in 2005–2006, the first year following the 10-year plan. These higher surgical volumes were maintained and in fact grew by another 16,400 cases the following year. In 2007–2008, there was a year-over-year increase of 12,000 priority surgery cases, although this was just enough to keep pace with population growth and aging. Table 1 Number of Wait Time Priority Procedures
Procedures by Year
2004–2005 2005–2006 2006–2007 2007–2008
Total Additional Procedures Since
2004–2005
Combined Priority Areas
446,500 487,600 504,000 516,000 168,100
Notes Excludes Quebec. All procedure volumes are rounded to the nearest hundred. Totals may not add due to rounding.
Sources Discharge Abstract Database and National Ambulatory Care Reporting System, Canadian Institute for Health Information; Ambulatory Care Data, Alberta Health and Wellness.
Between 2004–2005 and 2007–2008, rates for the combined priority areas increased by 8%, after adjustments were made for population growth and aging. Age-standardized rates grew by 7% in the first year after priorities were identified and a further 1% in the second year. While the number of priority area procedures increased in 2007–2008, the rate of growth across the combined priority procedures levelled off.
Surgical Volume Trends, 2009—Within and Beyond Wait Time Priority Areas
CIHI 2009 5
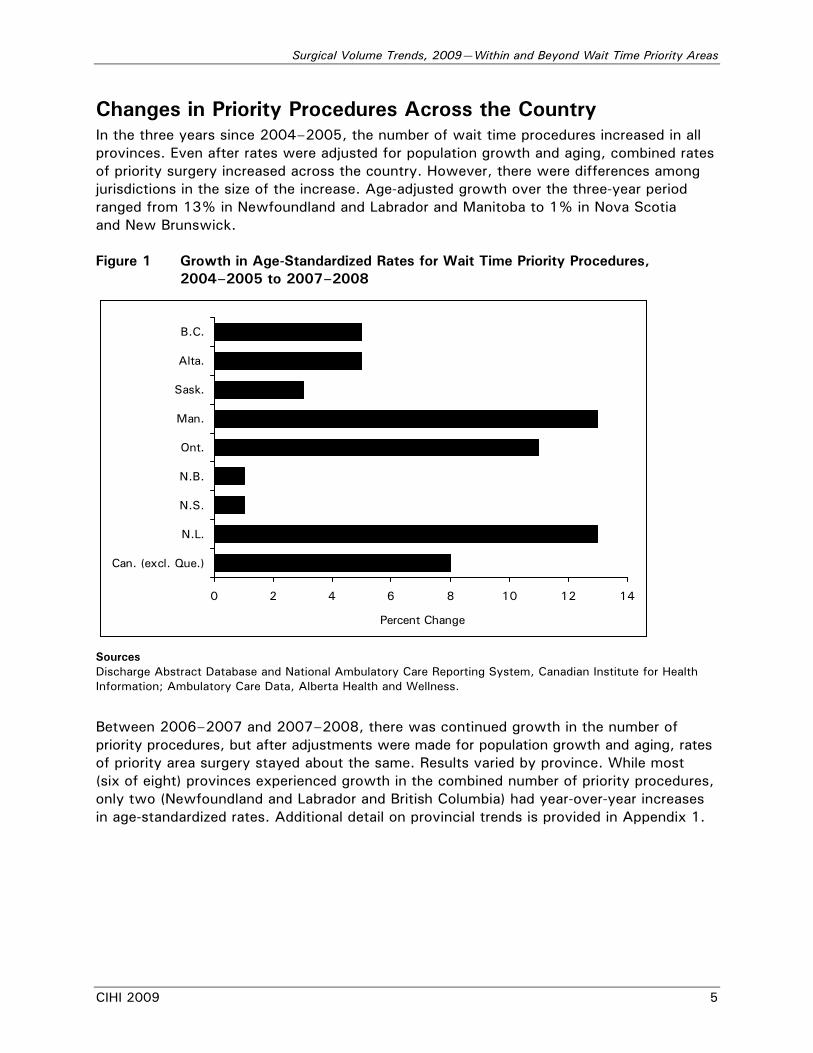
Changes in Priority Procedures Across the Country In the three years since 2004–2005, the number of wait time procedures increased in all provinces. Even after rates were adjusted for population growth and aging, combined rates of priority surgery increased across the country. However, there were differences among jurisdictions in the size of the increase. Age-adjusted growth over the three-year period ranged from 13% in Newfoundland and Labrador and Manitoba to 1% in Nova Scotia and New Brunswick. Figure 1 Growth in Age-Standardized Rates for Wait Time Priority Procedures,
2004–2005 to 2007–2008
0 2 4 6 8 10 12 14
B.C.
Alta.
Sask.
Man.
Ont.
N.B.
N.S.
N.L.
Can. (excl. Que.)
Percent Change
Sources Discharge Abstract Database and National Ambulatory Care Reporting System, Canadian Institute for Health Information; Ambulatory Care Data, Alberta Health and Wellness.
Between 2006–2007 and 2007–2008, there was continued growth in the number of priority procedures, but after adjustments were made for population growth and aging, rates of priority area surgery stayed about the same. Results varied by province. While most (six of eight) provinces experienced growth in the combined number of priority procedures, only two (Newfoundland and Labrador and British Columbia) had year-over-year increases in age-standardized rates. Additional detail on provincial trends is provided in Appendix 1.
Surgical Volume Trends, 2009—Within and Beyond Wait Time Priority Areas
6 CIHI 2009
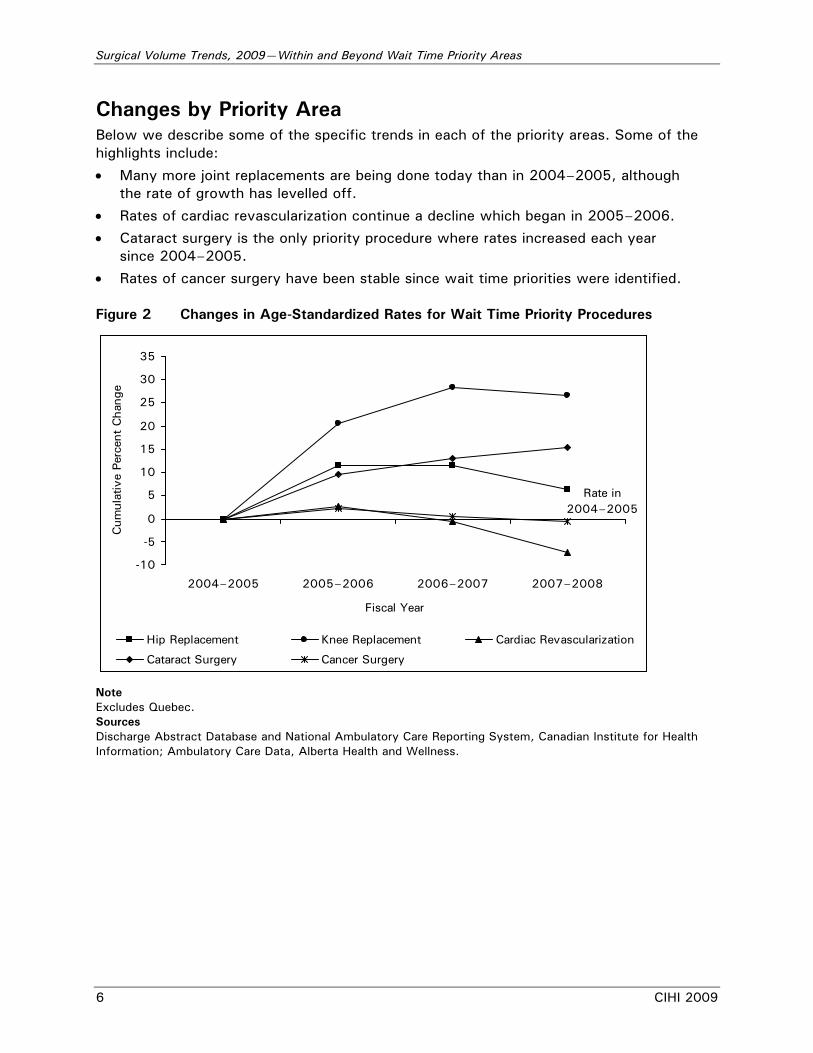
Changes by Priority Area Below we describe some of the specific trends in each of the priority areas. Some of the highlights include:
• Many more joint replacements are being done today than in 2004–2005, although the rate of growth has levelled off.
• Rates of cardiac revascularization continue a decline which began in 2005–2006.
• Cataract surgery is the only priority procedure where rates increased each year since 2004–2005.
• Rates of cancer surgery have been stable since wait time priorities were identified. Figure 2 Changes in Age-Standardized Rates for Wait Time Priority Procedures
-10
-5
0
5
10
15
20
25
30
35
2004–2005 2005–2006 2006–2007 2007–2008
Fiscal Year
Cum
ulat
ive
Perc
ent
Cha
nge
Hip Replacement Knee Replacement Cardiac Revascularization
Cataract Surgery Cancer Surgery
Rate in 2004–2005
Note Excludes Quebec. Sources Discharge Abstract Database and National Ambulatory Care Reporting System, Canadian Institute for Health Information; Ambulatory Care Data, Alberta Health and Wellness.
Surgical Volume Trends, 2009—Within and Beyond Wait Time Priority Areas
CIHI 2009 7
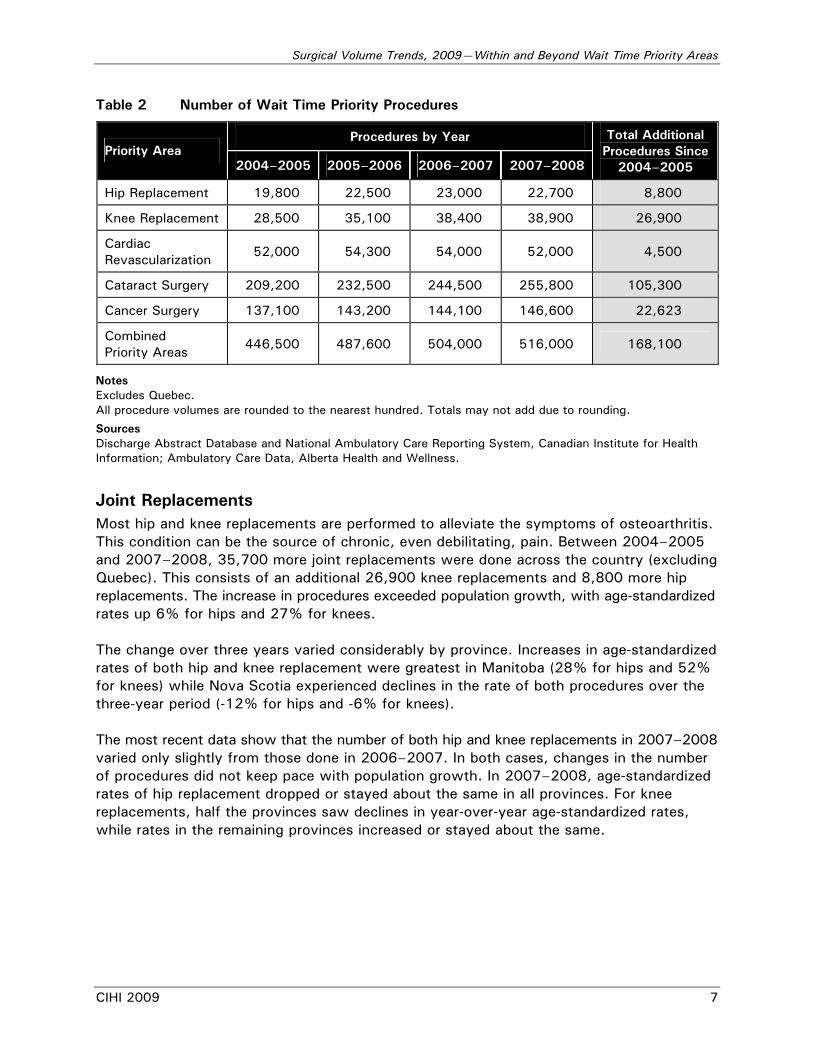
Table 2 Number of Wait Time Priority Procedures
Procedures by Year Priority Area
2004–2005 2005–2006 2006–2007 2007–2008
Total Additional Procedures Since
2004–2005
Hip Replacement 19,800 22,500 23,000 22,700 8,800
Knee Replacement 28,500 35,100 38,400 38,900 26,900
Cardiac Revascularization
52,000 54,300 54,000 52,000 4,500
Cataract Surgery 209,200 232,500 244,500 255,800 105,300
Cancer Surgery 137,100 143,200 144,100 146,600 22,623
Combined Priority Areas
446,500 487,600 504,000 516,000 168,100
Notes Excludes Quebec. All procedure volumes are rounded to the nearest hundred. Totals may not add due to rounding.
Sources Discharge Abstract Database and National Ambulatory Care Reporting System, Canadian Institute for Health Information; Ambulatory Care Data, Alberta Health and Wellness.
Joint Replacements Most hip and knee replacements are performed to alleviate the symptoms of osteoarthritis. This condition can be the source of chronic, even debilitating, pain. Between 2004–2005 and 2007–2008, 35,700 more joint replacements were done across the country (excluding Quebec). This consists of an additional 26,900 knee replacements and 8,800 more hip replacements. The increase in procedures exceeded population growth, with age-standardized rates up 6% for hips and 27% for knees. The change over three years varied considerably by province. Increases in age-standardized rates of both hip and knee replacement were greatest in Manitoba (28% for hips and 52% for knees) while Nova Scotia experienced declines in the rate of both procedures over the three-year period (-12% for hips and -6% for knees). The most recent data show that the number of both hip and knee replacements in 2007–2008 varied only slightly from those done in 2006–2007. In both cases, changes in the number of procedures did not keep pace with population growth. In 2007–2008, age-standardized rates of hip replacement dropped or stayed about the same in all provinces. For knee replacements, half the provinces saw declines in year-over-year age-standardized rates, while rates in the remaining provinces increased or stayed about the same.
Surgical Volume Trends, 2009—Within and Beyond Wait Time Priority Areas
8 CIHI 2009
Revascularization Between 2004–2005 and 2007–2008, 4,500 more revascularization procedures were done across the country (excluding Quebec). However, unlike other priority areas, the number of cardiac revascularization procedures in 2007–2008 is no higher than the number performed three years earlier. This represents a 7% decline in rates when adjusted for population growth and aging. The revascularization statistic combines trends for two procedures:
• Angioplasty uses a balloon device to reduce or clear an arterial blockage. Coronary stents—tiny cage-like tubes—are often inserted at the same time to keep the artery open. Angioplasty accounts for about two-thirds of revascularization procedures.
• Bypass surgery is a more invasive procedure where artery or vein grafts from other parts of the body are used to reroute blood around clogged arteries. Bypass surgery accounts for about one-third of revascularization procedures.
Since the late 1990s, consistently declining bypass surgery rates were coupled with increasing rates of angioplasty. Until now, the overall result had been an annual increase in combined revascularization procedures. However, between 2006–2007 and 2007–2008, combined rates of revascularization procedures decreased in all provinces, driven by an 8% drop in rates of angioplasty, after adjusting for population growth and aging. Factors that may explain the change in angioplasty rates include:
• The introduction of drug-eluting stents (which are coated with a slow-release drug) decreased the risk of a repeated narrowing and need for subsequent revascularization procedures.3, 4 Although these drug-eluting stents were first introduced in 2002, their use in Canada has become more widespread over time.5
• Cholesterol-lowering medications, often referred to as statins, have been shown to substantially reduce the risk of coronary events.6 It is possible that statins and other medical therapies may be delaying, and in some cases preventing, the need for a major revascularization procedure. Available data for seniors on public drug programs in five Canadian provinces show a 79% increase in the age–sex standardized rate of use of cholesterol-lowering drugs between 2001–2002 and 2007–2008. This includes a 6.5% increase between 2006–2007 and 2007–2008.ii
• Increased progress in preventive efforts, such as reduction in hypertension7 and more stringent smoking restrictions,8 have been linked to a reduction in adverse cardiovascular events. These initiatives may be beginning to have an impact on the need for revascularization procedures. Other population health trends, such as the increase in obesity9 and diabetes,10 may offset some of these gains.
ii. Data are from CIHI’s National Prescription Drug Utilization Information System (NPDUIS) Database.
As of November 2008, the NPDUIS Database holds information for five submitting provinces: Alberta, Saskatchewan, Manitoba, New Brunswick and Nova Scotia.
Surgical Volume Trends, 2009—Within and Beyond Wait Time Priority Areas
CIHI 2009 9
Cataract Surgery Cataract surgery corrects a clouding of the lens in the eye affecting vision—one of the more common age-related health problems. While knee replacements had the highest rate of growth since 2004–2005, cataract surgery accounted for the largest jump in the number of procedures: 105,300 additional cataract operations have been performed since 2004–2005. Rates of cataract surgery increased by 15%, after adjusting for population growth and aging. There was considerable variation in the rate of growth across the provinces. Age-standardized rates for cataract surgery increased by 29% in Newfoundland and Labrador and stayed about the same over the three-year period in New Brunswick. The most recent data show that the number of cataract procedures continues to grow. In 2007–2008, there was a year-over-year increase of more than 11,000 operations, or 2% beyond that which would be expected to meet the needs of a growing and aging population. Cancer For many cancers, surgery is a vital part of the treatment plan. Surgery can be used to remove tumours or cancerous cells, to shrink tumours in preparation for radiation or chemotherapy, or to provide palliative relief from pain. An additional 22,600 cancer procedures have been performed since 2004–2005. However, this increase was just marginally less than that required to keep pace with a growing and aging population. Age-standardized rates over the three-year period remained about the same in all provinces. In 2007–2008, there was a year-over-year increase of 2,500 cancer procedures. Across the country and in most provinces, age-standardized rates stayed about the same. Some may find it surprising that cancer surgery rates have not increased, even though cancer was identified as a priority for wait time reduction. Consideration of the following factors may help explain the results. Perhaps most importantly, while the number of cancer cases has increased in recent years, data published by the Canadian Cancer Society show that rates of new cancer cases (after adjusting for population growth and aging) have been relatively stable.11 Additionally, for some cancers there has been a move away from invasive surgical diagnostic procedures performed in the operating room to less-invasive image-guided procedures performed in the radiology suite (which would not be captured in CIHI statistics).
Surgical Volume Trends, 2009—Within and Beyond Wait Time Priority Areas
10 CIHI 2009
Rates of Growth Levelling Off—A Cause for Concern? Although many more procedures are being done in the combined priority areas than in 2004–2005, age-standardized rates have levelled off and in some instances are beginning to decline. What is the relationship between rates of surgery and waits for care? Substantial progress has been made in reducing wait times, but we know that waits for some priority procedures still exceed benchmarks in many parts of the country.12 Do reduced rates of surgery mean that these benchmarks won’t be reached or will take longer to achieve? This is an important question, although there are several factors that make it difficult to answer:
• No “right rate”: While benchmarks have been established to identify acceptable waits for care, there is not a similar consensus on what the right “rate” for a particular procedure should be. Rates are heavily influenced by the population served. Factors such as underlying health conditions, prevalence of disease and the likelihood of following prevention and early detection guidelines will all influence the need for a particular type of surgery. The supply and distribution of resources (both health professionals and facilities) also play a role in determining rates of surgery. Rates may change if other types of care, such as pharmaceutical treatment or sophisticated imaging, are substituted for surgery. Additionally, procedure rates may be higher in the short term if the objective is to clear (or reduce) a backlog of patients waiting.
• More procedures may not be the only strategy for reducing waits: Provinces have adopted multiple strategies to reduce waits for care in priority areas. Increasing surgical capacity was a widely adopted early strategy. Other initiatives may reduce wait times for patients without necessarily increasing the number of operations performed. Some have focused on developing better tools for physicians to assess and identify patients and manage wait lists. Others have worked on improving surgical efficiency in hospitals, which may result in fewer cancelled operations. Many have reviewed the surgical process, eliminating steps in the process or performing required steps in parallel rather than in sequence. While we recognize that provinces are employing multiple approaches, the relative impacts of these strategies are unclear.
• No early evidence that waits are on the rise: Data on wait time trends are only recently beginning to emerge. While it is impossible to draw firm conclusions on the relationship between rates of surgery and waits for care, some limited inferences may be made. Wait time trend information is most readily available for joint replacement surgery. In the five provinces where definitions and metrics have remained relatively stable, there is no evidence that reported waits have increased,12 even though rates of surgery have declined.
Surgical Volume Trends, 2009—Within and Beyond Wait Time Priority Areas
CIHI 2009 11
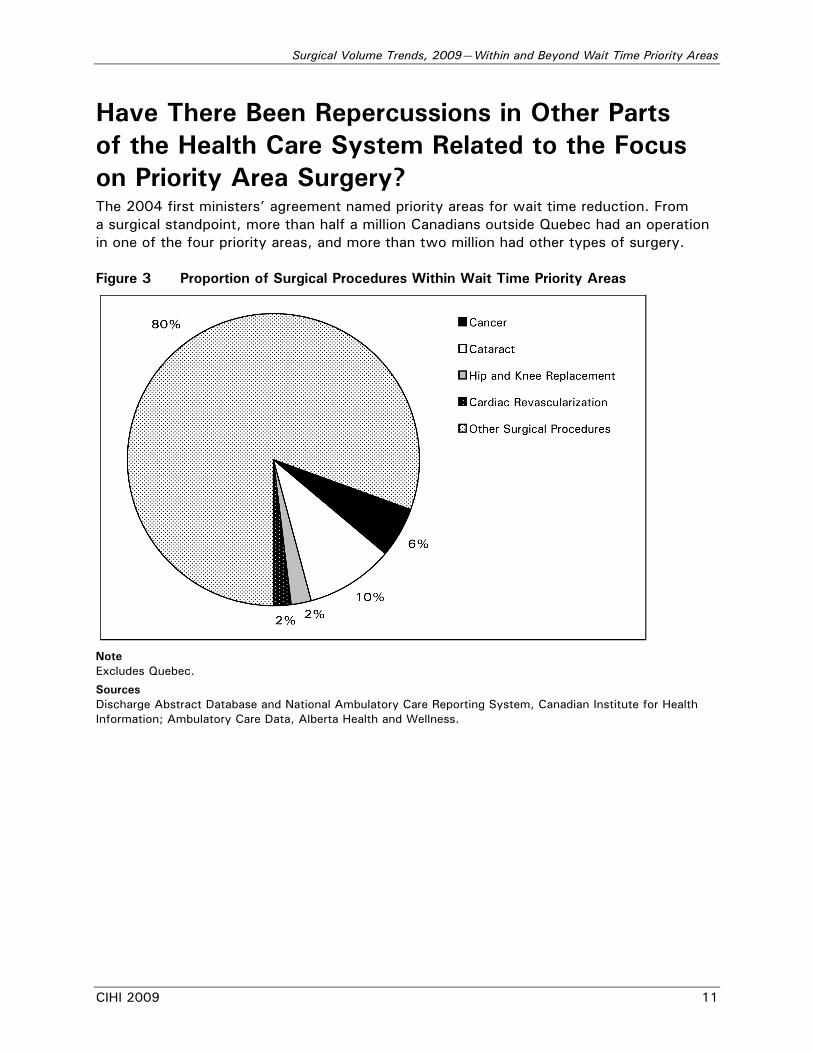
Have There Been Repercussions in Other Parts of the Health Care System Related to the Focus on Priority Area Surgery? The 2004 first ministers’ agreement named priority areas for wait time reduction. From a surgical standpoint, more than half a million Canadians outside Quebec had an operation in one of the four priority areas, and more than two million had other types of surgery. Figure 3 Proportion of Surgical Procedures Within Wait Time Priority Areas
Note Excludes Quebec.
Sources Discharge Abstract Database and National Ambulatory Care Reporting System, Canadian Institute for Health Information; Ambulatory Care Data, Alberta Health and Wellness.

Surgical Volume Trends, 2009—Within and Beyond Wait Time Priority Areas
12 CIHI 2009
Some have expressed concern about focusing on only a limited number of procedures. They worry that non-prioritized areas might actually be experiencing longer wait times as resources are channelled to prioritized areas. The ideal measure would be cross-Canada trends in how long patients wait for other types of care, such as surgery in other areas or waits for appointments with specialists. Although data on access to specialists are quite limited, there is emerging information on the waits for procedures outside of priority areas. For example, Saskatchewan has been tracking waits for a variety of common surgical procedures since 2003. More recently, Ontario established wait time access targets and began reporting waits for general, orthopedic and ophthalmic procedures. Other provinces also report on wait times for many surgical and diagnostic services beyond wait time priority areas. Efforts have been made at both the provincial and national levels to expand the list of procedures for which wait time benchmarks are set. These recent initiatives will help ensure that some areas don’t benefit at the expense of others. Until these measures are more comprehensively available, we can look at trends in volumes to explore two potential unintended consequences of the focus on priority area procedures:
• Is surgery outside of the priority areas still being performed at the same rate, or has it been crowded out by the emphasis on a select few surgical procedures?
• Are specialists who perform priority area surgery cutting back on their consultations to spend more time in the operating room?
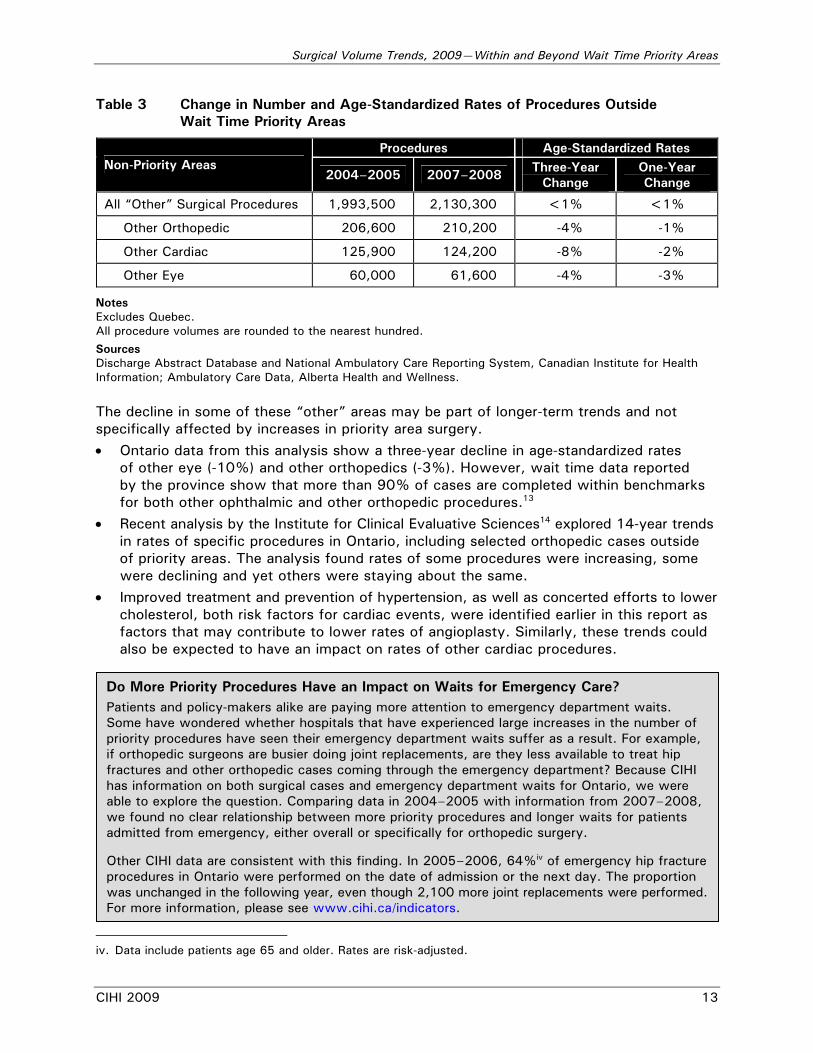
Surgery Outside Priority Areas Data are available to monitor the number of procedures in non-prioritized areas. Reduced rates of surgery outside the priority areas may indicate changes in clinical practice or population health, but they may also indicate insufficient capacity. Outside of the four surgical priority areas, about 140,000 more procedures were done in 2007–2008 than in 2004–2005. Age-standardized rates of surgery outside the priority areas are about the same as they were in 2004–2005. This information would indicate that the system was able to accommodate an increasing number of wait time priority area procedures without compromising the rate at which surgery is performed for other reasons. Within the broad category of surgery outside of the priority areas, we looked specifically at other types of surgery performed within a priority area specialty. For example, the category of “other orthopedics” includes orthopedic operations (other than hip and knee replacements), such as shoulder or back procedures. Some wonder whether these procedures may be particularly susceptible to crowding out by priority area surgery. Over three years, while the overall rate of other surgery remained about the same, age-standardized rates declined for other procedures within a priority area specialty (orthopedics, cardiac or eye).iii The decline was greatest for other cardiac procedures, where the number of procedures dropped below 2004–2005 levels. Rates of “other orthopedics” and “other eye procedures” declined by 4% over the three-year period, even though the number of operations in each category was higher than in 2004. iii. Cancer surgery is performed across a wide range of specialties, so it was not included in this aspect
of the analysis.
Surgical Volume Trends, 2009—Within and Beyond Wait Time Priority Areas
CIHI 2009 13
Table 3 Change in Number and Age-Standardized Rates of Procedures Outside Wait Time Priority Areas
Procedures Age-Standardized Rates Non-Priority Areas
2004–2005 2007–2008 Three-Year Change
One-Year Change
All “Other” Surgical Procedures 1,993,500 2,130,300 <1% <1%
Other Orthopedic 206,600 210,200 -4% -1%
Other Cardiac 125,900 124,200 -8% -2%
Other Eye 60,000 61,600 -4% -3%
Notes Excludes Quebec. All procedure volumes are rounded to the nearest hundred.
Sources Discharge Abstract Database and National Ambulatory Care Reporting System, Canadian Institute for Health Information; Ambulatory Care Data, Alberta Health and Wellness.
The decline in some of these “other” areas may be part of longer-term trends and not specifically affected by increases in priority area surgery. • Ontario data from this analysis show a three-year decline in age-standardized rates
of other eye (-10%) and other orthopedics (-3%). However, wait time data reported by the province show that more than 90% of cases are completed within benchmarks for both other ophthalmic and other orthopedic procedures.13
• Recent analysis by the Institute for Clinical Evaluative Sciences14 explored 14-year trends in rates of specific procedures in Ontario, including selected orthopedic cases outside of priority areas. The analysis found rates of some procedures were increasing, some were declining and yet others were staying about the same.
• Improved treatment and prevention of hypertension, as well as concerted efforts to lower cholesterol, both risk factors for cardiac events, were identified earlier in this report as factors that may contribute to lower rates of angioplasty. Similarly, these trends could also be expected to have an impact on rates of other cardiac procedures.
iv
iv. Data include patients age 65 and older. Rates are risk-adjusted.
Do More Priority Procedures Have an Impact on Waits for Emergency Care? Patients and policy-makers alike are paying more attention to emergency department waits. Some have wondered whether hospitals that have experienced large increases in the number of priority procedures have seen their emergency department waits suffer as a result. For example, if orthopedic surgeons are busier doing joint replacements, are they less available to treat hip fractures and other orthopedic cases coming through the emergency department? Because CIHI has information on both surgical cases and emergency department waits for Ontario, we were able to explore the question. Comparing data in 2004–2005 with information from 2007–2008, we found no clear relationship between more priority procedures and longer waits for patients admitted from emergency, either overall or specifically for orthopedic surgery. Other CIHI data are consistent with this finding. In 2005–2006, 64%iv of emergency hip fracture procedures in Ontario were performed on the date of admission or the next day. The proportion was unchanged in the following year, even though 2,100 more joint replacements were performed. For more information, please see www.cihi.ca/indicators.
Surgical Volume Trends, 2009—Within and Beyond Wait Time Priority Areas
14 CIHI 2009
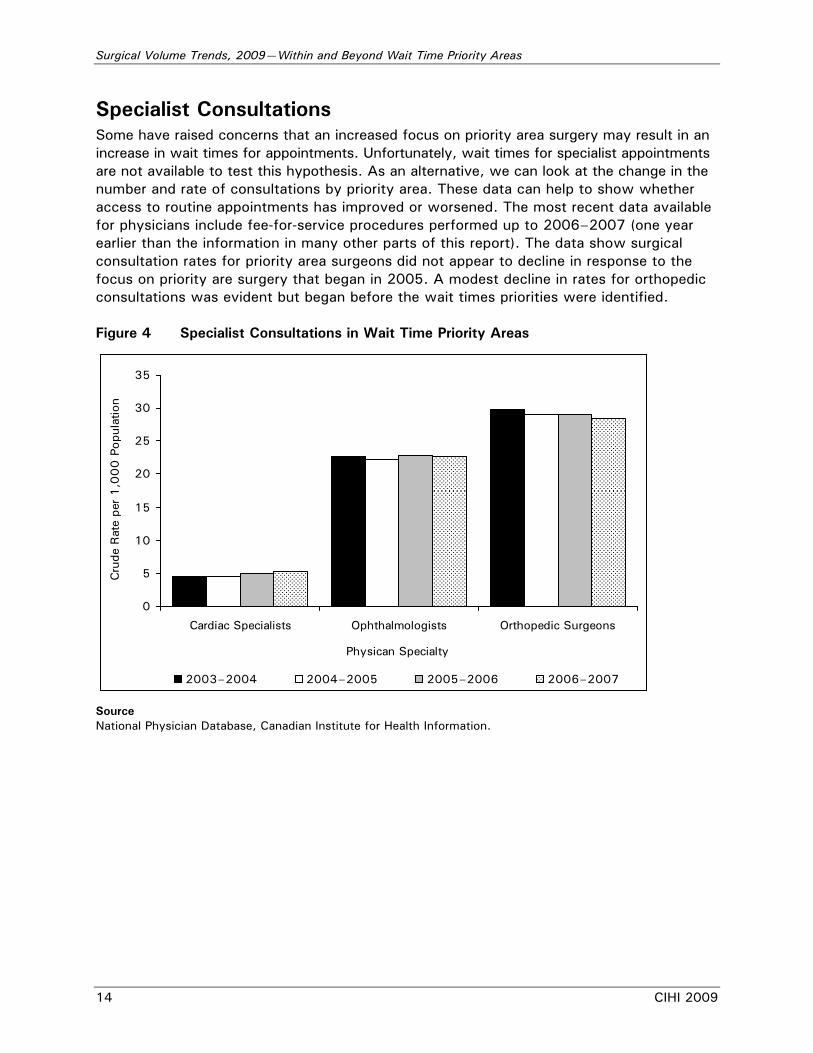
Specialist Consultations Some have raised concerns that an increased focus on priority area surgery may result in an increase in wait times for appointments. Unfortunately, wait times for specialist appointments are not available to test this hypothesis. As an alternative, we can look at the change in the number and rate of consultations by priority area. These data can help to show whether access to routine appointments has improved or worsened. The most recent data available for physicians include fee-for-service procedures performed up to 2006–2007 (one year earlier than the information in many other parts of this report). The data show surgical consultation rates for priority area surgeons did not appear to decline in response to the focus on priority are surgery that began in 2005. A modest decline in rates for orthopedic consultations was evident but began before the wait times priorities were identified. Figure 4 Specialist Consultations in Wait Time Priority Areas
0
5
10
15
20
25
30
35
Cardiac Specialists Ophthalmologists Orthopedic Surgeons
Physican Specialty
Cru
de R
ate
per
1,0
00
Pop
ulat
ion
2003–2004 2004–2005 2005–2006 2006–2007
Source National Physician Database, Canadian Institute for Health Information.
Surgical Volume Trends, 2009—Within and Beyond Wait Time Priority Areas
CIHI 2009 15
Has the Increase in Priority Area Surgery Yielded Benefits Beyond Reduced Wait Times? When studies look at the unintended effects of a policy decision, they often focus on the negative. But the decision in 2004 to focus wait time reduction efforts on a small number of priority areas may have yielded some benefits for the health care system. This section examines increases in priority area procedures, with a particular focus on those with the greatest volume increases: cataract surgery and knee replacement. It explores questions such as:
• Are there expected improvements in overall quality for procedures with known volume–outcome relationships?
• Have there been any benefits in terms of improved geographic access to care?
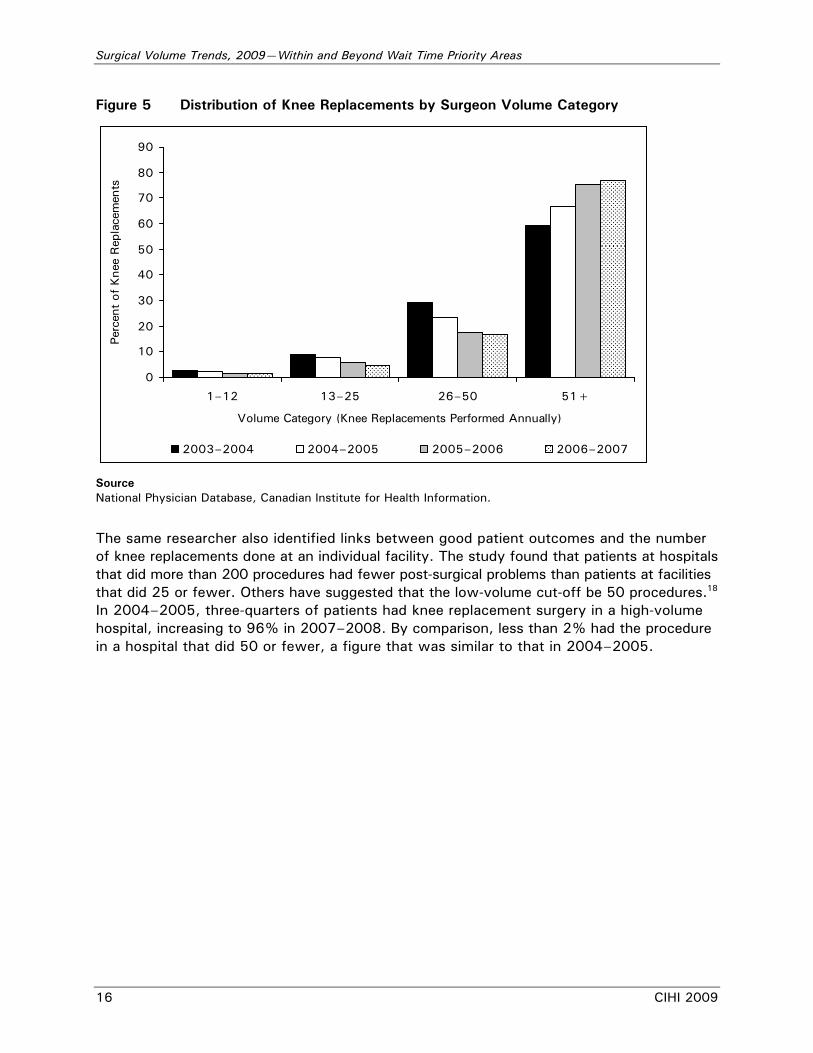
Volumes and Outcomes Most research shows that the greater the volume of procedures performed by a physician or a hospital, the better the outcomes. While the outcome most commonly studied is short-term in-hospital mortality, death is a relatively uncommon outcome for the two procedures that are the focus of this section: knee replacement and cataract surgery. Outcomes of interest in these procedures have focused more on infections15 and implant survival.16 This literature identifies volume thresholds above which better outcomes have been observed. We looked at whether there have been changes in the proportion of Canadians who receive knee replacement or cataract surgery from surgeons or facilities that are operating above these high-quality/volume thresholds. Knee Replacements Katz et al.17 found that surgeons who did 12 or fewer primary total knee replacements per year had significantly more patient complications (pneumonia and infection, among others) compared with surgeons who did more than 50. While these volume cut-offs were established for primary knee replacements only, 95% of knee replacements in Canada are primary procedures. In 2006–2007, the proportion of primary or revision knee replacements performed by high-volume surgeons was 77%, up from 59% in 2003–2004. Conversely, the proportion of knee replacements performed by low-volume surgeons declined from 2.7% to 1.4%. The declining trend was also seen in other medium-volume groups.
Surgical Volume Trends, 2009—Within and Beyond Wait Time Priority Areas
16 CIHI 2009
Figure 5 Distribution of Knee Replacements by Surgeon Volume Category
0
10
20
30
40
50
60
70
80
90
1–12 13–25 26–50 51+
Volume Category (Knee Replacements Performed Annually)
Perc
ent
of K
nee
Rep
lace
men
ts
2003–2004 2004–2005 2005–2006 2006–2007
Source National Physician Database, Canadian Institute for Health Information.
The same researcher also identified links between good patient outcomes and the number of knee replacements done at an individual facility. The study found that patients at hospitals that did more than 200 procedures had fewer post-surgical problems than patients at facilities that did 25 or fewer. Others have suggested that the low-volume cut-off be 50 procedures.18 In 2004–2005, three-quarters of patients had knee replacement surgery in a high-volume hospital, increasing to 96% in 2007–2008. By comparison, less than 2% had the procedure in a hospital that did 50 or fewer, a figure that was similar to that in 2004–2005.
Surgical Volume Trends, 2009—Within and Beyond Wait Time Priority Areas
CIHI 2009 17
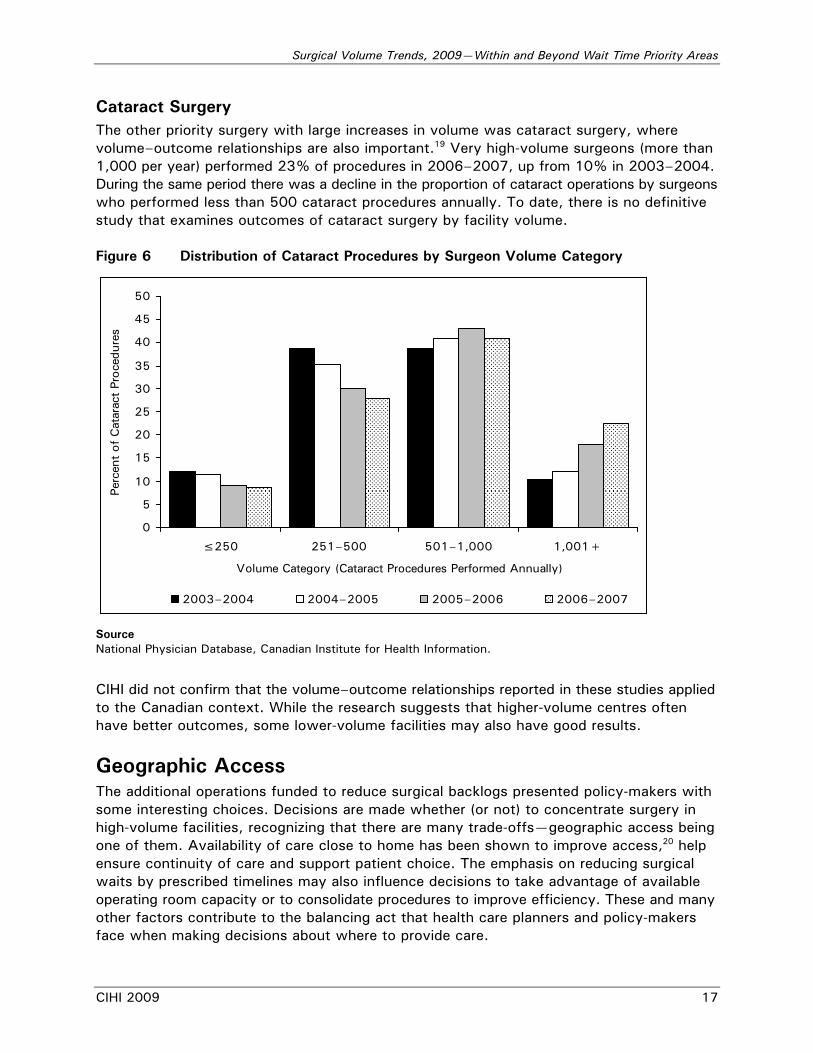
Cataract Surgery The other priority surgery with large increases in volume was cataract surgery, where volume–outcome relationships are also important.19 Very high-volume surgeons (more than 1,000 per year) performed 23% of procedures in 2006–2007, up from 10% in 2003–2004. During the same period there was a decline in the proportion of cataract operations by surgeons who performed less than 500 cataract procedures annually. To date, there is no definitive study that examines outcomes of cataract surgery by facility volume. Figure 6 Distribution of Cataract Procedures by Surgeon Volume Category
0
5
10
15
20
25
30
35
40
45
50
≤250 251–500 501–1,000 1,001+
Volume Category (Cataract Procedures Performed Annually)
Perc
ent
of C
atar
act
Proc
edur
es
2003–2004 2004–2005 2005–2006 2006–2007
Source National Physician Database, Canadian Institute for Health Information.
CIHI did not confirm that the volume–outcome relationships reported in these studies applied to the Canadian context. While the research suggests that higher-volume centres often have better outcomes, some lower-volume facilities may also have good results.
Geographic Access The additional operations funded to reduce surgical backlogs presented policy-makers with some interesting choices. Decisions are made whether (or not) to concentrate surgery in high-volume facilities, recognizing that there are many trade-offs—geographic access being one of them. Availability of care close to home has been shown to improve access,20 help ensure continuity of care and support patient choice. The emphasis on reducing surgical waits by prescribed timelines may also influence decisions to take advantage of available operating room capacity or to consolidate procedures to improve efficiency. These and many other factors contribute to the balancing act that health care planners and policy-makers face when making decisions about where to provide care.
Surgical Volume Trends, 2009—Within and Beyond Wait Time Priority Areas
18 CIHI 2009
Has geographic access to priority area surgery changed since 2004–2005? In a nutshell, the answer is no.
• Number of hospitals: There has been little change in the number of hospitals providing care for a particular priority procedure, even in cases where there have been large increases in volumes (such as cataract and knee replacement surgery).
• Care within home health region: There has been little change in the proportion of patients receiving care within their home health region since priority areas were first identified in 2004–2005. In 2007–2008:
− About three-quarters of joint replacement patients received care within their home health region, almost identical to the proportion in 2004–2005.
− Bypass surgery tended to be a more centralized procedure—just fewer than half of the patients having the procedure received care within their home health region. A similar figure was found before bypass surgery was identified as a priority procedure.
− Cataract surgery was available in a greater number of facilities and four out of five of patients received care within their home region. Once again, that figure changed very little since 2004.
− Cancer surgery includes a diverse mix of very common and extremely specialized services and is not considered appropriate for this type of analysis.
• Distance travelled: Given Canada’s population distribution and geography, it is not surprising that there are variations across provinces in the distances patients travel to receive surgical care. For example, more than half of patients in Saskatchewan and Newfoundland and Labrador travel more than 40 kilometres for joint replacement surgery. In Ontario, less than one-quarter of patients travels that far. That being said, in most provinces the proportion of patients who must travel more than 40 kilometres for care stayed about the same, even as the number of joint replacements increased. Fewer patients must travel for cataract surgery—17% of those requiring the operation travelled more than 40 kilometres in 2007–2008. This represents a small improvement (about 1.5%) over similar statistics from 2004–2005. (Because of differences in how day surgery was reported, Alberta could not be included in the analysis of distance travelled for cataract surgery.)
An Interesting Note In our study, many of the patients who received a wait time priority surgery were treated at the hospital closest to their home that provided the necessary type of care. But previous research on revascularization procedures has shown that about 3 in 10 patients do not receive care at the closest facility. There are many potential reasons for this finding, including availability of specialists, equipment or other facilities, policies and practice patterns, patient preferences and other factors.21 As improved information on expected wait times is available, this may also affect where a patient chooses to receive care.
Surgical Volume Trends, 2009—Within and Beyond Wait Time Priority Areas
CIHI 2009 19
For More Information This analysis is part of CIHI’s ongoing program of work related to access to care, including wait times. Copies of this report are available free of charge in both official languages on the CIHI website at www.cihi.ca. You can also find:
• Presentation slides with highlights from this analysis that you can use to share the results with others.
• Previous analyses of surgical volume trends published in 2007 and 2008.
• Related access-to-care reports, such as Wait Times Tables—A Comparison by Province, Alternate Level of Care in Canada, Understanding Emergency Department Waits and Waiting for Health Care in Canada: What We Know and What We Don’t Know.
• Related information on volume–outcome relationships from Health Care in Canada 2005.
Surgical Volume Trends, 2009—Within and Beyond Wait Time Priority Areas
20 CIHI 2009
References 1. Health Canada, First Minister’s Meeting on the Future of Health Care 2004 [online],
cited April 9, 2008, from <http://www.hc-sc.gc.ca/hcs-sss/delivery-prestation/ fptcollab/2004-fmm-rpm/index_e.html>.
2. N. Shervin, H. Rubash and J. N. Katz, “Orthopaedic Procedure Volume and Patient Outcomes: A Systematic Literature Review,” Clinical Orthopaedics & Related Research 457 (April 2007): pp. 35–41.
3. J. Daemen et al., “Meeting Report ESC Forum on Drug Eluting Stents European Heart House, Nice, 27–28 September 2007,” European Heart Journal 30 (2009): pp. 152–161.
4. J. Tu et al., “Effectiveness and Safety of Drug-Eluting Stents in Ontario,” New England Journal of Medicine 357, 14 (October 2007): pp. 1393–1402.
5. M. Love et al., “The Canadian Association of Interventional Cardiology and the Canadian Cardiovascular Society Joint Statement on Drug-Eluting Stents,” Canadian Journal of Cardiology 23 (February 2007): pp. 121–123.
6. T. Wilt et al., “Effectiveness of Statin Therapy in Adults With Coronary Heart Disease,” Archives of Internal Medicine 164 (July 2004): pp. 1427–1436.
7. F. Leenen et al., “Results of the Ontario Survey on the Prevalence and Control of Hypertension,” Canadian Medical Association Journal 178, 11 (May 2008): pp. 1441–1449.
8. J. Harlan et al., “Declines in Hospital Admission for Acute Myocardial Infarction in New York State After Implementation of a Comprehensive Smoking Ban,” American Journal of Public Health 97, 11 (November 2007): pp. 2035–2039.
9. Statistics Canada, Nutrition: Findings From the Canadian Community Health Survey—Adult Obesity in Canada: Measured Height and Weight (Ottawa, Ont.: Statistics Canada, 2004), Catalogue No. 82-620-MWE.
10. L. Lipscombe and J. Hux, “Trends in Diabetes Prevalence, Incidence, and Mortality in Ontario, Canada 1995–2005: A Population-Based Study,” The Lancet 369 (2007): pp. 750–756.
11. Canadian Cancer Society, Canadian Cancer Statistics, 2009 [online], cited April 20, 2009, from <http://www.cancer.ca/canada-wide/about%20cancer/cancer%20statistics/~/ media/CCS/Canada%20wide/Files%20List/English%20files%20heading/pdf%20not% 20in%20publications%20section/Stats%202009E%20Cdn%20Cancer.ashx>.
12. Canadian Institute for Health Information, Wait Times Tables—A Comparison by Province, 2009 [online], cited April 24, 2009, from <http://secure.cihi.ca/cihiweb/ products/wait_times_tables_aib_e.pdf>.
13. Ministry of Health and Long-Term Care, Progress on Wait Times [online], cited April 27, 2009, from <http://www.health.gov.on.ca/transformation/wait_times/ providers/wt_pro_mn.html>.
14. Institute for Clinical Evaluative Sciences, The Ontario Wait Time Strategy: No Evidence of an Adverse Impact on Other Surgeries [online], cited April 27, 2009, from <http://www.ices.on.ca/file/Wait_Time_Strategies_other_surgeries_IR.pdf>.
Surgical Volume Trends, 2009—Within and Beyond Wait Time Priority Areas
CIHI 2009 21
15. E. Jämsen, H. Huhtala, T. Puolakka and T. Moilanen, “Risk Factors for Infection After Knee Arthroplasty: A Register-Based Analysis of 43,149 Cases,” The Journal of Bone and Joint Surgery 91, 1 (January 2009): pp. 38–47.
16. D. J. Rodricks, S. Patil, P. Pulido and C. W. Colwell Jr., “Press-Fit Condylar Design Total Knee Arthroplasty: Fourteen to Seventeen-Year Follow-Up,” The Journal of Bone and Joint Surgery 89, 1 (January 2007): pp. 89–95.
17. J. N. Katz et al., “Association Between Hospital and Surgeon Procedure Volume and the Outcomes of Total Knee Replacement,” The Journal of Bone and Joint Surgery 86–A, 9 (September 2004): pp. 1909–1916.
18. K. Blum, W. de Cruppé, C. Ohmann and M. Geraedts, “Minimum Hospital Volumes for Total Knee Replacement,” Gesundheitswesen 70, 4 (April 2008): pp. 209–218.
19. C. M. Bell et al., “Surgeon Volumes and Selected Patient Outcomes in Cataract Surgery: A Population-Based Analysis,” Ophthalmology 114, 3 (March 2007): pp. 405–410.
20. J. Birkmeyer et al., “Regionalization of High-Risk Surgery and Implications for Patient Travel Times,” Journal of the American Medical Association 290 (November 2003): pp. 2703–2706.
21. Canadian Institute for Health Information, Health Care in Canada 2005 [online], cited April 28, 2009, from <http://secure.cihi.ca/cihiweb/products/hcic2005_e.pdf>.
Surgical Volume Trends, 2009—Within and Beyond Wait Time Priority Areas
22 CIHI 2009
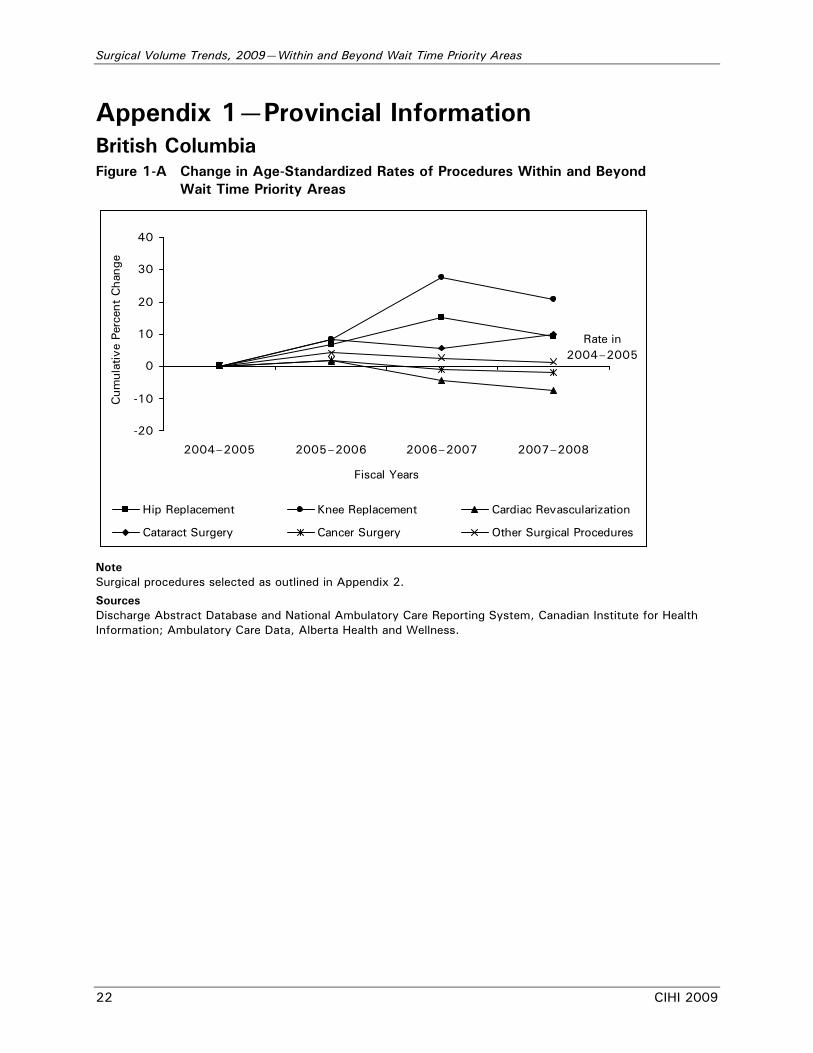
Appendix 1—Provincial Information British Columbia Figure 1-A Change in Age-Standardized Rates of Procedures Within and Beyond
Wait Time Priority Areas
-20
-10
0
10
20
30
40
2004–2005 2005–2006 2006–2007 2007–2008
Fiscal Years
Cum
ulat
ive
Perc
ent
Cha
nge
Hip Replacement Knee Replacement Cardiac Revascularization
Cataract Surgery Cancer Surgery Other Surgical Procedures
Rate in 2004–2005
Note Surgical procedures selected as outlined in Appendix 2.
Sources Discharge Abstract Database and National Ambulatory Care Reporting System, Canadian Institute for Health Information; Ambulatory Care Data, Alberta Health and Wellness.

Surgical Volume Trends, 2009—Within and Beyond Wait Time Priority Areas
CIHI 2009 23
Table 1-A1 Age-Standardized Rates of Surgical Procedures
Age-Standardized Rates (per 100,000)
Priority Area British Columbia 2007–2008
Canada 2007–2008
Hip Replacement* 112† 109
Knee Replacement* 157 179
Cardiac Revascularization* 232† 235
Cataract Surgery 779† 837
Cancer Surgery 432† 482
Other Surgical Procedures 6,707 7,579
Table 1-A2 Change in Volume of Surgical Procedures
Procedures by Year Priority Area
2004–2005 2005–2006 2006–2007 2007–2008
Total Additional Procedures Since
2004–2005
Hip Replacement 3,800 4,100 4,500 4,400 1,700
Knee Replacement 4,800 5,400 6,400 6,300 3,700
Cardiac Revascularization
9,300 9,700 9,500 9,400 600
Cataract Surgery 37,400 41,300 41,200 44,100 14,300
Cancer Surgery 22,700 23,800 23,700 24,200 3,400
Other Surgical Procedures
309,400 329,500 332,100 336,600 70,100
Notes * Procedure rates obtained from Health Indicators 2009 and calculated per population age 20 and older.
Rates for other reported procedures are calculated using full population. † Not significantly different from the Canada rate (excluding Quebec). Excludes Quebec. All procedure volumes are rounded to the nearest hundred. Totals may not add due to rounding. Surgical procedures selected as outlined in Appendix 2.
Sources Discharge Abstract Database and National Ambulatory Care Reporting System, Canadian Institute for Health Information; Ambulatory Care Data, Alberta Health and Wellness.
Surgical Volume Trends, 2009—Within and Beyond Wait Time Priority Areas
24 CIHI 2009
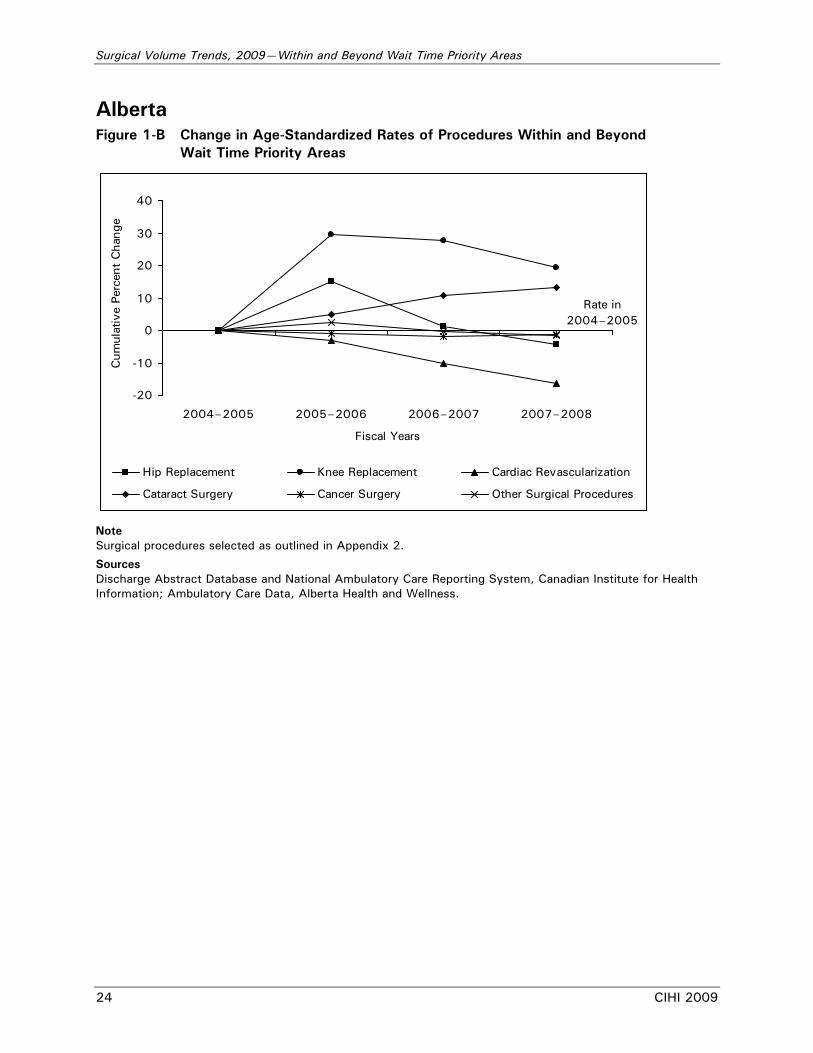
Alberta Figure 1-B Change in Age-Standardized Rates of Procedures Within and Beyond
Wait Time Priority Areas
-20
-10
0
10
20
30
40
2004–2005 2005–2006 2006–2007 2007–2008
Fiscal Years
Cum
ulat
ive
Perc
ent
Cha
nge
Hip Replacement Knee Replacement Cardiac Revascularization
Cataract Surgery Cancer Surgery Other Surgical Procedures
Rate in 2004–2005
Note Surgical procedures selected as outlined in Appendix 2.
Sources Discharge Abstract Database and National Ambulatory Care Reporting System, Canadian Institute for Health Information; Ambulatory Care Data, Alberta Health and Wellness.
Surgical Volume Trends, 2009—Within and Beyond Wait Time Priority Areas
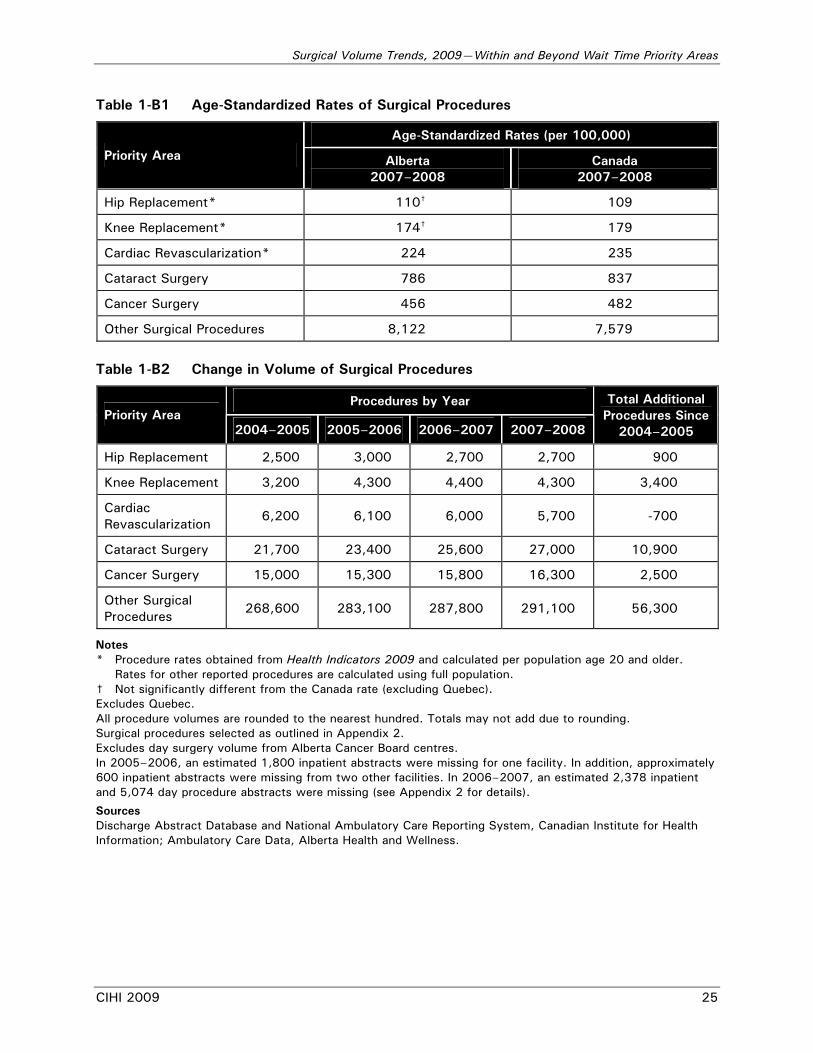
CIHI 2009 25
Table 1-B1 Age-Standardized Rates of Surgical Procedures
Age-Standardized Rates (per 100,000)
Priority Area Alberta 2007–2008
Canada 2007–2008
Hip Replacement* 110† 109
Knee Replacement* 174† 179
Cardiac Revascularization* 224 235
Cataract Surgery 786 837
Cancer Surgery 456 482
Other Surgical Procedures 8,122 7,579
Table 1-B2 Change in Volume of Surgical Procedures
Procedures by Year Priority Area
2004–2005 2005–2006 2006–2007 2007–2008
Total Additional Procedures Since
2004–2005
Hip Replacement 2,500 3,000 2,700 2,700 900
Knee Replacement 3,200 4,300 4,400 4,300 3,400
Cardiac Revascularization
6,200 6,100 6,000 5,700 -700
Cataract Surgery 21,700 23,400 25,600 27,000 10,900
Cancer Surgery 15,000 15,300 15,800 16,300 2,500
Other Surgical Procedures
268,600 283,100 287,800 291,100 56,300
Notes * Procedure rates obtained from Health Indicators 2009 and calculated per population age 20 and older.
Rates for other reported procedures are calculated using full population. † Not significantly different from the Canada rate (excluding Quebec). Excludes Quebec. All procedure volumes are rounded to the nearest hundred. Totals may not add due to rounding. Surgical procedures selected as outlined in Appendix 2. Excludes day surgery volume from Alberta Cancer Board centres. In 2005–2006, an estimated 1,800 inpatient abstracts were missing for one facility. In addition, approximately 600 inpatient abstracts were missing from two other facilities. In 2006–2007, an estimated 2,378 inpatient and 5,074 day procedure abstracts were missing (see Appendix 2 for details).
Sources Discharge Abstract Database and National Ambulatory Care Reporting System, Canadian Institute for Health Information; Ambulatory Care Data, Alberta Health and Wellness.
Surgical Volume Trends, 2009—Within and Beyond Wait Time Priority Areas
26 CIHI 2009
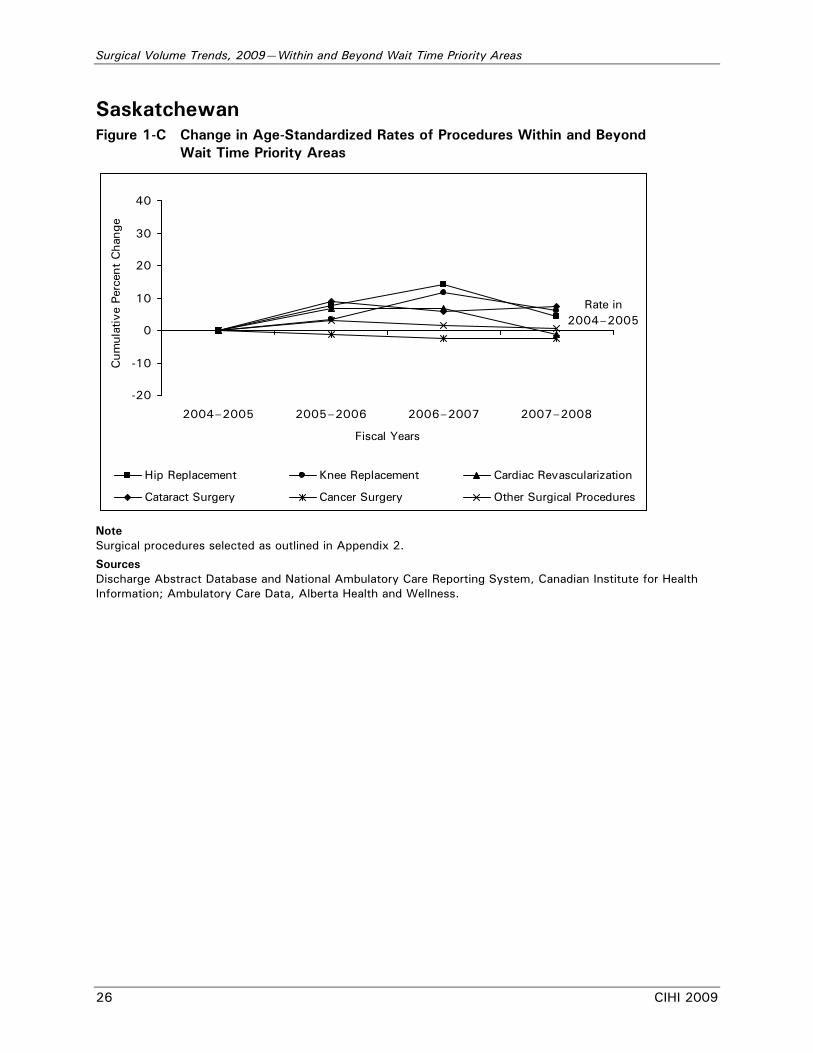
Saskatchewan Figure 1-C Change in Age-Standardized Rates of Procedures Within and Beyond
Wait Time Priority Areas
-20
-10
0
10
20
30
40
2004–2005 2005–2006 2006–2007 2007–2008
Fiscal Years
Cum
ulat
ive
Perc
ent
Cha
nge
Hip Replacement Knee Replacement Cardiac Revascularization
Cataract Surgery Cancer Surgery Other Surgical Procedures
Rate in 2004–2005
Note Surgical procedures selected as outlined in Appendix 2.
Sources Discharge Abstract Database and National Ambulatory Care Reporting System, Canadian Institute for Health Information; Ambulatory Care Data, Alberta Health and Wellness.

Surgical Volume Trends, 2009—Within and Beyond Wait Time Priority Areas
CIHI 2009 27
Table 1-C1 Age-Standardized Rates of Surgical Procedures
Age-Standardized Rates (per 100,000)
Priority Area Saskatchewan 2007–2008
Canada 2007–2008
Hip Replacement* 114† 109
Knee Replacement* 176† 179
Cardiac Revascularization* 286 235
Cataract Surgery 925 837
Cancer Surgery 493 482
Other Surgical Procedures 8,680 7,579
Table 1-C2 Change in Volume of Surgical Procedures
Procedures by Year Priority Area
2004–2005 2005–2006 2006–2007 2007–2008
Total Additional Procedures Since
2004–2005
Hip Replacement 900 1,000 1,100 1,000 300
Knee Replacement 1,400 1,500 1,600 1,600 400
Cardiac Revascularization
2,500 2,700 2,700 2,600 400
Cataract Surgery 11,100 12,100 11,800 12,200 2,600
Cancer Surgery 6,100 6,100 6,000 6,100 -200
Other Surgical Procedures
91,200 94,300 93,300 94,200 8,200
Notes * Procedure rates obtained from Health Indicators 2009 and calculated per population age 20 and older.
Rates for other reported procedures are calculated using full population. † Not significantly different from the Canada rate (excluding Quebec). Excludes Quebec. All procedure volumes are rounded to the nearest hundred. Totals may not add due to rounding. Surgical procedures selected as outlined in Appendix 2.
Sources Discharge Abstract Database and National Ambulatory Care Reporting System, Canadian Institute for Health Information; Ambulatory Care Data, Alberta Health and Wellness.
Surgical Volume Trends, 2009—Within and Beyond Wait Time Priority Areas
28 CIHI 2009
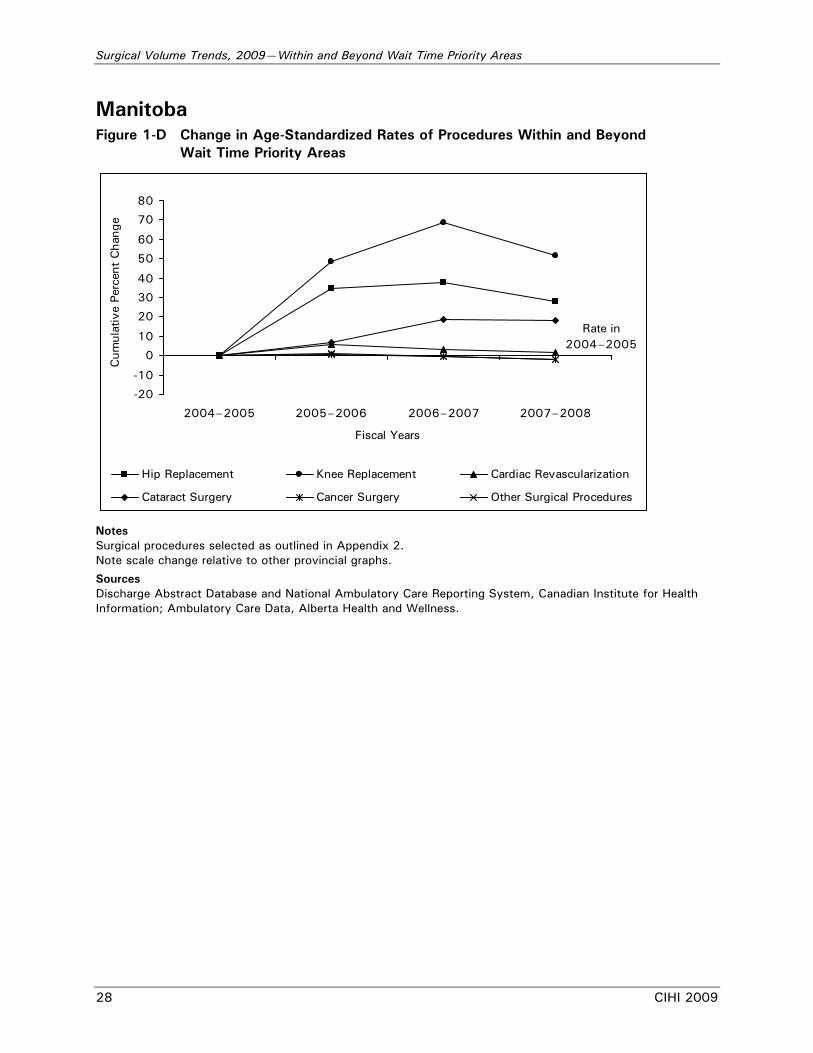
Manitoba Figure 1-D Change in Age-Standardized Rates of Procedures Within and Beyond
Wait Time Priority Areas
-20
-10
0
10
20
30
40
50
60
70
80
2004–2005 2005–2006 2006–2007 2007–2008
Fiscal Years
Cum
ulat
ive
Perc
ent
Cha
nge
Hip Replacement Knee Replacement Cardiac Revascularization
Cataract Surgery Cancer Surgery Other Surgical Procedures
Rate in 2004–2005
Notes Surgical procedures selected as outlined in Appendix 2. Note scale change relative to other provincial graphs.
Sources Discharge Abstract Database and National Ambulatory Care Reporting System, Canadian Institute for Health Information; Ambulatory Care Data, Alberta Health and Wellness.
Surgical Volume Trends, 2009—Within and Beyond Wait Time Priority Areas
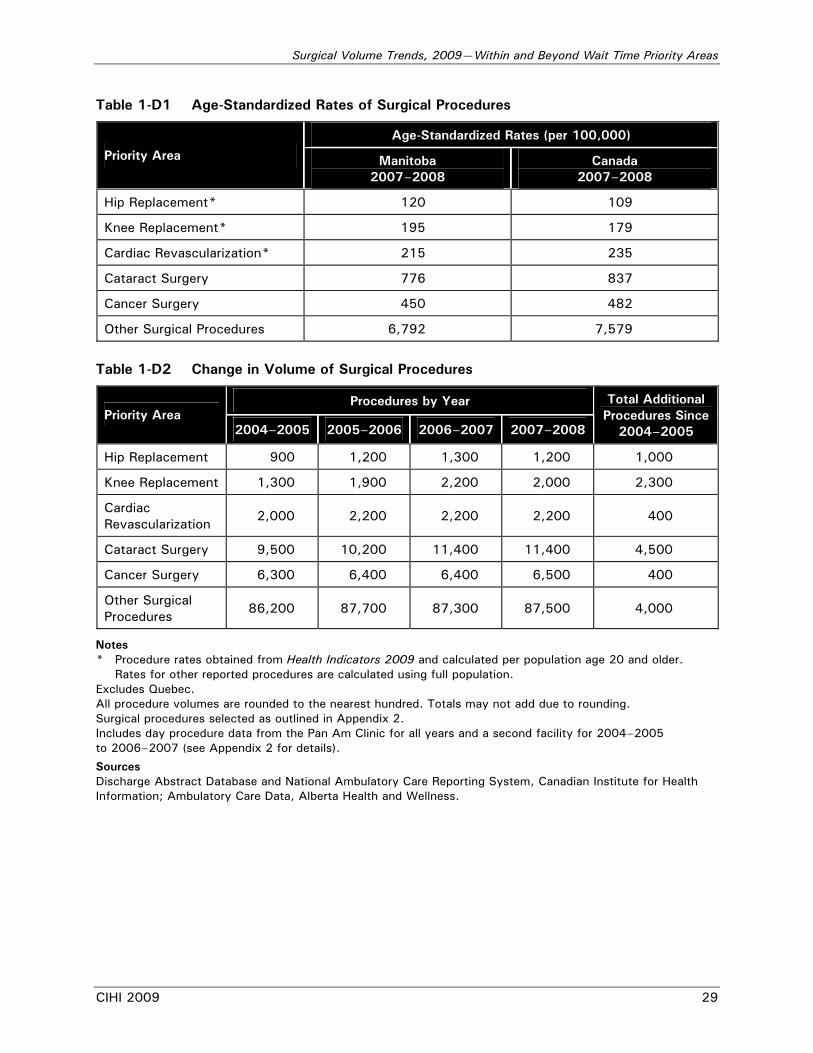
CIHI 2009 29
Table 1-D1 Age-Standardized Rates of Surgical Procedures
Age-Standardized Rates (per 100,000)
Priority Area Manitoba 2007–2008
Canada 2007–2008
Hip Replacement* 120 109
Knee Replacement* 195 179
Cardiac Revascularization* 215 235
Cataract Surgery 776 837
Cancer Surgery 450 482
Other Surgical Procedures 6,792 7,579
Table 1-D2 Change in Volume of Surgical Procedures
Procedures by Year Priority Area
2004–2005 2005–2006 2006–2007 2007–2008
Total Additional Procedures Since
2004–2005
Hip Replacement 900 1,200 1,300 1,200 1,000
Knee Replacement 1,300 1,900 2,200 2,000 2,300
Cardiac Revascularization
2,000 2,200 2,200 2,200 400
Cataract Surgery 9,500 10,200 11,400 11,400 4,500
Cancer Surgery 6,300 6,400 6,400 6,500 400
Other Surgical Procedures
86,200 87,700 87,300 87,500 4,000
Notes * Procedure rates obtained from Health Indicators 2009 and calculated per population age 20 and older.
Rates for other reported procedures are calculated using full population. Excludes Quebec. All procedure volumes are rounded to the nearest hundred. Totals may not add due to rounding. Surgical procedures selected as outlined in Appendix 2. Includes day procedure data from the Pan Am Clinic for all years and a second facility for 2004–2005 to 2006–2007 (see Appendix 2 for details).
Sources Discharge Abstract Database and National Ambulatory Care Reporting System, Canadian Institute for Health Information; Ambulatory Care Data, Alberta Health and Wellness.
Surgical Volume Trends, 2009—Within and Beyond Wait Time Priority Areas
30 CIHI 2009
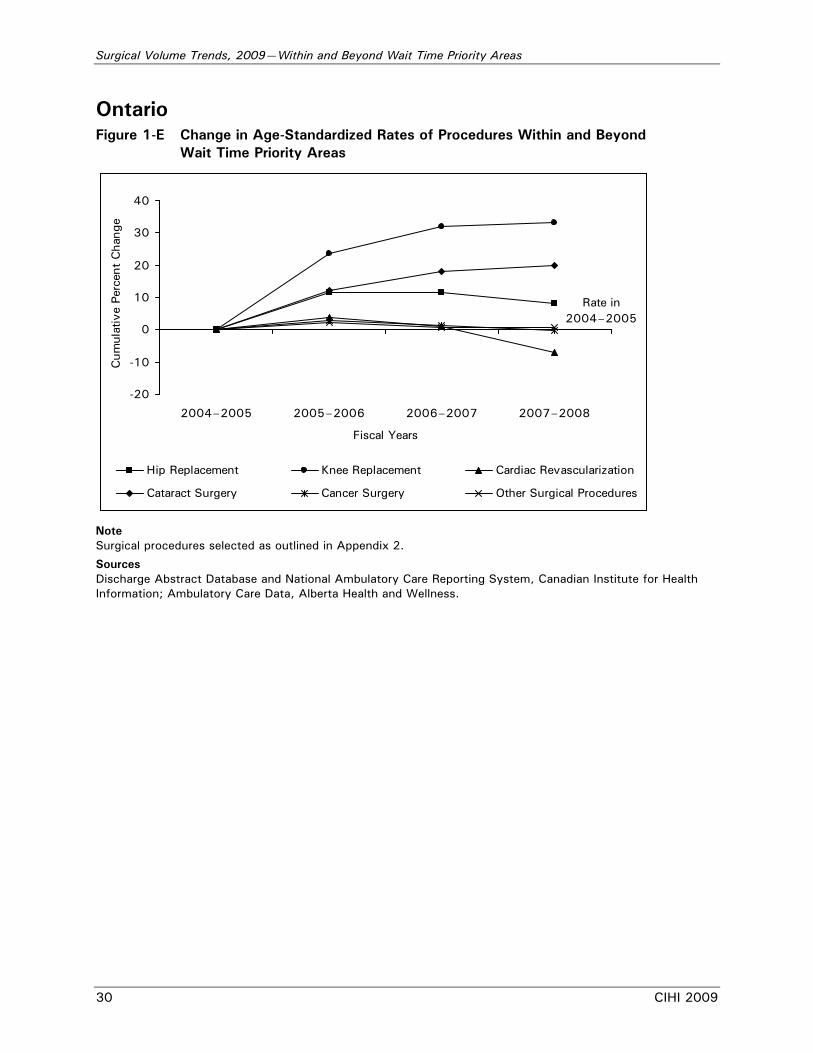
Ontario Figure 1-E Change in Age-Standardized Rates of Procedures Within and Beyond
Wait Time Priority Areas
-20
-10
0
10
20
30
40
2004–2005 2005–2006 2006–2007 2007–2008
Fiscal Years
Cum
ulat
ive
Perc
ent
Cha
nge
Hip Replacement Knee Replacement Cardiac Revascularization
Cataract Surgery Cancer Surgery Other Surgical Procedures
Rate in 2004–2005
Note Surgical procedures selected as outlined in Appendix 2.
Sources Discharge Abstract Database and National Ambulatory Care Reporting System, Canadian Institute for Health Information; Ambulatory Care Data, Alberta Health and Wellness.
Surgical Volume Trends, 2009—Within and Beyond Wait Time Priority Areas
CIHI 2009 31
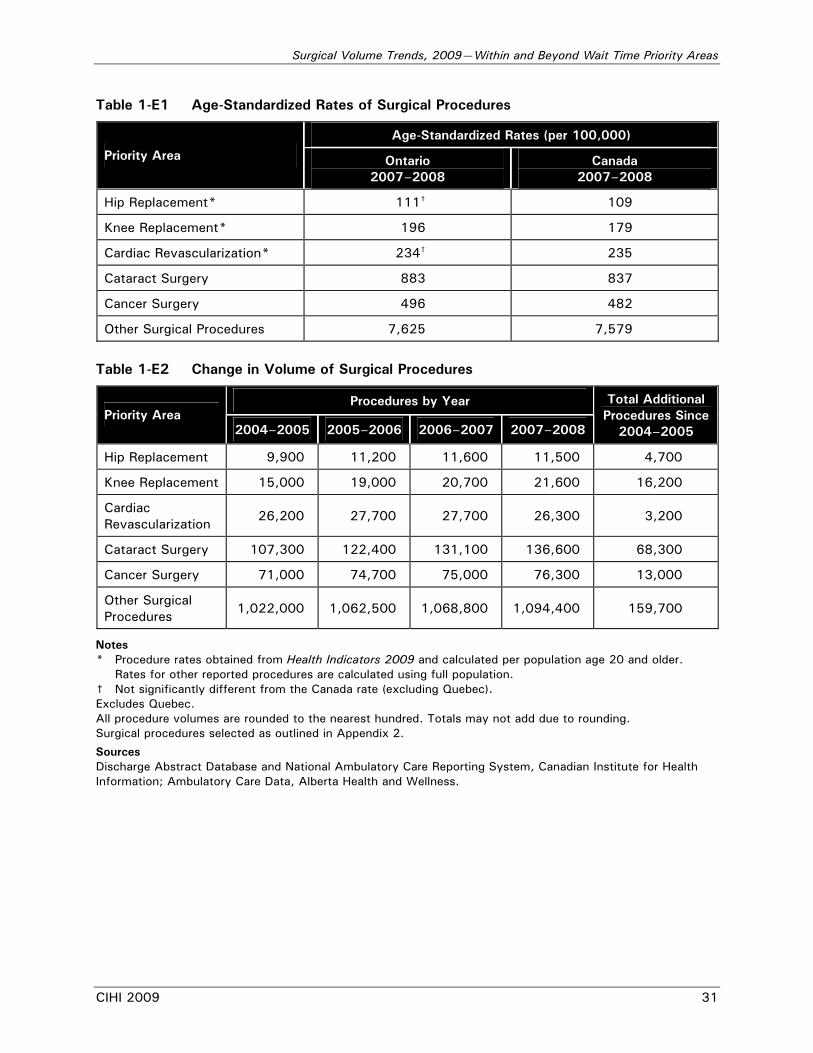
Table 1-E1 Age-Standardized Rates of Surgical Procedures
Age-Standardized Rates (per 100,000)
Priority Area Ontario 2007–2008
Canada 2007–2008
Hip Replacement* 111† 109
Knee Replacement* 196 179
Cardiac Revascularization* 234† 235
Cataract Surgery 883 837
Cancer Surgery 496 482
Other Surgical Procedures 7,625 7,579
Table 1-E2 Change in Volume of Surgical Procedures
Procedures by Year Priority Area
2004–2005 2005–2006 2006–2007 2007–2008
Total Additional Procedures Since
2004–2005
Hip Replacement 9,900 11,200 11,600 11,500 4,700
Knee Replacement 15,000 19,000 20,700 21,600 16,200
Cardiac Revascularization
26,200 27,700 27,700 26,300 3,200
Cataract Surgery 107,300 122,400 131,100 136,600 68,300
Cancer Surgery 71,000 74,700 75,000 76,300 13,000
Other Surgical Procedures
1,022,000 1,062,500 1,068,800 1,094,400 159,700
Notes * Procedure rates obtained from Health Indicators 2009 and calculated per population age 20 and older.
Rates for other reported procedures are calculated using full population. † Not significantly different from the Canada rate (excluding Quebec). Excludes Quebec. All procedure volumes are rounded to the nearest hundred. Totals may not add due to rounding. Surgical procedures selected as outlined in Appendix 2.
Sources Discharge Abstract Database and National Ambulatory Care Reporting System, Canadian Institute for Health Information; Ambulatory Care Data, Alberta Health and Wellness.
Surgical Volume Trends, 2009—Within and Beyond Wait Time Priority Areas
32 CIHI 2009
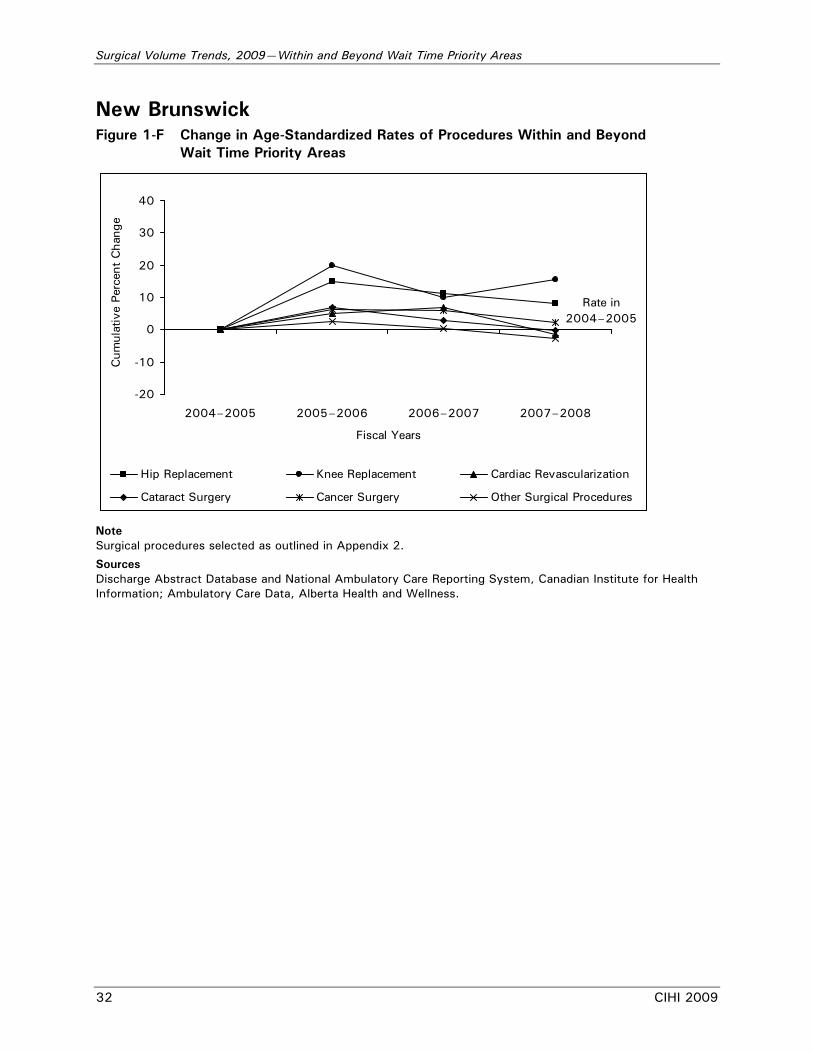
New Brunswick Figure 1-F Change in Age-Standardized Rates of Procedures Within and Beyond
Wait Time Priority Areas
-20
-10
0
10
20
30
40
2004–2005 2005–2006 2006–2007 2007–2008
Fiscal Years
Cum
ulat
ive
Perc
ent
Cha
nge
Hip Replacement Knee Replacement Cardiac Revascularization
Cataract Surgery Cancer Surgery Other Surgical Procedures
Rate in 2004–2005
Note Surgical procedures selected as outlined in Appendix 2.
Sources Discharge Abstract Database and National Ambulatory Care Reporting System, Canadian Institute for Health Information; Ambulatory Care Data, Alberta Health and Wellness.
Surgical Volume Trends, 2009—Within and Beyond Wait Time Priority Areas
CIHI 2009 33
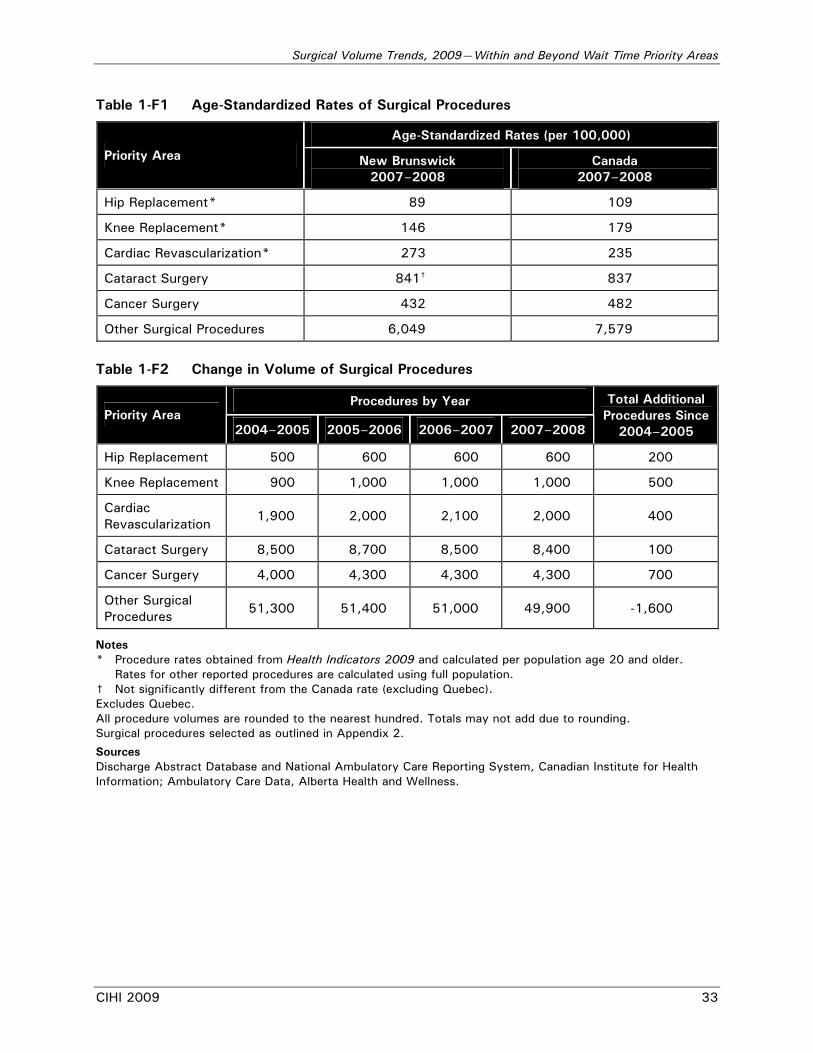
Table 1-F1 Age-Standardized Rates of Surgical Procedures
Age-Standardized Rates (per 100,000)
Priority Area New Brunswick 2007–2008
Canada 2007–2008
Hip Replacement* 89 109
Knee Replacement* 146 179
Cardiac Revascularization* 273 235
Cataract Surgery 841† 837
Cancer Surgery 432 482
Other Surgical Procedures 6,049 7,579
Table 1-F2 Change in Volume of Surgical Procedures
Procedures by Year Priority Area
2004–2005 2005–2006 2006–2007 2007–2008
Total Additional Procedures Since
2004–2005
Hip Replacement 500 600 600 600 200
Knee Replacement 900 1,000 1,000 1,000 500
Cardiac Revascularization
1,900 2,000 2,100 2,000 400
Cataract Surgery 8,500 8,700 8,500 8,400 100
Cancer Surgery 4,000 4,300 4,300 4,300 700
Other Surgical Procedures
51,300 51,400 51,000 49,900 -1,600
Notes * Procedure rates obtained from Health Indicators 2009 and calculated per population age 20 and older.
Rates for other reported procedures are calculated using full population. † Not significantly different from the Canada rate (excluding Quebec). Excludes Quebec. All procedure volumes are rounded to the nearest hundred. Totals may not add due to rounding. Surgical procedures selected as outlined in Appendix 2.
Sources Discharge Abstract Database and National Ambulatory Care Reporting System, Canadian Institute for Health Information; Ambulatory Care Data, Alberta Health and Wellness.
Surgical Volume Trends, 2009—Within and Beyond Wait Time Priority Areas
34 CIHI 2009
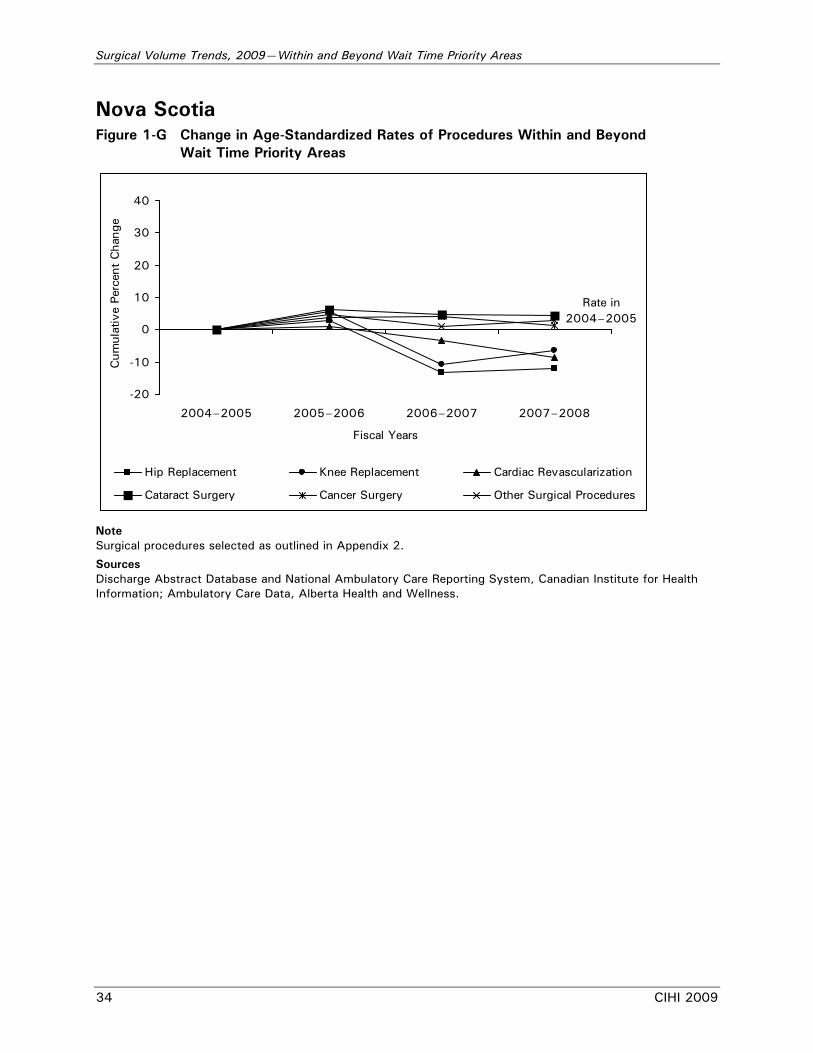
Nova Scotia Figure 1-G Change in Age-Standardized Rates of Procedures Within and Beyond
Wait Time Priority Areas
-20
-10
0
10
20
30
40
2004–2005 2005–2006 2006–2007 2007–2008
Fiscal Years
Cum
ulat
ive
Perc
ent
Cha
nge
Hip Replacement Knee Replacement Cardiac Revascularization
Cataract Surgery Cancer Surgery Other Surgical Procedures
Rate in 2004–2005
Note Surgical procedures selected as outlined in Appendix 2.
Sources Discharge Abstract Database and National Ambulatory Care Reporting System, Canadian Institute for Health Information; Ambulatory Care Data, Alberta Health and Wellness.

Surgical Volume Trends, 2009—Within and Beyond Wait Time Priority Areas
CIHI 2009 35
Table 1-G1 Age-Standardized Rates of Surgical Procedures
Age-Standardized Rates (per 100,000)
Priority Area Nova Scotia 2007–2008
Canada 2007–2008
Hip Replacement* 93 109
Knee Replacement* 135 179
Cardiac Revascularization* 236† 235
Cataract Surgery 770 837
Cancer Surgery 646 482
Other Surgical Procedures 9,045 7,579
Table 1-G2 Change in Volume of Surgical Procedures
Procedures by Year Priority Area
2004–2005 2005–2006 2006–2007 2007–2008
Total Additional Procedures Since
2004–2005
Hip Replacement 800 800 700 800 -100
Knee Replacement 1,200 1,300 1,100 1,200 0
Cardiac Revascularization
2,200 2,300 2,200 2,100 100
Cataract Surgery 9,000 9,600 9,600 9,800 2,000
Cancer Surgery 7,500 7,900 8,100 8,000 1,500
Other Surgical Procedures
92,100 97,300 95,000 98,500 14,500
Notes * Procedure rates obtained from Health Indicators 2009 and calculated per population age 20 and older.
Rates for other reported procedures are calculated using full population. † Not significantly different from the Canada rate (excluding Quebec). Excludes Quebec. All procedure volumes are rounded to the nearest hundred. Totals may not add due to rounding. Surgical procedures selected as outlined in Appendix 2.
Sources Discharge Abstract Database and National Ambulatory Care Reporting System, Canadian Institute for Health Information; Ambulatory Care Data, Alberta Health and Wellness.
Surgical Volume Trends, 2009—Within and Beyond Wait Time Priority Areas
36 CIHI 2009
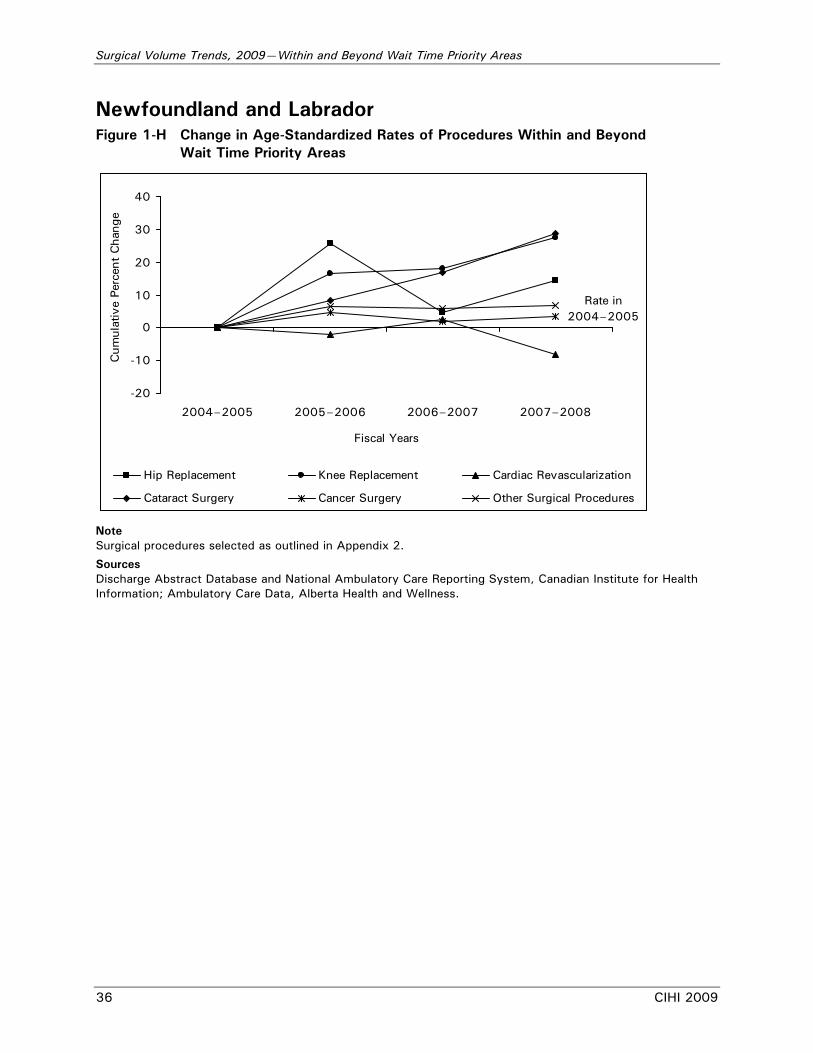
Newfoundland and Labrador Figure 1-H Change in Age-Standardized Rates of Procedures Within and Beyond
Wait Time Priority Areas
-20
-10
0
10
20
30
40
2004–2005 2005–2006 2006–2007 2007–2008
Fiscal Years
Cum
ulat
ive
Perc
ent
Cha
nge
Hip Replacement Knee Replacement Cardiac Revascularization
Cataract Surgery Cancer Surgery Other Surgical Procedures
Rate in 2004–2005
Note Surgical procedures selected as outlined in Appendix 2.
Sources Discharge Abstract Database and National Ambulatory Care Reporting System, Canadian Institute for Health Information; Ambulatory Care Data, Alberta Health and Wellness.
Surgical Volume Trends, 2009—Within and Beyond Wait Time Priority Areas
CIHI 2009 37
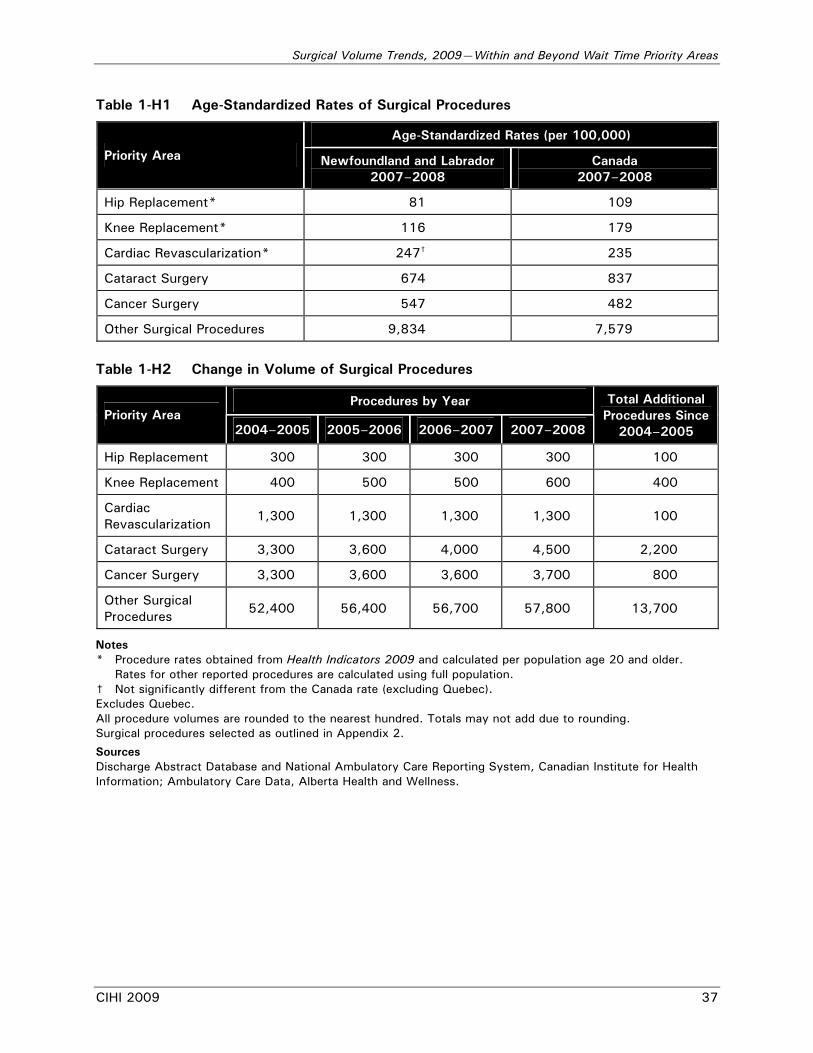
Table 1-H1 Age-Standardized Rates of Surgical Procedures
Age-Standardized Rates (per 100,000)
Priority Area Newfoundland and Labrador 2007–2008
Canada 2007–2008
Hip Replacement* 81 109
Knee Replacement* 116 179
Cardiac Revascularization* 247† 235
Cataract Surgery 674 837
Cancer Surgery 547 482
Other Surgical Procedures 9,834 7,579
Table 1-H2 Change in Volume of Surgical Procedures
Procedures by Year Priority Area
2004–2005 2005–2006 2006–2007 2007–2008
Total Additional Procedures Since
2004–2005
Hip Replacement 300 300 300 300 100
Knee Replacement 400 500 500 600 400
Cardiac Revascularization
1,300 1,300 1,300 1,300 100
Cataract Surgery 3,300 3,600 4,000 4,500 2,200
Cancer Surgery 3,300 3,600 3,600 3,700 800
Other Surgical Procedures
52,400 56,400 56,700 57,800 13,700
Notes * Procedure rates obtained from Health Indicators 2009 and calculated per population age 20 and older.
Rates for other reported procedures are calculated using full population. † Not significantly different from the Canada rate (excluding Quebec). Excludes Quebec. All procedure volumes are rounded to the nearest hundred. Totals may not add due to rounding. Surgical procedures selected as outlined in Appendix 2.
Sources Discharge Abstract Database and National Ambulatory Care Reporting System, Canadian Institute for Health Information; Ambulatory Care Data, Alberta Health and Wellness.
Surgical Volume Trends, 2009—Within and Beyond Wait Time Priority Areas
38 CIHI 2009
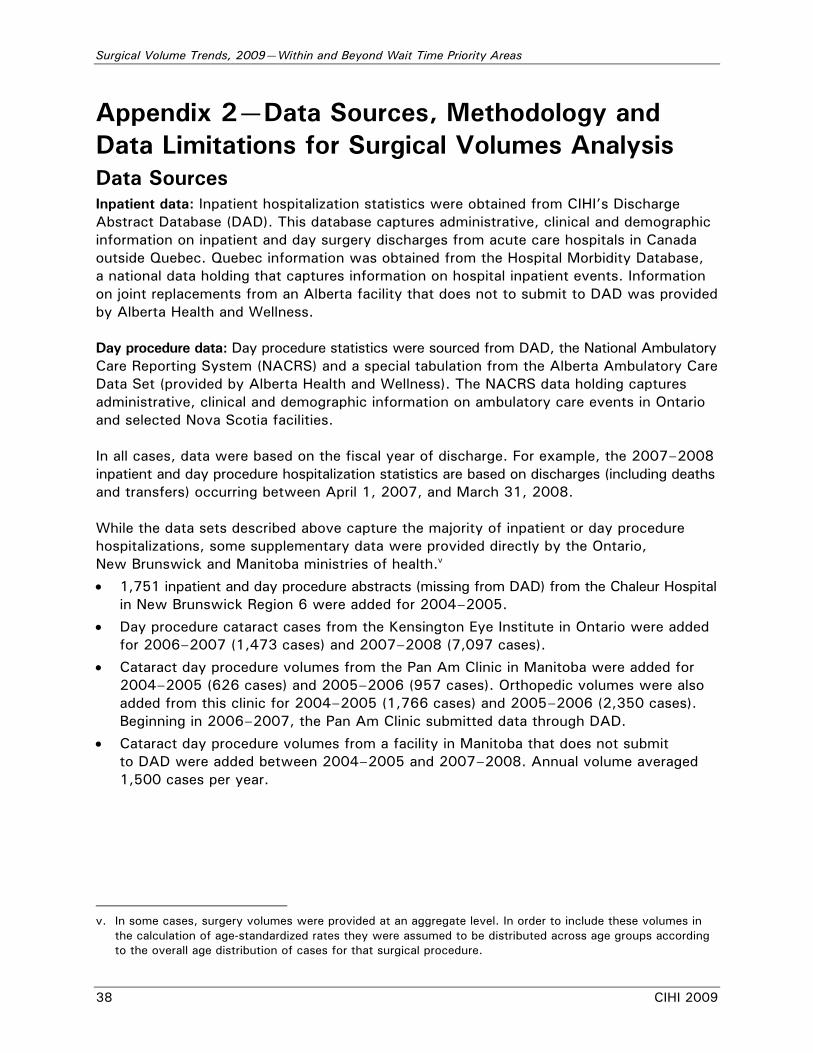
Appendix 2—Data Sources, Methodology and Data Limitations for Surgical Volumes Analysis Data Sources Inpatient data: Inpatient hospitalization statistics were obtained from CIHI’s Discharge Abstract Database (DAD). This database captures administrative, clinical and demographic information on inpatient and day surgery discharges from acute care hospitals in Canada outside Quebec. Quebec information was obtained from the Hospital Morbidity Database, a national data holding that captures information on hospital inpatient events. Information on joint replacements from an Alberta facility that does not to submit to DAD was provided by Alberta Health and Wellness. Day procedure data: Day procedure statistics were sourced from DAD, the National Ambulatory Care Reporting System (NACRS) and a special tabulation from the Alberta Ambulatory Care Data Set (provided by Alberta Health and Wellness). The NACRS data holding captures administrative, clinical and demographic information on ambulatory care events in Ontario and selected Nova Scotia facilities. In all cases, data were based on the fiscal year of discharge. For example, the 2007–2008 inpatient and day procedure hospitalization statistics are based on discharges (including deaths and transfers) occurring between April 1, 2007, and March 31, 2008. While the data sets described above capture the majority of inpatient or day procedure hospitalizations, some supplementary data were provided directly by the Ontario, New Brunswick and Manitoba ministries of health.v
• 1,751 inpatient and day procedure abstracts (missing from DAD) from the Chaleur Hospital in New Brunswick Region 6 were added for 2004–2005.
• Day procedure cataract cases from the Kensington Eye Institute in Ontario were added for 2006–2007 (1,473 cases) and 2007–2008 (7,097 cases).
• Cataract day procedure volumes from the Pan Am Clinic in Manitoba were added for 2004–2005 (626 cases) and 2005–2006 (957 cases). Orthopedic volumes were also added from this clinic for 2004–2005 (1,766 cases) and 2005–2006 (2,350 cases). Beginning in 2006–2007, the Pan Am Clinic submitted data through DAD.
• Cataract day procedure volumes from a facility in Manitoba that does not submit to DAD were added between 2004–2005 and 2007–2008. Annual volume averaged 1,500 cases per year.
v. In some cases, surgery volumes were provided at an aggregate level. In order to include these volumes in
the calculation of age-standardized rates they were assumed to be distributed across age groups according to the overall age distribution of cases for that surgical procedure.
Surgical Volume Trends, 2009—Within and Beyond Wait Time Priority Areas
CIHI 2009 39
There were some data missing from the inpatient and day surgery data sets for which no adjustments were made:
• In 2005–2006, the Medicine Hat Regional Hospital in Alberta did not submit two months of data. An estimated 1,800 inpatient abstracts were missing. This hospital is located in Palliser Health Region and is a major care provider in this region, performing about 80% of joint replacements. In addition, approximately 600 inpatient abstracts were missing from two other facilities.
• Inpatient and day procedure abstracts were not submitted by Queen Elizabeth II Hospital in Grand Prairie, Alberta, for three periods in 2006–2007. Three other smaller facilities in the same region (Peace Country) were also missing some data. Across the Queen Elizabeth II and other facilities, an estimated 2,400 inpatient and 5,100 day procedure abstracts were missing.
Methodology Most results are reported for Canada as a whole. Where provincial data are provided, they are based on where patients reside, not where they were treated. Patient province was assigned based on the first three characters of patient postal code. Where patient postal codes were missing, patient province was assigned based on the province that issued the patient’s health card. Cases were selected based on the total number of discharges with a surgical intervention, rather than the total number of interventions. For example, a bilateral knee replacement provided during one admission was counted as one event. Hospitalization rates were age-standardized (adjusted for age). Age-standardization is a statistical technique used to remove the effect of the difference in the age distribution of two or more populations when comparing rates across different populations or the same population over time. The 1991 Canadian population was used for the standard population in adjusting hospitalization rates for age. Fiscal year provincial and territorial population estimates as of October 1 provided by Statistics Canada were used in the calculations. Selection of Day Procedures There are variations among provinces and territories in what is considered a day procedure. Initial case selection for Newfoundland and Labrador, Prince Edward Island, Nova Scotia (DAD facilities), Manitoba, Saskatchewan and British Columbia included all day procedure abstracts submitted to DAD. Elsewhere, additional information on case selection criteria was applied, as shown in Table 2-1.
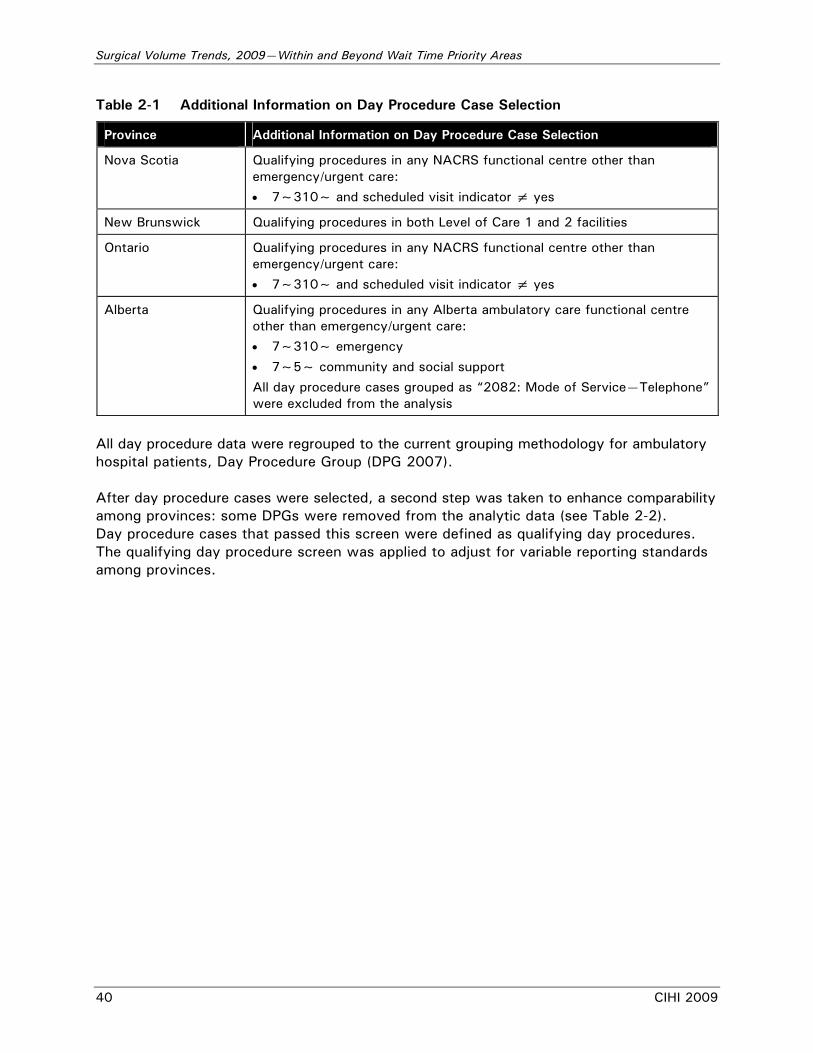
Surgical Volume Trends, 2009—Within and Beyond Wait Time Priority Areas
40 CIHI 2009
Table 2-1 Additional Information on Day Procedure Case Selection
Province Additional Information on Day Procedure Case Selection
Nova Scotia Qualifying procedures in any NACRS functional centre other than emergency/urgent care:
• 7~310~ and scheduled visit indicator ≠ yes
New Brunswick Qualifying procedures in both Level of Care 1 and 2 facilities
Ontario Qualifying procedures in any NACRS functional centre other than emergency/urgent care:
• 7~310~ and scheduled visit indicator ≠ yes
Alberta Qualifying procedures in any Alberta ambulatory care functional centre other than emergency/urgent care:
• 7~310~ emergency
• 7~5~ community and social support
All day procedure cases grouped as “2082: Mode of Service—Telephone” were excluded from the analysis
All day procedure data were regrouped to the current grouping methodology for ambulatory hospital patients, Day Procedure Group (DPG 2007). After day procedure cases were selected, a second step was taken to enhance comparability among provinces: some DPGs were removed from the analytic data (see Table 2-2). Day procedure cases that passed this screen were defined as qualifying day procedures. The qualifying day procedure screen was applied to adjust for variable reporting standards among provinces.
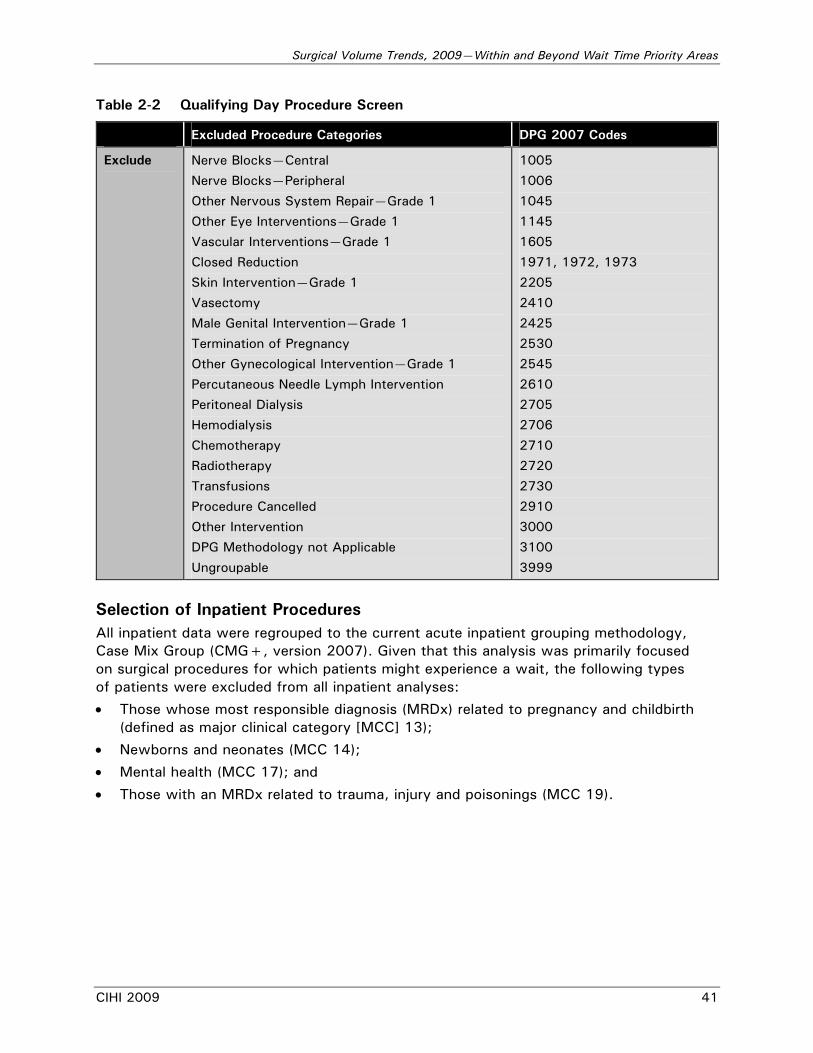
Surgical Volume Trends, 2009—Within and Beyond Wait Time Priority Areas
CIHI 2009 41
Table 2-2 Qualifying Day Procedure Screen
Excluded Procedure Categories DPG 2007 Codes
Exclude Nerve Blocks—Central
Nerve Blocks—Peripheral
Other Nervous System Repair—Grade 1
Other Eye Interventions—Grade 1
Vascular Interventions—Grade 1
Closed Reduction
Skin Intervention—Grade 1
Vasectomy
Male Genital Intervention—Grade 1
Termination of Pregnancy
Other Gynecological Intervention—Grade 1
Percutaneous Needle Lymph Intervention
Peritoneal Dialysis
Hemodialysis
Chemotherapy
Radiotherapy
Transfusions
Procedure Cancelled
Other Intervention
DPG Methodology not Applicable
Ungroupable
1005
1006
1045
1145
1605
1971, 1972, 1973
2205
2410
2425
2530
2545
2610
2705
2706
2710
2720
2730
2910
3000
3100
3999
Selection of Inpatient Procedures All inpatient data were regrouped to the current acute inpatient grouping methodology, Case Mix Group (CMG+, version 2007). Given that this analysis was primarily focused on surgical procedures for which patients might experience a wait, the following types of patients were excluded from all inpatient analyses:
• Those whose most responsible diagnosis (MRDx) related to pregnancy and childbirth (defined as major clinical category [MCC] 13);
• Newborns and neonates (MCC 14);
• Mental health (MCC 17); and
• Those with an MRDx related to trauma, injury and poisonings (MCC 19).
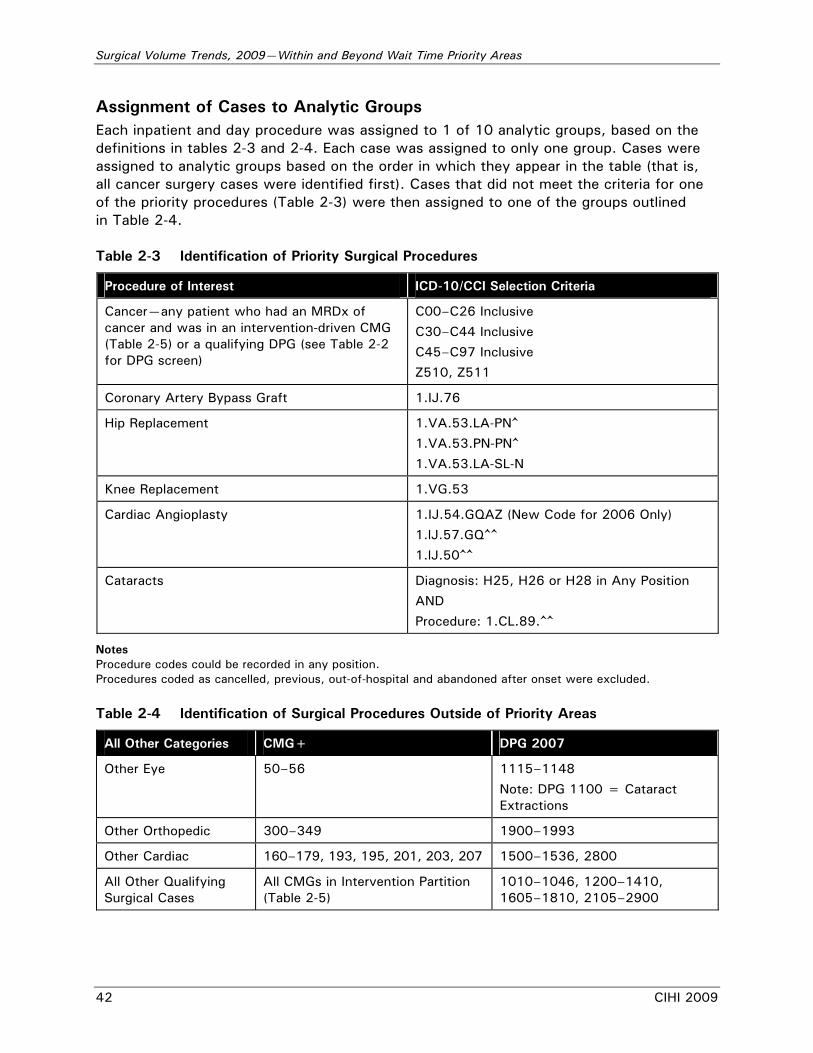
Surgical Volume Trends, 2009—Within and Beyond Wait Time Priority Areas
42 CIHI 2009
Assignment of Cases to Analytic Groups Each inpatient and day procedure was assigned to 1 of 10 analytic groups, based on the definitions in tables 2-3 and 2-4. Each case was assigned to only one group. Cases were assigned to analytic groups based on the order in which they appear in the table (that is, all cancer surgery cases were identified first). Cases that did not meet the criteria for one of the priority procedures (Table 2-3) were then assigned to one of the groups outlined in Table 2-4. Table 2-3 Identification of Priority Surgical Procedures
Procedure of Interest ICD-10/CCI Selection Criteria
Cancer—any patient who had an MRDx of cancer and was in an intervention-driven CMG (Table 2-5) or a qualifying DPG (see Table 2-2 for DPG screen)
C00–C26 Inclusive
C30–C44 Inclusive
C45–C97 Inclusive
Z510, Z511
Coronary Artery Bypass Graft 1.IJ.76
Hip Replacement 1.VA.53.LA-PN^
1.VA.53.PN-PN^
1.VA.53.LA-SL-N
Knee Replacement 1.VG.53
Cardiac Angioplasty 1.IJ.54.GQAZ (New Code for 2006 Only)
1.lJ.57.GQ^^
1.lJ.50^^
Cataracts Diagnosis: H25, H26 or H28 in Any Position
AND
Procedure: 1.CL.89.^^
Notes Procedure codes could be recorded in any position. Procedures coded as cancelled, previous, out-of-hospital and abandoned after onset were excluded. Table 2-4 Identification of Surgical Procedures Outside of Priority Areas
All Other Categories CMG+ DPG 2007
Other Eye 50–56 1115–1148
Note: DPG 1100 = Cataract Extractions
Other Orthopedic 300–349 1900–1993
Other Cardiac 160–179, 193, 195, 201, 203, 207 1500–1536, 2800
All Other Qualifying Surgical Cases
All CMGs in Intervention Partition (Table 2-5)
1010–1046, 1200–1410, 1605–1810, 2105–2900
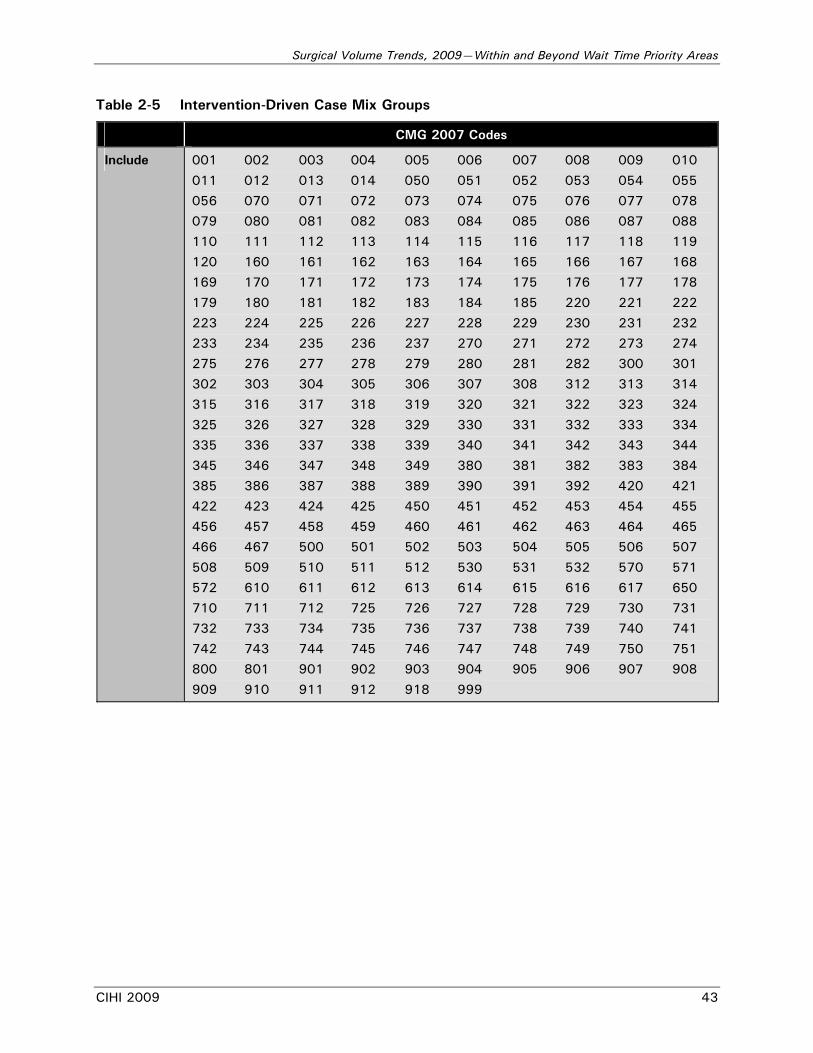
Surgical Volume Trends, 2009—Within and Beyond Wait Time Priority Areas
CIHI 2009 43
Table 2-5 Intervention-Driven Case Mix Groups
CMG 2007 Codes
Include 001 002 003 004 005 006 007 008 009 010
011 012 013 014 050 051 052 053 054 055
056 070 071 072 073 074 075 076 077 078
079 080 081 082 083 084 085 086 087 088
110 111 112 113 114 115 116 117 118 119
120 160 161 162 163 164 165 166 167 168
169 170 171 172 173 174 175 176 177 178
179 180 181 182 183 184 185 220 221 222
223 224 225 226 227 228 229 230 231 232
233 234 235 236 237 270 271 272 273 274
275 276 277 278 279 280 281 282 300 301
302 303 304 305 306 307 308 312 313 314
315 316 317 318 319 320 321 322 323 324
325 326 327 328 329 330 331 332 333 334
335 336 337 338 339 340 341 342 343 344
345 346 347 348 349 380 381 382 383 384
385 386 387 388 389 390 391 392 420 421
422 423 424 425 450 451 452 453 454 455
456 457 458 459 460 461 462 463 464 465
466 467 500 501 502 503 504 505 506 507
508 509 510 511 512 530 531 532 570 571
572 610 611 612 613 614 615 616 617 650
710 711 712 725 726 727 728 729 730 731
732 733 734 735 736 737 738 739 740 741
742 743 744 745 746 747 748 749 750 751
800 801 901 902 903 904 905 906 907 908
909 910 911 912 918 999
Surgical Volume Trends, 2009—Within and Beyond Wait Time Priority Areas
44 CIHI 2009
Appendix 3—Data Sources and Methodology for Surgeon Volume and Consultation Analyses Data Sources Data for physician consultations and surgical volume analyses were obtained from the National Physician Database (NPDB) from 2003–2004 to 2006–2007 (the most recent data available at the time of analysis). This data set includes information on fee-for-service physician payments in Canada obtained from provincial and territorial medical health care insurance plans. The NPDB contains:
• Socio-demographic, payment and service utilization data of physicians’ fee-for-service billings; and
• Service utilization data, by age group and sex, of their patients. Data in the NPDB do not include services provided by physicians on alternative payment plans. Alternative payments in 2004–2005 were approximately $2.65 billion, or 20.5% of the value of physicians’ clinical payments. The percentage of alternative payments varied considerably across jurisdictions in 2004–2005, ranging from 10.8% in Alberta to 41.5% in Nova Scotia and 97.3% in the Northwest Territories.
Methodology Physicians were selected for analysis if their main physician specialty was orthopedics, ophthalmology or cardiac care. This field is derived from the plan payment specialty of physicians’ fee-for-service billings submitted to the NPDB. In addition, orthopedic specialists must have billed for a hip or knee arthroplasty at least once since 2003–2004, while ophthalmologists must have billed for a cataract procedure and the cardiac specialists for bypass surgery or angioplasty in those same years. Because cancer surgery is performed by a broad range of surgical specialties, it was not included in this analysis. The number of fee-for-service consultations performed by specialists working in wait time priority areas were counted. All consults for these physicians were included because the NPDB data cannot identify which consultations were directly linked to a particular surgical procedure. Consultations were included if they were part of the following two categories: 001 major consultations (special surgical consult) or 002 other consultations (prenatal, limited, repeat, diagnostic consultation). The number of knee replacements and cataract procedures performed per specialist physician per year were calculated. The distribution of knee replacements and cataract procedures by physician volume were presented according to predefined volume cut-offs.


Taking health information further
À l’avant-garde de l’information sur la santéwww.cihi.ca
www.icis.ca