Embed Size (px)
Citation preview
Production of this document is made possible by financial contributions from Health Canada and provincial and territorial governments. The views expressed herein do not necessarily represent the views of Health Canada or any provincial or territorial government.
All rights reserved.
The contents of this publication may be reproduced unaltered, in whole or in part and by any means, solely for non-commercial purposes, provided that the Canadian Institute for Health Information is properly and fully acknowledged as the copyright owner. Any reproduction or use of this publication or its contents for any commercial purpose requires the prior written authorization of the Canadian Institute for Health Information. Reproduction or use that suggests endorsement by, or affiliation with, the Canadian Institute for Health Information is prohibited.
For permission or information, please contact CIHI:
Canadian Institute for Health Information495 Richmond Road, Suite 600Ottawa, Ontario K2A 4H6
Phone: 613-241-7860Fax: [email protected]
ISBN 978-1-77109-619-5 (PDF)
© 2017 Canadian Institute for Health Information
How to cite this document:Canadian Institute for Health Information. Understanding Variability in the Cost of a Standard Hospital Stay. Ottawa, ON: CIHI; 2017.
Cette publication est aussi disponible en français sous le titre Comprendre la variabilité du coût d’un séjour standard à l’hôpital.ISBN 978-1-77109-620-1 (PDF)
Table of contents Acknowledgements .................................................................................................................... 4
Executive summary .................................................................................................................... 5
About CIHI’s efficiency and health system performance work .................................................... 7
1 Introduction ....................................................................................................................... 8
1.1 Organization of the report ....................................................................................... 8
1.2 Background ............................................................................................................ 8
1.3 Objective ................................................................................................................. 9
1.4 Data sources........................................................................................................... 9
1.5 Defining and understanding CSHS ......................................................................... 9
1.6 Variation (descriptive) ............................................................................................11
2 Approach ..........................................................................................................................16
2.1 Literature review ....................................................................................................16
2.2 Expert Advisory Group ...........................................................................................16
2.3 Scope ....................................................................................................................16
2.4 Methodological/conceptual components ................................................................17
3 Results .............................................................................................................................22
3.1 Inclusion of indirect expenses ................................................................................22
3.2 The effect of inpatient stays that cross fiscal years ................................................27
3.3 Measuring the influence of exogenous factors .......................................................32
3.4 Overall summary of results ....................................................................................40
4 Discussion ........................................................................................................................42
Appendix A: Pooled versus arithmetic mean .............................................................................44
Appendix B: Jurisdictional wage index ......................................................................................46
Appendix C: DAD reporting practices and their impact on the CSHS ........................................47
Appendix D: Modelling with an alternative denominator ............................................................54
Appendix E: CSHS methodology ..............................................................................................60
Appendix F: Glossary of terms ..................................................................................................71
Appendix G: Literature review methodology and summary .......................................................77
Appendix H: Abbreviations ........................................................................................................84
Appendix I: Text alternative for figure ........................................................................................86
References ...............................................................................................................................87

Understanding Variability in the Cost of a Standard Hospital Stay
4
Acknowledgements The Canadian Institute for Health Information (CIHI) wishes to acknowledge and thank the following individuals for their contribution to Understanding Variability in the Cost of a Standard Hospital Stay:
• Adam Rondeau, CIHI
• Christine Boyes, CIHI
• Jun Gao, CIHI
• Jacqueline Singer, CIHI
• Minh Duong-Hua, CIHI
• Pierre Léveillé, CIHI
• Nathalie Robertson, CIHI
• Michael Hunt, CIHI
• Brent Diverty, CIHI
• Sara Allin, CIHI
• Katerina Gapanenko, CIHI
CIHI would also like to thank the Expert Advisory Group for its invaluable advice:
• Kim Walker, Director, Activity and Costing, Alberta Health Services
• Phil Jarman, Regional Director, Decision Support, Winnipeg Regional Health Authority
• Greg Zinck, Manager, Case Mix, CIHI
• Naisu Zhu, Senior Methodologist, CIHI
• Lee Geyer, Managing Partner, Geyer & Associates

Understanding Variability in the Cost of a Standard Hospital Stay
5
Executive summary In 2015, Canadians spent almost $65 billion on the hospital sector — the largest amount spent in any single health spending category.1 Given the size of the sector, the efficient operation of hospitals is critical to ensuring sustainable health care systems. Comparative financial indicators provide the ability to measure and compare the financial performance of Canadian hospitals.
The Cost of a Standard Hospital Stay (CSHS) indicator is one of the most widely used financial indicators produced by the Canadian Institute for Health Information (CIHI). This measure is used to monitor and compare the costs of a typical inpatient stay in acute care hospitals. The CSHS is frequently used to estimate costs, allocate funds and monitor hospital performance. Over the years, CIHI has been asked why the CSHS results vary among peers and over time.
Exogenous factors and hospital management decisions are the main drivers of CSHS variability among peers.
While previous CIHI publications have acknowledged that many factors such as staff mix, teaching status and facility size might affect CSHS variability, there have been no systematic investigations to verify or quantify these factors. This report attempts to identify and estimate the impact of these factors on the variability of the CSHS values.
After examining the likely causes of variation in the indicator estimates, CIHI’s previous guidance is largely borne out by the evidence; most of the differences between hospitals’ CSHS estimates can be explained either by exogenous factors or by hospital management decisions.
Many of the factors that influence CSHS variability among peers are outside of a hospital’s control, including location, teaching status, size and wage differences.
Some of the factors that affect the cost of providing inpatient care include a rural location (+3%), teaching activities (+18%) and the relative size of the hospital, with the smallest hospitals being around 10% more costly than the largest. The presence of onsite rehabilitation services may also have a modest effect, reducing costs by about 3%. Overall differences in wages between jurisdictions — likely driven by differences in the cost of living and in collective bargaining agreements — should also be considered when comparing CSHS estimates across provinces and territories. While facilities may not be able to influence these factors directly, they should be aware of their impact when comparing their results with those of their peers.
Understanding Variability in the Cost of a Standard Hospital Stay
6
The use of contract staff and the range of services offered also impact CSHS variability among peers, but should be interpreted with caution.
The effects of other factors on peer-to-peer CSHS variability are not as clear and should be interpreted with caution. For example, while the evidence suggests that hiring staff on a short-term basis from a third-party provider tends to increase costs, this may be more efficient in the long run than hiring permanent staff. While the analysis found that the range of services offered had a significant impact on the average cost, the authority to reduce or add specific services may not lie with the hospital. Even when the hospital or regional health authority (RHA) could make those decisions directly, the needs of the population may predominate.
Long patient stays impact variability among peers and over time.
The CSHS methodology relies on assumptions that may not hold for longer patient stays. Specifically, the presence of patient stays longer than 1 year in the Discharge Abstract Database (DAD) reduces the stability of CSHS estimates from a given year to the next, especially in smaller facilities.
Some hospital reporting practices may lead to an underestimate of the CSHS, impacting variability among peers.
Decisions that are made regarding hospital reporting practices also have an impact on the accuracy of the CSHS estimates. Reporting non-acute and post-acute episodes, such as long-term care or rehab, as acute care episodes may reduce the accuracy of the CSHS denominator, leading to an underestimate of the hospital’s actual CSHS value.
Administrative structures of a jurisdiction play only a minor role in the variation of the CSHS among peers.
The impact of differing administrative structures was also considered. Generally, jurisdictions with regionalized health systems experience less variation in the portion of CSHS related to non–patient care expenses (such as administration and finance) than those without RHAs do. However, while differences among jurisdictions without RHAs were statistically significant, they had little material effect on the overall variation in the indicator.
Adjustments to the CSHS presentation and methodology could support better understanding of variability among peers and mitigate variability over time.
As part of this analysis, CIHI identified 2 potential areas for improvement regarding the CSHS: presentation and methodology. First, the presentation of both the direct and indirect portions of the CSHS could help highlight the differences of the CSHS estimates among peers and across jurisdictions with different administrative structures. Second, an adjustment to the CSHS methodology to mitigate the impact of multi-year inpatient stays should increase the stability

Understanding Variability in the Cost of a Standard Hospital Stay
7
and accuracy of the indicator over time without affecting the variation among peers within a given year. CIHI will consider implementing these changes and will discuss them with key stakeholders and the Expert Advisory Group.
In summary, the results of this analysis suggest that the majority of the differences between hospital CSHS estimates can be explained either by exogenous factors or by hospital management decisions. While the overall quality of the CSHS indicator appears robust, CIHI will continue to monitor and improve its accuracy, reliability and usefulness.
About CIHI’s efficiency and health system performance work CIHI has begun to measure and examine various components of health system efficiency in Canada. Efficiency can be measured and studied from different perspectives, more specifically at the system level, at the disease level or by sub-sector (hospital, outpatient care, etc.).2 CIHI’s work in this area has looked at efficiency from a couple of these perspectives. Some of this work has focused on efficiency from a system-level perspective, while other work has examined efficiency and measures of spending in hospitals. More specifically, the topics being analyzed include
• Why does efficiency vary across Canada’s health regions?
• What actions are decision-makers taking to improve efficiency in their jurisdictions?
• What drives variation in CSHS indicator results in acute care facilities?
CIHI’s efficiency projects are a component of its health system performance (HSP) measurement and reporting program of work. Some of this work includes reporting pan-Canadian results of indicators of different components of health and health systems, developing analytical products and tools, and building the capacity of stakeholders to understand and use performance measurement indicators and tools.3 The Your Health System web tool provides a platform for jurisdictions to review their indicator results and compare them with those of their peers.
CIHI’s HSP Measurement Framework was created to outline the relationships that exist between different types of indicators and how they contribute to desired health system outcomes, otherwise referred to as performance goals.3 The framework highlights 3 performance goals: improved health status of Canadians, improved health system responsiveness and improved value for money. The goals of the HSP Measurement Framework align with those of other international performance frameworks, such as the Triple Aim framework from the Institute for Healthcare Improvement.3 The purpose of CIHI’s HSP work is to support its stakeholders as they attempt to assess, measure and improve health system performance within their jurisdictions.
Understanding Variability in the Cost of a Standard Hospital Stay
8
1 Introduction 1.1 Organization of the report The results of this technical report are divided into 4 sections. In this introductory section, general concepts are explained and a high-level overview of variability in the CSHS indicator is presented. Section 2 provides details of the overall approach to the analyses. Results are outlined in Section 3, which is split into 3 sub-sections. In the first 2 sub-sections, univariate analyses are presented in order to examine the effect of distinct issues related to methodological and/or conceptual questions. The final sub-section consists of a multivariate analysis of exogenous factors affecting the CSHS. Finally, Section 4 contains a summary and discussion of the findings.i
1.2 Background Health expenditures continue to represent a high proportion of provincial and territorial government budgets. In 2015, health spending made up approximately 38% of provincial and territorial program spending.1 Hospital spending accounts for the largest component of health system spending, at approximately $65 billion, or 3.2% of the national gross domestic product.1 Given the high cost of acute care facilities, interest has grown in understanding the factors that drive acute care hospital costs and the reasons why they vary.
CIHI’s CSHS is one of the key measures that allows for comparisons of the financial efficiency of Canadian hospitals. CIHI has been calculating the CSHS for more than 10 years. Over time, the CSHS has consistently been one of CIHI’s most widely used financial indicators. It can be used to understand hospital costs, allocate funds and monitor hospital performance.
In CIHI’s online tool Your Health System, the CSHS is used as a comparative measure of financial efficiency among Canadian hospitals. Users are able to assess hospital results and compare them with peer, regional, jurisdictional and national averages. In addition, users are able to monitor changes in the indicator over a 5-year period and determine whether the value is improving relative to that of their peers.
The CSHS is also one of the primary tools used to estimate patient-level costs in Canadian hospitals. In conjunction with Resource Intensity Weights (RIWs), the CSHS can be used to estimate the cost of an acute inpatient hospital stay for a specific Case Mix Group (CMG) or for a given patient. As a result, it is often used to add a cost component to clinically focused reports and publications. Notably, the CSHS acts as the primary methodology behind another of CIHI’s popular online tools, the Patient Cost Estimator (PCE).
i. Detailed data tables are available in the appendices, along with the full methodology for the CSHS indicator (Appendix E)
and a glossary of terms (Appendix F).
Understanding Variability in the Cost of a Standard Hospital Stay
9
1.3 Objective This analysis will look to explain the observed variability in the CSHS. Previous CIHI publications have acknowledged that a number of different factors such as staff mix, teaching status and facility size have the potential to influence CSHS estimates. However, these factors had not been verified or quantified by a systematic investigation. This report will act as a first attempt to analyze and estimate the impact of these factors on the CSHS.
1.4 Data sources The analyses presented in this technical report are based on data from CIHI’s Canadian MIS Database (CMDB) for fiscal years 2009–2010 to 2013–2014. The CMDB contains financial and statistical operations information from hospitals and RHAs across Canada. The data for the CMDB is collected using the MIS Standards. Because financial data is collected using a different standard in Quebec and Nunavut, hospitals from these jurisdictions were excluded from analyses.
Clinical information was extracted from CIHI’s DAD for 2009–2010 to 2013–2014. The DAD captures administrative, clinical and demographic information about patients when they are discharged from the hospital (including deaths, sign-outs and transfers). Patient cases identified in the DAD were grouped and weighted using the CMG+ 2014 methodology.
1.5 Defining and understanding CSHS The CSHS indicator measures the relative cost-efficiency of a hospital’s ability to provide acute inpatient care. The cost of a standard hospital stay is defined as the sum of a hospital’s inpatient expenses over the sum of the hospital’s RIW. As a full-cost indicator, the CSHS includes not only direct expenses incurred in the provision of care (e.g., nursing compensation, drugs, meals) but also the indirect operational expenses (e.g., finance, administrative services). The result is the hospital’s full cost to treat the average inpatient. The full CSHS methodology can be found in Appendix E.
1.5.1 Numerator The numerator for the CSHS is conceptually simple. It is the sum of inpatient-related expenses in a facility. In practice, expenses are not captured by type of service recipient but rather by function of the unit. In the MIS Standards, this is referred to as a functional centre.
Identifying inpatient expenses is straightforward in some functional centres because of the nature of the services they provide. For example, certain nursing units, such as the intensive care unit, are not expected to serve outpatients and serve only inpatients. Serving one type of patient makes it simpler to track expenses. Functional centres that provide direct health care services to inpatients are referred to as direct care functional centres.
Understanding Variability in the Cost of a Standard Hospital Stay
10
Some functional centres serve both the hospital’s acute inpatients and other types of patients, such as medical imaging recipients. It is therefore more difficult to allocate expenses to an inpatient in these functional centres. In order to properly allocate expenses, service recipient–specific activity statistics are used to impute the total share of expenses related to each service recipient type (inpatients, etc.).
Expenses are generally allocated to 3 cost pools: Inpatient Costs, Other Patient Costs and Non-Patient Costs (research, education, etc.). After all of the direct care functional centre expenses have been allocated between the service recipient cost pools, indirect expenses are allocated proportionally between the 3 pools. The result is an estimate of the total full expenses related to inpatient care. For more detailed definitions of some of these terms, please refer to the glossary of terms in Appendix F.
1.5.2 Denominator The denominator in the CSHS is the sum of all acute care weighted cases, or RIWs. An RIW is a relative cost weight value derived from patient cost data submitted to CIHI’s Canadian Patient Cost Database (CPCD). The term “weighted cases” is applied to the sum of RIWs within a defined group of cases or within a hospital, region or jurisdiction.
All RIWs are relative to the average typical inpatient case, which is assigned an RIW of 1.0. For example, a patient with an RIW of 2.0 would be expected to require twice as many resources during his or her hospital stay as the average typical inpatient.
1.5.3 Limitations/caveats Though the numerator of the CSHS includes a hospital’s full inpatient costs, it excludes physician compensation. Physician compensation within the hospital environment is treated and reported differently across jurisdictions due to varying provincial and territorial policies. It has been removed from the CSHS model to better ensure comparability across jurisdictions.
Other inpatient costs are excluded from the CSHS numerator. Building and land amortization are excluded to eliminate the effect of hospital buildings that have been completely amortized or that may be owned by the jurisdiction. Termination benefits are not included in the CSHS. These benefits are usually based on the employee’s full employment history, which is generally greater than the financial reporting period and which may also apply to functional centres other than the last functional centre of employment.

Understanding Variability in the Cost of a Standard Hospital Stay
11
1.6 Variation (descriptive) 1.6.1 Overall variation In 2013–2014, the average CSHS in Canada was $6,315,ii although it varied widely across the country — from $2,199 to $11,761 (Figure 1). While hospital costs are subject to annual inflation, the amount of variation in the indicator is reasonably consistent over time (Table 1).
Figure 1 CSHS frequency distribution, Canada, 2013–2014
ii. Throughout this report, the terms “mean” and “average” refer to the arithmetic average. In previous CIHI publications,
CIHI has used a pooled average for the CSHS. For more detail, please refer to Appendix A.
Understanding Variability in the Cost of a Standard Hospital Stay
12
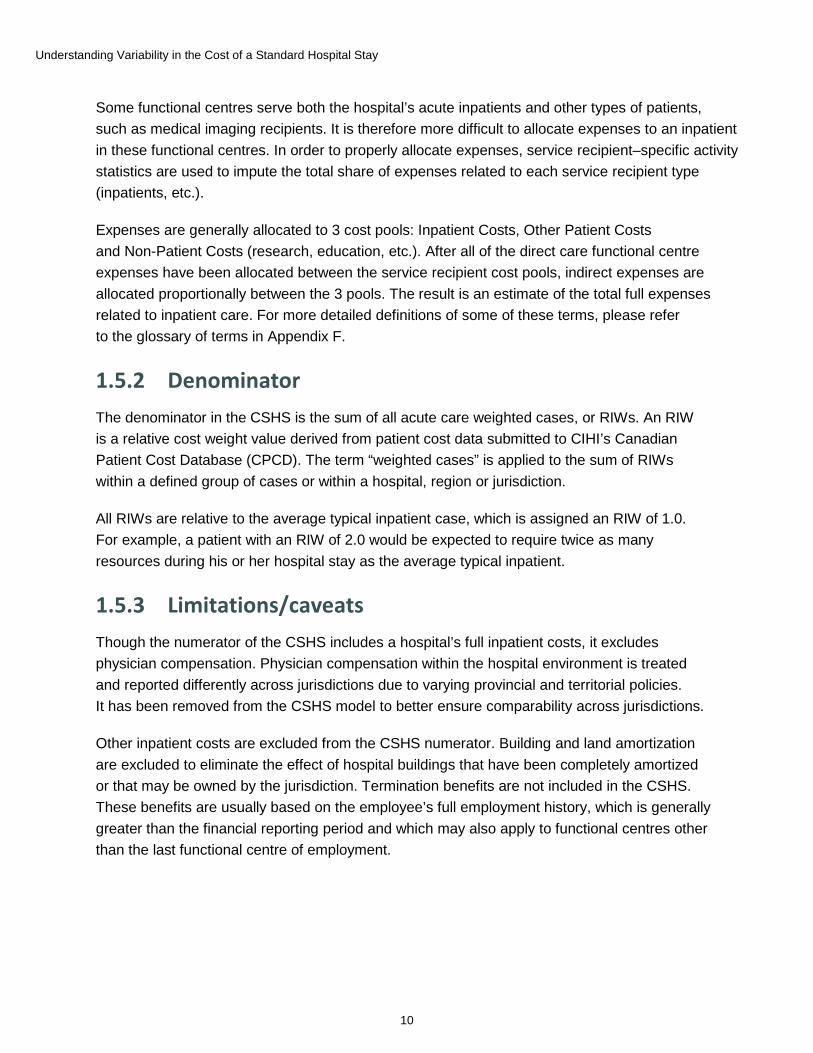
Table 1 CSHS summary statistics, 2009–2010 to 2013–2014
Fiscal year Mean value Range (min–max) Standard deviation Coefficient of variation
2009–2010 5,521 2,572–9,353 1,221 22
2010–2011 5,750 1,330–10,234 1,630 28
2011–2012 5,736 1,846–10,219 1,460 26
2012–2013 6,184 2,024–11,694 1,751 29
2013–2014 6,315 2,199–11,761 1,712 27
While estimates for some hospitals can change substantially from one year to the next, most hospitals (321 between 2012–2013 and 2013–2014 — approximately three-quarters of hospitals in the data set) vary by less than 10% from one year to the next (Figure 2). Fewer than 5% of hospitals experienced yearly variation greater than 30%.
Figure 2 Change in CSHS estimate, frequency distribution, Canada, 2012–2013 to 2013–2014

Understanding Variability in the Cost of a Standard Hospital Stay
13
1.6.2 Jurisdictional variation There is less variation among jurisdictions than among individual hospitals, though some noticeable differences exist (Figure 3). In 2013–2014, Newfoundland and Labrador, Saskatchewan and Alberta all had mean CSHS values above $7,000, while the other provinces had values between $5,000 and $6,000. Yukoniii had the highest CSHS among jurisdictions, because material and labour costs in the territories are generally much higher than in the rest of Canada.
Figure 3 Arithmetic average of CSHS among hospitals, by jurisdiction, 2013–2014
iii. Note that for the years under review, the CSHS can be calculated for only 1 hospital in Yukon: Whitehorse General Hospital.
Consequently, the CSHS value in this territory is identical to the value for that facility.
Understanding Variability in the Cost of a Standard Hospital Stay
14
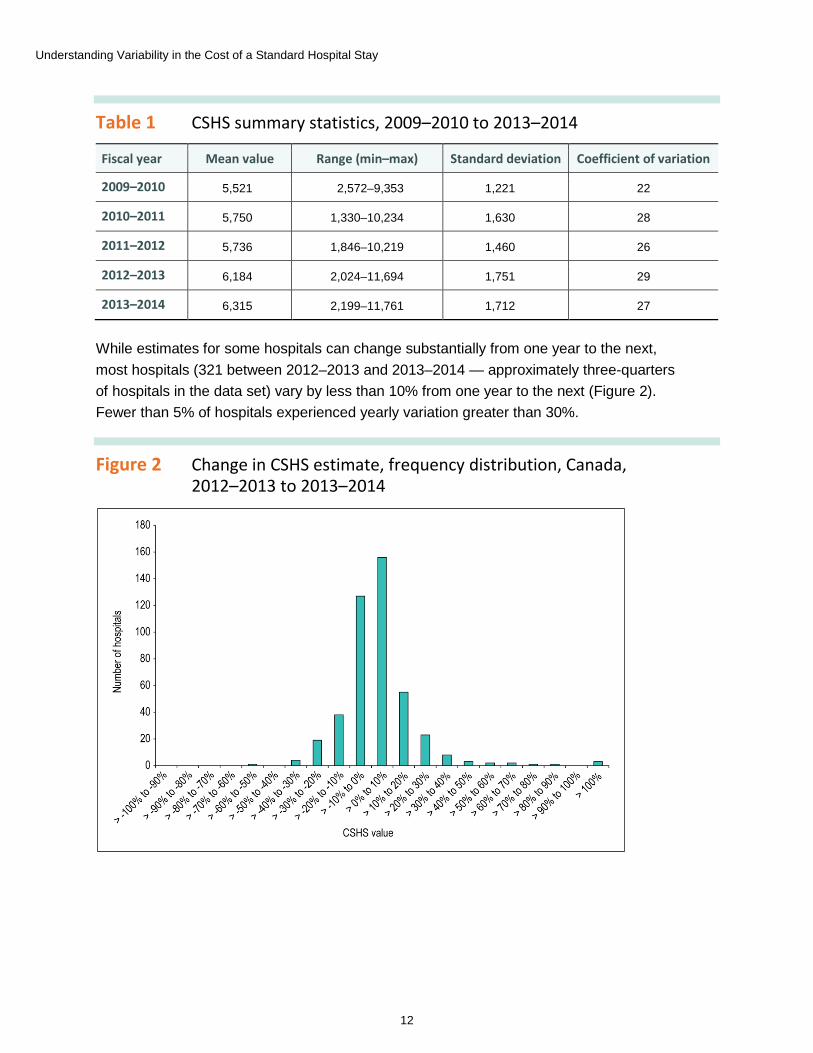
1.6.3 Variation and size of hospital Facility size is closely linked to variation in the CSHS. In general, the smaller the hospital, the greater the distance to the mean (Figure 4).
Figure 4 CSHS versus number of acute care beds, by hospital, Canada, 2013–2014
Understanding Variability in the Cost of a Standard Hospital Stay
15
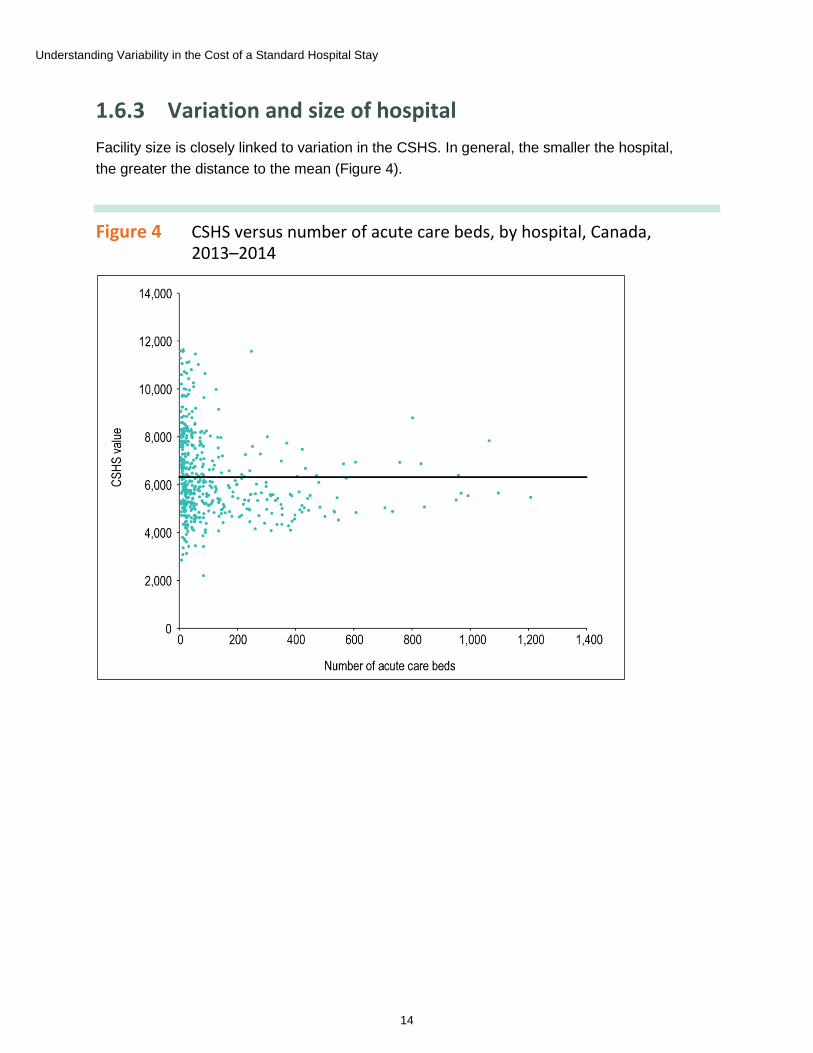
While diseconomies of scale might explain higher costs in smaller facilities, they are not sufficient to explain the range of variation to either side of the mean. The same pattern holds when examining the year-over-year change in CSHS values (Figure 5).
Figure 5 Year-over-year change in the CSHS, by number of beds, Canada, 2012–2013 to 2013–2014
Note To increase the legibility of the chart, the vertical axis is capped at an absolute value of 50%.
Understanding Variability in the Cost of a Standard Hospital Stay
16
2 Approach 2.1 Literature review At the outset of this study, a narrative literature review was conducted to inform the conceptual hospital cost function being designed for this report. While there are a number of studies that examine hospital cost functions, very few begin with a case mix–adjusted estimate, as is the case with the CSHS indicator. Consequently, much of the literature points to patient characteristics, case mix and population health as key explanatory factors in differing hospital costs. These factors are adjusted for in the CSHS through the use of RIWs in the denominator.
A number of other factors that might influence hospital costs were identified in the literature. These factors include size (economies or diseconomies of scale),4–8 geography or remoteness,8, 9 teaching status,5, 9, 10 the price of labour,9, 11, 12 labour13 and quality or clinical efficiency.9, 14–16 A summary of findings from the literature review and the search terms and sources used are provided in Appendix G.
2.2 Expert Advisory Group After completing the literature review, the Expert Advisory Group (EAG) was assembled to provide advice and expertise for the project. Members of the EAG provided direction on the overall approach and helped determine scope limitations. Over the course of the analysis, the EAG offered feedback on various components of the report and helped to validate the results of the analyses.
CIHI members of the EAG included representatives from the Methodologies and Specialized Care, Case Mix, and Financial Standards and Information departments. EAG members from external organizations were selected based on their familiarity with the concepts and measures involved, as well as their level of expertise in the field of hospital costing. These included RHA personnel from finance and decision-support departments, as well as a consultant with advanced knowledge of the concepts and measures involved in the interpretation of the CSHS.
2.3 Scope The number and types of factors that could potentially influence the results of the CSHS vary widely. This analysis focuses on factors that are most often linked to the hospital cost function.
The EAG determined that the role of data quality, methodologies, linkages between databases and other exogenous factors fell outside the scope of this study. Any additional analytical questions arising from this report will be used to inform future work.
Understanding Variability in the Cost of a Standard Hospital Stay
17
2.4 Methodological/conceptual components The primary focus of the initial analytical plan was a multivariate model that was designed to examine and explain sources of CSHS variation between hospitals. However, discussions with the EAG revealed additional avenues of analysis outside of the multivariate modelling approach. 2 methodological and conceptual questions were recommended for inclusion in the study:
• To what extent does the inclusion of indirect costs influence variability?
• Are patients who have long hospital stays causing over- or underestimates in the denominator?
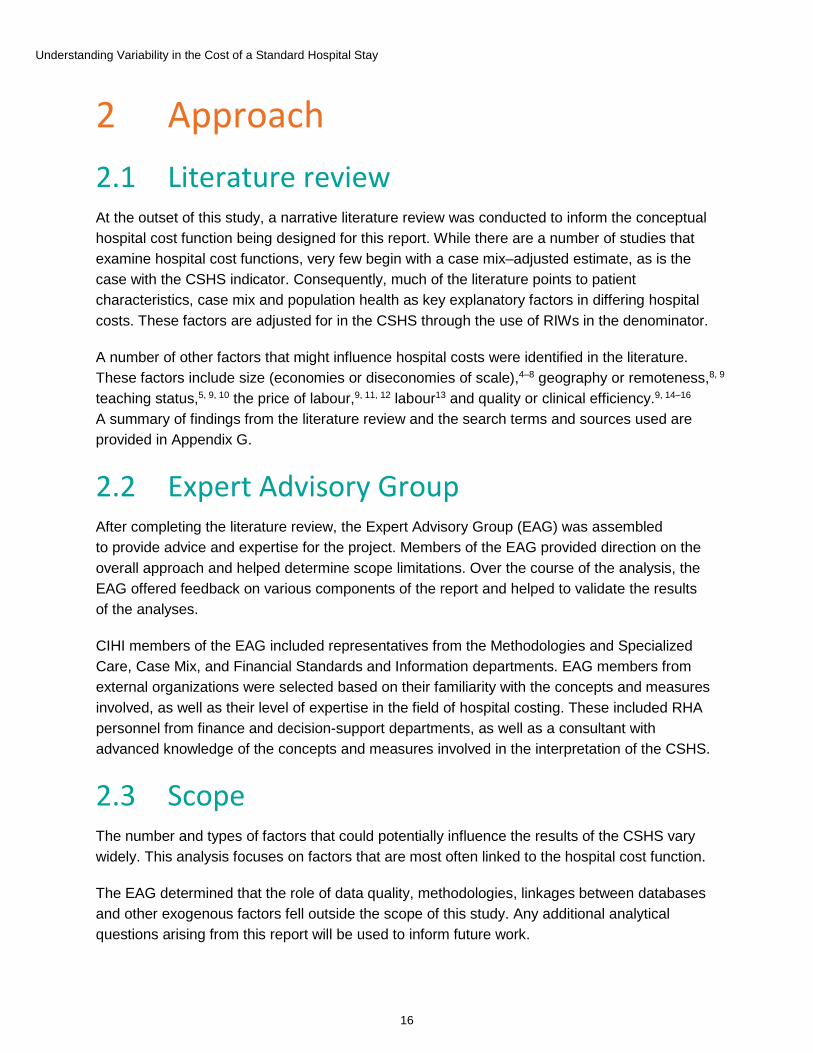
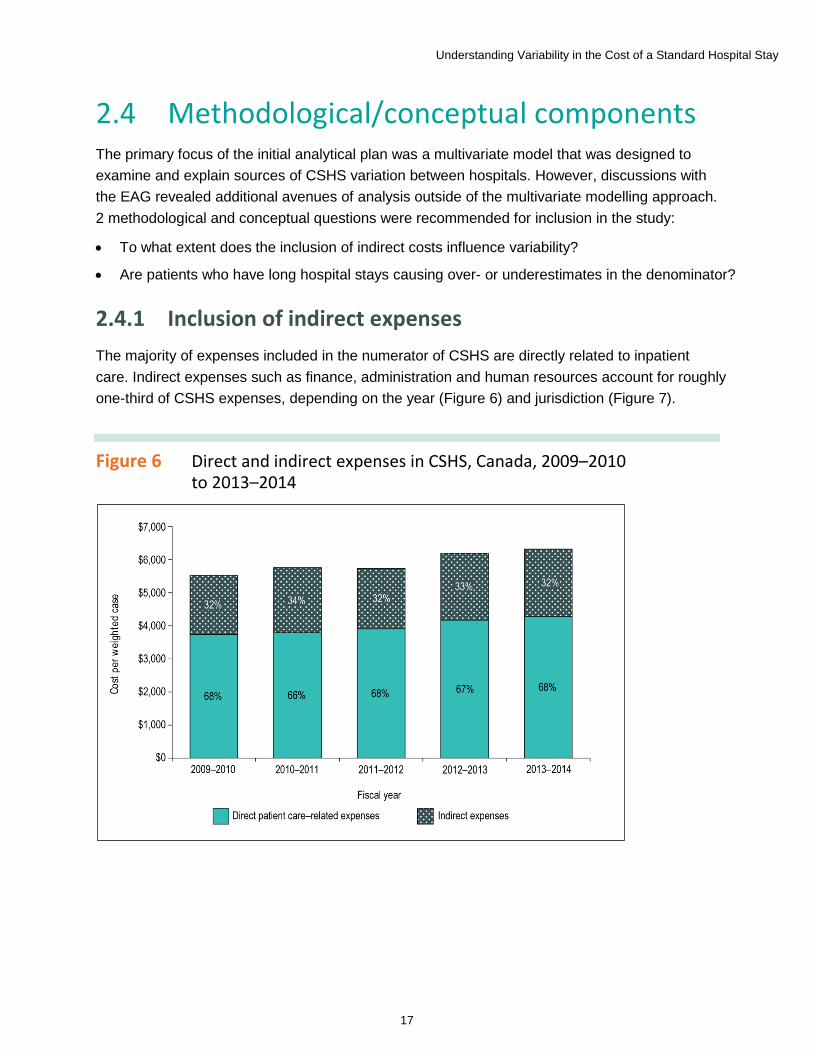
2.4.1 Inclusion of indirect expenses The majority of expenses included in the numerator of CSHS are directly related to inpatient care. Indirect expenses such as finance, administration and human resources account for roughly one-third of CSHS expenses, depending on the year (Figure 6) and jurisdiction (Figure 7).
Figure 6 Direct and indirect expenses in CSHS, Canada, 2009–2010 to 2013–2014
Understanding Variability in the Cost of a Standard Hospital Stay
18
Figure 7 Percentage indirect expenses in CSHS, by jurisdiction, 5-year average, 2009–2010 to 2013–2014
Indirect expenses in a facility are generally allocated based on that facility’s proportion of direct inpatient expenses relative to its total patient care expenses.iv To the extent that indirect expenses vary differently than direct expenses, the primary factors that influence this are the total expenditure on indirect services/costs (i.e., the level of indirect expenditure) and the overall proportion of inpatient expenses in the facility (i.e., the relative share of expenditure).
Not all indirect expenditure is incurred at the facility level. In an RHA, it is common for some services to be centralized within the regional entity. For example, payroll may be administered through the RHA on behalf of its underlying facilities; in this case, related expenses would not necessarily be reported by each facility. In order to ensure comparability at the facility level, the MIS Standards requires that these expenses be allocated to the consuming facilities prior to submission to the CMDB. Several different methods exist to perform this allocation.v Each of these methods takes the same general approach and allocates dollars based on each facility’s proportional share. Consequently, regionalization may also play a role in the variation of indirect expenses. In other words, the presence of shared or centralized services may reduce the overall variation of indirect expenses within a region.
iv. See Appendix E of this document, steps 5 to 7. v. See Appendix D in the Standards for Management Information Systems in Canadian Health Service Organizations, 2013
(MIS Standards 2013).

Understanding Variability in the Cost of a Standard Hospital Stay
19
In order to determine whether including indirect costs might have an effect on the variability of the CSHS, the numerator is disaggregated between the direct and indirect portions of expenses. A comparison of variation between the 2 portions is used to identify whether any significant or practical differences exist. Results are presented in Section 3.1.
2.4.2 The impact of cross-year inpatient stays The CSHS numerator is an estimate of inpatient expenses and is sourced from the CMDB, while the CSHS denominator is the number of inpatient cases weighted for relative resource use and is derived from the DAD. Both the CMDB and the DAD share the same reference period: the fiscal year ending March 31. However, there are some conceptual differences between the databases.
Expenses reported to the CMDB refer specifically to expenditures occurring between April 1 of a given year and March 31 of the following year. For example, expenses related to a patient admitted on March 15, 2012, and discharged April 15, 2012, would be split between the 2011 and 2012 fiscal years. The DAD records abstracts as of the date of discharge and includes the information for the entire stay from admission to discharge. Therefore, the entire weighted case for the patient in the preceding example would be recorded in the 2012 fiscal year.
The CSHS methodology assumes that any additional weight from a patient stay across fiscal years will be offset by the missing weighted cases related to patients admitted during the reference year but not yet discharged (and therefore not reported in the DAD) before March 31. It is possible that some facilities may experience significant year-to-year differences when patients with very long stays are discharged. Smaller facilities may also be more likely to experience greater variation due to this issue.
To determine the impact of cross-year inpatient stays, the incidence and overall weight of these discharges are examined. Several alternative adjustments to the methodology are also considered to mitigate any potential allocation errors. Results are presented in Section 3.2.
Understanding Variability in the Cost of a Standard Hospital Stay
20
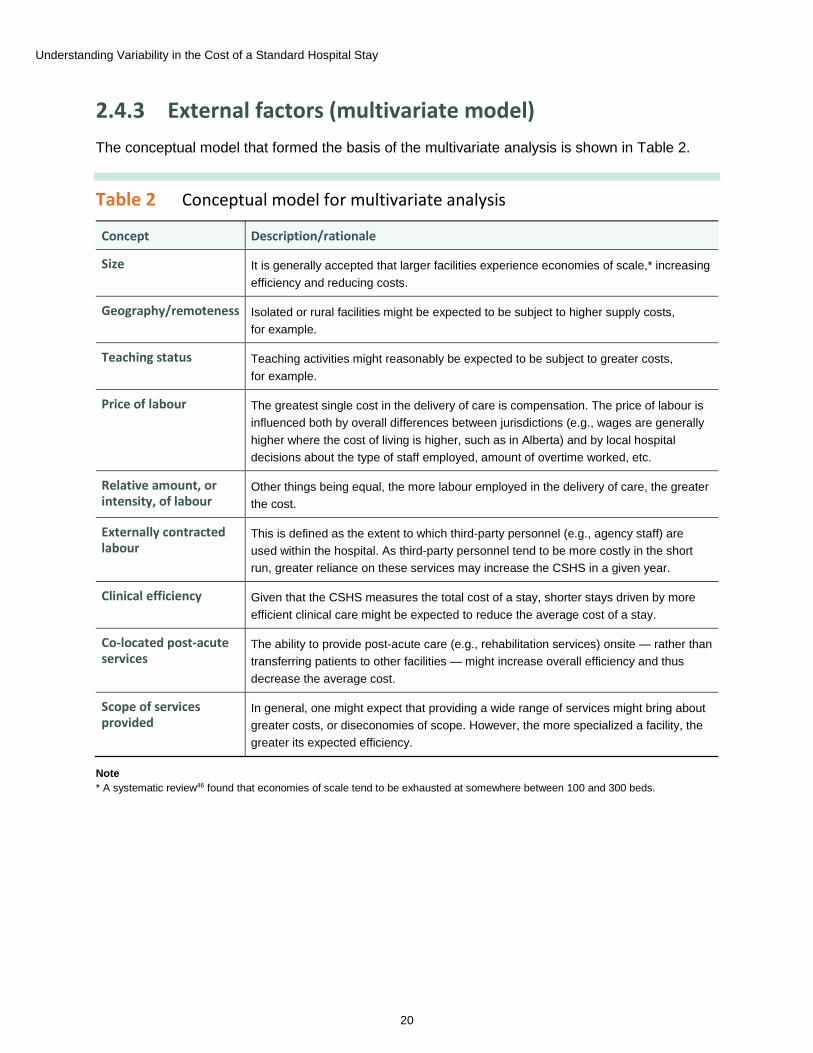
2.4.3 External factors (multivariate model) The conceptual model that formed the basis of the multivariate analysis is shown in Table 2.
Table 2 Conceptual model for multivariate analysis
Concept Description/rationale
Size It is generally accepted that larger facilities experience economies of scale,* increasing efficiency and reducing costs.
Geography/remoteness Isolated or rural facilities might be expected to be subject to higher supply costs, for example.
Teaching status Teaching activities might reasonably be expected to be subject to greater costs, for example.
Price of labour The greatest single cost in the delivery of care is compensation. The price of labour is influenced both by overall differences between jurisdictions (e.g., wages are generally higher where the cost of living is higher, such as in Alberta) and by local hospital decisions about the type of staff employed, amount of overtime worked, etc.
Relative amount, or intensity, of labour
Other things being equal, the more labour employed in the delivery of care, the greater the cost.
Externally contracted labour
This is defined as the extent to which third-party personnel (e.g., agency staff) are used within the hospital. As third-party personnel tend to be more costly in the short run, greater reliance on these services may increase the CSHS in a given year.
Clinical efficiency Given that the CSHS measures the total cost of a stay, shorter stays driven by more efficient clinical care might be expected to reduce the average cost of a stay.
Co-located post-acute services
The ability to provide post-acute care (e.g., rehabilitation services) onsite — rather than transferring patients to other facilities — might increase overall efficiency and thus decrease the average cost.
Scope of services provided
In general, one might expect that providing a wide range of services might bring about greater costs, or diseconomies of scope. However, the more specialized a facility, the greater its expected efficiency.
Note * A systematic review46 found that economies of scale tend to be exhausted at somewhere between 100 and 300 beds.

Understanding Variability in the Cost of a Standard Hospital Stay
21
Based on this conceptual model, a number of variables were explored to measure each of these concepts. The variables that were selected for use in the initial model are included in Table 3.
Table 3 Variables for conceptual model, by selected measure
Concept Selected measure
Size Number of beds in acute care functional centres
Geography/remoteness Urban/rural status (binary variable: 1 if rural, 0 if urban)
Teaching status As reported to the CMDB (binary variable: 1 if teaching, 0 if not)
Price of labour Index of provincial and territorial average wage (weighted by functional centre) relative to national average
Price of labour Index of hospital average wage (weighted by functional centre) relative to provincial and territorial average
Intensity of labour Relative labour (measured in hours) per weighted case
Externally contracted labour
Purchased hours as a percentage of total worked and purchased hours
Clinical efficiency Ratio of length of stay (LOS) to expected length of stay (ELOS)
Co-located post-acute services
Presence of dedicated inpatient rehab beds (binary variable: 1 if present, 0 if not)
Scope of services provided
Herfindahl-Hirschman Index based on major clinical category shares within hospital
The initial model is thus as follows:
CSHSvi = α + β1 year + β2 rural + β3 teaching + β4 provincial wage + β5 hospital wage + β6 relative labour + β7 proportion purchased hours + β8 LOS to ELOS + β9 rehab + β10 scope vi
While several modelling techniques were considered, the final analysis employs a generalized linear model (GLM), using a threshold of 2 times Cook’s distance to remove influential outliers among the independent variables. Extreme logical outliers (values less than $100 or greater than $100,000) among observed CSHS values are also excluded prior to modelling. Results and discussion are found in Section 3.3.
vi. To reduce heteroscedasticity, the CSHS is log transformed in the models presented. Note that the model is log-linear and
independent variables are not log transformed.
Understanding Variability in the Cost of a Standard Hospital Stay
22
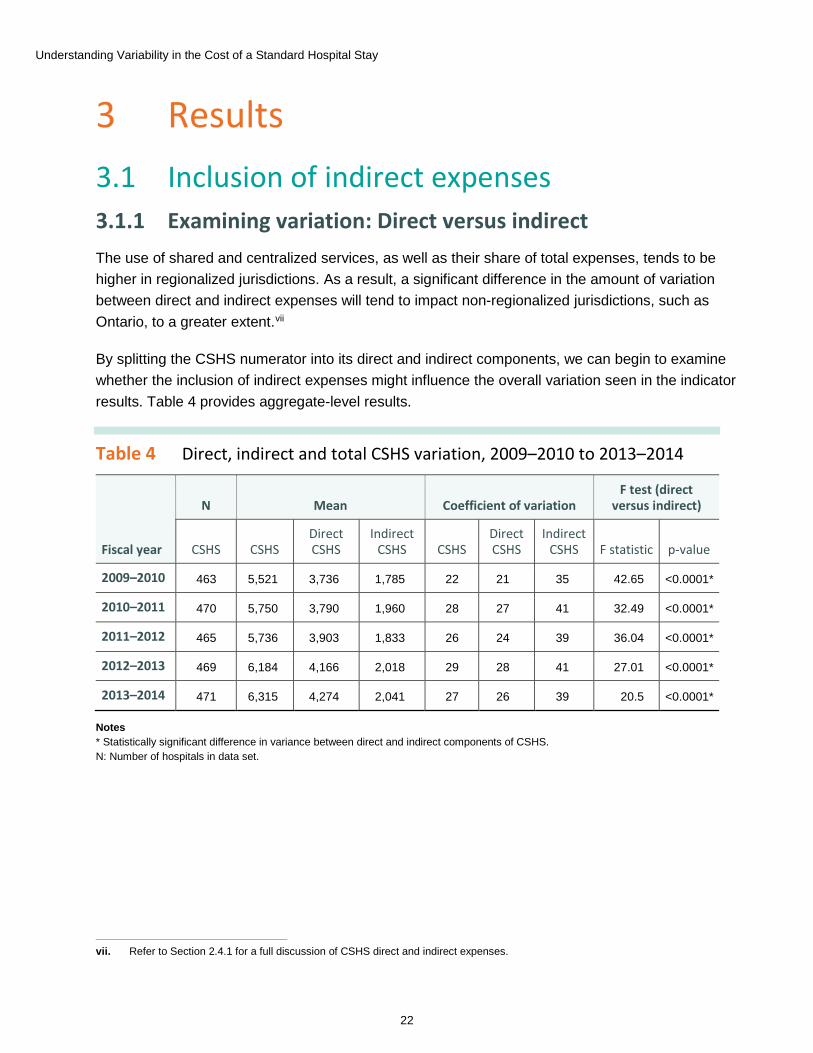
3 Results 3.1 Inclusion of indirect expenses 3.1.1 Examining variation: Direct versus indirect The use of shared and centralized services, as well as their share of total expenses, tends to be higher in regionalized jurisdictions. As a result, a significant difference in the amount of variation between direct and indirect expenses will tend to impact non-regionalized jurisdictions, such as Ontario, to a greater extent.vii
By splitting the CSHS numerator into its direct and indirect components, we can begin to examine whether the inclusion of indirect expenses might influence the overall variation seen in the indicator results. Table 4 provides aggregate-level results.
Table 4 Direct, indirect and total CSHS variation, 2009–2010 to 2013–2014
vii. Refer to Section 2.4.1 for a full discussion of CSHS direct and indirect expenses.
Fiscal year
N Mean Coefficient of variation F test (direct
versus indirect)
CSHS CSHS Direct CSHS
Indirect CSHS CSHS
Direct CSHS
Indirect CSHS F statistic p-value
2009–2010 463 5,521 3,736 1,785 22 21 35 42.65 <0.0001*
2010–2011 470 5,750 3,790 1,960 28 27 41 32.49 <0.0001*
2011–2012 465 5,736 3,903 1,833 26 24 39 36.04 <0.0001*
2012–2013 469 6,184 4,166 2,018 29 28 41 27.01 <0.0001*
2013–2014 471 6,315 4,274 2,041 27 26 39 20.5 <0.0001*
Notes * Statistically significant difference in variance between direct and indirect components of CSHS. N: Number of hospitals in data set.
Understanding Variability in the Cost of a Standard Hospital Stay
23
In all years, the variability of the indirect component of the CSHS is significantly higher than that of the direct, with coefficients of variation (CVs) ranging from 35 to 41 and from 21 to 28, respectively. However, while the statistical difference is significant, there is very little practical difference. The higher variation displayed by the indirect piece causes only a slight increase in the overall CV when compared with the direct component.
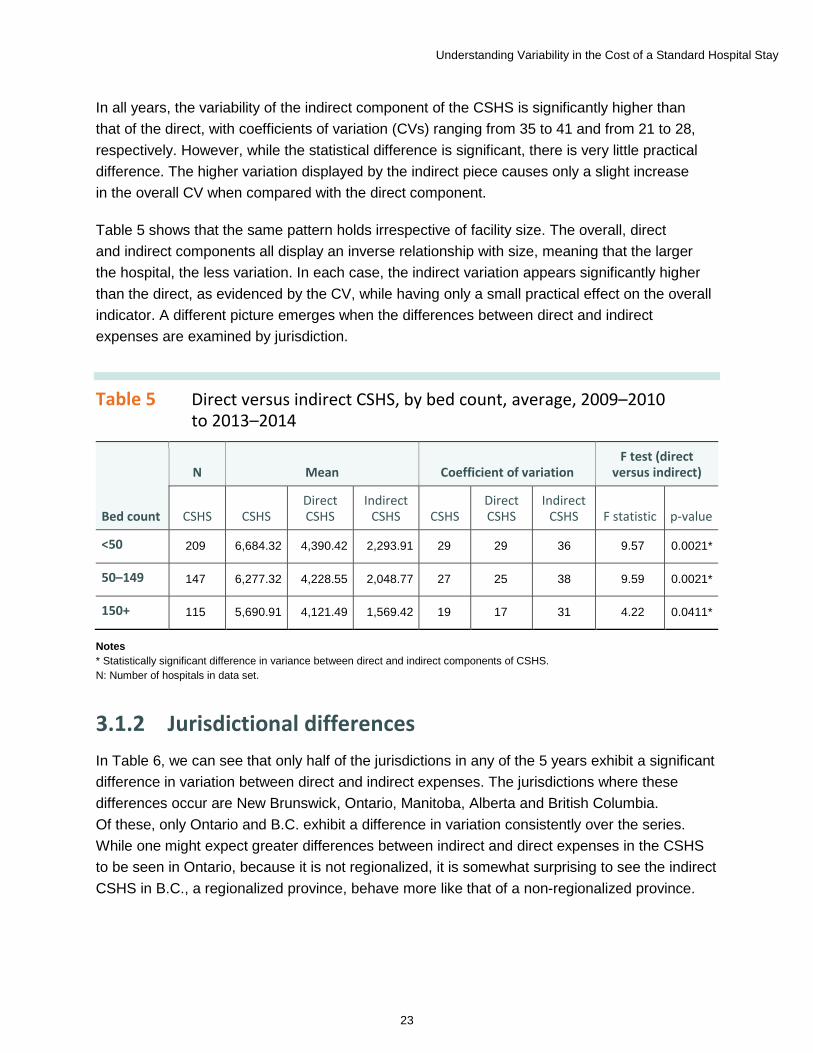
Table 5 shows that the same pattern holds irrespective of facility size. The overall, direct and indirect components all display an inverse relationship with size, meaning that the larger the hospital, the less variation. In each case, the indirect variation appears significantly higher than the direct, as evidenced by the CV, while having only a small practical effect on the overall indicator. A different picture emerges when the differences between direct and indirect expenses are examined by jurisdiction.
Table 5 Direct versus indirect CSHS, by bed count, average, 2009–2010 to 2013–2014
Bed count
N Mean Coefficient of variation F test (direct
versus indirect)
CSHS CSHS Direct CSHS
Indirect CSHS CSHS
Direct CSHS
Indirect CSHS F statistic p-value
<50 209 6,684.32 4,390.42 2,293.91 29 29 36 9.57 0.0021*
50–149 147 6,277.32 4,228.55 2,048.77 27 25 38 9.59 0.0021*
150+ 115 5,690.91 4,121.49 1,569.42 19 17 31 4.22 0.0411*
Notes * Statistically significant difference in variance between direct and indirect components of CSHS. N: Number of hospitals in data set.
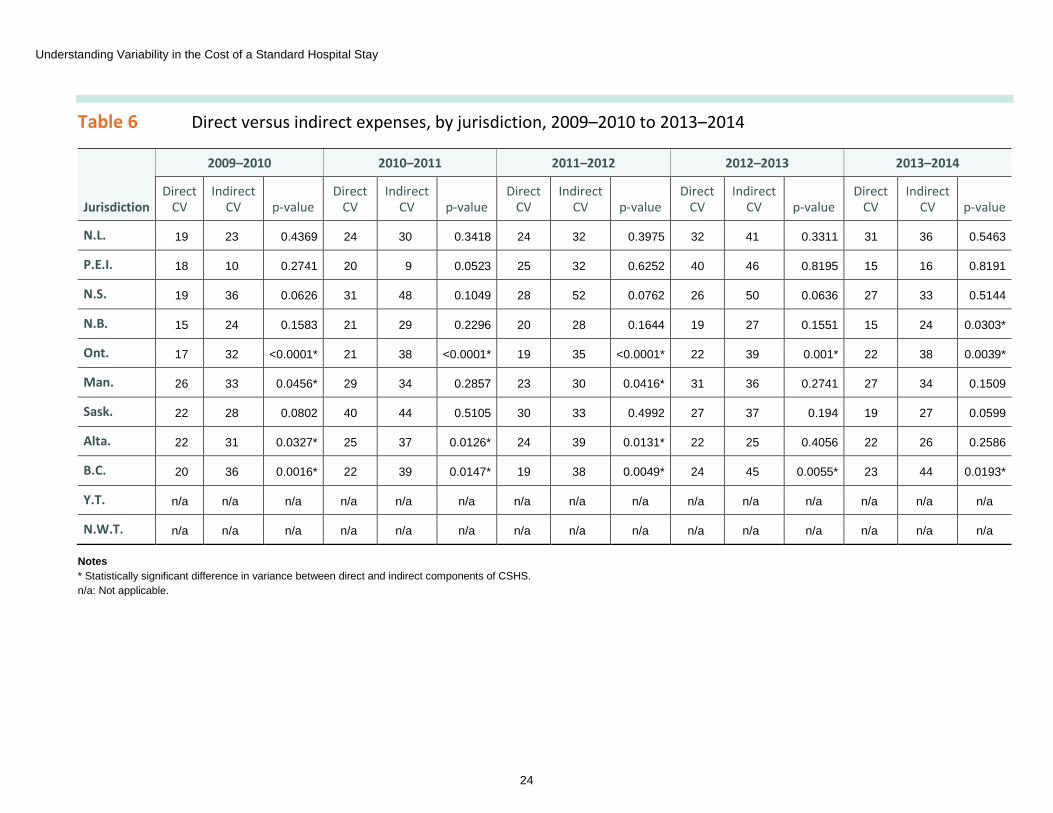
3.1.2 Jurisdictional differences In Table 6, we can see that only half of the jurisdictions in any of the 5 years exhibit a significant difference in variation between direct and indirect expenses. The jurisdictions where these differences occur are New Brunswick, Ontario, Manitoba, Alberta and British Columbia. Of these, only Ontario and B.C. exhibit a difference in variation consistently over the series. While one might expect greater differences between indirect and direct expenses in the CSHS to be seen in Ontario, because it is not regionalized, it is somewhat surprising to see the indirect CSHS in B.C., a regionalized province, behave more like that of a non-regionalized province.
Understanding Variability in the Cost of a Standard Hospital Stay
24
Table 6 Direct versus indirect expenses, by jurisdiction, 2009–2010 to 2013–2014
Jurisdiction
2009–2010 2010–2011 2011–2012 2012–2013 2013–2014
Direct CV
Indirect CV p-value
Direct CV
Indirect CV p-value
Direct CV
Indirect CV p-value
Direct CV
Indirect CV p-value
Direct CV
Indirect CV p-value
N.L. 19 23 0.4369 24 30 0.3418 24 32 0.3975 32 41 0.3311 31 36 0.5463
P.E.I. 18 10 0.2741 20 9 0.0523 25 32 0.6252 40 46 0.8195 15 16 0.8191
N.S. 19 36 0.0626 31 48 0.1049 28 52 0.0762 26 50 0.0636 27 33 0.5144
N.B. 15 24 0.1583 21 29 0.2296 20 28 0.1644 19 27 0.1551 15 24 0.0303*
Ont. 17 32 <0.0001* 21 38 <0.0001* 19 35 <0.0001* 22 39 0.001* 22 38 0.0039*
Man. 26 33 0.0456* 29 34 0.2857 23 30 0.0416* 31 36 0.2741 27 34 0.1509
Sask. 22 28 0.0802 40 44 0.5105 30 33 0.4992 27 37 0.194 19 27 0.0599
Alta. 22 31 0.0327* 25 37 0.0126* 24 39 0.0131* 22 25 0.4056 22 26 0.2586
B.C. 20 36 0.0016* 22 39 0.0147* 19 38 0.0049* 24 45 0.0055* 23 44 0.0193*
Y.T. n/a n/a n/a n/a n/a n/a n/a n/a n/a n/a n/a n/a n/a n/a n/a
N.W.T. n/a n/a n/a n/a n/a n/a n/a n/a n/a n/a n/a n/a n/a n/a n/a
Notes * Statistically significant difference in variance between direct and indirect components of CSHS. n/a: Not applicable.
Understanding Variability in the Cost of a Standard Hospital Stay
25
3.1.2.1 Ontario
In Ontario, the CV for the indirect portion of CSHS ranges from 32 to 39, much higher than the direct CV, which ranges from 17 to 22.
The variation between direct and indirect expenses might be due to the fact that the province’s health service organizations are not regionalized within health authorities. Ontario’s local health integration networks (LHINs) share some of the same responsibilities as the RHAs in other provinces, such as planning and funding hospital, home and community services.17, 18 However, compared with RHAs, Ontario LHINs have structural and managerial differences. RHAs share a single governance and management structure with their underlying facilities. For example, in a regionalized jurisdiction, the legal entity (e.g., corporation) exists at the level of the RHA. By contrast, in Ontario the legal entity and, consequently, the executive team exist at the facility level.
In practice, this means that most of the functions and services considered to be indirect in the CSHS methodology are managed at the local, or facility, level in Ontario. In a regionalized jurisdiction, many of these services are administered directly by the RHA in a shared or centralized fashion. Generally, the more services and functions that are administered through a central authority, the less variable the overall share of indirect expenses will be in an underlying organization. In Ontario, a greater share of indirect services is administered independently by individual facilities, leading to greater variance in the relative amount spent on these services when compared with provinces with RHAs.
3.1.2.2 British Columbia
Compared with most other regionalized jurisdictions, B.C. had noticeably higher variation in its indirect expenses relative to its direct expenses. Nevertheless, the results indicate that the variability of the indirect expenses has relatively little influence on the variability of the indicator as a whole.
Despite operating under an RHA structure, variation in indirect expenses is significantly different compared with variation in direct patient care expenses in B.C. The B.C. results contrast with the findings from other provinces that have an RHA structure. While it is unclear why this is the case, some reasonable possibilities can be inferred. In many ways, the administrative structure of B.C.’s health system is more complex than those in other regionalized provinces. B.C. has 5 RHAs divided along geographic lines, the Provincial Health Services Authority that administers certain services and agencies on a province-wide basis, as well as the First Nations Health Authority, tasked with working with the provincial and federal governments to improve health outcomes among First Nations in the province.
Understanding Variability in the Cost of a Standard Hospital Stay
26
Another factor that makes the administrative structure of B.C. more complex than those in other jurisdictions is that among the 5 geographic RHAs, there are a number of other projects and agreements that impact administrative structures. For example, Providence Health Care falls under Vancouver Coastal Health (VCH) but acts like a regional entity. At the same time, VCH continues to administer services for a number of underlying facilities, such as hospitals, clinics and long-term care facilities.19 Another example of the complex administrative system in B.C. is the Lower Mainland Consolidation (LMC) Project. The LMC Project has been described as being “initiated to ensure full consolidation of all corporate, clinical support and back office functions . . . across Fraser Health (FHA), the Provincial Health Services Authority (PHSA), Vancouver Coastal Health (VCH) and their affiliate Providence Health Care (PHC) . . .”20
Taken together, these examples serve to illustrate the complicated financial flows within the province’s health system that might explain, at least in part, why we observe the disparity in variation compared with other regionalized jurisdictions.
3.1.3 Summary In most of Canada — and notably for most of the regionalized jurisdictions — there is little to no difference in the variation of the indirect and direct components of CSHS. The exceptions to this are Ontario, one of the few non-regionalized provinces, and B.C., a regionalized province with potentially more complex financial flows than those found in other provinces. However, while both Ontario’s and B.C.’s indirect expenses vary in a consistent and statistically different way than their direct expenses, the effect on the overall CSHS indicator remains slight.
In general, then, we can conclude that the inclusion of indirect expenses in the CSHS indicator appears to have relatively little material effect on the observed variation. However, given the statistically significant differences observed in some jurisdictions, users comparing CSHS values across jurisdictions may wish to look at the overall indicator results as well as the direct and indirect components. Based on these results, CIHI might consider making a version of the indicator available that disaggregates indirect expenses and direct patient care expenses.
Understanding Variability in the Cost of a Standard Hospital Stay
27
3.2 The effect of inpatient stays that cross fiscal years
3.2.1 Methodological assumption in CSHS denominator Inpatient stays that cross fiscal years have the potential to impact CSHS variability. The CSHS methodology assumes that the additional resource weight from patients admitted in an earlier year and discharged in a given reference year (March 31 to April 1) will be offset by patients admitted in the reference year but discharged in a later year. Patients who have not yet been discharged would be absent from the DAD in that reference year, since abstracts are recorded in the DAD as of the date of the patients’ discharge from the facility. The entire stay from admission to discharge is recorded in a DAD abstract.viii The following analysis tests this assumption and evaluates possible methodological adjustments to mitigate any increase in year-over-year variability due to the methodology.
3.2.2 Measuring allocation error in CSHS denominator In order to determine whether cross-year patient stays result in increased year-over-year variability, weighted cases for individual patients must be allocated between reference years from admission to discharge.
While daily resource consumption related to specific patients cannot be derived directly from the DAD, a simple pro rata approach provides a reasonable estimate to allocate weighted cases across years.ix Figure 8 shows the estimated error in the denominator due to the underlying assumption that cross-year inpatient stays are offset by missing weighted cases.
viii. Please refer to Section 2.4.2 for a detailed discussion of CMDB and DAD reference years. ix. Please see Section 3.2.3 for a description of the pro rata approach.

Understanding Variability in the Cost of a Standard Hospital Stay
28
Figure 8 Estimated error in CSHS denominator due to cross-year inpatient stays, by acute care beds, Canada, 2009–2010 to 2013–2014
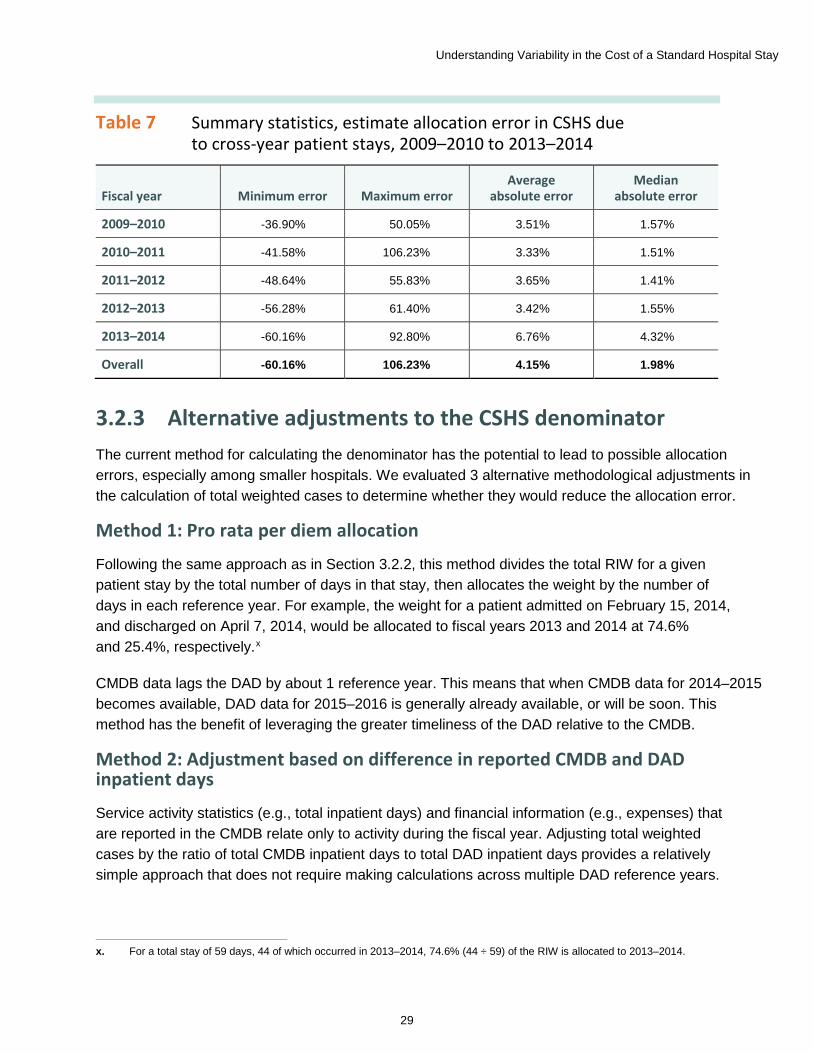
Table 7 summarizes the estimated effect on the denominator of cross-year patient stays. While the average and median absolute error is relatively small, the minimum and maximum errors indicate that for a certain group of hospitals, the impact of this assumption is significant. Looking at Figure 8, it becomes clear that the greatest effect of this error occurs among the smallest facilities. This is to be expected, as the impact of a single long-stay patient will have a greater proportional effect on total weighted cases in a small hospital.
Understanding Variability in the Cost of a Standard Hospital Stay
29
Table 7 Summary statistics, estimate allocation error in CSHS due to cross-year patient stays, 2009–2010 to 2013–2014
Fiscal year Minimum error Maximum error Average
absolute error Median
absolute error
2009–2010 -36.90% 50.05% 3.51% 1.57%
2010–2011 -41.58% 106.23% 3.33% 1.51%
2011–2012 -48.64% 55.83% 3.65% 1.41%
2012–2013 -56.28% 61.40% 3.42% 1.55%
2013–2014 -60.16% 92.80% 6.76% 4.32%
Overall -60.16% 106.23% 4.15% 1.98%
3.2.3 Alternative adjustments to the CSHS denominator The current method for calculating the denominator has the potential to lead to possible allocation errors, especially among smaller hospitals. We evaluated 3 alternative methodological adjustments in the calculation of total weighted cases to determine whether they would reduce the allocation error.
Method 1: Pro rata per diem allocation
Following the same approach as in Section 3.2.2, this method divides the total RIW for a given patient stay by the total number of days in that stay, then allocates the weight by the number of days in each reference year. For example, the weight for a patient admitted on February 15, 2014, and discharged on April 7, 2014, would be allocated to fiscal years 2013 and 2014 at 74.6% and 25.4%, respectively.x
CMDB data lags the DAD by about 1 reference year. This means that when CMDB data for 2014–2015 becomes available, DAD data for 2015–2016 is generally already available, or will be soon. This method has the benefit of leveraging the greater timeliness of the DAD relative to the CMDB.
x. For a total stay of 59 days, 44 of which occurred in 2013–2014, 74.6% (44 ÷ 59) of the RIW is allocated to 2013–2014.
Method 2: Adjustment based on difference in reported CMDB and DAD inpatient days
Service activity statistics (e.g., total inpatient days) and financial information (e.g., expenses) that are reported in the CMDB relate only to activity during the fiscal year. Adjusting total weighted cases by the ratio of total CMDB inpatient days to total DAD inpatient days provides a relatively simple approach that does not require making calculations across multiple DAD reference years.
Understanding Variability in the Cost of a Standard Hospital Stay
30
This methodology adjusts total weighted cases by the ratio of total CMDB inpatient days to total DAD inpatient days. Adjusting weighted cases to reflect CMDB inpatient days rather than DAD inpatient days should result in a total RIW more closely related to expenses incurred. For example, in the case where weighted cases are overestimated due to the discharge of patients who have a long hospital stay, one would expect that inpatient days as reported to the CMDB would be lower than total days reported to the DAD. In theory, multiplying weighted cases by this ratio should correct for this overestimate.
Method 3: Adjustment of patient stays greater than 365 days
This method removes a portion of the total weight for a given patient stay beyond 365 days. It is similar to the method used by the Ontario Ministry of Health and Long-Term Care (MOHLTC) in its Ontario Cost Distribution Methodology.
The direct effect of this approach is to reduce the impact of patients who have long hospital stays (i.e., multi-year stays). It is assumed that the remaining portion of multi-year patient stays and other cross-year patient stays less than 1 year in length will offset those patients admitted but not yet discharged in the given year. In effect, this method replicates the current methodology while removing the influence of truly long-stay (multi-year) patients.
It should be noted that while methods 1 and 2 can result in an increase or decrease to weighted cases, Method 3 is unambiguously unidirectional. Because Method 3 removes a portion of the weight due to multi-year stays, it can only decrease the denominator and therefore increase the CSHS.
3.2.4 A note about the data set In some cases certain data was missing, such as total inpatient days in the CMDB. The calculation of 1 of the 3 adjustment methods could not be completed if a hospital was missing certain data. In order to ensure comparability, any observation for which 1 of the 3 alternative methods could not be calculated was removed from the data set. Consequently, readers should be aware that means and other summary statistics in Section 3.2 may not be the same as those presented elsewhere in this report.
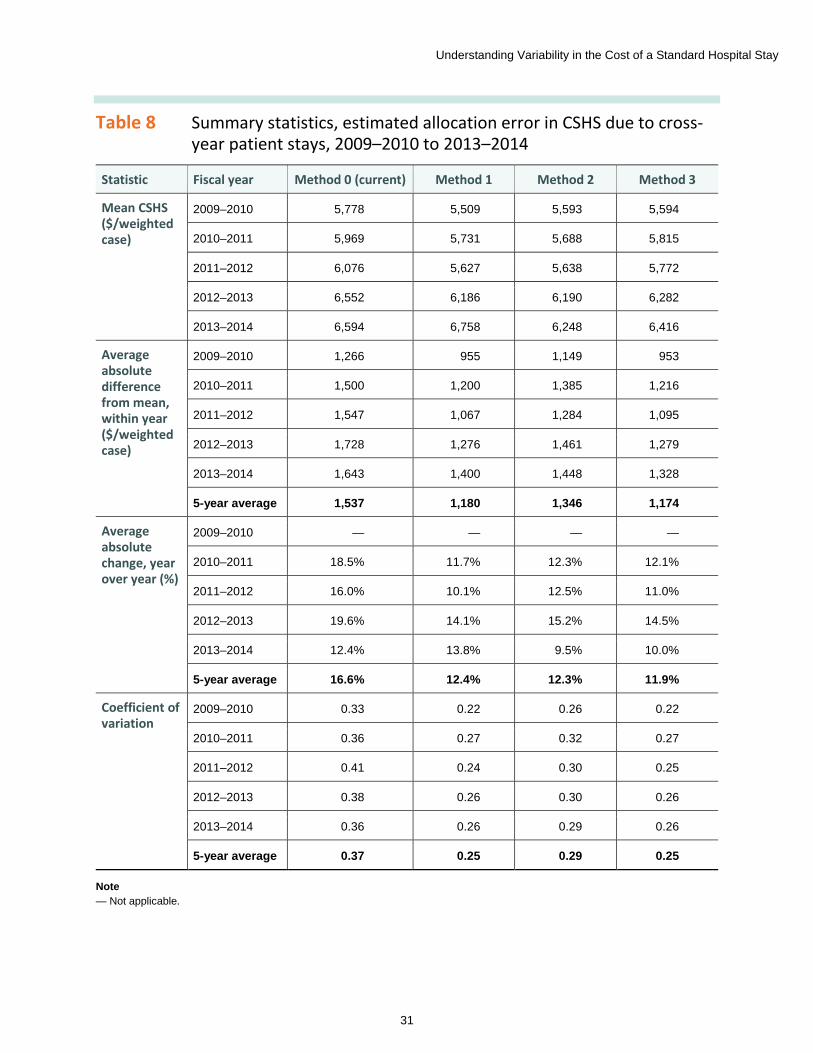
3.2.5 Evaluating adjustments to the CSHS denominator Table 8 provides a summary comparison of each method’s effectiveness in reducing allocation errors. For comparison purposes, the existing methodology is referred to as Method 0.
In general, all 3 methods reduce year-over-year variation over the existing methodology. While all seem to reduce variation between peers, Method 2 seems less effective than methods 1 and 3.
Understanding Variability in the Cost of a Standard Hospital Stay
31
Table 8 Summary statistics, estimated allocation error in CSHS due to cross-year patient stays, 2009–2010 to 2013–2014
Statistic Fiscal year Method 0 (current) Method 1 Method 2 Method 3
Mean CSHS ($/weighted case)
2009–2010 5,778 5,509 5,593 5,594
2010–2011 5,969 5,731 5,688 5,815
2011–2012 6,076 5,627 5,638 5,772
2012–2013 6,552 6,186 6,190 6,282
2013–2014 6,594 6,758 6,248 6,416
Average absolute difference from mean, within year ($/weighted case)
2009–2010 1,266 955 1,149 953
2010–2011 1,500 1,200 1,385 1,216
2011–2012 1,547 1,067 1,284 1,095
2012–2013 1,728 1,276 1,461 1,279
2013–2014 1,643 1,400 1,448 1,328
5-year average 1,537 1,180 1,346 1,174
Average absolute change, year over year (%)
2009–2010 — — — —
2010–2011 18.5% 11.7% 12.3% 12.1%
2011–2012 16.0% 10.1% 12.5% 11.0%
2012–2013 19.6% 14.1% 15.2% 14.5%
2013–2014 12.4% 13.8% 9.5% 10.0%
5-year average 16.6% 12.4% 12.3% 11.9%
Coefficient of variation
2009–2010 0.33 0.22 0.26 0.22
2010–2011 0.36 0.27 0.32 0.27
2011–2012 0.41 0.24 0.30 0.25
2012–2013 0.38 0.26 0.30 0.26
2013–2014 0.36 0.26 0.29 0.26
5-year average 0.37 0.25 0.29 0.25
Note — Not applicable.
Understanding Variability in the Cost of a Standard Hospital Stay
32
Methods 1 and 3 appear to perform similarly. They show a similar decrease in year-over-year variation, 4.2 percentage points for Method 1 and 4.7 percentage points for Method 3. Both methods also show a similar decrease in peer variation from an average absolute difference in the mean of $1,537 to $1,180 and $1,174, respectively.
Compared with the other methods, Method 1 results in a relatively large increase in the latest CSHS estimates. Methods 0, 2 and 3 all show an increase of less than 2.5% between 2012–2013 and 2014–2015, while Method 1 shows an increase of more than 9.2%. This is likely due to the fact that only 1 year of additional DAD data is available beyond the most recent CMDB submission from which to look for missing cases. This means that the data for patients who were admitted or staying in 2013–2014 but had not yet been discharged in 2014–2015 was not available. Since Method 1 improves indicator stability in all earlier reference years, it would appear that this adjustment requires at least 2 years of clinical data both before and after the year being studied to be effective.
3.2.6 Summary All of the different adjustment methods were successful in reducing year-over-year variation due to multi-year patient stays. However, only Method 3, adjusting patient stays greater than 365 days, seemed to do so without negatively impacting variation between peers or adding bias to the most recent estimates. Given that this adjustment is relatively straightforward to implement, these results suggest that CIHI should consider implementing a similar adjustment to the existing CSHS methodology.
3.3 Measuring the influence of exogenous factors 3.3.1 Initial model Based on the discussion in Section 2.4.3, the initial model (Section 2.4.3, Table 3) was determined as follows:
CSHSxi = α + β1 year + β2 rural + β3 teaching + β4 provincial wage + β5 hospital wage + β6 relative labour + β7 proportion purchased hours + β8 LOS to ELOS + β9 rehab + β10 scope
xi Modelling this function over the data set from 2009–2010 to 2013–2014 using a GLM approach requires an additional binary variable for the fiscal year, such that the model becomes this:
xi. To reduce heteroscedasticity, the CSHS is log transformed in the models presented. Note that the model is log-linear and
independent variables are not log transformed.
CSHS = α + β1 year + β2 rural + β3 teaching + β4 provincial wage + β5 hospital wage + β6 relative labour + β7 proportion purchased hours + β8 LOS to ELOS + β9 rehab + β10 scope + β11 year
Understanding Variability in the Cost of a Standard Hospital Stay
33
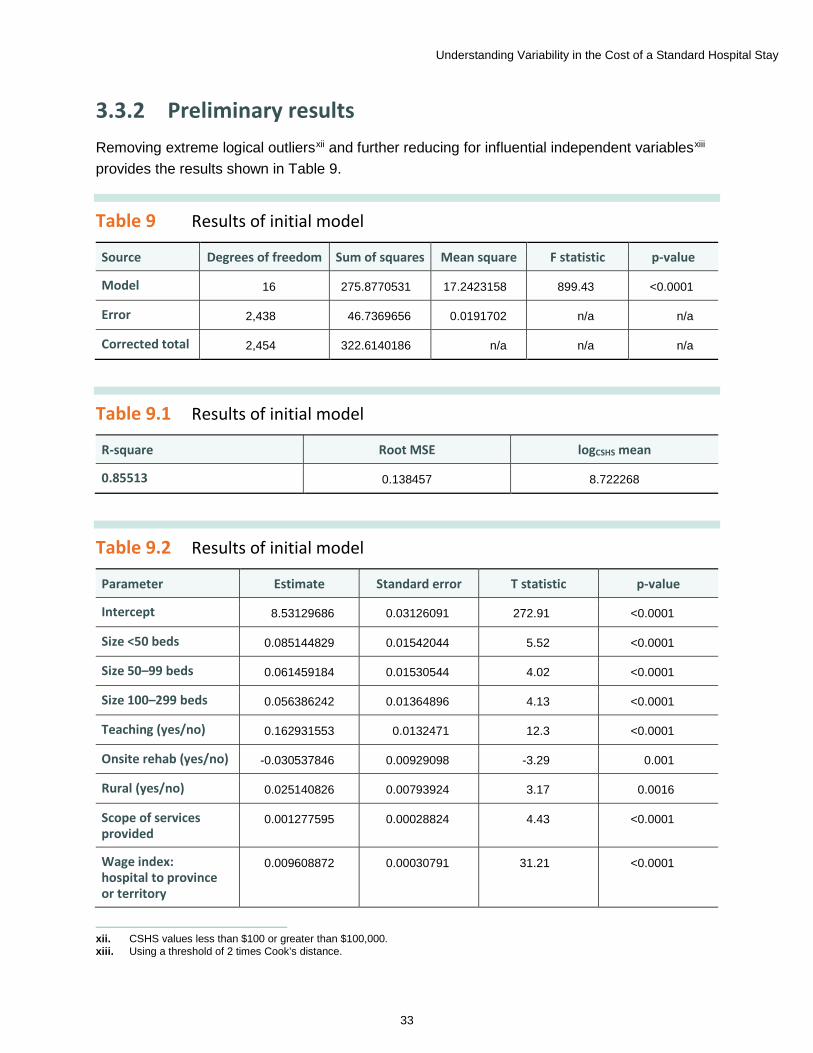
3.3.2 Preliminary results Removing extreme logical outliersxii and further reducing for influential independent variablesxiii provides the results shown in Table 9.
Table 9 Results of initial model
Source Degrees of freedom Sum of squares Mean square F statistic p-value
Model 16 275.8770531 17.2423158 899.43 <0.0001
Error 2,438 46.7369656 0.0191702 n/a n/a
Corrected total 2,454 322.6140186 n/a n/a n/a
Table 9.1 Results of initial model
R-square Root MSE logCSHS mean
0.85513 0.138457 8.722268
Table 9.2 Results of initial model
Parameter Estimate Standard error T statistic p-value
Intercept 8.53129686 0.03126091 272.91 <0.0001
Size <50 beds 0.085144829 0.01542044 5.52 <0.0001
Size 50–99 beds 0.061459184 0.01530544 4.02 <0.0001
Size 100–299 beds 0.056386242 0.01364896 4.13 <0.0001
Teaching (yes/no) 0.162931553 0.0132471 12.3 <0.0001
Onsite rehab (yes/no) -0.030537846 0.00929098 -3.29 0.001
Rural (yes/no) 0.025140826 0.00793924 3.17 0.0016
Scope of services provided
0.001277595 0.00028824 4.43 <0.0001
Wage index: hospital to province or territory
0.009608872 0.00030791 31.21 <0.0001
xii. CSHS values less than $100 or greater than $100,000. xiii. Using a threshold of 2 times Cook’s distance.
Understanding Variability in the Cost of a Standard Hospital Stay
34
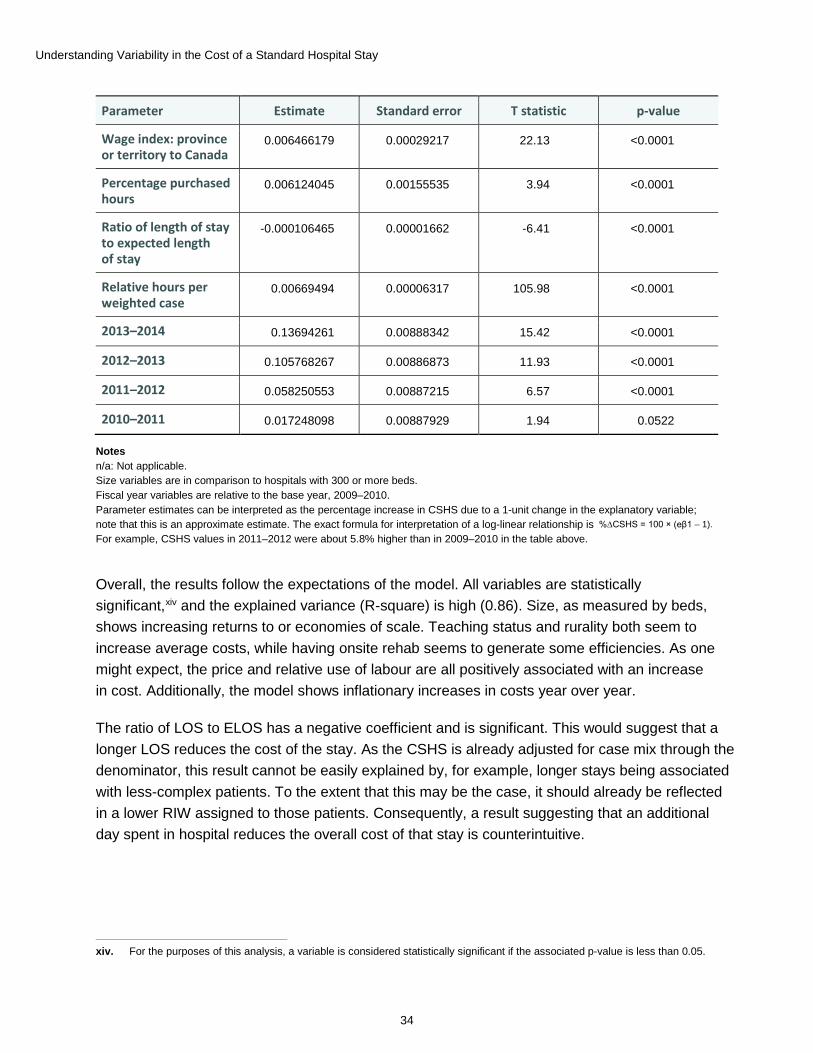
Parameter Estimate Standard error T statistic p-value
Wage index: province or territory to Canada
0.006466179 0.00029217 22.13 <0.0001
Percentage purchased hours
0.006124045 0.00155535 3.94 <0.0001
Ratio of length of stay to expected length of stay
-0.000106465 0.00001662 -6.41 <0.0001
Relative hours per weighted case
0.00669494 0.00006317 105.98 <0.0001
2013–2014 0.13694261 0.00888342 15.42 <0.0001
2012–2013 0.105768267 0.00886873 11.93 <0.0001
2011–2012 0.058250553 0.00887215 6.57 <0.0001
2010–2011 0.017248098 0.00887929 1.94 0.0522
Notes n/a: Not applicable. Size variables are in comparison to hospitals with 300 or more beds. Fiscal year variables are relative to the base year, 2009–2010. Parameter estimates can be interpreted as the percentage increase in CSHS due to a 1-unit change in the explanatory variable; note that this is an approximate estimate. The exact formula for interpretation of a log-linear relationship is Percentage change in CSHS is equal to Euler’s number to the power of beta 1 minus 1, times 100. For example, CSHS values in 2011–2012 were about 5.8% higher than in 2009–2010 in the table above.
Overall, the results follow the expectations of the model. All variables are statistically significant,xiv and the explained variance (R-square) is high (0.86). Size, as measured by beds, shows increasing returns to or economies of scale. Teaching status and rurality both seem to increase average costs, while having onsite rehab seems to generate some efficiencies. As one might expect, the price and relative use of labour are all positively associated with an increase in cost. Additionally, the model shows inflationary increases in costs year over year.
The ratio of LOS to ELOS has a negative coefficient and is significant. This would suggest that a longer LOS reduces the cost of the stay. As the CSHS is already adjusted for case mix through the denominator, this result cannot be easily explained by, for example, longer stays being associated with less-complex patients. To the extent that this may be the case, it should already be reflected in a lower RIW assigned to those patients. Consequently, a result suggesting that an additional day spent in hospital reduces the overall cost of that stay is counterintuitive.
xiv. For the purposes of this analysis, a variable is considered statistically significant if the associated p-value is less than 0.05.
%∆CSHS = 100 × (eβ1 – 1).
Understanding Variability in the Cost of a Standard Hospital Stay
35
3.3.3 The effect of post-acute and non-acute patient stays reported as acute
Further investigationxv suggests that hospitals’ reporting practices to the DAD may be responsible for the negative parameter estimate associated with the ratio of LOS to ELOS, impacting the CSHS:
xv. Please refer to Appendix C for a full discussion.
• Submitting primarily non-acute (e.g., long-term care) patient records under an acute institution type; and
• Including the post-acute (e.g., rehabilitation care) phase of the patient stay in the acute care record.
In both cases, the assigned RIW may overvalue the actual cost of the patient stay. Because the RIW is based on acute inpatient data, and because one assumes that acute care patients are likely to be more resource intensive than non-acute patients, assigning an acute care–derived RIW to a non-acute or post-acute patient will tend to overestimate the resources required for that stay. Therefore, the actual expenses recorded in the CMDB are likely to be lower than the sum of weighted cases in that facility. The net effect on the CSHS will be to increase the denominator and therefore decrease the value of the CSHS.
This would explain the negative coefficient on the ratio of LOS to ELOS. In general, these non-acute and post-acute patients can be expected to have longer stays than their acute care counterparts, on whom the ELOS is based. Hence, the greater the proportion of non-acute and post-acute patients, the higher the ratio of LOS to ELOS. And because facilities with higher proportions of these patients will tend to have a lower CSHS, LOS to ELOS will tend to exhibit an inverse relationship with CSHS in those facilities. In this context, the negative parameter estimate observed in Table 9.2 is not surprising.
3.3.4 Mitigating the influence of post-acute and non-acute patient stays
While it is not possible to exclude post-acute and non-acute patients from the calculation of the CSHS, it is possible to mitigate their effect in the model. Given that this patient population will tend to have longer stays than acute care patients, they are also much more likely to be identified in the DAD as having atypical long stays. Therefore, the proportion of atypical long stays might act as a proxy for this population.
Understanding Variability in the Cost of a Standard Hospital Stay
36
The ratio of LOS to ELOS is therefore recalculated including only typical cases, allowing us to model the relationship of clinical efficiency to the CSHS for the subset of typical acute care patients. In order to mitigate the effect of post-acute and non-acute patients, a new continuous variable is included: the percentage of long-stay atypical patients.
Results are presented in Table 10.
Table 10 Results of conceptual model adjusted for percentage long-stay atypical RIW
Source Degrees of freedom Sum of squares Mean square F statistic p-value
Model 17 275.7572893 16.221017 789.53 <0.0001
Error 2,428 49.8836787 0.0205452 n/a n/a
Corrected total 2,445 325.6409681 n/a n/a n/a
Table 10.1 Results of conceptual model adjusted for percentage long-stay atypical RIW
R-square Coefficient of variation Root MSE logCSHS mean
0.846814 1.642877 0.143336 8.724689
Table 10.2 Results of conceptual model adjusted for percentage long-stay atypical RIW
Parameter Estimate Standard error T statistic p-value
Intercept 8.447310442 0.03313245 254.96 <0.0001
Size <50 beds 0.097556302 0.01619904 6.02 <0.0001
Size 50–99 beds 0.068008216 0.01592977 4.27 <0.0001
Size 100–299 beds 0.058241319 0.01414272 4.12 <0.0001
Teaching (yes/no) 0.164050584 0.01371955 11.96 <0.0001
Onsite rehab (yes/no)
-0.031648386 0.00965384 -3.28 0.0011
Rural (yes/no) 0.023594376 0.00841312 2.8 0.0051
Understanding Variability in the Cost of a Standard Hospital Stay
37
Parameter Estimate Standard error T statistic p-value
Scope of services provided
0.001439246 0.0002874 5.01 <0.0001
Wage index: hospital to province or territory
0.009461669 0.00032201 29.38 <0.0001
Wage index: province or territory to Canada
0.006341999 0.00033065 19.18 <0.0001
Percentage purchased hours
0.006298844 0.00161308 3.9 <0.0001
Ratio of length of stay to expected length of stay (typical cases)
-0.000107162 0.00016917 -0.63 0.5265
Relative hours per weighted case
0.00658007 0.00006334 103.88 <0.0001
Percentage of long-stay atypical RIWs
-0.000790777 0.00023336 -3.39 0.0007
2013–2014 0.130886434 0.00922468 14.19 <0.0001
2012–2013 0.105255306 0.00919714 11.44 <0.0001
2011–2012 0.058392408 0.00919395 6.35 <0.0001
2010–2011 0.012078565 0.00919928 1.31 0.1893
Notes n/a: Not applicable. Size variables are in comparison to hospitals with 300 or more beds. Fiscal year variables are relative to the base year, 2009–2010.
Once the effect of non-acute and post-acute patients reported as acute is included in the conceptual model, the clinical efficiency variable ceases to be statistically significant. Instead, the proportion of RIWs due to atypical long-stay patients provides a more easily interpretable and meaningful predictor of CSHS. Given its strong likely association with non-acute patients, it supports the idea that an increasing proportion of these patients reported as acute reduces the resulting CSHS estimate.
Table 11 presents the final results for the model after reducing for significant variables.
Understanding Variability in the Cost of a Standard Hospital Stay
38
Table 11 Final CSHS model reduced for significance
Source Degrees of freedom Sum of squares Mean square F statistic p-value
Model 16 276.0648685 17.2540543 908.59 <0.0001
Error 2,436 46.2592703 0.0189898 n/a n/a
Corrected total 2,452 322.3241388 n/a n/a n/a
Table 11.1 Final CSHS model reduced for significance
R-square Coefficient of variation Root MSE logCSHS mean
0.856482 1.580019 0.137804 8.721648
Table 11.2 Final CSHS model reduced for significance
Parameter Estimate Standard error T statistic p-value
Intercept 8.402576996 0.02828781 297.04 <0.0001
Size <50 beds 0.098650364 0.01553599 6.35 <0.0001
Size 50–99 beds 0.068056872 0.01531767 4.44 <0.0001
Size 100–299 beds 0.057417794 0.01360034 4.22 <0.0001
Teaching (yes/no) 0.162077686 0.0131948 12.28 <0.0001
Onsite rehab (yes/no)
-0.028580768 0.00926292 -3.09 0.0021
Rural (yes/no) 0.025876126 0.00795428 3.25 0.0012
Scope of services provided
0.001850801 0.00025387 7.29 <0.0001
Wage index: hospital to province or territory
0.009713164 0.00030883 31.45 <0.0001
Wage index: province or territory to Canada
0.006267225 0.00031453 19.93 <0.0001
Percentage purchased hours
0.006566604 0.0015826 4.15 <0.0001
Understanding Variability in the Cost of a Standard Hospital Stay
39
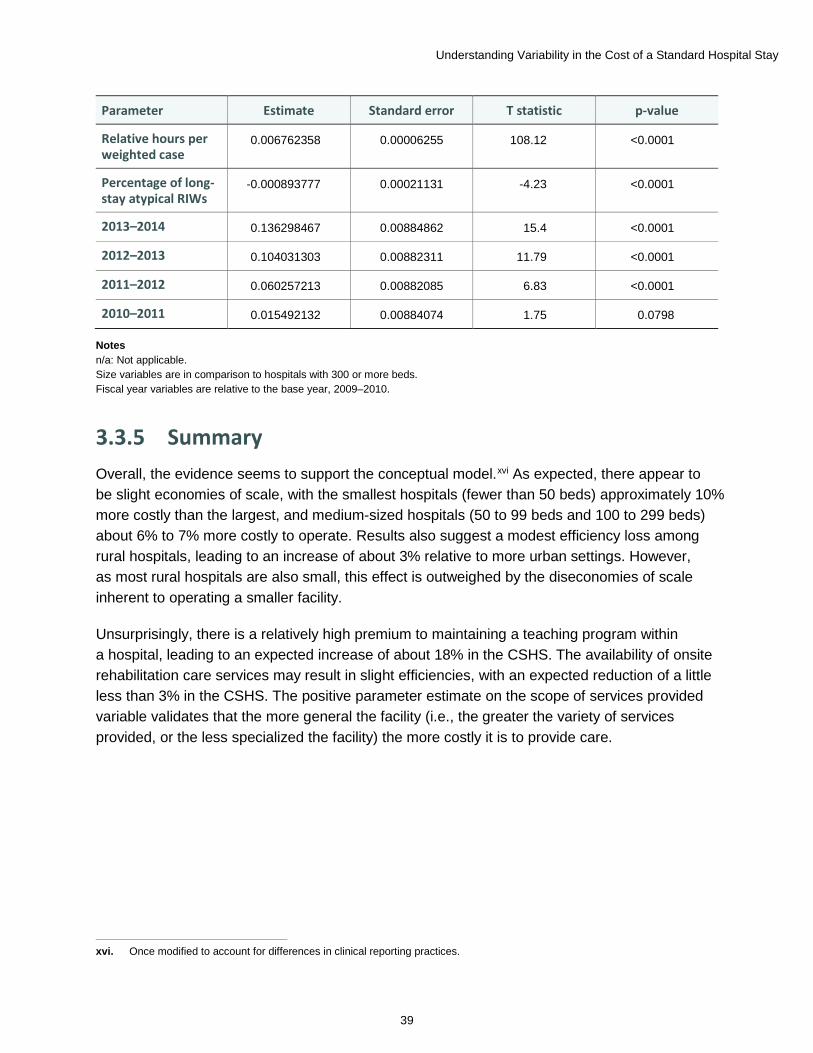
Parameter Estimate Standard error T statistic p-value
Relative hours per weighted case
0.006762358 0.00006255 108.12 <0.0001
Percentage of long-stay atypical RIWs
-0.000893777 0.00021131 -4.23 <0.0001
2013–2014 0.136298467 0.00884862 15.4 <0.0001
2012–2013 0.104031303 0.00882311 11.79 <0.0001
2011–2012 0.060257213 0.00882085 6.83 <0.0001
2010–2011 0.015492132 0.00884074 1.75 0.0798
Notes n/a: Not applicable. Size variables are in comparison to hospitals with 300 or more beds. Fiscal year variables are relative to the base year, 2009–2010.
3.3.5 Summary Overall, the evidence seems to support the conceptual model.xvi As expected, there appear to be slight economies of scale, with the smallest hospitals (fewer than 50 beds) approximately 10% more costly than the largest, and medium-sized hospitals (50 to 99 beds and 100 to 299 beds) about 6% to 7% more costly to operate. Results also suggest a modest efficiency loss among rural hospitals, leading to an increase of about 3% relative to more urban settings. However, as most rural hospitals are also small, this effect is outweighed by the diseconomies of scale inherent to operating a smaller facility.
Unsurprisingly, there is a relatively high premium to maintaining a teaching program within a hospital, leading to an expected increase of about 18% in the CSHS. The availability of onsite rehabilitation care services may result in slight efficiencies, with an expected reduction of a little less than 3% in the CSHS. The positive parameter estimate on the scope of services provided variable validates that the more general the facility (i.e., the greater the variety of services provided, or the less specialized the facility) the more costly it is to provide care.
xvi. Once modified to account for differences in clinical reporting practices.
Understanding Variability in the Cost of a Standard Hospital Stay
40
As compensation accounts for most of a hospital’s costs, it is not surprising that the cost of labour can affect the CSHS in multiple ways. The wage differences between jurisdictions (wage index: province or territory to Canada) have a significant impact on the CSHS, as does relative differences between hospitals within a province (wage index: hospital to province or territory) due to local decisions about staffing (use of overtime, staff mix, etc.). The use of agency staff (percentage purchased hours) tends to result in a higher CSHS, with a 1 percentage point increase in the overall proportion of staff hours leading to a 0.7% increase in the CSHS. Finally, the relative amount of staff to patients has a significant impact on the CSHS, with each additional worked hour per weighted case relative to the average hospital increasing the CSHS by about 0.7%.
Users of the indicator should also be aware that differences in clinical reporting practices can have a significant impact on CSHS estimates. While it is difficult to directly measure the effect of non-acute and post-acute patients on the CSHS, using the proxy measure of the proportion of long-stay atypical cases among total cases, we expect that a 1 percentage point increase in atypical long stays leads to a decrease of about 0.1% in the CSHS estimate. In other words, including non-acute and post-acute patients in acute care reporting will tend to underestimate the true CSHS of a facility.
3.4 Overall summary of results CIHI has previously recommended that users of the CSHS consider other factors when comparing results between hospitals. The results of the statistical model support the advice that CIHI has provided to users when interpreting the indicator and confirm that these exogenous differences are responsible for variability between hospitals. Based on the available data, this model suggests that, irrespective of case mix,
• Teaching activities tend to increase the CSHS by around 18%;
• The size of the facility also has an impact, with the smallest hospitals incurring an additional cost of 10% relative to the biggest hospitals;
• Geography can play a small role, with rural facilities expected to see costs increase by 3% relative to those in urban centres;
• The availability of onsite rehab might provide a small efficiency gain, reducing the average cost by around 3%;
• Overall wage differences can play a role when comparing facilities between jurisdictions;xvii
• Local hospital decisions around staff, such as relative amount, mix and overtime use, can drive CSHS differences between peers;
xvii. See Appendix B for a summary table of comparative wage indices by province or territory.
Understanding Variability in the Cost of a Standard Hospital Stay
41
• The use of third-party providers for staffing increases the average cost of providing care;xviii and
• As a hospital becomes more general and provides a greater scope of services, costs will increase. Alternatively, the more specialized the facility, the greater the financial efficiency gained.
xviii. Note that an increase in cost does not necessarily demonstrate lower efficiency. For example, while third-party staffing may be more expensive than permanent staff in the short run, it may still be less costly in the long run than hiring new permanent staff or opening an additional unit.
Clinical reporting practices can impact the accuracy of the CSHS, increasing overall variability between hospitals.
• In particular, reporting non-acute (e.g., long-term care) and post-acute (e.g., rehabilitation care) patients to the DAD as acute can lead to inflated estimates of resource use, and ultimately an underestimate of the CSHS.
Inpatient stays that cross fiscal years may increase variability in the CSHS, both over time and between peers.
• The accuracy of CSHS estimates may be negatively affected by the presence of patient stays longer than 1 year in the DAD.
• The impact of this effect is likely to be greater on smaller hospitals.
• CIHI should consider implementing an adjustment to the CSHS methodology to mitigate this effect.
The CSHS is a full-cost estimate and includes expenses directly related to patient care activities, as well as indirect costs.
• In most jurisdictions, there is very little difference in variation between the direct and indirect costs.
• Ontario and B.C. are the only jurisdictions where direct and indirect expenses vary consistently from one another in a statistically significant fashion; however, this variation in indirect expenses has relatively little material effect on the CSHS.
• CIHI could consider providing clients with a breakdown of CSHS between direct and indirect costs to aid in comparisons across jurisdictions (e.g., between a regionalized and non-regionalized province).

Understanding Variability in the Cost of a Standard Hospital Stay
42
4 Discussion The CSHS is a complex indicator that can be influenced by many different factors. While CIHI has provided guidance with respect to additional considerations when understanding and comparing CSHS values, these have never been systematically tested. After examining the likely causes of variation in the indicator estimates, CIHI’s previous guidance is largely borne out by the evidence.
Many of the factors that influence the CSHS are outside of a hospital’s control. Rural location, teaching status and relative sizexix of the hospital all affect the cost of providing inpatient care. Overall differences in wages between jurisdictions, likely driven by differences in the cost of living and in collective bargaining agreements, should also be considered when comparing CSHS values across provinces and territories. While facilities may not be able to influence these factors directly, they should be aware of the impact of these factors when comparing results with those of their peers.
The administrative structure of a jurisdiction may play a role in the variation of the CSHS. For example, in a non-regionalized province such as Ontario, the relatively smaller amount of shared administrative services between smaller numbers of facilities seems to lead to a statistically significant increase in the variability of the CSHS indicator. A statistically significant difference does not necessarily lead to a practical difference; however, it suggests that there may be a need for CIHI to disaggregate the indicator between direct and indirect portions to aid in cross-jurisdictional comparisons.
The methodology of the CSHS can also be improved to reduce the impact of inpatients with hospital stays that stretch across multiple years. The current CSHS methodology does not seem to increase the overall variability of the indicator between peers. Adopting an adjustment to the current methodology for the denominator could reduce year-over-year variability and increase the stability of the indicator.
From a hospital’s perspective, the greatest factor over which it has direct influence is labour. Specifically, operating and management decisions that affect the average wage in acute care are a significant factor in driving differences in the CSHS. Examples of these types of decisions that could affect wages include the staff mix in a nursing unit and the use of overtime.
xix. The smaller the hospital, the greater the cost.

Understanding Variability in the Cost of a Standard Hospital Stay
43
The effects of other factors are not as clear and should be interpreted with caution. For example, while the evidence suggests that hiring staff on a short-term basis from a third-party provider tends to increase costs, this may be more efficient in the long run than hiring permanent staff to fill those roles. While the analysis found that the range of services offered had a significant impact on the average cost, the authority to reduce or add specific services may not lie with the hospital. Even in the case where the hospital or RHA could make those decisions directly, the needs of the population may predominate.
Finally, it will be important to understand the impact of hospital reporting practices on the accuracy of CSHS estimates. Applying an acute inpatient methodology, such as CMG+, to non-acute and post-acute patients may not provide meaningful estimates of hospital resource utilization. It also has the potential to reduce the accuracy of the CSHS denominator. In order to make meaningful comparisons, it will be important to ensure that any facilities included in analyses of the CSHS have limited their acute care submission to the DAD to truly acute care inpatients.
Taken together, these results explain the majority of observed variation in the CSHS. They suggest that most of the differences between hospitals’ CSHS estimates can be explained either by exogenous factors or by hospital management decisions. While the overall quality of the indicator appears robust, CIHI will continue to improve the accuracy, reliability and usefulness of the CSHS indicator.
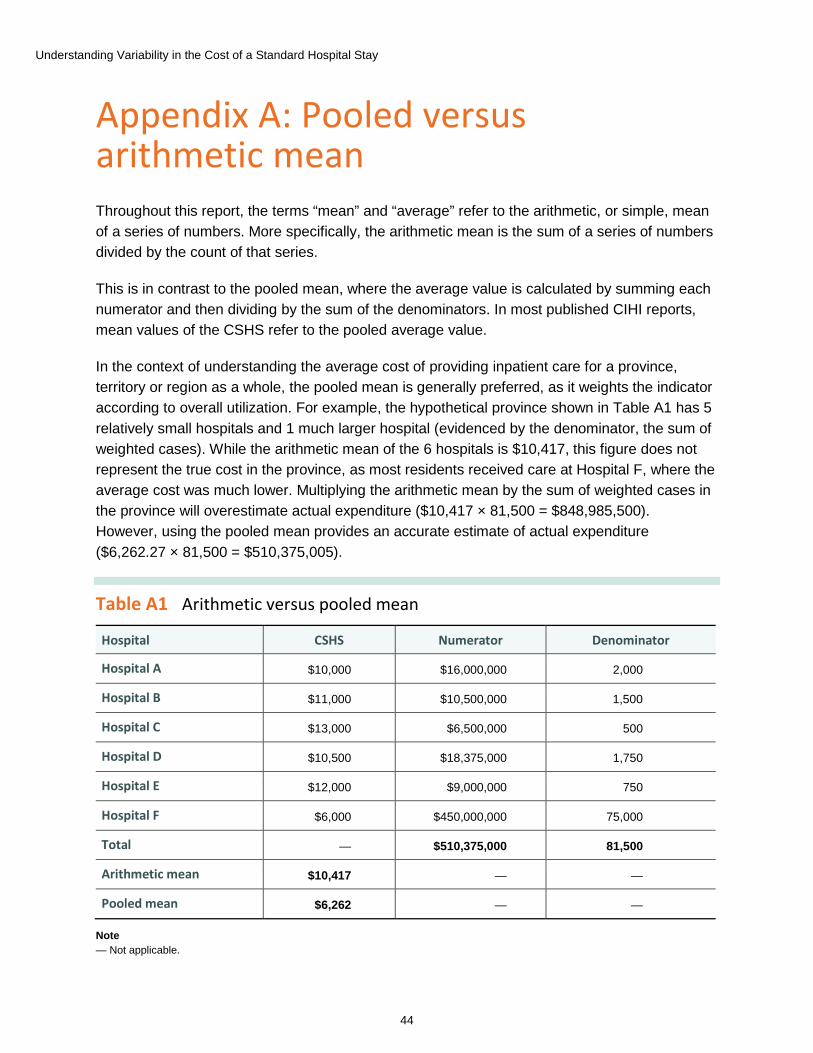
Understanding Variability in the Cost of a Standard Hospital Stay
44
Appendix A: Pooled versus arithmetic mean Throughout this report, the terms “mean” and “average” refer to the arithmetic, or simple, mean of a series of numbers. More specifically, the arithmetic mean is the sum of a series of numbers divided by the count of that series.
This is in contrast to the pooled mean, where the average value is calculated by summing each numerator and then dividing by the sum of the denominators. In most published CIHI reports, mean values of the CSHS refer to the pooled average value.
In the context of understanding the average cost of providing inpatient care for a province, territory or region as a whole, the pooled mean is generally preferred, as it weights the indicator according to overall utilization. For example, the hypothetical province shown in Table A1 has 5 relatively small hospitals and 1 much larger hospital (evidenced by the denominator, the sum of weighted cases). While the arithmetic mean of the 6 hospitals is $10,417, this figure does not represent the true cost in the province, as most residents received care at Hospital F, where the average cost was much lower. Multiplying the arithmetic mean by the sum of weighted cases in the province will overestimate actual expenditure ($10,417 × 81,500 = $848,985,500). However, using the pooled mean provides an accurate estimate of actual expenditure ($6,262.27 × 81,500 = $510,375,005).
Table A1 Arithmetic versus pooled mean
Hospital CSHS Numerator Denominator
Hospital A $10,000 $16,000,000 2,000
Hospital B $11,000 $10,500,000 1,500
Hospital C $13,000 $6,500,000 500
Hospital D $10,500 $18,375,000 1,750
Hospital E $12,000 $9,000,000 750
Hospital F $6,000 $450,000,000 75,000
Total — $510,375,000 81,500
Arithmetic mean $10,417 — —
Pooled mean $6,262 — —
Note — Not applicable.

Understanding Variability in the Cost of a Standard Hospital Stay
45
Because the focus of this report is to examine the variability of CSHS results across hospitals, it is more appropriate to use the arithmetic mean. Using the arithmetic mean provides a better understanding of overall variation in hospital values, irrespective of size. Using the pooled mean in this analysis would not speak to variation in the indicator, but rather to the observed difference from large, statistically influential hospitals.

Understanding Variability in the Cost of a Standard Hospital Stay
46
Appendix B: Jurisdictional wage index
Table B1 Jurisdictional wage index
Fiscal year N.L. P.E.I. N.S. N.B. Ont. Man. Sask. Alta. B.C. Y.T.
2009–2010 0.86 0.73 0.81 0.77 1.06 0.85 0.98 1.06 1.03 1.23
2010–2011 0.85 0.73 0.84 0.76 1.07 0.85 0.99 1.05 1.03 1.22
2011–2012 0.88 0.80 0.86 0.76 1.05 0.83 1.02 1.05 1.03 1.25
2012–2013 0.87 0.81 0.87 0.77 1.04 0.86 1.01 1.08 1.00 1.18
2013–2014 0.87 0.80 0.88 0.79 1.04 0.83 1.01 1.10 0.98 1.18
Source Canadian MIS Database, Canadian Institute for Health Information.

Understanding Variability in the Cost of a Standard Hospital Stay
47
Appendix C: DAD reporting practices and their impact on the CSHS Revisiting basic assumptions To begin exploring the underlying cause of the counterintuitive finding in Section 3.3.2, one can construct a simple model that allows the testing of some basic assumptions about the indicator.
Recall that the CSHS is defined as the quotient of total inpatient-related expenses to total inpatient RIWs.
𝐶𝐶𝐶𝐶𝐶𝐶𝐶𝐶 =∑ 𝑖𝑖𝑖𝑖𝑖𝑖𝑖𝑖𝑖𝑖𝑖𝑖𝑖𝑖𝑖𝑖𝑖𝑖-𝑟𝑟𝑖𝑖𝑟𝑟𝑖𝑖𝑖𝑖𝑖𝑖𝑟𝑟 𝑖𝑖𝑒𝑒𝑖𝑖𝑖𝑖𝑖𝑖𝑒𝑒𝑖𝑖𝑒𝑒
∑ 𝑖𝑖𝑖𝑖𝑖𝑖𝑖𝑖𝑖𝑖𝑖𝑖𝑖𝑖𝑖𝑖𝑖𝑖 𝑅𝑅𝑅𝑅𝑅𝑅𝑒𝑒
The denominator can be rewritten as the sum of inpatient discharges times the overall Case Mix Index (CMI),xx such that
𝐶𝐶𝐶𝐶𝐶𝐶𝐶𝐶 =∑ 𝑖𝑖𝑖𝑖𝑖𝑖𝑖𝑖𝑖𝑖𝑖𝑖𝑖𝑖𝑖𝑖𝑖𝑖 𝑖𝑖𝑒𝑒𝑖𝑖𝑖𝑖𝑖𝑖𝑒𝑒𝑖𝑖𝑒𝑒
𝐶𝐶𝐶𝐶𝑅𝑅 × ∑ 𝑖𝑖𝑖𝑖𝑖𝑖𝑖𝑖𝑖𝑖𝑖𝑖𝑖𝑖𝑖𝑖𝑖𝑖 𝑟𝑟𝑖𝑖𝑒𝑒𝑑𝑑ℎ𝑖𝑖𝑟𝑟𝑎𝑎𝑖𝑖𝑒𝑒
Rearranging the equation provides a relationship that is easily modelled:xxi
�𝑖𝑖𝑖𝑖𝑖𝑖𝑖𝑖𝑖𝑖𝑖𝑖𝑖𝑖𝑖𝑖𝑖𝑖 𝑖𝑖𝑒𝑒𝑖𝑖𝑖𝑖𝑖𝑖𝑒𝑒𝑖𝑖𝑒𝑒 = 𝐶𝐶𝐶𝐶𝐶𝐶𝐶𝐶 × 𝐶𝐶𝐶𝐶𝑅𝑅 × �𝑟𝑟𝑖𝑖𝑒𝑒𝑑𝑑ℎ𝑖𝑖𝑟𝑟𝑎𝑎𝑖𝑖𝑒𝑒
xx. See Appendix F for a glossary of terms. xxi. Given that it produces a model that resembles the Cobb-Douglas production function.
Log-transforming this model allows for easier interpretation, such that for hospital i
log(total inpatient expenses) = log(CSHS) + β1 log(CMItypical i) + β2 log(total dischargesi)
Assuming economies of scale exist, beta 2 would be expected to be less than 1. For example, a beta 2 coefficient estimate of 0.9 would suggest that a 10% increase in inpatient discharges leads to a 9% increase in total expenses.
In general, the CMG+ and CSHS methodologies assume that costs are proportional to the average CMI. In this case, one would not expect that beta 1 would be significantly different than 1. For example, a 10% increase in average complexity of patients should result in a 10% increase in expenses.
𝛽𝛽2 𝛽𝛽2
𝛽𝛽1

Understanding Variability in the Cost of a Standard Hospital Stay
48
A beta 1 value greater than 1 would indicate some cost compression in the RIW estimates. That is, it would have a tendency to generate estimates closer to the overall mean, underestimating high resource use cases and overestimating low resource use cases.xxii
A beta 1 value of less than 1 would be more difficult to explain. Other things being equal, one should not expect to see this. However, as shown in Table C1, the national data set provides an unexpected result.
Table C1 Results of arithmetic model, 2009–2010 to 2013–2014
Source Degrees of freedom Sum of squares Mean square F statistic p-value
Model 6 5,963.305 993.884167 6,409.99 <0.0001
Error 2,562 397.24401 0.155052 n/a n/a
Corrected total 2,568 6,360.54901 n/a n/a n/a
Table C1.1 Results of arithmetic model, 2009–2010 to 2013–2014
R-square Coefficient of variation Root MSE logcost mean
0.937546 2.449756 0.393767 16.07372
Table C1.2 Results of arithmetic model, 2009–2010 to 2013–2014
Parameter Estimate Standard error T statistic p-value
Intercept 9.443837331 0.03883022 243.21 <0.0001
2009–2010 -0.147427244 0.02462648 -5.99 <0.0001
2010–2011 -0.140067094 0.02459542 -5.69 <0.0001
2011–2012 -0.092766111 0.02458843 -3.77 0.0002
2012–2013 -0.03515467 0.02459173 -1.43 0.153
2013–2014 0 n/a n/a n/a
Log (discharges) 0.919656338 0.00469474 195.89 <0.0001
Log (CMI) 0.742781206 0.01602334 46.36 <0.0001
Note n/a: Not applicable.
xxii. This might not be unexpected if, for example, some of the patient costing data used to generate the CMG+ estimates had
quality issues. Given that data is rarely perfect, this is not much of a concern, assuming only moderate quality concerns in the patient costing data.
𝛽𝛽1
𝛽𝛽1
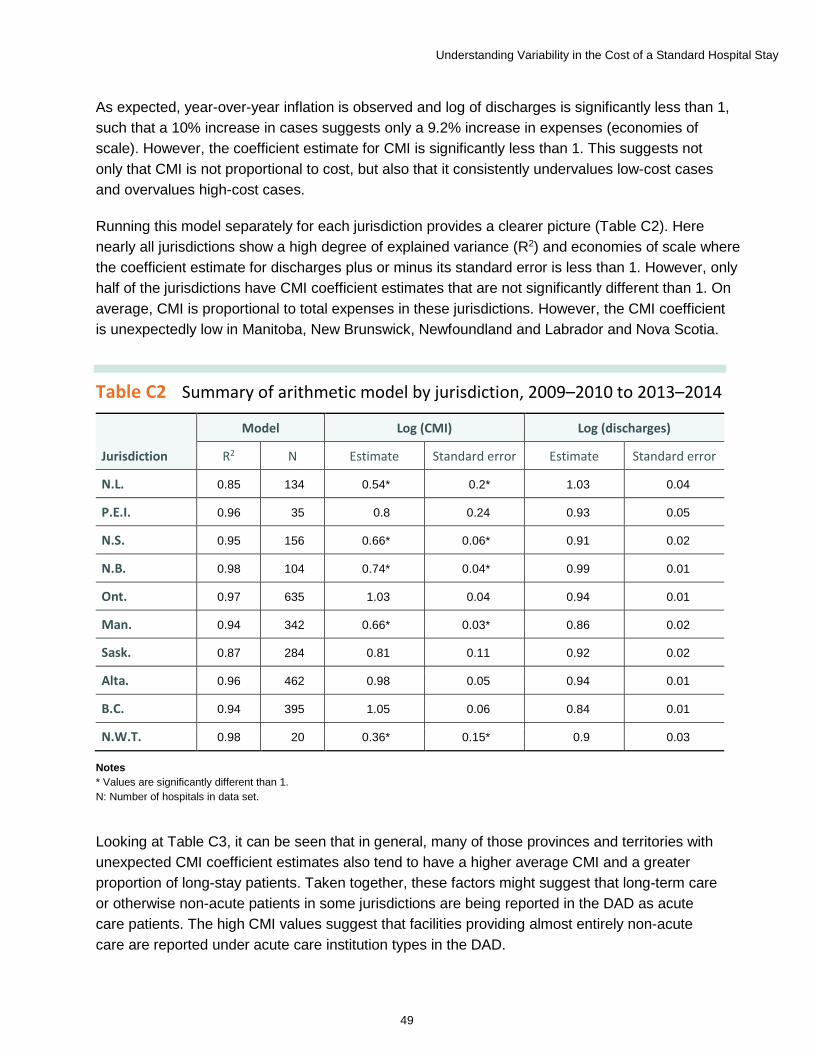
Understanding Variability in the Cost of a Standard Hospital Stay
49
As expected, year-over-year inflation is observed and log of discharges is significantly less than 1, such that a 10% increase in cases suggests only a 9.2% increase in expenses (economies of scale). However, the coefficient estimate for CMI is significantly less than 1. This suggests not only that CMI is not proportional to cost, but also that it consistently undervalues low-cost cases and overvalues high-cost cases.
Running this model separately for each jurisdiction provides a clearer picture (Table C2). Here nearly all jurisdictions show a high degree of explained variance (R2) and economies of scale where the coefficient estimate for discharges plus or minus its standard error is less than 1. However, only half of the jurisdictions have CMI coefficient estimates that are not significantly different than 1. On average, CMI is proportional to total expenses in these jurisdictions. However, the CMI coefficient is unexpectedly low in Manitoba, New Brunswick, Newfoundland and Labrador and Nova Scotia.
Table C2 Summary of arithmetic model by jurisdiction, 2009–2010 to 2013–2014
Jurisdiction
Model Log (CMI) Log (discharges)
R2 N Estimate Standard error Estimate Standard error
N.L. 0.85 134 0.54* 0.2* 1.03 0.04
P.E.I. 0.96 35 0.8 0.24 0.93 0.05
N.S. 0.95 156 0.66* 0.06* 0.91 0.02
N.B. 0.98 104 0.74* 0.04* 0.99 0.01
Ont. 0.97 635 1.03 0.04 0.94 0.01
Man. 0.94 342 0.66* 0.03* 0.86 0.02
Sask. 0.87 284 0.81 0.11 0.92 0.02
Alta. 0.96 462 0.98 0.05 0.94 0.01
B.C. 0.94 395 1.05 0.06 0.84 0.01
N.W.T. 0.98 20 0.36* 0.15* 0.9 0.03
Notes * Values are significantly different than 1. N: Number of hospitals in data set.
Looking at Table C3, it can be seen that in general, many of those provinces and territories with unexpected CMI coefficient estimates also tend to have a higher average CMI and a greater proportion of long-stay patients. Taken together, these factors might suggest that long-term care or otherwise non-acute patients in some jurisdictions are being reported in the DAD as acute care patients. The high CMI values suggest that facilities providing almost entirely non-acute care are reported under acute care institution types in the DAD.

Understanding Variability in the Cost of a Standard Hospital Stay
50
Assuming that the average non-acute care patient is less resource intensive than the average acute care patient, assigning acute care weights to non-acute patients would result in an overvalued RIW relative to actual costs. In other words, non-acute patients reported as acute would tend to reduce the CSHS of a hospital.
Table C3 Average hospital Case Mix Index, percentage long stay, by jurisdiction, by year, 2009–2010 to 2013–2014
Jurisdiction
Average Case Mix Index Percentage long-stay weighted cases
2009 2010 2011 2012 2013 2009 2010 2011 2012 2013
N.L. 1.19 1.21 1.17 1.2 1.32 0.37 0.35 0.33 0.33 0.38
P.E.I. 1.81* 1.74* 2.09* 2.08* 2.83* 0.5* 0.46* 0.52* 0.54* 0.6*
N.S. 2.33* 2* 2.23* 2.02* 2.16* 0.48* 0.44* 0.46* 0.46* 0.47*
N.B. 1.88* 1.91* 1.84* 1.89* 1.91* 0.39* 0.42* 0.42* 0.44* 0.42*
Ont. 1.24 1.28 1.29 1.32 1.38 0.23 0.22 0.23 0.22 0.22
Man. 5.37* 3.89* 3.12* 3.52* 4.3* 0.49* 0.5* 0.51* 0.55* 0.57*
Sask. 0.94 0.97 1.07 1.11 1.07 0.24 0.24 0.29 0.3 0.31
Alta. 1.14 1.14 1.18 1.17 1.2 0.33 0.3 0.33 0.32 0.33
B.C. 1.18 1.19 1.26 1.24 1.25 0.25 0.23 0.27 0.25 0.25
Y.T. 0.83 0.81 0.87 0.83 0.9 0.23 0.18 0.23 0.2 0.25
N.W.T. 0.73 0.84 0.86 0.8 0.75 0.25 0.29 0.27 0.26 0.24
Total 1.83 1.63 1.57 1.62 1.77 0.32 0.31 0.33 0.33 0.34
Note * Higher-than-average Case Mix Index and proportion of long-stay weighted cases.
Correcting for non-acute facilities reporting as acute facilities While no data elements directly capture the presence of non-acute patients in acute care DAD reporting, several elements exist that might nevertheless serve as a proxy. In particular, non-acute patients might reasonably be expected to be associated with a greater proportion of alternate level of care (ALC) days. They may also be more likely to have a longer overall stay and thus be identified as atypical long-stay patients in the CMG+ methodology.
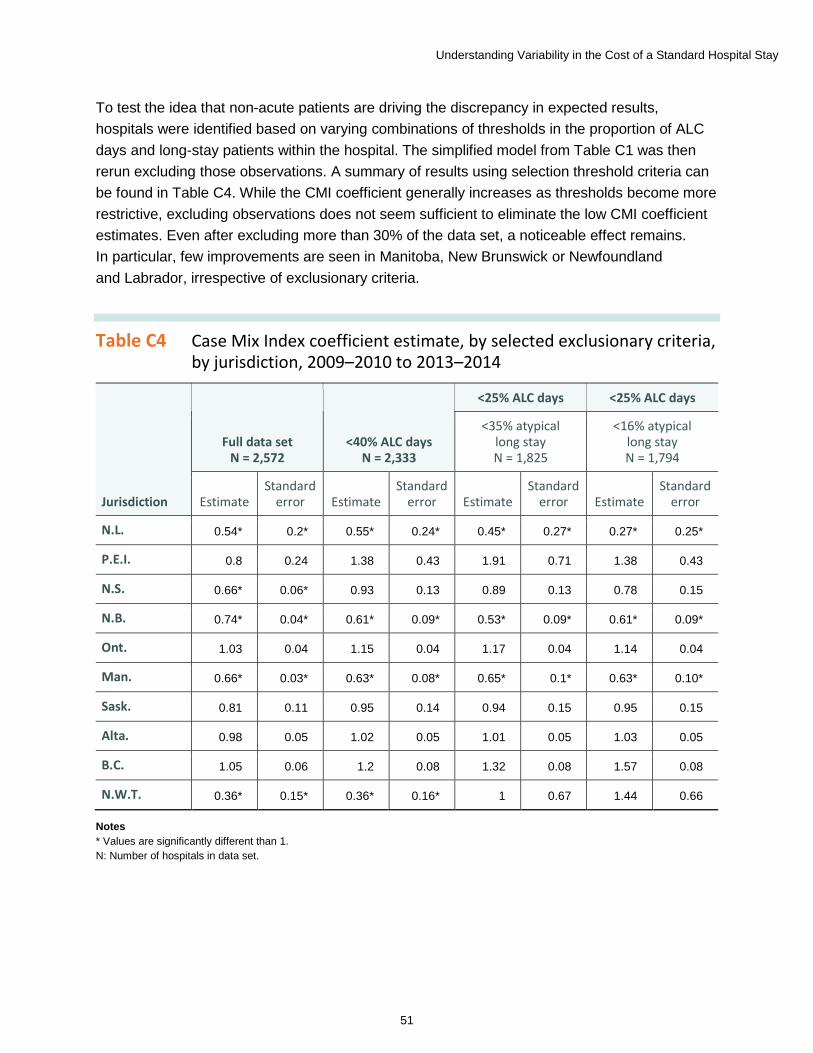
Understanding Variability in the Cost of a Standard Hospital Stay
51
To test the idea that non-acute patients are driving the discrepancy in expected results, hospitals were identified based on varying combinations of thresholds in the proportion of ALC days and long-stay patients within the hospital. The simplified model from Table C1 was then rerun excluding those observations. A summary of results using selection threshold criteria can be found in Table C4. While the CMI coefficient generally increases as thresholds become more restrictive, excluding observations does not seem sufficient to eliminate the low CMI coefficient estimates. Even after excluding more than 30% of the data set, a noticeable effect remains. In particular, few improvements are seen in Manitoba, New Brunswick or Newfoundland and Labrador, irrespective of exclusionary criteria.
Table C4 Case Mix Index coefficient estimate, by selected exclusionary criteria, by jurisdiction, 2009–2010 to 2013–2014
Jurisdiction
Full data set N = 2,572
<40% ALC days N = 2,333
<25% ALC days <25% ALC days
<35% atypical long stay N = 1,825
<16% atypical long stay N = 1,794
Estimate Standard
error Estimate Standard
error Estimate Standard
error Estimate Standard
error
N.L. 0.54* 0.2* 0.55* 0.24* 0.45* 0.27* 0.27* 0.25*
P.E.I. 0.8 0.24 1.38 0.43 1.91 0.71 1.38 0.43
N.S. 0.66* 0.06* 0.93 0.13 0.89 0.13 0.78 0.15
N.B. 0.74* 0.04* 0.61* 0.09* 0.53* 0.09* 0.61* 0.09*
Ont. 1.03 0.04 1.15 0.04 1.17 0.04 1.14 0.04
Man. 0.66* 0.03* 0.63* 0.08* 0.65* 0.1* 0.63* 0.10*
Sask. 0.81 0.11 0.95 0.14 0.94 0.15 0.95 0.15
Alta. 0.98 0.05 1.02 0.05 1.01 0.05 1.03 0.05
B.C. 1.05 0.06 1.2 0.08 1.32 0.08 1.57 0.08
N.W.T. 0.36* 0.15* 0.36* 0.16* 1 0.67 1.44 0.66
Notes * Values are significantly different than 1. N: Number of hospitals in data set.
Understanding Variability in the Cost of a Standard Hospital Stay
52
The influence of post-acute patients reported in acute institution types The results from the preceding section suggest that there is an additional driver beyond the seemingly non-acute facilities reported to the DAD as acute. Given that the effect exists to one degree or another across much of the data set, it seems likely that varying proportions of non-acute patients are included with acute patients in many hospitals’ reporting to the DAD. Best reporting practices suggest that once a patient concludes the acute portion of a stay and moves into a post-acute phase such as rehabilitation care, that patient is discharged from acute care and readmitted as a rehab patient. Hospitals may not follow this process and may record the entire stay as a single acute stay. As a result, the overall LOS for one of these patients would be longer than that of a typical acute patient and that case could be reported as an atypical long-stay case.
Since it is likely that the RIW assignment for non-acute and post-acute patients is greater than the actual resource consumption incurred by those patients, the overall CMI for the hospital will be overvalued. An attempt to correct this in the simple model can be made by replacing the overall CMI value with the CMI for typical patients only.xxiii The model then becomes
log(total inpatient expenses) = log(CSHS) + β1 log(CMItypical i) + β2 log(total dischargesi)
xxiii. Note that this assumes all atypical cases are overvalued. Where this is not the case, the CMI coefficient estimate may see some inflation through the substitution of typical CMI for total CMI.
As seen in Table C5, once the model is adjusted for the influence of non-acute and post-acute patients by eliminating the proxy measure of atypical long stays, the unexpected effect on the CMI coefficient largely disappears.
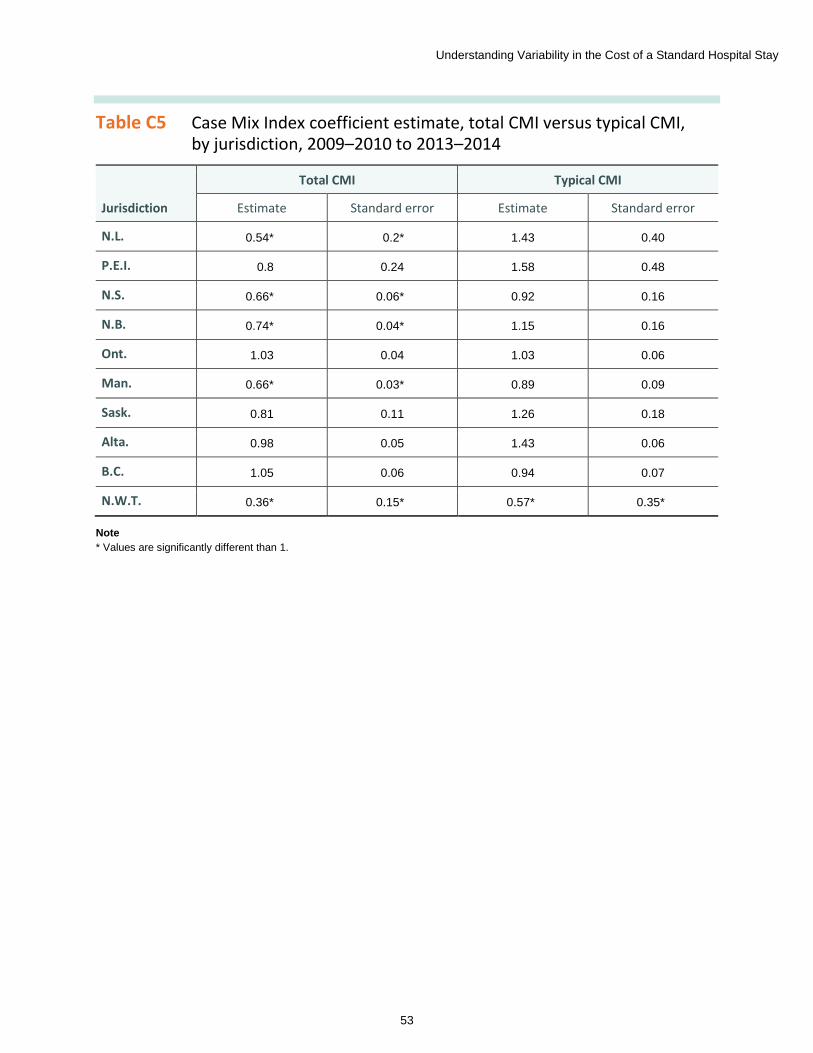
Understanding Variability in the Cost of a Standard Hospital Stay
53
Table C5 Case Mix Index coefficient estimate, total CMI versus typical CMI, by jurisdiction, 2009–2010 to 2013–2014
Jurisdiction
Total CMI Typical CMI
Estimate Standard error Estimate Standard error
N.L. 0.54* 0.2* 1.43 0.40
P.E.I. 0.8 0.24 1.58 0.48
N.S. 0.66* 0.06* 0.92 0.16
N.B. 0.74* 0.04* 1.15 0.16
Ont. 1.03 0.04 1.03 0.06
Man. 0.66* 0.03* 0.89 0.09
Sask. 0.81 0.11 1.26 0.18
Alta. 0.98 0.05 1.43 0.06
B.C. 1.05 0.06 0.94 0.07
N.W.T. 0.36* 0.15* 0.57* 0.35*
Note * Values are significantly different than 1.
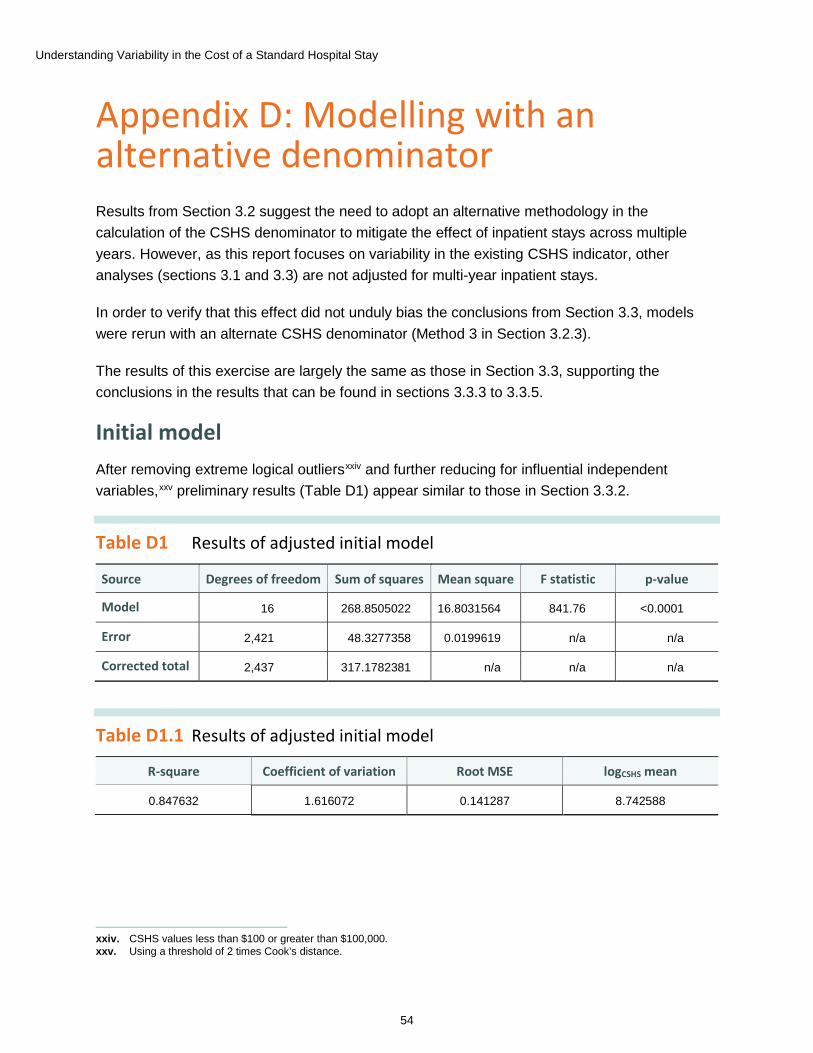
Understanding Variability in the Cost of a Standard Hospital Stay
54
Appendix D: Modelling with an alternative denominator Results from Section 3.2 suggest the need to adopt an alternative methodology in the calculation of the CSHS denominator to mitigate the effect of inpatient stays across multiple years. However, as this report focuses on variability in the existing CSHS indicator, other analyses (sections 3.1 and 3.3) are not adjusted for multi-year inpatient stays.
In order to verify that this effect did not unduly bias the conclusions from Section 3.3, models were rerun with an alternate CSHS denominator (Method 3 in Section 3.2.3).
The results of this exercise are largely the same as those in Section 3.3, supporting the conclusions in the results that can be found in sections 3.3.3 to 3.3.5.
Initial model After removing extreme logical outliersxxiv and further reducing for influential independent variables,xxv preliminary results (Table D1) appear similar to those in Section 3.3.2.
Table D1 Results of adjusted initial model
xxiv. CSHS values less than $100 or greater than $100,000. xxv. Using a threshold of 2 times Cook’s distance.
Source Degrees of freedom Sum of squares Mean square F statistic p-value
Model 16 268.8505022 16.8031564 841.76 <0.0001
Error 2,421 48.3277358 0.0199619 n/a n/a
Corrected total 2,437 317.1782381 n/a n/a n/a
Table D1.1 Results of adjusted initial model
R-square Coefficient of variation Root MSE logCSHS mean
0.847632 1.616072 0.141287 8.742588

Understanding Variability in the Cost of a Standard Hospital Stay
55
Table D1.2 Results of adjusted initial model
Parameter Estimate Standard error T statistic p-value
Intercept 8.555604405 0.03254966 262.85 <0.0001
Size <50 beds 0.088258348 0.01589031 5.55 <0.0001
Size 50–99 beds 0.062102652 0.01575542 3.94 <0.0001
Size 100–299 beds 0.05714565 0.01407386 4.06 <0.0001
Teaching (yes/no) 0.168840501 0.01364486 12.37 <0.0001
Onsite rehab (yes/no)
-0.032505232 0.00951502 -3.42 0.0006
Rural (yes/no) 0.030814755 0.00812299 3.79 0.0002
Scope of services provided
0.001201941 0.00030108 3.99 <0.0001
Wage index: hospital to province or territory
0.009057799 0.00031527 28.73 <0.0001
Wage index: province or territory to Canada
0.006500877 0.00030021 21.65 <0.0001
Percentage purchased hours
0.005360963 0.00162881 3.29 0.001
Ratio of length of stay to expected length of stay
-0.00006212 0.00002098 -2.96 0.0031
Relative hours per weighted case
0.006503595 0.00006242 104.18 <0.0001
2013–2014 0.126590332 0.00907893 13.94 <0.0001
2012–2013 0.107816183 0.00907216 11.88 <0.0001
2011–2012 0.047750202 0.00905963 5.27 <0.0001
2010–2011 0.016036818 0.009069 1.77 0.0771
Notes n/a: Not applicable. Size variables are in comparison to hospitals with 300 or more beds. Fiscal year variables are relative to the base year, 2009–2010.
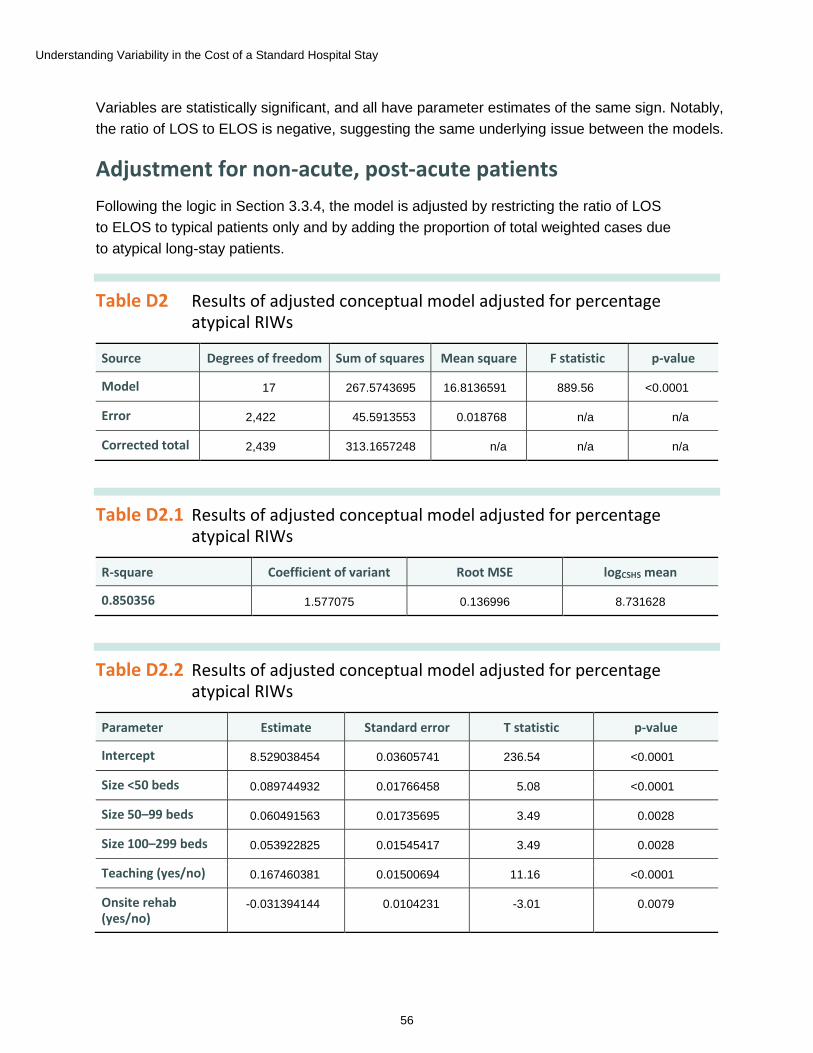
Understanding Variability in the Cost of a Standard Hospital Stay
56
Variables are statistically significant, and all have parameter estimates of the same sign. Notably, the ratio of LOS to ELOS is negative, suggesting the same underlying issue between the models.
Adjustment for non-acute, post-acute patients Following the logic in Section 3.3.4, the model is adjusted by restricting the ratio of LOS to ELOS to typical patients only and by adding the proportion of total weighted cases due to atypical long-stay patients.
Table D2 Results of adjusted conceptual model adjusted for percentage atypical RIWs
Source Degrees of freedom Sum of squares Mean square F statistic p-value
Model 17 267.5743695 16.8136591 889.56 <0.0001
Error 2,422 45.5913553 0.018768 n/a n/a
Corrected total 2,439 313.1657248 n/a n/a n/a
Table D2.1 Results of adjusted conceptual model adjusted for percentage atypical RIWs
R-square Coefficient of variant Root MSE logCSHS mean
0.850356 1.577075 0.136996 8.731628
Table D2.2 Results of adjusted conceptual model adjusted for percentage atypical RIWs
Parameter Estimate Standard error T statistic p-value
Intercept 8.529038454 0.03605741 236.54 <0.0001
Size <50 beds 0.089744932 0.01766458 5.08 <0.0001
Size 50–99 beds 0.060491563 0.01735695 3.49 0.0028
Size 100–299 beds 0.053922825 0.01545417 3.49 0.0028
Teaching (yes/no) 0.167460381 0.01500694 11.16 <0.0001
Onsite rehab (yes/no)
-0.031394144 0.0104231 -3.01 0.0079

Understanding Variability in the Cost of a Standard Hospital Stay
57
Parameter Estimate Standard error T statistic p-value
Rural (yes/no) 0.026651943 0.00907738 2.94 0.0092
Scope of services provided
0.001061032 0.00031436 3.38 0.0036
Wage index: hospital to province or territory
0.009111622 0.00034597 26.34 <0.0001
Wage index: province or territory to Canada
0.005917293 0.0003523 16.8 <0.0001
Percentage purchased hours
0.005673937 0.00180777 3.14 0.006
Ratio of length of stay to expected length of stay (typical cases)
-0.000359595 0.00019506 -0.84 0.4126
Relative hours per weighted case
0.006521541 0.00006931 94.09 <0.0001
Percentage of long-stay atypical RIWs
-0.000521019 0.00025416 -2.62 0.0018
2013–2014 0.127385856 0.00891327 14.29 <0.0001
2012–2013 0.107895263 0.00883995 12.5 <0.0001
2011–2012 0.051861892 0.00886473 5.85 <0.0001
2010–2011 0.01851704 0.00887445 2.19 0.0428
Notes n/a: Not applicable. Size variables are in comparison to hospitals with 300 or more beds. Fiscal year variables are relative to the base year, 2009–2010.
As in the original CSHS model, making these adjustments removes the significance of the ratio of LOS to ELOS (typical patients), while the percentage of long-stay atypical inpatients is negative and significant.
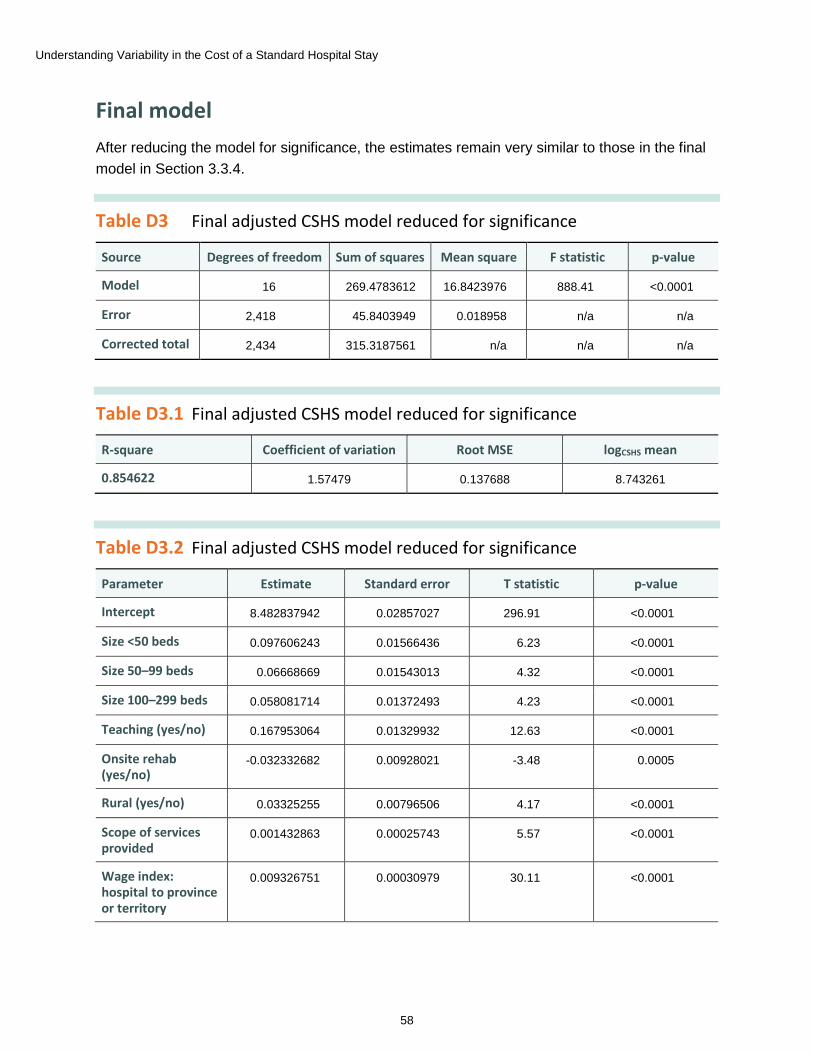
Understanding Variability in the Cost of a Standard Hospital Stay
58
Final model After reducing the model for significance, the estimates remain very similar to those in the final model in Section 3.3.4.
Table D3 Final adjusted CSHS model reduced for significance
Source Degrees of freedom Sum of squares Mean square F statistic p-value
Model 16 269.4783612 16.8423976 888.41 <0.0001
Error 2,418 45.8403949 0.018958 n/a n/a
Corrected total 2,434 315.3187561 n/a n/a n/a
Table D3.1 Final adjusted CSHS model reduced for significance
R-square Coefficient of variation Root MSE logCSHS mean
0.854622 1.57479 0.137688 8.743261
Table D3.2 Final adjusted CSHS model reduced for significance
Parameter Estimate Standard error T statistic p-value
Intercept 8.482837942 0.02857027 296.91 <0.0001
Size <50 beds 0.097606243 0.01566436 6.23 <0.0001
Size 50–99 beds 0.06668669 0.01543013 4.32 <0.0001
Size 100–299 beds 0.058081714 0.01372493 4.23 <0.0001
Teaching (yes/no) 0.167953064 0.01329932 12.63 <0.0001
Onsite rehab (yes/no)
-0.032332682 0.00928021 -3.48 0.0005
Rural (yes/no) 0.03325255 0.00796506 4.17 <0.0001
Scope of services provided
0.001432863 0.00025743 5.57 <0.0001
Wage index: hospital to province or territory
0.009326751 0.00030979 30.11 <0.0001
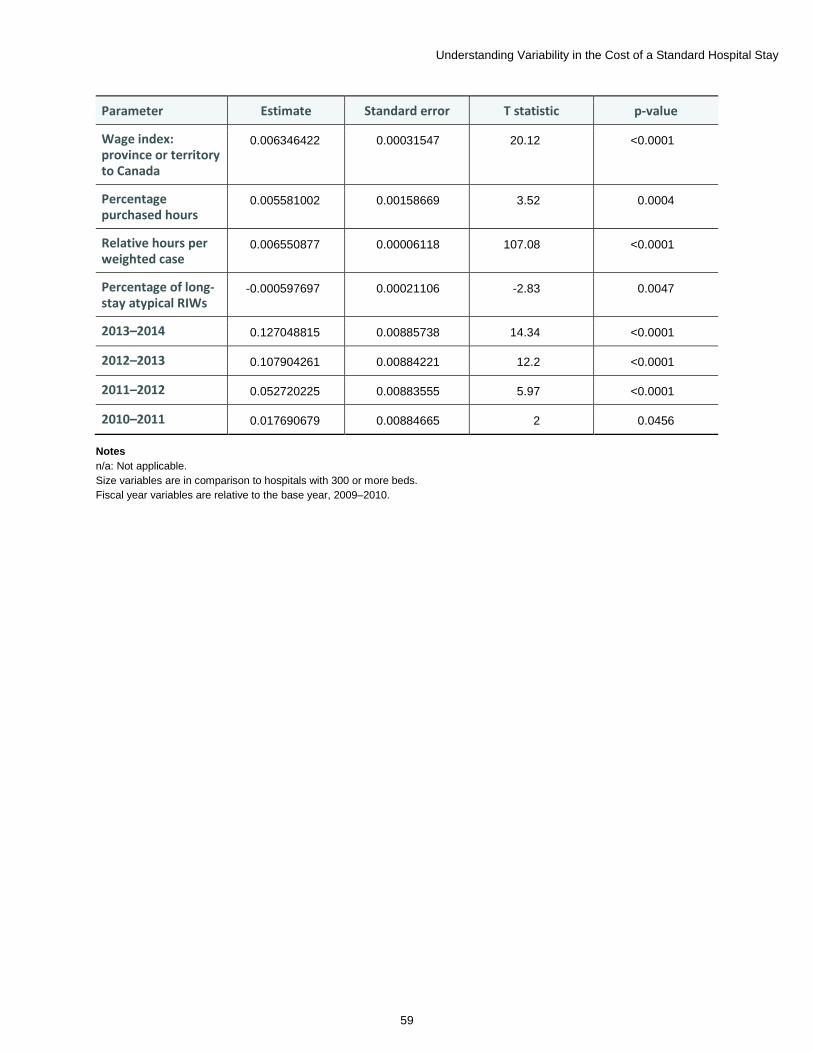
Understanding Variability in the Cost of a Standard Hospital Stay
59
Parameter Estimate Standard error T statistic p-value
Wage index: province or territory to Canada
0.006346422 0.00031547 20.12 <0.0001
Percentage purchased hours
0.005581002 0.00158669 3.52 0.0004
Relative hours per weighted case
0.006550877 0.00006118 107.08 <0.0001
Percentage of long-stay atypical RIWs
-0.000597697 0.00021106 -2.83 0.0047
2013–2014 0.127048815 0.00885738 14.34 <0.0001
2012–2013 0.107904261 0.00884221 12.2 <0.0001
2011–2012 0.052720225 0.00883555 5.97 <0.0001
2010–2011 0.017690679 0.00884665 2 0.0456
Notes n/a: Not applicable. Size variables are in comparison to hospitals with 300 or more beds. Fiscal year variables are relative to the base year, 2009–2010.
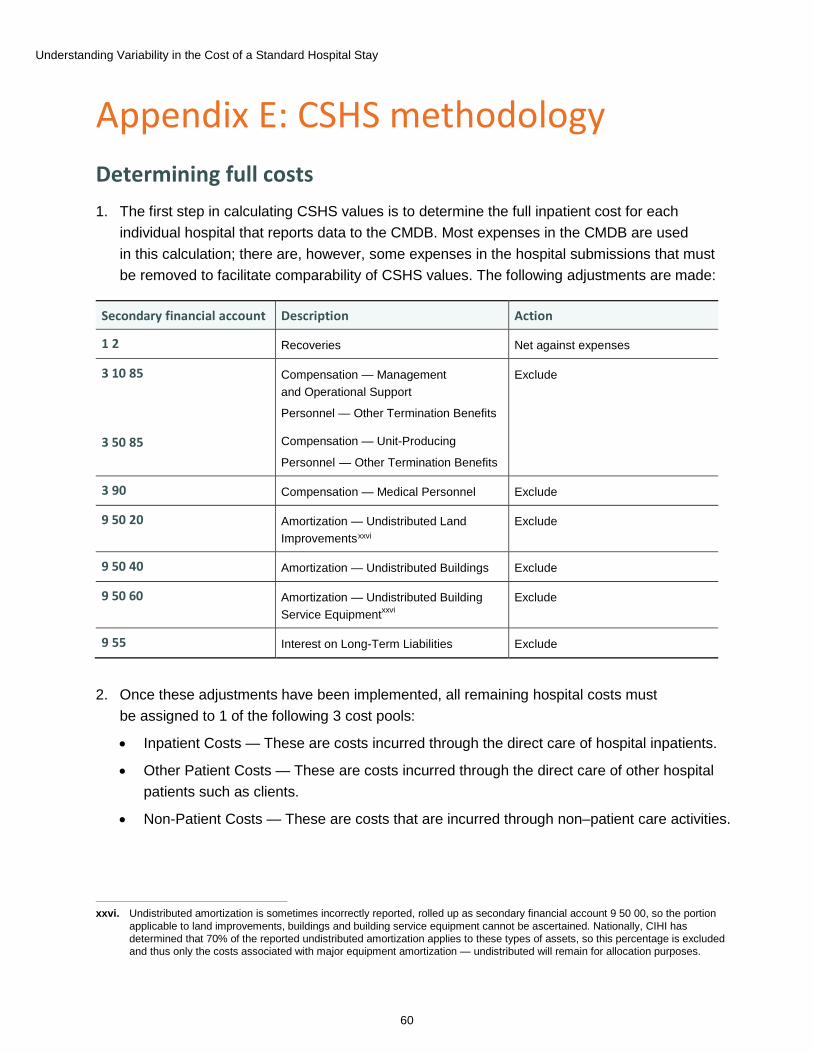
Understanding Variability in the Cost of a Standard Hospital Stay
60
Appendix E: CSHS methodology Determining full costs 1. The first step in calculating CSHS values is to determine the full inpatient cost for each
individual hospital that reports data to the CMDB. Most expenses in the CMDB are used in this calculation; there are, however, some expenses in the hospital submissions that must be removed to facilitate comparability of CSHS values. The following adjustments are made:
Secondary financial account Description Action
1 2 Recoveries Net against expenses
3 10 85
3 50 85
Compensation — Management and Operational Support
Personnel — Other Termination Benefits
Compensation — Unit-Producing
Personnel — Other Termination Benefits
Exclude
3 90 Compensation — Medical Personnel Exclude
9 50 20 Amortization — Undistributed Land Improvementsxxvi
Exclude
9 50 40 Amortization — Undistributed Buildings Exclude
9 50 60 Amortization — Undistributed Building Service Equipmentxxvi
Exclude
9 55 Interest on Long-Term Liabilities Exclude
xxvi. Undistributed amortization is sometimes incorrectly reported, rolled up as secondary financial account 9 50 00, so the portion applicable to land improvements, buildings and building service equipment cannot be ascertained. Nationally, CIHI has determined that 70% of the reported undistributed amortization applies to these types of assets, so this percentage is excluded and thus only the costs associated with major equipment amortization — undistributed will remain for allocation purposes.
2. Once these adjustments have been implemented, all remaining hospital costs must be assigned to 1 of the following 3 cost pools:
• Inpatient Costs — These are costs incurred through the direct care of hospital inpatients.
• Other Patient Costs — These are costs incurred through the direct care of other hospital patients such as clients.
• Non-Patient Costs — These are costs that are incurred through non–patient care activities.
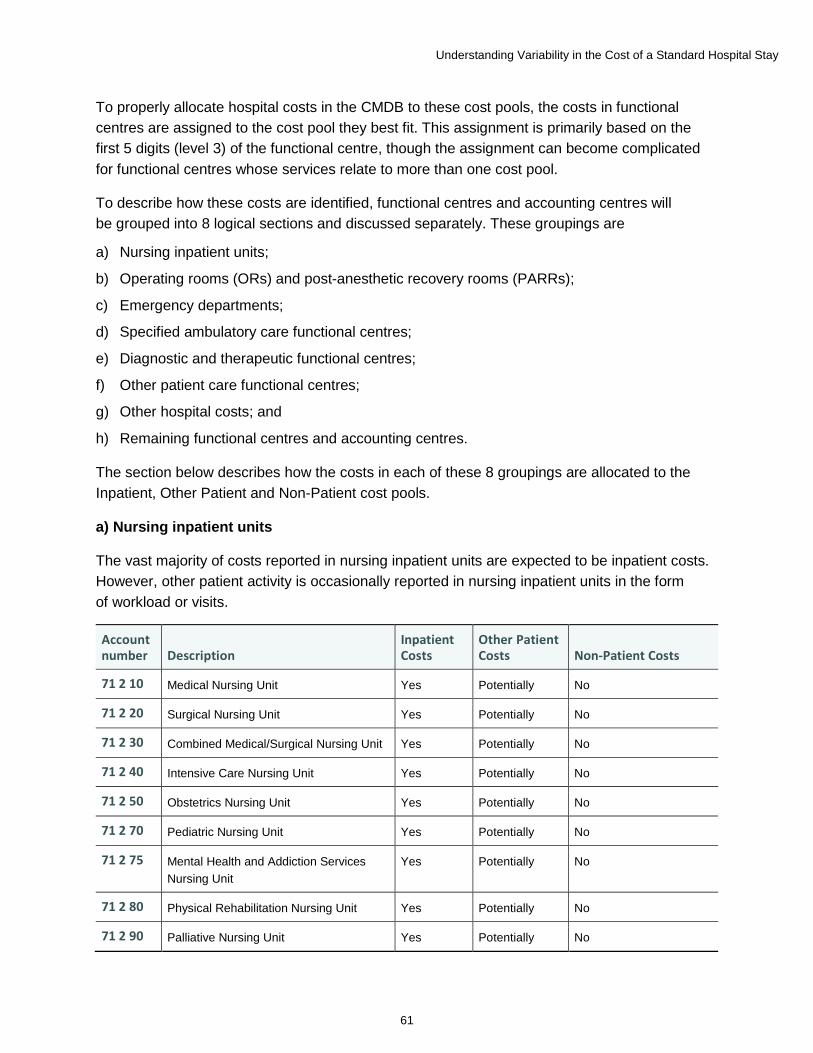
Understanding Variability in the Cost of a Standard Hospital Stay
61
To properly allocate hospital costs in the CMDB to these cost pools, the costs in functional centres are assigned to the cost pool they best fit. This assignment is primarily based on the first 5 digits (level 3) of the functional centre, though the assignment can become complicated for functional centres whose services relate to more than one cost pool.
To describe how these costs are identified, functional centres and accounting centres will be grouped into 8 logical sections and discussed separately. These groupings are
a) Nursing inpatient units;
b) Operating rooms (ORs) and post-anesthetic recovery rooms (PARRs);
c) Emergency departments;
d) Specified ambulatory care functional centres;
e) Diagnostic and therapeutic functional centres;
f) Other patient care functional centres;
g) Other hospital costs; and
h) Remaining functional centres and accounting centres.
The section below describes how the costs in each of these 8 groupings are allocated to the Inpatient, Other Patient and Non-Patient cost pools.
a) Nursing inpatient units
The vast majority of costs reported in nursing inpatient units are expected to be inpatient costs. However, other patient activity is occasionally reported in nursing inpatient units in the form of workload or visits.
Account number Description
Inpatient Costs
Other Patient Costs Non-Patient Costs
71 2 10 Medical Nursing Unit Yes Potentially No
71 2 20 Surgical Nursing Unit Yes Potentially No
71 2 30 Combined Medical/Surgical Nursing Unit Yes Potentially No
71 2 40 Intensive Care Nursing Unit Yes Potentially No
71 2 50 Obstetrics Nursing Unit Yes Potentially No
71 2 70 Pediatric Nursing Unit Yes Potentially No
71 2 75 Mental Health and Addiction Services Nursing Unit
Yes Potentially No
71 2 80 Physical Rehabilitation Nursing Unit Yes Potentially No
71 2 90 Palliative Nursing Unit Yes Potentially No
Understanding Variability in the Cost of a Standard Hospital Stay
62
In order to determine the amount of expenses that should be allocated to the Other Patient cost pool, all of the above functional centres that report other patient visits are identified. These functional centres are passed through a two-phase algorithm to determine an appropriate allocation to the Other Patient cost pool.
Phase 1: All nursing inpatient functional centres with workload are passed through a linear regression model that uses its labour-adjusted cost per workload unit as the dependent variable, and fiscal year and functional centre as the independent variables.
All functional centres that pass this regression are deemed to demonstrate a reasonable relationship between total workload and labour-adjusted expenses; their allocation to the Other Patient cost pool is based on their proportion of reported workload by category of service recipient.
Phase 2: All nursing inpatient functional centres with other patient visits and other patient workload are passed through 3 consecutive linear regression models, where only those functional centres that pass one model are passed on to the subsequent model. The independent variables for each model include fiscal year and functional centre. The dependent variables are
• Other patient workload per other patient visit;
• Labour-adjusted expenses per workload unit; and
• Other patient portion of labour-adjusted expenses per other patient visit.
Those functional centres that pass all 3 regression models are deemed to demonstrate a reasonable relationship between the 3 variables and are used to calculate a national cost per other patient visit. This national cost per other patient visit is then scaled for each jurisdiction to reflect its own labour rates, and multiplied against the other patient visits of each functional centre that failed Phase 1.
Functional centres that reported workload and visits in service recipient categories that contradicted one another are deemed to consist of 100% inpatient expenses.
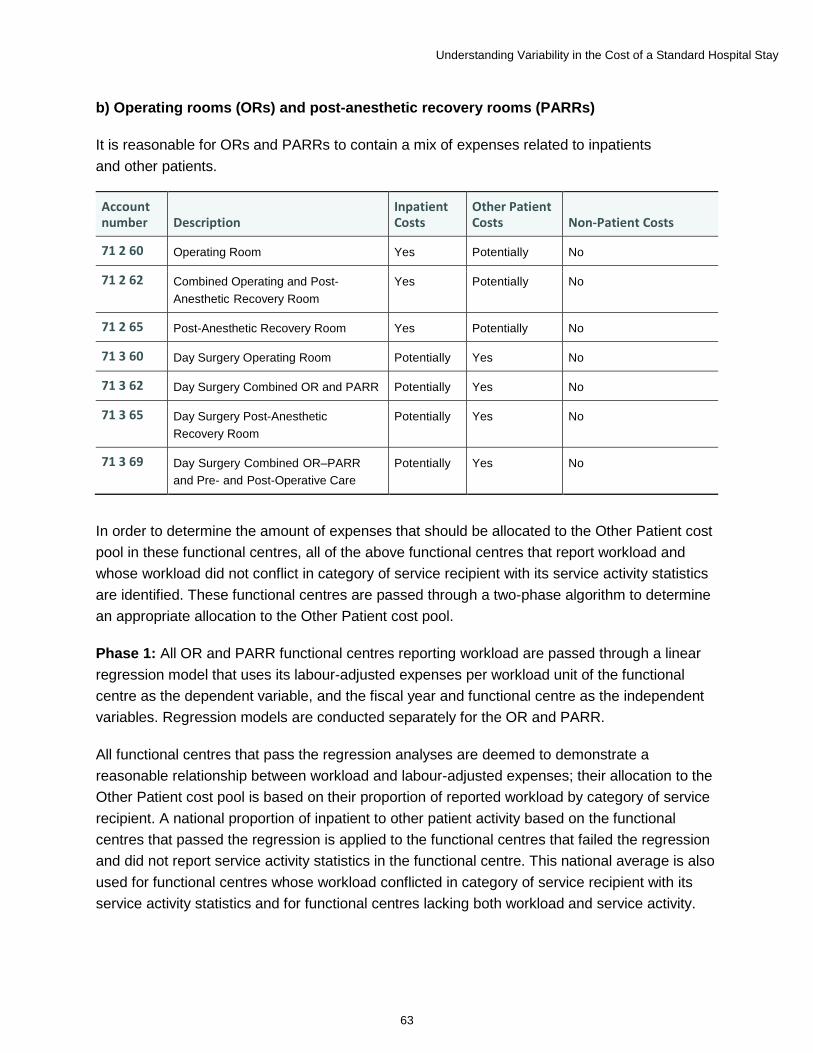
Understanding Variability in the Cost of a Standard Hospital Stay
63
b) Operating rooms (ORs) and post-anesthetic recovery rooms (PARRs)
It is reasonable for ORs and PARRs to contain a mix of expenses related to inpatients and other patients.
Account number Description
Inpatient Costs
Other Patient Costs Non-Patient Costs
71 2 60 Operating Room Yes Potentially No
71 2 62 Combined Operating and Post- Anesthetic Recovery Room
Yes Potentially No
71 2 65 Post-Anesthetic Recovery Room Yes Potentially No
71 3 60 Day Surgery Operating Room Potentially Yes No
71 3 62 Day Surgery Combined OR and PARR Potentially Yes No
71 3 65 Day Surgery Post-Anesthetic Recovery Room
Potentially Yes No
71 3 69 Day Surgery Combined OR–PARR and Pre- and Post-Operative Care
Potentially Yes No
In order to determine the amount of expenses that should be allocated to the Other Patient cost pool in these functional centres, all of the above functional centres that report workload and whose workload did not conflict in category of service recipient with its service activity statistics are identified. These functional centres are passed through a two-phase algorithm to determine an appropriate allocation to the Other Patient cost pool.
Phase 1: All OR and PARR functional centres reporting workload are passed through a linear regression model that uses its labour-adjusted expenses per workload unit of the functional centre as the dependent variable, and the fiscal year and functional centre as the independent variables. Regression models are conducted separately for the OR and PARR.
All functional centres that pass the regression analyses are deemed to demonstrate a reasonable relationship between workload and labour-adjusted expenses; their allocation to the Other Patient cost pool is based on their proportion of reported workload by category of service recipient. A national proportion of inpatient to other patient activity based on the functional centres that passed the regression is applied to the functional centres that failed the regression and did not report service activity statistics in the functional centre. This national average is also used for functional centres whose workload conflicted in category of service recipient with its service activity statistics and for functional centres lacking both workload and service activity.
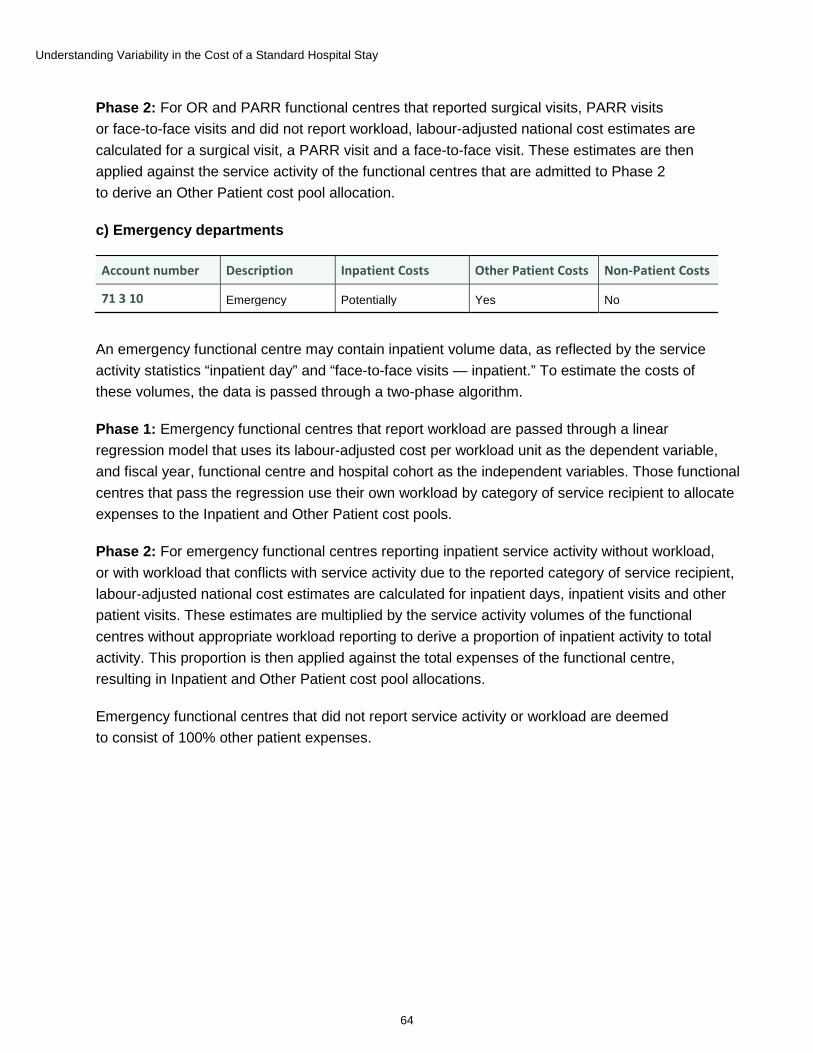
Understanding Variability in the Cost of a Standard Hospital Stay
64
Phase 2: For OR and PARR functional centres that reported surgical visits, PARR visits or face-to-face visits and did not report workload, labour-adjusted national cost estimates are calculated for a surgical visit, a PARR visit and a face-to-face visit. These estimates are then applied against the service activity of the functional centres that are admitted to Phase 2 to derive an Other Patient cost pool allocation.
c) Emergency departments
Account number Description Inpatient Costs Other Patient Costs Non-Patient Costs
71 3 10 Emergency Potentially Yes No
An emergency functional centre may contain inpatient volume data, as reflected by the service activity statistics “inpatient day” and “face-to-face visits — inpatient.” To estimate the costs of these volumes, the data is passed through a two-phase algorithm.
Phase 1: Emergency functional centres that report workload are passed through a linear regression model that uses its labour-adjusted cost per workload unit as the dependent variable, and fiscal year, functional centre and hospital cohort as the independent variables. Those functional centres that pass the regression use their own workload by category of service recipient to allocate expenses to the Inpatient and Other Patient cost pools.
Phase 2: For emergency functional centres reporting inpatient service activity without workload, or with workload that conflicts with service activity due to the reported category of service recipient, labour-adjusted national cost estimates are calculated for inpatient days, inpatient visits and other patient visits. These estimates are multiplied by the service activity volumes of the functional centres without appropriate workload reporting to derive a proportion of inpatient activity to total activity. This proportion is then applied against the total expenses of the functional centre, resulting in Inpatient and Other Patient cost pool allocations.
Emergency functional centres that did not report service activity or workload are deemed to consist of 100% other patient expenses.
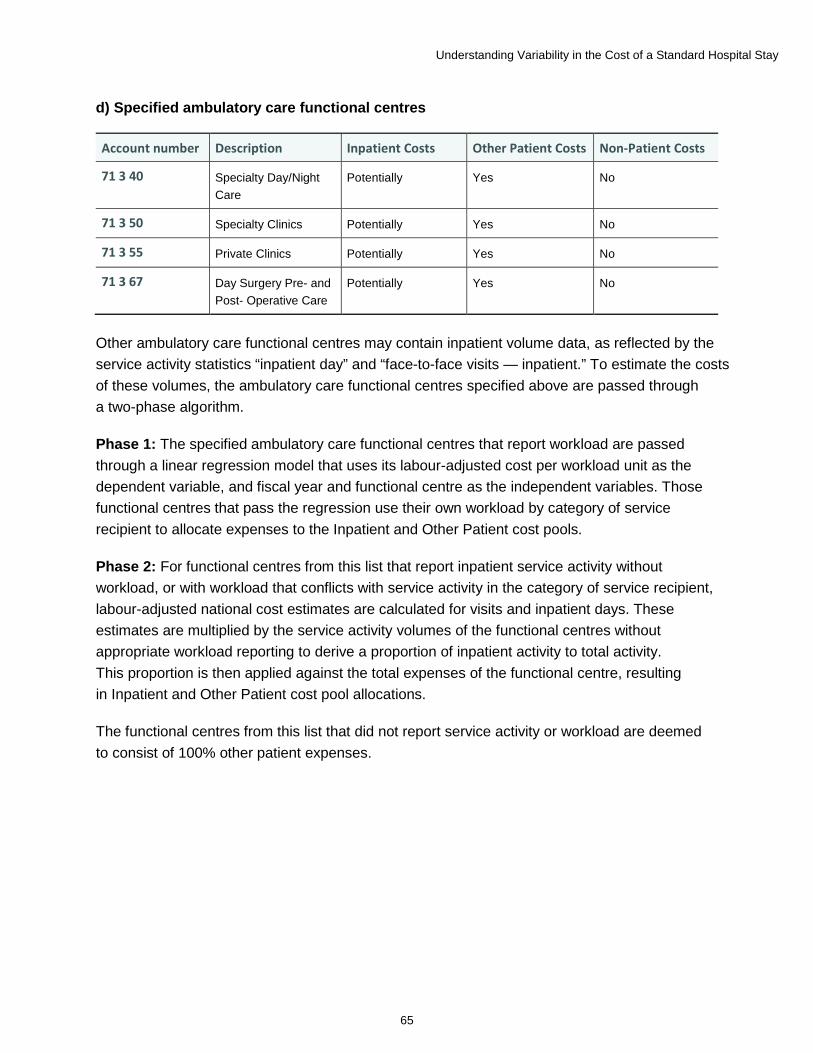
Understanding Variability in the Cost of a Standard Hospital Stay
65
d) Specified ambulatory care functional centres
Account number Description Inpatient Costs Other Patient Costs Non-Patient Costs
71 3 40 Specialty Day/Night Care
Potentially Yes No
71 3 50 Specialty Clinics Potentially Yes No
71 3 55 Private Clinics Potentially Yes No
71 3 67 Day Surgery Pre- and Post- Operative Care
Potentially Yes No
Other ambulatory care functional centres may contain inpatient volume data, as reflected by the service activity statistics “inpatient day” and “face-to-face visits — inpatient.” To estimate the costs of these volumes, the ambulatory care functional centres specified above are passed through a two-phase algorithm.
Phase 1: The specified ambulatory care functional centres that report workload are passed through a linear regression model that uses its labour-adjusted cost per workload unit as the dependent variable, and fiscal year and functional centre as the independent variables. Those functional centres that pass the regression use their own workload by category of service recipient to allocate expenses to the Inpatient and Other Patient cost pools.
Phase 2: For functional centres from this list that report inpatient service activity without workload, or with workload that conflicts with service activity in the category of service recipient, labour-adjusted national cost estimates are calculated for visits and inpatient days. These estimates are multiplied by the service activity volumes of the functional centres without appropriate workload reporting to derive a proportion of inpatient activity to total activity. This proportion is then applied against the total expenses of the functional centre, resulting in Inpatient and Other Patient cost pool allocations.
The functional centres from this list that did not report service activity or workload are deemed to consist of 100% other patient expenses.
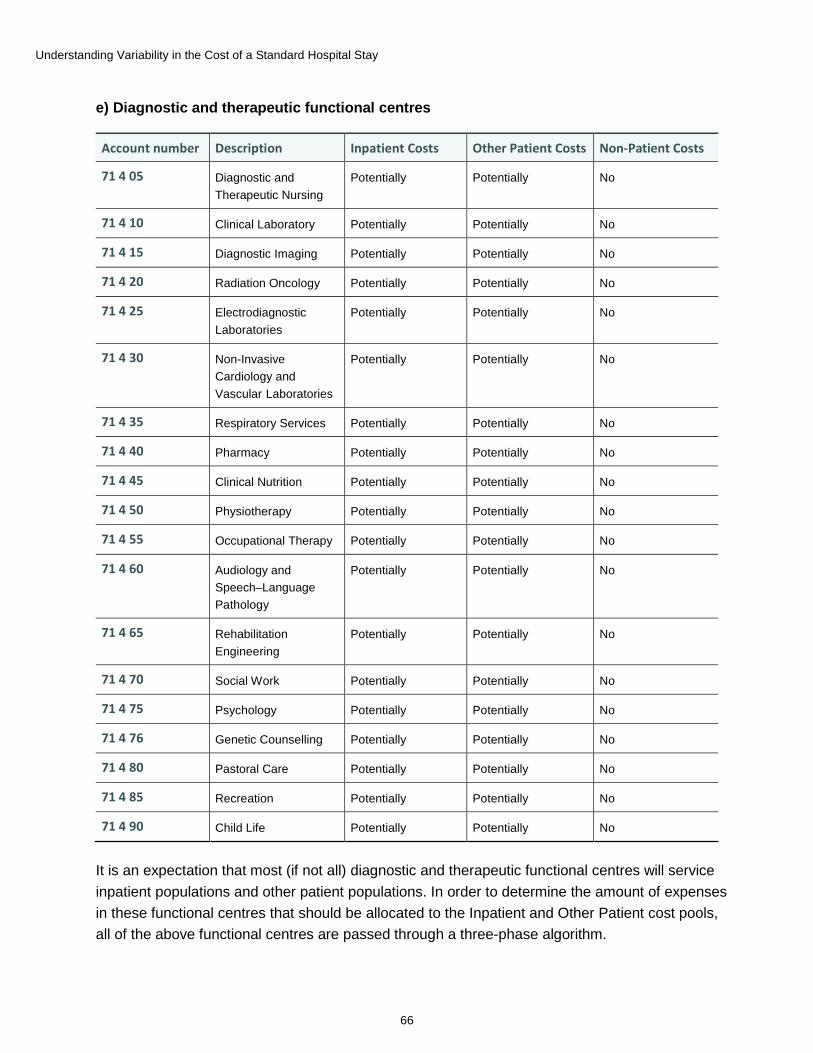
Understanding Variability in the Cost of a Standard Hospital Stay
66
e) Diagnostic and therapeutic functional centres
Account number Description Inpatient Costs Other Patient Costs Non-Patient Costs
71 4 05 Diagnostic and Therapeutic Nursing
Potentially Potentially No
71 4 10 Clinical Laboratory Potentially Potentially No
71 4 15 Diagnostic Imaging Potentially Potentially No
71 4 20 Radiation Oncology Potentially Potentially No
71 4 25 Electrodiagnostic Laboratories
Potentially Potentially No
71 4 30 Non-Invasive Cardiology and Vascular Laboratories
Potentially Potentially No
71 4 35 Respiratory Services Potentially Potentially No
71 4 40 Pharmacy Potentially Potentially No
71 4 45 Clinical Nutrition Potentially Potentially No
71 4 50 Physiotherapy Potentially Potentially No
71 4 55 Occupational Therapy Potentially Potentially No
71 4 60 Audiology and Speech–Language Pathology
Potentially Potentially No
71 4 65 Rehabilitation Engineering
Potentially Potentially No
71 4 70 Social Work Potentially Potentially No
71 4 75 Psychology Potentially Potentially No
71 4 76 Genetic Counselling Potentially Potentially No
71 4 80 Pastoral Care Potentially Potentially No
71 4 85 Recreation Potentially Potentially No
71 4 90 Child Life Potentially Potentially No
It is an expectation that most (if not all) diagnostic and therapeutic functional centres will service inpatient populations and other patient populations. In order to determine the amount of expenses in these functional centres that should be allocated to the Inpatient and Other Patient cost pools, all of the above functional centres are passed through a three-phase algorithm.
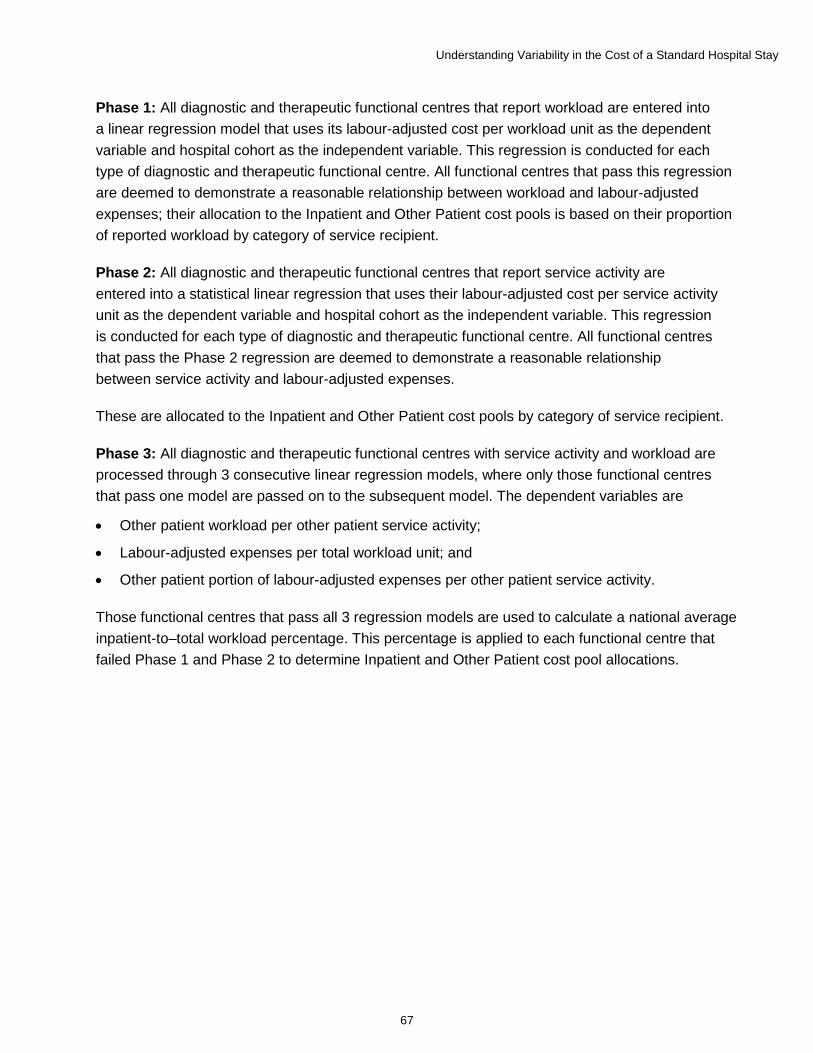
Understanding Variability in the Cost of a Standard Hospital Stay
67
Phase 1: All diagnostic and therapeutic functional centres that report workload are entered into a linear regression model that uses its labour-adjusted cost per workload unit as the dependent variable and hospital cohort as the independent variable. This regression is conducted for each type of diagnostic and therapeutic functional centre. All functional centres that pass this regression are deemed to demonstrate a reasonable relationship between workload and labour-adjusted expenses; their allocation to the Inpatient and Other Patient cost pools is based on their proportion of reported workload by category of service recipient.
Phase 2: All diagnostic and therapeutic functional centres that report service activity are entered into a statistical linear regression that uses their labour-adjusted cost per service activity unit as the dependent variable and hospital cohort as the independent variable. This regression is conducted for each type of diagnostic and therapeutic functional centre. All functional centres that pass the Phase 2 regression are deemed to demonstrate a reasonable relationship between service activity and labour-adjusted expenses.
These are allocated to the Inpatient and Other Patient cost pools by category of service recipient.
Phase 3: All diagnostic and therapeutic functional centres with service activity and workload are processed through 3 consecutive linear regression models, where only those functional centres that pass one model are passed on to the subsequent model. The dependent variables are
• Other patient workload per other patient service activity;
• Labour-adjusted expenses per total workload unit; and
• Other patient portion of labour-adjusted expenses per other patient service activity.
Those functional centres that pass all 3 regression models are used to calculate a national average inpatient-to–total workload percentage. This percentage is applied to each functional centre that failed Phase 1 and Phase 2 to determine Inpatient and Other Patient cost pool allocations.
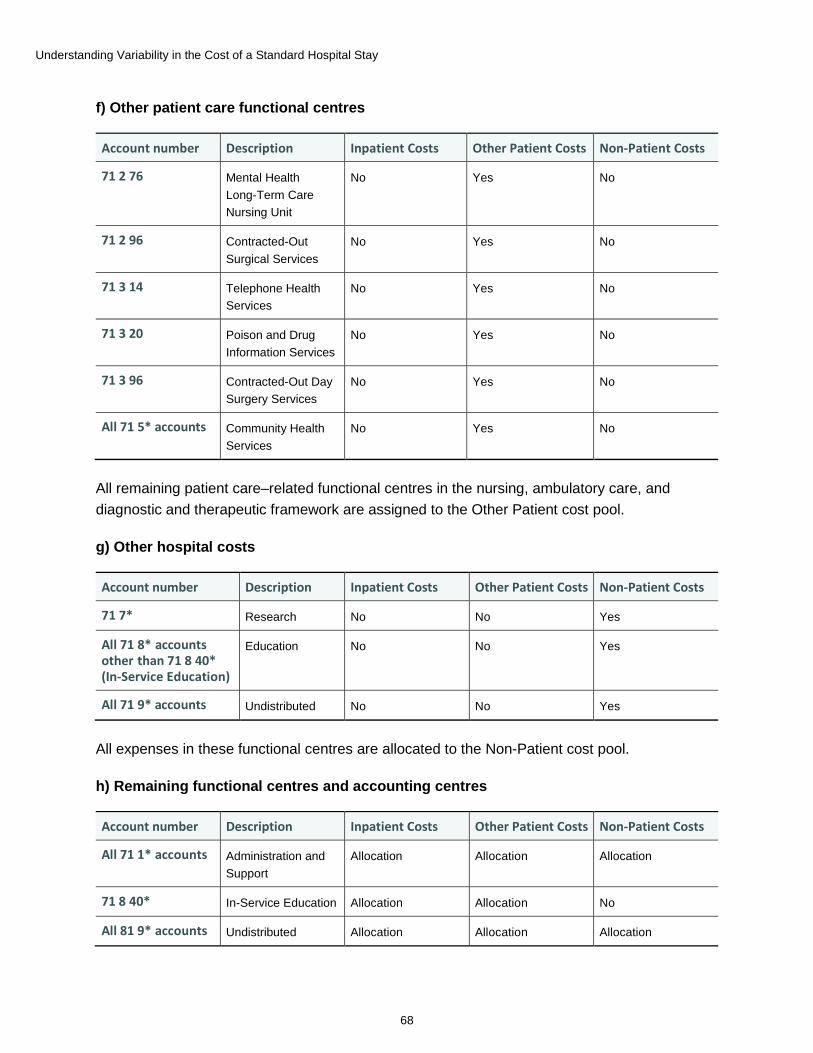
Understanding Variability in the Cost of a Standard Hospital Stay
68
f) Other patient care functional centres
Account number Description Inpatient Costs Other Patient Costs Non-Patient Costs
71 2 76 Mental Health Long-Term Care Nursing Unit
No Yes No
71 2 96 Contracted-Out Surgical Services
No Yes No
71 3 14 Telephone Health Services
No Yes No
71 3 20 Poison and Drug Information Services
No Yes No
71 3 96 Contracted-Out Day Surgery Services
No Yes No
All 71 5* accounts Community Health Services
No Yes No
All remaining patient care–related functional centres in the nursing, ambulatory care, and diagnostic and therapeutic framework are assigned to the Other Patient cost pool.
g) Other hospital costs
Account number Description Inpatient Costs Other Patient Costs Non-Patient Costs
71 7* Research No No Yes
All 71 8* accounts other than 71 8 40* (In-Service Education)
Education No No Yes
All 71 9* accounts Undistributed No No Yes
All expenses in these functional centres are allocated to the Non-Patient cost pool.
h) Remaining functional centres and accounting centres
Account number Description Inpatient Costs Other Patient Costs Non-Patient Costs
All 71 1* accounts Administration and Support
Allocation Allocation Allocation
71 8 40* In-Service Education Allocation Allocation No
All 81 9* accounts Undistributed Allocation Allocation Allocation
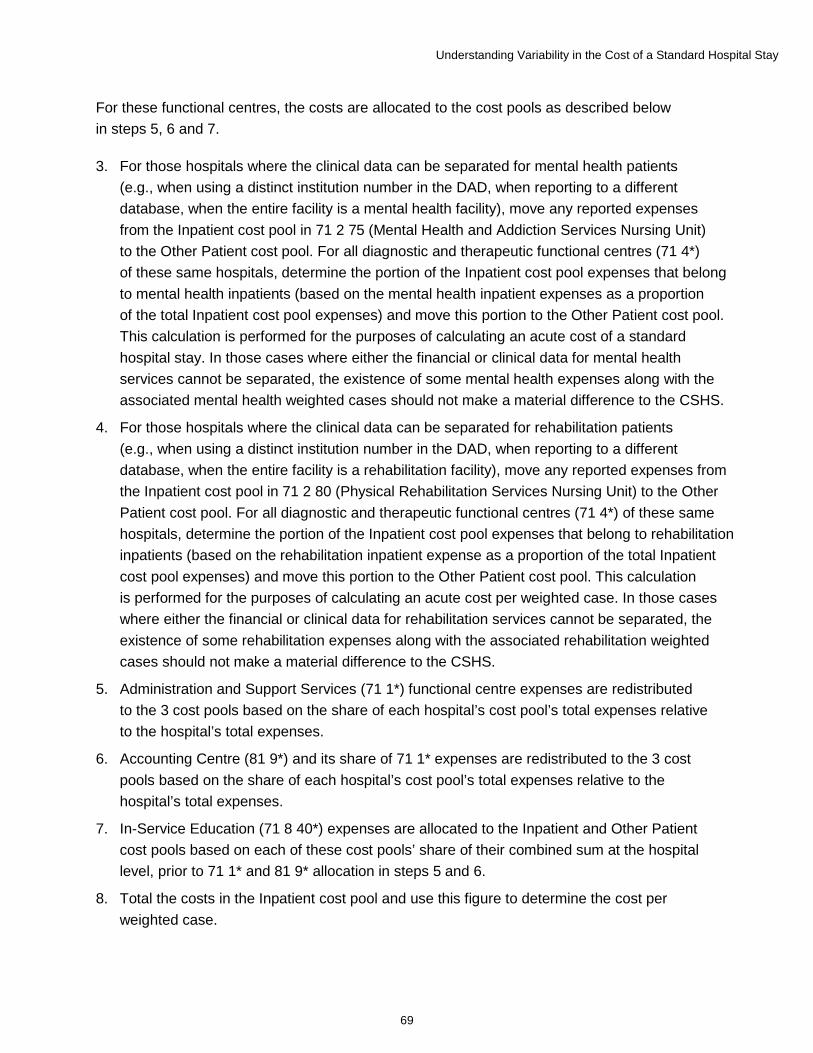
Understanding Variability in the Cost of a Standard Hospital Stay
69
For these functional centres, the costs are allocated to the cost pools as described below in steps 5, 6 and 7.
3. For those hospitals where the clinical data can be separated for mental health patients (e.g., when using a distinct institution number in the DAD, when reporting to a different database, when the entire facility is a mental health facility), move any reported expenses from the Inpatient cost pool in 71 2 75 (Mental Health and Addiction Services Nursing Unit) to the Other Patient cost pool. For all diagnostic and therapeutic functional centres (71 4*) of these same hospitals, determine the portion of the Inpatient cost pool expenses that belong to mental health inpatients (based on the mental health inpatient expenses as a proportion of the total Inpatient cost pool expenses) and move this portion to the Other Patient cost pool. This calculation is performed for the purposes of calculating an acute cost of a standard hospital stay. In those cases where either the financial or clinical data for mental health services cannot be separated, the existence of some mental health expenses along with the associated mental health weighted cases should not make a material difference to the CSHS.
4. For those hospitals where the clinical data can be separated for rehabilitation patients (e.g., when using a distinct institution number in the DAD, when reporting to a different database, when the entire facility is a rehabilitation facility), move any reported expenses from the Inpatient cost pool in 71 2 80 (Physical Rehabilitation Services Nursing Unit) to the Other Patient cost pool. For all diagnostic and therapeutic functional centres (71 4*) of these same hospitals, determine the portion of the Inpatient cost pool expenses that belong to rehabilitation inpatients (based on the rehabilitation inpatient expense as a proportion of the total Inpatient cost pool expenses) and move this portion to the Other Patient cost pool. This calculation is performed for the purposes of calculating an acute cost per weighted case. In those cases where either the financial or clinical data for rehabilitation services cannot be separated, the existence of some rehabilitation expenses along with the associated rehabilitation weighted cases should not make a material difference to the CSHS.
5. Administration and Support Services (71 1*) functional centre expenses are redistributed to the 3 cost pools based on the share of each hospital’s cost pool’s total expenses relative to the hospital’s total expenses.
6. Accounting Centre (81 9*) and its share of 71 1* expenses are redistributed to the 3 cost pools based on the share of each hospital’s cost pool’s total expenses relative to the hospital’s total expenses.
7. In-Service Education (71 8 40*) expenses are allocated to the Inpatient and Other Patient cost pools based on each of these cost pools’ share of their combined sum at the hospital level, prior to 71 1* and 81 9* allocation in steps 5 and 6.
8. Total the costs in the Inpatient cost pool and use this figure to determine the cost per weighted case.
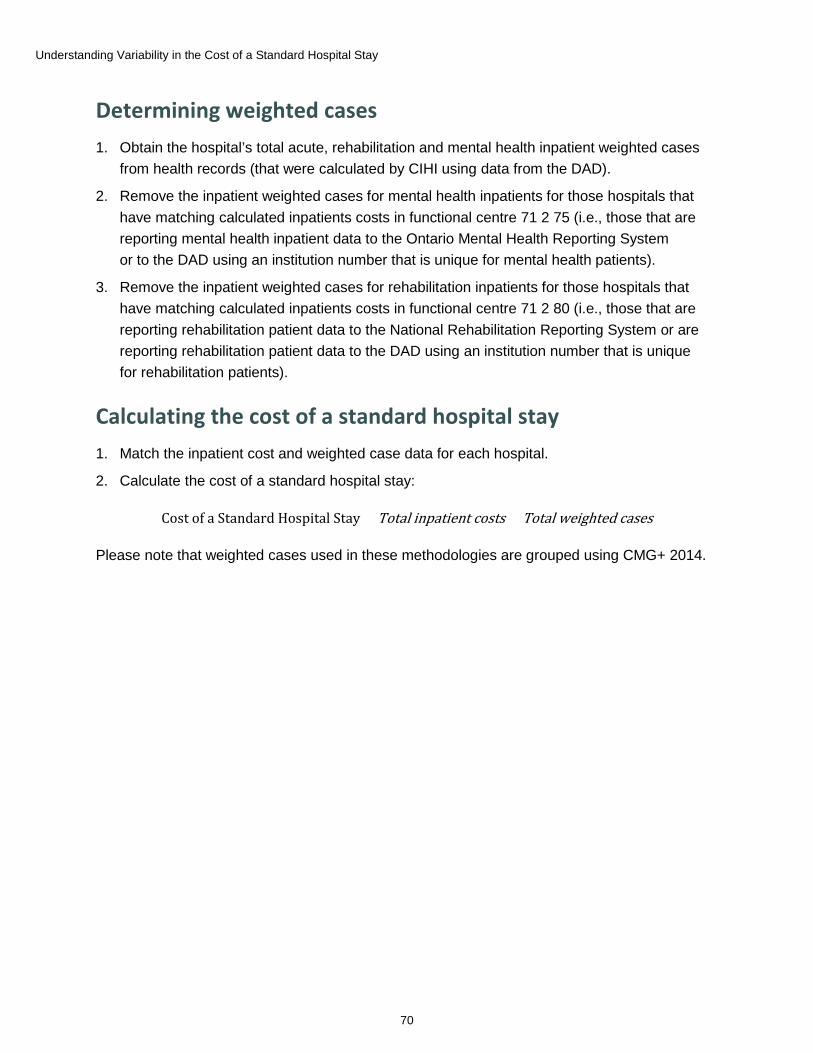
Understanding Variability in the Cost of a Standard Hospital Stay
70
Determining weighted cases 1. Obtain the hospital’s total acute, rehabilitation and mental health inpatient weighted cases
from health records (that were calculated by CIHI using data from the DAD).
2. Remove the inpatient weighted cases for mental health inpatients for those hospitals that have matching calculated inpatients costs in functional centre 71 2 75 (i.e., those that are reporting mental health inpatient data to the Ontario Mental Health Reporting System or to the DAD using an institution number that is unique for mental health patients).
3. Remove the inpatient weighted cases for rehabilitation inpatients for those hospitals that have matching calculated inpatients costs in functional centre 71 2 80 (i.e., those that are reporting rehabilitation patient data to the National Rehabilitation Reporting System or are reporting rehabilitation patient data to the DAD using an institution number that is unique for rehabilitation patients).
Calculating the cost of a standard hospital stay 1. Match the inpatient cost and weighted case data for each hospital.
2. Calculate the cost of a standard hospital stay:
Cost of a Standard Hospital Stay = Total inpatient costs ÷ Total weighted cases
Please note that weighted cases used in these methodologies are grouped using CMG+ 2014.
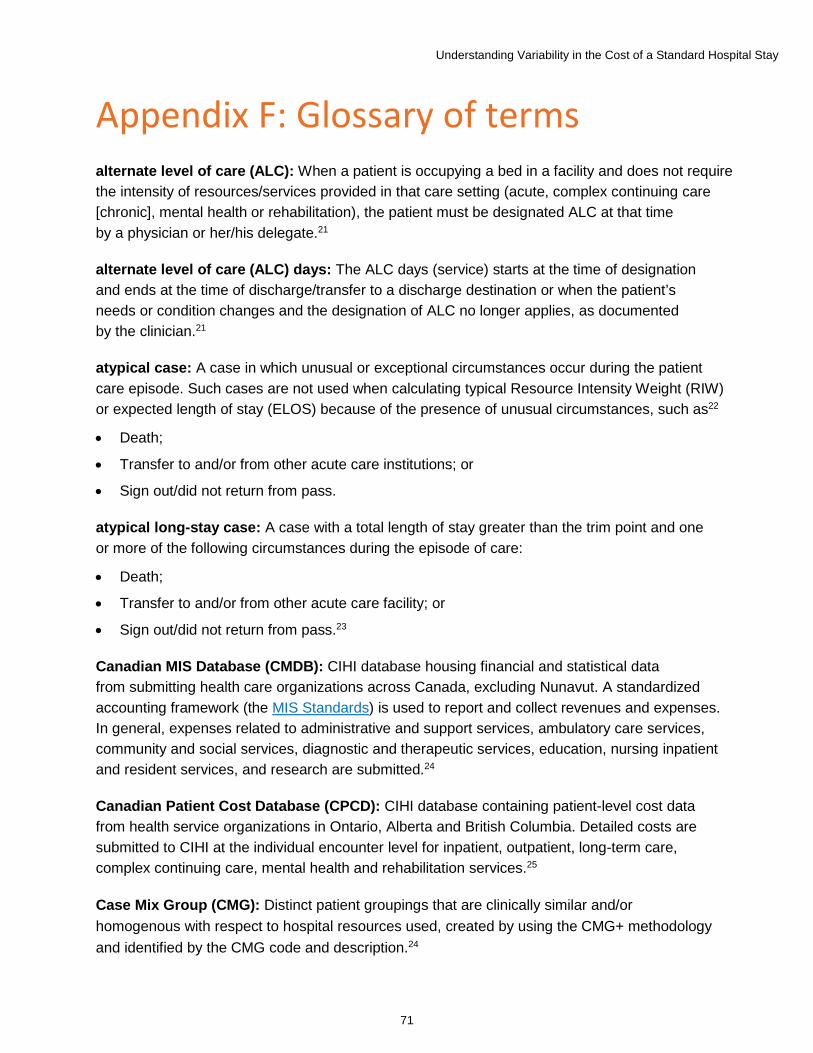
Understanding Variability in the Cost of a Standard Hospital Stay
71
Appendix F: Glossary of terms alternate level of care (ALC): When a patient is occupying a bed in a facility and does not require the intensity of resources/services provided in that care setting (acute, complex continuing care [chronic], mental health or rehabilitation), the patient must be designated ALC at that time by a physician or her/his delegate.21
alternate level of care (ALC) days: The ALC days (service) starts at the time of designation and ends at the time of discharge/transfer to a discharge destination or when the patient’s needs or condition changes and the designation of ALC no longer applies, as documented by the clinician.21
atypical case: A case in which unusual or exceptional circumstances occur during the patient care episode. Such cases are not used when calculating typical Resource Intensity Weight (RIW) or expected length of stay (ELOS) because of the presence of unusual circumstances, such as22
• Death;
• Transfer to and/or from other acute care institutions; or
• Sign out/did not return from pass.
atypical long-stay case: A case with a total length of stay greater than the trim point and one or more of the following circumstances during the episode of care:
• Death;
• Transfer to and/or from other acute care facility; or
• Sign out/did not return from pass.23
Canadian MIS Database (CMDB): CIHI database housing financial and statistical data from submitting health care organizations across Canada, excluding Nunavut. A standardized accounting framework (the MIS Standards) is used to report and collect revenues and expenses. In general, expenses related to administrative and support services, ambulatory care services, community and social services, diagnostic and therapeutic services, education, nursing inpatient and resident services, and research are submitted.24
Canadian Patient Cost Database (CPCD): CIHI database containing patient-level cost data from health service organizations in Ontario, Alberta and British Columbia. Detailed costs are submitted to CIHI at the individual encounter level for inpatient, outpatient, long-term care, complex continuing care, mental health and rehabilitation services.25
Case Mix Group (CMG): Distinct patient groupings that are clinically similar and/or homogenous with respect to hospital resources used, created by using the CMG+ methodology and identified by the CMG code and description.24
Understanding Variability in the Cost of a Standard Hospital Stay
72
Case Mix Group+ (CMG+): A methodology designed to aggregate acute care inpatients with similar clinical and resource utilization characteristics. The CMG+ methodology was introduced in 2007 and was designed to take advantage of the increased clinical specificity of the ICD-10-CA and CCI classifications.xxvii This methodology, developed using multiple years of acute care inpatient activity and cost records, introduces and enhances several grouping factors to improve the ability to clinically group inpatients, and to define length of stay and resource use indicators.26 More information on the CMG+ methodology can be found on CIHI’s website.
Case Mix Index (CMI): A relative measure of predicted resource use. Each Resource Utilization Group (RUG) is associated with a CMI value that provides an indication of the relative average daily resource use for individuals assigned to a particular RUG group, as compared with the entire population.27
clinical efficiency: Differences in cost that stem from differences in the clinical techniques applied.
coefficient of variation (CV): The ratio of the standard deviation to the mean. The CV is unitless and falls between 0 and 1. The greater the CV, the greater the overall observed variation in the population.
Cost of a Standard Hospital Stay (CSHS): An indicator that measures the relative cost-efficiency of a hospital’s ability to provide acute inpatient care. This indicator compares a hospital’s total acute inpatient care expenses with the number of acute inpatient weighted cases related to the inpatients that it provided care for. The result is the hospital’s average full cost of treating the average acute inpatient.28
Please note that the CSHS excludes physician compensation. For a full breakdown of the CSHS methodology, please refer to Appendix E of this report.
cost pools (Inpatient, Other Patient, Non-Patient): The first step in determining the full cost of the CSHS involves making specific adjustments, which are outlined in Appendix D. Once these adjustments have been implemented, all remaining hospital costs must be assigned to 1 of the following 3 cost pools:29
• Inpatient Costs — These are costs incurred through the direct care of hospital inpatients.
• Other Patient Costs — These are costs incurred through the direct care of other hospital patients such as clients.
• Non-Patient Costs — These are costs that are incurred through non–patient care activities.
xxvii. ICD-10-CA: International Statistical Classification of Diseases and Related Health Problems, 10th Revision, Canada.
CCI: Canadian Classification of Health Interventions.
Understanding Variability in the Cost of a Standard Hospital Stay
73
cross-year patient stay: A patient admitted in a given fiscal year (April 1 to March 31) and discharged in a subsequent fiscal year.
direct care functional centre: Functional centres with the primary function of providing direct health care services to patients. These include 71 2 Inpatient Nursing Services, 71 3 Ambulatory Care and 71 4 Diagnostic and Therapeutic Services.
direct expenses: Direct costs include all the expenses for salaries, supplies, equipment, amortization and other outlays seen in the accounts of the functional centre, including direct expense transfers. Direct costs exclude costs of absorbing cost centres that initially resided in the accounts of transient cost centres but have subsequently been allocated as indirect expenses.30
discharge: “The official departure from the health service organization of a live inpatient or resident. Discharge of a newborn is deemed to occur at the time of official release from the health service organization.”31
Discharge Abstract Database (DAD): CIHI database containing demographic, administrative and clinical data on hospital discharges. CIHI receives DAD data directly from participating hospitals. Collected for each fiscal year (April 1 to March 31).24
economies of scale: The concept that a facility’s costs are reduced as the scale of production increases.4
economies of scope: The concept that producing a product or service individually is more expensive than producing multiple products or services.16
exogenous factor: A variable in a model whose value is independent from other variables in the system.
expected length of stay (ELOS): The average acute length of stay in hospital for patients with the same CMG, age category, comorbidity level and intervention factors.32
full expense (total inpatient-related expenses): Full costs are direct costs plus indirect costs. A distinction must be made between the full costs of absorbing cost centres (ACCs) and transient cost centres (TCCs). The full costs of TCCs are an accounting convention used in allocating costs among functional centres. These full costs do not have any meaning outside of this context and should not be considered to be the true cost of operating these TCCs. The full cost of operating a particular ACC is composed of all the direct costs associated with the centre’s operation, plus a proportion of the costs that lie within the accounts of those TCCs that are required for the functioning of the particular ACC and have been allocated to it.30
Understanding Variability in the Cost of a Standard Hospital Stay
74
functional centre: A subdivision of an organization used in a functional accounting system to record the budget and actual direct expenses, statistics and/or revenues, if any, that pertain to the function or activity being carried out.30
health service organization: An organization whose primary function is to provide health services to patients. Includes hospitals, residential care facilities, community health service organizations, social service program organizations and public health organizations.
hospital: Broadly defined as an institution where patients are accommodated on the basis of medical need and are provided with continuing medical care and supporting diagnostic and therapeutic services, and that is licensed or approved as a hospital by a provincial government or is operated by the government of Canada. This definition includes psychiatric hospitals. In provinces and territories where hospitals are part of an RHA, regional data is also submitted to the CMDB, providing a complete picture of health services for that region.
Please note that the hospital data in the CMDB reflects hospitals that report to their provincial ministries of health and does not include hospitals that are administered federally. Federally administered hospitals include military hospitals, hospitals on reserves, hospitals in correctional facilities, etc.
indirect expenses: Indirect costs are those costs that previously were within the accounts of transient cost centres, as their direct costs, but through cost allocation procedures were allocated to functional centres based on their relative resource utilization. Indirect costs are also generally known as overhead costs.30
labour productivity: Labour productivity in a hospital setting relates to output, or patient services, produced by hospital staff members in a given unit of time.33
legal entity: An association, corporation, partnership, proprietorship, trust or individual.
length of stay (LOS): For inpatient abstracts, the calculated difference, in days, between the admission date and the discharge date. If the admission date equals the discharge date (the difference is 0), then the calculated LOS is 1.24
local health integration network (LHIN): “One of 14 not-for-profit corporations established in Ontario by the MOHLTC, each with specific geographic boundaries. Each LHIN is responsible for planning, integrating and funding local health services.”34
long-stay patient: A patient who stays at a hospital longer than the expected length of stay (ELOS). Please see the definitions for ELOS and multi-year patient stay.

Understanding Variability in the Cost of a Standard Hospital Stay
75
MIS patient costing methodology: Specifies allocation and distribution methodologies used to construct a patient cost record within the costing facilities. It provides a standard for comparisons among health service organizations.22
MIS Standards: Standards for Management Information Systems in Canadian Health Service Organizations is the standardized accounting framework used to report and collect financial data, such as revenues and expenses, as well as administrative statistical data, such as earned hours.24
multi-year patient stay: Inpatient stay in hospital greater than 365 days.
non-acute facilities: Non-acute facilities in Canada include but are not limited to long-term care facilities, home care facilities, residential care facilities, and community health service organizations as well as some public health program organizations and social service program organizations.
Patient Cost Estimator (PCE): An interactive tool developed by CIHI to estimate the average cost of various services provided in hospitals. This tool provides information nationally, by jurisdiction and by patient age group. The cost estimates represent the estimated average cost of services provided to the average typical inpatient in an acute care facility. They include the costs incurred by the hospital in providing services and exclude physician fees, since physicians are normally paid directly by the jurisdiction and not by the hospital.24
patient costing: Patient costing, sometimes referred to as case costing or service recipient costing, is a health care–specific term describing an activity-based costing model that tracks and costs service delivery to individual service recipients by service date.
Patient costing is conducted in a variety of health care settings, both hospital and non-hospital, by health service organizations.22
physician compensation: In the MIS Standards, this account is used to record the compensation expense for physicians and personnel who provide medical-type services and who are remunerated by the health service organization on a salary or contractual basis. Examples include pathologists, psychiatrists, radiologists, respirologists, cardiologists, hospitalists, dentists, podiatrists, medical residents, interns and students. Excludes medical personnel who fulfill a management role.30
regional health authority (RHA): A health region or regional health authority is an administrative area whose boundaries are created by provincial ministries of health.18 RHAs are responsible for organizing, governing and managing health services within their jurisdiction.18
relative resource use: A synonym for the term Resource Intensity Weight (RIW). Please refer to the RIW definition.
Understanding Variability in the Cost of a Standard Hospital Stay
76
Resource Intensity Weight (RIW): A relative cost weight value assigned to each patient care episode in the DAD. It reflects the resource intensity of each patient care episode and is adjusted for a number of factors (including age, comorbidity level and selected interventions).
An RIW is not a dollar value; it represents the relative resources (total hospital service cost including fixed and variable components), intensity (the amount of service utilized) and weight of each inpatient case compared with the typical average case, which has a value of 1.0000.24
service activity statistics: The statistics related to unit-producing personnel activities that involve the delivery of services to or on behalf of a specific service recipient. These activities directly contribute to the fulfillment of the service mandate of the functional centre. Examples of service activity statistics include face-to-face visits, face-to-face procedures, face-to-face exams, inpatient days, etc.30
service recipient: The consumer of service activities of one or more functional centres of the health service organization. Service recipients include individuals (e.g., inpatients, residents, clients) and their significant others, and others as defined by the health service organization.30
teaching status (hospital): Teaching hospitals are defined as hospitals with full membership in the Association of Canadian Academic Healthcare Organizations.35
CIHI assigns hospitals to peer groups. Assigning hospitals to peer groups facilitates standardized comparisons by categorizing facilities that have similar structural and patient characteristics. Hospital peer groups were developed based on literature reviews, previous methodologies and consultations with experts in the field. One of these peer groups is teaching status. Hospitals are designated as teaching status in CIHI data if they had confirmed teaching status from the provincial ministry or were identified as teaching in the provincial ministry’s submission to the CMDB.36 For more information please view the CIHI Indicator Library’s Peer Group Methodology.
Please note that jurisdictions outside of Canada define teaching status differently.
third-party providers: Persons or organizations that are contracted by the health service organization to provide services on either a purchased or contracted-out basis. Includes self-employed individuals (e.g., radiologist or cardiologist performing interpretations) and individuals working for another health service organization (e.g., hospital, region, affiliate, provincial laboratory) or a private company (e.g., ABC Food Services, HIJ Nursing Home, XYZ Eye Clinic).30
weighted cases: The sum of Resource Intensity Weights (RIWs) within a specific group of cases or within a hospital, region or jurisdiction. The definition of RIWs is outlined above.
year-over-year variation: The difference in a given hospital’s estimate (e.g., CSHS value) from one year to the next.
Understanding Variability in the Cost of a Standard Hospital Stay
77
Appendix G: Literature review methodology and summary Methodology The purpose of the review was to find literature related to the variability of average hospital stay costs. Based on initial searching and consultation with a researcher in the field, it was found that the literature examining the drivers of variation in the CSHS using case mix–adjusted estimates is limited.37 Only a few jurisdictions have indicators calculating standard hospital stay costs that have been adjusted for case mix. The focus of the search shifted to identify research in the area of hospital cost function or cost per case literature that might yield insight into what factors drive differences in costs between hospitals. Please note that this was a narrative review, not a systematic review of the literature.
Search strategy
The search strategy was designed to identify literature related to variability of estimated average hospital stay costs. Several databases were searched for relevant articles, including the Ovid ejournal database (that includes Econlit, Ovid MEDLINE and PsychINFO), the Health Sciences database, Science Direct and the PubMed database. A general search was conducted using Google Scholar in order to find additional research articles. A snowballing approach was applied wherein the reference lists of relevant articles were searched to find other resources that might be useful.
In order to capture other sources, a grey literature search was conducted. Websites of the following organizations were searched to identify literature produced outside of academic journals: Australian Institute of Health and Welfare (Australia Hospital Statistics), Healthcare Cost and Utilization Project (Agency for Healthcare Research and Quality, U.S. Department of Health and Human Services), Centre for Health Economics (University of York, England), U.K. Statistics Authority (Office for National Statistics, United Kingdom) and Eurostat. Previously released CIHI reports were also reviewed.
In both the academic and grey literature searches, a number of keywords were used to identify relevant literature. The terms used for searching were
• Estimated average cost;
• Cost per weighted case;
• Cost of a standard hospital stay;
• Cost per case;
• Cost per day;
Understanding Variability in the Cost of a Standard Hospital Stay
78
• Cost per episode of care;
• Hospital cost function;
• Cost;
• Hospital;
• Variability; and
• Variance.
Selection criteria
The process for selecting sources started with a database and grey literature scan. Once the literature scanning was complete, a review of the abstracts was conducted. The inclusion and exclusion criteria outlined below were applied when reviewing the abstracts. The most relevant sources were then selected for full review. The sources that were selected were skimmed to verify their appropriateness and were either included or excluded based on the selection criteria. The final set of sources was analyzed and summarized.
Dates for studies were originally set for 2000 to present; however, due to the limited literature examining the drivers of variation in the CSHS using case mix–adjusted estimates, older literature was reviewed. Studies written in either English or French were eligible for review. Literature from Canada and from other developed countries, such as the United States, the United Kingdom, Australia, France and Spain, was considered.
Studies eligible for review had to focus on hospital cost functions, cost per case, or a factor or multiple factors that might influence hospital costs (or cost per case), such as patient characteristics (case mix, age, sex, gender) or hospital characteristics (teaching status, geography, economies of scale, clinical efficiency, price of labour, labour productivity). Studies or reports that described case mix–adjusted cost indicators from other jurisdictions were also eligible for review. The focus was not on the cost of illnesses or conditions. Studies that assessed the variability in hospital costs for certain conditions and studies that examined the impact of diagnosis-related groups on cost variations for certain conditions were considered for review.
Summarizing the literature
The literature was categorized into specific categories to facilitate the analysis. The categories included patient characteristics that drive variation, hospital characteristics that drive variation, hospital cost variation and case mix–adjusted indicators from another jurisdiction. Certain studies contained information pertaining to the first 2 categories (patient and hospital characteristics); those studies were categorized under the more general heading of hospital cost variation. In total, approximately 40 sources of academic and grey literature were reviewed and summarized.
Understanding Variability in the Cost of a Standard Hospital Stay
79
Summary of literature Concepts underlying hospital cost function literature
Hospital cost functions have been studied for a number of decades across many jurisdictions.38–41 The purpose of studying hospital cost functions is to determine which factors drive hospital cost variations in different hospitals.7 Sources of variability can stem from patient characteristics or hospital characteristics. Methodological differences between studies also have the potential to impact results.
The literature examining the drivers of variation in the CSHS using case mix–adjusted estimates is limited.37 Despite the lack of studies assessing the drivers of variations in average hospital costs using case mix–adjusted estimates, the cost function literature yielded insight into which factors other than case mix and patient characteristics may drive hospital costs. These include factors such as size (economies or diseconomies of scale),4–8 geography or remoteness,8, 9, 39 teaching status,5, 9, 10 price of labour,9, 11, 12 labour productivity,13, 33, 42 and quality or clinical efficiency.9, 14–16 The exact impact of these factors on the CSHS in Canada and other jurisdictions remains unclear.
Patient-level characteristics
Case mix, age, sex
Patient- and population-level factors such as CMG,8, 39, 41, 43, 44 and sex43–45 have all consistently been recognized as factors that influence the cost of a hospital stay. Some of the first studies examining hospitals costs did not properly adjust for differences in case mix.7 It is more common now than it was in earlier hospital cost studies to see adjustments for case mix.7, 46 Adjusting for case mix and other patient characteristics allows for other drivers of average hospital costs to be identified. The CSHS adjusts for case mix and patient characteristics through the use of RIWs. Please see Appendix E for more information on the CSHS methodology.
Hospital characteristics
Teaching status
In a number of jurisdictions, teaching status has been identified as a factor that influences the cost of a hospital stay after adjusting for CMG.5, 9, 10 The influence of teaching status on hospital costs differs from study to study,47 with some studies even finding a smaller effect.45, 47 The influence of teaching status on hospital costs has been identified in a Canadian context. In a 2001 report from the Manitoba Centre for Health Policy (MCHP), the results indicated that teaching status had an impact on average hospital costs in Manitoba, even after adjustments had been made for the severity and complexity of the patients served.9
Understanding Variability in the Cost of a Standard Hospital Stay
80
Several factors may contribute to higher standard case costs for teaching hospitals. Higher usage of diagnostic and therapeutic services in teaching hospitals compared with other facilities has been identified as a contributing factor.9, 47 In the case of Manitoba, indirect expenses stemming from education practices that had not been properly removed from the financial data were flagged as a factor that could have increased teaching costs.48
Economies/diseconomies of scale and scope
The relationship between hospital size and hospital costs has been explored, specifically whether or not acute care hospitals display economies of scale. The concept of economies of scale refers to when the average cost of producing or providing a good or service decreases as the scale of operations increases.7, 46 A number of theoretical assumptions underlie economies of scale within a hospital setting, such as that a larger workforce can allow for an increase in specialization of skills and that cost savings might occur as a result of a larger hospital’s ability to buy greater quantities of products.16, 46
Diseconomies of scale can occur due to a number of factors. For example, the amount of resources the hospital needs to properly operate may not align with changes to hospital capacity.7 Larger hospitals might also have higher overhead and bureaucratic costs that could contribute to diseconomies of scale.16 The majority of studies, using a variety of statistical techniques and from different jurisdictions, indicate that larger hospitals do not have economies of scale and that economies of scale tend to be exhausted at somewhere between 100 and 300 beds.4, 8
The concept of economies of scope differs slightly from that of economies of scale. It refers to the process of producing or providing more than one product or service more cheaply than the process of producing or providing each product or service on its own.16 In a hospital setting, this concept relates to services provided. Providing a variety — or scope — of services could potentially lower costs compared with providing fewer services.46, 49 The presence of economies of scope in hospitals has yet to be confirmed in average hospitals.4
Results from the literature would suggest that larger hospitals are not necessarily more efficient than smaller hospitals.4 Properly assessing economies of scale and scope in hospitals is complex, and numerous limitations exist. All relevant factors need to be controlled for in order to properly get a reliable estimate for an economy of scale in a hospital.4 Making some of these adjustments has been flagged as a difficult task.4 Therefore, it is recommended that users interpret results regarding economies of scale and scope with some caution due to the methodological challenges and the inconsistency of some results.4
Understanding Variability in the Cost of a Standard Hospital Stay
81
Quality/clinical efficiency
Average costs may differ between hospitals due to differences in quality of care. The relationship between quality and health care costs is complex. A positive or mixed-positive relationship between quality and health care costs exists when increased spending is mostly associated with higher-quality care.15 A negative or mixed-negative relationship exists where higher costs are largely associated with lower-quality care. In some instances, there may be no association between the 2 factors.15 Action or lack of action taken to improve quality can have a variety of impacts on health care or hospital costs. Quality improvement initiatives can lead to increased costs; however, those initiatives could also lead to cost savings, such as by reducing adverse events.50 Low-quality care leading to an adverse event could heighten the CSHS. An adverse event can increase the length of stay or could result in a patient requiring new medications.50 One report from the MCHP noted that inefficiencies and different treatment methods could influence the cost of an average hospital stay.9
The direction of association between cost and quality of health care remains unclear.15, 16 A recent systematic review assessing studies on cost and quality in health care from the United States found inconsistencies in the results.15 A number of studies highlighted positive relationships between cost and quality, others found negative relationships and a number found no significant association between costs of health care and quality.15 The authors of the systematic review noted the challenges associated with assessing this literature related to the heterogeneity in methods and measures used to capture quality and cost. As a result, it is recommended that users interpret the results of cost of health care and quality studies with caution.15
Geography
The geography of a hospital has been shown to have an impact on hospital costs.8, 9, 39 Physical location can influence hospital costs. An MCHP study found that the highest costs per weighted case in Manitoba were among northern isolated facilities, small multi-use facilities and teaching hospitals, compared with the provincial and hospital average.9 The authors noted that higher costs in northern isolated hospitals may be due to accounting practices, the flexible capacity of the facilities, higher vacancy rates, and the fact that these facilities provide a large amount of ambulatory care services and that the costs of some of these services may be reported as inpatient costs.9
There may be geographic variation in input costs outside of a hospital’s control due to its location.16 Prices of inputs such as cost of labour, land or rent costs, capital costs relating to equipment and goods, and the costs of servicing capital assets are all factors that can differ between hospitals in different locations. For example, rural hospitals may have higher transportation costs.16 The exact influence of geographic location or remoteness remains unclear and requires further analysis.
Understanding Variability in the Cost of a Standard Hospital Stay
82
Price of labour
The price of labour has been identified as a driver of overall hospital costs in Canada and other jurisdictions. Expenditures relating to price increases and real resources allocated to the Canadian hospital sector have contributed to the rising costs in hospitals in recent years.14 Excluding physicians, employee compensation accounted for approximately 60% of total hospital expenditure in Canadian hospitals in 2008–2009.14 Expenditure for compensation increased significantly from 1999 to 2008. The index of growth for hospital employees was consistently higher than other indices of growth in Canada from 1999 to 2008.14 Hospital supplies, including contracted external labour, was the second-highest expenditure category in 2008–2009.14
Certain other factors have been flagged as having the potential to increase Canadian hospital expenditures, such as recruitment of professionals with higher average wages (e.g., diagnostic or therapeutic professionals); an increased reinvestment in hospital services in the early 2000s, which may have contributed to demands for more staff over time; and contracting out support services such as housekeeping or food services, which could lead to an increase in average wages if the jobs that had been contracted out were among those with relatively lower wages in terms of hospital salaries.14 Input costs such as price of labour were flagged as a potential driver of the CSHS in Manitoba.9 The exact impact of the price of labour on costs of a standard hospital stay in Canada has not been determined.
A study from the American Hospital Association highlighted that increasing labour costs was the most important factor leading to increases in hospital costs between 2006 and 2010 in the United States.xxviii, 11 These increasing costs accounted for approximately 35% of the overall growth in costs and about half or more of the costs for goods and services.11 The largest area of hospital spending for National Health Service (NHS) providers in England is related to employee compensation. It accounted for approximately two-thirds of NHS providers’ total expenditure in 2013–2014.xxix, 12 Compensation for permanent employees had stayed relatively consistent compared with the previous year, but compensation for temporary employees in acute care hospitals appeared to be increasing.12
xxviii. The AHA 2012 study includes physicians in the costs estimations, whereas CIHI isolates the cost of physicians. xxix. Staff spending includes temporary and permanent workers. Physicians and dentists who work within the hospital are
included in these numbers.
Labour productivity
Labour productivity in a hospital setting relates to output, or patient services, produced by hospital staff members.33 A productive workforce can contribute to lower costs and improved efficiency. Labour productivity in the Canadian hospital sector is thought to have increased by 2.6% per year in Canada between 2002 and 2010, based on a direct output measure.42 3 factors are thought to have contributed to the growth in labour productivity in the hospital sector in Canada: increases in capital per worker (often referred to as capital deepening), intermediate input deepening (such as spending on drugs) and the efficiency with which resources are used to produce patient services.42
Understanding Variability in the Cost of a Standard Hospital Stay
83
The CIHI indicator Worked Hours per Weighted Case provided insight into the distribution of hospital resources within different hospital departments based on weighted cases. The indicator is calculated by dividing the number of worked hours (unit-producing personnel worked and purchased hours) from the CMDB by the total inpatient weighted cases from the DAD. From 2008 to 2012, nursing hours consistently accounted for the largest proportion of worked hours per weighted case, compared with other hospital departments.51 The weighted average for inpatient nursing services for all provinces and territories ranged from 49.99 in 2008 to 49.45 in 2012.51 Clinical laboratory services, pharmacy services and diagnostic services accounted for a much smaller amount of the worked hours per weighted case from 2008 to 2012.51 This has been consistent over time. Analysis examining the Worked Hours per Weighted Case indicator from 2002–2003 showed similar results as those found in the 2008 to 2012 analysis.13
Understanding Variability in the Cost of a Standard Hospital Stay
84
Appendix H: Abbreviations ALC: alternate level of care
CIHI: Canadian Institute for Health Information
CMDB: Canadian MIS Database
CMG: Case Mix Group
CMG+: Case Mix Group+
CMI: Case Mix Index
CPCD: Canadian Patient Cost Database
CSHS: Cost of a Standard Hospital Stay
CV: coefficient of variation
DAD: Discharge Abstract Database
EAG: Expert Advisory Group
ELOS: expected length of stay
FHA: Fraser Health Authority
GLM: generalized linear model
LHIN: local health integration network
LMC: Lower Mainland Consolidation Project
LOS: length of stay
MOHLTC: Ontario Ministry of Health and Long-Term Care
OR: operating room
PARR: post-anesthetic recovery room
PCE: Patient Cost Estimator

Understanding Variability in the Cost of a Standard Hospital Stay
85
PHC: Providence Health Care
PHSA: Provincial Health Services Authority
RHA: regional health authority
RIW: Resource Intensity Weight
RUG: Resource Utilization Group
VCH: Vancouver Coastal Health
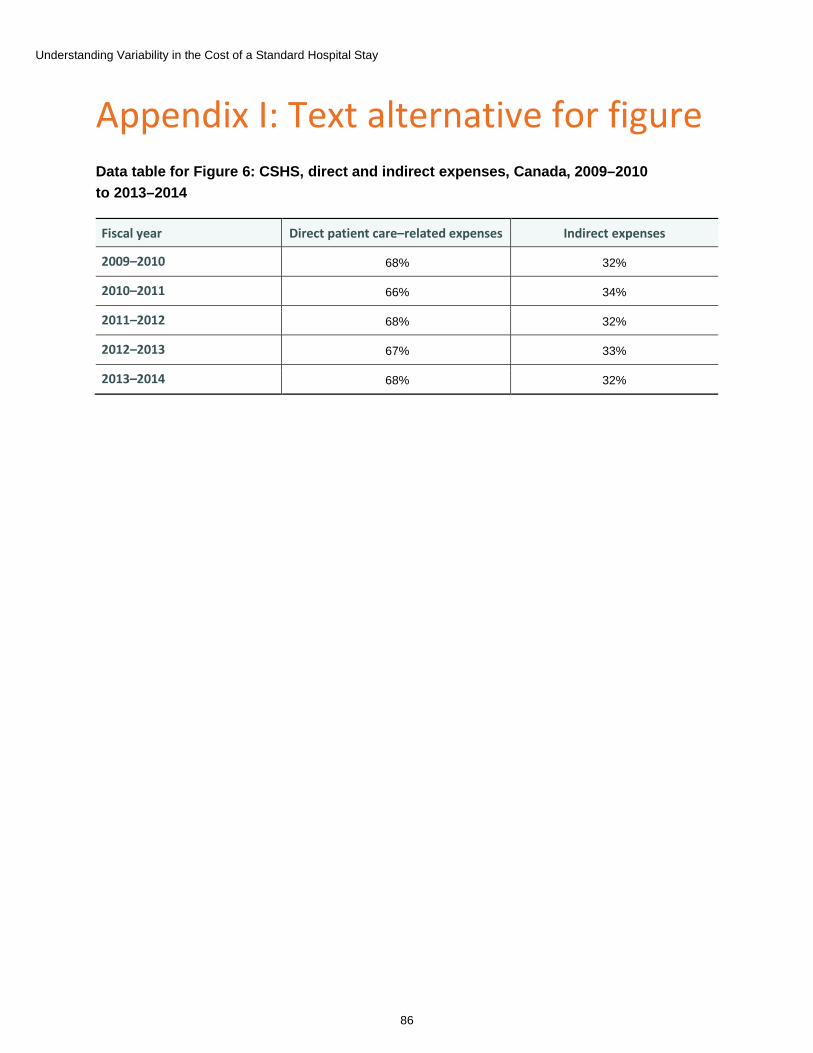
Understanding Variability in the Cost of a Standard Hospital Stay
86
Appendix I: Text alternative for figure Data table for Figure 6: CSHS, direct and indirect expenses, Canada, 2009–2010 to 2013–2014
Fiscal year Direct patient care–related expenses Indirect expenses
2009–2010 68% 32%
2010–2011 66% 34%
2011–2012 68% 32%
2012–2013 67% 33%
2013–2014 68% 32%

Understanding Variability in the Cost of a Standard Hospital Stay
87
References 1. Canadian Institute for Health Information. National Health Expenditure Trends, 1975
to 2015. 2015.
2. Häkkinen U, Joumard I. Cross-Country Analysis of Efficiency in OECD Health Care Sectors: Options for Research. 2007.
3. Canadian Institute for Health Information. Enhancing Pan-Canadian Health System Performance Reporting at CIHI. 2013.
4. Aletras V. Concentration and Choice in the Provision of Hospital Services. Part II: The Relationship Between Volume and the Scope of Activity and Hospital Costs. 1997.
5. Farsi M, Filippini M. Effects of ownership, subsidization and teaching activities on hospital costs in Switzerland. Health Economics. 2008.
6. Kristensen T, Olsen KR, Kilsmark J, Pederson KM. Economies of Scale and Optimal Size of Hospitals: Empirical Results for Danish Public Hospitals. 2008.
7. Posnett J. Chapter 6: Are bigger hospitals better?. In: McKee M, Healy J, eds. Hospitals in a Changing Europe. 2002.
8. Weidmann B, Duckett S. Technical Appendix to Controlling Costly Care: Quantifying Variation in Australian Acute-Care Costs. 2014.
9. Finlayson G, Roos N, Jacobs P, Watson D. Using the Manitoba Hospital Management Information System: Comparing Average Cost per Weighted Case and Financial Ratios of Manitoba Hospitals (1997/98) — The Next Step. 2001.
10. López-Casasnovas G, Saez M. The impact of teaching status on average hospital costs in Spanish hospitals. Health Economics. 1999.
11. American Hospital Association. The Cost of Caring. 2012.
12. Lafond S, Charlesworth A, Roberts A. Hospital Finances and Productivity: In a Critical Condition?. 2015.
13. Canadian Institute for Health Information. Hospital Financial Performance Indicators, 1999–2000 to 2002–2003. 2005.
14. Canadian Institute for Health Information. Hospital Cost Drivers Technical Report: What Factors Have Determined Hospital Expenditure Trends in Canada?. 2012.
15. Hussey PS, Wertheimer S, Mehrotra A. The association between health care quality and cost: A systematic review. Annals of Internal Medicine. 2013.
16. Street A, Scheller-Kreinsen D, Geissler A, Busse R. Determinants of Hospital Costs and Performance Variation: Methods, Models and Variables for the EuroDRG Project. 2010.
17. Ontario Local Health Integration Network. Ontario’s LHINs. Accessed March 16, 2017.
Understanding Variability in the Cost of a Standard Hospital Stay
88
18. Statistics Canada. Health profile — What are health regions?. Accessed August 18, 2016.
19. Vancouver Coastal Health. About us. Accessed March 16, 2017.
20. Accenture Inc. British Columbia Ministry of Health Services: Lower Mainland Consolidation Project — Due Diligence Assessment. 2010.
21. Canadian Institute for Health Information. DAD Abstracting Manual, 2016–2017. 2016.
22. Canadian Institute for Health Information. Case Mix Glossary of Terms. No date.
23. Canadian Institute for Health Information. DAD Resource Intensity Weights and Expected Length of Stay (ELOS). 2016.
24. Canadian Institute for Health Information. Patient Cost Estimator: Methodological Notes and Glossary. 2016.
25. Canadian Institute for Health Information. Canadian Patient Cost Database. Accessed March 16, 2017.
26. Canadian Institute for Health Information. CMG+. Accessed March 16, 2017.
27. Canadian Institute for Health Information. Continuing Care Reporting System: Case Mix Resource Utilization Groups version 3 and RUG Weighted Patient Days — Resource Materials and FAQ, 2014–2015. 2014.
28. Canadian Institute for Health Information. Cost of a Standard Hospital Stay. Accessed March 16, 2017.
29. Canadian Institute for Health Information. Cost of a Standard Hospital Stay: Appendices to Indicator Library. 2016.
30. Canadian Institute for Health Information. MIS Standards. Accessed March 16, 2017.
31. Statistics Canada, Health and Welfare Canada. Annual Return of Health Care Facilities: Hospitals — Part One. 1976.
32. Canadian Institute for Health Information. Case mix. Accessed March 16, 2017.
33. National Audit Office. Management of NHS Hospital Productivity. 2010.
34. Ontario Stroke Network. LHIN. Accessed March 16, 2017.
35. Canadian Institute for Health Information. Peer groups in the electronic Discharge Abstract Database Reports. Accessed March 16, 2017.
36. Canadian Institute for Health Information. Indicator Library: Peer Group Methodology. 2016.
37. Finlayson G. Personal communication. 2015.
38. Bilodeau D, Crémieux P-Y, Ouellette P. Hospital cost function in a non-market health care system. The Review of Economics and Statistics. 2000.
39. Feldstein MS, Schuttinga J. Hospital costs in Massachusetts: A methodological study. Inquiry. 1977.

Understanding Variability in the Cost of a Standard Hospital Stay
89
40. Lave JR, Lave LB, Silverman LP. Hospital cost estimation controlling for case-mix. Applied Economics. 1972.
41. Schumacher DN, Horn SD, Solnick MF, Atkinson G, Cook J. Hospital cost per case: Analyses using a statewide data system. Medical Care. 1979.
42. Gu W, Morin S. Experimental Measures of Output and Productivity in the Canadian Hospital Sector, 2002 to 2010. 2014.
43. Gaughan J, Mason A, Street A, Ward P. English Hospitals Can Improve Their Use of Resources: An Analysis of Costs and Length of Stay for Ten Treatments. 2012.
44. Kristensen T, Laudicella M, Ejersted C, Street A. Cost variation in diabetes care delivered in English hospitals. Diabetic Medicine. 2010.
45. Dormont B, Milcent C. The sources of hospital cost variability. Health Economics. 2004.
46. Aletras V, Jones A, Sheldon TA. Economies of scale and scope. In: Ferguson B, Sheldon T, Posnett J, eds. Concentration and Choice in Healthcare. 1997.
47. Butler JR. Hospital Cost Analysis. 1995.
48. Finlayson G, Watson D, Jacobs P. The relative cost of inpatient care in Manitoba’s largest hospitals. Healthcare Management Forum. 2002.
49. Panzar JC, Willig RD. Economies of scope. American Economic Review. 1981.
50. Carey K, Stefos T. Controlling for quality in the hosptial cost function. Health Care Management Science. 2011.
51. Canadian Institute for Health Information. Canadian MIS Database: Hospital Financial Performance Indicators, 2008–2009 to 2012–2013. 2014.

[email protected] Ottawa495 Richmond Road
Suite 600
Ottawa, Ont.
K2A 4H6
613-241-7860
CIHI Toronto 4110 Yonge Street
Suite 300
Toronto, Ont.
M2P 2B7
416-481-2002
CIHI Victoria 880 Douglas Street
Suite 600
Victoria, B.C.
V8W 2B7
250-220-4100
CIHI Montréal 1010 Sherbrooke Street West
Suite 602
Montréal, Que.
H3A 2R7
514-842-2226
cihi.ca14973-0517