Embed Size (px)
Citation preview
1
WITHDRAWAL FROM NAFTAWOULD ERODE
U.S. MANUFACTURING
COMPETITIVENESS
EXECUTIVE SUMMARY
By modernizing the North American Free Trade
Agreement (NAFTA), President Trump can help the
U.S. capitalize on the chemical industry’s strong
competitive advantage created by domestic shale gas;
boost U.S. chemical exports to Canada and Mexico by
34 percent by 2025; and support the chemical
industry’s positive contribution to the U.S. trade
balance. A U.S. withdrawal from the trade pact would
have virtually the opposite effect, creating a tariff
burden of up to $9 billion on U.S. chemical exports to
Canada and Mexico, translating into higher prices for
manufacturers and consumers and likely forcing the
industry’s two largest trading partners to turn to
lower-cost imports from China to satisfy their demand
for chemicals and plastics.
NAFTA has fostered regional integration across
North American businesses which increases efficiencies
and productivity. Companies can take advantage of
vertical specialization and economies of scale in
production, without the restriction of border tariffs. In
particular, NAFTA has been instrumental to the growth
and job creation of the U.S. chemical sector. U.S.
chemical exports to Canada and Mexico will have grown
from $13 billion in 1994 to $44 billion in 2018. They are
projected to reach $59 billion by 2025. Importantly,
46,000 chemical industry jobs now depend on chemicals
trade with Canada and Mexico.
In 2016, the chemical industry saved approximately
$700 million in tariff relief on exports to Canada and
Mexico, and $800 million in tariff relief on imports. The
cost savings have helped drive economic growth
throughout the manufacturing supply chain and lowered
prices for manufacturers and consumers.
In addition, American shale gas has created a
competitive advantage for U.S. chemical manufacturers.
The low-cost feedstocks, together with tariff relief
provided by NAFTA, have helped position the U.S. as a
leading global supplier of chemicals. For example,
exports of chemicals and plastics derived from shale will
reach $30 billion by 2025, $13 billion of which will be
destined for Canada and Mexico.
Abandoning NAFTA or making changes that
undermine the certainty of NAFTA would raise prices,
destroy demand for U.S. exports and cause job losses.
Specifically, the introduction of tariffs into the North
American supply chain would increase production costs
and disrupt regional integration, causing U.S. goods and
exports to become more expensive and U.S. firms to lose
their competitive advantage. In a worst-case scenario,
Canada and Mexico could impose extremely high,
retaliatory tariff rates, causing the costs to trade within
North America to rise substantially. Without NAFTA, U.S.
chemicals exports to NAFTA partners could drop by as
much as $22 billion, or 45 percent of the current export
total, creating a total lost chemistry demand of $29
billion when contractions in end-use industries such as
automotive, electronics, and appliances are combined
with direct losses to chemistry exports.
Manufacturers in the U.S. have sustained a
competitive position in the global marketplace by
extending their supply chains regionally. Without
NAFTA, tariffs would be levied on manufacturing
components, some of which may cross the border as
many as seven or eight times before a final product is
complete. Trade and tariff costs would accumulate.
Increasing the costs to do business in the U.S. will
invite lower-cost competitors to enter, or increase their
presence in, the U.S. market. China is poised to take
advantage of this opportunity, since higher-cost U.S.
goods would make lower-cost Chinese goods more
attractive to customers in the U.S. and around the
world. With Chinese goods more competitively priced,
the U.S. trade deficit with China would deepen due to
an acceleration in U.S. imports and a drop in U.S.
exports to the country.
ACC ECONOMICS AND STATISTICS
February 2018
2
FULL REPORT
North American Manufacturing Competitiveness
Since NAFTA entered into force in 1994, the
economies of North American countries have become
increasingly integrated as efficient supply chains
developed across the region. The Agreement has
helped minimize production costs in the U.S.,
enabling regional economies of scale that make
efficient production possible. As a result,
manufacturers in the U.S. have been able to maintain a
competitive position in the global marketplace.
Anchored in the U.S., North America has become
one of the world’s major manufacturing hubs, along with
Europe and China. While the North American hub is
driven by the U.S. economy, Canadian and Mexican
economies contribute essential complements—raw
materials, components and labor—to the strong
manufacturing base in the U.S.
The vast amount of intra-regional trade is a
reflection of long supply chains and the specialization
that occurs at each stage of production, and the
locations that are most advantaged with the resources
required at each stage. Goods manufactured in the U.S.
are often created in stages with value added along the
way. Cross-border trade is part of regional production-
sharing, thus many U.S. imports are embedded with U.S.
value added. Traditional measures of trade like total
exports, total imports, or the trade deficit (or surplus),
do not sufficiently reflect the extent to which Canadian
and Mexican imports are used as inputs to U.S.
manufacturing, or how imports often include U.S. value-
added.
The U.S. automotive industry is one of many
industries whose competitive position benefits from
cross-border trade and production-sharing (also referred
to as “vertical specialization”). Automobile parts and
components may cross the U.S. border multiple times
during the production of a car. According to the
Woodrow Wilson International Center for Scholars, cars
produced in North America “cross the United States’
borders eight times during production, integrating
materials and parts developed in Mexico and Canada.”
Vertical specialization among North American
partners allows for the manufacture of goods that are
higher quality and more competitively priced in both
domestic and global markets. Minimizing the tariff (and
non-tariff) barriers to trade helps North American
producers create goods together, which keeps U.S.
manufacturing competitive.
Manufacturers in Europe and China employ similar
vertical specialization strategies in order to minimize
costs and make production more efficient. However,
China’s low labor costs, and access to even lower wage
labor in neighboring countries, have proved a
comparative advantage in manufacturing. Furthermore,
Chinese producers are investing in extending the China-
centered production supply chains to exploit the
comparative advantages that their neighbors provide.
Today, China has already surpassed the U.S. as the
world’s largest manufacturer.
A significant portion of goods produced in the U.S.
are a product of the North American supply chain, which
incorporates raw materials and components from Mexico
and Canada. U.S. export competitiveness depends on
that regional base and economies of scale that are vital
to competing with China’s very low cost. Withdrawing
from NAFTA would reduce the competitiveness of U.S.
businesses, as both domestic and foreign firms would be
incentivized to find substitutes to U.S. and North
American produced goods. Chinese producers are
already well-positioned as top trade partners with North
American firms and consumers and could readily step in
as “the next best” or “alternative” suppliers if North
American supply chains and trade become more
expensive.
Productivity, Production, and Labor Costs
Labor costs are a major component of total
production costs. In manufacturing, labor costs are
significantly impacted by the labor intensity level and
the worker skill level required at each stage of
production. Some stages of production are more labor-
intensive than others. Thus, production costs can be
minimized by locating labor-intensive stages of
production in lower labor-cost locales.
In addition to intensity, labor costs reflect the
worker skill level (low, middle, high) required. In the
U.S., there is a relatively abundant supply of higher
skilled labor whereas the supply of less skilled labor is
more plentiful in countries such as Mexico and China.
Thus, the U.S. has a comparative advantage in higher
skilled labor but is disadvantaged regarding less skilled
labor.
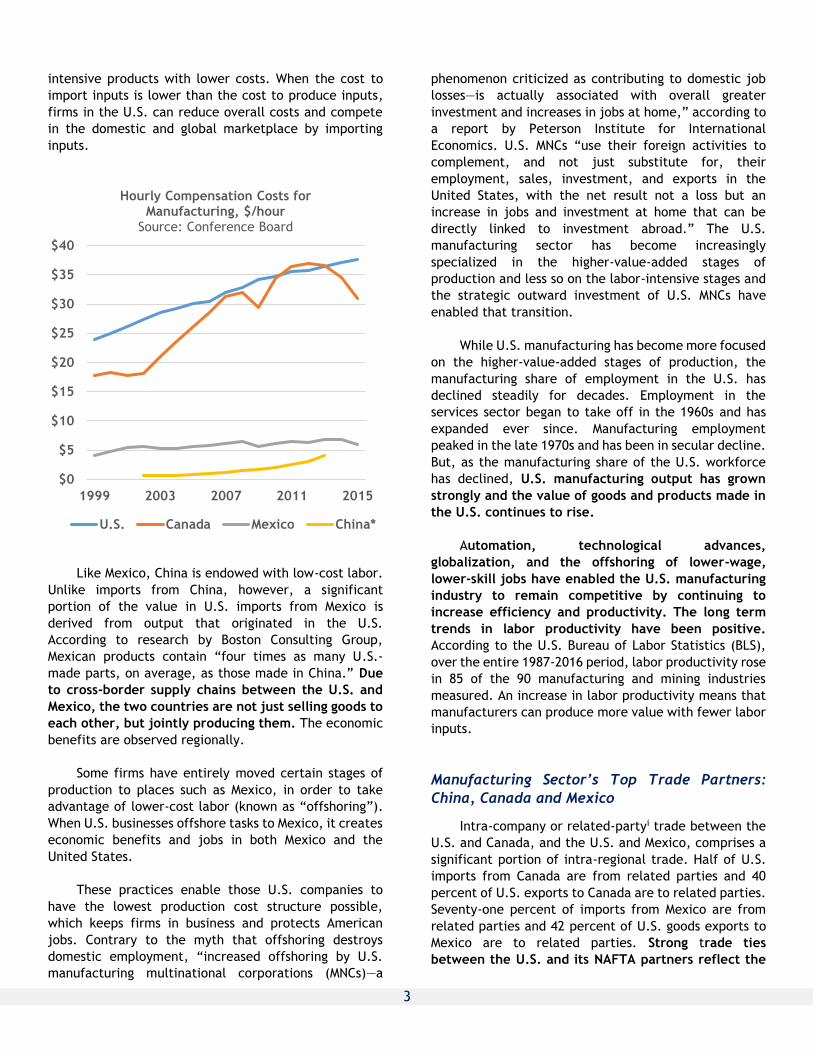
Wages and productivity are positively correlated
with skill level. A comparison of hourly compensation
rates for manufacturing workers across North America
shows how wages in Mexico, where there is plentiful
lower skilled labor, are significantly lower than they are
in the U.S. As such, firms in Mexico can produce labor-
3
intensive products with lower costs. When the cost to
import inputs is lower than the cost to produce inputs,
firms in the U.S. can reduce overall costs and compete
in the domestic and global marketplace by importing
inputs.
Like Mexico, China is endowed with low-cost labor.
Unlike imports from China, however, a significant
portion of the value in U.S. imports from Mexico is
derived from output that originated in the U.S.
According to research by Boston Consulting Group,
Mexican products contain “four times as many U.S.-
made parts, on average, as those made in China.” Due
to cross-border supply chains between the U.S. and
Mexico, the two countries are not just selling goods to
each other, but jointly producing them. The economic
benefits are observed regionally.
Some firms have entirely moved certain stages of
production to places such as Mexico, in order to take
advantage of lower-cost labor (known as “offshoring”).
When U.S. businesses offshore tasks to Mexico, it creates
economic benefits and jobs in both Mexico and the
United States.
These practices enable those U.S. companies to
have the lowest production cost structure possible,
which keeps firms in business and protects American
jobs. Contrary to the myth that offshoring destroys
domestic employment, “increased offshoring by U.S.
manufacturing multinational corporations (MNCs)—a
phenomenon criticized as contributing to domestic job
losses—is actually associated with overall greater
investment and increases in jobs at home,” according to
a report by Peterson Institute for International
Economics. U.S. MNCs “use their foreign activities to
complement, and not just substitute for, their
employment, sales, investment, and exports in the
United States, with the net result not a loss but an
increase in jobs and investment at home that can be
directly linked to investment abroad.” The U.S.
manufacturing sector has become increasingly
specialized in the higher-value-added stages of
production and less so on the labor-intensive stages and
the strategic outward investment of U.S. MNCs have
enabled that transition.
While U.S. manufacturing has become more focused
on the higher-value-added stages of production, the
manufacturing share of employment in the U.S. has
declined steadily for decades. Employment in the
services sector began to take off in the 1960s and has
expanded ever since. Manufacturing employment
peaked in the late 1970s and has been in secular decline.
But, as the manufacturing share of the U.S. workforce
has declined, U.S. manufacturing output has grown
strongly and the value of goods and products made in
the U.S. continues to rise.
Automation, technological advances,
globalization, and the offshoring of lower-wage,
lower-skill jobs have enabled the U.S. manufacturing
industry to remain competitive by continuing to
increase efficiency and productivity. The long term
trends in labor productivity have been positive.
According to the U.S. Bureau of Labor Statistics (BLS),
over the entire 1987-2016 period, labor productivity rose
in 85 of the 90 manufacturing and mining industries
measured. An increase in labor productivity means that
manufacturers can produce more value with fewer labor
inputs.
Manufacturing Sector’s Top Trade Partners:
China, Canada and Mexico
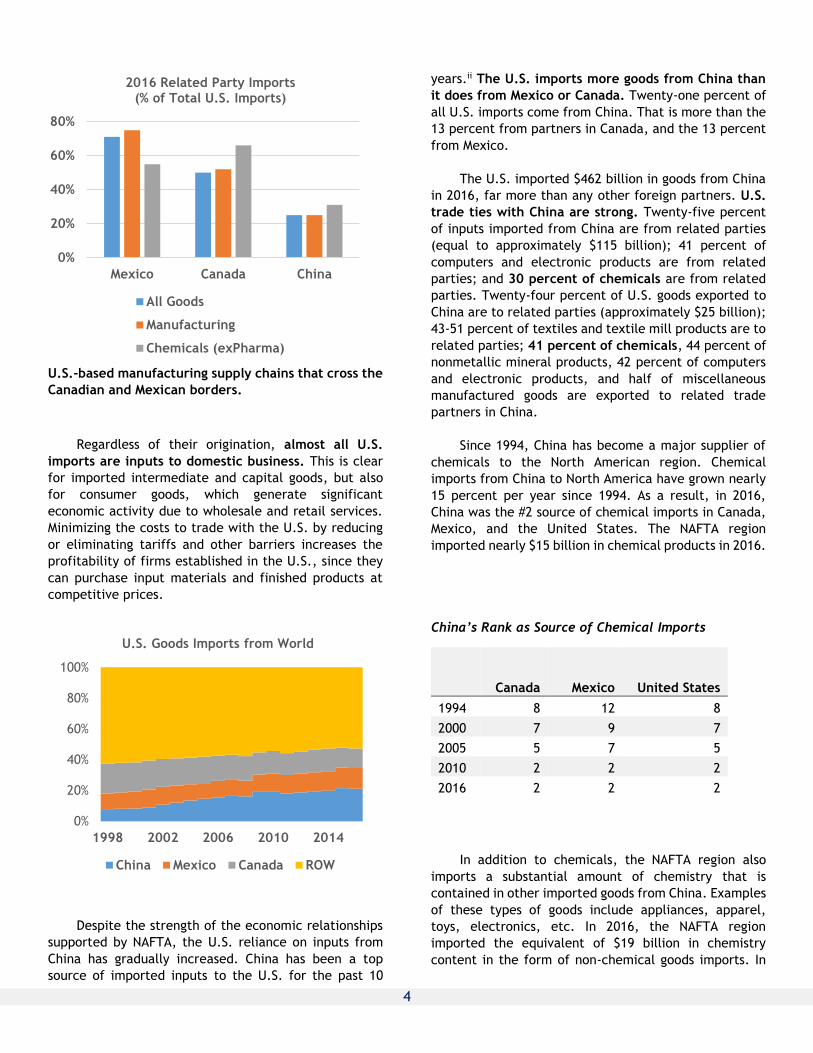
Intra-company or related-partyi trade between the
U.S. and Canada, and the U.S. and Mexico, comprises a
significant portion of intra-regional trade. Half of U.S.
imports from Canada are from related parties and 40
percent of U.S. exports to Canada are to related parties.
Seventy-one percent of imports from Mexico are from
related parties and 42 percent of U.S. goods exports to
Mexico are to related parties. Strong trade ties
between the U.S. and its NAFTA partners reflect the
$0
$5
$10
$15
$20
$25
$30
$35
$40
1999 2003 2007 2011 2015
Hourly Compensation Costs for Manufacturing, $/hour
Source: Conference Board
U.S. Canada Mexico China*
4
U.S.-based manufacturing supply chains that cross the
Canadian and Mexican borders.
Regardless of their origination, almost all U.S.
imports are inputs to domestic business. This is clear
for imported intermediate and capital goods, but also
for consumer goods, which generate significant
economic activity due to wholesale and retail services.
Minimizing the costs to trade with the U.S. by reducing
or eliminating tariffs and other barriers increases the
profitability of firms established in the U.S., since they
can purchase input materials and finished products at
competitive prices.
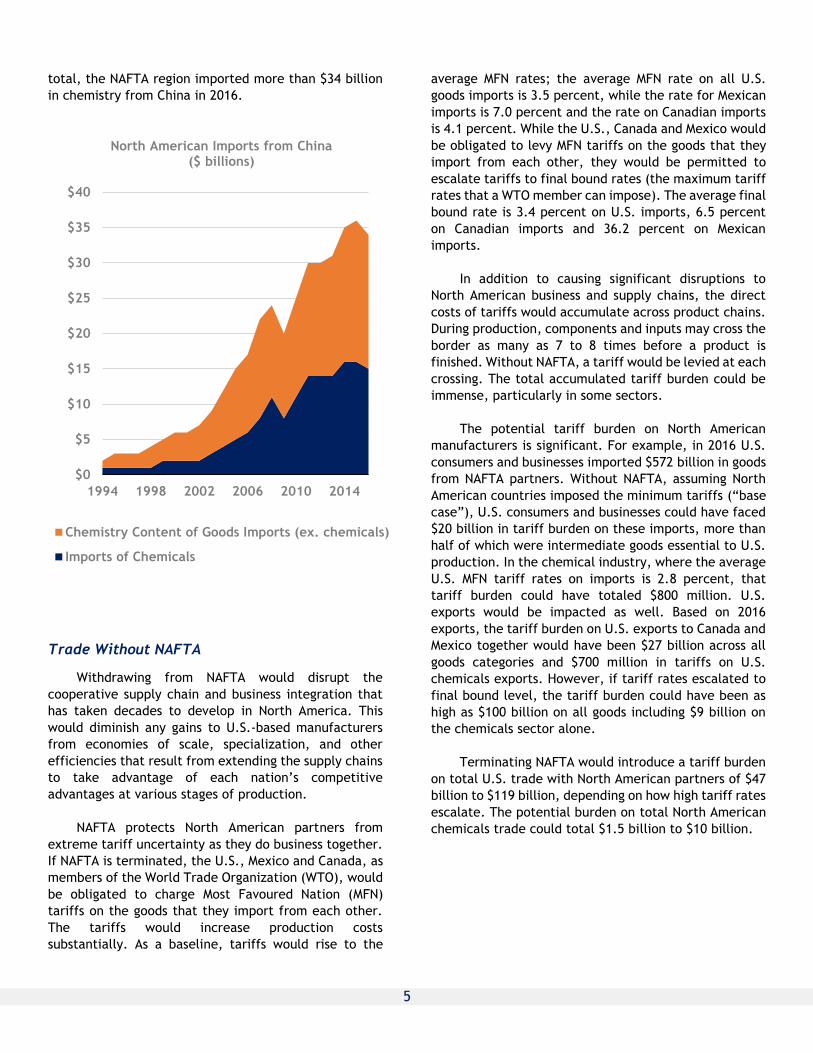
Despite the strength of the economic relationships
supported by NAFTA, the U.S. reliance on inputs from
China has gradually increased. China has been a top
source of imported inputs to the U.S. for the past 10
years.ii The U.S. imports more goods from China than
it does from Mexico or Canada. Twenty-one percent of
all U.S. imports come from China. That is more than the
13 percent from partners in Canada, and the 13 percent
from Mexico.
The U.S. imported $462 billion in goods from China
in 2016, far more than any other foreign partners. U.S.
trade ties with China are strong. Twenty-five percent
of inputs imported from China are from related parties
(equal to approximately $115 billion); 41 percent of
computers and electronic products are from related
parties; and 30 percent of chemicals are from related
parties. Twenty-four percent of U.S. goods exported to
China are to related parties (approximately $25 billion);
43-51 percent of textiles and textile mill products are to
related parties; 41 percent of chemicals, 44 percent of
nonmetallic mineral products, 42 percent of computers
and electronic products, and half of miscellaneous
manufactured goods are exported to related trade
partners in China.
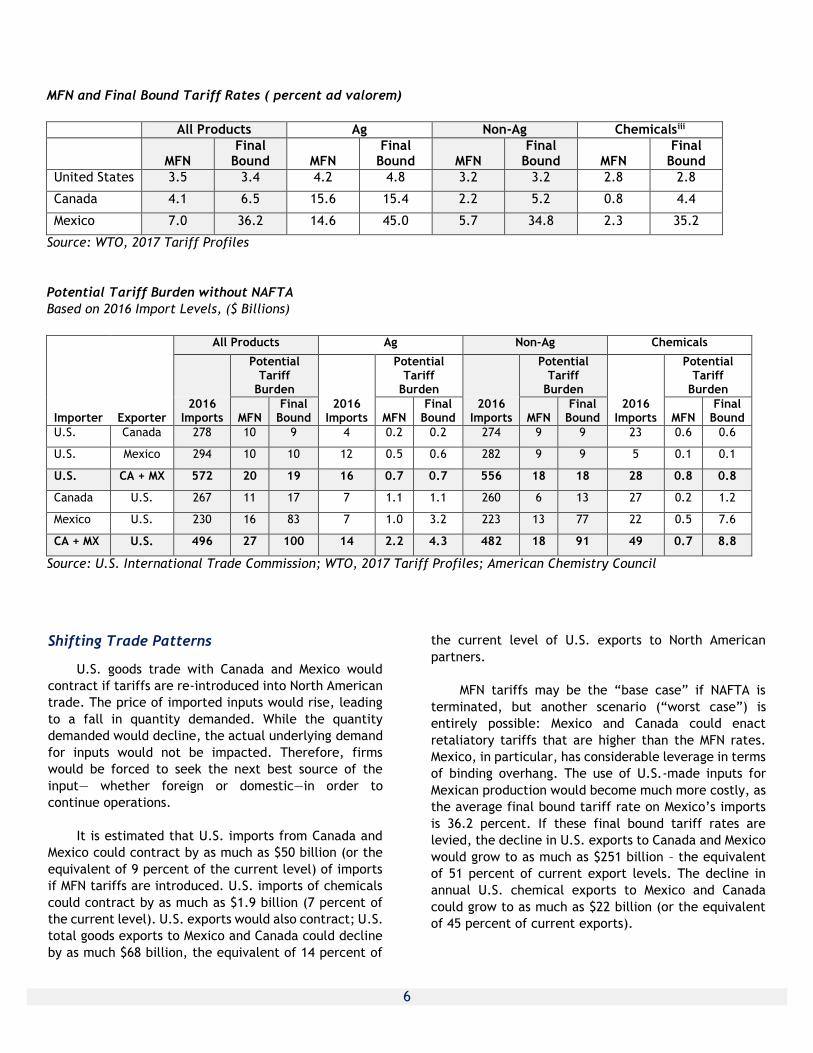
Since 1994, China has become a major supplier of
chemicals to the North American region. Chemical
imports from China to North America have grown nearly
15 percent per year since 1994. As a result, in 2016,
China was the #2 source of chemical imports in Canada,
Mexico, and the United States. The NAFTA region
imported nearly $15 billion in chemical products in 2016.
China’s Rank as Source of Chemical Imports
Canada Mexico United States
1994 8 12 8
2000 7 9 7
2005 5 7 5
2010 2 2 2
2016 2 2 2
In addition to chemicals, the NAFTA region also
imports a substantial amount of chemistry that is
contained in other imported goods from China. Examples
of these types of goods include appliances, apparel,
toys, electronics, etc. In 2016, the NAFTA region
imported the equivalent of $19 billion in chemistry
content in the form of non-chemical goods imports. In
0%
20%
40%
60%
80%
100%
1998 2002 2006 2010 2014
U.S. Goods Imports from World
China Mexico Canada ROW
0%
20%
40%
60%
80%
Mexico Canada China
2016 Related Party Imports (% of Total U.S. Imports)
All Goods
Manufacturing
Chemicals (exPharma)
5
total, the NAFTA region imported more than $34 billion
in chemistry from China in 2016.
Trade Without NAFTA
Withdrawing from NAFTA would disrupt the
cooperative supply chain and business integration that
has taken decades to develop in North America. This
would diminish any gains to U.S.-based manufacturers
from economies of scale, specialization, and other
efficiencies that result from extending the supply chains
to take advantage of each nation’s competitive
advantages at various stages of production.
NAFTA protects North American partners from
extreme tariff uncertainty as they do business together.
If NAFTA is terminated, the U.S., Mexico and Canada, as
members of the World Trade Organization (WTO), would
be obligated to charge Most Favoured Nation (MFN)
tariffs on the goods that they import from each other.
The tariffs would increase production costs
substantially. As a baseline, tariffs would rise to the
average MFN rates; the average MFN rate on all U.S.
goods imports is 3.5 percent, while the rate for Mexican
imports is 7.0 percent and the rate on Canadian imports
is 4.1 percent. While the U.S., Canada and Mexico would
be obligated to levy MFN tariffs on the goods that they
import from each other, they would be permitted to
escalate tariffs to final bound rates (the maximum tariff
rates that a WTO member can impose). The average final
bound rate is 3.4 percent on U.S. imports, 6.5 percent
on Canadian imports and 36.2 percent on Mexican
imports.
In addition to causing significant disruptions to
North American business and supply chains, the direct
costs of tariffs would accumulate across product chains.
During production, components and inputs may cross the
border as many as 7 to 8 times before a product is
finished. Without NAFTA, a tariff would be levied at each
crossing. The total accumulated tariff burden could be
immense, particularly in some sectors.
The potential tariff burden on North American
manufacturers is significant. For example, in 2016 U.S.
consumers and businesses imported $572 billion in goods
from NAFTA partners. Without NAFTA, assuming North
American countries imposed the minimum tariffs (“base
case”), U.S. consumers and businesses could have faced
$20 billion in tariff burden on these imports, more than
half of which were intermediate goods essential to U.S.
production. In the chemical industry, where the average
U.S. MFN tariff rates on imports is 2.8 percent, that
tariff burden could have totaled $800 million. U.S.
exports would be impacted as well. Based on 2016
exports, the tariff burden on U.S. exports to Canada and
Mexico together would have been $27 billion across all
goods categories and $700 million in tariffs on U.S.
chemicals exports. However, if tariff rates escalated to
final bound level, the tariff burden could have been as
high as $100 billion on all goods including $9 billion on
the chemicals sector alone.
Terminating NAFTA would introduce a tariff burden
on total U.S. trade with North American partners of $47
billion to $119 billion, depending on how high tariff rates
escalate. The potential burden on total North American
chemicals trade could total $1.5 billion to $10 billion.
$0
$5
$10
$15
$20
$25
$30
$35
$40
1994 1998 2002 2006 2010 2014
North American Imports from China($ billions)
Chemistry Content of Goods Imports (ex. chemicals)
Imports of Chemicals
6
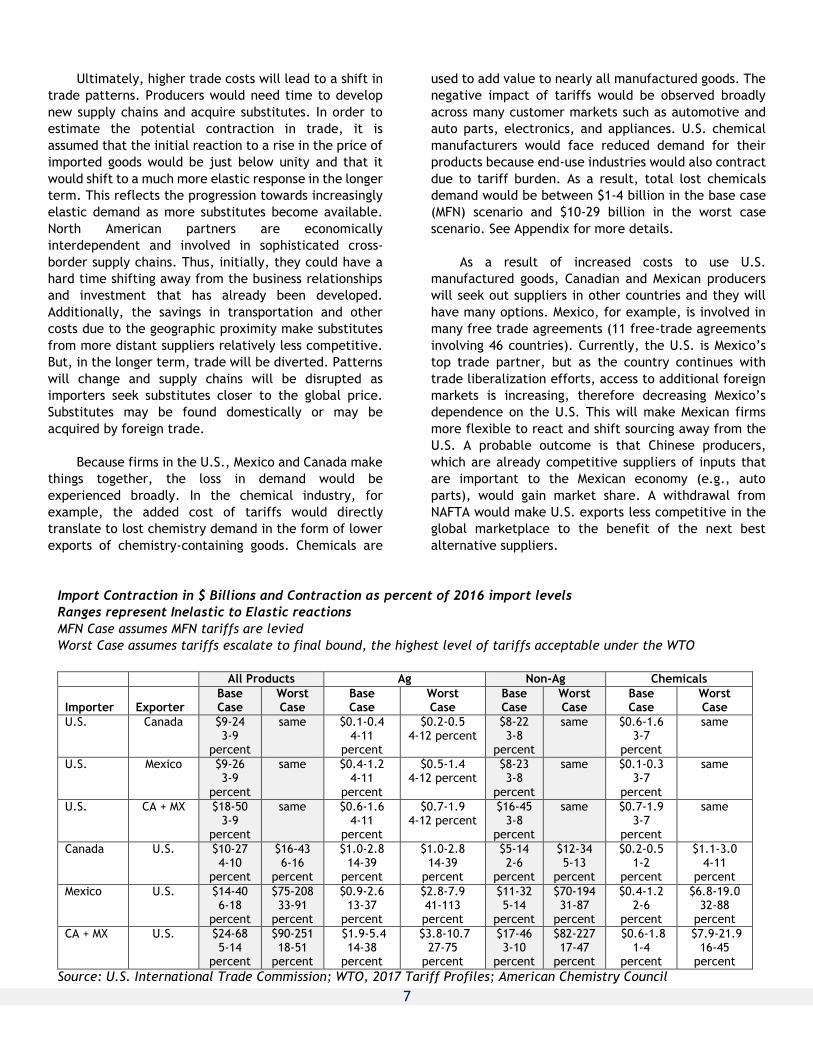
MFN and Final Bound Tariff Rates ( percent ad valorem)
All Products Ag Non-Ag Chemicalsiii
MFN
Final Bound MFN
Final Bound MFN
Final Bound MFN
Final Bound
United States 3.5 3.4 4.2 4.8 3.2 3.2 2.8 2.8
Canada 4.1 6.5 15.6 15.4 2.2 5.2 0.8 4.4
Mexico 7.0 36.2 14.6 45.0 5.7 34.8 2.3 35.2
Source: WTO, 2017 Tariff Profiles
Potential Tariff Burden without NAFTA
Based on 2016 Import Levels, ($ Billions)
All Products Ag Non-Ag Chemicals
Potential Tariff
Burden
Potential Tariff
Burden
Potential Tariff
Burden
Potential Tariff
Burden
Importer Exporter 2016
Imports MFN Final
Bound 2016
Imports MFN Final
Bound 2016
Imports MFN Final
Bound 2016
Imports MFN Final
Bound
U.S. Canada 278 10 9 4 0.2 0.2 274 9 9 23 0.6 0.6
U.S. Mexico 294 10 10 12 0.5 0.6 282 9 9 5 0.1 0.1
U.S. CA + MX 572 20 19 16 0.7 0.7 556 18 18 28 0.8 0.8
Canada U.S. 267 11 17 7 1.1 1.1 260 6 13 27 0.2 1.2
Mexico U.S. 230 16 83 7 1.0 3.2 223 13 77 22 0.5 7.6
CA + MX U.S. 496 27 100 14 2.2 4.3 482 18 91 49 0.7 8.8
Source: U.S. International Trade Commission; WTO, 2017 Tariff Profiles; American Chemistry Council
Shifting Trade Patterns
U.S. goods trade with Canada and Mexico would
contract if tariffs are re-introduced into North American
trade. The price of imported inputs would rise, leading
to a fall in quantity demanded. While the quantity
demanded would decline, the actual underlying demand
for inputs would not be impacted. Therefore, firms
would be forced to seek the next best source of the
input— whether foreign or domestic—in order to
continue operations.
It is estimated that U.S. imports from Canada and
Mexico could contract by as much as $50 billion (or the
equivalent of 9 percent of the current level) of imports
if MFN tariffs are introduced. U.S. imports of chemicals
could contract by as much as $1.9 billion (7 percent of
the current level). U.S. exports would also contract; U.S.
total goods exports to Mexico and Canada could decline
by as much $68 billion, the equivalent of 14 percent of
the current level of U.S. exports to North American
partners.
MFN tariffs may be the “base case” if NAFTA is
terminated, but another scenario (“worst case”) is
entirely possible: Mexico and Canada could enact
retaliatory tariffs that are higher than the MFN rates.
Mexico, in particular, has considerable leverage in terms
of binding overhang. The use of U.S.-made inputs for
Mexican production would become much more costly, as
the average final bound tariff rate on Mexico’s imports
is 36.2 percent. If these final bound tariff rates are
levied, the decline in U.S. exports to Canada and Mexico
would grow to as much as $251 billion – the equivalent
of 51 percent of current export levels. The decline in
annual U.S. chemical exports to Mexico and Canada
could grow to as much as $22 billion (or the equivalent
of 45 percent of current exports).
7
Ultimately, higher trade costs will lead to a shift in
trade patterns. Producers would need time to develop
new supply chains and acquire substitutes. In order to
estimate the potential contraction in trade, it is
assumed that the initial reaction to a rise in the price of
imported goods would be just below unity and that it
would shift to a much more elastic response in the longer
term. This reflects the progression towards increasingly
elastic demand as more substitutes become available.
North American partners are economically
interdependent and involved in sophisticated cross-
border supply chains. Thus, initially, they could have a
hard time shifting away from the business relationships
and investment that has already been developed.
Additionally, the savings in transportation and other
costs due to the geographic proximity make substitutes
from more distant suppliers relatively less competitive.
But, in the longer term, trade will be diverted. Patterns
will change and supply chains will be disrupted as
importers seek substitutes closer to the global price.
Substitutes may be found domestically or may be
acquired by foreign trade.
Because firms in the U.S., Mexico and Canada make
things together, the loss in demand would be
experienced broadly. In the chemical industry, for
example, the added cost of tariffs would directly
translate to lost chemistry demand in the form of lower
exports of chemistry-containing goods. Chemicals are
used to add value to nearly all manufactured goods. The
negative impact of tariffs would be observed broadly
across many customer markets such as automotive and
auto parts, electronics, and appliances. U.S. chemical
manufacturers would face reduced demand for their
products because end-use industries would also contract
due to tariff burden. As a result, total lost chemicals
demand would be between $1-4 billion in the base case
(MFN) scenario and $10-29 billion in the worst case
scenario. See Appendix for more details.
As a result of increased costs to use U.S.
manufactured goods, Canadian and Mexican producers
will seek out suppliers in other countries and they will
have many options. Mexico, for example, is involved in
many free trade agreements (11 free-trade agreements
involving 46 countries). Currently, the U.S. is Mexico’s
top trade partner, but as the country continues with
trade liberalization efforts, access to additional foreign
markets is increasing, therefore decreasing Mexico’s
dependence on the U.S. This will make Mexican firms
more flexible to react and shift sourcing away from the
U.S. A probable outcome is that Chinese producers,
which are already competitive suppliers of inputs that
are important to the Mexican economy (e.g., auto
parts), would gain market share. A withdrawal from
NAFTA would make U.S. exports less competitive in the
global marketplace to the benefit of the next best
alternative suppliers.
Import Contraction in $ Billions and Contraction as percent of 2016 import levels
Ranges represent Inelastic to Elastic reactions
MFN Case assumes MFN tariffs are levied
Worst Case assumes tariffs escalate to final bound, the highest level of tariffs acceptable under the WTO
All Products Ag Non-Ag Chemicals
Importer Exporter Base Case
Worst Case
Base Case
Worst Case
Base Case
Worst Case
Base Case
Worst Case
U.S. Canada $9-24 3-9
percent
same $0.1-0.4 4-11
percent
$0.2-0.5 4-12 percent
$8-22 3-8
percent
same $0.6-1.6 3-7
percent
same
U.S. Mexico $9-26 3-9
percent
same $0.4-1.2 4-11
percent
$0.5-1.4 4-12 percent
$8-23 3-8
percent
same $0.1-0.3 3-7
percent
same
U.S. CA + MX $18-50 3-9
percent
same $0.6-1.6 4-11
percent
$0.7-1.9 4-12 percent
$16-45 3-8
percent
same $0.7-1.9 3-7
percent
same
Canada U.S. $10-27 4-10
percent
$16-43 6-16
percent
$1.0-2.8 14-39
percent
$1.0-2.8 14-39
percent
$5-14 2-6
percent
$12-34 5-13
percent
$0.2-0.5 1-2
percent
$1.1-3.0 4-11
percent
Mexico U.S. $14-40 6-18
percent
$75-208 33-91
percent
$0.9-2.6 13-37
percent
$2.8-7.9 41-113 percent
$11-32 5-14
percent
$70-194 31-87
percent
$0.4-1.2 2-6
percent
$6.8-19.0 32-88
percent
CA + MX U.S. $24-68 5-14
percent
$90-251 18-51
percent
$1.9-5.4 14-38
percent
$3.8-10.7 27-75
percent
$17-46 3-10
percent
$82-227 17-47
percent
$0.6-1.8 1-4
percent
$7.9-21.9 16-45
percent
Source: U.S. International Trade Commission; WTO, 2017 Tariff Profiles; American Chemistry Council
8
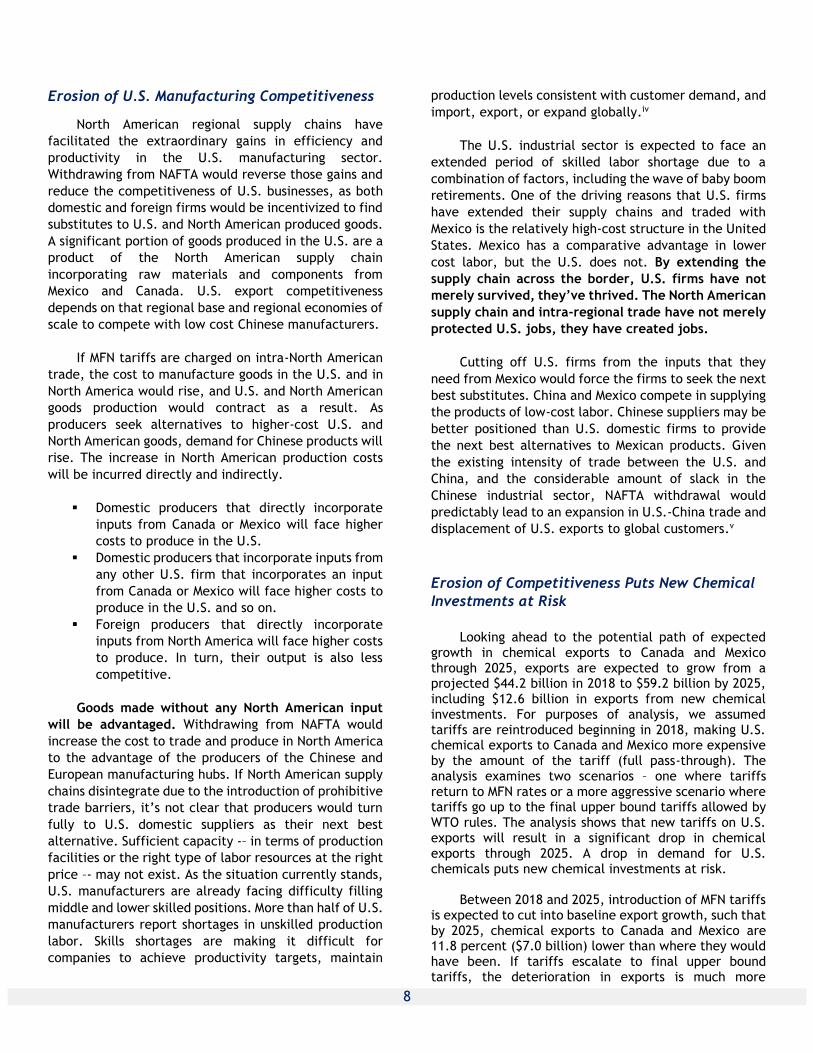
Erosion of U.S. Manufacturing Competitiveness
North American regional supply chains have
facilitated the extraordinary gains in efficiency and
productivity in the U.S. manufacturing sector.
Withdrawing from NAFTA would reverse those gains and
reduce the competitiveness of U.S. businesses, as both
domestic and foreign firms would be incentivized to find
substitutes to U.S. and North American produced goods.
A significant portion of goods produced in the U.S. are a
product of the North American supply chain
incorporating raw materials and components from
Mexico and Canada. U.S. export competitiveness
depends on that regional base and regional economies of
scale to compete with low cost Chinese manufacturers.
If MFN tariffs are charged on intra-North American
trade, the cost to manufacture goods in the U.S. and in
North America would rise, and U.S. and North American
goods production would contract as a result. As
producers seek alternatives to higher-cost U.S. and
North American goods, demand for Chinese products will
rise. The increase in North American production costs
will be incurred directly and indirectly.
Domestic producers that directly incorporate
inputs from Canada or Mexico will face higher
costs to produce in the U.S.
Domestic producers that incorporate inputs from
any other U.S. firm that incorporates an input
from Canada or Mexico will face higher costs to
produce in the U.S. and so on.
Foreign producers that directly incorporate
inputs from North America will face higher costs
to produce. In turn, their output is also less
competitive.
Goods made without any North American input
will be advantaged. Withdrawing from NAFTA would
increase the cost to trade and produce in North America
to the advantage of the producers of the Chinese and
European manufacturing hubs. If North American supply
chains disintegrate due to the introduction of prohibitive
trade barriers, it’s not clear that producers would turn
fully to U.S. domestic suppliers as their next best
alternative. Sufficient capacity -– in terms of production
facilities or the right type of labor resources at the right
price –- may not exist. As the situation currently stands,
U.S. manufacturers are already facing difficulty filling
middle and lower skilled positions. More than half of U.S.
manufacturers report shortages in unskilled production
labor. Skills shortages are making it difficult for
companies to achieve productivity targets, maintain
production levels consistent with customer demand, and
import, export, or expand globally.iv
The U.S. industrial sector is expected to face an
extended period of skilled labor shortage due to a
combination of factors, including the wave of baby boom
retirements. One of the driving reasons that U.S. firms
have extended their supply chains and traded with
Mexico is the relatively high-cost structure in the United
States. Mexico has a comparative advantage in lower
cost labor, but the U.S. does not. By extending the
supply chain across the border, U.S. firms have not
merely survived, they’ve thrived. The North American
supply chain and intra-regional trade have not merely
protected U.S. jobs, they have created jobs.
Cutting off U.S. firms from the inputs that they
need from Mexico would force the firms to seek the next
best substitutes. China and Mexico compete in supplying
the products of low-cost labor. Chinese suppliers may be
better positioned than U.S. domestic firms to provide
the next best alternatives to Mexican products. Given
the existing intensity of trade between the U.S. and
China, and the considerable amount of slack in the
Chinese industrial sector, NAFTA withdrawal would
predictably lead to an expansion in U.S.-China trade and
displacement of U.S. exports to global customers.v
Erosion of Competitiveness Puts New Chemical
Investments at Risk
Looking ahead to the potential path of expected
growth in chemical exports to Canada and Mexico through 2025, exports are expected to grow from a projected $44.2 billion in 2018 to $59.2 billion by 2025, including $12.6 billion in exports from new chemical investments. For purposes of analysis, we assumed tariffs are reintroduced beginning in 2018, making U.S. chemical exports to Canada and Mexico more expensive by the amount of the tariff (full pass-through). The analysis examines two scenarios – one where tariffs return to MFN rates or a more aggressive scenario where tariffs go up to the final upper bound tariffs allowed by WTO rules. The analysis shows that new tariffs on U.S. exports will result in a significant drop in chemical exports through 2025. A drop in demand for U.S. chemicals puts new chemical investments at risk.
Between 2018 and 2025, introduction of MFN tariffs
is expected to cut into baseline export growth, such that by 2025, chemical exports to Canada and Mexico are 11.8 percent ($7.0 billion) lower than where they would have been. If tariffs escalate to final upper bound tariffs, the deterioration in exports is much more
9
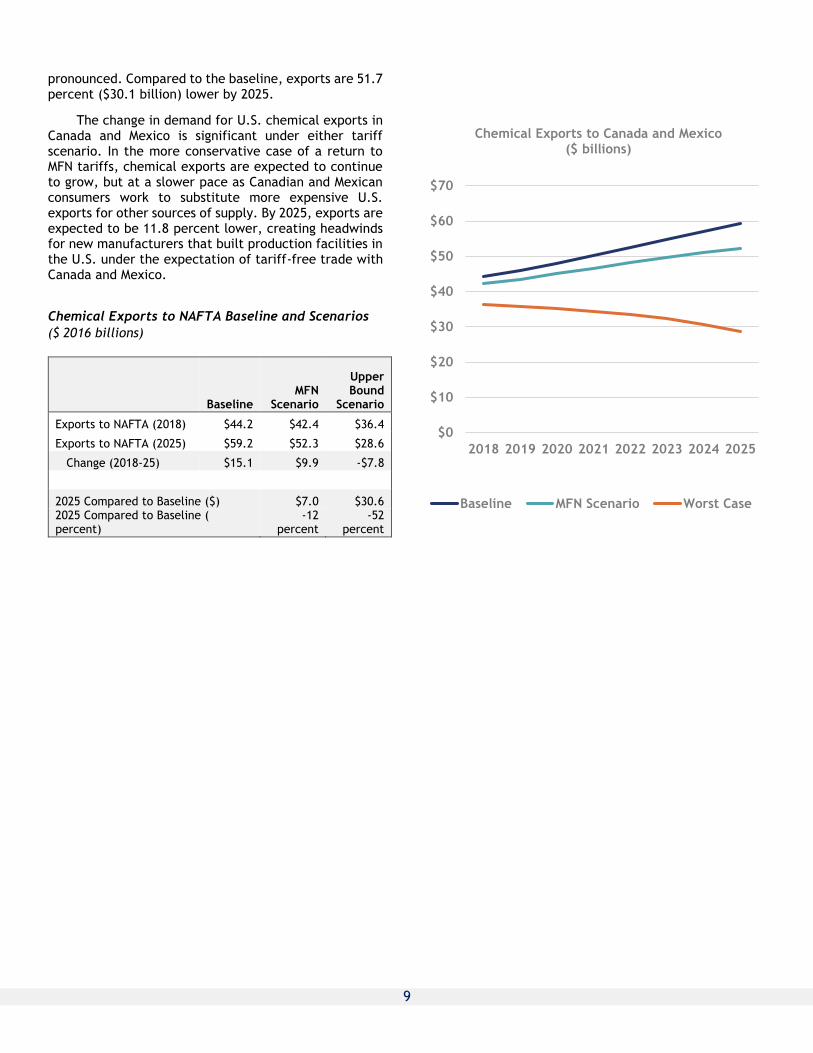
pronounced. Compared to the baseline, exports are 51.7 percent ($30.1 billion) lower by 2025.
The change in demand for U.S. chemical exports in Canada and Mexico is significant under either tariff scenario. In the more conservative case of a return to MFN tariffs, chemical exports are expected to continue to grow, but at a slower pace as Canadian and Mexican consumers work to substitute more expensive U.S. exports for other sources of supply. By 2025, exports are expected to be 11.8 percent lower, creating headwinds for new manufacturers that built production facilities in the U.S. under the expectation of tariff-free trade with Canada and Mexico.
Chemical Exports to NAFTA Baseline and Scenarios
($ 2016 billions)
Baseline MFN
Scenario
Upper Bound
Scenario
Exports to NAFTA (2018) $44.2 $42.4 $36.4
Exports to NAFTA (2025) $59.2 $52.3 $28.6
Change (2018-25) $15.1 $9.9 -$7.8
2025 Compared to Baseline ($) $7.0 $30.6 2025 Compared to Baseline ( percent)
-12 percent
-52 percent
$0
$10
$20
$30
$40
$50
$60
$70
2018 2019 2020 2021 2022 2023 2024 2025
Chemical Exports to Canada and Mexico($ billions)
Baseline MFN Scenario Worst Case
10
Appendix
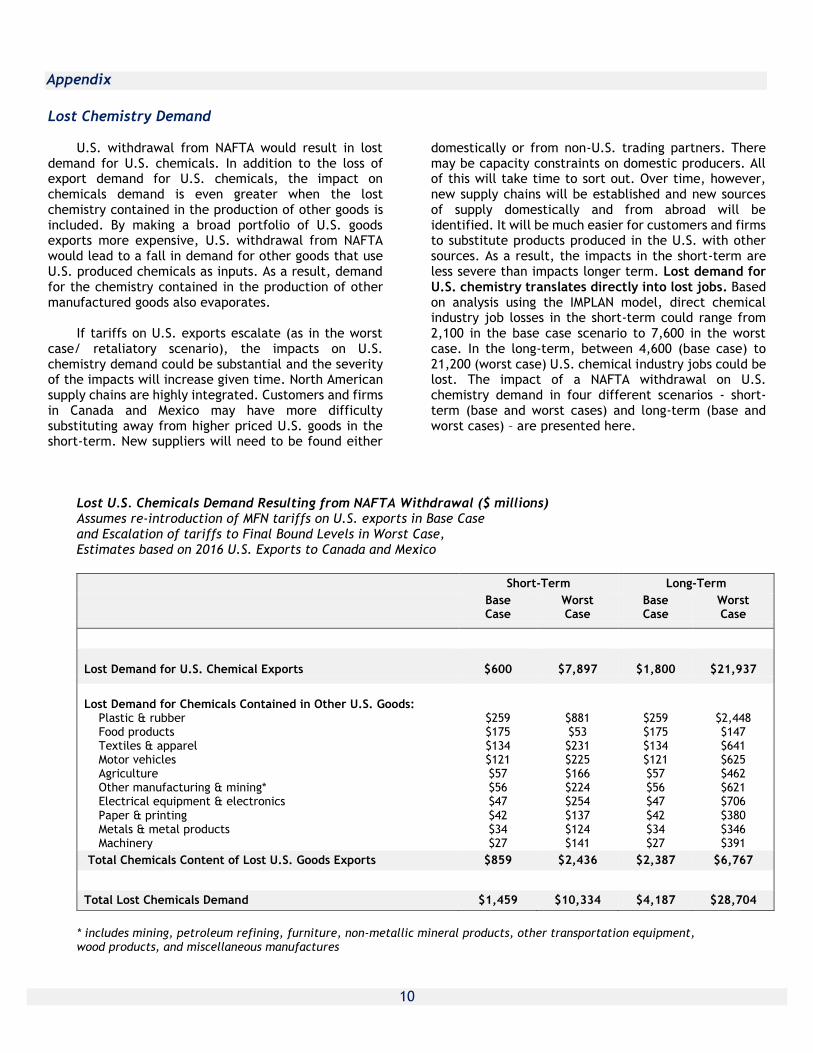
Lost Chemistry Demand
U.S. withdrawal from NAFTA would result in lost demand for U.S. chemicals. In addition to the loss of export demand for U.S. chemicals, the impact on chemicals demand is even greater when the lost chemistry contained in the production of other goods is included. By making a broad portfolio of U.S. goods exports more expensive, U.S. withdrawal from NAFTA would lead to a fall in demand for other goods that use U.S. produced chemicals as inputs. As a result, demand for the chemistry contained in the production of other manufactured goods also evaporates.
If tariffs on U.S. exports escalate (as in the worst
case/ retaliatory scenario), the impacts on U.S. chemistry demand could be substantial and the severity of the impacts will increase given time. North American supply chains are highly integrated. Customers and firms in Canada and Mexico may have more difficulty substituting away from higher priced U.S. goods in the short-term. New suppliers will need to be found either
domestically or from non-U.S. trading partners. There may be capacity constraints on domestic producers. All of this will take time to sort out. Over time, however, new supply chains will be established and new sources of supply domestically and from abroad will be identified. It will be much easier for customers and firms to substitute products produced in the U.S. with other sources. As a result, the impacts in the short-term are less severe than impacts longer term. Lost demand for U.S. chemistry translates directly into lost jobs. Based on analysis using the IMPLAN model, direct chemical industry job losses in the short-term could range from 2,100 in the base case scenario to 7,600 in the worst case. In the long-term, between 4,600 (base case) to 21,200 (worst case) U.S. chemical industry jobs could be lost. The impact of a NAFTA withdrawal on U.S. chemistry demand in four different scenarios - short-term (base and worst cases) and long-term (base and worst cases) – are presented here.
Lost U.S. Chemicals Demand Resulting from NAFTA Withdrawal ($ millions) Assumes re-introduction of MFN tariffs on U.S. exports in Base Case and Escalation of tariffs to Final Bound Levels in Worst Case, Estimates based on 2016 U.S. Exports to Canada and Mexico
Short-Term Long-Term
Base Case
Worst Case
Base Case
Worst Case
Lost Demand for U.S. Chemical Exports
$600
$7,897
$1,800
$21,937
Lost Demand for Chemicals Contained in Other U.S. Goods: Plastic & rubber $259 $881 $259 $2,448 Food products $175 $53 $175 $147 Textiles & apparel $134 $231 $134 $641 Motor vehicles $121 $225 $121 $625 Agriculture $57 $166 $57 $462 Other manufacturing & mining* $56 $224 $56 $621 Electrical equipment & electronics $47 $254 $47 $706 Paper & printing $42 $137 $42 $380 Metals & metal products $34 $124 $34 $346 Machinery $27 $141 $27 $391
Total Chemicals Content of Lost U.S. Goods Exports $859 $2,436 $2,387 $6,767
Total Lost Chemicals Demand $1,459 $10,334 $4,187 $28,704
* includes mining, petroleum refining, furniture, non-metallic mineral products, other transportation equipment, wood products, and miscellaneous manufactures
11
For More Information
American Chemistry Council Economics & Statistics Department Contacts
Martha Gilchrist Moore, CBE
Senior Director – Policy Analysis and Economics
202.249.6182
Emily Sanchez
Director, Economics & Data Analytics
202.249.6183
12
References
i Related party trade is often cross-border intra-firm transactions of multinational corporations. Technically, the Census Bureau applies the following definitions: For U.S. imports, a related party transaction is a transaction between two parties in which (among many possibilities) “any person directly or indirectly owning, controlling or holding power to vote, 5 percent or more of the outstanding voting stock or shares of any organization.” For U.S. exports, a related party transaction is “a transaction involving trade between a U.S. principal party in interest and an ultimate consignee where either party owns directly or indirectly 10 percent or more of the other party.” ii Note that after the U.S., China is the top origin of imported goods (12 percent of all imported goods) to Canada. Similarly, after the U.S., China is the top origin of imported goods (18 percent of all imported goods) to Mexico. After Canada and Mexico, China is the top destination for U.S. exports and 17 percent of all U.S. exports are sold to customers in China. The U.S. exported $107 billion in goods to China in 2016. After the U.S., China is the top export destination of exported goods (4 percent of all exported goods) from Canada. iii Chemicals is based on the WTO “chemicals” product group which is not perfectly aligned with what ACC defines as
chemicals excluding pharmaceuticals. However, information from the WTO tariff profiles is used in this analysis
because it provides a consistent source for comparing tariff rates across countries and sectors.
iv The Manufacturing Institute, “Boiling point? The skills gap in U.S. manufacturing” URL: http://www.themanufacturinginstitute.org/~/media/A07730B2A798437D98501E798C2E13AA.ashx v Chinese manufacturing has been overbuilt and spare capacity exists. The infrastructure for expanding manufacturing already exists. In addition to Chinese readiness to meet displaced North American demand, the Chinese manufacturing hub employs the evolving comparative advantages in the Southeast Asian partner nations through a network of trade and investment. The IMF estimated China’s average capacity utilization at 60 percent at the end of 2011, indicating significant slack in their economy (http://www.businessinsider.com/chinas-excess-capacity-problem-2013-6).