Embed Size (px)
Citation preview
. Economic Review – Journal of Economics and Business, Vol. XII, Issue 2, November 2014 ///
* International Islamic university Malaysia, [email protected] ** International Islamic university Malaysia, [email protected] *** Islamic Science University of Malaysia, [email protected] **** Effat University, Saudi Arabia, [email protected]
49 ///
FIRMS’ FINANCIAL AND CORPORATE GOVERNANCE CHARACTERISTICS ASSOCIATION
WITH EARNING MANAGEMENT PRACTICES: A META-ANALYSIS APPROACH
Fatima Abdul Hamid *, Chaabane Oussama Houssem Eddine **,
Abdullah Mohamed Ayedh ***, Abdelghani Echchabi ****
ABSTRACT
This paper aims to investigate the association
between firm’s corporate governance and
financial attributes (namely, board of directors’
size, board of directors’ independence, chief
executive officer (CEO) duality, ownership
structure, audit type, firm’s size, firm’s return
and leverage) with earnings management
practices. The study applies a comprehensive
meta-analysis of the findings of 25 journal
articles published between 2003 and 2013. The
analysis permits this research to accumulate
and assimilate the results of previous literature,
and their generalization to a wider range of
settings. The results showed that all corporate
governance and financial characteristics
variables have a significant association with
earnings management practices.
Keywords: meta-analysis, earnings
management, corporate governance, financial
characteristics.
JEL Classification: M41, M42
1. INTRODUCTION
In the modern day business environment,
many corporations are faced with a
considerable number of issues and challenges.
Among others, these include the risk of future
losses, volatility of company’s share price and
the concern of being overly regulated,
particularly for large corporations. These
challenges resulted in the emergence of
earnings management (EM). One of EM
practices is income smoothing which consists
of reducing income fluctuations in order to
smoothen out the income level. Income
smoothing portrays a more stable company,
affects share price and may be used to cover
possible loss in the future. Large corporations
could also use EM to decrease their reported
income, consequently paying less tax and
becoming less profitably visible. Hence, EM
may be used by large corporations to reduce
political cost in order not to face more
regulation.
Therefore, based on the above, EM is basically
the manipulation of earnings. Frequently, EM
practices are in favour of managers. This is
because potentially smoothening out the
income flow and portraying a stable company
infers that management is managing the
company well, thus providing job security for
the managers. Furthermore, it allows
managers to receive performance-equivalent
bonuses. Thus, more formally, EM “occurs
when managers use judgment in financial
reporting and in structuring transactions to
alter financial report to either mislead some
stakeholders about the underlying economic
performance of the company or influence
contractual outcomes that depend on
reported accounting numbers” (Healy &
Wahlen 1999, p. 368).
Since EM practices distort financial reporting
figures and may mislead users of financial
statements, alleviating EM, particularly
minimizing discretionary accruals, is
/// . Hamid F. A., Eddine Ch. O. H, Ayedh A. M., Echchabi A. .
/// 50 Economic Review – Journal of Economics and Business, Vol. XII, Issue 2, November 2014
considered one of the main indicators of the
quality of financial reporting. By deterring EM
practices, financial statements are more
reliable, informative, and accurate; especially,
when managers’ profit maximization
ambitions and financially opportunistic
behaviour are well restricted by effective
monitoring through good corporate
governance mechanisms as well as firms’
financial attributes (e.g. leverage ratio, return,
and company’s size). In view of the fact that
maintaining the reliability and accuracy of the
financial statements is vital, in the last few
decades, there has been a growing interest
amongst researchers to study different factors
that might be able to reduce EM practices in
various countries. These efforts to potentially
alleviate EM practices seem to be more of a
concern after the financial scandals (e.g.
Enron) and the global financial crisis.
In reviewing the literature, prior studies have
provided insights into the effect of a number
of factors on EM practices across different
countries. However, the findings of these
studies have been mixed (e.g. Alves 2011; Lo
et al., 2010; Prencipe & Bar-Yosef 2011;
Hassan & Ahmad 2012; Chaharsoughi &
AbdulRahman 2013). Therefore, in order to
better understand the factors that reduce EM
practices and possibly untangle the mixed
findings, the current study attempts to review
EM practices and their determinants using a
meta-analysis technique.
The meta-analysis technique is formally
defined as a “statistical analysis of a large
collection of results from individual studies
for the purpose of accumulating and
integrating the findings” (Glass 1976, p. 3).
This technique allows summarizing the
findings of most previous studies in this area
and provides precise and comprehensive
results, which enhances the generalizability of
the findings across settings. Furthermore, it
extends prior meta-analysis studies by
including recent studies and combining
corporate governance attributes and firms’
financial performance characteristics as
determinants of EM. More importantly, this
study updates the specifications of meta-
analysis by having sub-groupings of “before
crisis” and “after crisis”. By having such a
categorization, this study contributes not only
by investigating and accumulating the factors
that reduce EM practices but also analyses
them under differing economic conditions, i.e.
before and after the financial crisis, in order to
determine their consistency.
The remainder of the paper is organized as
follows: Section two discusses the literature in
this area. Section three presents and explains
the methodology applied in the study. Section
four discusses the main results, and section
five concludes with the major findings,
limitations and implications of the findings,
and makes recommendations for further
studies in this area.
2. LITERATURE REVIEW AND
HYPOTHESES DEVELOPMENT
2.1. Corporate governance
The concept of agency theory has documented
that there is a conflict of interest between
principles and agents. Consequently,
corporate governance (CG) was instigated to
govern the corporation as a monitoring
mechanism in order to restrict the
opportunistic behaviour by managers. In this
regard, CG has several elements, including
board of directors, audit committee, internal
auditing, etc. Prior studies have used different
measures of CG effectiveness. These measures
include board size, board independence, audit
committee independence, and ownership
concentration. Accordingly, several empirical
studies have used different CG measures to
examine its effectiveness, for instance, Mohd.
Saleh and Mohd. Iskandar (2007) as well as
Nelson and Devi (2013) have used audit
committee, Park and Shin (2004) and Liu and
Lu (2007) used board of directors, while Alves
(2011) and Lo et al. (2010) used mixed
. Firms’ financial and corporate governance characteristics association with earning … ///
Economic Review – Journal of Economics and Business, Vol. XII, Issue 2, November 2014 51 ///
measures, and Siregar and Utama (2008) used
a combination of board of directors, audit
committee and ownership concentration.
Among the abovementioned CG elements,
most commonly used are board of directors
(board size, board independence, and CEO
duality), ownership concentration, and
auditor type. Hence, the current study focuses
on these three aspects. With respect to board
size, prior studies have presented
contradicting results. For instance, Chen,
Firth, Gao and Rui (2006), Siregar and Utama
(2008), Gulzar and Wang (2011), and Mohd,
Saleh, Mohd. Iskandar and Rahmat (2005)
found no significant impact of board size on
EM. On the other hand, Chaharsoughi and
AbdulRahman (2013) and Alves (2008)
discovered that board size has a significant
negative impact on EM, while Swastika (2013)
revealed a significant positive impact of board
size on EM. It is worth noting that the
measurement for board size was the same in
the above studies, which is the total number of
board members.
The previous studies also found different
results for board independence. Gulzar and
Wang (2011), Park and Shin (2004), Mohd.
Saleh et al. (2005), Chaharsoughi and
AbdulRahman (2013) and Nelson and Devi
(2010) did not find a significant association
between board independence and EM, while
the results presented by Klein (2002), Xie,
Davidson and Dadalt (2003), Cornett, McNutt
and Tehranian (2009), Chen et al. (2006), Liu
and Lu (2007), Alves (2008), and
González and García-Meca (2013) indicated
that board independence has a negative effect
on EM. The above studies also used the same
measurement of board independence, which
is the percentage of outside directors on the
board.
With regard to CEO duality, Chen et al. (2006)
Liu and Lu (2007) and Gonzalez and Garcia-
Meca (2013) found no significant impact of
CEO duality on EM. On the contrary, the
findings of Gulzar and Wang (2011), Cornett
et al. (2009), Xie et al. (2003) and Mohd, Saleh
et al. (2005) show that CEO duality has a
positive impact on EM, while Abed et al.
(2012) found that CEO duality has a negative
impact on EM. These studies used a similar
proxy for CEO duality in the form of a dummy
variable taking the value of 1 if the chairman
and CEO positions are held by the same
person and 0 otherwise.
In terms of ownership concentration,
Bauwhede, Willekens and Gaeremynk (2003)
and Chaharsoughi and AbdulRahman (2013)
did not find a significant association between
ownership concentration and EM. However,
Gulzar and Wang (2011) found that
ownership concentration has a significant
positive effect on EM, while Abed et al. (2012),
Mohd. Saleh et al. (2005), and Liu and Lu
(2007) found that ownership concentration
has a negative impact on EM. Most of the
studies used ownership concentration by
shareholders (Charfeddine et al., 2013;
Gonzalez & Garcia-Meca 2013), while a few
studies used only institutional ownership
concentration (Prencipe & Bar-Yosef 2011;
Hassan & Ahmad 2012).
Prior studies also found contradicting results
for auditor type. For example, Abdullah and
Mohd.Naser (2004), Banderlipe (2009),
Marra, Mazzola and Prencipe (2011) and
Gonzalez and Garcia-Meca (2013) found no
significant effect of auditor type on restricting
EM. However, Kim and Yi (2006) found a
significant positive association, while
Swastika (2013) found a significant negative
relationship. It is noteworthy that these prior
studies used the same measure for auditor
type, which took a value of 1 if the audit firm
was a Big-4 and 0 otherwise. Based on the
above discussion, we propose the following
hypotheses in an alternate form:
H1a: board size is significantly associated
with EM practices

/// . Hamid F. A., Eddine Ch. O. H, Ayedh A. M., Echchabi A. .
/// 52 Economic Review – Journal of Economics and Business, Vol. XII, Issue 2, November 2014
H1b: board independence is significantly
associated with EM practices
H1c: CEO duality is significantly associated
with EM practices
H1d: ownership concentration is significantly
associated with EM practices
H1e: audit type is significantly associated with
EM practices
2.2. Firm characteristics
Regarding firm size, Hassan and Ahmad
(2012), Bekiris and Doukakis (2011), Abed,
Al-Attar and Suwaidan (2012), and Kim and Yi
(2006) found no significant impact of firm size
on EM. On the other hand, Leventis and
Dimitropoulos (2012) and Cornett et al.
(2009) found that firm size has a negative
impact on EM, while Swastika (2013),
Gonzalez and Garcia-Meca (2013), Nelson and
Devi (2010), Chaharsoughi and Abdul Rahman
(2013), Charfeddine et al. (2013), and Kim
and Yoon (2008) found that firm size has a
significant positive impact on EM. It should be
noted that these studies used two different
measures of firm size namely total assets
(Bauwhede et al., 2003; Kim & Yoon 2008)
and total equities (Alves 2011; Chen et al.,
2006).
With respect to leverage, Abed et al. (2012)
and Charfeddine et al. (2013) did not find a
significant relationship between leverage and
EM. In contrast, Gonzalez and Garcia-Meca
(2013), Leventis and Dimitropoulos (2012),
Nelson and Devi (2010), Bekiris and Doukakis
(2011), and Kim and Yi (2006) found that
leverage has a significant positive effect on
EM, while Kim and Yoon (2008) found that
leverage has a significant negative effect on
EM. Three proxies of leverage were used by
these studies; liabilities to total assets ratio
(Chi et al., 2010; Chen et al., 2011), debt to
total assets ratio (Kang & Kim 2012), and debt
to equity ratio (Leventis & Dimitropoulos
2012).
Regarding return, Bekiris and Doukakis’
(2011) findings showed no significant impact
of return on EM. On the other hand,
González and García-Meca (2013) and Nelson
and Devi (2013) found a significant positive
effect of return on EM, while the results of Kim
and Yi (2006) and Charfeddine et al. (2013)
indicated a significant negative impact of
return on EM. These studies used three
different types of return, namely return on
assets (ROA) (Chi et al., 2010), return on
investment (ROI) (Banderlipe 2009) and
annual stock return (Chen et al., 2006). Based
on the aforementioned discussion the
following hypotheses are proposed:
H2a: firm’s size is significantly associated with
EM practices
H2b: firm’s leverage is significantly associated
with EM practices
H2c: firm’s profitability is significantly
associated with EM practices
3. META-ANALYSIS TECHNIQUE
This study conducts a meta-analysis of the
determinants of EM practices. Prior studies
stated that meta-analysis uses advanced
statistical techniques in order to accumulate
the findings of several researches to have a
comprehensive view of the relationship
amongst the variables concerned. According
to Khlif and Souissi (2010), meta-analysis
techniques help to precise and simplify the
varying findings of different empirical studies.
Although Lin and Hwang’s (2010) study also
uses a meta-analysis technique, they do not
take into consideration the economic
conditions of the period before the crisis and
after the crisis. Moreover, their findings on the
association of corporate governance variables
and EM differ from the current study possibly
due to differences in terms of sample size,
sample period, country categorization,
measurement of variables, and different
proxies used for EM. Thus, meta-analysis will
enable the association and calculation of all
. Firms’ financial and corporate governance characteristics association with earning … ///
Economic Review – Journal of Economics and Business, Vol. XII, Issue 2, November 2014 53 ///
these different influencing factors on the
results of those literatures (García-
Meca & Sánchez Ballesta 2009; Lin & Hwang
2010). Moreover, prior studies used different
methodologies in conducting the meta-
analysis technique; for example, Lin and
Hwang (2010) used combined Stouffer test to
examine the effect of audit quality on EM,
while, García-Meca and Sánchez Ballesta
(2009) used effect size (r) to compute the
effect of different corporate governance
attribute on EM. This study follows a similar
methodology of meta-analysis used in Hunter,
Schmidt and Jackson (1982), Ahmed and
Courtis (1999) and Khlif and Souissi (2010).
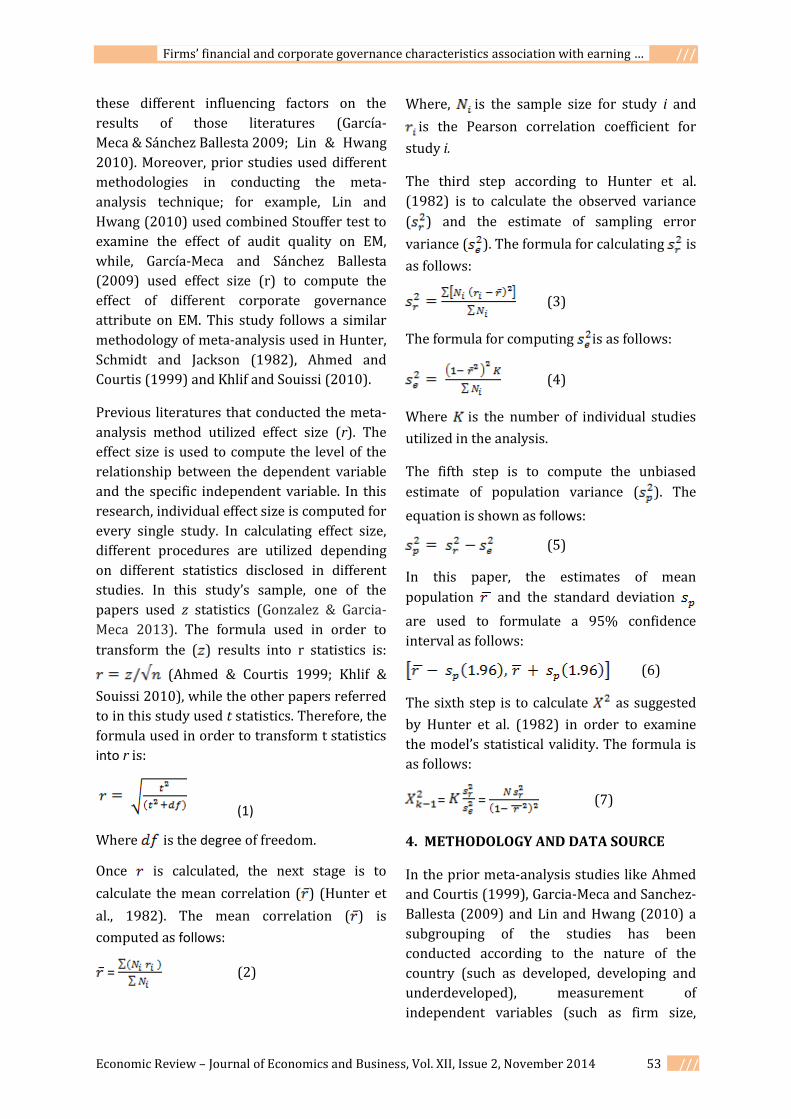
Previous literatures that conducted the meta-
analysis method utilized effect size (r). The
effect size is used to compute the level of the
relationship between the dependent variable
and the specific independent variable. In this
research, individual effect size is computed for
every single study. In calculating effect size,
different procedures are utilized depending
on different statistics disclosed in different
studies. In this study’s sample, one of the
papers used z statistics (Gonzalez & Garcia-
Meca 2013). The formula used in order to
transform the ( ) results into r statistics is:
(Ahmed & Courtis 1999; Khlif &
Souissi 2010), while the other papers referred
to in this study used t statistics. Therefore, the
formula used in order to transform t statistics
into r is:
(1)
Where is the degree of freedom.
Once is calculated, the next stage is to
calculate the mean correlation ( ) (Hunter et
al., 1982). The mean correlation ( ) is
computed as follows:
= (2)
Where, is the sample size for study i and
is the Pearson correlation coefficient for
study i.
The third step according to Hunter et al.
(1982) is to calculate the observed variance
( ) and the estimate of sampling error
variance ( ). The formula for calculating is
as follows:
(3)
The formula for computing is as follows:
(4)
Where is the number of individual studies
utilized in the analysis.
The fifth step is to compute the unbiased
estimate of population variance ( ). The
equation is shown as follows:
(5)
In this paper, the estimates of mean
population and the standard deviation
are used to formulate a 95% confidence
interval as follows:
(6)
The sixth step is to calculate as suggested
by Hunter et al. (1982) in order to examine
the model’s statistical validity. The formula is
as follows:
= = (7)
4. METHODOLOGY AND DATA SOURCE
In the prior meta-analysis studies like Ahmed
and Courtis (1999), Garcia-Meca and Sanchez-
Ballesta (2009) and Lin and Hwang (2010) a
subgrouping of the studies has been
conducted according to the nature of the
country (such as developed, developing and
underdeveloped), measurement of
independent variables (such as firm size,
/// . Hamid F. A., Eddine Ch. O. H, Ayedh A. M., Echchabi A. .
/// 54 Economic Review – Journal of Economics and Business, Vol. XII, Issue 2, November 2014
firm’s return, different measures of corporate
governance, and others), nature of disclosure
(such as voluntary and mandatory) and
dependent variables (such as different
measures and proxies used for EM). This
subgrouping has been performed in order to
escape the over influence of a distinct study in
the meta-analysis (Khlif & Souissi, 2010). In
addition, subgrouping helps in reducing
heterogeneity.
Thus, this research firstly subcategorizes the
literatures depending on country’s
development level (developed counties and
developing countries). The second
subgrouping is established on the nature of
the independent variable measurement. Thus,
the subgroup of size variable comprises two
categories -total assets and others. For return,
two subgroups were created and they are
Return on Assets (ROA) and others. For
leverage, three sub-categories were formed;
total debt to total assets, total investments to
total assets, and total debt to total equity.
Regarding corporate governance variables,
this study did not sub categorize them, since
most of the studies included in this research
utilized the same measurement. Lastly, due to
financial crises’ effects on firms’ different
practices it is expected that the crisis may
have an impact on firms’ EM practices. Thus,
this study sub categorizes the studies to those
before and after the crises, depending on the
sample period of the included studies. The
studies that used a sample during the global
financial crisis have been excluded from this
sub-categorization due to lack of a sufficient
number of studies to be included in the
analysis. Variables such as CEO duality and
auditor type have not been included in the
before and after financial crisis sub grouping
due to lack of studies that were available after
the crisis. The initial sample contained 51
studies and later 26 studies had to be
excluded due to the unavailable data to
compute Consequently, the final sample of
the study comprises 25 published papers on
the determinants of EM practices from 2002
to 2013 on the basis of the availability of the
literature, which represents 50 per cent of the
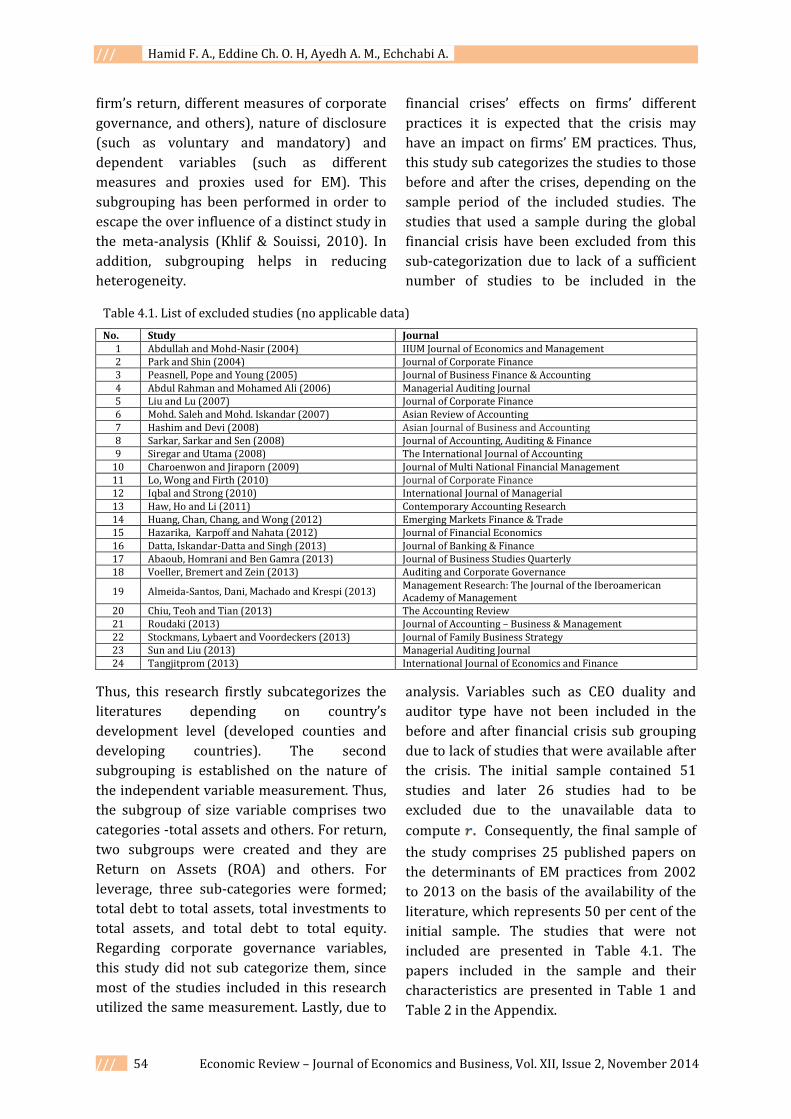
initial sample. The studies that were not
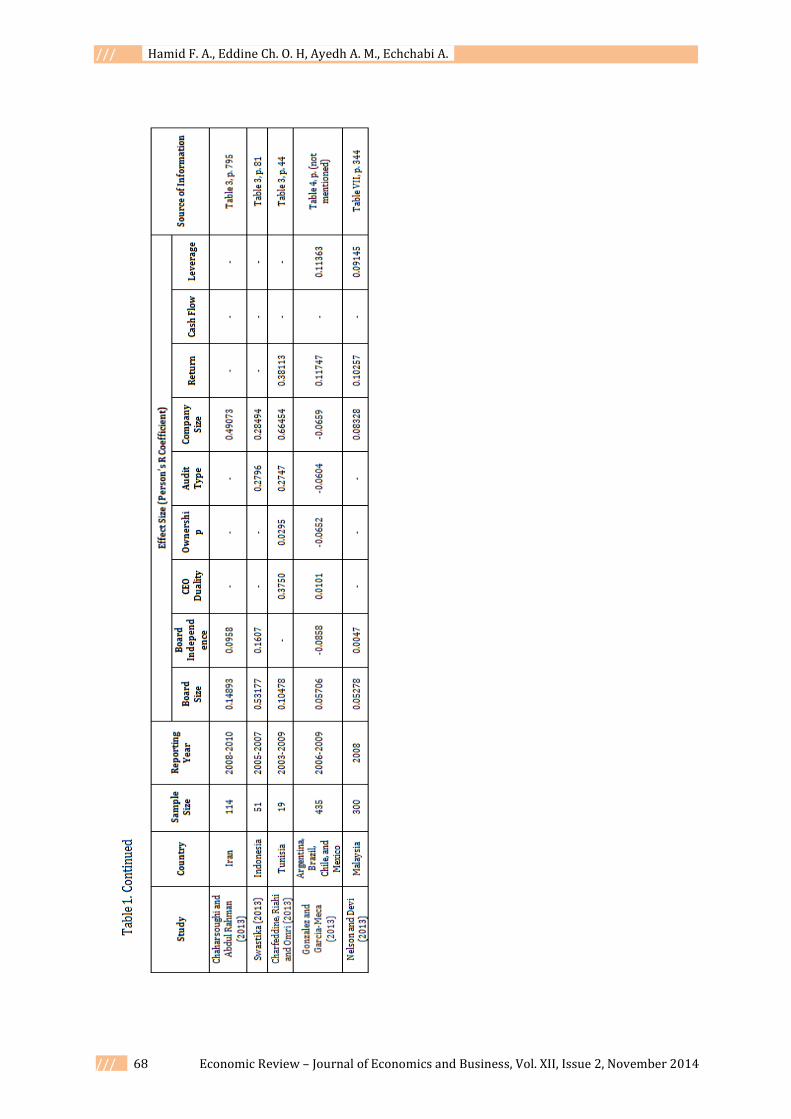
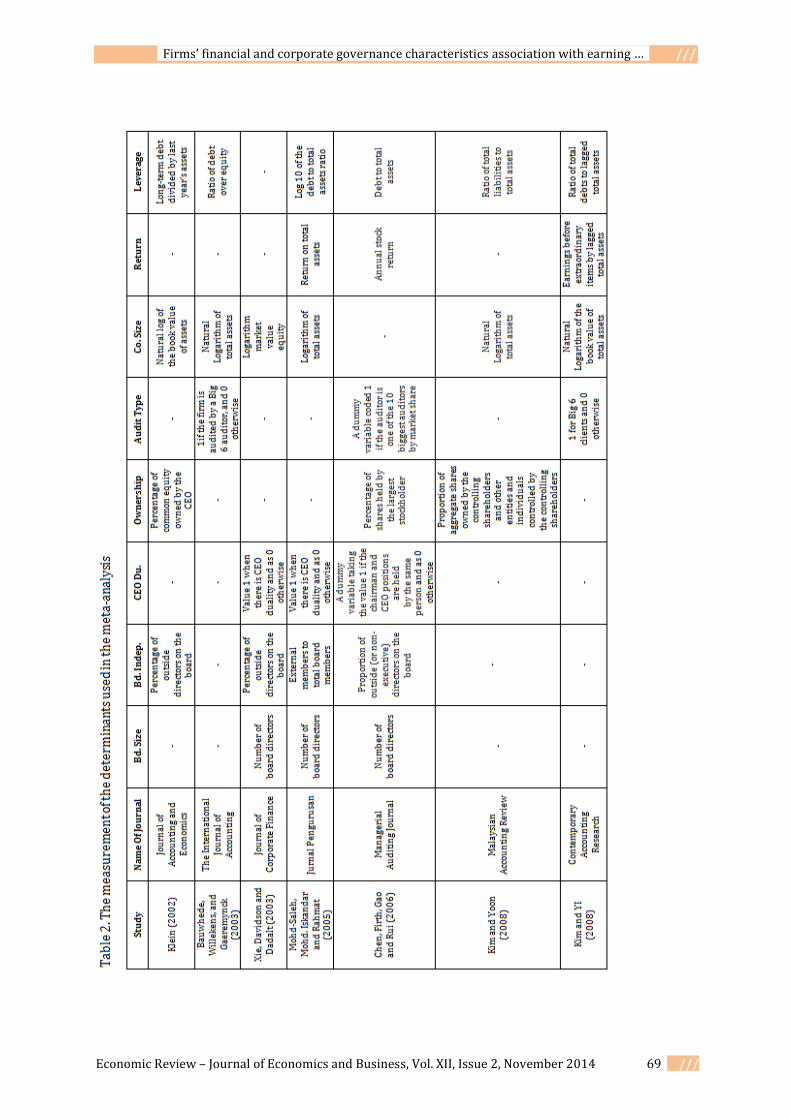
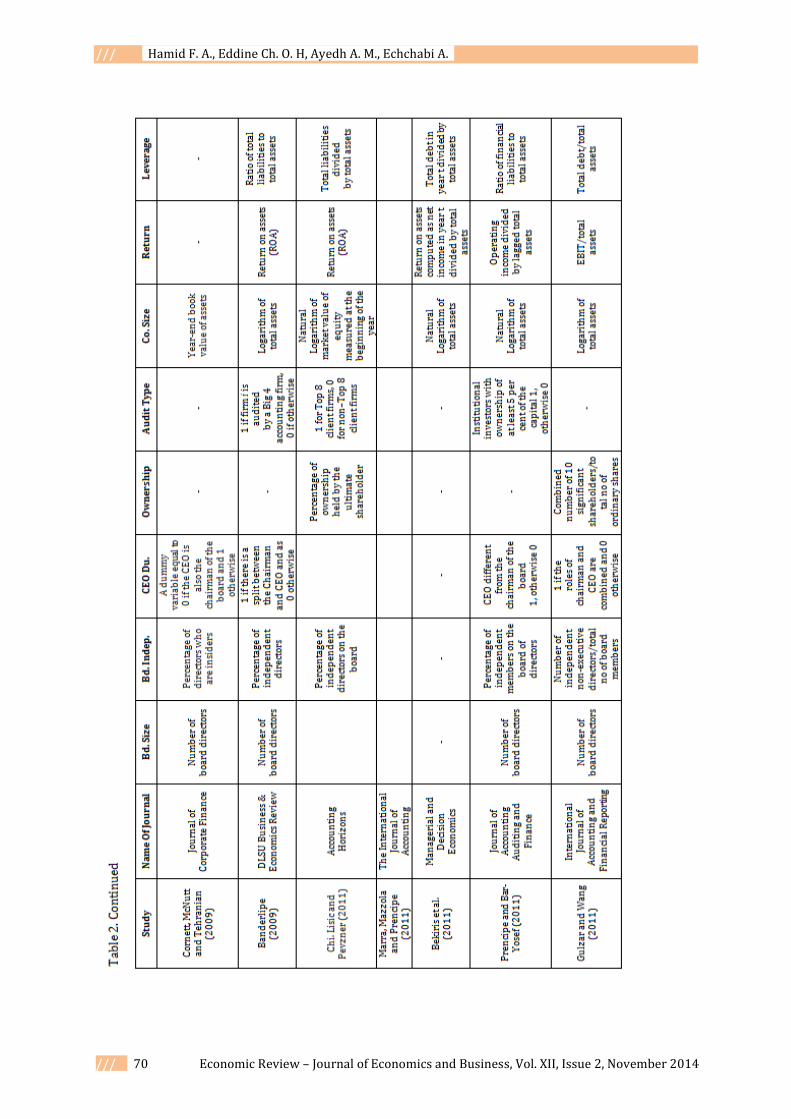
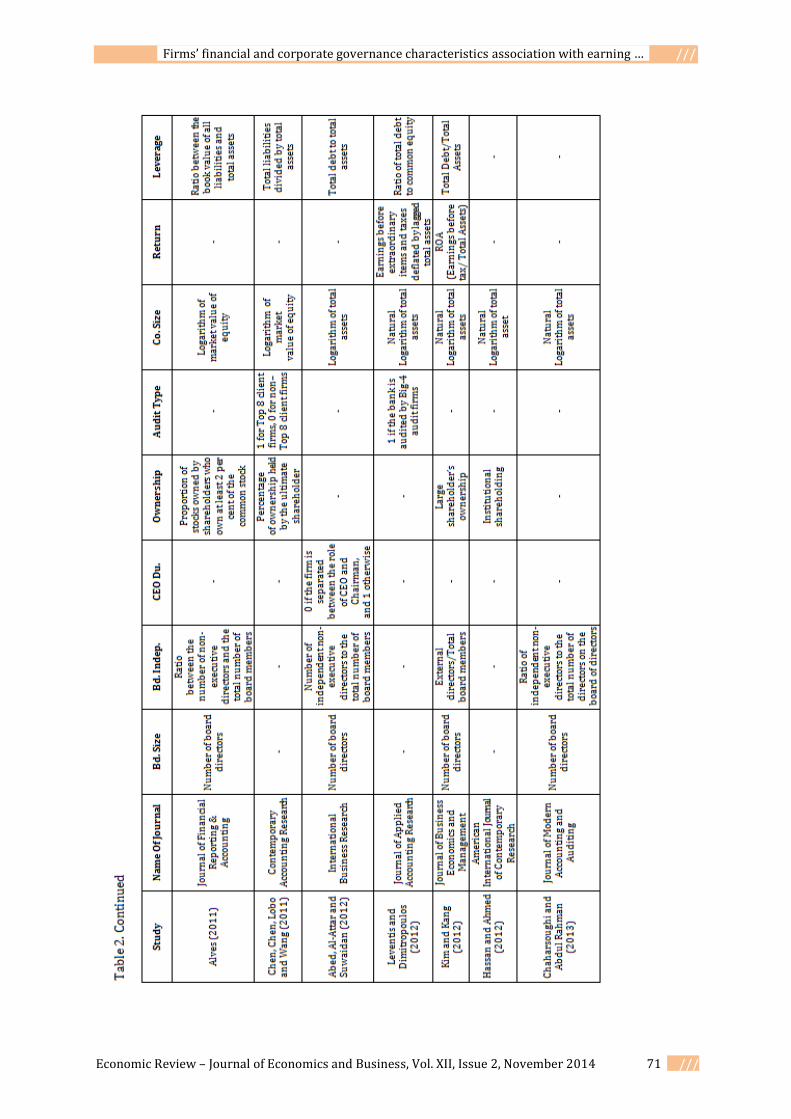
included are presented in Table 4.1. The
papers included in the sample and their
characteristics are presented in Table 1 and
Table 2 in the Appendix.
Table 4.1. List of excluded studies (no applicable data)
No. Study Journal 1 Abdullah and Mohd-Nasir (2004) IIUM Journal of Economics and Management 2 Park and Shin (2004) Journal of Corporate Finance 3 Peasnell, Pope and Young (2005) Journal of Business Finance & Accounting 4 Abdul Rahman and Mohamed Ali (2006) Managerial Auditing Journal 5 Liu and Lu (2007) Journal of Corporate Finance 6 Mohd. Saleh and Mohd. Iskandar (2007) Asian Review of Accounting 7 Hashim and Devi (2008) Asian Journal of Business and Accounting 8 Sarkar, Sarkar and Sen (2008) Journal of Accounting, Auditing & Finance 9 Siregar and Utama (2008) The International Journal of Accounting
10 Charoenwon and Jiraporn (2009) Journal of Multi National Financial Management 11 Lo, Wong and Firth (2010) Journal of Corporate Finance 12 Iqbal and Strong (2010) International Journal of Managerial 13 Haw, Ho and Li (2011) Contemporary Accounting Research 14 Huang, Chan, Chang, and Wong (2012) Emerging Markets Finance & Trade 15 Hazarika, Karpoff and Nahata (2012) Journal of Financial Economics 16 Datta, Iskandar-Datta and Singh (2013) Journal of Banking & Finance 17 Abaoub, Homrani and Ben Gamra (2013) Journal of Business Studies Quarterly 18 Voeller, Bremert and Zein (2013) Auditing and Corporate Governance
19 Almeida-Santos, Dani, Machado and Krespi (2013) Management Research: The Journal of the Iberoamerican Academy of Management
20 Chiu, Teoh and Tian (2013) The Accounting Review 21 Roudaki (2013) Journal of Accounting – Business & Management 22 Stockmans, Lybaert and Voordeckers (2013) Journal of Family Business Strategy 23 Sun and Liu (2013) Managerial Auditing Journal 24 Tangjitprom (2013) International Journal of Economics and Finance
. Firms’ financial and corporate governance characteristics association with earning … ///
Economic Review – Journal of Economics and Business, Vol. XII, Issue 2, November 2014 55 ///
5. EMPIRICAL FINDINGS
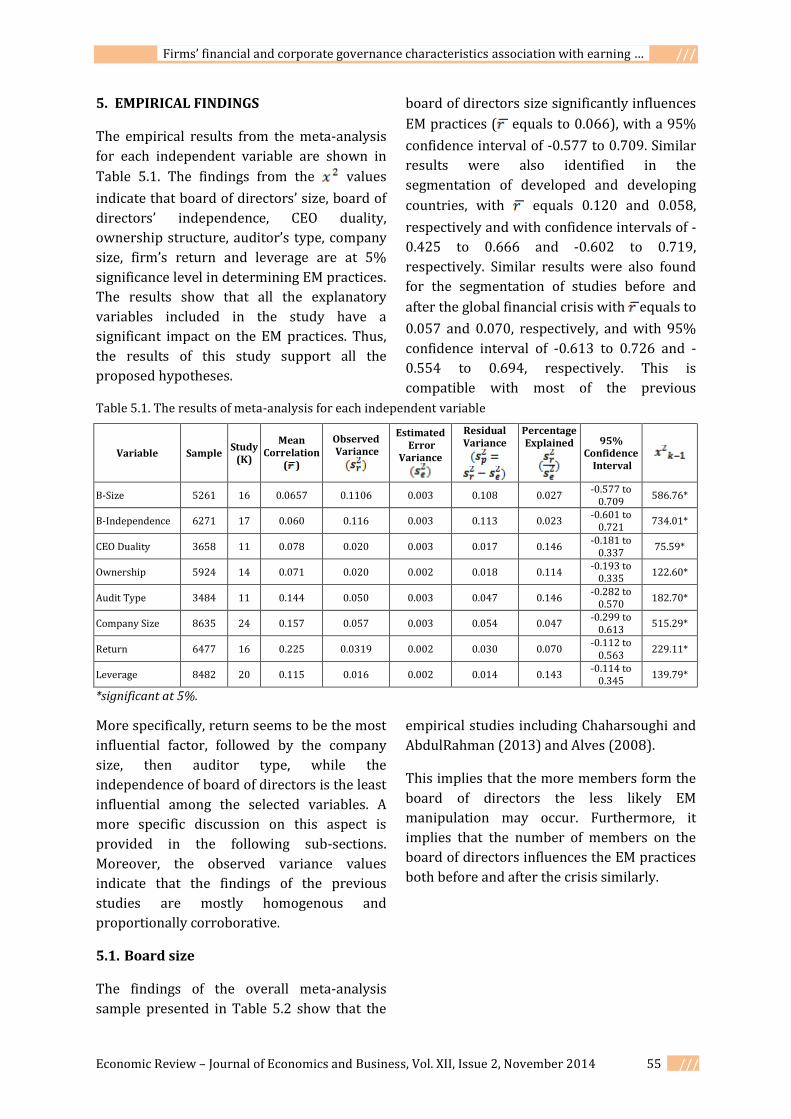
The empirical results from the meta-analysis
for each independent variable are shown in
Table 5.1. The findings from the values
indicate that board of directors’ size, board of
directors’ independence, CEO duality,
ownership structure, auditor’s type, company
size, firm’s return and leverage are at 5%
significance level in determining EM practices.
The results show that all the explanatory
variables included in the study have a
significant impact on the EM practices. Thus,
the results of this study support all the
proposed hypotheses.
More specifically, return seems to be the most
influential factor, followed by the company
size, then auditor type, while the
independence of board of directors is the least
influential among the selected variables. A
more specific discussion on this aspect is
provided in the following sub-sections.
Moreover, the observed variance values
indicate that the findings of the previous
studies are mostly homogenous and
proportionally corroborative.
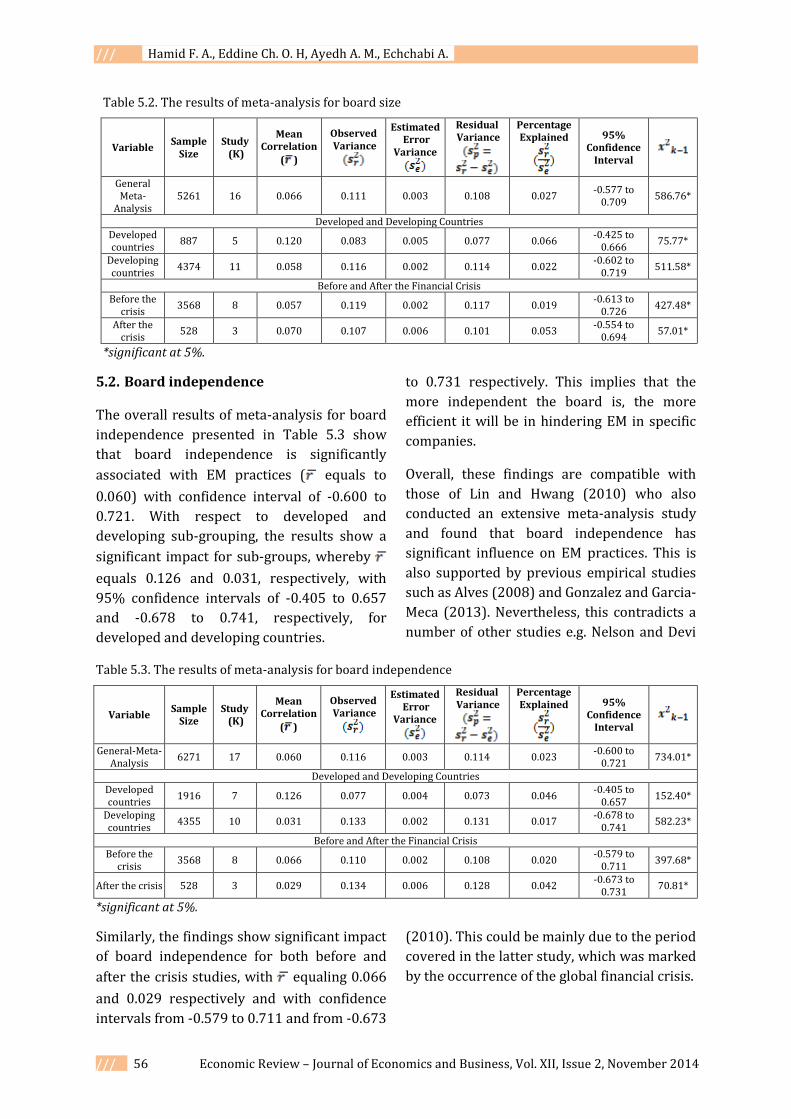
5.1. Board size
The findings of the overall meta-analysis
sample presented in Table 5.2 show that the
board of directors size significantly influences
EM practices ( equals to 0.066), with a 95%
confidence interval of -0.577 to 0.709. Similar
results were also identified in the
segmentation of developed and developing
countries, with equals 0.120 and 0.058,
respectively and with confidence intervals of -
0.425 to 0.666 and -0.602 to 0.719,
respectively. Similar results were also found
for the segmentation of studies before and
after the global financial crisis with equals to
0.057 and 0.070, respectively, and with 95%
confidence interval of -0.613 to 0.726 and -
0.554 to 0.694, respectively. This is
compatible with most of the previous
empirical studies including Chaharsoughi and
AbdulRahman (2013) and Alves (2008).
This implies that the more members form the
board of directors the less likely EM
manipulation may occur. Furthermore, it
implies that the number of members on the
board of directors influences the EM practices
both before and after the crisis similarly.
Table 5.1. The results of meta-analysis for each independent variable
Variable Sample Study
(K)
Mean Correlation
( )
Observed Variance
Estimated Error
Variance
Residual Variance
Percentage Explained
95% Confidence
Interval
B-Size 5261 16 0.0657 0.1106 0.003 0.108 0.027 -0.577 to
0.709 586.76*
B-Independence 6271 17 0.060 0.116 0.003 0.113 0.023 -0.601 to
0.721 734.01*
CEO Duality 3658 11 0.078 0.020 0.003 0.017 0.146 -0.181 to
0.337 75.59*
Ownership 5924 14 0.071 0.020 0.002 0.018 0.114 -0.193 to
0.335 122.60*
Audit Type 3484 11 0.144 0.050 0.003 0.047 0.146 -0.282 to
0.570 182.70*
Company Size 8635 24 0.157 0.057 0.003 0.054 0.047 -0.299 to
0.613 515.29*
Return 6477 16 0.225 0.0319 0.002 0.030 0.070 -0.112 to
0.563 229.11*
Leverage 8482 20 0.115 0.016 0.002 0.014 0.143 -0.114 to
0.345 139.79*
*significant at 5%.
/// . Hamid F. A., Eddine Ch. O. H, Ayedh A. M., Echchabi A. .
/// 56 Economic Review – Journal of Economics and Business, Vol. XII, Issue 2, November 2014
5.2. Board independence
The overall results of meta-analysis for board
independence presented in Table 5.3 show
that board independence is significantly
associated with EM practices ( equals to
0.060) with confidence interval of -0.600 to
0.721. With respect to developed and
developing sub-grouping, the results show a
significant impact for sub-groups, whereby
equals 0.126 and 0.031, respectively, with
95% confidence intervals of -0.405 to 0.657
and -0.678 to 0.741, respectively, for
developed and developing countries.
Similarly, the findings show significant impact
of board independence for both before and
after the crisis studies, with equaling 0.066
and 0.029 respectively and with confidence
intervals from -0.579 to 0.711 and from -0.673
to 0.731 respectively. This implies that the
more independent the board is, the more
efficient it will be in hindering EM in specific
companies.
Overall, these findings are compatible with
those of Lin and Hwang (2010) who also
conducted an extensive meta-analysis study
and found that board independence has
significant influence on EM practices. This is
also supported by previous empirical studies
such as Alves (2008) and Gonzalez and Garcia-
Meca (2013). Nevertheless, this contradicts a
number of other studies e.g. Nelson and Devi
(2010). This could be mainly due to the period
covered in the latter study, which was marked
by the occurrence of the global financial crisis.
Table 5.2. The results of meta-analysis for board size
Variable Sample
Size Study (K)
Mean Correlation
( )
Observed Variance
Estimated Error
Variance
Residual Variance
Percentage Explained
95% Confidence
Interval
General Meta-
Analysis 5261 16 0.066 0.111 0.003 0.108 0.027
-0.577 to 0.709
586.76*
Developed and Developing Countries Developed countries
887 5 0.120 0.083 0.005 0.077 0.066 -0.425 to
0.666 75.77*
Developing countries
4374 11 0.058 0.116 0.002 0.114 0.022 -0.602 to
0.719 511.58*
Before and After the Financial Crisis Before the
crisis 3568 8 0.057 0.119 0.002 0.117 0.019
-0.613 to 0.726
427.48*
After the crisis
528 3 0.070 0.107 0.006 0.101 0.053 -0.554 to
0.694 57.01*
*significant at 5%.
Table 5.3. The results of meta-analysis for board independence
Variable Sample
Size Study
(K)
Mean Correlation
( )
Observed Variance
Estimated Error
Variance
Residual Variance
Percentage Explained
95% Confidence
Interval
General-Meta- Analysis
6271 17 0.060 0.116 0.003 0.114 0.023 -0.600 to
0.721 734.01*
Developed and Developing Countries Developed countries
1916 7 0.126 0.077 0.004 0.073 0.046 -0.405 to
0.657 152.40*
Developing countries
4355 10 0.031 0.133 0.002 0.131 0.017 -0.678 to
0.741 582.23*
Before and After the Financial Crisis Before the
crisis 3568 8 0.066 0.110 0.002 0.108 0.020
-0.579 to 0.711
397.68*
After the crisis 528 3 0.029 0.134 0.006 0.128 0.042 -0.673 to
0.731 70.81*
*significant at 5%.
. Firms’ financial and corporate governance characteristics association with earning … ///
Economic Review – Journal of Economics and Business, Vol. XII, Issue 2, November 2014 57 ///
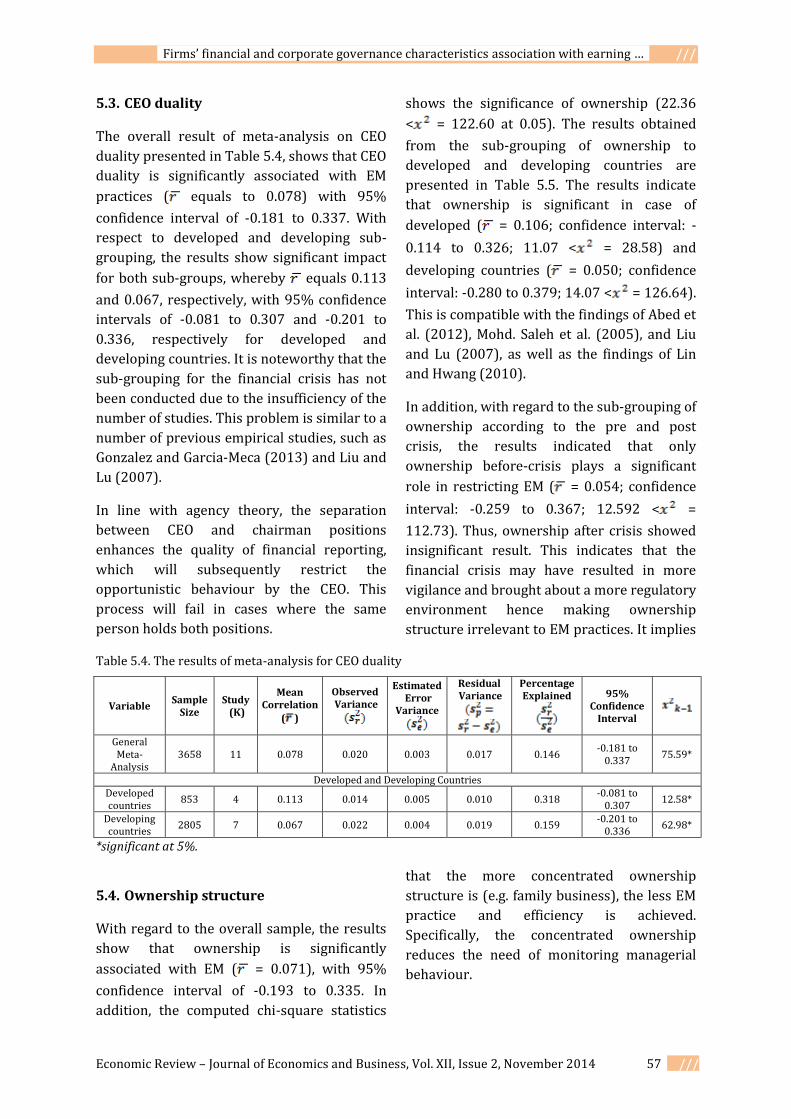
5.3. CEO duality
The overall result of meta-analysis on CEO
duality presented in Table 5.4, shows that CEO
duality is significantly associated with EM
practices ( equals to 0.078) with 95%
confidence interval of -0.181 to 0.337. With
respect to developed and developing sub-
grouping, the results show significant impact
for both sub-groups, whereby equals 0.113
and 0.067, respectively, with 95% confidence
intervals of -0.081 to 0.307 and -0.201 to
0.336, respectively for developed and
developing countries. It is noteworthy that the
sub-grouping for the financial crisis has not
been conducted due to the insufficiency of the
number of studies. This problem is similar to a
number of previous empirical studies, such as
Gonzalez and Garcia-Meca (2013) and Liu and
Lu (2007).
In line with agency theory, the separation
between CEO and chairman positions
enhances the quality of financial reporting,
which will subsequently restrict the
opportunistic behaviour by the CEO. This
process will fail in cases where the same
person holds both positions.
5.4. Ownership structure
With regard to the overall sample, the results
show that ownership is significantly
associated with EM ( = 0.071), with 95%
confidence interval of -0.193 to 0.335. In
addition, the computed chi-square statistics
shows the significance of ownership (22.36
< = 122.60 at 0.05). The results obtained
from the sub-grouping of ownership to
developed and developing countries are
presented in Table 5.5. The results indicate
that ownership is significant in case of
developed ( = 0.106; confidence interval: -
0.114 to 0.326; 11.07 < = 28.58) and
developing countries ( = 0.050; confidence
interval: -0.280 to 0.379; 14.07 < = 126.64).
This is compatible with the findings of Abed et
al. (2012), Mohd. Saleh et al. (2005), and Liu
and Lu (2007), as well as the findings of Lin
and Hwang (2010).
In addition, with regard to the sub-grouping of
ownership according to the pre and post
crisis, the results indicated that only
ownership before-crisis plays a significant
role in restricting EM ( = 0.054; confidence
interval: -0.259 to 0.367; 12.592 < =
112.73). Thus, ownership after crisis showed
insignificant result. This indicates that the
financial crisis may have resulted in more
vigilance and brought about a more regulatory
environment hence making ownership
structure irrelevant to EM practices. It implies
that the more concentrated ownership
structure is (e.g. family business), the less EM
practice and efficiency is achieved.
Specifically, the concentrated ownership
reduces the need of monitoring managerial
behaviour.
Table 5.4. The results of meta-analysis for CEO duality
Variable Sample
Size Study
(K)
Mean Correlation
( )
Observed Variance
Estimated Error
Variance
Residual Variance
Percentage Explained
95% Confidence
Interval
General Meta-
Analysis 3658 11 0.078 0.020 0.003 0.017 0.146
-0.181 to 0.337
75.59*
Developed and Developing Countries Developed countries
853 4 0.113 0.014 0.005 0.010 0.318 -0.081 to
0.307 12.58*
Developing countries
2805 7 0.067 0.022 0.004 0.019 0.159 -0.201 to
0.336 62.98*
*significant at 5%.

/// . Hamid F. A., Eddine Ch. O. H, Ayedh A. M., Echchabi A. .
/// 58 Economic Review – Journal of Economics and Business, Vol. XII, Issue 2, November 2014
5.5. Auditor type
The findings of meta-analysis on the overall
sample presented in Table 5.6 show that
auditor type is significantly associated with
EM ( = 0.144), with 95% confidence interval
of -0.282 to 0.570. In addition, the computed
chi-square statistics shows the significance of
size (18.307 < = 182.70 at 0.05). The
findings of sub-grouping by developed and
developing countries also proved to be
significant in case of developed ( = 0.086;
confidence interval: -0.149 to 0.321; 9.488
< = 24.74) and developing countries ( =
0.181; confidence interval: -0.330 to 0.692;
11.070 < = 161.17).
It is noteworthy that the analysis segmenting
the studies of pre and post crisis was not
conducted due to the insufficiency of the
corresponding studies.
These findings are similar to the findings by
Swastika (2013) and Kim and Yi (2006), and
also in the meta-analysis study by Lin and
Hwang (2010). This implies that big auditing
firms (6-8) have more resources to mitigate
EM practices than other firms do.
5.6. Company size
The overall meta-analysis results of company
size presented in Table 5.7 show that
company size is significantly associated with
Table 5.5. The results of meta-analysis for ownership structure
Variable Sample
Size Study (K)
Mean Correlation
( )
Observed Variance
Estimated Error
Variance
Residual Variance
Percentage Explained
95% Confidence
Interval
General Meta-
Analysis 5924 14 0.071 0.020 0.002 0.018 0.114
-0.193 to 0.335
122.60*
Developed and Developing Countries Developed countries
1750 6 0.106 0.016 0.003 0.013 0.210 -0.114 to
0.326 28.58*
Developing countries
4174 8 0.050 0.030 0.002 0.028 0.063
-0.280 to 0.379
126.64*
Before and After the Financial Crisis Before the
crisis 4128 7 0.054 0.027 0.002 0.025 0.062
-0.259 to 0.367 112.73*
After the crisis
139 2 0.320 0.014 0.012 0.003 0.803 0.215 to
0.424 2.491
*significant at 5%.
Table 5.6. The results of meta-analysis for auditor type
Variable Sample
Size Study (K)
Mean Correlation
( )
Observed Variance
Estimated Error
Variance
Residual Variance
Percentage Explained
95% Confidence
Interval
General Meta-
Analysis 3484 11 0.144 0.050 0.003 0.047 0.146
-0.282 to 0.570
182.70*
Developed and Developing Countries
Developed countries
1348 5 0.086 0.018 0.004 0.014 0.202 -0.149 to
0.321 24.74*
Developing countries
2136 6 0.181 0.071 0.003 0.068 0.037 -0.330 to
0.692 161.17*
*significant at 5%.

. Firms’ financial and corporate governance characteristics association with earning … ///
Economic Review – Journal of Economics and Business, Vol. XII, Issue 2, November 2014 59 ///
EM ( = 0.157), with 95% confidence interval
of -0.299 to 0.613. The results obtained from
the sub-grouping of company size to
developed and developing countries indicate
that company size is significant in the case of
both developed ( = 0.131; confidence
interval: -0.044 to 0.307; 18.307 < = 31.25)
and developing countries ( = 0.143;
confidence interval: -0.384 to 0.670; 21.026
< = 479.06). This is similar to the findings
by Leventis and Dimitropoulos (2012) and
Cornett et al. (2009).
In addition, the results of sub-grouping
according to the measurement by total assets
indicate significant relationship with EM
practices ( = 0.157; confidence interval: -
0.340 to 0.653; 30.144 < = 502.40 ( =
0.158; confidence interval: -0.091 to 0.429;
7.815 < = 12.84).
Furthermore, with regard to the sub-grouping
of company size according to before and after
the crisis, the results indicated that company
size is significantly associated with EM before
the crisis ( = 0.091; confidence interval: -
0.121 to 0.304; 16.919 < = 69.69), and after
the crisis ( = 0.169; confidence interval: -
0.091 to 0.429; 9.488 < = 16.35).
This implies that larger companies possess
more resources, which leads to applying
different monitoring mechanisms for
company’s performance and reporting. Thus,
company size leads to less EM practices.
5.7. Return
The results of meta-analysis of the overall
sample presented in Table 5.8 indicate that
returns of a firm are a significant determinant
of EM ( = 0.225), with 95% confidence
interval of -0.112 to 0.563. Moreover, chi-
square statistics results point out the
significance of return (24.996 < = 229.11 at
0.05). In terms of sub-grouping, it was found
that return is a significant determinant for EM
in both developed and developing countries
( = 0.145 and = 0.304; confidence interval:
-0.091 to 0.382 and-0.106 to 0.713; 12.592
< = 31.54 and 15.507 < = 266.53
respectively). This is similar to the findings by
Gonzalez and Garcia-Meca (2013) and Nelson
and Devi (2010).
Table 5.7. The results of meta-analysis for company size
Variable Sample
Size Study (K)
Mean Correlation
( )
Observed Variance
Estimated Error
Variance
Residual Variance
Percentage Explained
95% Confidence
Interval
General Meta-
Analysis 8635 24 0.157 0.057 0.003 0.054 0.047
-0.299 to 0.613
515.29*
Developed and Developing Countries Developed countries
2447 11 0.131 0.012 0.004 0.008 0.352 -0.044 to
0.307 31.25*
Developing countries
6188 13 0.143 0.074 0.002 0.072 0.027
-0.384 to 0.670
479.06*
Measurement of Company’s Size Total
Assets 7149 20 0.157 0.067 0.003 0.064 0.040
-0.340 to 0.653
502.40*
Total Sales
1486 4 0.158 0.008 0.003 0.006 0.312 0.011 to
0.305 12.84*
Before and After the Financial Crisis Before the
crisis 5013 10 0.091 0.014 0.002 0.012 0.143
-0.121 to 0.304
69.69*
After the crisis
608 5 0.169 0.025 0.008 0.018 0.306 -0.091 to
0.429 16.35*
*significant at 5%.

/// . Hamid F. A., Eddine Ch. O. H, Ayedh A. M., Echchabi A. .
/// 60 Economic Review – Journal of Economics and Business, Vol. XII, Issue 2, November 2014
Regarding the measurement of return by sub-
grouping, it was found that the EM level has a
significant association only with ROA ( =
0.281; confidence interval: -0.110 to 0.672;
chi-square 21.026 < = 289.94). Finally, the
findings of meta-analysis categorisation with
respect to the global financial crisis show that
only return was significantly associated with
EM practices before the financial crisis ( =
0.322), with 95% confidence interval of -0.129
to 0.772 and chi-square of 14.067 < =
300.99 at 0.05.
This relation implies that the higher firm’s
return ratio is, the more likely EM is practiced.
This can be explained by the fact that
managers usually practice income smoothing.
Furthermore, this can also be attributed to the
political cost theory, whereby in the case of
high return, the company is required to pay
more tax to the government, which is usually
undesired by managers and CEOs alike.
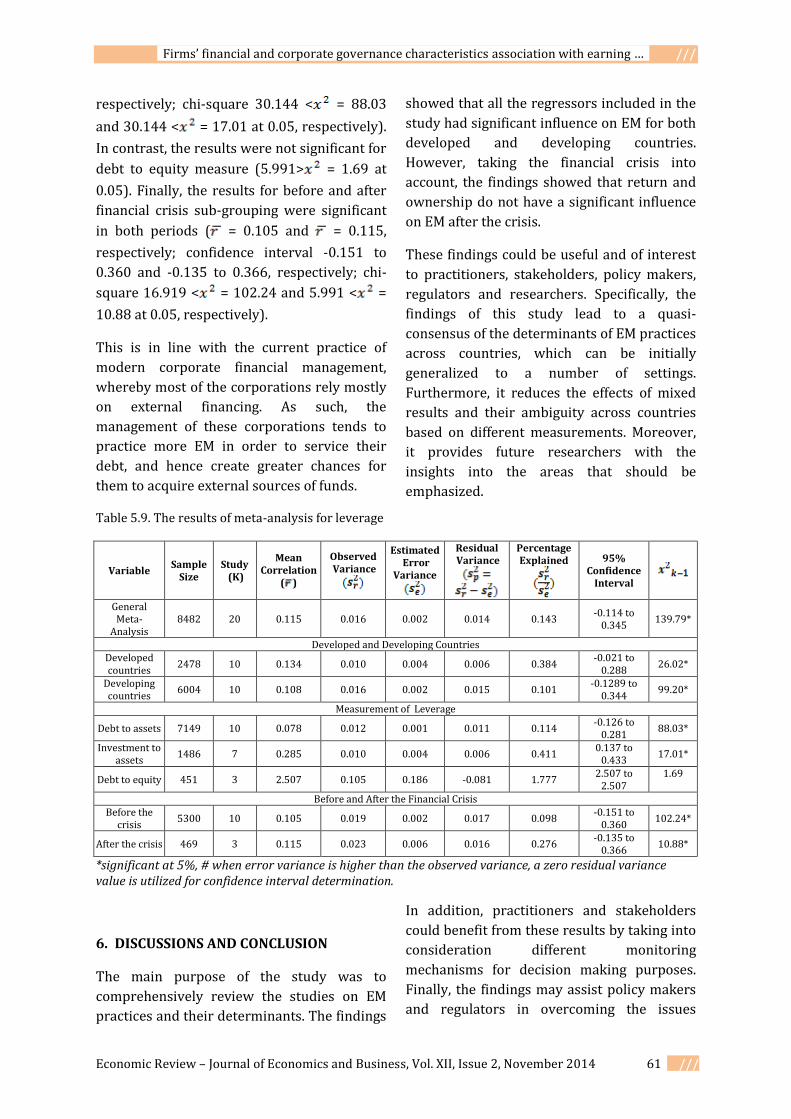
5.8. Leverage
The results of the meta-analysis general
sample, shown in Table 5.9 revealed that
leverage is significantly associated with EM
practices ( = 0.115), with 95% confidence
interval of -0.114 to 0.345. Additionally, the
chi-square statistics demonstrate the
significance of leverage (30.144 < = 139.79
at 0.05).
The results of the sub-grouping of developed
and developing countries were also similar to
the general meta-analysis results, whereby
leverage was significant for both developed
and developing countries ( = 0.134 and =
0.108, respectively; confidence interval -0.021
to 0.288 and 0.137 to 0.433, respectively; chi-
square 30.144 < = 26.02 and 30.144 < =
99.20 at 0.05, respectively). This is compatible
with earlier studies, such as Leventis and
Dimitropoulos (2012) Nelson and Devi
(2010), and Bekiris and Doukakis (2011).
With respect to the sub-grouping
measurement for leverage, the findings show
that both debt to assets and investments to
assets measurements are significantly
associated with the level of EM practices ( =
0.078 and = 0.285, respectively; confidence
interval -0.126 to 0.281 and 0.137 to 0.433,
Table 5.8. The results of meta-analysis for company’s return
Variable Sample
Size Study
(K)
Mean Correlation
( )
Observed Variance
Estimated Error
Variance
Residual Variance
Percentage Explained
95% Confidence
Interval
General Meta-
Analysis 6477 16 0.225 0.0319 0.0022 0.0296 0.0698
-0.112 to 0.563
229.11*
Developed and Developing Countries
Developed countries
1616 7 0.145 0.019 0.004 0.015 0.222 -0.091 to
0.382 31.54*
Developing countries
4861 9 0.304 0.045 0.002 0.044 0.034 -0.106 to
0.713 266.53*
Measurement of Company’s return
ROA 5898 13 0.281 0.042 0.002 0.040 0.045 -0.110 to
0.672 289.49*
Others 579 3 0.096 0.009 0.005 0.004 0.565 -0.027 to
0.218 5.30
Before and After the Financial Crisis
Before the crisis
4433 8 0.322 0.055 0.002 0.053 0.033 -0.129 to
0.772 300.99*
After the crisis 469 3 0.148 0.005 0.010 -0.005 2.084 0.148 to
0.148 2.40
*significant at 5%.
. Firms’ financial and corporate governance characteristics association with earning … ///
Economic Review – Journal of Economics and Business, Vol. XII, Issue 2, November 2014 61 ///
respectively; chi-square 30.144 < = 88.03
and 30.144 < = 17.01 at 0.05, respectively).
In contrast, the results were not significant for
debt to equity measure (5.991> = 1.69 at
0.05). Finally, the results for before and after
financial crisis sub-grouping were significant
in both periods ( = 0.105 and = 0.115,
respectively; confidence interval -0.151 to
0.360 and -0.135 to 0.366, respectively; chi-
square 16.919 < = 102.24 and 5.991 < =
10.88 at 0.05, respectively).
This is in line with the current practice of
modern corporate financial management,
whereby most of the corporations rely mostly
on external financing. As such, the
management of these corporations tends to
practice more EM in order to service their
debt, and hence create greater chances for
them to acquire external sources of funds.
6. DISCUSSIONS AND CONCLUSION
The main purpose of the study was to
comprehensively review the studies on EM
practices and their determinants. The findings
showed that all the regressors included in the
study had significant influence on EM for both
developed and developing countries.
However, taking the financial crisis into
account, the findings showed that return and
ownership do not have a significant influence
on EM after the crisis.
These findings could be useful and of interest
to practitioners, stakeholders, policy makers,
regulators and researchers. Specifically, the
findings of this study lead to a quasi-
consensus of the determinants of EM practices
across countries, which can be initially
generalized to a number of settings.
Furthermore, it reduces the effects of mixed
results and their ambiguity across countries
based on different measurements. Moreover,
it provides future researchers with the
insights into the areas that should be
emphasized.
In addition, practitioners and stakeholders
could benefit from these results by taking into
consideration different monitoring
mechanisms for decision making purposes.
Finally, the findings may assist policy makers
and regulators in overcoming the issues
Table 5.9. The results of meta-analysis for leverage
Variable Sample
Size Study
(K)
Mean Correlation
( )
Observed Variance
Estimated Error
Variance
Residual Variance
Percentage Explained
95% Confidence
Interval
General Meta-
Analysis 8482 20 0.115 0.016 0.002 0.014 0.143
-0.114 to 0.345
139.79*
Developed and Developing Countries Developed countries
2478 10 0.134 0.010 0.004 0.006 0.384 -0.021 to
0.288 26.02*
Developing countries
6004 10 0.108 0.016 0.002 0.015 0.101 -0.1289 to
0.344 99.20*
Measurement of Leverage
Debt to assets 7149 10 0.078 0.012 0.001 0.011 0.114 -0.126 to
0.281 88.03*
Investment to assets
1486 7 0.285 0.010 0.004 0.006 0.411 0.137 to
0.433 17.01*
Debt to equity 451 3 2.507 0.105 0.186 -0.081 1.777 2.507 to
2.507 1.69
Before and After the Financial Crisis
Before the crisis
5300 10 0.105 0.019 0.002 0.017 0.098 -0.151 to
0.360 102.24*
After the crisis 469 3 0.115 0.023 0.006 0.016 0.276 -0.135 to
0.366 10.88*
*significant at 5%, # when error variance is higher than the observed variance, a zero residual variance value is utilized for confidence interval determination.

/// . Hamid F. A., Eddine Ch. O. H, Ayedh A. M., Echchabi A. .
/// 62 Economic Review – Journal of Economics and Business, Vol. XII, Issue 2, November 2014
emerging due to EM practices, which persist
even after the latest global financial crisis.
Even though the current study has brought
about certain contributions, it still suffers
from a number of limitations which could be
improved in future studies. Firstly, the study
has included a limited number of corporate
governance attributes. Thus future studies are
recommended to consider more corporate
governance attributes such as audit
committee, internal auditing, etc. Secondly,
some variables can be measured by different
proxies, such as ownership concentration and
return. Hence, future studies are
recommended to consider all these
measurements for more comprehensive
results. Thirdly, a limited number of studies
have been included in the study, since many
prior studies were excluded due to non-
availability of data. Thus in future, as more
studies are conducted on corporate
governance variables and their impact on EM
and the literature grows along with the
measures used in meta-analysis, future
studies would have more data in order to
refine the findings of this study. Finally, this
study uses meta-analysis based on Hunter et
al. (1982) but ignored the Stouffer combined
metal-analysis test as applied by Lin and
Huang (2010). Hence, future studies are
recommended to apply both methods to
compare or confirm the findings from both
methods.
REFERENCES
1. Abaoub, E., Homrani, K. & Ben Gamra, S.
(2013). The determinants of earnings
management: Empirical evidence in the
Tunisian banking industry (1999-2010).
Journal of Business Studies Quarterly.
4(3), pp. 63-73.
2. Abdul Rahman, R. & Mohamed Ali, F.H.
(2006). Board, audit committee, culture
and earning management: Malaysian
evidence. Managerial Auditing Journal.
21(7), pp. 783-804.
3. Abdullah, S. & Mohd. Nasir, N. (2004).
Accrual management and the
independence of board of directors and
audit committees. IIUM Journal of
Economics and Management. 12(1), pp.
1-31.
4. Abed, S., Al-Attar, A. & Suwaidan, M.
(2012). Corporate governance and
earnings management: Jordanian
evidence. International Business
Research. 5(1), pp. 216-225.
5. Ahmed, K. & Courtis, J.K. (1999).
Association between corporate
characteristics and disclosure levels in
annual reports: A meta-analysis. British
Accounting Review. 31, pp. 35-61.
6. Almeida-Santos, P., Dani, C., Machado, D.
& Krespi, N. (2013). Influence of family
control in the practice of earnings
management: The case of open Brazilian
companies. Management Research: The
Journal of the Iberoamerican Academy of
Management. 11(1), pp. 77-99.
7. Alves, S.M. (2011). The effect of board
structure on earnings management:
Evidence from Portugal. Journal of
Financial Reporting and Accounting.
9(2), pp. 141-160.
8. Banderlipe, M.S. (2009). The impact of
selected corporate governance variables
in mitigating earning management in
Philippines. DLSU Business and
Economic Review. 19(1), pp. 17-27.
9. Bauwhede, H.V., Willekens, M. &
Gaeremynck, A. (2003). Audit firm size,
public ownership, and firms’
discretionary accruals management. The
International Journal of Accounting. 38,
pp. 1-22.
. Firms’ financial and corporate governance characteristics association with earning … ///
Economic Review – Journal of Economics and Business, Vol. XII, Issue 2, November 2014 63 ///
10. Bekiris, F.V. & Doukakis, L.C. (2011).
Corporate governance and accruals
earnings management. Managerial and
Decision Economics. 32, pp. 439-456.
11. Chaharsoughi, M.T. & Abdul Rahman, R.
(2013). Corporate governance and
earnings quality: The experience of
listed companies in Iran. Journal of
Modern Accounting and Auditing. 9(6),
pp. 790-797.
12. Charfeddine, L., Riahi, R. & Omri, A.
(2013). The determinants of earnings
management in developing countries: A
study in the Tunisian context. The IUP
Journal of Corporate Governance. XII(1),
pp. 35-49.
13. Charoenwong, C. & Jiraporn, P. (2009).
Earnings management to exceed
thresholds: Evidence from Singapore
and Thailand. Journal of Multinational
Financial Management. 19, pp. 221-236.
14. Chen, G., Firth, M., Gao, D.N. & Rui, O.M.
(2006). Ownership structure, corporate
governance, and fraud: Evidence from
China. Journal of Corporate Finance. 12,
pp. 424-448.
15. Chen, H., Chen, J.Z., Lobo, G.J. & Wang, Y.
(2011). Effects of audit quality on
earnings management and cost of equity
capital: Evidence from China.
Contemporary Accounting Research.
28(3), pp. 892-925.
16. Chi, W., Lisic, L.L. & Pevzner, M. (2011).
Is enhanced audit quality associated
with greater real earnings
management? Accounting Horizons.
25(2), pp. 315-335.
17. Chiu, P., Teoh, S. & Tian, F. (2013).
Board interlocks and earnings
management contagion. The Accounting
Review. 88(3), pp. 915-944.
18. Cornett, M.M., McNutt, J.J. & Tehranian,
H. (2009). Corporate governance and
earnings management at large U.S. bank
holding companies. Journal of Corporate
Finance. 15, pp. 412–430.
19. Datta, S., Iskandar-Datta, M. & Singh, V.
(2013). Product market power, industry
structure, and corporate earnings
management. Journal of Banking and
Finance. 37, pp. 3273-3285.
20. Garcia-Meca, E. & Sanchez-Ballesta, J.
(2009). Corporate governance and
earnings management: A meta-analysis.
Corportate Governance: An International
Review. 17(5), pp. 594-610.
21. Glass, G. (1976). Primary seondary and
metal analysis of results. Educational
Researcher. 5, pp. 3-8.
22. Gonzalez, J.S. & Garcia-Meca, E. (2013).
Does corporate governance influence
earnings management in Latin
American markets? Journal of Business
Ethics. xx(xx), pp. xx-xx.
23. Gulzar, M.A. & Wang, Z. (2011).
Corporate finance characteristics and
earnings management: Empirical
evidence from Chinese listed forms.
International Journal of Accounting and
Financial Reporting. 1(1), pp. 133-151.
24. Hashim, H.A. & Devi, S.S. (2008). Board
independence, CEO duality, and accrual
management: Malaysian evidence. Asian
Journal of Business and Accounting. 1(1),
pp. 27-46.
25. Hassan, S.U. & Ahmed, A. (2012).
Corporate governance, earnings
management and financial performance:
A case of Nigerian manufacturing firms.
American International Journal of
Contemporary Research. 2(7), pp. 214-
226.
/// . Hamid F. A., Eddine Ch. O. H, Ayedh A. M., Echchabi A. .
/// 64 Economic Review – Journal of Economics and Business, Vol. XII, Issue 2, November 2014
26. Haw, I., Ho, S. & Li, A. (2011). Corporate
governance and earnings management
by classification shifting. Contemporary
Accounting Research. 28(2), pp. 517-
553.
27. Hazarika, S., Karpoff, J. & Nahata, R.
(2012). Internal corporate governance,
CEO turnover, and earnings
management. Journal of Financial
Economics. 104, pp. 44-69.
28. Healey, P.M. & Wahlen, J.M. (1999). A
review of earning management
literature and its implications for
standard setting. American Accounting
Association Accounting Horizons. 13(4),
pp. 365-383.
29. Huang, H.-H., Chan, M.-L., Chang, C.H. &
Wong, J.L. (2012). Is corporate
governance related to the conservatism
in management earnings forecasts?
Emerging Markets Finance and Trade.
48(2), pp. 105-121.
30. Hunter, J.E., Schmidt, F L, & Jackson, G.B.
(1982). Cumulating Research Findings
Across Studies. Beverly Hills CA: Sage
Publications.
31. Hw, I.M., Ho, S.S. & Li, A.Y. (2011).
Corporate governance and earnings
management by classification shifting.
Contemporary Accounting Research.
28(2), pp. 517-553.
32. Iqbal, A., & Strong, N. (2010). The efffect
of corporate governance on earning
management around UK rights issues.
International Journal of Managerial
Finance. 6(3), pp. 168-189.
33. Kang, S.A. & Kim, Y.S. (2012). Effect of
corproate governance on real activity-
based earnings management: Evidence
from Korea. Journal of Business
Economics and Management. 13(1), pp.
29-52.
34. Khlif, H. & Souissi, M. (2010). The
determinants of corporate disclosure: A
meta-analysis. International Journal of
Accounting and Information
Management. 18(3), pp. 198-219.
35. Kim, H.J. & Yoon, S.S. (2008). The impact
of corporate governance on earning
management in Korea. Malaysian
Accounting Review. 7(1), pp. 43-49.
36. Kim, J.B. & Yi, C.H. (2006). Ownership
structure, business group affiliation,
listing status and earnings management:
Evidence from Korea. Contemporary
Accounting Research. 23(2), pp. 427-
464.
37. Klein, A. (2002). Audit committee, board
of director characteristics, and earning
management. Journal of Accounting and
Economics. 33, pp. 375-400.
38. Leventis, S. & Dimitropoulos, P. (2012).
The role of corporate governance in
earnings management: Experience from
US banks. Journal of Appplied Accounting
Research. 13(2), pp. 161-177.
39. Lin, J.W. & Hwang, M.I. (2010). Audit
quality, corporate governance, and
earnings management: A meta-analysis.
International Journal of Auditing. 14, pp.
57-77.
40. Liu, Q. & Lu, Z.J. (2007). Corporate
governance and earning management in
the Chinese listed companies: A
tunnelling perspective. Journal of
Corporate Finance. 13, pp. 881-906.
41. Lo, A.W., Wong, R.M. & Firth, M. (2010).
Can corporate governance deter
management from manipulating
earnings? Evidence from related-sales
transactions in China. Journal of
Corporate Finance. 16, pp. 225-235.
42. Marra, A., Mazzola, P. & Prencipe, A.
(2011). Board monitoring and earnings

. Firms’ financial and corporate governance characteristics association with earning … ///
Economic Review – Journal of Economics and Business, Vol. XII, Issue 2, November 2014 65 ///
management Pre- and Post-IFRS. The
International Journal of Accounting. 46,
pp. 205-230.
43. Mohd. Saleh, N. & Mohd. Iskandar, T.
(2007). Audit committee characteristics
and earning management: Evidence
from Malaysia. Asian Review of
Accounting. 15(2), pp. 147-163.
44. Mohd. Saleh, N., Mohd. Iskandar, T. &
Rahmat, M. (2005). Earning
management and board characteristics:
Evidence from Malaysia. Journal
Pengurusan. 24, pp. 77-103.
45. Nelson, S.P. & Devi, S. (2013). Audit
committee experts and earnings quality.
Corporate Governance. 13(4), pp. 335-
351.
46. Park, Y.W. & Shin, H.H. (2004). Board
compensation and earning management
in Canada. Journal of Coporate Finance.
10, pp. 431-457.
47. Peasnell, K.V., Pope, P.F. & Young, S.
(2005). Board monitoring and earnings
management: Do outside directors
influence abnormal accruals? Journal of
Business Finance and Accounting. 32(7),
pp. 1311-1346.
48. Prencipe, A. & Bar-Yosef, S. (2011).
Corporate governance and earnings
management in family-controlled
companies. Journal of Accounting,
Auditing and Finance. 26, pp. 199-227.
49. Roudaki, J. (2013). Earnings
management in developing countries:
Iranian listed companies. Journal of
Accounting Business and Management.
20(2), pp. 14-32.
50. Sarkar, J., Sarkar, S. & Sen, K. (2009).
Board of directors and opportunistics
earnings management: Evidence from
India. Journal of Accounting Auditing and
Finance. 23(4), pp. 517-551.
51. Siregar, S.V. & Utama, S. (2008). Type of
earning management and the effect of
ownership structure, firm size, and
corporate governance practices:
Evidence from Indonesia. International
Journal of Accounting. 43, pp. 1-27.
52. Stockmans, A., Lybaert, N. &
Voordeckers, W. (2013). The conditional
nature of board characteristics in
constraining earnings management in
private family firms. Journal of Family
Business Strategy. xx(xx), pp. xx-xx.
53. Sun, J. & Lu, J. (2013). Auditor industry
specialisation, board governance and
earnings maangement. Managerial
Auditing Journal. 28(1), pp. 45-64.
54. Swastika, D.L. (2013). Corporate
Governance, firm size, and earning
management: Evidence in Indonesia
stock exchange. IOSR Journal of Business
and Management. 10(4), pp. 77-82.
55. Tanjitprom, N. (2013). The role of
corporate governance in reducing
negative effect of earning management.
International Journal of Economics and
Finance. 5(3), pp. 213-220.
56. Voeller, D., Bremert, M. & Zein, N.
(2013). Interdependencies between
auditing and corporate governance –
Evidence from Germany. Auditing and
Corporate Governance. 65, pp. 198-226.
57. Xie, B., Davidson, W.N. & Dadalt, P.J.
(2003). Earnings management and
corporate governance: the role of the
board and the audit committee. Journal
of Corporate Finance. 9, pp. 295-316.

/// . Hamid F. A., Eddine Ch. O. H, Ayedh A. M., Echchabi A. .
/// 66 Economic Review – Journal of Economics and Business, Vol. XII, Issue 2, November 2014

. Firms’ financial and corporate governance characteristics association with earning … ///
Economic Review – Journal of Economics and Business, Vol. XII, Issue 2, November 2014 67 ///
/// . Hamid F. A., Eddine Ch. O. H, Ayedh A. M., Echchabi A. .
/// 68 Economic Review – Journal of Economics and Business, Vol. XII, Issue 2, November 2014
. Firms’ financial and corporate governance characteristics association with earning … ///
Economic Review – Journal of Economics and Business, Vol. XII, Issue 2, November 2014 69 ///
/// . Hamid F. A., Eddine Ch. O. H, Ayedh A. M., Echchabi A. .
/// 70 Economic Review – Journal of Economics and Business, Vol. XII, Issue 2, November 2014
. Firms’ financial and corporate governance characteristics association with earning … ///
Economic Review – Journal of Economics and Business, Vol. XII, Issue 2, November 2014 71 ///

/// . Hamid F. A., Eddine Ch. O. H, Ayedh A. M., Echchabi A. .
/// 72 Economic Review – Journal of Economics and Business, Vol. XII, Issue 2, November 2014


![ETABS [Qaemi Hamid]](https://img.pdfslide.us/doc/110x75/55cf8673550346484b97c22c/etabs-qaemi-hamid.jpg)