Embed Size (px)
Citation preview

FP7-ICT-2009-5 WiserBAN (257454) D5.2 v7
This project is funded by the European Commission under the 7th
Research Framework Programme.
WiserBAN
Project Acronym: WiserBAN
Project Title: Smart miniature low-power wireless microsystem for Body Area Networks
Call: FP7-ICT-2009-5, Collaborative project
Grant Agreement no.: 257454
Project Duration: 36 months
Coordinator: CSEM
Beneficiaries:
CSEM Centre Suisse D’Electronique et de Microtechnique SA – Recherche et Development
CSEM CH
Commissariat a L’Energie Atomique et aux Energies Alternatives CEA FR
Fraunhofer-Gesellschaft zur Foerderung der Angewandten Forschung E.V.
FRAUNHOFER DE
Valtion Teknillinen Tutkimuskeskus VTT FI
Technische Universitat Berlin TUB DE
Alma Mater Studiorum-Universita di Bologna UNIBO IT
Sorin CRM SAS SORIN FR
EPCOS SAS EPCOS FR
MED-EL Elektromedizinische Geraete GmbH MED-EL AT
Siemens Audiologische Technik GmbH DE-SAT DE
Debiotech S.A. DEBIOTECH CH
SignalGeneriX Ltd SG CY
RTD TALOS Ltd TALOS CY

FP7-ICT-2009-5 WiserBAN (257454) D5.2 v7
2
WiserBAN
Smart miniature low-power wireless microsystem for
Body Area Networks
Deliverable identifier: D5.2
Deliverable title: Computer Simulation Results and Test of BAN Protocols over Benchmark Platform
Due date of deliverable: M18
Actual submission date: M20 (April 10,2012)
Start day of project: 01/09/2010
Duration: 36 months
WP Number: WP 5 Miniature BAN components
Organization name of lead partner for this deliverable (partner name): TUB
Author(s): C. Buratti (UNIBO), R. Cavallari (UNIBO), E. Guidotti (UNIBO), F. Martelli
(UNIBO), R. Rosini (UNIBO), R. Verdone (UNIBO).
Document Status: Delivered
Project funded by the European Commission within the Seventh Framework Programme
Dissemination Level
PU Public x
PP Restricted to other programme participants (including the Commission Services)
RE Restricted to a group specified by the consortium (including the Commission Services)
CO Confidential, only for members of the consortium (including the Commission Services)

FP7-ICT-2009-5 WiserBAN (257454) D5.2 v7
3
Revision History
Version Date Changed page(s) Cause of change Partner
V1 Dec 14 2011 All Creation UNIBO
V2 March 9 All Editing of all the Deliverable
UNIBO
V3 March 23 All Editing of almost all the Deliverable
UNIBO
V5 March 25 All Revision of all the document
CEA
V6 March 31 All Final revision UNIBO
V7 March 10 minor Final review CSEM
Disclaimer: The information in this document is subject to change without notice. Company
or product names mentioned in this document may be trademarkers or registered
trademarks of their respective companies.
All rights reserved.
The document is proprietary of the WiserBAN consortium members. No copying or
distributing, in any form or by any means is allowed without the prior written agreement of
the owner of the property rights.
Τhis document reflects the authors’ view. The European Community is not liable for any use
that may be made of the information contained herein.

FP7-ICT-2009-5 WiserBAN (257454) D5.2 v7
4
Contents
Contents ............................................................................................................... 4
Executive Summary ............................................................................................... 5
1 Introduction ................................................................................................... 6
2 The Benchmark Platform ................................................................................ 6
3 The MAC Protocol Implementation ................................................................. 9
3.1 Computer Simulation Results ........................................................................... 12
3.2 The Benchmark Results: the IEEE 802.15.4 CSMA/CA Protocol .......................... 14
3.2.1 Results on the IEEE 802.15.4 CSMA/CA Protocol ............................................................. 14
3.2.2 Results on the Data Aggregation Strategy ........................................................................ 16
3.3 The Benchmark Results: the Slotted ALOHA Protocol ....................................... 19
4 Coexistence Issues and Results ...................................................................... 21
4.1 Simulation Results ........................................................................................... 21
4.1.1 Interference Characterization........................................................................................... 21
4.1.2 Simulated Scenario ........................................................................................................... 24
4.1.3 Numerical Results ............................................................................................................. 26
4.2 The Benchmark Results ................................................................................... 27
5 Concluding remarks ....................................................................................... 29
6 Annexes ........................................................................................................ 29
6.1 List of Tables ................................................................................................... 29
6.2 List of Figures .................................................................................................. 30
6.3 List of references ............................................................................................. 31
6.4 Abbreviations .................................................................................................. 31
FP7-ICT-2009-5 WiserBAN (257454) D5.2 v7
5
Executive Summary
The WiserBAN project will create an ultra-miniature and ultra low-power RF microsystem for
wireless Body Area Networks (BAN) targeting primarily wearable and implanted devices for
healthcare, biomedical and lifestyle applications.
This Deliverable is the first issued by Task 5.3, dealing with the BAN multi-node platform,
having the aim of developing and validating the BAN concept, combining the elements of
Tasks 5.1 and 5.2 with the BAN protocol delivered in WP4.
This document aims at validating the radio communication protocol performance in the
context of a simple network topology, that is a star topology, and at validating the
simulation results on MAC protocols included in the Deliverables of WP4.
The BAN protocols have been tested over a separate, stable and commercially available
platform, developed by Texas Instruments, to create a proper benchmark for performance
evaluation purposes to be used in the later stages of the project.
This Deliverable contains the results of the first tests on the BAN MAC protocol achieved
through experimentations on the field, using the benchmark platform. Performance was
evaluated in terms of Packet Loss Rate and average delay. Coexistence issues are also
discussed.
It is shown that, apart from discrepancies related to the HW/SW platform constraints, the
qualitative behavior predicted by simulations of the protocols envisaged, is confirmed by the
experimentations. This proves that the simulation tool developed within the project is useful
to predict the performance variations of the WiserBAN communication protocol stack.

FP7-ICT-2009-5 WiserBAN (257454) D5.2 v7
6
1 Introduction
This Deliverable is the first issued by Task 5.3 and it reports about the benchmark platform
which has been developed in the last months at UNIBO. This platform will be considered as a
reference and benchmark for the rest of the project, to be used for comparison with the
final WiserBAN platform.
The Deliverable aims at:
Validating the simulation results on Medium Access Control (MAC) protocols included in
D4.1 and D4.2, through comparison with results achieved on the field with the
benchmark.
Providing some results on the performance of the WiserBAN MAC protocols, achieved
through experimentations on the field.
Providing some results, through both experimentations and simulations, on the
coexistence among the WiserBAN network and external interference, like Wi-Fi
networks.
2 The Benchmark Platform
A platform, already available on the market, has been identified to create a proper
benchmark for performance evaluation purposes. The BAN protocols, defined in D4.1, have
been implemented on the benchmark platform to provide some preliminary results on the
performance achievable by the WiserBAN devices and to validate simulation results,
included in D4.1 and D4.2.
Due to the lack of commercially available devices implementing the IEEE 802.15.6, an IEEE
802.15.4-compliant platform has been selected to be used as benchmark. As a result the
only available Physical (PHY) layer is the one implemented by IEEE 802.15.4, using Minimum
Shift Keying (MSK) modulation with spreading. Therefore the results achieved through the
tests on the benchmark will be compared with the simulation results achieved when using
MSK with spreading.
From the MAC layer viewpoint, instead, both the Carrier Sense Multiple Access with Collision
Avoidance (CSMA/CA) defined by IEEE 802.15.4 and the Slotted ALOHA protocol, as defined
in D4.1, have been implemented on the platform.
In the rest of this Section we report some details about the selected platform and the results
obtained through a measurements campaign made on the field.
The CC2530 produced by Texas Instrument (TI) has been selected as benchmark platform. It
is a second generation IEEE 802.15.4-compliant System-on-Chip with an optimized 8051
microcontroller unit (MCU) core and radio for the 2.4 GHz unlicensed Industrial Scientific

FP7-ICT-2009-5 WiserBAN (257454) D5.2 v7
7
and Medical (ISM) band. It is a good example of existing state-of-the-art 2.4GHz SoC, but
yields size and power consumptions that are way above the WiserBAN targets, and is
nonetheless very suitable for the required benchmarking process.
The CC2530 ZigBee Development Kit used for the benchmark is shown below.
Figure 2-1: Left part: The TI Development Kit. Right part: The Integrated Circuit [1]
The main characteristics are:
- Radio Frequency transceiver compliant with the IEEE 802.15.4 at 2.4 GHz;
- Programmable transmit power up to +4.5 dBm;
- Receiver sensitivity of -97 dBm;
- RAM (random access memory) of 8KB and 256 KB of flash;
- Low power consumptions: i) Transmission at +1 dBm (CPU Idle): 29mA; ii) Reception
(CPU Idle): 24mA; iii) Idle: three different modalities up to 0.4 mA.
Other technical characteristics of such devices are reported in the tables below [1].

FP7-ICT-2009-5 WiserBAN (257454) D5.2 v7
8
Table 2-1: CC2530 current consumptions [1]
Table 2-2: CC2530 technical characteristics [1]

FP7-ICT-2009-5 WiserBAN (257454) D5.2 v7
9
3 The MAC Protocol Implementation
To manage the access to the channel, the superframe (SF) reported in the figure below and
defined within the WiserBAN project (see D4.1) has been implemented on the benchmark
platform.
Figure 3-1: The WiserBAN Superframe
In the Contention Access Period (CAP) portion of the superframe the following protocols
have been implemented:
The IEEE 802.15.4 CSMA/CA protocol
The slotted ALOHA protocol of the IEEE 802.15.6 standard (as defined in D4.1).
We refer to D4.1 for details about the superframe and the MAC protocols.
The reference scenario considered is the integrated scenario shown in Figure 3-2, where four
WiserBAN devices are present on the body (see D4.1 for details). In simulations we had
considered three different sub-scenarios, with different possible positions of the Remote
Control (RC), supposed to be held in the left hand (scenario A), to be held in the right hand
(scenario B), or to be carried in a pocket (thigh position, scenario C). In the case of
experimental measurements, performed with the benchmark platform, only scenario B has
been addressed, therefore all the tests have been performed with the RC on the right hand.
Therefore results refer to a network composed of four nodes transmitting data to the
Coordinator (that is the RC), organized in a star topology and using the CAP portion of the SF,
as depicted in Figure 3-1.

FP7-ICT-2009-5 WiserBAN (257454) D5.2 v7
10
Figure 3-2: Integrated scenarios for the simulator
To implement the above described MAC protocol, the Texas Instruments Medium Access
Control Software (TIMAC) has been used. TIMAC implements: the interface toward the
physical layer; the MAC layer; and a simple application layer (see Figure 3-3). The interface
toward the PHY layer is the HAL (Hardware Abstraction Layer), which allows the
management of all the peripherals, the radio and the CPU (Central Processing Unit) of the
system of chip (SoC). On top of this level, there is the OSAL (Operative System Abstraction
Layer), enabling functionalities, like creation, initialization and synchronization of tasks, and
management of the timers, interrupts and memory. The MAC and application layers are
implemented above the OSAL layer.
Figure 3-3: TIMAC Architecture
UNIBO has implemented on the TIMAC software the same application considered in the
simulations, described in the following. At the beginning of every SF, each node generates
one packet to be transmitted toward the Coordinator (that is the RC). Packets generated by
nodes have all the same length. If a node does not succeed in sending correctly its packet to
the RC by the end of the current SF, the packet is considered lost. A maximum number of 3
retransmissions is allowed in both, simulations and experimentations. 10.000 SFs, meaning
10.000 packets to be transmitted from each node to the RC are sent in the experiments.
The flow-chart of the software developed at the application layer on TIMAC is shown in
Figure 3-4).

FP7-ICT-2009-5 WiserBAN (257454) D5.2 v7
11
Performance are evaluated in terms of:
Packet Loss Rate = (Number of packets lost) / (Number of packets generated).
Packets can be lost due to connectivity, collisions, or the end of the superframe. The
PLR is averaged among the PLR achieved by the different nodes in the network.
Delay: time interval between the beginning of the SF and the correct reception of
the node packet at the Coordinator. The delay is averaged among the delays
achieved by the different nodes in the network.
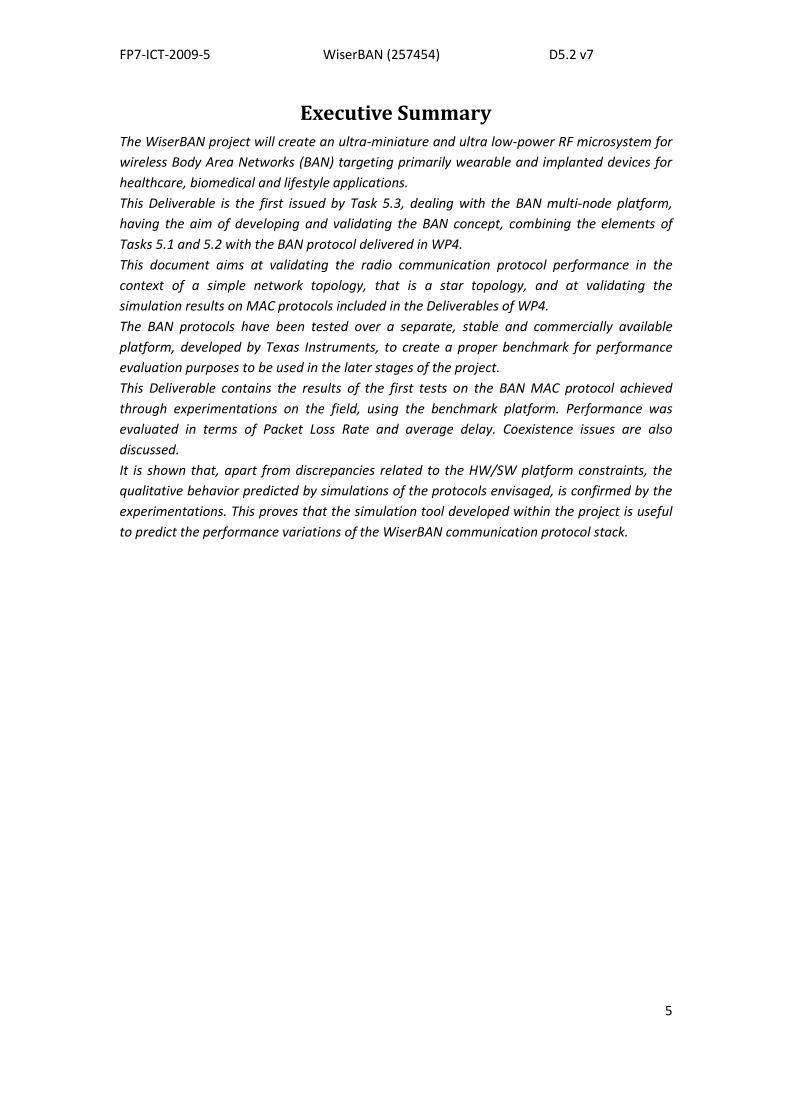
A Matlab interface has been implemented, in order that it is possible to visualize in real-time
the performance of the network, during the experiments. In particular, the interface shows
the power received by the RC (connected to a PC via UART, during the experiments), when
transmitted by the different nodes in the network, the delay with which packets are received
and the number of packets lost. The interfaces are shown in
Figure 3-5.
Figure 3-4: The flow-chart of the software implemented on the benchmark devices
FP7-ICT-2009-5 WiserBAN (257454) D5.2 v7
12
Figure 3-5: The software interface
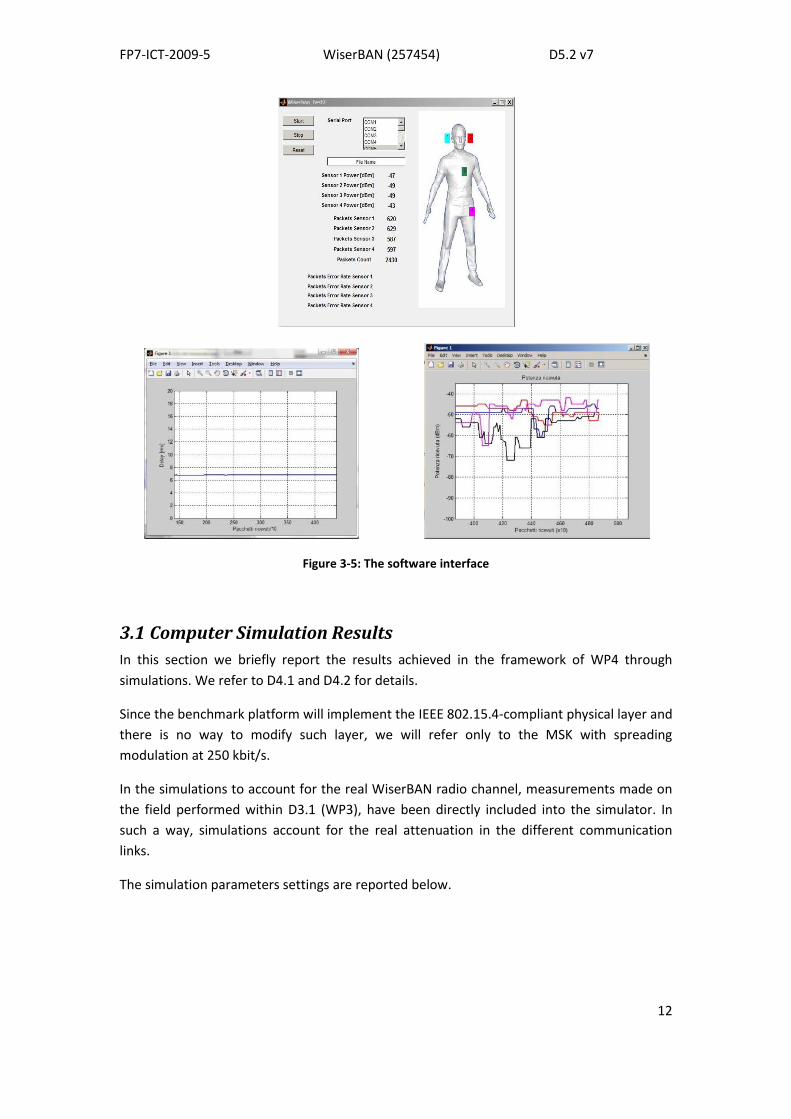
3.1 Computer Simulation Results
In this section we briefly report the results achieved in the framework of WP4 through
simulations. We refer to D4.1 and D4.2 for details.
Since the benchmark platform will implement the IEEE 802.15.4-compliant physical layer and
there is no way to modify such layer, we will refer only to the MSK with spreading
modulation at 250 kbit/s.
In the simulations to account for the real WiserBAN radio channel, measurements made on
the field performed within D3.1 (WP3), have been directly included into the simulator. In
such a way, simulations account for the real attenuation in the different communication
links.
The simulation parameters settings are reported below.

FP7-ICT-2009-5 WiserBAN (257454) D5.2 v7
13
Parameter Value
SIFS 50 μs [15.6]
PHY header + preamble 121 bits [15.6]
MAC header + FCS 9 bytes [15.6]
Beacon MPDU length 9 + 14 + payload = 23 bytes + payload [15.6]
Ack MPDU length 9 bytes [15.6]
Maximum number of retransmissions 3
Ack Timeout 2 ms
TB 1 ms
TInd 1 ms
TAck 1 ms
Ta 40 ms
BEmin 3
BEmax 5
NBmax 4
Transmit power 0 dBm
Receiver sensitivity -96 dBm
Antenna gain, RC -3 dB
Antenna gain, nodes -15 dB
Table 3-1: Simulation parameters setting
The following figures show the numerical results achieved in the case of the PHY layer of
IEEE 802.15.4 (MSK with spreading) and when top loaded (TL) and planar monopole (PL)
antennas are used. Results refer to the case of walking scenario, meaning that the subject
was walking during the experiments performed in WP3 and included into the simulator for
computing the attenuation in the different links. Such a case, in fact, is the one considered
also in the experiments performed with the benchmark platform and reported in the next
section.
Figure 3-6: PLR obtained for MSK with spreading PHY for PL antenna (left) and TL antenna (right)
0 20 40 60 80 100 120 140 160 180 20010
-3
10-2
10-1
100
MAC payload [bytes]
PL
R
MSK with spreading (15.4-like) PHY - 250 kbit/sPL antennas, walking scenarios
Scenario A
Scenario B
Scenario C
802.15.6CSMA/CA
802.15.4CSMA/CA
SlottedALOHA
0 20 40 60 80 100 120 140 160 180 20010
-3
10-2
10-1
100
MAC payload [bytes]
PL
R
MSK with spreading (15.4-like) PHY - 250 kbit/sTL antennas, walking scenarios
Scenario A
Scenario B
Scenario C
802.15.4CSMA/CA
802.15.6CSMA/CA
SlottedALOHA

FP7-ICT-2009-5 WiserBAN (257454) D5.2 v7
14
Figure 3-7: Delay obtained for MSK with spreading PHY for PL antenna (left) and TL antenna (right)
3.2 The Benchmark Results: the IEEE 802.15.4 CSMA/CA Protocol
As stated above, the reference scenario considered in the experimentations is scenario B
shown in Figure 3-2. The subject performed several walking cycles in an indoor environment,
using alternatively monopole antennas with normal (PL) or tangential (TL) polarization with
respect to the body surface.
The figures below show the environment were the experiments were performed.
Figure 3-8: The performed experiments
3.2.1 Results on the IEEE 802.15.4 CSMA/CA Protocol
In the benchmark we set the transmit power equal to -22 dBm, instead of 0 dBm, to account
for the negative antenna gains reported in Table 3-1 and characterizing the final WiserBAN
devices (see D3.1).
Figure 3-9 shows the PLR as a function of the packet payload in the case of PL and TL
antennas. Performance in the case of PL are worse with respect to the case of TL antennas
(as shown in the simulations); however, in the case of experiments, due to the large mass
0 20 40 60 80 100 120 140 160 180 2000
5
10
15
20
25
30
MAC payload [bytes]
De
lay [m
s]
MSK with spreading (15.4-like) PHY - 250 kbit/sPL antennas, walking scenarios
Scenario A
Scenario B
Scenario C
802.15.6CSMA/CA
SlottedALOHA
802.15.4CSMA/CA
0 20 40 60 80 100 120 140 160 180 2000
5
10
15
20
25
30
MAC payload [bytes]
De
lay [m
s]
MSK with spreading (15.4-like) PHY - 250 kbit/sTL antennas, walking scenarios
Scenario A
Scenario B
Scenario C
SlottedALOHA
802.15.6CSMA/CA
802.15.4CSMA/CA

FP7-ICT-2009-5 WiserBAN (257454) D5.2 v7
15
plan of the board, the impact of the antennas polarization is lower with respect to the
simulation results, accounting for a measurements campaign performed with different
boards. The figure demonstrates the good agreement between simulation and experimental
results; the slight differences, when comparing the two curves, could be explained
considering how differently the connectivity could affect the results. Indeed, the antennas
used on the benchmark and those used in the measurements campaign included in the
simulators, present different radiation characteristics, even if the polarization is the same.
Similar considerations could be drawn for the node emplacement and the environments
considered in the two cases.
In Figure 3-10 we show the PLR as a function of the packet payload for the different links. As
expected, the best link is the one connecting the RC and the right ear, since the two devices
are on the same side of the body, while the worst link is the one connecting the RC with the
left ear. The reason of the crossing among some of the curves is that the experiments
performed with different payloads have been done at different moments and performing
walking that are very similar, but could not be exactly the same (in terms of movements
performed by the subject).
In Figure 3-11 the comparison between simulated and measured average delay, as a
function of the packet payload, is shown. The measurements achieved in the case of TL and
PL antennas are shown. Also in this case the curves follow the same trend, confirming the
reliability of the numerical results obtained, presenting a constant difference of
approximately 5 ms. This could be explained considering that experiments obviously deal
with real hardware devices, whose intrinsic delays are not taken into account in the
simulations. This delay is mainly due to processing at the device.
Figure 3-9: PLR: simulations and experiments

FP7-ICT-2009-5 WiserBAN (257454) D5.2 v7
16
Figure 3-10: PLR achieved in experiments for the different links
Figure 3-11: Average Delay: simulations and experiments
3.2.2 Results on the Data Aggregation Strategy
To decrease the energy consumption we developed on the benchmark platform a data
aggregation strategy. In the experiments shown in the previous section, three
retransmissions are allowed for trying to transmit correctly the packets within the same
superframe. However, if a packet is lost due to connectivity issues, mainly caused by the
shadowing effect of the body, performing retransmissions immediately after transmission is
useless, since the channel will most probably be the same. In such a case, all the energy
spent by nodes for retransmitting the packet is wasted. During the walking, in fact, the body
movement generates the alternation of situations in which nodes are in visibility and in
which nodes are shadowed by the body. This is mainly due to the typical arm movement
performed during the walking. Therefore, it is possible to take advantage of the movement,
avoid to retransmit packets till visibility between nodes is gained.
0 20 40 60 80 1000
5
10
15
20
25
30
MAC payload [bytes]
De
lay [m
s]
MSK with spreading (15.4-like) PHY - 250 kbit/s
PL antennas
802.15.4 CSMA/CA
Walking, Scenario B
Walking, Scenario B, experimental
0 20 40 60 80 1000
5
10
15
20
25
30
MAC payload [bytes]
De
lay [m
s]
MSK with spreading (15.4-like) PHY - 250 kbit/s
TL antennas
802.15.4 CSMA/CA
Walking, Scenario B
Walking, Scenario B, experimental

FP7-ICT-2009-5 WiserBAN (257454) D5.2 v7
17
To improve the performance, mainly in terms of energy consumption, we implemented on
the benchmark the following aggregation strategy. When a node does not receive the ACK
from the RC, instead of retransmitting the packet in the same SF, it will wait for a given
number of SFs, during which it will only store the generated data, without transmitting
them. After a given number of SFs, the node will try to transmit a single packet, containing
the lost data plus all the data generated and not transmitted, in an aggregated packet. We
denoted as min_Aggr_Pkt the number of packets aggregated in case of packet loss.
Therefore, once a packet is lost, the node will only store data for the following
min_Aggr_Pkt-2 SFs and at the (min_Aggr_Pkt-1)-th SF it will transmit a packet with a
payload equal to: min_Aggr_Pkt*payload. In Figure 3-11 an example of aggregation strategy
is shown.
Figure 3-12: The Aggregation strategy implemented: an example
As a first step we evaluate the optimum value of min_Aggr_Pkt to be set. We set the
superframe duration equal to 30.72 ms, that is we set the superframe order (equal to the
beacon order) to 1. The presence of the optimum can be motivated as follows: when
min_Aggr_Pkt is too small, there is still correlation between the channel experienced by the
transmission and the one experienced by the retransmission; when min_Aggr_Pkt is too
large, the size of the transmitted packet becomes very large, therefore collisions may occur
(i.e., the channel is uncorrelated and no connectivity issues could be present, by MAC
collisions may occur). The optimum is reached when the trade-off is found. This optimum is
shown in Figure 3-13 for the case of payload equal to 1 byte. As can be seen the optimum
value is equal to 30, which means approx. 900 ms (accounting for the SF duration), that is
approx. the time needed for a subject to perform one cycle of a walk.
In Figure 3-14 we show the PLR when 3 retransmissions are implemented, in the case of no
retransmissions and when the aggregated strategy is implemented. The reason why the PLR
in the case of aggregation is larger with respect to the case of 3 retransmissions is the fact
that we impose no retransmissions also when the aggregated packet is sent. However,
having such packet a large size, it could suffer from collisions, therefore it could be useful to
implement retransmissions in such a case. In fact, thanks to the optimization performed on
the min_Aggr_Pkt parameter, when the transmission occur the channel should be “good”.
On the other hand, thanks to aggregation, nodes could save energy, assuming that they will
switch off the radio for all the SFs where they just have to store the information data.
Obviously this is obtained at expense of an increase of the delays.
In Figure 3-15 we show the number of times the different nodes in the network will use the
aggregation protocol (N_aggr) in one experiment. This parameter refers to the number of

FP7-ICT-2009-5 WiserBAN (257454) D5.2 v7
18
SFs, over the total number of 10.000 transmissions (i.e., SFs) implemented, a node lost a
packet and used aggregation. This metric is useful to compute the percentage of inactive
time, that is the percentage of time during which the node could turn off the radio, saving
energy, since it has not to transmit data. This percentage is shown in Figure 3-16 for the
different nodes. Note that link 2, which is the worst link in terms of connectivity, is the one
using more times aggregation, and saving more energy.
Figure 3-13: The PLR as a function of min_Aggr_Pkt when payload = 1 byte
Figure 3-14: The PLR as a function of the packet payload
Figure 3-15: NAggr as a function of min_Aggr_Pkt for the different nodes

FP7-ICT-2009-5 WiserBAN (257454) D5.2 v7
19
Figure 3-16: The % of time during which nodes could switch off the radio
3.3 The Benchmark Results: the Slotted ALOHA Protocol
To implement the Slotted ALOHA protocol, we have modified the software implementing the
MAC layer into the TI platform and the functionalities of the co-processor radio (CSP) of the
SoC CC2530.
According to the protocol defined in IEEE 802.15.6, the SF is divided into slots. Once a node
has a packet to be transmitted (i.e., after the reception of the beacon), it will transmit in the
current slot with a probability CP (contention probability). CP ranges in the interval [CPmin,
CPmax] = [1/8, 1/4]. See D4.1 for details.
Figure 3-17: The Access to the Channel: Slotted ALOHA
The procedure used to set the slot duration is as follows. Each slot should contain the packet
transmission, the acknowledge (ACK) transmission, one TurnAroundTime and a Guard Time.
In the Table 3-2 we report the parameters set in the experiments. Ts is the symbol time for
IEEE 802.15.4, which is equal to 16 s.
In the benchmark, since not all parts of the TIMAC software are accessible, devices need to
wait for an interval of time equal to 54*Ts for the ACK, before performing retransmission. To
avoid implementation problems, we included this 54*Ts (denoted as ACK time) into the slot,
resulting in a larger slot duration in the experiments with respect to simulations and also
with respect to the performance we could expect to have on the final platform. Larger slot
size, in fact, will bring to a lower number of slots available for transmitting packets into the

FP7-ICT-2009-5 WiserBAN (257454) D5.2 v7
20
CAP, therefore larger PLR. This could be observed in Figure 3-19 (right part) where results
achieved in the case of slot duration implemented has shown in Figure 3-19, and in the case
of slot without the ACK time. The performance in the latter case is derived through post-
processing on the data measured.
Typical data/management type frame transmission time
Aloha slot (pAlohaSlotLength)
I-Ack frame transmission time Nominal guard timepSIFS
Figure 3-18: The ALOHA Slot: an example
Payload
[Byte]
Tx time
[Ts]
TurnAroundTime
pSIFS [Ts]
ACK time
[Ts]
Guard
Time [Ts]
Slot duration
[Ts]
6 46 12 54 4 120
31 96 12 54 4 180
56 146 12 54 4 220
81 196 12 54 4 280
106 246 12 54 4 320
Table 3-2: The Slot size
The comparison of results achieved in the case of CSMA/CA and Slotted ALOHA are reported
below (Figure 3-19). As expected, slotted ALOHA has worse performance in terms of both
average delay and PLR. However, as stated in D4.1, it is simpler and it allows to reduce the
energy consumption. Note that the duration of a single slot will increase by increasing the
payload and the number of available slots in each CAP will decrease by increasing the slot
size.
In Figure 3-20 we report the comparison between simulations and experimental results.
Once again simulations are validated by the measurements results.
Figure 3-19: Average Delay and PLR in the case of ALOHA and CSMA/CA

FP7-ICT-2009-5 WiserBAN (257454) D5.2 v7
21
Figure 3-20: PLR in the case of ALOHA: simulations and experimentation
4 Coexistence Issues and Results
In this section we report the results of coexistence studies regarding the performance
achievable by the WiserBAN network when an IEEE 802.11 (Wi-Fi) network is present as
source of interference. Results have been achieved via both simulations and
experimentations.
We refer to IR4.2 for simulation results related to the interference caused by IEEE 802.15.4
(ZigBee) networks on the WiserBAN network.
We report here only results related to the PHY layer of IEEE 802.15.4 (MSK with spreading),
being the PHY implemented by the benchmark. We refer to IR4.2 for simulation results
related to the other PHYs.
4.1 Simulation Results
4.1.1 Interference Characterization
The interference has been previously characterized in both the frequency domain and in the
time domain. In particular, since the above mentioned interference sources are standardized
networks, their frequency characterization could be derived from the standards, while time
characterization has been performed through specific measurements.
In the following studies we assume that the WiserBAN network works in the following frequency channels characterized by:
Center frequencies 15,,0,MHz52405 iifc ;
Bandwidth B = 5 [MHz], when MSK modulation is used.

FP7-ICT-2009-5 WiserBAN (257454) D5.2 v7
22
Figure 4-1: The Coexistence studies
4.1.1.1 Frequency Characterization
We refer to the versions of IEEE 802.11 standard operating at 2.45 GHz in the ISM band,
namely IEEE 802.11 b/g/n. In these cases, the standard defines 13 channels of 22 MHz each,
as illustrated in Figure 4-3. The spectrum mask that an IEEE 802.11 signal must respect is
shown in Figure 4-2.
Figure 4-2: IEEE 802.11 transmit power spectrum mask
Figure 4-3: IEEE 802.11 channel
Being WiserBAN channels 5 MHz or 2 MHz wide, depending on the considered PHY, only part
of the IEEE 802.11 interfering power will fall inside the receiver band. A graphical example of
FP7-ICT-2009-5 WiserBAN (257454) D5.2 v7
23
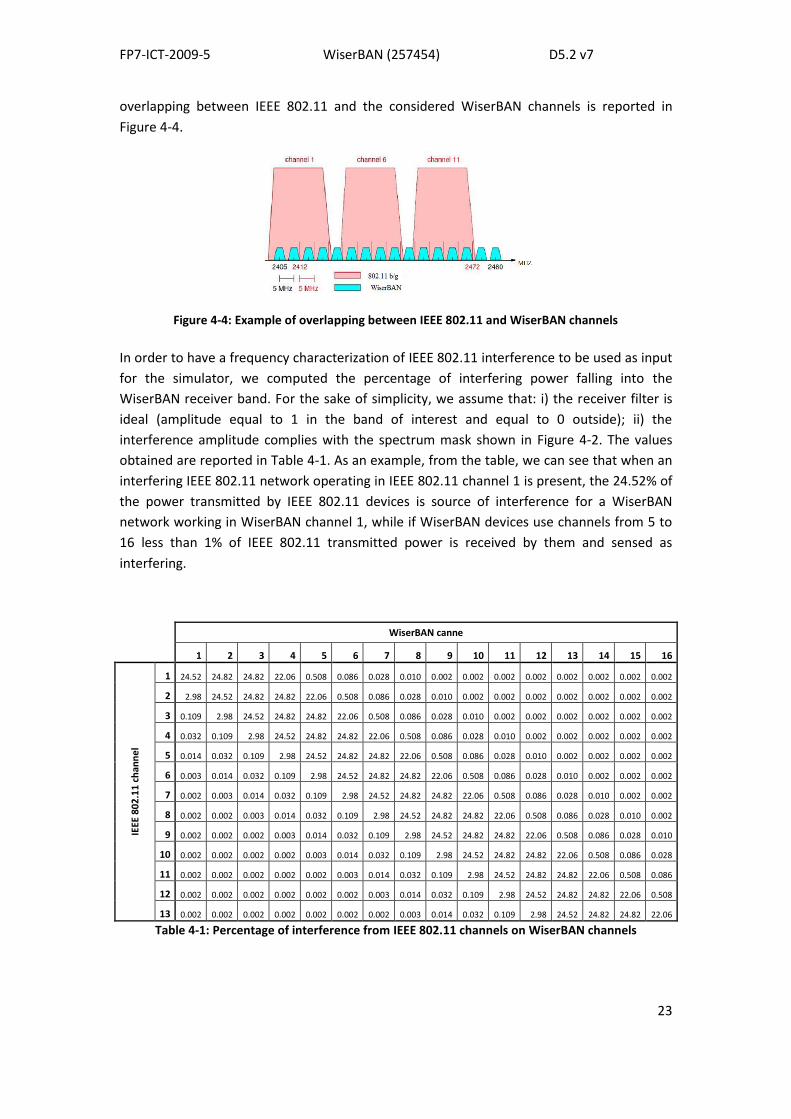
overlapping between IEEE 802.11 and the considered WiserBAN channels is reported in
Figure 4-4.
Figure 4-4: Example of overlapping between IEEE 802.11 and WiserBAN channels
In order to have a frequency characterization of IEEE 802.11 interference to be used as input
for the simulator, we computed the percentage of interfering power falling into the
WiserBAN receiver band. For the sake of simplicity, we assume that: i) the receiver filter is
ideal (amplitude equal to 1 in the band of interest and equal to 0 outside); ii) the
interference amplitude complies with the spectrum mask shown in Figure 4-2. The values
obtained are reported in Table 4-1. As an example, from the table, we can see that when an
interfering IEEE 802.11 network operating in IEEE 802.11 channel 1 is present, the 24.52% of
the power transmitted by IEEE 802.11 devices is source of interference for a WiserBAN
network working in WiserBAN channel 1, while if WiserBAN devices use channels from 5 to
16 less than 1% of IEEE 802.11 transmitted power is received by them and sensed as
interfering.
WiserBAN canne
1 2 3 4 5 6 7 8 9 10 11 12 13 14 15 16
IEEE
80
2.1
1 c
han
ne
l
1 24.52 24.82 24.82 22.06 0.508 0.086 0.028 0.010 0.002 0.002 0.002 0.002 0.002 0.002 0.002 0.002
2 2.98 24.52 24.82 24.82 22.06 0.508 0.086 0.028 0.010 0.002 0.002 0.002 0.002 0.002 0.002 0.002
3 0.109 2.98 24.52 24.82 24.82 22.06 0.508 0.086 0.028 0.010 0.002 0.002 0.002 0.002 0.002 0.002
4 0.032 0.109 2.98 24.52 24.82 24.82 22.06 0.508 0.086 0.028 0.010 0.002 0.002 0.002 0.002 0.002
5 0.014 0.032 0.109 2.98 24.52 24.82 24.82 22.06 0.508 0.086 0.028 0.010 0.002 0.002 0.002 0.002
6 0.003 0.014 0.032 0.109 2.98 24.52 24.82 24.82 22.06 0.508 0.086 0.028 0.010 0.002 0.002 0.002
7 0.002 0.003 0.014 0.032 0.109 2.98 24.52 24.82 24.82 22.06 0.508 0.086 0.028 0.010 0.002 0.002
8 0.002 0.002 0.003 0.014 0.032 0.109 2.98 24.52 24.82 24.82 22.06 0.508 0.086 0.028 0.010 0.002
9 0.002 0.002 0.002 0.003 0.014 0.032 0.109 2.98 24.52 24.82 24.82 22.06 0.508 0.086 0.028 0.010
10 0.002 0.002 0.002 0.002 0.003 0.014 0.032 0.109 2.98 24.52 24.82 24.82 22.06 0.508 0.086 0.028
11 0.002 0.002 0.002 0.002 0.002 0.003 0.014 0.032 0.109 2.98 24.52 24.82 24.82 22.06 0.508 0.086
12 0.002 0.002 0.002 0.002 0.002 0.002 0.003 0.014 0.032 0.109 2.98 24.52 24.82 24.82 22.06 0.508
13 0.002 0.002 0.002 0.002 0.002 0.002 0.002 0.003 0.014 0.032 0.109 2.98 24.52 24.82 24.82 22.06
Table 4-1: Percentage of interference from IEEE 802.11 channels on WiserBAN channels

FP7-ICT-2009-5 WiserBAN (257454) D5.2 v7
24
4.1.1.2 Time Characterization
In order to characterize in the time domain the traffic generated by an IEEE 802.11 network,
some experiments have been carried out. The measurement set up considered is shown in
Figure 4-5. To measure the traffic between the Access Point (AP) and the notebook, the
network protocol analyzer Wireshark Version 1.6.2 has been used.
Figure 4-5: Experiment setup for IEEE 802.11 traffic characterization
Three different traffic flows have been measured:
No traffic, meaning that the notebook was left with an open browser application,
but with no interaction with the user, in this modality only synchronization packets
are supposed to be exchanged;
Web browsing, that refers to simple navigation operations during which the user
performs general operations with a web browser, alternating the opening of web
pages with their reading;
Heavy traffic, meaning a more intense web navigation, which involves both actions
described in the web browsing case and the download of files from emails or ftp
sites, with dimensions up to 20 Mbytes.
All the above mentioned traffic modalities have been measured for a time interval of 5
minutes, with the AP and the notebook positioned at a distance of 2 m and in Line-of-Sight
condition.
From the results captured with Wireshark, some elaborations were performed to produce
.txt files that served as simulation inputs for later analysis. These files report the
presence/absence of IEEE 802.11 packets, coming from the AP or the notebook, as a
function of time and with the resolution needed in the WiserBAN simulator.
4.1.2 Simulated Scenario
The simulated scenario is illustrated in Figure 4-6. It represents a hypothetical room of 3 x
3.5 m. A human subject wearing the WiserBAN nodes walks in the room, following the
trajectory represented by the red arrow in the figure. The WiserBAN network is composed of

FP7-ICT-2009-5 WiserBAN (257454) D5.2 v7
25
4 devices and one RC held in the right hand (integrated scenario simulated in D4.1 for CAP
performance evaluation, scenario B of Figure 4-18 in D4.1 document).
The AP is located at the coordinates (x, y, z) = (1, 3.5, 3) m. The notebook is positioned at (x,
y, z) = (3, 1.5, 0.8) m.
Simulations have been performed with the Heavy traffic input file for the traffic
charcaterisation of IEEE 802.11 link (see Section 4.1.1.2).
Both the AP and the notebook are supposed to use a transmit power equal to +20 dBm (100
mW). We have considered two different cases of overlapping between IEEE 802.11 and
WiserBAN channels; specifically, for MSK with and without spreading PHYs we have selected:
case 1: situation with 0.028% of interfering power falling into WiserBAN receiver
band (for instance, IEEE 802.11 channel 1 with WiserBAN channel 7). This situation
corresponds to an interfering power approximately equal to -19 dBm;
case 2: situation with 24.82% of interfering power falling into WiserBAN receiver
band (for instance, IEEE 802.11 channel 1 with WiserBAN channel 2 or 3). This
situation corresponds to an interfering power approximately equal to +14 dBm.
Figure 4-6: Simulation scenario for WiserBAN coexistence evaluation with an IEEE 802.11 network
We refer to D4.1 for details about the channel model considered and the packet capture
model.
An average human walking speed of 3 m/s has been considered.
As for the channel model between IEEE 802.11 devices and WiserBAN nodes, a free space
propagation is considered:
),ln()( 10 dkkdL
where L is the attenuation in dB for devices located at a distance d [m], k0 = 40 dB and k1 =
13.03 (values obtained for the frequency of 2.45 GHz and a propagation constant equal to
3). The free space attenuation has been chosen for the sake of simplicity; in fact, it has to be
considered as the worst case scenario, since it does not include the additional attenuation
produced by the presence of the human body.

FP7-ICT-2009-5 WiserBAN (257454) D5.2 v7
26
In order to compare the results reported hereafter with the ones obtained without
interference, all the simulation parameters (CSMA/CA, MAC, PHY, and energy consumption
values) have been set as in Deliverable D4.1.
4.1.3 Numerical Results
The average PLR obtained in presence of IEEE 802.11 interference is shown below.
We can notice that in presence of an IEEE 802.11 interfering network, WiserBAN
performance in terms of PLR degrades significantly. The results obtained for simulated case
1 and case 2 appear to slightly differ. This means that IEEE 802.11 interference affects
WiserBAN PLR performance even when the utilized channels are only partially overlapping.
This can be explained remembering that we have simulated a worst case scenario, because
of two reasons:
the traffic exchanged between the AP and the notebook was a heavy traffic;
the attenuation between interfering nodes and WiserBAN devices is modeled as a
free space propagation.
Under these circumstances, the channel is very often found busy by WiserBAN devices,
which are therefore not able to correctly transmit their data.
The average delay obtained in presence of IEEE 802.11 interference is shown below. From
the figures, we can state that the presence of a IEEE 802.11 interfering network does not
degrade WiserBAN performance in terms of delay significantly (the degradation with respect
to the case without interference is around 1 ms at maximum).
Figure 4-7: PLR with IEEE 802.11 interference
0 20 40 60 80 100 120 140 160 180 20010
-3
10-2
10-1
100
MAC payload [byte]
PLR
IEEE 802.15.4 CSMA/CAMSK with spreading (15.4-like) PHY - 250 kbit/s
802.11 Interference - case 2
802.11 Interference - case 1
No Interference

FP7-ICT-2009-5 WiserBAN (257454) D5.2 v7
27
Figure 4-8: Delay with IEEE 802.11 interference
4.2 The Benchmark Results
The coexistence measurements have been performed according to the reference scenario
shown in Figure 4-9. The subject was still at a given distance, d, from the Wi-Fi access point
(AP).
As shown in Figure 4-9 the set up was the following: The Wi-Fi network was composed of a
PC (PC2) downloading, through a wireless link, a file from another PC (PC1) passing through
the AP. PC1 was connected through cable to the AP, such that this link (PC1 – AP) was not
generating wireless traffic. The transmit power of the AP was set equal to +19 dBm, while
the one of the BAN devices was set equal to -22 dBm.
In Figure 4-10 we show the channel used by the AP and by the BAN on the subject. Two
channels have been considered for the BAN: a complete overlapped channel and a partially
overlapped channel.
In Figure 4-11 we show the PLR on the BAN when the four devices are transmitting packets
through the CSMA/CA protocol to the RC, as a function of the distance, d, from the AP, for
different values of the packet payload. The file download has been performed during all the
duration of the experiment. As can be seen, when the channels are completely overlapped,
the PLR is near to 100%. This could be mainly due to the following causes:
1) The AP transmits with a power that is approx. +40 dBm larger with respect to the
one used by devices;
2) The link between the body and the AP is almost free-space, whereas the links of the
BAN (among the devices and the RC) are strongly affected by the shadowing caused
by the body;
3) The PC continuously downloads data from the AP during all the measure, that is BAN
devices will never find the channel free.
When, instead, the channels used by the AP and the BAN are only partially overlapped,
the performance improves significantly and do not change very much by varying the
0 20 40 60 80 100 120 140 160 180 2000
2
4
6
8
10
12
14
16
18
20
MAC payload [byte]
Dela
y [
ms]
IEEE 802.15.4 CSMA/CAMSK with spreading (15.4-like) PHY - 250 kbit/s
802.11 Interference - case 2
802.11 Interference - case 1
No interference

FP7-ICT-2009-5 WiserBAN (257454) D5.2 v7
28
distance from the AP. This is also due to the fact that in the environment considered
there was a background electromagnetic activity almost constant on all the frequency
band, due to the presence of many interferers on the ISM band.
Figure 4-9: The reference scenario for the measurements
Figure 4-10: The Wi-Fi and BAN channels used
Figure 4-11: The BAN PLR when affected by Wi-Fi interference

FP7-ICT-2009-5 WiserBAN (257454) D5.2 v7
29
5 Concluding remarks
This Deliverable reports about the development of the benchmark platform. The CC2530
SoC, produced by Texas Instrument has been used for the development of the benchmark.
The chip implements the IEEE 802.15.4-compliant physical layer. On top of this the
WiserBAN MAC protocol has been implemented. In particular we have implemented:
1. The WiserBAN superframe including the IEEE 802.15.4-compliant CSMA/CA protocol
in the CAP portion;
2. The slotted ALOHA protocol, as it has been defined in D4.1, to be used as an
alternative to CSMA/CA in the CAP portion;
3. A data aggregation strategy to save energy;
4. The WiserBAN application considered in the simulations reported in D4.1 and IR4.2.
We can summarize the outcomes of the Deliverable as follows.
First results of the performance of the WiserBAN protocols, achieved on the field, have
been shown;
Validation of the simulation results contained in D4.1 and D4.2, thanks to comparison
with experimental measurements, has been obtained;
Results on experiments made on the field, related to coexistence issues, have shown that
care must be taken in environments populated by WiFi APs;
A benchmark platform, implemented over a stable and commercially hardware, to be
considered as reference for the rest of the project, has been developed.
6 Annexes
6.1 List of Tables
Table 2-1: CC2530 current consumptions ................................................................................. 8
Table 2-2: CC2530 technical characteristics .............................................................................. 8
Table 3-1: Simulation parameters setting ............................................................................... 13
Table 3-2: The slot size. ........................................................................................................... 19
Table 4-1: Percentage of interference from IEEE 802.11 channels on WiserBAN channels ... 23

FP7-ICT-2009-5 WiserBAN (257454) D5.2 v7
30
6.2 List of Figures
Figure 2-1: Left part: The TI Development Kit. Right part: The Integrated Circuit [1] .............. 7
Figure 3-1: The WiserBAN Superframe ..................................................................................... 9
Figure 3-2: Integrated scenarios for the simulator ................................................................. 10
Figure 3-3: TIMAC Architecture ............................................................................................... 10
Figure 3-4: The flow-chart of the software implemented on the benchmark devices ........... 11
Figure 3-5: The software interface .......................................................................................... 12
Figure 3-6: PLR obtained for MSK with spreading PHY for PL antenna (left) and TL antenna
(right) ....................................................................................................................................... 13
Figure 3-7: Delay obtained for MSK with spreading PHY for PL antenna (left) and TL antenna
(right) ....................................................................................................................................... 14
Figure 3-8: The performed experiments ................................................................................. 14
Figure 3-9: PLR: simulations and experiments ........................................................................ 15
Figure 3-10: PLR achieved in experiments for the different links ........................................... 16
Figure 3-11: Average Delay: simulations and experiments ..................................................... 16
Figure 3-12: The Aggregation strategy implemented: an example ......................................... 17
Figure 3-13: The PLR as a function of min_Aggr_Pkt when payload = 1 byte ......................... 18
Figure 3-14: The PLR as a function of the packet payload ...................................................... 18
Figure 3-15: NAggr as a function of min_Aggr_Pkt for the different nodes .............................. 18
Figure 3-16: The % of time during which nodes could switch off the radio ............................ 19
Figure 3-17: The Access to the Channel: Slotted ALOHA ........................................................ 19
Figure 3-18: The ALOHA Slot: an example ............................................................................... 20
Figure 3-19: Average Delay and PLR in the case of ALOHA and CSMA/CA ............................. 20
Figure 3-20: PLR in the case of ALOHA: simulations and experimentation............................. 21
Figure 4-1: The Coexistence studies ........................................................................................ 22
Figure 4-2: IEEE 802.11 transmit power spectrum mask ........................................................ 22
Figure 4-3: IEEE 802.11 channel .............................................................................................. 22
Figure 4-4: Example of overlapping between IEEE 802.11 and WiserBAN channels .............. 23

FP7-ICT-2009-5 WiserBAN (257454) D5.2 v7
31
Figure 4-5: Experiment setup for IEEE 802.11 traffic characterization ................................... 24
Figure 4-6: Simulation scenario for WiserBAN coexistence evaluation with an IEEE 802.11
network ................................................................................................................................... 25
Figure 4-7: PLR with IEEE 802.11 interference ........................................................................ 26
Figure 4-8: Delay with IEEE 802.11 interference ..................................................................... 27
Figure 4-9: The reference scenario for the measurements .................................................... 28
Figure 4-10: The Wi-Fi and BAN channels used ....................................................................... 28
Figure 4-11: The BAN PLR when affected by Wi-Fi interference ............................................. 28
6.3 List of references
[1] Texas Instruments, “A True System-on-Chip Solution for 2.4-GHz IEEE 802.15.4 and ZigBee Applications”.
6.4 Abbreviations
ACK Acknowledge
CPU Control Processing Unit
CSMA/CA Carrier Sense Multiple Access with Collision Avoidance
CSP Co-Processor Radio
HAL Hardware Abstraction Layer
ISM Industrial Scientific Medical
MAC Medium Access Control
MCU Microcontroller Unit
MSK Minimum Shift Keying
OSAL Operative System Abstraction Layer
PHY Physical
PLR Packet Loss Rate
RAM Random Access Memory
SF Superframe
TI Texas Instruments