Embed Size (px)
Citation preview
Wisconsin’s Forests 2009
Resource Bulletin
NRS-67
United States Department of Agriculture
Forest Service
Northern Research Station
Abstract
The second full annual inventory of Wisconsin’s forests reports more than 16.7 million acres of forest land with an average volume of more than 1,400 cubic feet per acre. Forest land is dominated by the oak/hickory forest-type group, which occupies slightly more than one quarter of the total forest land area; the maple/beech/birch forest-type group occupies an additional 23 percent. Forty-two percent of forest land consists of large diameter stands, 23 percent contains medium diameter stands, and 8 percent contains small diameter stands. The volume of growing stock on timberland has been rising since the 1980s and currently totals more than 21.1 billion cubic feet. The average annual net growth of growing stock on forest land from 2005 to 2009 is approximately 572 million cubic feet per year. This report includes additional information on forest attributes, land use change, carbon, timber products, forest health, and statistics and quality assurance of data collection.
Acknowledgments
Field crew and QA staff over the 2005-2009 field inventory cycle included John Benaszeski, Andrew Bird, Dana Carothers, Tom Castonguay, Nathan Cochran, Ron Colatskie, Alison Dibble, Ian Diffenderfer, Michael Downs, Michael Hough, Gary Inhelder, Daniel Johnson, Michael Johnson, Mike Kangas, Paul Kodanko, Peter Koehler, Cassandra Kurtz, Chris La Cosse, Rebecca Langenecker, Dominic Lewer, Mike Long, Steve Lorenz, Mark Majewsky, Paul Mueller, Pat Nelson, Benjamin Nurre, Jeff Nyquist, Charles Paulson, Emil Peter, Nick Reynolds, Matthew Riederer, Bob Rother, Sjana Schanning, Terry Schreiber, Thomas Seablom, Jennifer Smith, Willard Smith, Aimee Stephens, Brad Totten, and Brian Wall.
Published by: For additional copies:U.S. FOREST SERVICE U.S. Forest Service11 CAMPUS BLVD SUITE 200 Publications DistributionNEWTOWN SQUARE PA 19073-3294 359 Main Road Delaware, OH 43015-8640
August 2012
Visit our homepage at: http://www.nrs.fs.fed.us
Cover: Paper birch. Photo by David Lee, Bugwood.org.
Manuscript received for publication January 2012
Printed on recycled paper
Charles H. Perry, Vern A. Everson, Brett J. Butler, Susan J. Crocker, Sally E. Dahir, Andrea L. Diss-Torrance, Grant M. Domke, Dale D. Gormanson, Mark A. Hatfield, Sarah K. Herrick, Steven S. Hubbard, Terry R. Mace, Patrick D. Miles, Mark D. Nelson, Richard B. Rideout, Luke T. Saunders, Kirk M. Stueve, Barry T. Wilson, Christopher W. Woodall
Contact Author:
Charles H. Perry
651-649-5191
Charles H. Perry is a research soil scientist with the Forest Inventory and Analysis (FIA) program, Northern Research Station, St. Paul, MN.
Vern A. Everson is a forest resource analyst with the Wisconsin Department of Natural Resources (WNDR), Madison, WI.
Brett J. Butler is a research forester with FIA, Northern Research Station, Amherst, MA.
Susan J. Crocker is a research forester with FIA, Northern Research Station, St. Paul, MN.
Sally E. Dahir is a plant pest and disease specialist with WDNR, Dodgeville, WI.
Andrea L. Diss-Torrance is the Invasive Forest Insect Program Coordinator with WDNR, Madison, WI.
Grant M. Domke is a research forester with FIA, Northern Research Station, St. Paul, MN.
Dale D. Gormanson and Mark A. Hatfield are foresters with FIA, Northern Research Station, St. Paul, MN.
Sarah K. Herrick is a research scientist with WDNR, Madison, WI.
Steven S. Hubbard and Terry R. Mace are forest products utilization and marketing specialists with WDNR, Madison, WI.
Patrick D. Miles and Mark D. Nelson are research foresters with FIA, St. Paul, MN.
Richard B. Rideout is the urban forestry coordinator with WDNR, Madison, WI.
Luke T. Saunders is a forest products utilization and marketing specialist with WDNR, Madison, WI.
Kirk M. Stueve was a research ecologist with FIA, Northern Research Station, St. Paul, MN. He currently is a visiting assistant professor of geography at North Dakota State University, Fargo, ND.
Barry T. Wilson and Christopher W. Woodall are research foresters with FIA, St. Paul, MN.
Wisconsin’s Forests 2009
About the Authors
Foreword
Our forests are one of our most precious assets. Today, Wisconsin’s forests cover 46 percent of our State, totaling more than 16.7 million acres. Since the mid-1960s the extent of forest land in Wisconsin has been expanding, while both the average age and volume of trees has been increasing.
We know our forests are expanding and diversifying because of the information collected by the Forest Inventory and Analysis (FIA) Program of the U.S. Forest Service. The annual inventory of Wisconsin’s forests is administered through the FIA Program in partnership with the Wisconsin Department of Natural Resources, Division of Forestry. The latest 5-year inventory of Wisconsin covers the period 2005-2009, with analysis having been completed in 2011 by the U.S. Forest Service.
FIA collects, analyzes, and reports information on the status and trends of America’s forests: how much forest exists, where it exists, who owns it, and how it is changing, as well as how the trees and other forest vegetation are growing and how much has died or has been removed in recent years. Since 1968, Wisconsin has provided funding to intensify the inventory by doubling the number of permanent plots from which data are collected. The reason for intensifying the inventory is to provide more reliable data on areas smaller than on a statewide basis and stratified components of the data such as forest type, condition class, species volume, etc.
The information provided by FIA can be used in many ways, such as in evaluating wildlife habitat conditions, assessing the sustainability of forest management practices, and supporting planning and decisionmaking activities undertaken by public and private enterprises. FIA combines its information with related data on insects, diseases, and other types of forest damages and stressors to assess the health condition and potential future risks to forests. FIA also projects what the forests are likely to be in 10 to 50 years under various scenarios. This information is essential for evaluating whether current forest management practices are sustainable and will allow future generations to enjoy America’s forests.
Wisconsin proudly supports the nation’s largest forest products industry. We employ more people and produce more value from forest products than any other state. The forest industry often uses FIA information in making business decisions regarding the timber resource quantity, quality, and availability in their area. Information can be provided to industry on a county level basis or radius from a mill location. This information, whether for a traditional wood processing plant or a biomass facility, is invaluable in determining whether there will be an adequate supply of the desired species and size in the area to sustain both the current or proposed operation, and the forest itself.
In this report, we briefly describe and highlight the current status and trends observed within Wisconsin’s forests. We hope this information will stimulate discussion about the State’s forest resources and motivate additional research and analysis, as well as increase our shared commitment to protect and sustainably manage one of Wisconsin’s most precious assets.
Paul DeLongChief State Forester
Contents
Highlights . . . . . . . . . . . . . . . . . . . . . . . . . . . . . . . . . . . . . . . . . . . . . . . . . . . . . . . . . . . . . . . . 1
Background. . . . . . . . . . . . . . . . . . . . . . . . . . . . . . . . . . . . . . . . . . . . . . . . . . . . . . . . . . . . . . . 5
Forest Features. . . . . . . . . . . . . . . . . . . . . . . . . . . . . . . . . . . . . . . . . . . . . . . . . . . . . . . . . . . 11
Forest Health Indicators . . . . . . . . . . . . . . . . . . . . . . . . . . . . . . . . . . . . . . . . . . . . . . . . . . . 37
Forest Economics . . . . . . . . . . . . . . . . . . . . . . . . . . . . . . . . . . . . . . . . . . . . . . . . . . . . . . . . 49
Data Sources and Techniques. . . . . . . . . . . . . . . . . . . . . . . . . . . . . . . . . . . . . . . . . . . . . . . 57
Literature Cited. . . . . . . . . . . . . . . . . . . . . . . . . . . . . . . . . . . . . . . . . . . . . . . . . . . . . . . . . . . 59
Statistics, Methods, and Quality Assurance . . . . . . . . . . . . . . . . . . . . . . . . . . . . . . . . . DVD
1
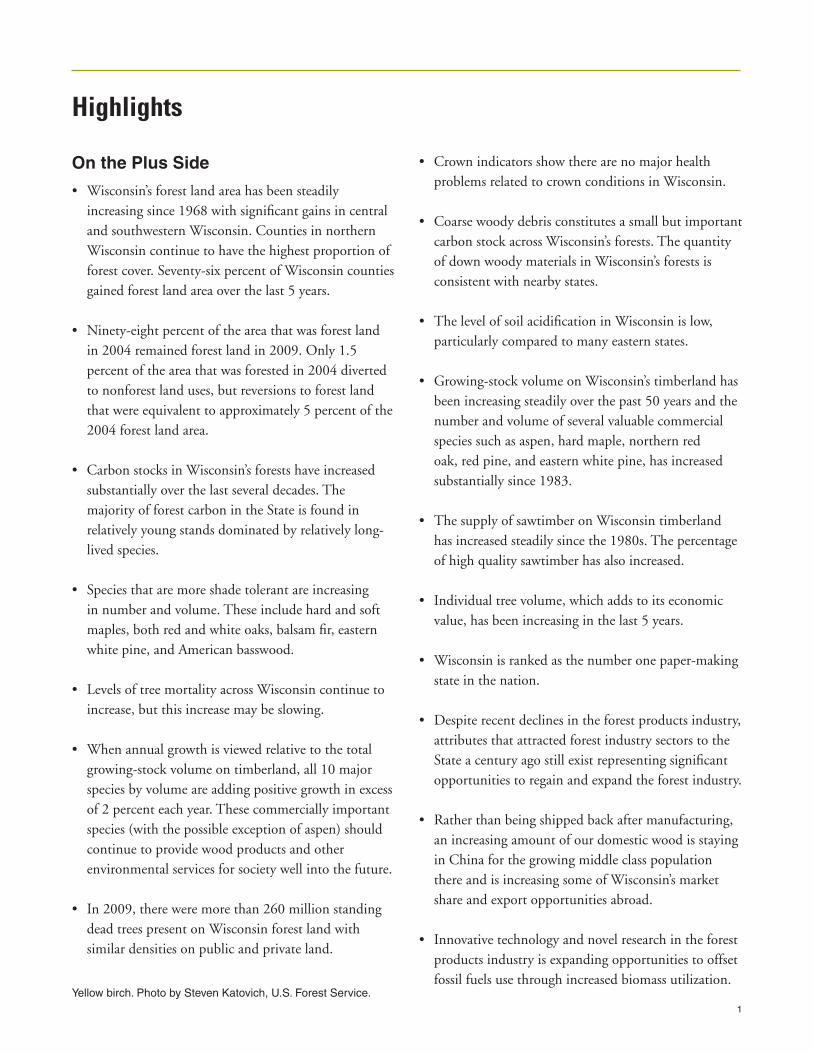
On the Plus Side
• Wisconsin’sforestlandareahasbeensteadilyincreasingsince1968withsignificantgainsincentralandsouthwesternWisconsin.CountiesinnorthernWisconsincontinuetohavethehighestproportionofforestcover.Seventy-sixpercentofWisconsincountiesgainedforestlandareaoverthelast5years.
• Ninety-eightpercentoftheareathatwasforestlandin2004remainedforestlandin2009.Only1.5percentoftheareathatwasforestedin2004divertedtononforestlanduses,butreversionstoforestlandthatwereequivalenttoapproximately5percentofthe2004forestlandarea.
• CarbonstocksinWisconsin’sforestshaveincreasedsubstantiallyoverthelastseveraldecades.ThemajorityofforestcarbonintheStateisfoundinrelativelyyoungstandsdominatedbyrelativelylong-livedspecies.
• Speciesthataremoreshadetolerantareincreasinginnumberandvolume.Theseincludehardandsoftmaples,bothredandwhiteoaks,balsamfir,easternwhitepine,andAmericanbasswood.
• LevelsoftreemortalityacrossWisconsincontinuetoincrease,butthisincreasemaybeslowing.
• Whenannualgrowthisviewedrelativetothetotalgrowing-stockvolumeontimberland,all10majorspeciesbyvolumeareaddingpositivegrowthinexcessof2percenteachyear.Thesecommerciallyimportantspecies(withthepossibleexceptionofaspen)shouldcontinuetoprovidewoodproductsandotherenvironmentalservicesforsocietywellintothefuture.
• In2009,thereweremorethan260millionstandingdeadtreespresentonWisconsinforestlandwithsimilardensitiesonpublicandprivateland.
• CrownindicatorsshowtherearenomajorhealthproblemsrelatedtocrownconditionsinWisconsin.
• CoarsewoodydebrisconstitutesasmallbutimportantcarbonstockacrossWisconsin’sforests.ThequantityofdownwoodymaterialsinWisconsin’sforestsisconsistentwithnearbystates.
• ThelevelofsoilacidificationinWisconsinislow,particularlycomparedtomanyeasternstates.
• Growing-stockvolumeonWisconsin’stimberlandhasbeenincreasingsteadilyoverthepast50yearsandthenumberandvolumeofseveralvaluablecommercialspeciessuchasaspen,hardmaple,northernredoak,redpine,andeasternwhitepine,hasincreasedsubstantiallysince1983.
• ThesupplyofsawtimberonWisconsintimberlandhasincreasedsteadilysincethe1980s.Thepercentageofhighqualitysawtimberhasalsoincreased.
• Individualtreevolume,whichaddstoitseconomicvalue,hasbeenincreasinginthelast5years.
• Wisconsinisrankedasthenumberonepaper-makingstateinthenation.
• Despiterecentdeclinesintheforestproductsindustry,attributesthatattractedforestindustrysectorstotheStateacenturyagostillexistrepresentingsignificantopportunitiestoregainandexpandtheforestindustry.
• Ratherthanbeingshippedbackaftermanufacturing,anincreasingamountofourdomesticwoodisstayinginChinaforthegrowingmiddleclasspopulationthereandisincreasingsomeofWisconsin’smarketshareandexportopportunitiesabroad.
• Innovativetechnologyandnovelresearchintheforestproductsindustryisexpandingopportunitiestooffsetfossilfuelsusethroughincreasedbiomassutilization.
Highlights
Yellow birch. Photo by Steven Katovich, U.S. Forest Service.
2
• Wisconsin’swoodresourceiswellpositionedtomeetgrowingdemandfor“green”projectsthatfavortheuseofindependentlyverifiedenvironmentalcertificationsystems.
• Thisisastablemillcountof280activeprimarywoodprocessingmillssincethelastinventory.
Areas of Concern
• WhiletheextentofoakforestsinWisconsinappearstobeslowlyincreasing,ageclassdisparitiescontinue,especiallyonmediumtohighqualitysites.Olderoakforestsonsitesofmedium-to-highproductivityarebeinglostandyoungoakforestsareregeneratingpoorly.
• Treespeciesthatdependondisturbancetoregeneratearedecreasinginnumberand/orvolume.Theseincludequakingaspen,bigtoothaspen,jackpine,andpaperbirch.
• Removalsdeclinedbetween2004and2009,verylikelytheresultoftwoprimaryfactors:1)thedeclineinthenumberofhousingstarts,whichaffectslumberdemand,and2)theaccompanyingeconomicdownturn,whichhasnegativelyimpactedallsectorsoftheeconomy,includingtheforestproductsindustry—especiallypaper.
• Theabundanceofsmalldiameterstand-sizeclasscontinuestodecline.Concurrently,thedistributionoflarge-diameterstand-sizeclasshasincreaseddramatically.
• Emeraldashborer(EAB)andbeechbarkdiseasehavebecomeestablishedinWisconsin.EABhasthepotentialtokillmillionsofblack,whiteandgreenashtreesthroughoutWisconsin.TheimpactofEABisexpectedtorivalthatofchestnutblightandDutchelmdisease.
• Thefrequencyoftwoormoreinvasivespeciesperplotisgreaterinthe2009inventorythanthe2004inventory(21and13percent,respectively).Reedcanarygrasswasoneof15specieswhichincreasedinoccurrencebetween2004and2009.Onlytwospecies(multifloraroseandblacklocust)declinedinoccurrencebetween2004and2009.Thesamplingofinvasivespeciesisstillrelativelynew,sothisdatadoesnotdefineasolidtrend.
• Jackpineshowedsignificantdeclinesinsawtimbervolume.
• AspenisamajorspeciesgroupusedbytheeconomicallyimportantpaperindustryinWisconsin.Theannualgrowthtoremovalratiosforquakingaspen(0.9)andbigtoothaspen(0.9)werelessthan1.0,whichisnotsustainableinthelongrun.However,aspenisapioneer,short-livedspeciesthatisexpectedtodeclineinvolumeovertimeduetonaturalsuccession.
• Downturnsinourdomesticeconomyhaveresultedinasignificantlossofforestproductscompaniesandthejobstheysupported;sixofWisconsin’spulpandcompositepanelmillsclosedsince2000.
Issues to Watch
• Growing-stockvolumeofeconomicallyimportantredandwhiteoakspeciesonmedium-to-highqualitysitesremainedthesameorincreasedslightlyinthelast5yearspossiblyasaresultofincreasedknowledgeaboutproblemswithoakforestsinWisconsinandbettermanagementtechniques.
• Itisimportanttorememberthatland-usechangeresultsinthisreportareaggregatedattheStatescale;therewillbelocalvariationwheremoreforestlandisbeinglostthangained.
3
• Familyforestownersarediverseandtimberproductionisnottheprimaryownershipobjectiveformostofthem.Policiesandprogramsshouldbedesignedtomeettheowners’diversesituationsandneeds.
• Comparingthefieldandsatelliteurbanforestinventorymethodsrevealsthatbothareneededtoprovidecommunityleaderstheurbanforestinformationtomakemanagementdecisions.
• Maturingforestsarereflectedindecreasingforestdensityandincreasingtreevolume.Ifspeciesthatdependondisturbancetoregeneratearetoremaineconomicallyimportant,measuresshouldbeundertakentoencourageregenerationandpreventconversiontootherforesttypes.
• Seedlingregenerationmaybecompromisedinclosedcanopy,late-successionalforests.Managersneedtoensurethatregenerationoflight-demandingspecies,suchasquakingaspen,paperbirch,andjackpine,ismaintained.
• Aspenharvestlevelsareonlymarginallysustainableoverthelongterm.Aspenharvestlevelshavebeendeclining,however,andwillprobablycontinuetodeclineasaresultofglobalcompetitioninthepaperandpulpindustriesandtheeconomicdownturn.
• Thougheconomicallyimportantspeciesgroupshaveshowngrowthintotalvolumeandaveragevolumeperacre,therateofincreasehasnotbeenequallyapportionedacrossallspeciesgroups.
• Averageannualremovalsofgrowing-stockvolumeonWisconsin’stimberlandincreasedsteadilyfrom1956to2004.Since2004removalshavedecreased.Thedeclineinremovalsbetweenthelasttwoinventorieswasdueprimarilytotheeconomicdownturnandglobalcompetition.
• Averageannualmortalityofgrowing-stockvolumeonWisconsin’stimberlandhasbeenincreasingsincethemid-1960s.However,therateofincreasehasdiminishedsince1996indicatingadecadeofmorestableforestmortality.
• Sawtimbervolumesinsomeeconomicallyimportantspeciesgroups,suchasselectredoakandhardmaple,haveremainedaboutthesamesince1996whilemostothershaveincreased.
• Ourforestsareagingandspeciesthatarelatesuccessional,suchasthemaples,arereplacingearlysuccessionalspecies,suchasquakingaspenandpaperbirch.
• Changingclimatewillcausestresstotrees,makingthemmoresusceptibletoopportunisticpestsanddiseasesthatmaynothavebeenasignificantthreatinthepast.
• Asweseekwaystoreduceourdependenceontraditionalfossilfuels,woodybiomassislikelytoplayanincreasinglyimportantroleinthisarea.
• Toremaincompetitive,theforestproductsindustryinWisconsinwillneedtocontinueexploringinnovativewaysoffindingnewopportunitiesforgrowthinnicheandglobalwoodproductsmarkets.
• Woodproductsmanufacturersareheavilydependentonthehealthofhousingmarketsandotherconstructionindustriesthatutilizestheirproducts.
• Morethan60percentofthelandareaintheState’surbanforestsisavailablefortreeplanting.Exploitingthisopportunity,aswellasmaintainingexistinglarge-canopytrees,wouldsignificantlyincreasetheenvironmental,social,andeconomicservicestheseforestsprovidetotheStateandatthesametimereducetheimpendingimpactofemeraldashborerontheurbanforestcanopy.

4
55
Background
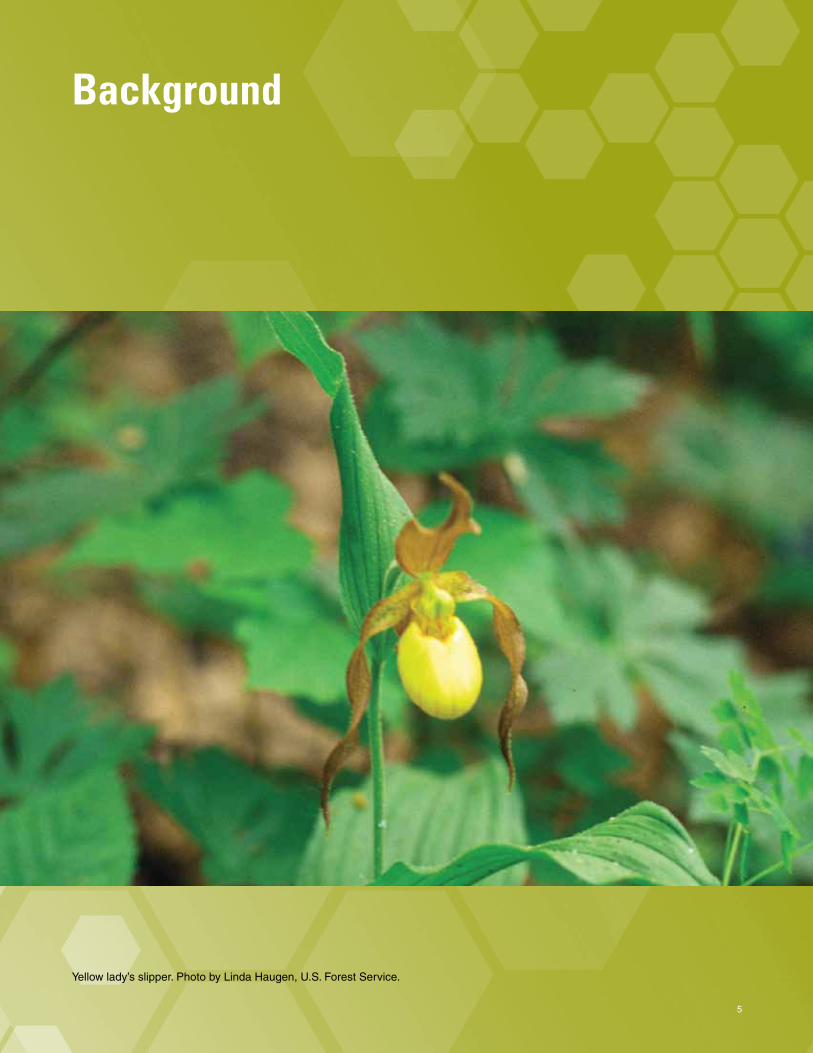
Yellow lady’s slipper. Photo by Linda Haugen, U.S. Forest Service.
6
BACKGROUND
A Beginner’s Guide to Forest Inventory
What is a tree?
Weknowatreewhenweseeoneandwecanagreeonsomecommontreeattributes.Atreeisaperennialwoodyplantwithacentralstemanddistinctcrown.TheForestInventoryandAnalysis(FIA)programoftheU.S.DepartmentofAgriculture,ForestServicedefinesatreeasanyperennialwoodyplantspeciesthatcanattainaheightof15feetatmaturity.InWisconsin,theproblemisindecidingwhichspeciesshouldbeclassifiedasshrubsandwhichshouldbeclassifiedastrees.AcompletelistofthetreespeciesmeasuredinthisinventorycanbefoundinAppendixAof“Wisconsin’sForests2009:Statistics,Methods,andQualityAssurance,”ontheDVDintheinsidebackcoverpocketofthisbulletin.
What is a forest?
Weallknowwhataforestis,butwheredoestheforeststopandtheprairiebegin?It’sanimportantquestion.ThegrossareaofforestlandorrangelandoftendeterminestheallocationoffundingforcertainStateandFederalprograms.Forestmanagerswantmorelandclassifiedasforestland,andrangemanagerswantmorelandclassifiedasprairie.Somewhereyouhavetodrawtheline.
FIAdefinesforestlandaslandthatisatleast10percentstockedbytreesofanysizeorformerlyhavinghadsuchtreecoverandnotcurrentlydevelopedfornonforestuse.Theareawithtreesmustbeatleast1acreinsize,androadside,streamside,andshelterbeltstripsmustbeatleast120feetwidetoqualifyasforestland.
TheurbanforestisanothertypeofforestthatFIAistryingtoquantify.Theurbanforestmeetsthedefinitionofforestlandabovebutisfoundwithintheboundariesofcities,villages,andotherdensedevelopments.
What is the difference between timberland, reserved forest land, and other forest land?
FromanFIAperspective,therearethreetypesofforestland:timberland,reservedforestland,andotherforestland.InWisconsin,98.4percentoftheforestlandistimberland,0.6percentisreservedforestland,and1.0percentisotherforestland.
• Timberlandisunreservedforestlandthatmeetstheminimumproductivityrequirementof20cubicfeetperacreperyearatitspeak.
• Reservedforestlandislandwithdrawnfromtimberutilizationthroughlegislationoradministrativeregulation.InWisconsin,theNationalParkServiceowns40percentofthereservedland;theStateofWisconsinandNationalForestsown30and27percent,respectively.
• Otherforestlandiscommonlyfoundonlow-lyingsiteswithpoorsoilswheretheforestisincapableofproducing20cubicfeetperacreperyearatitspeak.
Before2000onlytreesontimberlandplotsweremeasuredinWisconsin.Therefore,whilewecanreportvolumeontimberlandforthoseinventories,wecan’treportvolumeonforestland.Underthenewannualinventorysystem,treesweremeasuredonallforestlandsoforestvolumeestimatescanbeproduced.Becausetheseannualplotshavebeenremeasureduponcompletionofthesecondannualinventoryin2009,wearenowabletoreportgrowth,removals,andmortalityonallforestland,notjustontimberland.
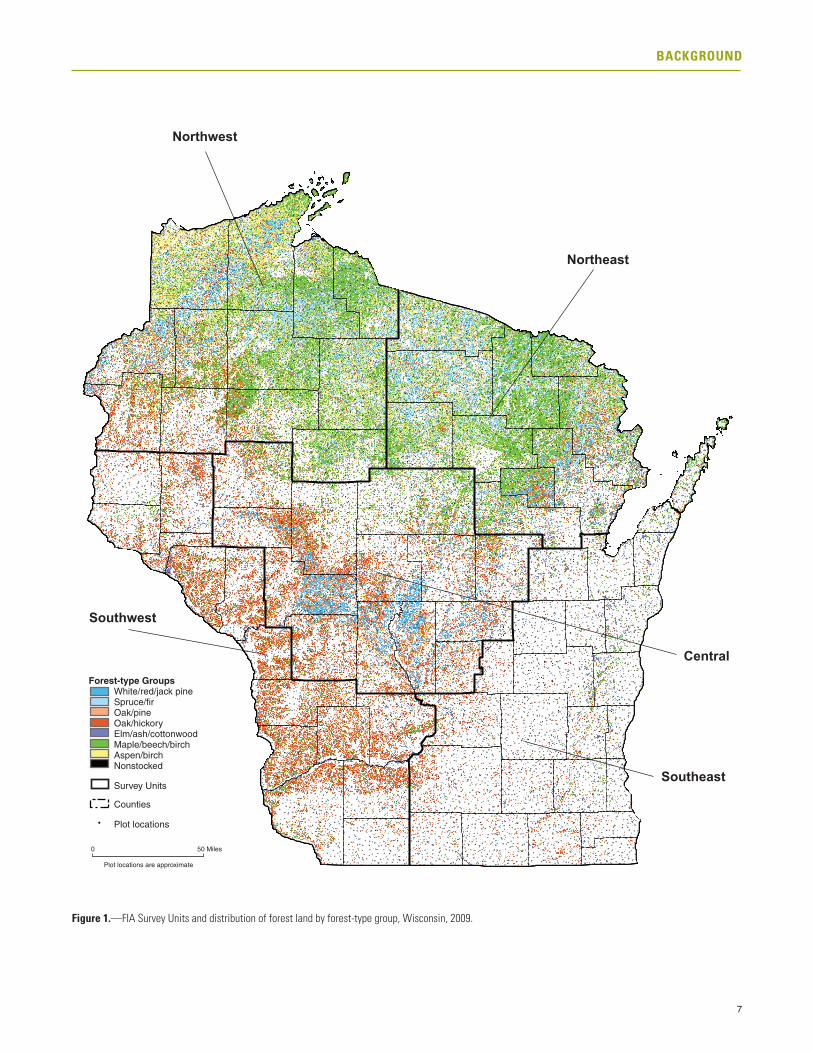
Where are Wisconsin’s forests, and how many trees are in Wisconsin?
Wisconsin’sforestsaregenerallylocatedinthenorthernandwesternpartsoftheState(Fig.1).Thereareapproximately2.5billiontreesonWisconsin’sforestland(giveortakeafewmillion)thatareatleast5inchesindiameterasmeasuredat4.5feetabovetheground.Wedon’tknowtheexactnumberbecausewe
7
BACKGROUND
Figure 1.—FIA Survey Units and distribution of forest land by forest-type group, Wisconsin, 2009.
Forest-type Groups White/red/jack pine Spruce/fir Oak/pine Oak/hickory Elm/ash/cottonwood Maple/beech/birch Aspen/birch Nonstocked
Survey Units
Counties
Plot locations
50 Miles0
Plot locations are approximate
Northwest
Northeast
Southeast
Central
Southwest
8
BACKGROUND
measuredonlyabout1outofevery16,600trees.Inall,133,449trees5inchesandlargerweresampledon6,189forestedplots.1
How do we estimate a tree’s volume?
FIAhastypicallyexpressedvolumesincubicfeet.But,inWisconsin,woodismorecommonlymeasuredincords(astackoflogs8feetlong4feetwideand4feethigh).Acordhasapproximately79cubicfeetofsolidwoodand49cubicfeetofbarkandair.
Volumecanbepreciselydeterminedbyimmersingatreeinapoolofwaterandmeasuringtheamountofwaterdisplaced.Lessprecise,butmuchcheaper,wasthemethodusedbytheNorthCentralResearchStation(whichlatermergedwiththeNortheasternResearchStationtobecometheNorthernResearchStation).Severalhundredcuttreesweremeasuredbytakingdetaileddiametermeasurementsalongtheirlengthstoaccuratelydeterminetheirvolumes(Hahn1984).Regressionlineswerethenfittothesedatabyspeciesgroup.Usingtheseregressionequations,wecanproduceindividualtree-volumeestimatesbasedonspecies,diameter,andtreesiteindex.
Thesamemethodwasusedtodeterminesawtimbervolumes.FIAreportssawtimbervolumesin¼-inchInternationalboardfootscale.ConversionfactorsforconvertingtoScribnerboardfootscalearealsoavailable(Smith1991).
How much does a tree weigh?
TheU.S.ForestService’sForestProductsLaboratoryandothersdevelopedspecificgravityestimatesforanumberoftreespecies(MilesandSmith2009).Thesespecificgravitieswerethenappliedtotreevolumeestimatestoderiveestimatesofmerchantabletreebiomass(theweightofthebole).Toestimatelivebiomass,wehave
1During the 2009 inventory of Wisconsin (from 2005 to 2009), we measured
one 1/6-acre plot for approximately every 3,084 acres of forest land. See
“Wisconsin’s Forests 2009: Statistics, Methods, and Quality Assurance” on the
DVD in the back of this book.
toaddinthestump(Raile1982)andlimbsandbark(Heathetal.2009).Wedonotcurrentlyreportthelivebiomassestimatesofrootsorfoliage.
Forestinventoriesreportbiomassasgreenoroven-dryweight.Greenweightistheweightofafreshlycuttree;oven-dryweightistheweightofatreewithzeropercentmoisturecontent.Onaverage,1tonofoven-drybiomassisroughlyequalto2tonsofgreenbiomass.
How do we estimate all the forest carbon pools?
FIAdoesnotmeasurethecarboninstandingtreesorcarboninbelowgroundpools.FIAassumesthathalfthebiomassinstandinglive/deadtreesconsistsofcarbon.Theremainingcarbonpools(e.g.,soil,understoryvegetation,belowgroundbiomass)aremodeledbasedonstand/sitecharacteristics(e.g.,standageandforesttype).
How do we compare data from different inventories?
Datafromnewinventoriesareoftencomparedwithdatafromearlierinventoriestodeterminetrendsinforestresources.Thisiscertainlyvalidwhencomparingthe2004inventorytothe2009inventory.Butcomparisonswithinventoriesconductedbefore2000areproblematicbecauseproceduresforassigningstandcharacteristics,suchasforesttypeandstandsize,havechangedasaresultofFIA’songoingeffortstoimprovetheefficiencyandreliabilityoftheinventory.Severalchangesinproceduresanddefinitionshaveoccurredsincethe1996Wisconsininventory.Althoughthesechangeswillhavelittleimpactonstatewideestimatesofforestarea,timbervolume,andtreebiomass,theymayhavesignificantimpactsonplotclassificationvariablessuchasforesttypeandstand-sizeclass.Someofthesechangesmakeitinappropriatetodirectlycomparethe2009and2004annualinventorytableswithperiodicinventoriespublishedfor1936,1956,1968,1983,and1996.
The1996inventoryalsousedmodeledplots,i.e.,plotsmeasuredin1983andprojectedforwardusing
9
BACKGROUND
theSTEMS(Belcheretal.1982)growthmodel.Thiswasdonetosavemoneybyreducingthenumberofundisturbedplotsthatweresenttothefieldforremeasurement.Disturbancewasdeterminedbycomparingaerialphotographsoftheplotsandlookingforreductionsincanopycover.TheideawasthatparametersfortheSTEMSgrowthmodelcouldbefinetunedusingthemeasured,undisturbedplotsandthenappliedtotheremainingunmeasured,undisturbedplots.Unfortunately,theuseofmodeledplotsintroducederrors,sothecurrentinventoryincludesfullremeasurements.Thus,onlyfieldmeasuredplotsareusedforcomparisonswiththe1996inventoryinthispublication.
A word of caution on suitability and availability…
FIAdoesnotattempttoidentifywhichlandsaresuitableoravailablefortimberharvesting,particularlybecausesuchsuitabilityandavailabilityaresubjecttochanginglaws,economic/marketconstraints,physicalconditions,adjacencytohumanpopulations,andownershipobjectives.Theclassificationoflandastimberlanddoesnotnecessarilymeanitissuitableoravailablefortimberproduction.
Thus,forestinventorydataaloneareinadequatefordeterminingtheareaofforestlandavailablefortimberproduction.Additionalfactors,suchassocialtrends,needtobeconsideredwhenestimatingthetimberbase.
FIAendeavorstobepreciseindefinitionsandimplementation.Theprogramtriestominimizechangestothesedefinitionsandtocollectionprocedures,butthatisnotalwayspossibleordesirableinaworldofchangingvaluesandobjectives.Whilechangeisinevitable,wehopethatthroughclarityandtransparencyforestinventorydatawillbeofusetoanalystsfordecadestocome.

10
1111
Forest Features
Black spruce. Photo by Steven Katovich, U.S. Forest Service.
12
FOREST FEATURES
Forest Area
Background
Formanydecades,Wisconsinhashadamixofagriculturalandforestlanduses.Trendsinforestareaareoftenapredictoroffutureforestresourcetrends.Fluctuationsinforestareamayindicatechanginglanduseorforesthealthconditions.Monitoringthesechangesprovidesessentialinformationformanagementanddecisionmaking.
What We Found
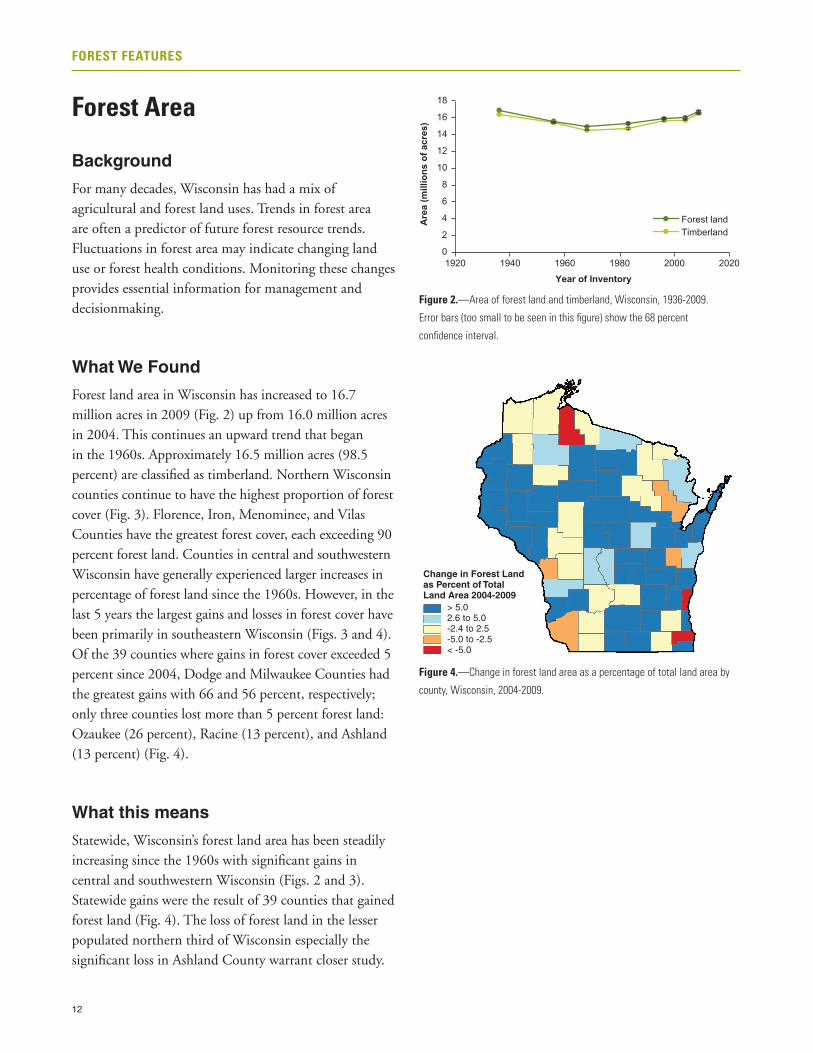
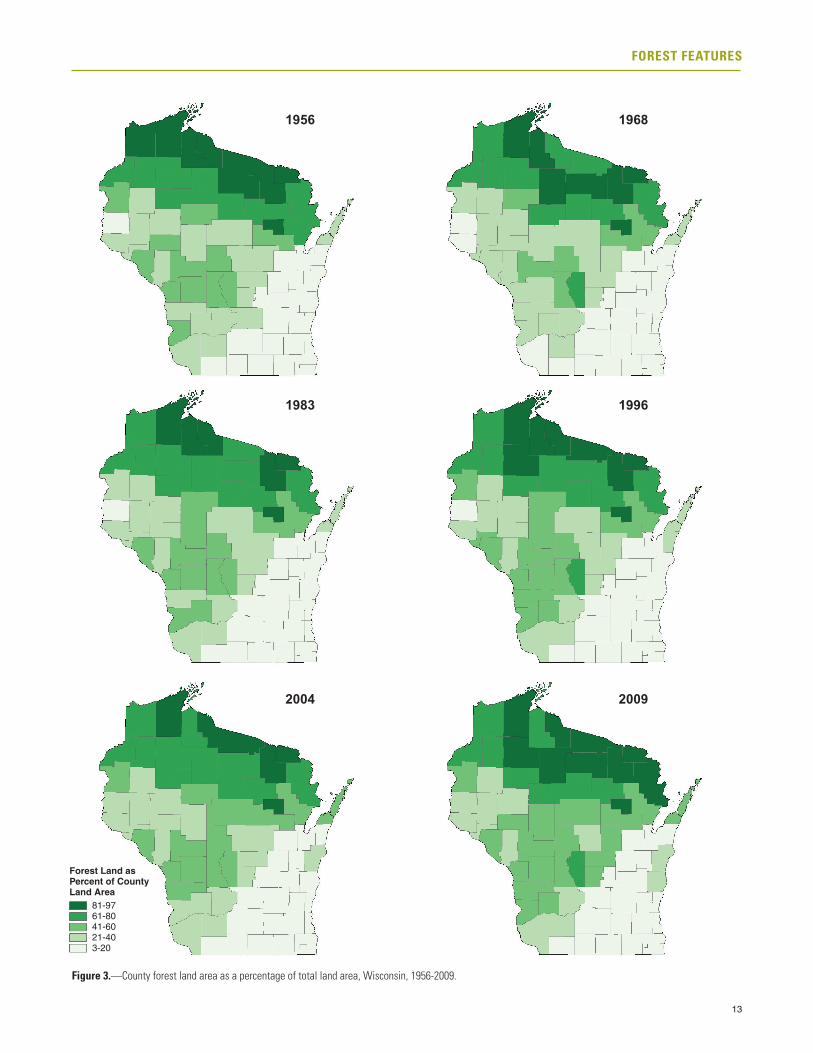
ForestlandareainWisconsinhasincreasedto16.7millionacresin2009(Fig.2)upfrom16.0millionacresin2004.Thiscontinuesanupwardtrendthatbeganinthe1960s.Approximately16.5millionacres(98.5percent)areclassifiedastimberland.NorthernWisconsincountiescontinuetohavethehighestproportionofforestcover(Fig.3).Florence,Iron,Menominee,andVilasCountieshavethegreatestforestcover,eachexceeding90percentforestland.CountiesincentralandsouthwesternWisconsinhavegenerallyexperiencedlargerincreasesinpercentageofforestlandsincethe1960s.However,inthelast5yearsthelargestgainsandlossesinforestcoverhavebeenprimarilyinsoutheasternWisconsin(Figs.3and4).Ofthe39countieswheregainsinforestcoverexceeded5percentsince2004,DodgeandMilwaukeeCountieshadthegreatestgainswith66and56percent,respectively;onlythreecountieslostmorethan5percentforestland:Ozaukee(26percent),Racine(13percent),andAshland(13percent)(Fig.4).
What this means
Statewide,Wisconsin’sforestlandareahasbeensteadilyincreasingsincethe1960swithsignificantgainsincentralandsouthwesternWisconsin(Figs.2and3).Statewidegainsweretheresultof39countiesthatgainedforestland(Fig.4).ThelossofforestlandinthelesserpopulatednorthernthirdofWisconsinespeciallythesignificantlossinAshlandCountywarrantcloserstudy.
Forest land
Timberland
0
2
4
6
8
10
12
14
16
18
1920 1940 1960 1980 2000 2020
Are
a (m
illio
ns o
f acr
es)
Year of Inventory
Figure 2.—Area of forest land and timberland, Wisconsin, 1936-2009.
Error bars (too small to be seen in this figure) show the 68 percent
confidence interval.
Figure 4.—Change in forest land area as a percentage of total land area by
county, Wisconsin, 2004-2009.
Change in Forest Land as Percent of Total Land Area 2004-2009 > 5.0 2.6 to 5.0 -2.4 to 2.5 -5.0 to -2.5 < -5.0
13
FOREST FEATURES
Forest Land as Percent of County Land Area 81-97 61-80 41-60 21-40 3-20
Figure 3.—County forest land area as a percentage of total land area, Wisconsin, 1956-2009.
1956 1968
1983 1996
2004 2009
14
FOREST FEATURES
Changes to Oak Forests
Background
Oakforestsareimportantfortheirecologicalandeconomicvalues.Manywildlifespeciesdependonoaksforfoodandforagingopportunities.Inaddition,oaksareveryimportanttoWisconsin’seconomybecauseoftheirhighvaluelumber.ThroughouttheMidwest,oakforestshavebeendecreasinginextentforseveraldecadesespeciallyonmediumandhigh-productivitysites(siteindex>60).Historically,regenerationintheseforestswasfacilitatedbyaperiodicfireregimewhichreducedcompetitionfromnativeandnon-nativeplants.Theabsenceofperiodicfirealongwithbrowsingbywhite-taileddeer(Odocoileus virginianus)hasmadeoakregenerationdifficultonnutrient-richsites.Poorregenerationandselectiveharvestinghaveleadtothegradualsuccessionofoakforeststoonesdominatedbyredandsugarmaple,basswood,elms,greenandwhiteash,andironwood.
What We Found
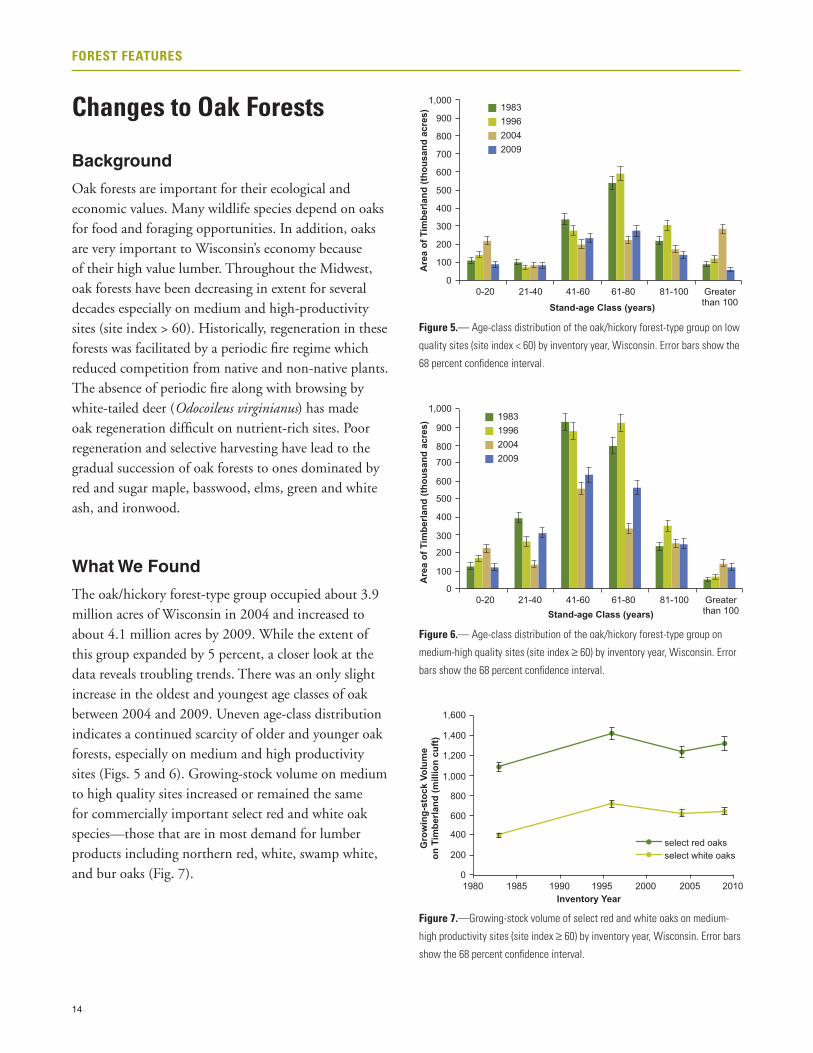
Theoak/hickoryforest-typegroupoccupiedabout3.9millionacresofWisconsinin2004andincreasedtoabout4.1millionacresby2009.Whiletheextentofthisgroupexpandedby5percent,acloserlookatthedatarevealstroublingtrends.Therewasanonlyslightincreaseintheoldestandyoungestageclassesofoakbetween2004and2009.Unevenage-classdistributionindicatesacontinuedscarcityofolderandyoungeroakforests,especiallyonmediumandhighproductivitysites(Figs.5and6).Growing-stockvolumeonmediumtohighqualitysitesincreasedorremainedthesameforcommerciallyimportantselectredandwhiteoakspecies—thosethatareinmostdemandforlumberproductsincludingnorthernred,white,swampwhite,andburoaks(Fig.7).
0
100
200
300
400
500
600
700
800
900
1,000
0-20 21-40 41-60 61-80 81-100 Greater
than 100
Are
a of
Tim
berla
nd (t
hous
and
acre
s)
Stand-age Class (years)
1983
1996
2004
2009
1983
1996
2004
2009
0
100
200
300
400
500
600
700
800
900
1,000
0-20 21-40 41-60 61-80 81-100 Greater
than 100
Are
a of
Tim
berla
nd (t
hous
and
acre
s)
Stand-age Class (years)
select red oaks
select white oaks
0
200
400
600
800
1,000
1,200
1,400
1,600
1980 1985 1990 1995 2000 2005 2010
Gro
win
g-st
ock
Volu
me
on T
imbe
rland
(mill
ion
cuft)
Inventory Year
Figure 5.— Age-class distribution of the oak/hickory forest-type group on low
quality sites (site index < 60) by inventory year, Wisconsin. Error bars show the
68 percent confidence interval.
Figure 6.— Age-class distribution of the oak/hickory forest-type group on
medium-high quality sites (site index ≥ 60) by inventory year, Wisconsin. Error
bars show the 68 percent confidence interval.
Figure 7.—Growing-stock volume of select red and white oaks on medium-
high productivity sites (site index ≥ 60) by inventory year, Wisconsin. Error bars
show the 68 percent confidence interval.
15
FOREST FEATURES
What This Means
WhiletheextentofoakforestsinWisconsinappearstobeslowlyincreasing,age-classdisparitiescontinue,especiallyonmedium-highqualitysites.Olderoakforestsonsitesofmediumtohighproductivityarebeinglostandoakforestsareregeneratingpoorly.Oakregenerationmaybedeclining,thoughtheratioofseedlingdensitytogrowing-stockvolumeappearssatisfactory.Growing-stockvolumeofeconomicallyimportantredandwhiteoakspeciesonmediumtohighqualitysitesremainedthesameorincreasedslightlyinthelast5yearspossiblyasaresultofincreasedknowledgeaboutproblemswithoakforestsinWisconsinandbettermanagementtechniques.
Land-use Change
Background
Informationonland-usechangeisimportantforunderstandingthefuturedirectionoflanduseinWisconsin.Inpresettlementtimes,therewereapproximately22millionacresofforestlandwithanadditional9.6millionacresofsavanna(Curtis1959).Mostofthechangeinforestlandareaoccurredbeforethefirstforestinventoryinthe1930s.Inthisreport,wefocusonthechangeinforestareabetween2004and2009.
What we found
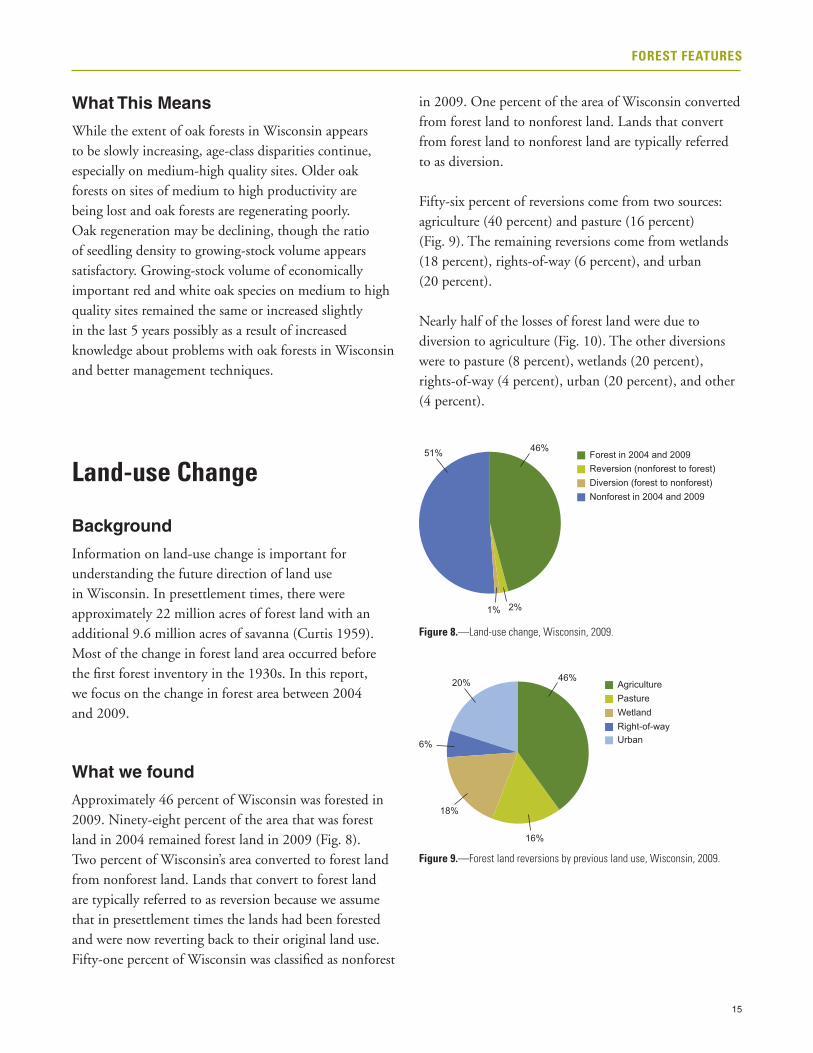
Approximately46percentofWisconsinwasforestedin2009.Ninety-eightpercentoftheareathatwasforestlandin2004remainedforestlandin2009(Fig.8).TwopercentofWisconsin’sareaconvertedtoforestlandfromnonforestland.Landsthatconverttoforestlandaretypicallyreferredtoasreversionbecauseweassumethatinpresettlementtimesthelandshadbeenforestedandwerenowrevertingbacktotheiroriginallanduse.Fifty-onepercentofWisconsinwasclassifiedasnonforest
Forest in 2004 and 2009
Reversion (nonforest to forest)
Diversion (forest to nonforest)
Nonforest in 2004 and 2009
1%
51% 46%
2%
18%
20% 46%
16%
6%
Agriculture
Pasture
Wetland
Right-of-way
Urban
in2009.OnepercentoftheareaofWisconsinconvertedfromforestlandtononforestland.Landsthatconvertfromforestlandtononforestlandaretypicallyreferredtoasdiversion.
Fifty-sixpercentofreversionscomefromtwosources:agriculture(40percent)andpasture(16percent)(Fig.9).Theremainingreversionscomefromwetlands(18percent),rights-of-way(6percent),andurban(20percent).
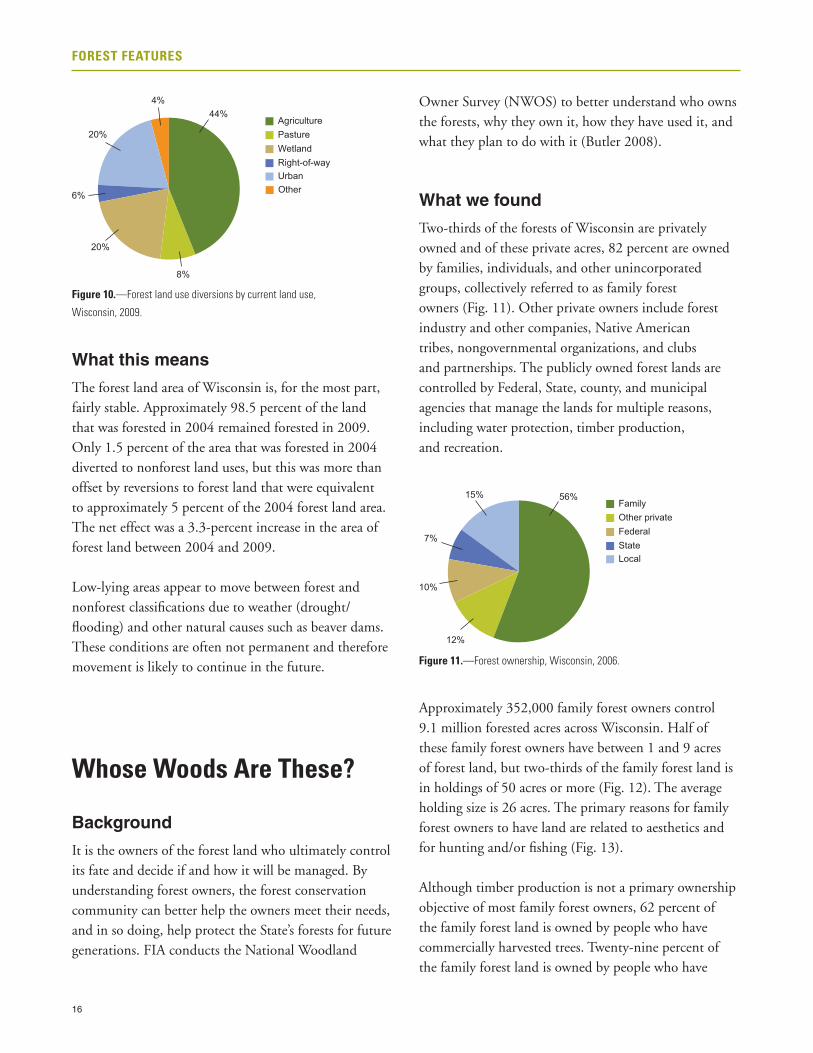
Nearlyhalfofthelossesofforestlandwereduetodiversiontoagriculture(Fig.10).Theotherdiversionsweretopasture(8percent),wetlands(20percent),rights-of-way(4percent),urban(20percent),andother(4percent).
Figure 8.—Land-use change, Wisconsin, 2009.
Figure 9.—Forest land reversions by previous land use, Wisconsin, 2009.
16
FOREST FEATURES
What this means
TheforestlandareaofWisconsinis,forthemostpart,fairlystable.Approximately98.5percentofthelandthatwasforestedin2004remainedforestedin2009.Only1.5percentoftheareathatwasforestedin2004divertedtononforestlanduses,butthiswasmorethanoffsetbyreversionstoforestlandthatwereequivalenttoapproximately5percentofthe2004forestlandarea.Theneteffectwasa3.3-percentincreaseintheareaofforestlandbetween2004and2009.
Low-lyingareasappeartomovebetweenforestandnonforestclassificationsduetoweather(drought/flooding)andothernaturalcausessuchasbeaverdams.Theseconditionsareoftennotpermanentandthereforemovementislikelytocontinueinthefuture.
Whose Woods Are These?
Background
Itistheownersoftheforestlandwhoultimatelycontrolitsfateanddecideifandhowitwillbemanaged.Byunderstandingforestowners,theforestconservationcommunitycanbetterhelptheownersmeettheirneeds,andinsodoing,helpprotecttheState’sforestsforfuturegenerations.FIAconductstheNationalWoodland
OwnerSurvey(NWOS)tobetterunderstandwhoownstheforests,whytheyownit,howtheyhaveusedit,andwhattheyplantodowithit(Butler2008).
What we found
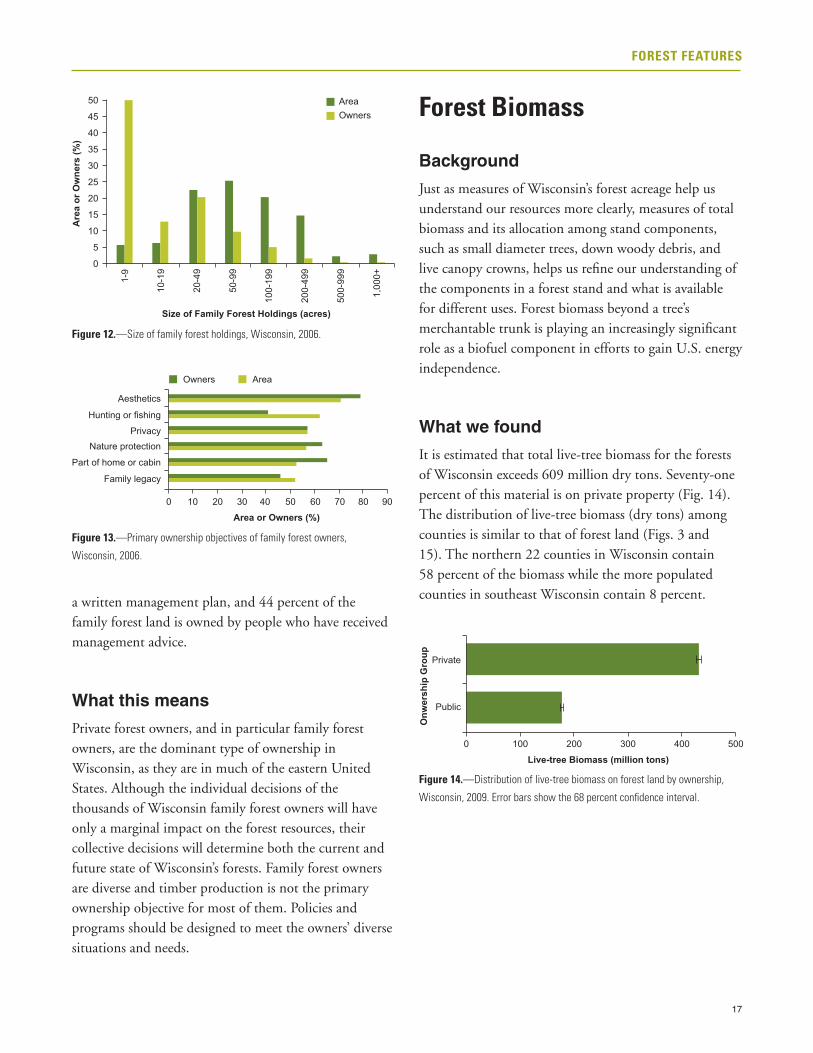
Two-thirdsoftheforestsofWisconsinareprivatelyownedandoftheseprivateacres,82percentareownedbyfamilies,individuals,andotherunincorporatedgroups,collectivelyreferredtoasfamilyforestowners(Fig.11).Otherprivateownersincludeforestindustryandothercompanies,NativeAmericantribes,nongovernmentalorganizations,andclubsandpartnerships.ThepubliclyownedforestlandsarecontrolledbyFederal,State,county,andmunicipalagenciesthatmanagethelandsformultiplereasons,includingwaterprotection,timberproduction,andrecreation.
10%
15% 56%
12%
7%
Family
Other private
Federal
State
Local
20%
20%
4%
44%
8%
6%
Agriculture
Pasture
Wetland
Right-of-way
Urban
Other
Figure 10.—Forest land use diversions by current land use,
Wisconsin, 2009.
Approximately352,000familyforestownerscontrol9.1millionforestedacresacrossWisconsin.Halfofthesefamilyforestownershavebetween1and9acresofforestland,buttwo-thirdsofthefamilyforestlandisinholdingsof50acresormore(Fig.12).Theaverageholdingsizeis26acres.Theprimaryreasonsforfamilyforestownerstohavelandarerelatedtoaestheticsandforhuntingand/orfishing(Fig.13).
Althoughtimberproductionisnotaprimaryownershipobjectiveofmostfamilyforestowners,62percentofthefamilyforestlandisownedbypeoplewhohavecommerciallyharvestedtrees.Twenty-ninepercentofthefamilyforestlandisownedbypeoplewhohave
Figure 11.—Forest ownership, Wisconsin, 2006.
17
FOREST FEATURES
awrittenmanagementplan,and44percentofthefamilyforestlandisownedbypeoplewhohavereceivedmanagementadvice.
What this means
Privateforestowners,andinparticularfamilyforestowners,arethedominanttypeofownershipinWisconsin,astheyareinmuchoftheeasternUnitedStates.AlthoughtheindividualdecisionsofthethousandsofWisconsinfamilyforestownerswillhaveonlyamarginalimpactontheforestresources,theircollectivedecisionswilldetermineboththecurrentandfuturestateofWisconsin’sforests.Familyforestownersarediverseandtimberproductionisnottheprimaryownershipobjectiveformostofthem.Policiesandprogramsshouldbedesignedtomeettheowners’diversesituationsandneeds.
Forest Biomass
Background
JustasmeasuresofWisconsin’sforestacreagehelpusunderstandourresourcesmoreclearly,measuresoftotalbiomassanditsallocationamongstandcomponents,suchassmalldiametertrees,downwoodydebris,andlivecanopycrowns,helpsusrefineourunderstandingofthecomponentsinaforeststandandwhatisavailablefordifferentuses.Forestbiomassbeyondatree’smerchantabletrunkisplayinganincreasinglysignificantroleasabiofuelcomponentineffortstogainU.S.energyindependence.
What we found
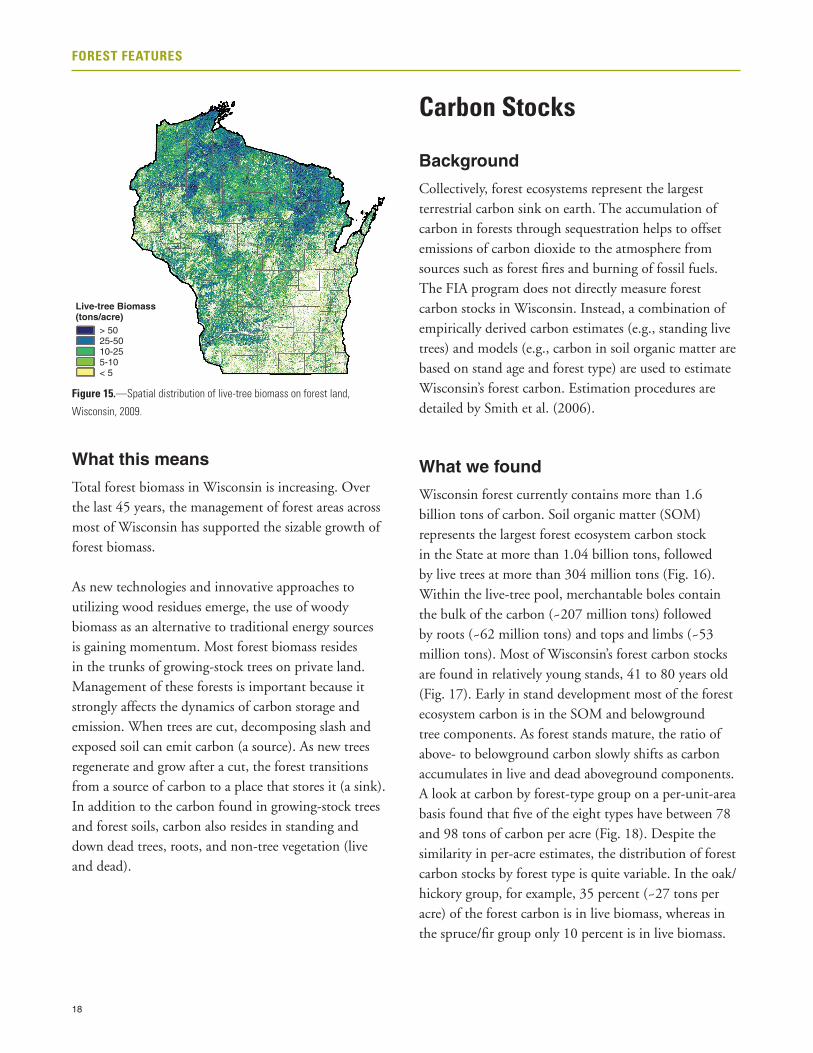
Itisestimatedthattotallive-treebiomassfortheforestsofWisconsinexceeds609milliondrytons.Seventy-onepercentofthismaterialisonprivateproperty(Fig.14).Thedistributionoflive-treebiomass(drytons)amongcountiesissimilartothatofforestland(Figs.3and15).Thenorthern22countiesinWisconsincontain58percentofthebiomasswhilethemorepopulatedcountiesinsoutheastWisconsincontain8percent.
Area
Owners
0
5
10
15
20
25
30
35
40
45
50
1-9
10
-19
20
-49
50
-99
10
0-1
99
20
0-4
99
50
0-9
99
1,0
00
+
Are
a or
Ow
ners
(%)
Size of Family Forest Holdings (acres)
0 10 20 30 40 50 60 70 80 90
Family legacy
Part of home or cabin
Nature protection
Privacy
Hunting or fishing
Aesthetics
Area or Owners (%)
Owners Area
Figure 12.—Size of family forest holdings, Wisconsin, 2006.
Figure 13.—Primary ownership objectives of family forest owners,
Wisconsin, 2006.
0 100 200 300 400 500
Public
Private
Live-tree Biomass (million tons)
Onw
ersh
ip G
roup
Figure 14.—Distribution of live-tree biomass on forest land by ownership,
Wisconsin, 2009. Error bars show the 68 percent confidence interval.
18
FOREST FEATURES
What this means
TotalforestbiomassinWisconsinisincreasing.Overthelast45years,themanagementofforestareasacrossmostofWisconsinhassupportedthesizablegrowthofforestbiomass.
Asnewtechnologiesandinnovativeapproachestoutilizingwoodresiduesemerge,theuseofwoodybiomassasanalternativetotraditionalenergysourcesisgainingmomentum.Mostforestbiomassresidesinthetrunksofgrowing-stocktreesonprivateland.Managementoftheseforestsisimportantbecauseitstronglyaffectsthedynamicsofcarbonstorageandemission.Whentreesarecut,decomposingslashandexposedsoilcanemitcarbon(asource).Asnewtreesregenerateandgrowafteracut,theforesttransitionsfromasourceofcarbontoaplacethatstoresit(asink).Inadditiontothecarbonfoundingrowing-stocktreesandforestsoils,carbonalsoresidesinstandinganddowndeadtrees,roots,andnon-treevegetation(liveanddead).
Carbon Stocks
Background
Collectively,forestecosystemsrepresentthelargestterrestrialcarbonsinkonearth.Theaccumulationofcarboninforeststhroughsequestrationhelpstooffsetemissionsofcarbondioxidetotheatmospherefromsourcessuchasforestfiresandburningoffossilfuels.TheFIAprogramdoesnotdirectlymeasureforestcarbonstocksinWisconsin.Instead,acombinationofempiricallyderivedcarbonestimates(e.g.,standinglivetrees)andmodels(e.g.,carboninsoilorganicmatterarebasedonstandageandforesttype)areusedtoestimateWisconsin’sforestcarbon.EstimationproceduresaredetailedbySmithetal.(2006).
What we found
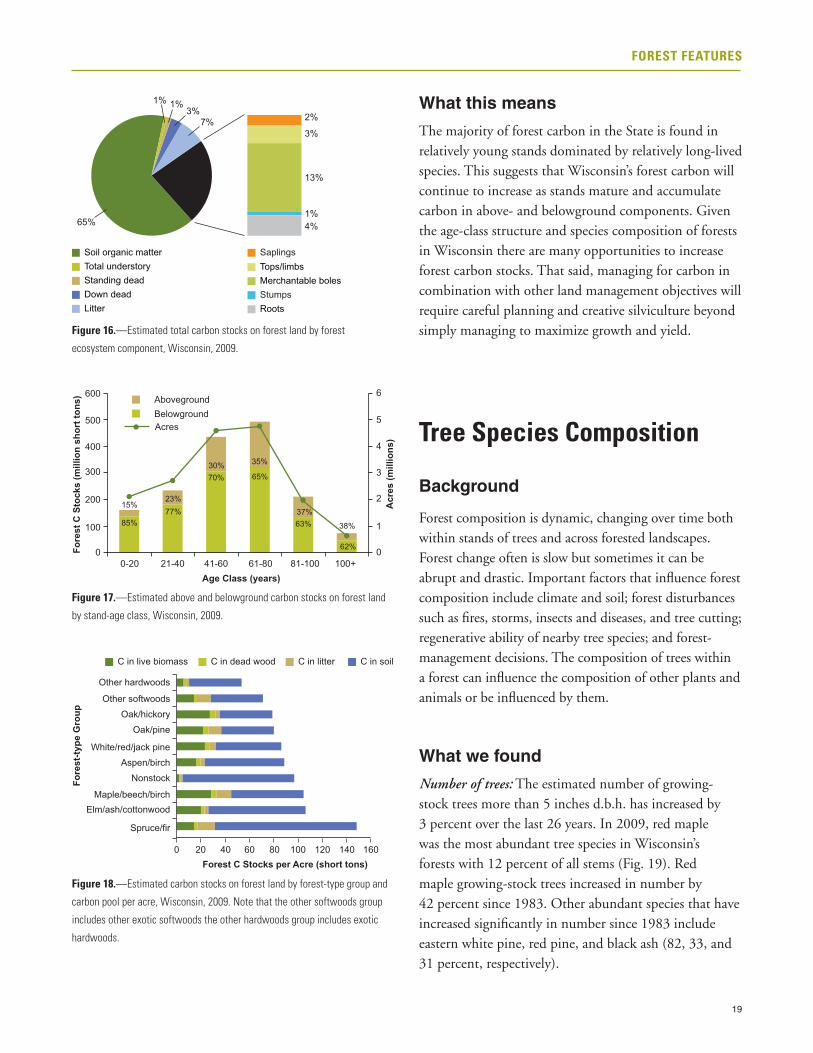
Wisconsinforestcurrentlycontainsmorethan1.6billiontonsofcarbon.Soilorganicmatter(SOM)representsthelargestforestecosystemcarbonstockintheStateatmorethan1.04billiontons,followedbylivetreesatmorethan304milliontons(Fig.16).Withinthelive-treepool,merchantablebolescontainthebulkofthecarbon(~207milliontons)followedbyroots(~62milliontons)andtopsandlimbs(~53milliontons).MostofWisconsin’sforestcarbonstocksarefoundinrelativelyyoungstands,41to80yearsold(Fig.17).EarlyinstanddevelopmentmostoftheforestecosystemcarbonisintheSOMandbelowgroundtreecomponents.Asforeststandsmature,theratioofabove-tobelowgroundcarbonslowlyshiftsascarbonaccumulatesinliveanddeadabovegroundcomponents.Alookatcarbonbyforest-typegrouponaper-unit-areabasisfoundthatfiveoftheeighttypeshavebetween78and98tonsofcarbonperacre(Fig.18).Despitethesimilarityinper-acreestimates,thedistributionofforestcarbonstocksbyforesttypeisquitevariable.Intheoak/hickorygroup,forexample,35percent(~27tonsperacre)oftheforestcarbonisinlivebiomass,whereasinthespruce/firgrouponly10percentisinlivebiomass.
Figure 15.—Spatial distribution of live-tree biomass on forest land,
Wisconsin, 2009.
Live-tree Biomass(tons/acre) > 50 25-50 10-25 5-10 < 5
19
FOREST FEATURES
What this means
ThemajorityofforestcarbonintheStateisfoundinrelativelyyoungstandsdominatedbyrelativelylong-livedspecies.ThissuggeststhatWisconsin’sforestcarbonwillcontinuetoincreaseasstandsmatureandaccumulatecarboninabove-andbelowgroundcomponents.Giventheage-classstructureandspeciescompositionofforestsinWisconsintherearemanyopportunitiestoincreaseforestcarbonstocks.Thatsaid,managingforcarbonincombinationwithotherlandmanagementobjectiveswillrequirecarefulplanningandcreativesilviculturebeyondsimplymanagingtomaximizegrowthandyield.
Tree Species Composition
Background
Forestcompositionisdynamic,changingovertimebothwithinstandsoftreesandacrossforestedlandscapes.Forestchangeoftenisslowbutsometimesitcanbeabruptanddrastic.Importantfactorsthatinfluenceforestcompositionincludeclimateandsoil;forestdisturbancessuchasfires,storms,insectsanddiseases,andtreecutting;regenerativeabilityofnearbytreespecies;andforest-managementdecisions.Thecompositionoftreeswithinaforestcaninfluencethecompositionofotherplantsandanimalsorbeinfluencedbythem.
What we found
Number of trees:Theestimatednumberofgrowing-stocktreesmorethan5inchesd.b.h.hasincreasedby3percentoverthelast26years.In2009,redmaplewasthemostabundanttreespeciesinWisconsin’sforestswith12percentofallstems(Fig.19).Redmaplegrowing-stocktreesincreasedinnumberby42percentsince1983.Otherabundantspeciesthathaveincreasedsignificantlyinnumbersince1983includeeasternwhitepine,redpine,andblackash(82,33,and31percent,respectively).
65%
1%
3%
7%
1%
Soil organic matter
Total understory
Standing dead
Down dead
Litter
Saplings
Tops/limbs
Merchantable boles
Stumps
Roots
1%
4%
13%
3%
2%
Aboveground
Belowground
Acres
85%
77%
70% 65%
63%
62%
15% 23%
30% 35%
37%
38%
0
1
2
3
4
5
6
0
100
200
300
400
500
600
0-20 21-40 41-60 61-80 81-100 100+
Acr
es (m
illio
ns)
Fore
st C
Sto
cks
(mill
ion
shor
t ton
s)
Age Class (years)
C in live biomass C in dead wood C in litter C in soil
0 20 40 60 80 100 120 140 160
Spruce/fir
Elm/ash/cottonwood
Maple/beech/birch
Nonstock
Aspen/birch
White/red/jack pine
Oak/pine
Oak/hickory
Other softwoods
Other hardwoods
Forest C Stocks per Acre (short tons)
Fore
st-ty
pe G
roup
Figure 16.—Estimated total carbon stocks on forest land by forest
ecosystem component, Wisconsin, 2009.
Figure 17.—Estimated above and belowground carbon stocks on forest land
by stand-age class, Wisconsin, 2009.
Figure 18.—Estimated carbon stocks on forest land by forest-type group and
carbon pool per acre, Wisconsin, 2009. Note that the other softwoods group
includes other exotic softwoods the other hardwoods group includes exotic
hardwoods.
20
FOREST FEATURES
Species
0 500 1,000 1,500 2,000 2,500
White oak
Sugar maple
Red pine
Red maple
Quaking aspen
Northern white-cedar
Northern red oak
Eastern white pine
Bigtooth aspen
American basswood
Growing-stock Volume on Timberland (million ft3)
1983
1996
2004
2009
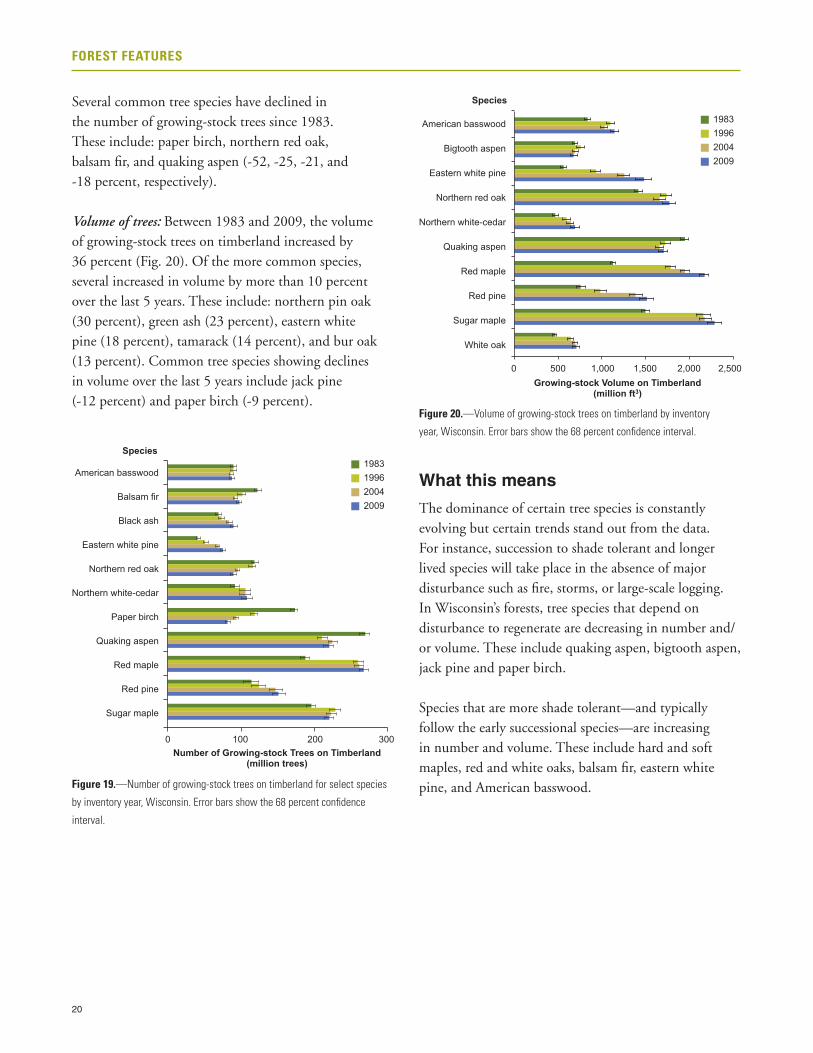
Severalcommontreespecieshavedeclinedinthenumberofgrowing-stocktreessince1983.Theseinclude:paperbirch,northernredoak,balsamfir,andquakingaspen(-52,-25,-21,and-18percent,respectively).
Volume of trees:Between1983and2009,thevolumeofgrowing-stocktreesontimberlandincreasedby36percent(Fig.20).Ofthemorecommonspecies,severalincreasedinvolumebymorethan10percentoverthelast5years.Theseinclude:northernpinoak(30percent),greenash(23percent),easternwhitepine(18percent),tamarack(14percent),andburoak(13percent).Commontreespeciesshowingdeclinesinvolumeoverthelast5yearsincludejackpine(-12percent)andpaperbirch(-9percent).
0 100 200 300
Sugar maple
Red pine
Red maple
Quaking aspen
Paper birch
Northern white-cedar
Northern red oak
Eastern white pine
Black ash
Balsam fir
American basswood
Number of Growing-stock Trees on Timberland (million trees)
Species 1983
1996
2004
2009
Figure 19.—Number of growing-stock trees on timberland for select species
by inventory year, Wisconsin. Error bars show the 68 percent confidence
interval.
Figure 20.—Volume of growing-stock trees on timberland by inventory
year, Wisconsin. Error bars show the 68 percent confidence interval.
What this means
Thedominanceofcertaintreespeciesisconstantlyevolvingbutcertaintrendsstandoutfromthedata.Forinstance,successiontoshadetolerantandlongerlivedspecieswilltakeplaceintheabsenceofmajordisturbancesuchasfire,storms,orlarge-scalelogging.InWisconsin’sforests,treespeciesthatdependondisturbancetoregeneratearedecreasinginnumberand/orvolume.Theseincludequakingaspen,bigtoothaspen,jackpineandpaperbirch.
Speciesthataremoreshadetolerant—andtypicallyfollowtheearlysuccessionalspecies—areincreasinginnumberandvolume.Theseincludehardandsoftmaples,redandwhiteoaks,balsamfir,easternwhitepine,andAmericanbasswood.
21
FOREST FEATURES
How Thick Are the Woods?
Background
Thedensityofaforestindicatesthecurrentphaseofstanddevelopmentandhasimplicationsfordiametergrowth,treemortality,andyield.Densityistypicallymeasuredintermsofnumberoftreesorbasalareaperunitarea.
What we found
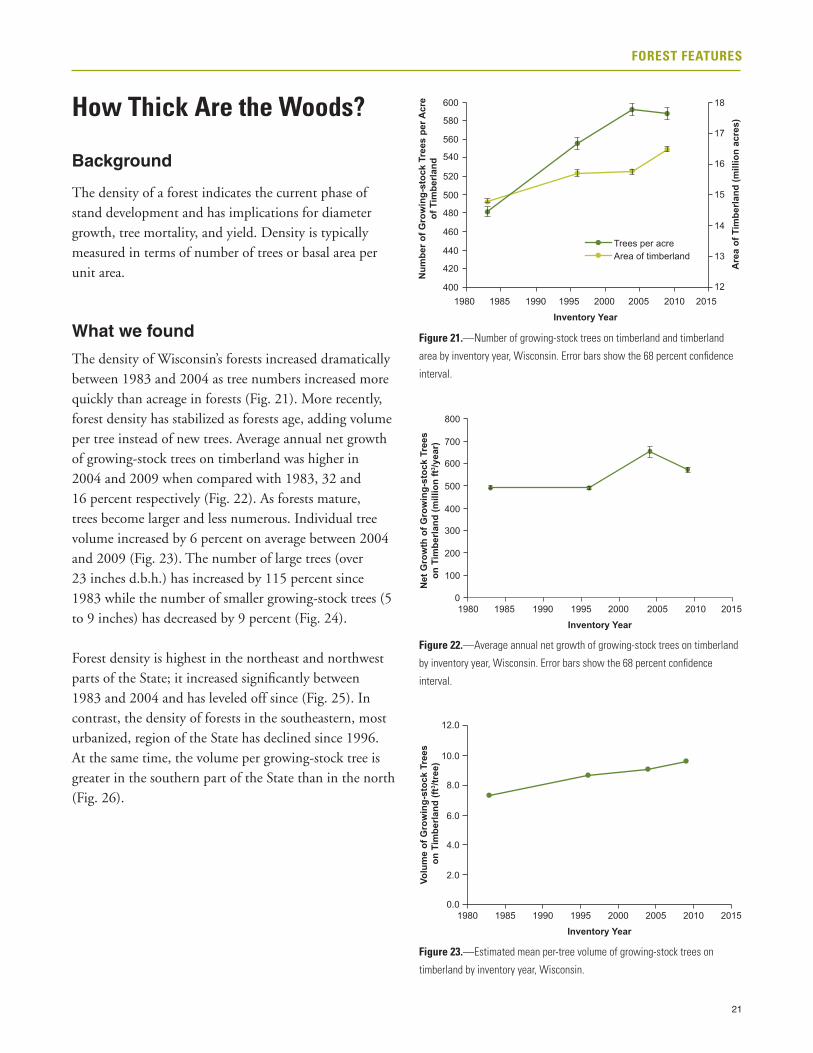
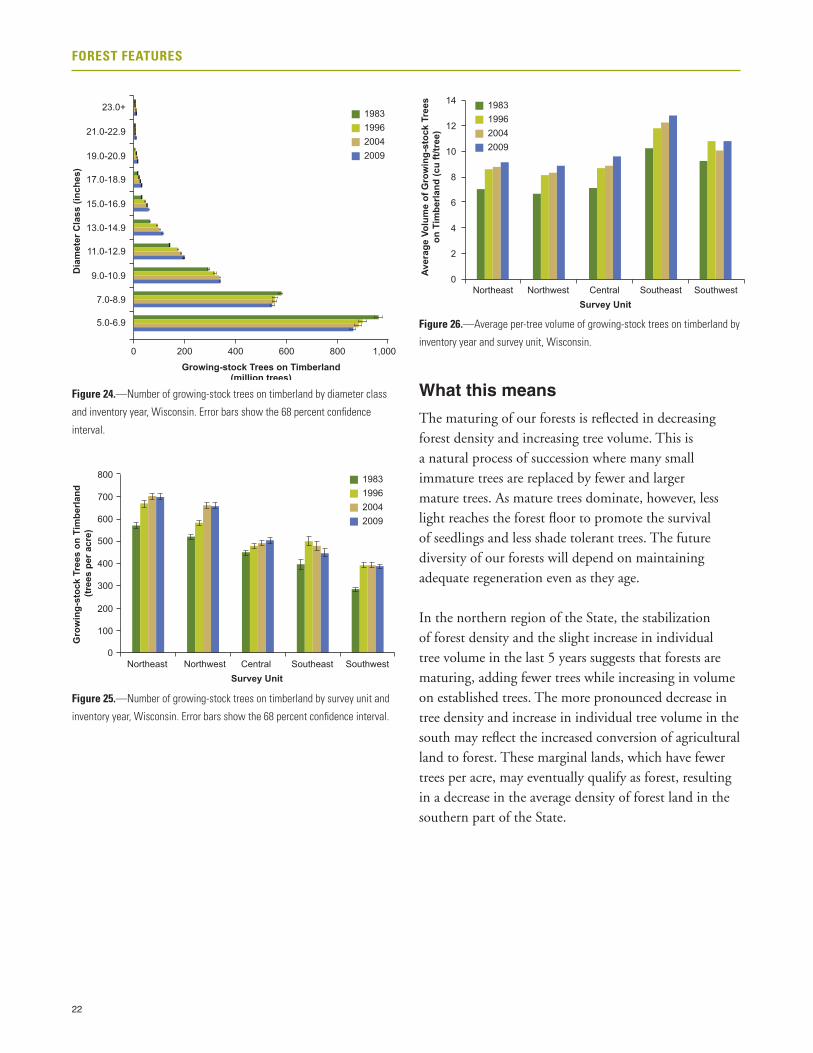
ThedensityofWisconsin’sforestsincreaseddramaticallybetween1983and2004astreenumbersincreasedmorequicklythanacreageinforests(Fig.21).Morerecently,forestdensityhasstabilizedasforestsage,addingvolumepertreeinsteadofnewtrees.Averageannualnetgrowthofgrowing-stocktreesontimberlandwashigherin2004and2009whencomparedwith1983,32and16percentrespectively(Fig.22).Asforestsmature,treesbecomelargerandlessnumerous.Individualtreevolumeincreasedby6percentonaveragebetween2004and2009(Fig.23).Thenumberoflargetrees(over23inchesd.b.h.)hasincreasedby115percentsince1983whilethenumberofsmallergrowing-stocktrees(5to9inches)hasdecreasedby9percent(Fig.24).
ForestdensityishighestinthenortheastandnorthwestpartsoftheState;itincreasedsignificantlybetween1983and2004andhasleveledoffsince(Fig.25).Incontrast,thedensityofforestsinthesoutheastern,mosturbanized,regionoftheStatehasdeclinedsince1996.Atthesametime,thevolumepergrowing-stocktreeisgreaterinthesouthernpartoftheStatethaninthenorth(Fig.26).
Trees per acre
Area of timberland
12
13
14
15
16
17
18
400
420
440
460
480
500
520
540
560
580
600
1980 1985 1990 1995 2000 2005 2010 2015
Are
a of
Tim
berla
nd (m
illio
n ac
res)
Num
ber o
f Gro
win
g-st
ock
Tree
s pe
r Acr
e of
Tim
berla
nd
Inventory Year
0
100
200
300
400
500
600
700
800
1980 1985 1990 1995 2000 2005 20152010
Net
Gro
wth
of G
row
ing-
stoc
k Tr
ees
on T
imbe
rland
(mill
ion
ft3 /yea
r)
Inventory Year
Figure 21.—Number of growing-stock trees on timberland and timberland
area by inventory year, Wisconsin. Error bars show the 68 percent confidence
interval.
Figure 22.—Average annual net growth of growing-stock trees on timberland
by inventory year, Wisconsin. Error bars show the 68 percent confidence
interval.
0.0
2.0
4.0
6.0
8.0
10.0
12.0
1980 1985 1990 1995 2000 2005 2010 2015
Volu
me
of G
row
ing-
stoc
k Tr
ees
on T
imbe
rland
(ft3 /t
ree)
Inventory Year
Figure 23.—Estimated mean per-tree volume of growing-stock trees on
timberland by inventory year, Wisconsin.
22
FOREST FEATURES
What this means
Thematuringofourforestsisreflectedindecreasingforestdensityandincreasingtreevolume.Thisisanaturalprocessofsuccessionwheremanysmallimmaturetreesarereplacedbyfewerandlargermaturetrees.Asmaturetreesdominate,however,lesslightreachestheforestfloortopromotethesurvivalofseedlingsandlessshadetoleranttrees.Thefuturediversityofourforestswilldependonmaintainingadequateregenerationevenastheyage.
InthenorthernregionoftheState,thestabilizationofforestdensityandtheslightincreaseinindividualtreevolumeinthelast5yearssuggeststhatforestsarematuring,addingfewertreeswhileincreasinginvolumeonestablishedtrees.Themorepronounceddecreaseintreedensityandincreaseinindividualtreevolumeinthesouthmayreflecttheincreasedconversionofagriculturallandtoforest.Thesemarginallands,whichhavefewertreesperacre,mayeventuallyqualifyasforest,resultinginadecreaseintheaveragedensityofforestlandinthesouthernpartoftheState.
1983
1996
2004
2009
0
100
200
300
400
500
600
700
800
Northeast Northwest Central Southeast Southwest
Gro
win
g-st
ock
Tree
s on
Tim
berla
nd
(tree
s pe
r acr
e)
Survey Unit
1983
1996
2004
2009
Northeast Northwest Central Southeast Southwest
Survey Unit
0
2
4
6
8
10
12
14
Aver
age
Volu
me
of G
row
ing-
stoc
k Tr
ees
on T
imbe
rland
(cu
ft/tr
ee)
Figure 25.—Number of growing-stock trees on timberland by survey unit and
inventory year, Wisconsin. Error bars show the 68 percent confidence interval.
Figure 26.—Average per-tree volume of growing-stock trees on timberland by
inventory year and survey unit, Wisconsin.0 200 400 600 800 1,000
5.0-6.9
7.0-8.9
9.0-10.9
11.0-12.9
13.0-14.9
15.0-16.9
17.0-18.9
19.0-20.9
21.0-22.9
23.0+
Growing-stock Trees on Timberland (million trees)
Dia
met
er C
lass
(inc
hes)
1983
1996
2004
2009
Figure 24.—Number of growing-stock trees on timberland by diameter class
and inventory year, Wisconsin. Error bars show the 68 percent confidence
interval.
23
FOREST FEATURES
Forest Growth
Background
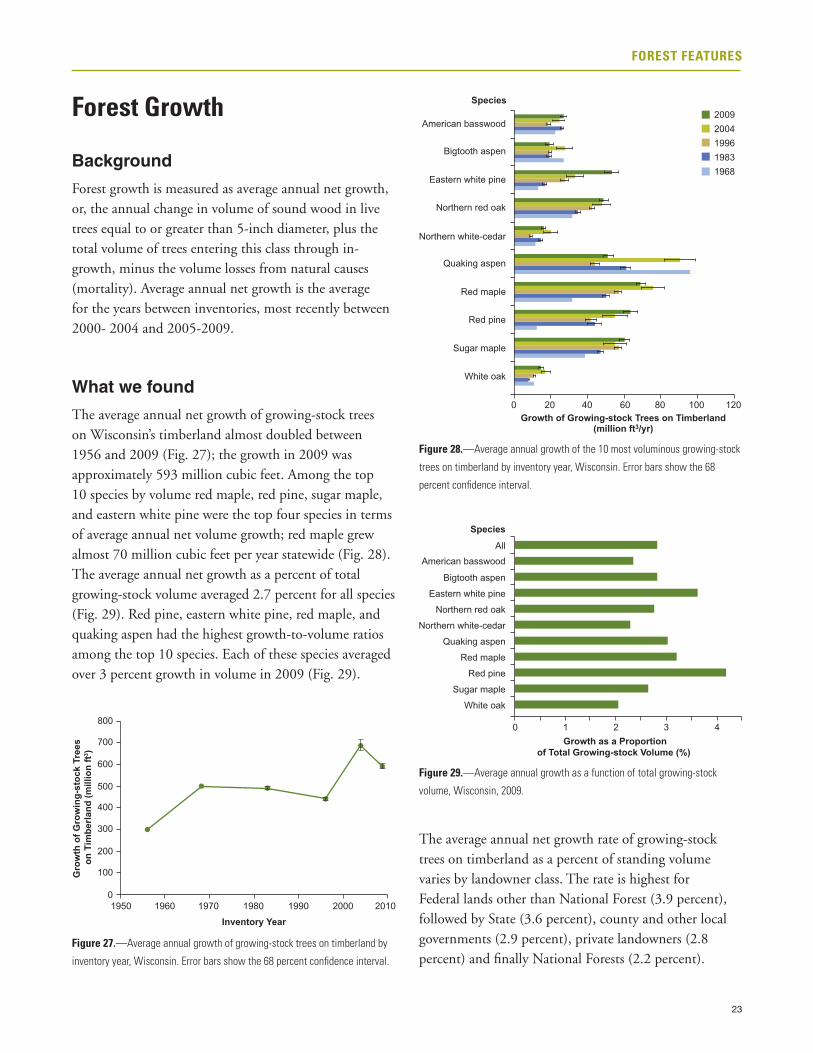
Forestgrowthismeasuredasaverageannualnetgrowth,or,theannualchangeinvolumeofsoundwoodinlivetreesequaltoorgreaterthan5-inchdiameter,plusthetotalvolumeoftreesenteringthisclassthroughin-growth,minusthevolumelossesfromnaturalcauses(mortality).Averageannualnetgrowthistheaveragefortheyearsbetweeninventories,mostrecentlybetween2000-2004and2005-2009.
What we found
Theaverageannualnetgrowthofgrowing-stocktreesonWisconsin’stimberlandalmostdoubledbetween1956and2009(Fig.27);thegrowthin2009wasapproximately593millioncubicfeet.Amongthetop10speciesbyvolumeredmaple,redpine,sugarmaple,andeasternwhitepinewerethetopfourspeciesintermsofaverageannualnetvolumegrowth;redmaplegrewalmost70millioncubicfeetperyearstatewide(Fig.28).Theaverageannualnetgrowthasapercentoftotalgrowing-stockvolumeaveraged2.7percentforallspecies(Fig.29).Redpine,easternwhitepine,redmaple,andquakingaspenhadthehighestgrowth-to-volumeratiosamongthetop10species.Eachofthesespeciesaveragedover3percentgrowthinvolumein2009(Fig.29).
0
100
200
300
400
500
600
700
800
1950 1960 1970 1980 1990 2000 2010
Gro
wth
of G
row
ing-
stoc
k Tr
ees
on T
imbe
rland
(mill
ion
ft3 )
Inventory Year
Species 2009
2004
1996
1983
1968
0 20 40 60 80 100 120
White oak
Sugar maple
Red pine
Red maple
Quaking aspen
Northern white-cedar
Northern red oak
Eastern white pine
Bigtooth aspen
American basswood
Growth of Growing-stock Trees on Timberland (million ft3/yr)
Species
0 1 2 3 4
White oak
Sugar maple
Red pine
Red maple
Quaking aspen
Northern white-cedar
Northern red oak
Eastern white pine
Bigtooth aspen
American basswood
All
Growth as a Proportion of Total Growing-stock Volume (%)
Figure 27.—Average annual growth of growing-stock trees on timberland by
inventory year, Wisconsin. Error bars show the 68 percent confidence interval.
Figure 28.—Average annual growth of the 10 most voluminous growing-stock
trees on timberland by inventory year, Wisconsin. Error bars show the 68
percent confidence interval.
Figure 29.—Average annual growth as a function of total growing-stock
volume, Wisconsin, 2009.
Theaverageannualnetgrowthrateofgrowing-stocktreesontimberlandasapercentofstandingvolumevariesbylandownerclass.TherateishighestforFederallandsotherthanNationalForest(3.9percent),followedbyState(3.6percent),countyandotherlocalgovernments(2.9percent),privatelandowners(2.8percent)andfinallyNationalForests(2.2percent).
24
FOREST FEATURES
What this means
TheaverageannualnetgrowthofWisconsin’sforestshasanincreasingtrendfrom1956to2009indicatinganoverallsustainableresource.Whenannualgrowthisviewedrelativetothetotalgrowing-stockvolumeontimberland,allofthe10majorspeciesbyvolumeareaddingpositivegrowthinexcessof2percenteachyear.Asaresult,thesecommerciallyimportantspecies(withthepossibleexceptionoftheaspenspeciesforreasonsdiscussedbelow)shouldcontinuetoprovidewoodproductsandotherenvironmentalservicesforsocietywellintothefuture.
Growthprovidesonlyonepieceofthesustainabilityquestion,however.Informationonmortalityandremovalsisalsoneededtomonitorthechangingcompositionoftheforest.
Tree Removals
Background
Treesareremovedfromtimberlandtomeetavarietyofmanagementobjectivesorland-usechanges.Changesinthequantityofgrowingstockremovedhelptoidentifytrendsinland-usechangeandforestmanagement.Becauseremovalsaregenerallyobservedonalimitednumberofplots,theestimatesforremovalsshowgreatervariancethanthoseforgrowth,mortality,orarea.Likeforestgrowth,therateatwhichtreeswereremovedrepresentstheaverageannualgrowing-stockremovalsthatoccurredbetweeninventories,mostrecentlybetween2000-2004and2005-2009.
What we found
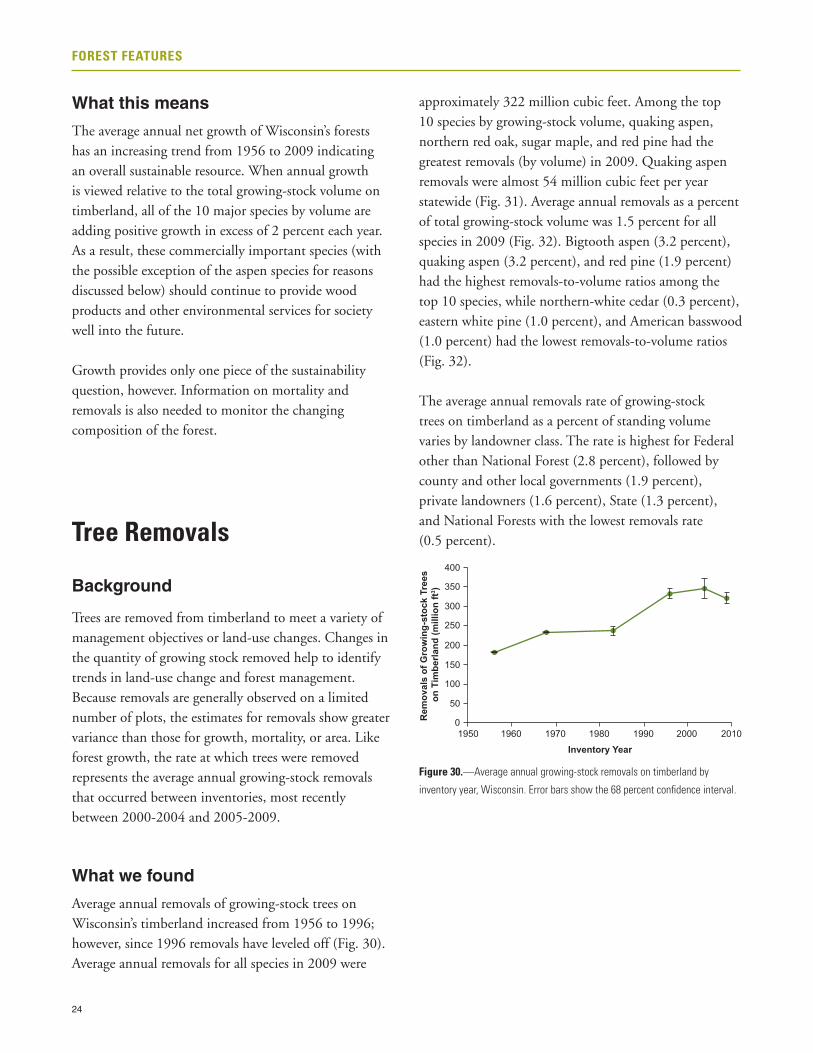
Averageannualremovalsofgrowing-stocktreesonWisconsin’stimberlandincreasedfrom1956to1996;however,since1996removalshaveleveledoff(Fig.30).Averageannualremovalsforallspeciesin2009were
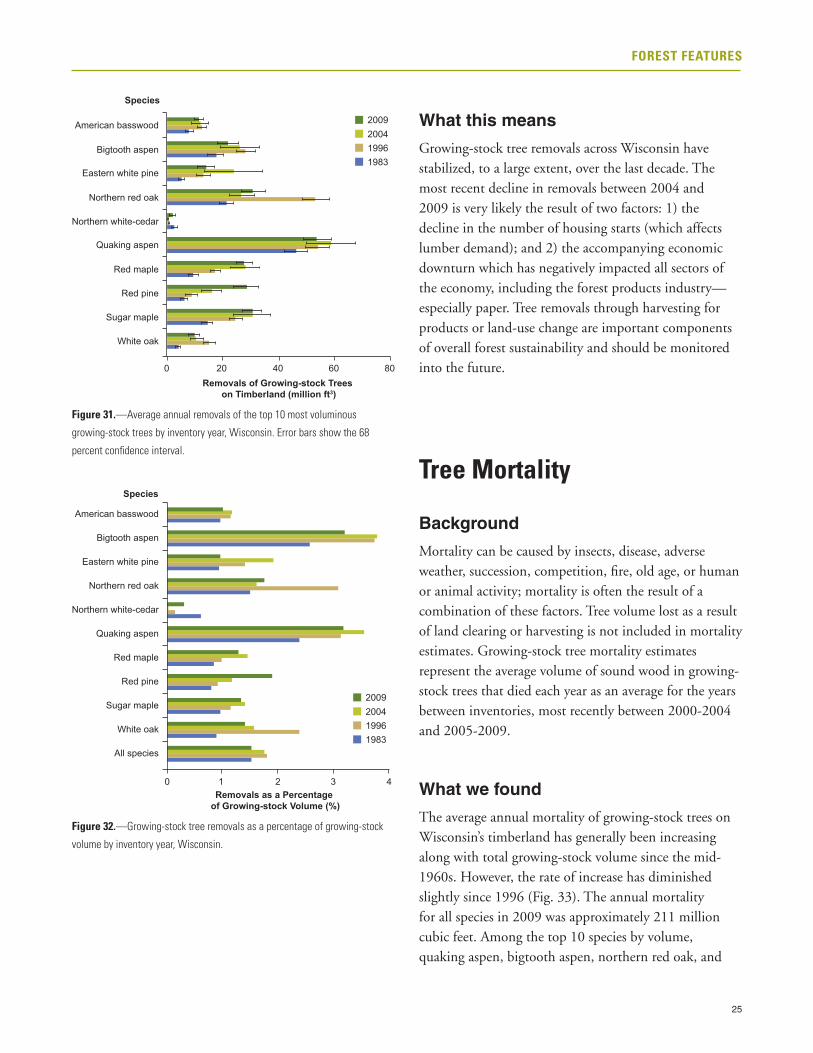
approximately322millioncubicfeet.Amongthetop10speciesbygrowing-stockvolume,quakingaspen,northernredoak,sugarmaple,andredpinehadthegreatestremovals(byvolume)in2009.Quakingaspenremovalswerealmost54millioncubicfeetperyearstatewide(Fig.31).Averageannualremovalsasapercentoftotalgrowing-stockvolumewas1.5percentforallspeciesin2009(Fig.32).Bigtoothaspen(3.2percent),quakingaspen(3.2percent),andredpine(1.9percent)hadthehighestremovals-to-volumeratiosamongthetop10species,whilenorthern-whitecedar(0.3percent),easternwhitepine(1.0percent),andAmericanbasswood(1.0percent)hadthelowestremovals-to-volumeratios(Fig.32).
Theaverageannualremovalsrateofgrowing-stocktreesontimberlandasapercentofstandingvolumevariesbylandownerclass.TherateishighestforFederalotherthanNationalForest(2.8percent),followedbycountyandotherlocalgovernments(1.9percent),privatelandowners(1.6percent),State(1.3percent),andNationalForestswiththelowestremovalsrate(0.5percent).
0
50
100
150
200
250
300
350
400
1950 1960 1970 1980 1990 2000 2010
Rem
oval
s of
Gro
win
g-st
ock
Tree
s on
Tim
berla
nd (m
illio
n ft3 )
Inventory Year
Figure 30.—Average annual growing-stock removals on timberland by
inventory year, Wisconsin. Error bars show the 68 percent confidence interval.
25
FOREST FEATURES
What this means
Growing-stocktreeremovalsacrossWisconsinhavestabilized,toalargeextent,overthelastdecade.Themostrecentdeclineinremovalsbetween2004and2009isverylikelytheresultoftwofactors:1)thedeclineinthenumberofhousingstarts(whichaffectslumberdemand);and2)theaccompanyingeconomicdownturnwhichhasnegativelyimpactedallsectorsoftheeconomy,includingtheforestproductsindustry—especiallypaper.Treeremovalsthroughharvestingforproductsorland-usechangeareimportantcomponentsofoverallforestsustainabilityandshouldbemonitoredintothefuture.
Tree Mortality
Background
Mortalitycanbecausedbyinsects,disease,adverseweather,succession,competition,fire,oldage,orhumanoranimalactivity;mortalityisoftentheresultofacombinationofthesefactors.Treevolumelostasaresultoflandclearingorharvestingisnotincludedinmortalityestimates.Growing-stocktreemortalityestimatesrepresenttheaveragevolumeofsoundwoodingrowing-stocktreesthatdiedeachyearasanaveragefortheyearsbetweeninventories,mostrecentlybetween2000-2004and2005-2009.
What we found
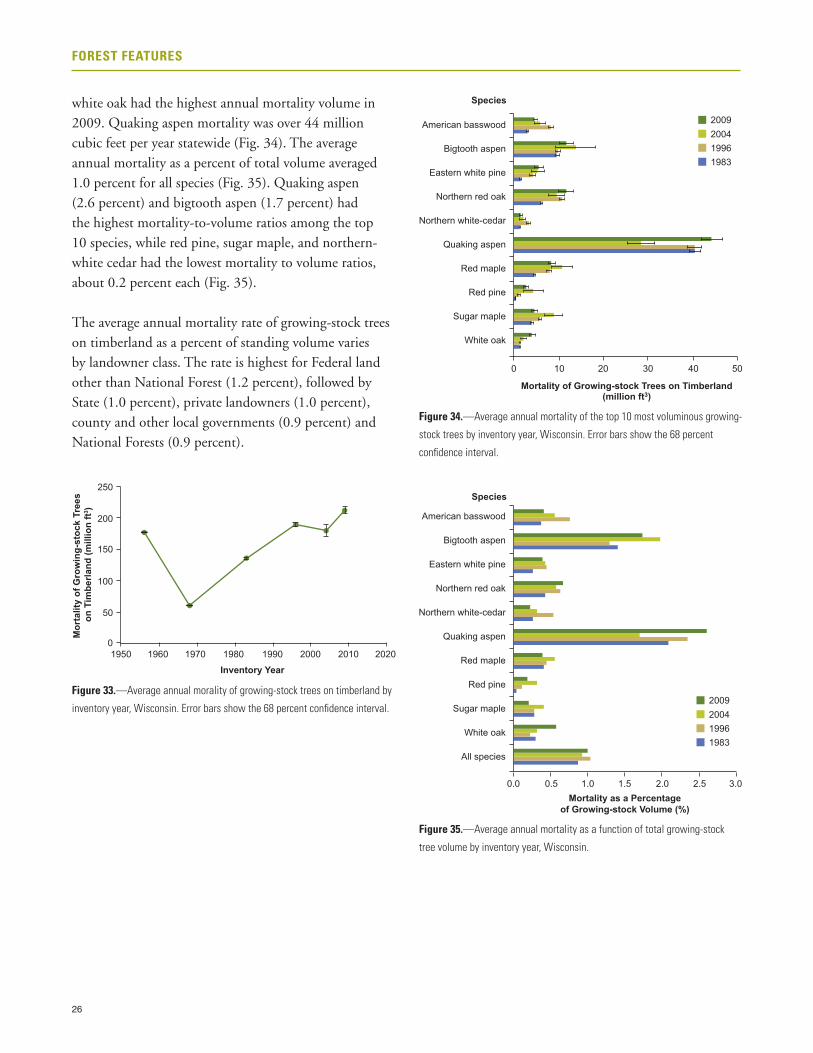
Theaverageannualmortalityofgrowing-stocktreesonWisconsin’stimberlandhasgenerallybeenincreasingalongwithtotalgrowing-stockvolumesincethemid-1960s.However,therateofincreasehasdiminishedslightlysince1996(Fig.33).Theannualmortalityforallspeciesin2009wasapproximately211millioncubicfeet.Amongthetop10speciesbyvolume,quakingaspen,bigtoothaspen,northernredoak,and
Species
2009
2004
1996
1983
0 20 40 60 80
White oak
Sugar maple
Red pine
Red maple
Quaking aspen
Northern white-cedar
Northern red oak
Eastern white pine
Bigtooth aspen
American basswood
Removals of Growing-stock Trees on Timberland (million ft3)
Species
2009
2004
1996
1983
0 1 2 3 4
All species
White oak
Sugar maple
Red pine
Red maple
Quaking aspen
Northern white-cedar
Northern red oak
Eastern white pine
Bigtooth aspen
American basswood
Removals as a Percentage of Growing-stock Volume (%)
Figure 31.—Average annual removals of the top 10 most voluminous
growing-stock trees by inventory year, Wisconsin. Error bars show the 68
percent confidence interval.
Figure 32.—Growing-stock tree removals as a percentage of growing-stock
volume by inventory year, Wisconsin.
26
FOREST FEATURES
whiteoakhadthehighestannualmortalityvolumein2009.Quakingaspenmortalitywasover44millioncubicfeetperyearstatewide(Fig.34).Theaverageannualmortalityasapercentoftotalvolumeaveraged1.0percentforallspecies(Fig.35).Quakingaspen(2.6percent)andbigtoothaspen(1.7percent)hadthehighestmortality-to-volumeratiosamongthetop10species,whileredpine,sugarmaple,andnorthern-whitecedarhadthelowestmortalitytovolumeratios,about0.2percenteach(Fig.35).
Theaverageannualmortalityrateofgrowing-stocktreesontimberlandasapercentofstandingvolumevariesbylandownerclass.TherateishighestforFederallandotherthanNationalForest(1.2percent),followedbyState(1.0percent),privatelandowners(1.0percent),countyandotherlocalgovernments(0.9percent)andNationalForests(0.9percent).
0
50
100
150
200
250
1950 1960 1970 1980 1990 2000 2010 2020
Mor
talit
y of
Gro
win
g-st
ock
Tree
s on
Tim
berla
nd (m
illio
n ft3 )
Inventory Year
Species
2009
2004
1996
1983
0 10 20 30 40 50
White oak
Sugar maple
Red pine
Red maple
Quaking aspen
Northern white-cedar
Northern red oak
Eastern white pine
Bigtooth aspen
American basswood
Mortality of Growing-stock Trees on Timberland (million ft3)
Species
2009
2004
1996
1983
0.0 0.5 1.0 1.5 2.0 2.5 3.0
All species
White oak
Sugar maple
Red pine
Red maple
Quaking aspen
Northern white-cedar
Northern red oak
Eastern white pine
Bigtooth aspen
American basswood
Mortality as a Percentage of Growing-stock Volume (%)
Figure 33.—Average annual morality of growing-stock trees on timberland by
inventory year, Wisconsin. Error bars show the 68 percent confidence interval.
Figure 34.—Average annual mortality of the top 10 most voluminous growing-
stock trees by inventory year, Wisconsin. Error bars show the 68 percent
confidence interval.
Figure 35.—Average annual mortality as a function of total growing-stock
tree volume by inventory year, Wisconsin.
27
FOREST FEATURES
What this means
TreemortalityacrossWisconsincontinuestoincrease,butmaybeslowingoverthelastdecade.Mortalityisanaturalprocessinforeststandsastheydevelopandchangeovertime.Quakingaspenandbigtoothaspenareshort-lived,pioneerspeciessoitcomesasnosurprisethattheyhavethehighestmortalityratesamongthetop10commercialspeciesinWisconsin.Treemortalityisacrucialcomponentofoverallforesthealthandshouldcontinuetobemonitored.
Growth-to-Removals Ratio
Background
Aprimarymeasureofsustainabilityisthenetannualgrowth-to-removals(G/R)ratio.TheG/Rratioisannualnetgrowthdividedbyremovalswherenetgrowthisequaltogrossgrowthminusmortality.Anumbergreaterthan1.0indicatesthatnetannualgrowthofthespeciesexceedsannualremovalsandthisremovalrateissustainable.Anumberlessthan1.0indicatesthatgrowthislessthanremovalsandthisspecieswillnotbesustainedifremovalscontinueatthislevelovertime.
What we found
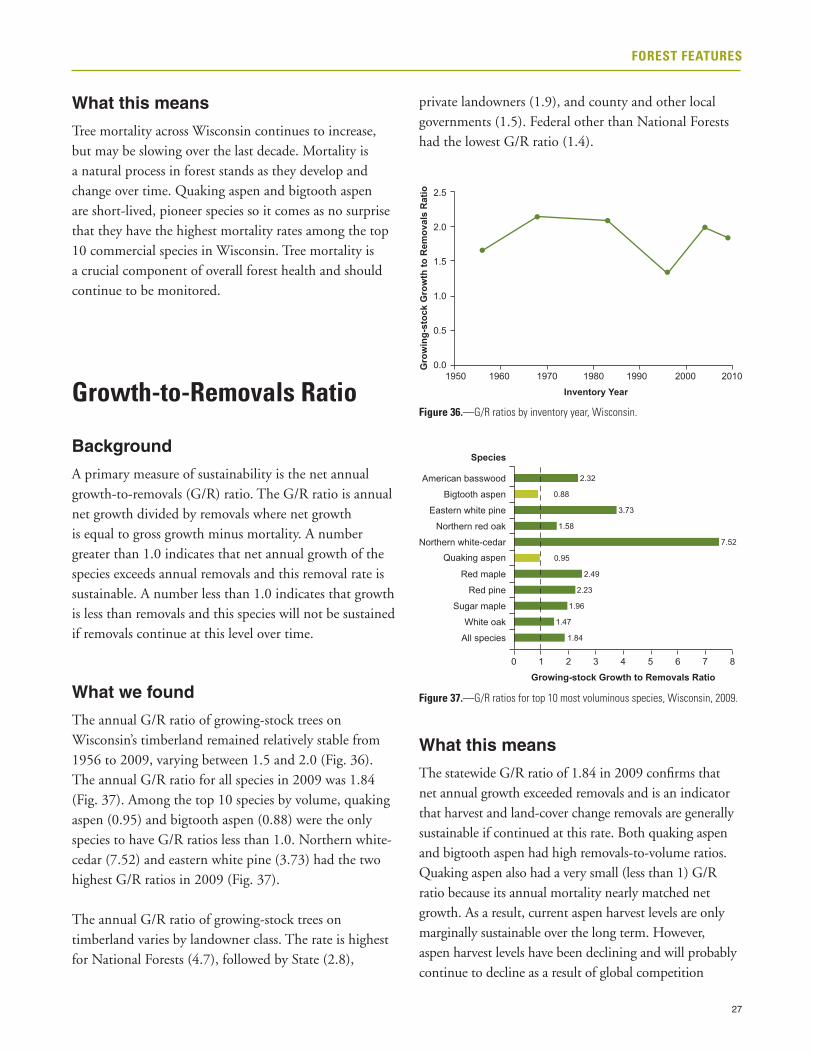
TheannualG/Rratioofgrowing-stocktreesonWisconsin’stimberlandremainedrelativelystablefrom1956to2009,varyingbetween1.5and2.0(Fig.36).TheannualG/Rratioforallspeciesin2009was1.84(Fig.37).Amongthetop10speciesbyvolume,quakingaspen(0.95)andbigtoothaspen(0.88)weretheonlyspeciestohaveG/Rratioslessthan1.0.Northernwhite-cedar(7.52)andeasternwhitepine(3.73)hadthetwohighestG/Rratiosin2009(Fig.37).
TheannualG/Rratioofgrowing-stocktreesontimberlandvariesbylandownerclass.TherateishighestforNationalForests(4.7),followedbyState(2.8),
privatelandowners(1.9),andcountyandotherlocalgovernments(1.5).FederalotherthanNationalForestshadthelowestG/Rratio(1.4).
0.0
0.5
1.0
1.5
2.0
2.5
1950 1960 1970 1980 1990 2000 2010
Gro
win
g-st
ock
Gro
wth
to R
emov
als
Rat
io
Inventory Year
Species
1.84
1.47
1.96
2.23
2.49
0.95
7.52
1.58
3.73
0.88
2.32
0 1 2 3 4 5 6 7 8
All species
White oak
Sugar maple
Red pine
Red maple
Quaking aspen
Northern white-cedar
Northern red oak
Eastern white pine
Bigtooth aspen
American basswood
Growing-stock Growth to Removals Ratio
What this means
ThestatewideG/Rratioof1.84in2009confirmsthatnetannualgrowthexceededremovalsandisanindicatorthatharvestandland-coverchangeremovalsaregenerallysustainableifcontinuedatthisrate.Bothquakingaspenandbigtoothaspenhadhighremovals-to-volumeratios.Quakingaspenalsohadaverysmall(lessthan1)G/Rratiobecauseitsannualmortalitynearlymatchednetgrowth.Asaresult,currentaspenharvestlevelsareonlymarginallysustainableoverthelongterm.However,aspenharvestlevelshavebeendecliningandwillprobablycontinuetodeclineasaresultofglobalcompetition
Figure 36.—G/R ratios by inventory year, Wisconsin.
Figure 37.—G/R ratios for top 10 most voluminous species, Wisconsin, 2009.
28
FOREST FEATURES
inthepaperandpulpindustriesandthedownturnintheeconomy.Asnotedpreviously,aspenareshort-lived,earlysuccessionalspeciesthatwillbereplacedbylatersuccessionalforesttypesovertimeregardlessofharvestintensity.Ofthethreecomponentsofchange(growth,removals,andmortality),removalsarethemostdirectlytiedtohumanactivityandasaresultarethemostresponsivetochangingeconomicconditions.
Patterns of Forest Canopy Disturbance
Background
TemporarydisturbancestotheforestcanopyarecommoninWisconsin.Thislossofexistingtreesandsubsequentregenerationisknownassecondarysuccession.Permanentforestland-usechanges,suchasreversionofabandonedpastureoragriculturallandstoforestordiversionofforestintononforestuses,arefarlesscommonoccurrencesinWisconsininrecentyearsandarediscussedelsewhereinthisreport.Forestcanopydisturbancesresultfromavarietyofcauses,includingharvest,wind,ice,fire,insectsanddisease,etc.,allofwhichimpactforestecosystemcomposition,structure,andfunction.Severityofdisturbanceisaffectedbythesusceptibilityoftrees(e.g.,rootingdepth)andtheintensityofthedisturbanceagent(e.g.,windspeed).Scalesofdisturbancealsovarywidely,affectingthetotalareaandvolumeimpacted,andalsothenumberandsizeofresultingpatches.Abundanceofyoungforesthabitat,forexample,isdirectlydependentonthefrequency,severity,andscaleofcanopydisturbances.
Weproducedsatelliteimage-basedmapsandstatisticstobetterunderstandforestcanopydisturbances.Using13LandsatTimeSeriesStacks(LTSS)spanningmorethan25yearsanda‘vegetationchangetracker’algorithm(VCTw)(Huangetal.2010,Stueveetal.2011a),wemappedtheyearofthemostrecentforestcanopydisturbancesacrosstheentirestateofWisconsin.Fromthesemapswedeterminedtheageoftheresultingforestpatches,theirnumber,andtheirsize.
What we found
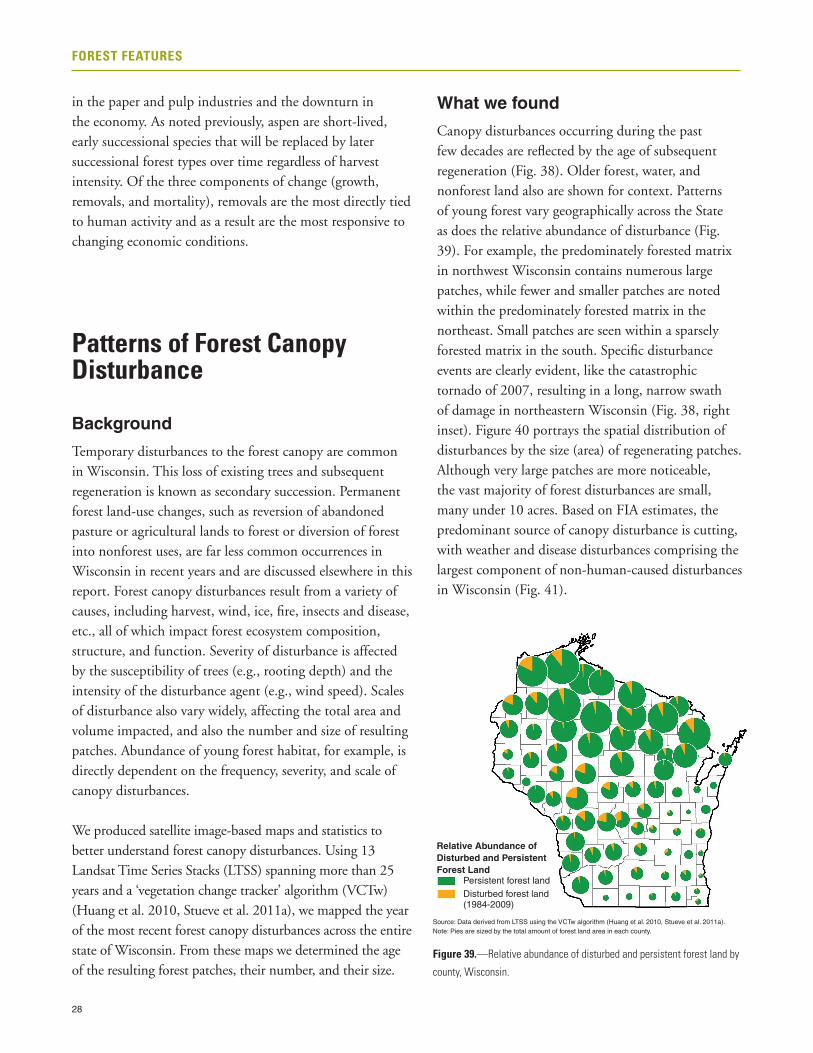
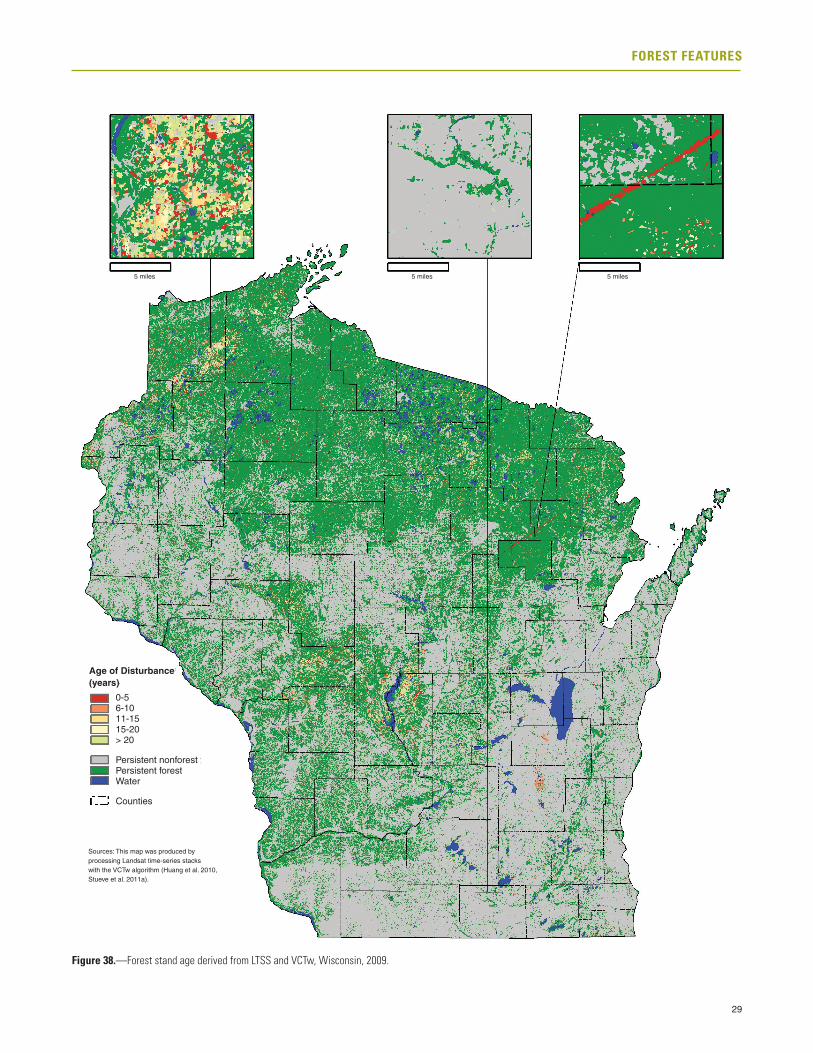
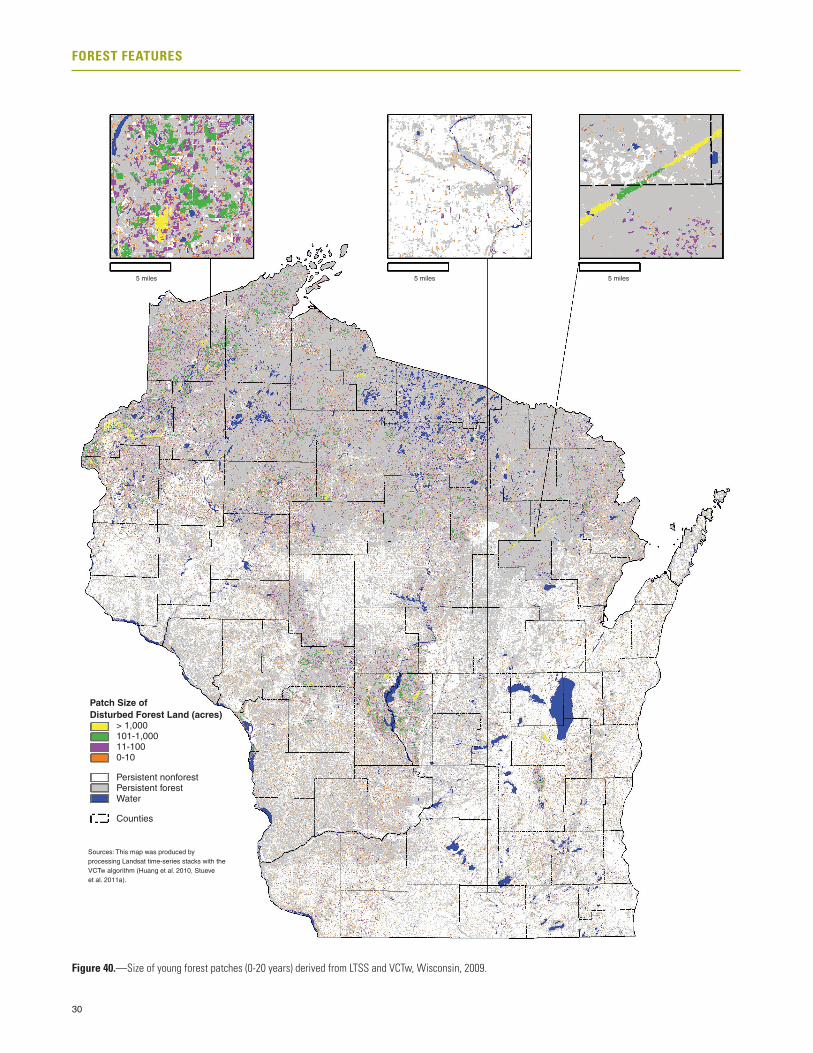
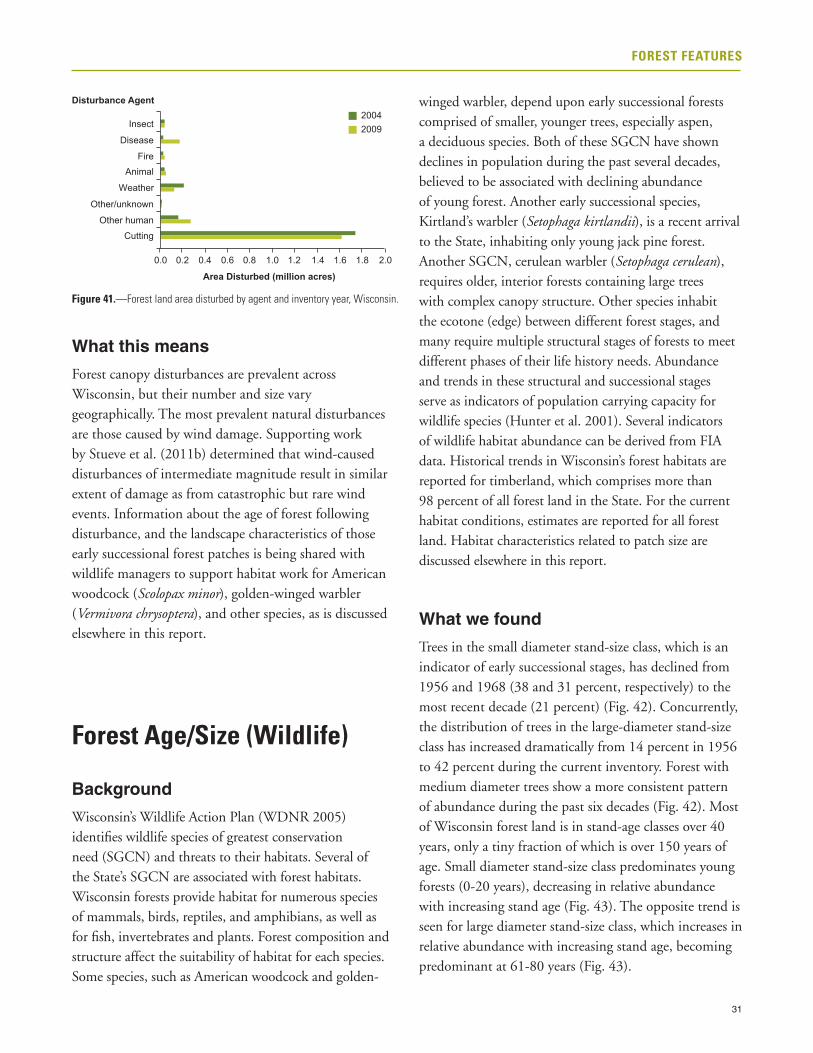
Canopydisturbancesoccurringduringthepastfewdecadesarereflectedbytheageofsubsequentregeneration(Fig.38).Olderforest,water,andnonforestlandalsoareshownforcontext.PatternsofyoungforestvarygeographicallyacrosstheStateasdoestherelativeabundanceofdisturbance(Fig.39).Forexample,thepredominatelyforestedmatrixinnorthwestWisconsincontainsnumerouslargepatches,whilefewerandsmallerpatchesarenotedwithinthepredominatelyforestedmatrixinthenortheast.Smallpatchesareseenwithinasparselyforestedmatrixinthesouth.Specificdisturbanceeventsareclearlyevident,likethecatastrophictornadoof2007,resultinginalong,narrowswathofdamageinnortheasternWisconsin(Fig.38,rightinset).Figure40portraysthespatialdistributionofdisturbancesbythesize(area)ofregeneratingpatches.Althoughverylargepatchesaremorenoticeable,thevastmajorityofforestdisturbancesaresmall,manyunder10acres.BasedonFIAestimates,thepredominantsourceofcanopydisturbanceiscutting,withweatheranddiseasedisturbancescomprisingthelargestcomponentofnon-human-causeddisturbancesinWisconsin(Fig.41).
Figure 39.—Relative abundance of disturbed and persistent forest land by
county, Wisconsin.
Relative Abundance of Disturbed and Persistent Forest Land Persistent forest land Disturbed forest land (1984-2009)
Source: Data derived from LTSS using the VCTw algorithm (Huang et al. 2010, Stueve et al. 2011a). Note: Pies are sized by the total amount of forest land area in each county.
29
FOREST FEATURES
Figure 38.—Forest stand age derived from LTSS and VCTw, Wisconsin, 2009.
Sources: This map was produced by processing Landsat time-series stacks with the VCTw algorithm (Huang et al. 2010, Stueve et al. 2011a).
5 miles5 miles5 miles
Age of Disturbance(years)
0-5 6-10 11-15 15-20 > 20
Persistent nonforest Persistent forest Water Counties
30
FOREST FEATURES
Figure 40.—Size of young forest patches (0-20 years) derived from LTSS and VCTw, Wisconsin, 2009.
Patch Size of Disturbed Forest Land (acres) > 1,000 101-1,000 11-100 0-10
Persistent nonforest Persistent forest Water
Counties
Sources: This map was produced by processing Landsat time-series stacks with the VCTw algorithm (Huang et al. 2010, Stueve et al. 2011a).
5 miles 5 miles 5 miles
31
FOREST FEATURES
Insect
Disease
Fire
Animal
Weather
Other/unknown
Other human
Cutting
Area Disturbed (million acres)
2.01.81.61.41.21.00.80.60.40.20.0
Disturbance Agent 2004
2009
What this means
ForestcanopydisturbancesareprevalentacrossWisconsin,buttheirnumberandsizevarygeographically.Themostprevalentnaturaldisturbancesarethosecausedbywinddamage.SupportingworkbyStueveetal.(2011b)determinedthatwind-causeddisturbancesofintermediatemagnituderesultinsimilarextentofdamageasfromcatastrophicbutrarewindevents.Informationabouttheageofforestfollowingdisturbance,andthelandscapecharacteristicsofthoseearlysuccessionalforestpatchesisbeingsharedwithwildlifemanagerstosupporthabitatworkforAmericanwoodcock(Scolopax minor),golden-wingedwarbler(Vermivora chrysoptera),andotherspecies,asisdiscussedelsewhereinthisreport.
Forest Age/Size (Wildlife)
Background
Wisconsin’sWildlifeActionPlan(WDNR2005)identifieswildlifespeciesofgreatestconservationneed(SGCN)andthreatstotheirhabitats.SeveraloftheState’sSGCNareassociatedwithforesthabitats.Wisconsinforestsprovidehabitatfornumerousspeciesofmammals,birds,reptiles,andamphibians,aswellasforfish,invertebratesandplants.Forestcompositionandstructureaffectthesuitabilityofhabitatforeachspecies.Somespecies,suchasAmericanwoodcockandgolden-
wingedwarbler,dependuponearlysuccessionalforestscomprisedofsmaller,youngertrees,especiallyaspen,adeciduousspecies.BothoftheseSGCNhaveshowndeclinesinpopulationduringthepastseveraldecades,believedtobeassociatedwithdecliningabundanceofyoungforest.Anotherearlysuccessionalspecies,Kirtland’swarbler(Setophaga kirtlandii),isarecentarrivaltotheState,inhabitingonlyyoungjackpineforest.AnotherSGCN,ceruleanwarbler(Setophaga cerulean),requiresolder,interiorforestscontaininglargetreeswithcomplexcanopystructure.Otherspeciesinhabittheecotone(edge)betweendifferentforeststages,andmanyrequiremultiplestructuralstagesofforeststomeetdifferentphasesoftheirlifehistoryneeds.Abundanceandtrendsinthesestructuralandsuccessionalstagesserveasindicatorsofpopulationcarryingcapacityforwildlifespecies(Hunteretal.2001).SeveralindicatorsofwildlifehabitatabundancecanbederivedfromFIAdata.HistoricaltrendsinWisconsin’sforesthabitatsarereportedfortimberland,whichcomprisesmorethan98percentofallforestlandintheState.Forthecurrenthabitatconditions,estimatesarereportedforallforestland.Habitatcharacteristicsrelatedtopatchsizearediscussedelsewhereinthisreport.
What we found
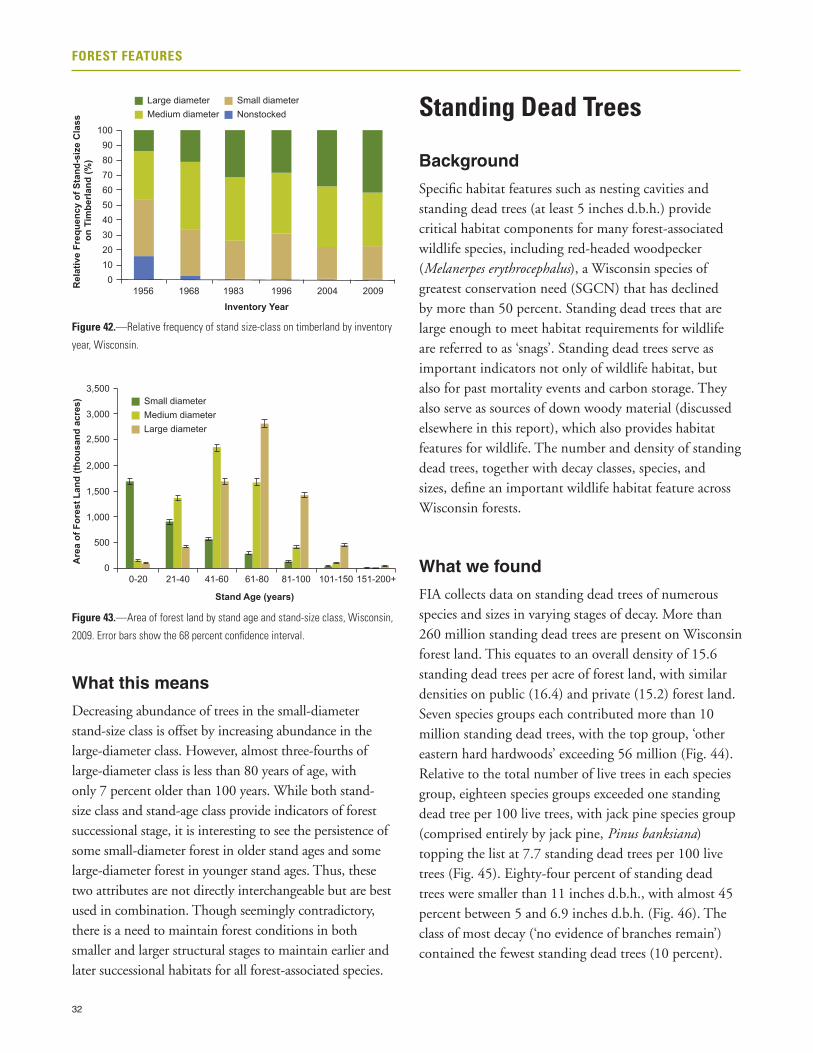
Treesinthesmalldiameterstand-sizeclass,whichisanindicatorofearlysuccessionalstages,hasdeclinedfrom1956and1968(38and31percent,respectively)tothemostrecentdecade(21percent)(Fig.42).Concurrently,thedistributionoftreesinthelarge-diameterstand-sizeclasshasincreaseddramaticallyfrom14percentin1956to42percentduringthecurrentinventory.Forestwithmediumdiametertreesshowamoreconsistentpatternofabundanceduringthepastsixdecades(Fig.42).MostofWisconsinforestlandisinstand-ageclassesover40years,onlyatinyfractionofwhichisover150yearsofage.Smalldiameterstand-sizeclasspredominatesyoungforests(0-20years),decreasinginrelativeabundancewithincreasingstandage(Fig.43).Theoppositetrendisseenforlargediameterstand-sizeclass,whichincreasesinrelativeabundancewithincreasingstandage,becomingpredominantat61-80years(Fig.43).
Figure 41.—Forest land area disturbed by agent and inventory year, Wisconsin.
32
FOREST FEATURES
What this means
Decreasingabundanceoftreesinthesmall-diameterstand-sizeclassisoffsetbyincreasingabundanceinthelarge-diameterclass.However,almostthree-fourthsoflarge-diameterclassislessthan80yearsofage,withonly7percentolderthan100years.Whilebothstand-sizeclassandstand-ageclassprovideindicatorsofforestsuccessionalstage,itisinterestingtoseethepersistenceofsomesmall-diameterforestinolderstandagesandsomelarge-diameterforestinyoungerstandages.Thus,thesetwoattributesarenotdirectlyinterchangeablebutarebestusedincombination.Thoughseeminglycontradictory,thereisaneedtomaintainforestconditionsinbothsmallerandlargerstructuralstagestomaintainearlierandlatersuccessionalhabitatsforallforest-associatedspecies.
Standing Dead Trees
Background
Specifichabitatfeaturessuchasnestingcavitiesandstandingdeadtrees(atleast5inchesd.b.h.)providecriticalhabitatcomponentsformanyforest-associatedwildlifespecies,includingred-headedwoodpecker(Melanerpes erythrocephalus),aWisconsinspeciesofgreatestconservationneed(SGCN)thathasdeclinedbymorethan50percent.Standingdeadtreesthatarelargeenoughtomeethabitatrequirementsforwildlifearereferredtoas‘snags’.Standingdeadtreesserveasimportantindicatorsnotonlyofwildlifehabitat,butalsoforpastmortalityeventsandcarbonstorage.Theyalsoserveassourcesofdownwoodymaterial(discussedelsewhereinthisreport),whichalsoprovideshabitatfeaturesforwildlife.Thenumberanddensityofstandingdeadtrees,togetherwithdecayclasses,species,andsizes,defineanimportantwildlifehabitatfeatureacrossWisconsinforests.
What we found
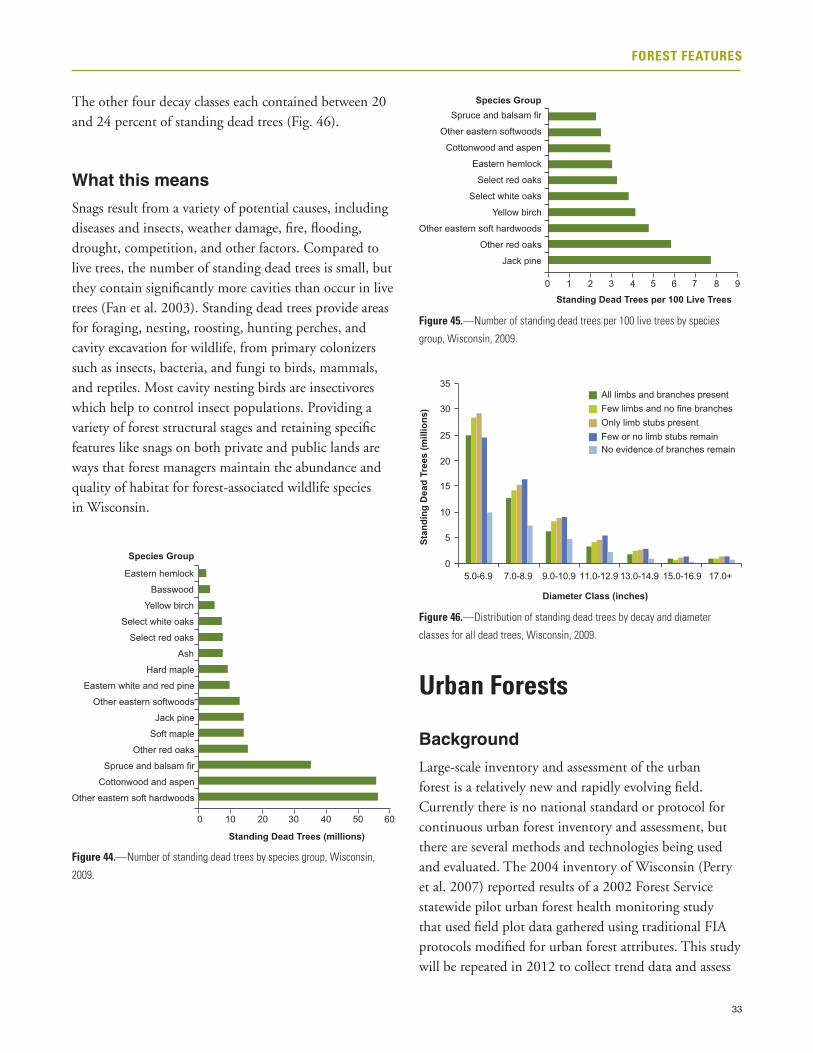
FIAcollectsdataonstandingdeadtreesofnumerousspeciesandsizesinvaryingstagesofdecay.Morethan260millionstandingdeadtreesarepresentonWisconsinforestland.Thisequatestoanoveralldensityof15.6standingdeadtreesperacreofforestland,withsimilardensitiesonpublic(16.4)andprivate(15.2)forestland.Sevenspeciesgroupseachcontributedmorethan10millionstandingdeadtrees,withthetopgroup,‘othereasternhardhardwoods’exceeding56million(Fig.44).Relativetothetotalnumberoflivetreesineachspeciesgroup,eighteenspeciesgroupsexceededonestandingdeadtreeper100livetrees,withjackpinespeciesgroup(comprisedentirelybyjackpine,Pinus banksiana)toppingthelistat7.7standingdeadtreesper100livetrees(Fig.45).Eighty-fourpercentofstandingdeadtreesweresmallerthan11inchesd.b.h.,withalmost45percentbetween5and6.9inchesd.b.h.(Fig.46).Theclassofmostdecay(‘noevidenceofbranchesremain’)containedthefeweststandingdeadtrees(10percent).
Large diameter
Medium diameter
Small diameter
Nonstocked
0
10
20
30
40
50
60
70
80
90
100
1956 1968 1983 1996 2004 2009
Rel
ativ
e Fr
eque
ncy
of S
tand
-siz
e C
lass
on
Tim
berla
nd (%
)
Inventory Year
Small diameter
Medium diameter
Large diameter
0
500
1,000
1,500
2,000
2,500
3,000
3,500
0-20 21-40 41-60 61-80 81-100 101-150 151-200+
Are
a of
For
est L
and
(thou
sand
acr
es)
Stand Age (years)
Figure 42.—Relative frequency of stand size-class on timberland by inventory
year, Wisconsin.
Figure 43.—Area of forest land by stand age and stand-size class, Wisconsin,
2009. Error bars show the 68 percent confidence interval.
33
FOREST FEATURES
Theotherfourdecayclasseseachcontainedbetween20and24percentofstandingdeadtrees(Fig.46).
What this means
Snagsresultfromavarietyofpotentialcauses,includingdiseasesandinsects,weatherdamage,fire,flooding,drought,competition,andotherfactors.Comparedtolivetrees,thenumberofstandingdeadtreesissmall,buttheycontainsignificantlymorecavitiesthanoccurinlivetrees(Fanetal.2003).Standingdeadtreesprovideareasforforaging,nesting,roosting,huntingperches,andcavityexcavationforwildlife,fromprimarycolonizerssuchasinsects,bacteria,andfungitobirds,mammals,andreptiles.Mostcavitynestingbirdsareinsectivoreswhichhelptocontrolinsectpopulations.Providingavarietyofforeststructuralstagesandretainingspecificfeatureslikesnagsonbothprivateandpubliclandsarewaysthatforestmanagersmaintaintheabundanceandqualityofhabitatforforest-associatedwildlifespeciesinWisconsin.
Urban Forests
Background
Large-scaleinventoryandassessmentoftheurbanforestisarelativelynewandrapidlyevolvingfield.Currentlythereisnonationalstandardorprotocolforcontinuousurbanforestinventoryandassessment,butthereareseveralmethodsandtechnologiesbeingusedandevaluated.The2004inventoryofWisconsin(Perryetal.2007)reportedresultsofa2002ForestServicestatewidepiloturbanforesthealthmonitoringstudythatusedfieldplotdatagatheredusingtraditionalFIAprotocolsmodifiedforurbanforestattributes.Thisstudywillberepeatedin2012tocollecttrenddataandassess
Species Group
0 10 20 30 40 50 60
Other eastern soft hardwoods
Cottonwood and aspen
Spruce and balsam fir
Other red oaks
Soft maple
Jack pine
Other eastern softwoods
Eastern white and red pine
Hard maple
Ash
Select red oaks
Select white oaks
Yellow birch
Basswood
Eastern hemlock
Standing Dead Trees (millions)
Species Group
0 1 2 3 4 5 6 7 8 9
Jack pine
Other red oaks
Other eastern soft hardwoods
Yellow birch
Select white oaks
Select red oaks
Eastern hemlock
Cottonwood and aspen
Other eastern softwoods
Spruce and balsam fir
Standing Dead Trees per 100 Live Trees
All limbs and branches present
Few limbs and no fine branches
Only limb stubs present
Few or no limb stubs remain
No evidence of branches remain
0
5
10
15
20
25
30
35
5.0-6.9 7.0-8.9 9.0-10.9 11.0-12.9 13.0-14.9 15.0-16.9 17.0+
Stan
ding
Dea
d Tr
ees
(mill
ions
)
Diameter Class (inches)
Figure 44.—Number of standing dead trees by species group, Wisconsin,
2009.
Figure 45.—Number of standing dead trees per 100 live trees by species
group, Wisconsin, 2009.
Figure 46.—Distribution of standing dead trees by decay and diameter
classes for all dead trees, Wisconsin, 2009.
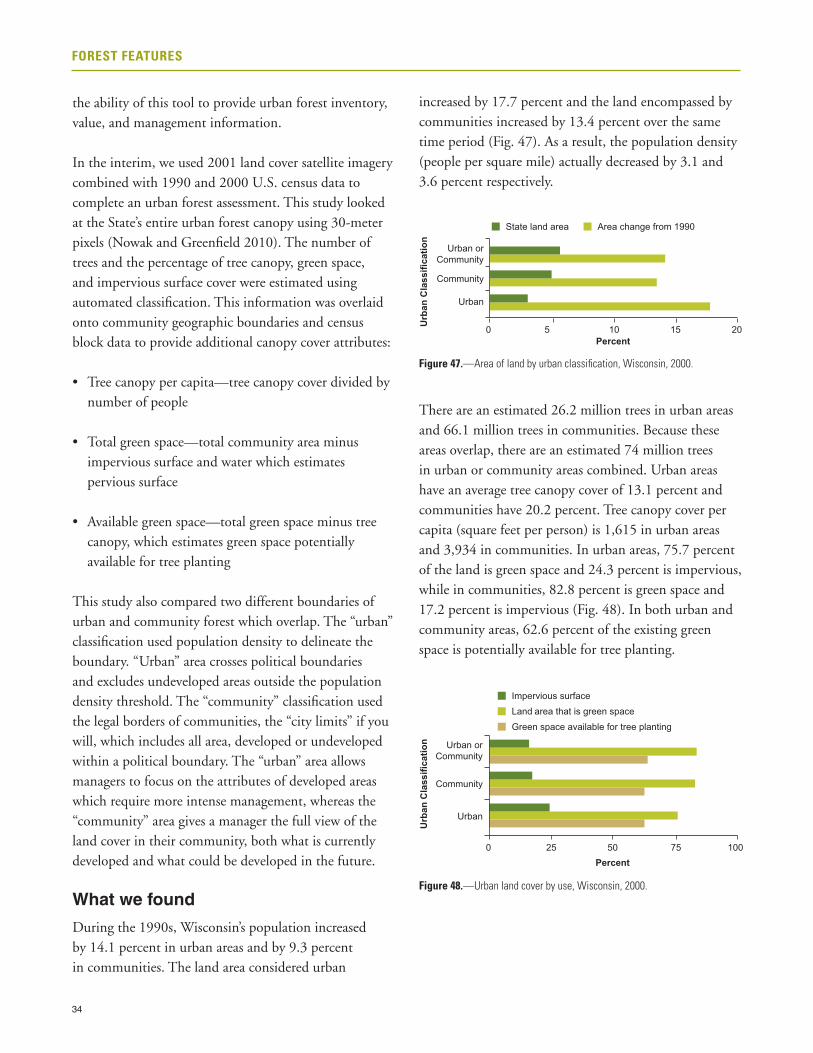
34
FOREST FEATURES
theabilityofthistooltoprovideurbanforestinventory,value,andmanagementinformation.
Intheinterim,weused2001landcoversatelliteimagerycombinedwith1990and2000U.S.censusdatatocompleteanurbanforestassessment.ThisstudylookedattheState’sentireurbanforestcanopyusing30-meterpixels(NowakandGreenfield2010).Thenumberoftreesandthepercentageoftreecanopy,greenspace,andimpervioussurfacecoverwereestimatedusingautomatedclassification.Thisinformationwasoverlaidontocommunitygeographicboundariesandcensusblockdatatoprovideadditionalcanopycoverattributes:
• Treecanopypercapita—treecanopycoverdividedbynumberofpeople
• Totalgreenspace—totalcommunityareaminusimpervioussurfaceandwaterwhichestimatespervioussurface
• Availablegreenspace—totalgreenspaceminustreecanopy,whichestimatesgreenspacepotentiallyavailablefortreeplanting
Thisstudyalsocomparedtwodifferentboundariesofurbanandcommunityforestwhichoverlap.The“urban”classificationusedpopulationdensitytodelineatetheboundary.“Urban”areacrossespoliticalboundariesandexcludesundevelopedareasoutsidethepopulationdensitythreshold.The“community”classificationusedthelegalbordersofcommunities,the“citylimits”ifyouwill,whichincludesallarea,developedorundevelopedwithinapoliticalboundary.The“urban”areaallowsmanagerstofocusontheattributesofdevelopedareaswhichrequiremoreintensemanagement,whereasthe“community”areagivesamanagerthefullviewofthelandcoverintheircommunity,bothwhatiscurrentlydevelopedandwhatcouldbedevelopedinthefuture.
What we found
Duringthe1990s,Wisconsin’spopulationincreasedby14.1percentinurbanareasandby9.3percentincommunities.Thelandareaconsideredurban
increasedby17.7percentandthelandencompassedbycommunitiesincreasedby13.4percentoverthesametimeperiod(Fig.47).Asaresult,thepopulationdensity(peoplepersquaremile)actuallydecreasedby3.1and3.6percentrespectively.
State land area Area change from 1990
0 5 10 15 20
Urban
Community
Urban or
Community
Percent
Urb
an C
lass
ifica
tion
Thereareanestimated26.2milliontreesinurbanareasand66.1milliontreesincommunities.Becausetheseareasoverlap,thereareanestimated74milliontreesinurbanorcommunityareascombined.Urbanareashaveanaveragetreecanopycoverof13.1percentandcommunitieshave20.2percent.Treecanopycoverpercapita(squarefeetperperson)is1,615inurbanareasand3,934incommunities.Inurbanareas,75.7percentofthelandisgreenspaceand24.3percentisimpervious,whileincommunities,82.8percentisgreenspaceand17.2percentisimpervious(Fig.48).Inbothurbanandcommunityareas,62.6percentoftheexistinggreenspaceispotentiallyavailablefortreeplanting.
0 25 50 75 100
Percent
Urb
an C
lass
ifica
tion
Impervious surface
Green space available for tree planting
Land area that is green space
Urban
Community
Urban or
Community
Figure 47.—Area of land by urban classification, Wisconsin, 2000.
Figure 48.—Urban land cover by use, Wisconsin, 2000.
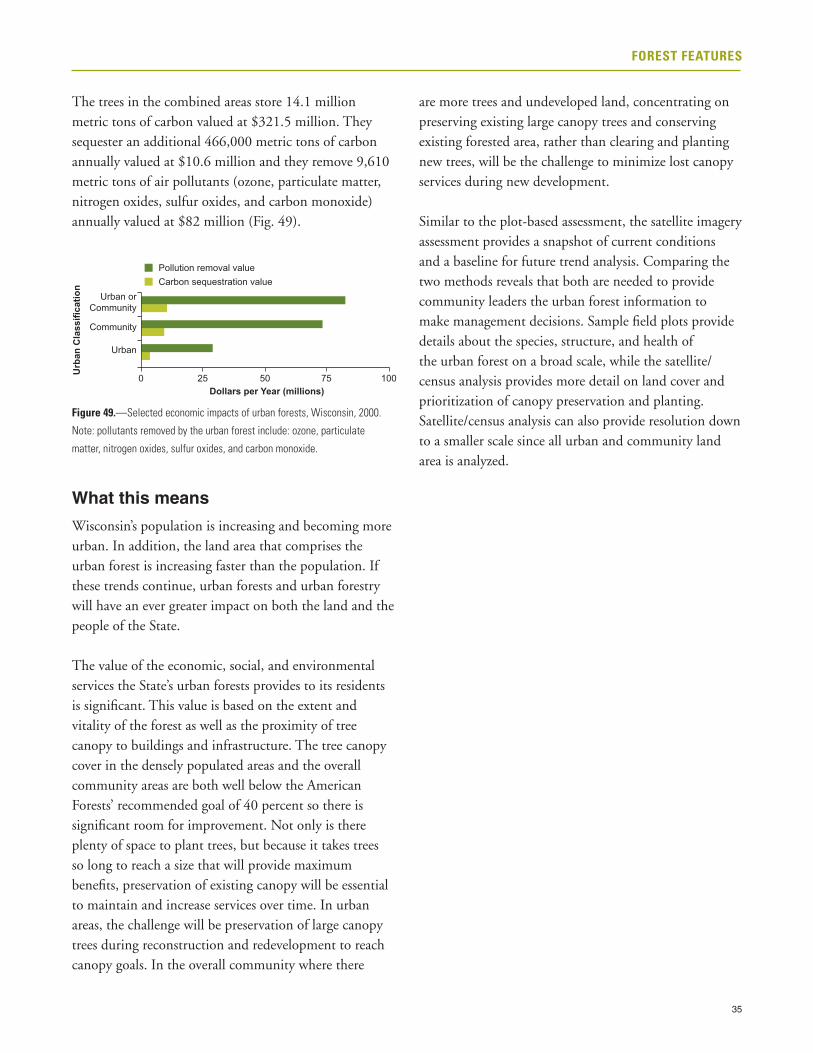
35
FOREST FEATURES
Thetreesinthecombinedareasstore14.1millionmetrictonsofcarbonvaluedat$321.5million.Theysequesteranadditional466,000metrictonsofcarbonannuallyvaluedat$10.6millionandtheyremove9,610metrictonsofairpollutants(ozone,particulatematter,nitrogenoxides,sulfuroxides,andcarbonmonoxide)annuallyvaluedat$82million(Fig.49).
aremoretreesandundevelopedland,concentratingonpreservingexistinglargecanopytreesandconservingexistingforestedarea,ratherthanclearingandplantingnewtrees,willbethechallengetominimizelostcanopyservicesduringnewdevelopment.
Similartotheplot-basedassessment,thesatelliteimageryassessmentprovidesasnapshotofcurrentconditionsandabaselineforfuturetrendanalysis.Comparingthetwomethodsrevealsthatbothareneededtoprovidecommunityleaderstheurbanforestinformationtomakemanagementdecisions.Samplefieldplotsprovidedetailsaboutthespecies,structure,andhealthoftheurbanforestonabroadscale,whilethesatellite/censusanalysisprovidesmoredetailonlandcoverandprioritizationofcanopypreservationandplanting.Satellite/censusanalysiscanalsoprovideresolutiondowntoasmallerscalesinceallurbanandcommunitylandareaisanalyzed.
What this means
Wisconsin’spopulationisincreasingandbecomingmoreurban.Inaddition,thelandareathatcomprisestheurbanforestisincreasingfasterthanthepopulation.Ifthesetrendscontinue,urbanforestsandurbanforestrywillhaveanevergreaterimpactonboththelandandthepeopleoftheState.
Thevalueoftheeconomic,social,andenvironmentalservicestheState’surbanforestsprovidestoitsresidentsissignificant.Thisvalueisbasedontheextentandvitalityoftheforestaswellastheproximityoftreecanopytobuildingsandinfrastructure.ThetreecanopycoverinthedenselypopulatedareasandtheoverallcommunityareasarebothwellbelowtheAmericanForests’recommendedgoalof40percentsothereissignificantroomforimprovement.Notonlyisthereplentyofspacetoplanttrees,butbecauseittakestreessolongtoreachasizethatwillprovidemaximumbenefits,preservationofexistingcanopywillbeessentialtomaintainandincreaseservicesovertime.Inurbanareas,thechallengewillbepreservationoflargecanopytreesduringreconstructionandredevelopmenttoreachcanopygoals.Intheoverallcommunitywherethere
Pollution removal value
Carbon sequestration value
Urban
Community
Urban or
Community
Urb
an C
lass
ifica
tion
0 25 50 75 100
Dollars per Year (millions)
Figure 49.—Selected economic impacts of urban forests, Wisconsin, 2000.
Note: pollutants removed by the urban forest include: ozone, particulate
matter, nitrogen oxides, sulfur oxides, and carbon monoxide.

36
3737
Forest Health Indicators
American hornbeam. Photo by David Lee, Bugwood.org.
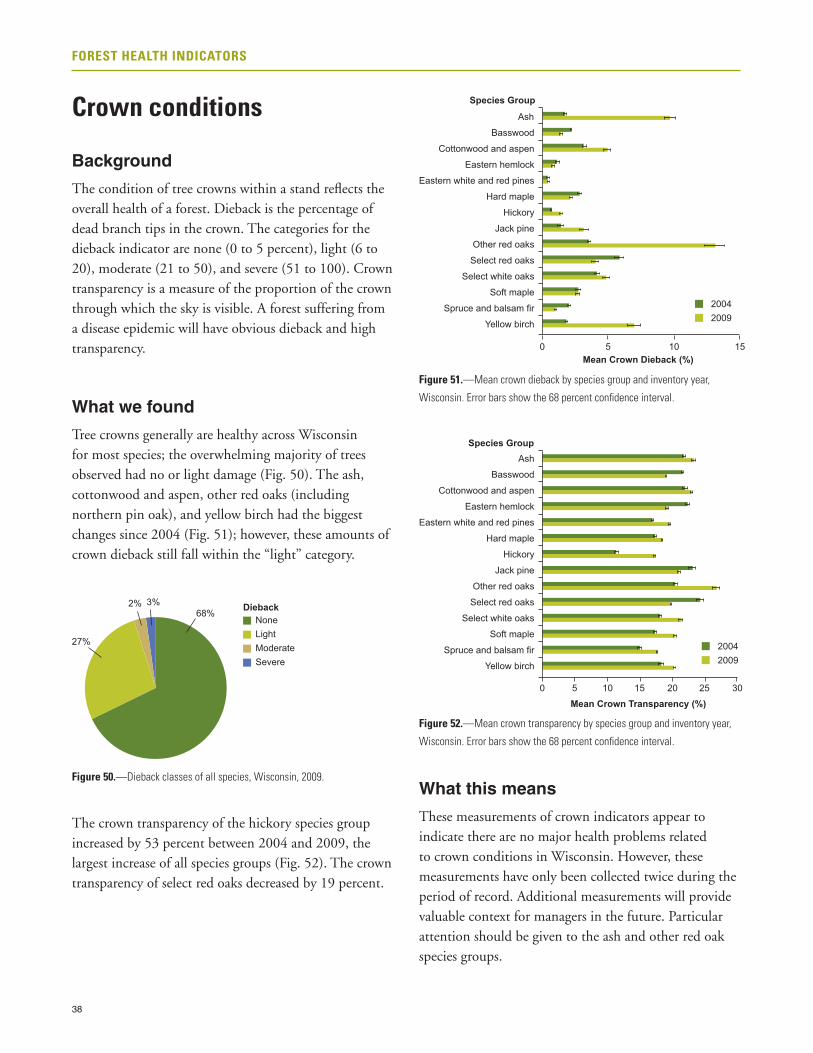
38
FOREST HEALTH INDICATORS
Crown conditions
Background
Theconditionoftreecrownswithinastandreflectstheoverallhealthofaforest.Diebackisthepercentageofdeadbranchtipsinthecrown.Thecategoriesforthediebackindicatorarenone(0to5percent),light(6to20),moderate(21to50),andsevere(51to100).Crowntransparencyisameasureoftheproportionofthecrownthroughwhichtheskyisvisible.Aforestsufferingfromadiseaseepidemicwillhaveobviousdiebackandhightransparency.
What we found
TreecrownsgenerallyarehealthyacrossWisconsinformostspecies;theoverwhelmingmajorityoftreesobservedhadnoorlightdamage(Fig.50).Theash,cottonwoodandaspen,otherredoaks(includingnorthernpinoak),andyellowbirchhadthebiggestchangessince2004(Fig.51);however,theseamountsofcrowndiebackstillfallwithinthe“light”category.
What this means
ThesemeasurementsofcrownindicatorsappeartoindicatetherearenomajorhealthproblemsrelatedtocrownconditionsinWisconsin.However,thesemeasurementshaveonlybeencollectedtwiceduringtheperiodofrecord.Additionalmeasurementswillprovidevaluablecontextformanagersinthefuture.Particularattentionshouldbegiventotheashandotherredoakspeciesgroups.
None
Light
Moderate
Severe
2% 3%
68%
27%
Dieback
2004
2009
Species Group
0 5 10 15
Yellow birch
Spruce and balsam fir
Soft maple
Select white oaks
Select red oaks
Other red oaks
Jack pine
Hickory
Hard maple
Eastern white and red pines
Eastern hemlock
Cottonwood and aspen
Basswood
Ash
Mean Crown Dieback (%)
Thecrowntransparencyofthehickoryspeciesgroupincreasedby53percentbetween2004and2009,thelargestincreaseofallspeciesgroups(Fig.52).Thecrowntransparencyofselectredoaksdecreasedby19percent.
2004
2009
Species Group
0 5 10 15 20 25 30
Yellow birch
Spruce and balsam fir
Soft maple
Select white oaks
Select red oaks
Other red oaks
Jack pine
Hickory
Hard maple
Eastern white and red pines
Eastern hemlock
Cottonwood and aspen
Basswood
Ash
Mean Crown Transparency (%)
Figure 50.—Dieback classes of all species, Wisconsin, 2009.
Figure 51.—Mean crown dieback by species group and inventory year,
Wisconsin. Error bars show the 68 percent confidence interval.
Figure 52.—Mean crown transparency by species group and inventory year,
Wisconsin. Error bars show the 68 percent confidence interval.
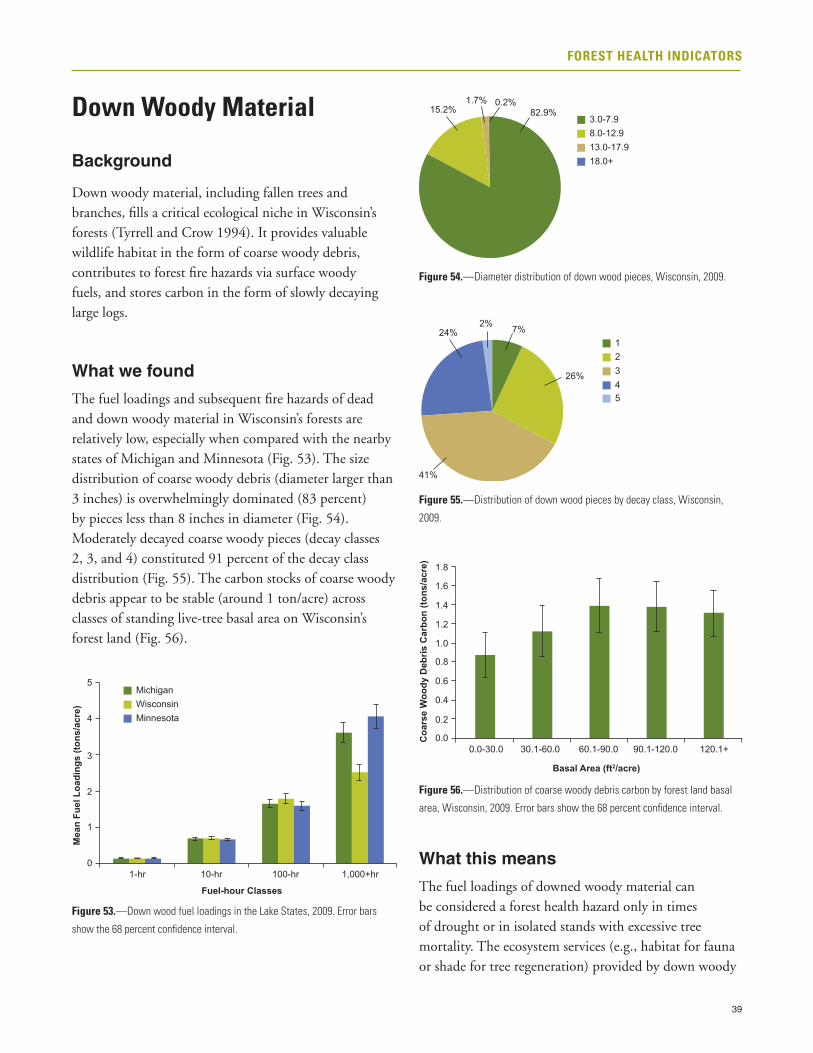
39
FOREST HEALTH INDICATORS
Down Woody Material
Background
Downwoodymaterial,includingfallentreesandbranches,fillsacriticalecologicalnicheinWisconsin’sforests(TyrrellandCrow1994).Itprovidesvaluablewildlifehabitatintheformofcoarsewoodydebris,contributestoforestfirehazardsviasurfacewoodyfuels,andstorescarbonintheformofslowlydecayinglargelogs.
What we found
ThefuelloadingsandsubsequentfirehazardsofdeadanddownwoodymaterialinWisconsin’sforestsarerelativelylow,especiallywhencomparedwiththenearbystatesofMichiganandMinnesota(Fig.53).Thesizedistributionofcoarsewoodydebris(diameterlargerthan3inches)isoverwhelminglydominated(83percent)bypieceslessthan8inchesindiameter(Fig.54).Moderatelydecayedcoarsewoodypieces(decayclasses2,3,and4)constituted91percentofthedecayclassdistribution(Fig.55).Thecarbonstocksofcoarsewoodydebrisappeartobestable(around1ton/acre)acrossclassesofstandinglive-treebasalareaonWisconsin’sforestland(Fig.56).
What this means
Thefuelloadingsofdownedwoodymaterialcanbeconsideredaforesthealthhazardonlyintimesofdroughtorinisolatedstandswithexcessivetreemortality.Theecosystemservices(e.g.,habitatforfaunaorshadefortreeregeneration)providedbydownwoody
Michigan
Wisconsin
Minnesota
0
1
2
3
4
5
1-hr 10-hr 100-hr 1,000+hr
Mea
n Fu
el L
oadi
ngs
(tons
/acr
e)
Fuel-hour Classes
0.2% 15.2% 82.9%
1.7%
3.0-7.9
8.0-12.9
13.0-17.9
18.0+
41%
2% 7%
26%
24%
1
2
3
4
5
0.0
0.2
0.4
0.6
0.8
1.0
1.2
1.4
1.6
1.8
0.0-30.0 30.1-60.0 60.1-90.0 90.1-120.0 120.1+
Coa
rse
Woo
dy D
ebris
Car
bon
(tons
/acr
e)
Basal Area (ft2/acre)
Figure 53.—Down wood fuel loadings in the Lake States, 2009. Error bars
show the 68 percent confidence interval.
Figure 54.—Diameter distribution of down wood pieces, Wisconsin, 2009.
Figure 55.—Distribution of down wood pieces by decay class, Wisconsin,
2009.
Figure 56.—Distribution of coarse woody debris carbon by forest land basal
area, Wisconsin, 2009. Error bars show the 68 percent confidence interval.
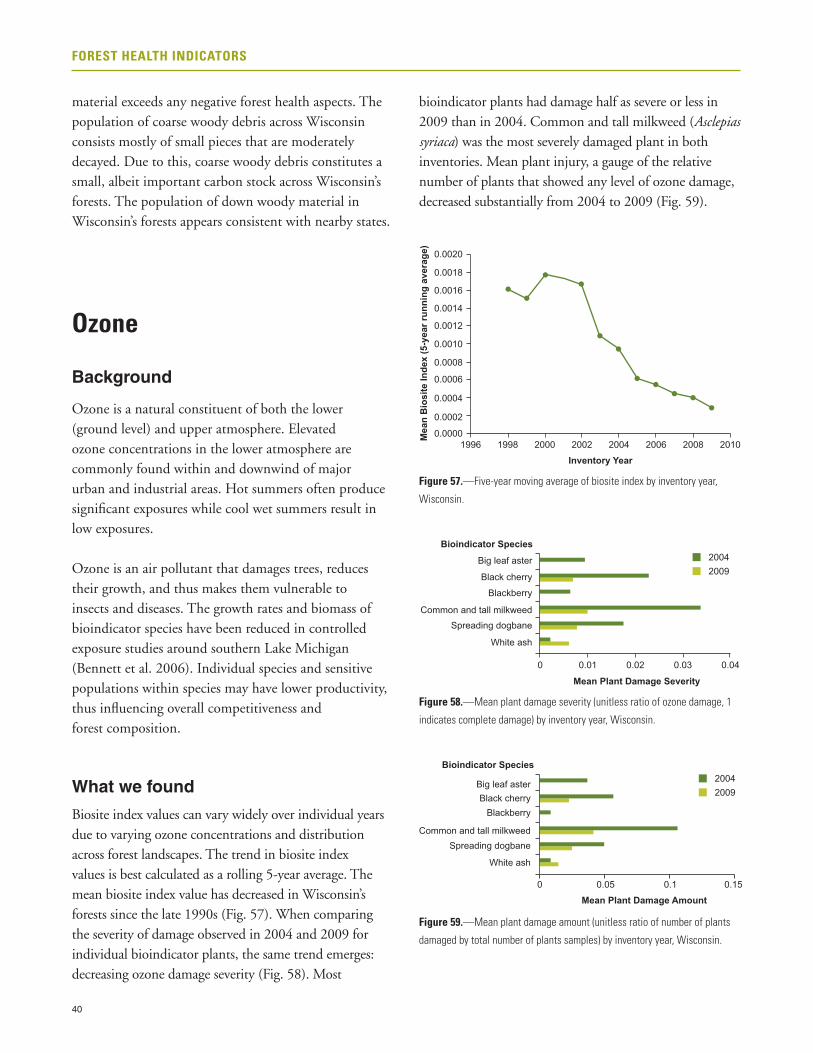
40
FOREST HEALTH INDICATORS
materialexceedsanynegativeforesthealthaspects.ThepopulationofcoarsewoodydebrisacrossWisconsinconsistsmostlyofsmallpiecesthataremoderatelydecayed.Duetothis,coarsewoodydebrisconstitutesasmall,albeitimportantcarbonstockacrossWisconsin’sforests.ThepopulationofdownwoodymaterialinWisconsin’sforestsappearsconsistentwithnearbystates.
Ozone
Background
Ozoneisanaturalconstituentofboththelower(groundlevel)andupperatmosphere.Elevatedozoneconcentrationsintheloweratmospherearecommonlyfoundwithinanddownwindofmajorurbanandindustrialareas.Hotsummersoftenproducesignificantexposureswhilecoolwetsummersresultinlowexposures.
Ozoneisanairpollutantthatdamagestrees,reducestheirgrowth,andthusmakesthemvulnerabletoinsectsanddiseases.ThegrowthratesandbiomassofbioindicatorspecieshavebeenreducedincontrolledexposurestudiesaroundsouthernLakeMichigan(Bennettetal.2006).Individualspeciesandsensitivepopulationswithinspeciesmayhavelowerproductivity,thusinfluencingoverallcompetitivenessandforestcomposition.
What we found
Biositeindexvaluescanvarywidelyoverindividualyearsduetovaryingozoneconcentrationsanddistributionacrossforestlandscapes.Thetrendinbiositeindexvaluesisbestcalculatedasarolling5-yearaverage.ThemeanbiositeindexvaluehasdecreasedinWisconsin’sforestssincethelate1990s(Fig.57).Whencomparingtheseverityofdamageobservedin2004and2009forindividualbioindicatorplants,thesametrendemerges:decreasingozonedamageseverity(Fig.58).Most
bioindicatorplantshaddamagehalfassevereorlessin2009thanin2004.Commonandtallmilkweed(Asclepias syriaca)wasthemostseverelydamagedplantinbothinventories.Meanplantinjury,agaugeoftherelativenumberofplantsthatshowedanylevelofozonedamage,decreasedsubstantiallyfrom2004to2009(Fig.59).
0.0000
0.0002
0.0004
0.0006
0.0008
0.0010
0.0012
0.0014
0.0016
0.0018
0.0020
1996 1998 2000 2002 2004 2006 2008 2010
Mea
n B
iosi
te In
dex
(5-y
ear r
unni
ng a
vera
ge)
Inventory Year
0 0.01 0.02 0.03 0.04
White ash
Spreading dogbane
Common and tall milkweed
Blackberry
Black cherry
Big leaf aster
Mean Plant Damage Severity
Bioindicator Species 2004
2009
Bioindicator Species
0 0.05 0.1 0.15
White ash
Spreading dogbane
Common and tall milkweed
Blackberry
Black cherry
Big leaf aster
Mean Plant Damage Amount
2004
2009
Figure 57.—Five-year moving average of biosite index by inventory year,
Wisconsin.
Figure 58.—Mean plant damage severity (unitless ratio of ozone damage, 1
indicates complete damage) by inventory year, Wisconsin.
Figure 59.—Mean plant damage amount (unitless ratio of number of plants
damaged by total number of plants samples) by inventory year, Wisconsin.
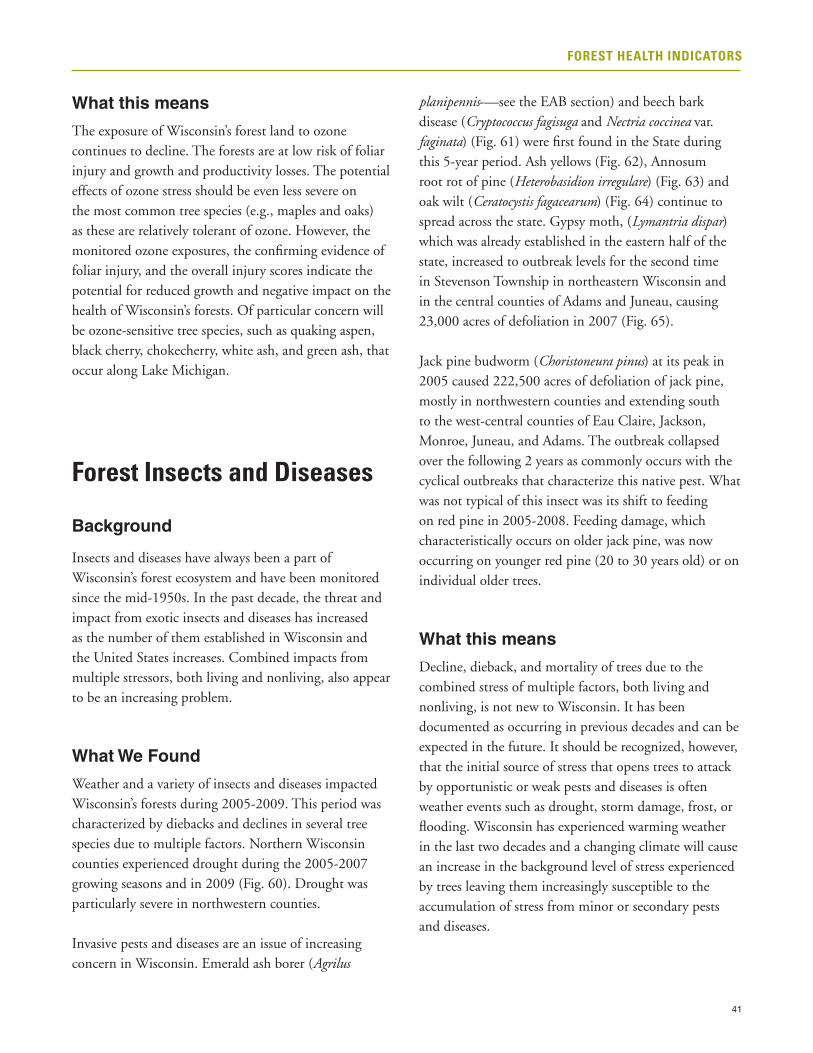
41
FOREST HEALTH INDICATORS
What this means
TheexposureofWisconsin’sforestlandtoozonecontinuestodecline.Theforestsareatlowriskoffoliarinjuryandgrowthandproductivitylosses.Thepotentialeffectsofozonestressshouldbeevenlesssevereonthemostcommontreespecies(e.g.,maplesandoaks)asthesearerelativelytolerantofozone.However,themonitoredozoneexposures,theconfirmingevidenceoffoliarinjury,andtheoverallinjuryscoresindicatethepotentialforreducedgrowthandnegativeimpactonthehealthofWisconsin’sforests.Ofparticularconcernwillbeozone-sensitivetreespecies,suchasquakingaspen,blackcherry,chokecherry,whiteash,andgreenash,thatoccuralongLakeMichigan.
Forest Insects and Diseases
Background
InsectsanddiseaseshavealwaysbeenapartofWisconsin’sforestecosystemandhavebeenmonitoredsincethemid-1950s.Inthepastdecade,thethreatandimpactfromexoticinsectsanddiseaseshasincreasedasthenumberofthemestablishedinWisconsinandtheUnitedStatesincreases.Combinedimpactsfrommultiplestressors,bothlivingandnonliving,alsoappeartobeanincreasingproblem.
What We Found
WeatherandavarietyofinsectsanddiseasesimpactedWisconsin’sforestsduring2005-2009.Thisperiodwascharacterizedbydiebacksanddeclinesinseveraltreespeciesduetomultiplefactors.NorthernWisconsincountiesexperienceddroughtduringthe2005-2007growingseasonsandin2009(Fig.60).Droughtwasparticularlysevereinnorthwesterncounties.
InvasivepestsanddiseasesareanissueofincreasingconcerninWisconsin.Emeraldashborer(Agrilus
planipennis-—seetheEABsection)andbeechbarkdisease(Cryptococcus fagisuga and Nectria coccinea var.faginata)(Fig.61)werefirstfoundintheStateduringthis5-yearperiod.Ashyellows(Fig.62),Annosumrootrotofpine(Heterobasidion irregulare)(Fig.63)andoakwilt(Ceratocystis fagacearum)(Fig.64)continuetospreadacrossthestate.Gypsymoth,(Lymantria dispar)whichwasalreadyestablishedintheeasternhalfofthestate,increasedtooutbreaklevelsforthesecondtimeinStevensonTownshipinnortheasternWisconsinandinthecentralcountiesofAdamsandJuneau,causing23,000acresofdefoliationin2007(Fig.65).
Jackpinebudworm(Choristoneura pinus)atitspeakin2005caused222,500acresofdefoliationofjackpine,mostlyinnorthwesterncountiesandextendingsouthtothewest-centralcountiesofEauClaire,Jackson,Monroe,Juneau,andAdams.Theoutbreakcollapsedoverthefollowing2yearsascommonlyoccurswiththecyclicaloutbreaksthatcharacterizethisnativepest.Whatwasnottypicalofthisinsectwasitsshifttofeedingonredpinein2005-2008.Feedingdamage,whichcharacteristicallyoccursonolderjackpine,wasnowoccurringonyoungerredpine(20to30yearsold)oronindividualoldertrees.
What this means
Decline,dieback,andmortalityoftreesduetothecombinedstressofmultiplefactors,bothlivingandnonliving,isnotnewtoWisconsin.Ithasbeendocumentedasoccurringinpreviousdecadesandcanbeexpectedinthefuture.Itshouldberecognized,however,thattheinitialsourceofstressthatopenstreestoattackbyopportunisticorweakpestsanddiseasesisoftenweathereventssuchasdrought,stormdamage,frost,orflooding.Wisconsinhasexperiencedwarmingweatherinthelasttwodecadesandachangingclimatewillcauseanincreaseinthebackgroundlevelofstressexperiencedbytreesleavingthemincreasinglysusceptibletotheaccumulationofstressfromminororsecondarypestsanddiseases.
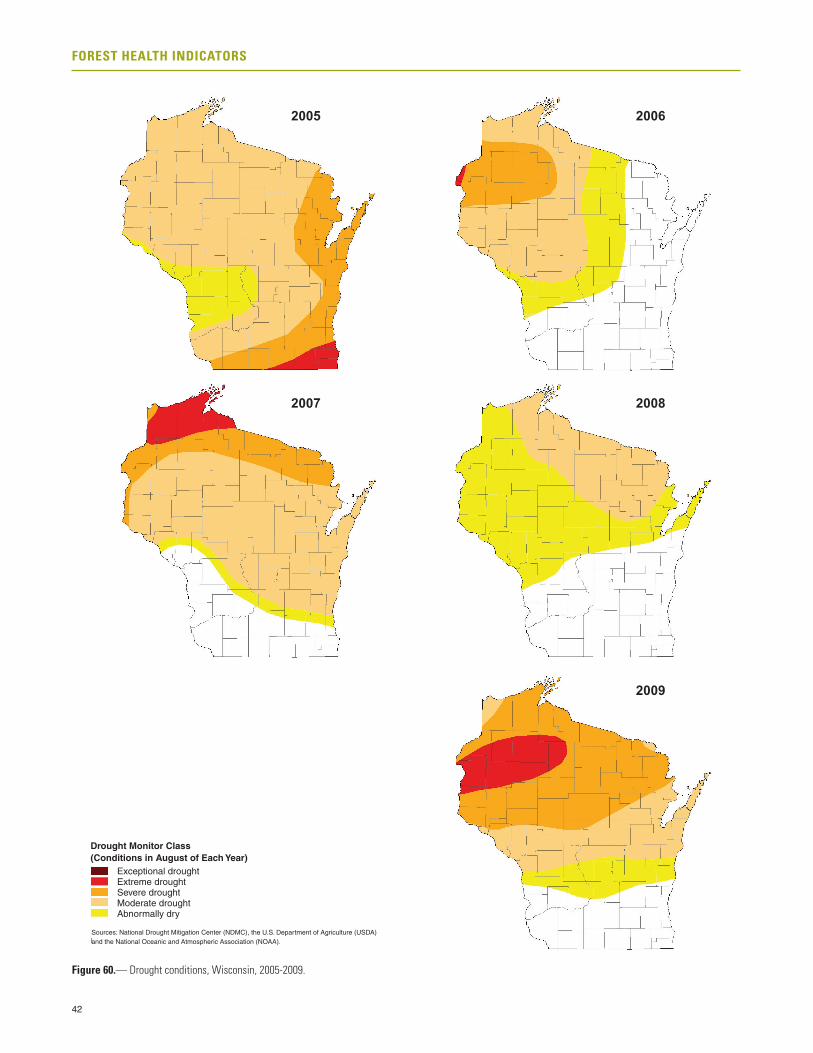
42
FOREST HEALTH INDICATORS
Figure 60.— Drought conditions, Wisconsin, 2005-2009.
2005
2007
2006
2008
2009
Sources: National Drought Mitigation Center (NDMC), the U.S. Department of Agriculture (USDA) and the National Oceanic and Atmospheric Association (NOAA).
Drought Monitor Class(Conditions in August of Each Year) Exceptional drought Extreme drought Severe drought Moderate drought Abnormally dry
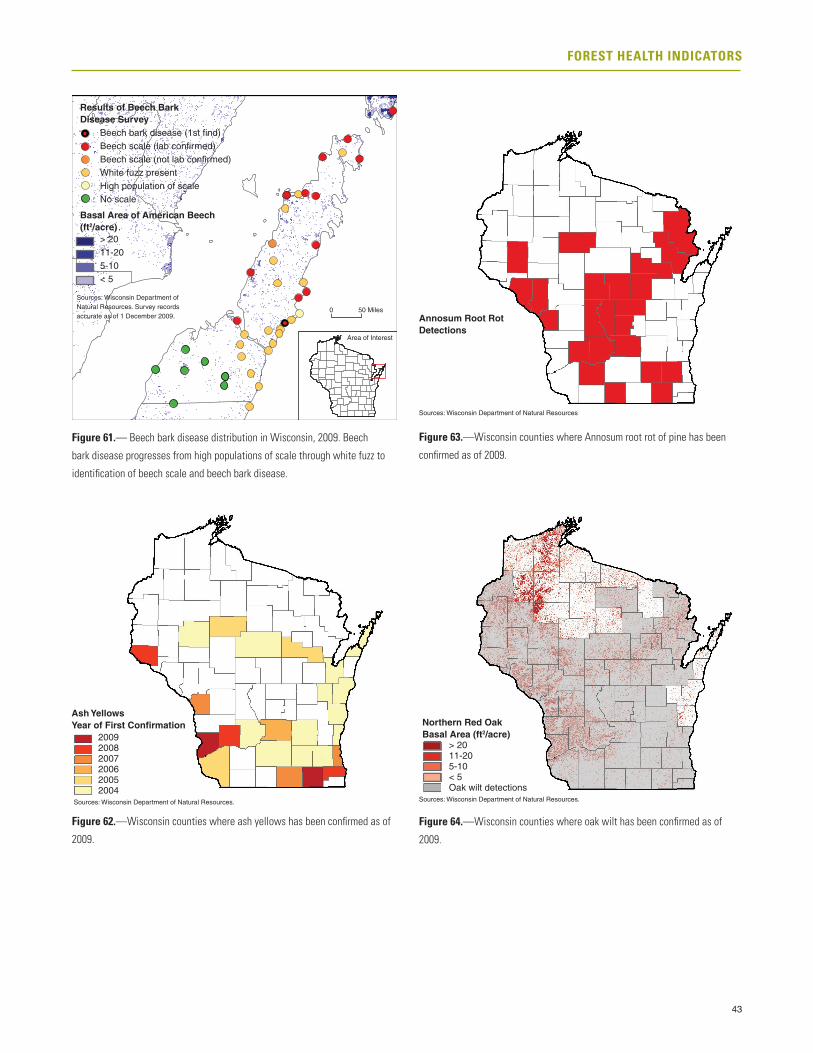
43
FOREST HEALTH INDICATORS
Figure 61.— Beech bark disease distribution in Wisconsin, 2009. Beech
bark disease progresses from high populations of scale through white fuzz to
identification of beech scale and beech bark disease.
Figure 62.—Wisconsin counties where ash yellows has been confirmed as of
2009.
Figure 63.—Wisconsin counties where Annosum root rot of pine has been
confirmed as of 2009.
Figure 64.—Wisconsin counties where oak wilt has been confirmed as of
2009.
Sources: Wisconsin Department of Natural Resources
Sources: Wisconsin Department of Natural Resources.
50 Miles0
Ash YellowsYear of First Confirmation 2009 2008 2007 2006 2005 2004
Annosum Root Rot Detections
Northern Red OakBasal Area (ft2/acre) > 20 11-20 5-10 < 5 Oak wilt detections
Sources: Wisconsin Department of Natural Resources.
Results of Beech Bark Disease Survey Beech bark disease (1st find) Beech scale (lab confirmed) Beech scale (not lab confirmed) White fuzz present High population of scale No scale
Basal Area of American Beech(ft2/acre) > 20 11-20 5-10 < 5
Sources: Wisconsin Department of Natural Resources. Survey records accurate as of 1 December 2009.
Area of Interest
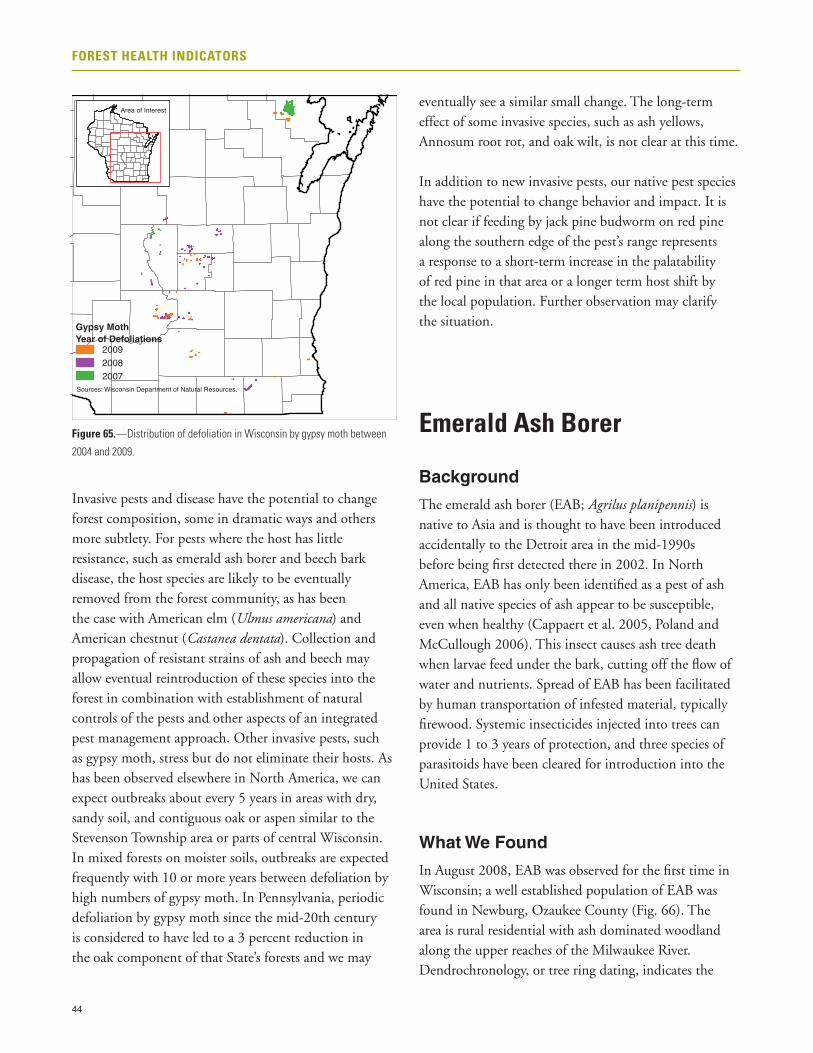
44
FOREST HEALTH INDICATORS
Invasivepestsanddiseasehavethepotentialtochangeforestcomposition,someindramaticwaysandothersmoresubtlety.Forpestswherethehosthaslittleresistance,suchasemeraldashborerandbeechbarkdisease,thehostspeciesarelikelytobeeventuallyremovedfromtheforestcommunity,ashasbeenthecasewithAmericanelm(Ulmus americana)andAmericanchestnut(Castanea dentata).Collectionandpropagationofresistantstrainsofashandbeechmayalloweventualreintroductionofthesespeciesintotheforestincombinationwithestablishmentofnaturalcontrolsofthepestsandotheraspectsofanintegratedpestmanagementapproach.Otherinvasivepests,suchasgypsymoth,stressbutdonoteliminatetheirhosts.AshasbeenobservedelsewhereinNorthAmerica,wecanexpectoutbreaksaboutevery5yearsinareaswithdry,sandysoil,andcontiguousoakoraspensimilartotheStevensonTownshipareaorpartsofcentralWisconsin.Inmixedforestsonmoistersoils,outbreaksareexpectedfrequentlywith10ormoreyearsbetweendefoliationbyhighnumbersofgypsymoth.InPennsylvania,periodicdefoliationbygypsymothsincethemid-20thcenturyisconsideredtohaveledtoa3percentreductionintheoakcomponentofthatState’sforestsandwemay
eventuallyseeasimilarsmallchange.Thelong-termeffectofsomeinvasivespecies,suchasashyellows,Annosumrootrot,andoakwilt,isnotclearatthistime.
Inadditiontonewinvasivepests,ournativepestspecieshavethepotentialtochangebehaviorandimpact.Itisnotcleariffeedingbyjackpinebudwormonredpinealongthesouthernedgeofthepest’srangerepresentsaresponsetoashort-termincreaseinthepalatabilityofredpineinthatareaoralongertermhostshiftbythelocalpopulation.Furtherobservationmayclarifythesituation.
Emerald Ash Borer
Background
Theemeraldashborer(EAB;Agrilus planipennis)isnativetoAsiaandisthoughttohavebeenintroducedaccidentallytotheDetroitareainthemid-1990sbeforebeingfirstdetectedtherein2002.InNorthAmerica,EABhasonlybeenidentifiedasapestofashandallnativespeciesofashappeartobesusceptible,evenwhenhealthy(Cappaertetal.2005,PolandandMcCullough2006).Thisinsectcausesashtreedeathwhenlarvaefeedunderthebark,cuttingofftheflowofwaterandnutrients.SpreadofEABhasbeenfacilitatedbyhumantransportationofinfestedmaterial,typicallyfirewood.Systemicinsecticidesinjectedintotreescanprovide1to3yearsofprotection,andthreespeciesofparasitoidshavebeenclearedforintroductionintotheUnitedStates.
What We Found
InAugust2008,EABwasobservedforthefirsttimeinWisconsin;awellestablishedpopulationofEABwasfoundinNewburg,OzaukeeCounty(Fig.66).TheareaisruralresidentialwithashdominatedwoodlandalongtheupperreachesoftheMilwaukeeRiver.Dendrochronology,ortreeringdating,indicatesthe
Figure 65.—Distribution of defoliation in Wisconsin by gypsy moth between
2004 and 2009.
Gypsy MothYear of Defoliations 2009 2008 2007Sources: Wisconsin Department of Natural Resources.
Area of Interest
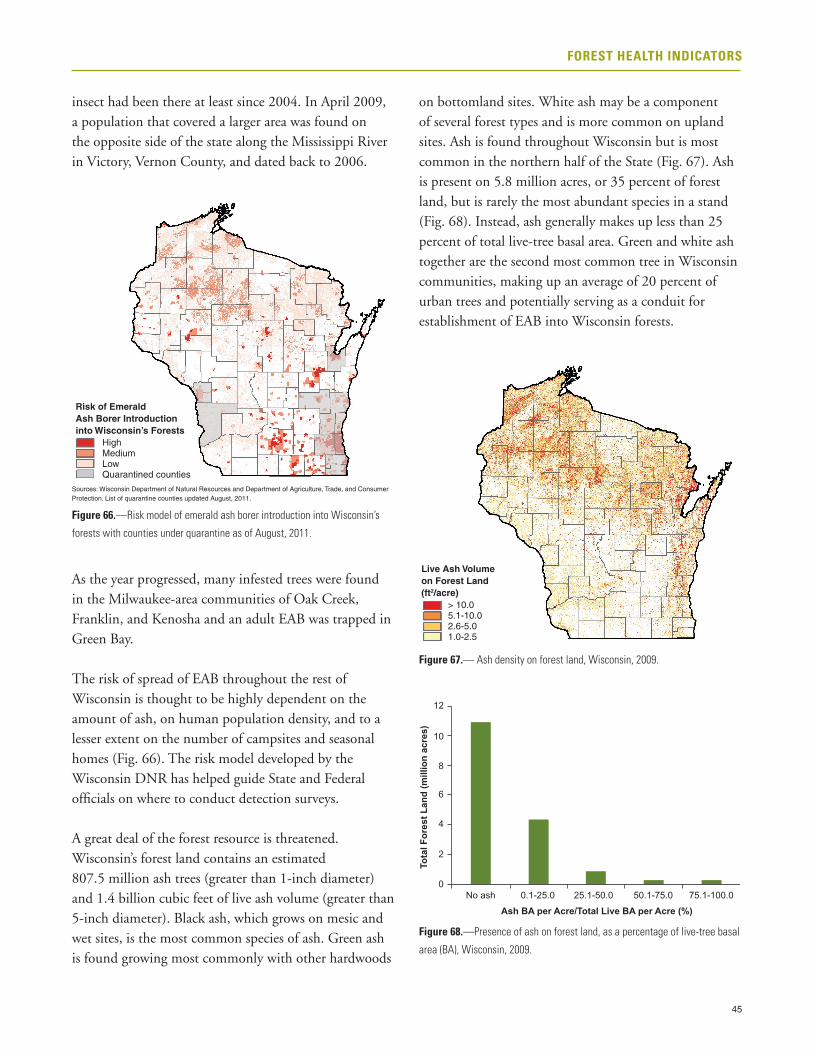
45
FOREST HEALTH INDICATORS
onbottomlandsites.Whiteashmaybeacomponentofseveralforesttypesandismorecommononuplandsites.AshisfoundthroughoutWisconsinbutismostcommoninthenorthernhalfoftheState(Fig.67).Ashispresenton5.8millionacres,or35percentofforestland,butisrarelythemostabundantspeciesinastand(Fig.68).Instead,ashgenerallymakesuplessthan25percentoftotallive-treebasalarea.GreenandwhiteashtogetherarethesecondmostcommontreeinWisconsincommunities,makingupanaverageof20percentofurbantreesandpotentiallyservingasaconduitforestablishmentofEABintoWisconsinforests.
insecthadbeenthereatleastsince2004.InApril2009,apopulationthatcoveredalargerareawasfoundontheoppositesideofthestatealongtheMississippiRiverinVictory,VernonCounty,anddatedbackto2006.
Astheyearprogressed,manyinfestedtreeswerefoundintheMilwaukee-areacommunitiesofOakCreek,Franklin,andKenoshaandanadultEABwastrappedinGreenBay.
TheriskofspreadofEABthroughouttherestofWisconsinisthoughttobehighlydependentontheamountofash,onhumanpopulationdensity,andtoalesserextentonthenumberofcampsitesandseasonalhomes(Fig.66).TheriskmodeldevelopedbytheWisconsinDNRhashelpedguideStateandFederalofficialsonwheretoconductdetectionsurveys.
Agreatdealoftheforestresourceisthreatened.Wisconsin’sforestlandcontainsanestimated807.5millionashtrees(greaterthan1-inchdiameter)and1.4billioncubicfeetofliveashvolume(greaterthan5-inchdiameter).Blackash,whichgrowsonmesicandwetsites,isthemostcommonspeciesofash.Greenashisfoundgrowingmostcommonlywithotherhardwoods
0
2
4
6
8
10
12
No ash 0.1-25.0 25.1-50.0 50.1-75.0 75.1-100.0
Tota
l For
est L
and
(mill
ion
acre
s)
Ash BA per Acre/Total Live BA per Acre (%)
Figure 66.—Risk model of emerald ash borer introduction into Wisconsin’s
forests with counties under quarantine as of August, 2011.
Figure 67.— Ash density on forest land, Wisconsin, 2009.
Figure 68.—Presence of ash on forest land, as a percentage of live-tree basal
area (BA), Wisconsin, 2009.
Risk of Emerald Ash Borer Introduction into Wisconsin’s Forests High Medium Low Quarantined counties
Live Ash Volume on Forest Land(ft2/acre) > 10.0 5.1-10.0 2.6-5.0 1.0-2.5
Sources: Wisconsin Department of Natural Resources and Department of Agriculture, Trade, and Consumer Protection. List of quarantine counties updated August, 2011.
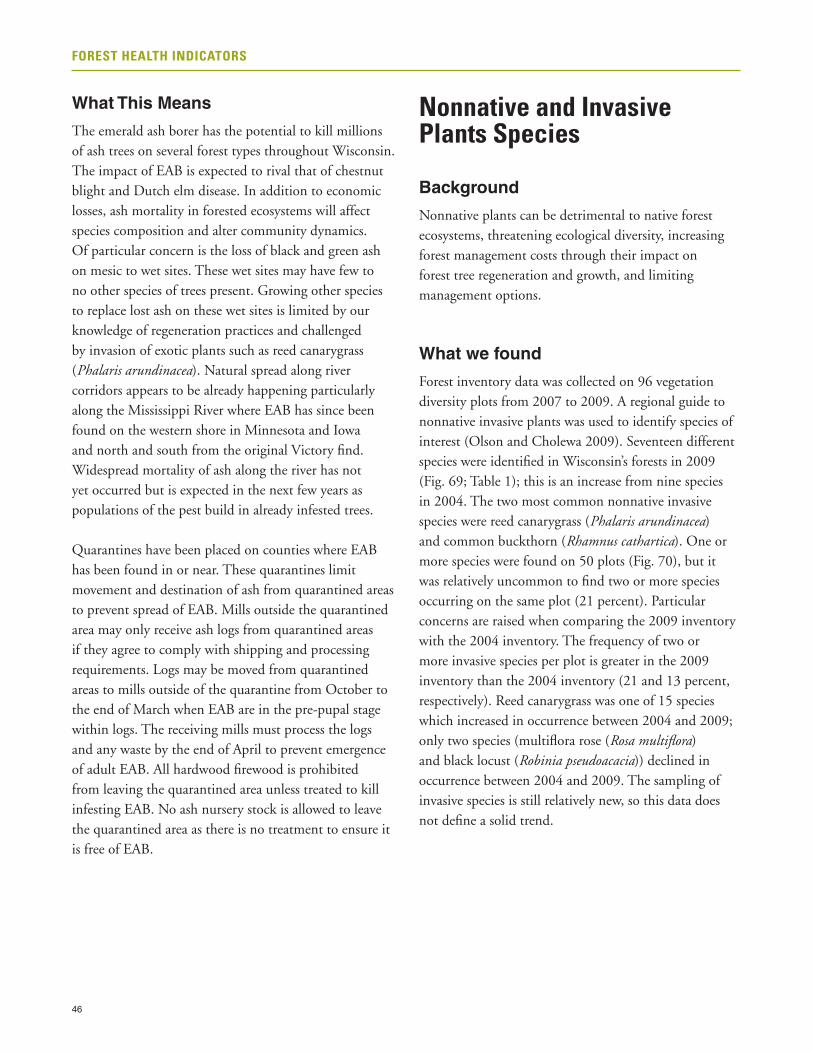
46
FOREST HEALTH INDICATORS
What This Means
TheemeraldashborerhasthepotentialtokillmillionsofashtreesonseveralforesttypesthroughoutWisconsin.TheimpactofEABisexpectedtorivalthatofchestnutblightandDutchelmdisease.Inadditiontoeconomiclosses,ashmortalityinforestedecosystemswillaffectspeciescompositionandaltercommunitydynamics.Ofparticularconcernisthelossofblackandgreenashonmesictowetsites.Thesewetsitesmayhavefewtonootherspeciesoftreespresent.Growingotherspeciestoreplacelostashonthesewetsitesislimitedbyourknowledgeofregenerationpracticesandchallengedbyinvasionofexoticplantssuchasreedcanarygrass(Phalaris arundinacea).NaturalspreadalongrivercorridorsappearstobealreadyhappeningparticularlyalongtheMississippiRiverwhereEABhassincebeenfoundonthewesternshoreinMinnesotaandIowaandnorthandsouthfromtheoriginalVictoryfind.Widespreadmortalityofashalongtheriverhasnotyetoccurredbutisexpectedinthenextfewyearsaspopulationsofthepestbuildinalreadyinfestedtrees.
QuarantineshavebeenplacedoncountieswhereEABhasbeenfoundinornear.ThesequarantineslimitmovementanddestinationofashfromquarantinedareastopreventspreadofEAB.Millsoutsidethequarantinedareamayonlyreceiveashlogsfromquarantinedareasiftheyagreetocomplywithshippingandprocessingrequirements.LogsmaybemovedfromquarantinedareastomillsoutsideofthequarantinefromOctobertotheendofMarchwhenEABareinthepre-pupalstagewithinlogs.ThereceivingmillsmustprocessthelogsandanywastebytheendofApriltopreventemergenceofadultEAB.AllhardwoodfirewoodisprohibitedfromleavingthequarantinedareaunlesstreatedtokillinfestingEAB.NoashnurserystockisallowedtoleavethequarantinedareaasthereisnotreatmenttoensureitisfreeofEAB.
Nonnative and Invasive Plants Species
Background
Nonnativeplantscanbedetrimentaltonativeforestecosystems,threateningecologicaldiversity,increasingforestmanagementcoststhroughtheirimpactonforesttreeregenerationandgrowth,andlimitingmanagementoptions.
What we found
Forestinventorydatawascollectedon96vegetationdiversityplotsfrom2007to2009.Aregionalguidetononnativeinvasiveplantswasusedtoidentifyspeciesofinterest(OlsonandCholewa2009).SeventeendifferentspecieswereidentifiedinWisconsin’sforestsin2009(Fig.69;Table1);thisisanincreasefromninespeciesin2004.Thetwomostcommonnonnativeinvasivespecieswerereedcanarygrass(Phalaris arundinacea)andcommonbuckthorn(Rhamnus cathartica).Oneormorespecieswerefoundon50plots(Fig.70),butitwasrelativelyuncommontofindtwoormorespeciesoccurringonthesameplot(21percent).Particularconcernsareraisedwhencomparingthe2009inventorywiththe2004inventory.Thefrequencyoftwoormoreinvasivespeciesperplotisgreaterinthe2009inventorythanthe2004inventory(21and13percent,respectively).Reedcanarygrasswasoneof15specieswhichincreasedinoccurrencebetween2004and2009;onlytwospecies(multiflorarose(Rosa multiflora)andblacklocust(Robinia pseudoacacia))declinedinoccurrencebetween2004and2009.Thesamplingofinvasivespeciesisstillrelativelynew,sothisdatadoesnotdefineasolidtrend.
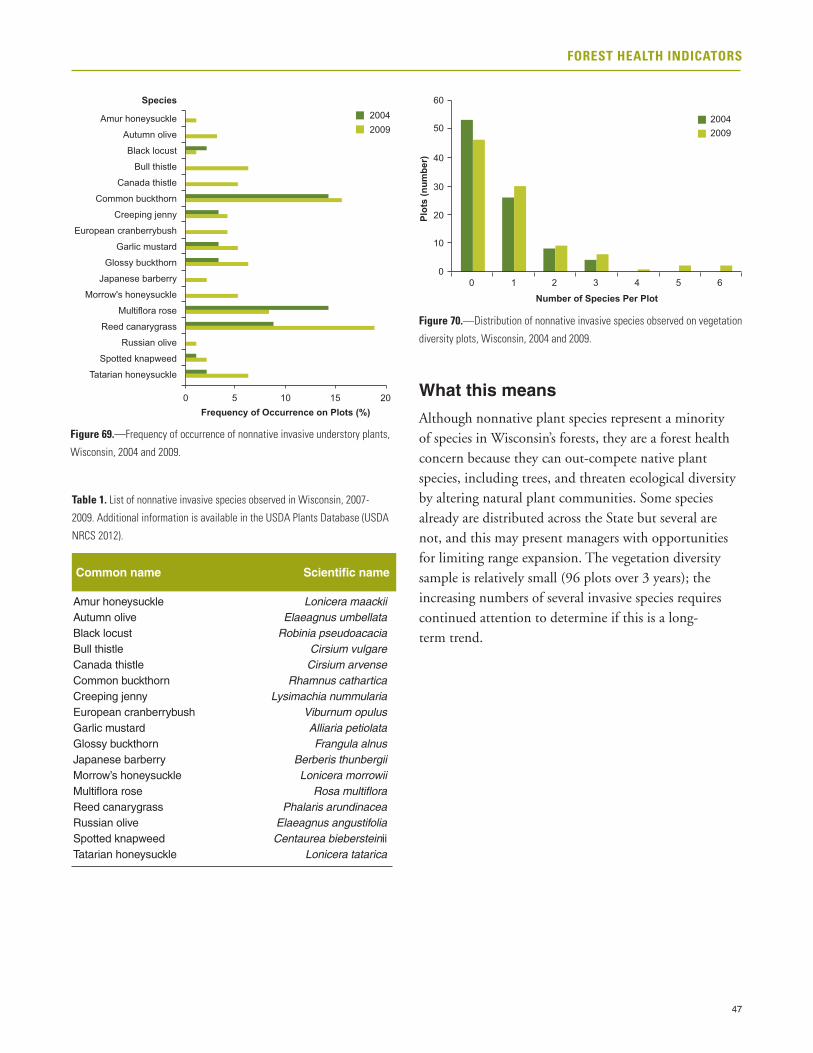
47
FOREST HEALTH INDICATORS
What this means
AlthoughnonnativeplantspeciesrepresentaminorityofspeciesinWisconsin’sforests,theyareaforesthealthconcernbecausetheycanout-competenativeplantspecies,includingtrees,andthreatenecologicaldiversitybyalteringnaturalplantcommunities.SomespeciesalreadyaredistributedacrosstheStatebutseveralarenot,andthismaypresentmanagerswithopportunitiesforlimitingrangeexpansion.Thevegetationdiversitysampleisrelativelysmall(96plotsover3years);theincreasingnumbersofseveralinvasivespeciesrequirescontinuedattentiontodetermineifthisisalong-termtrend.
0 5 10 15 20
Tatarian honeysuckle
Spotted knapweed
Russian olive
Reed canarygrass
Multiflora rose
Morrow's honeysuckle
Japanese barberry
Glossy buckthorn
Garlic mustard
European cranberrybush
Creeping jenny
Common buckthorn
Canada thistle
Bull thistle
Black locust
Autumn olive
Amur honeysuckle
Frequency of Occurrence on Plots (%)
Species 2004
2009
2004
2009
0
10
20
30
40
50
60
0 1 2 3 4 5 6
Plot
s (n
umbe
r)
Number of Species Per Plot
Figure 69.—Frequency of occurrence of nonnative invasive understory plants,
Wisconsin, 2004 and 2009.
Figure 70.—Distribution of nonnative invasive species observed on vegetation
diversity plots, Wisconsin, 2004 and 2009.
Table 1. List of nonnative invasive species observed in Wisconsin, 2007-
2009. Additional information is available in the USDA Plants Database (USDA
NRCS 2012).
Amur honeysuckle Lonicera maackiiAutumn olive Elaeagnus umbellataBlack locust Robinia pseudoacaciaBull thistle Cirsium vulgareCanada thistle Cirsium arvenseCommon buckthorn Rhamnus catharticaCreeping jenny Lysimachia nummulariaEuropean cranberrybush Viburnum opulusGarlic mustard Alliaria petiolataGlossy buckthorn Frangula alnusJapanese barberry Berberis thunbergiiMorrow’s honeysuckle Lonicera morrowiiMultiflora rose Rosa multifloraReed canarygrass Phalaris arundinaceaRussian olive Elaeagnus angustifoliaSpotted knapweed Centaurea biebersteiniiTatarian honeysuckle Lonicera tatarica
Common name Scientific name

48
4949
Forest Economics
Red pine stand. Photo by Steven Katovich, U.S. Forest Service, bugwood.org.
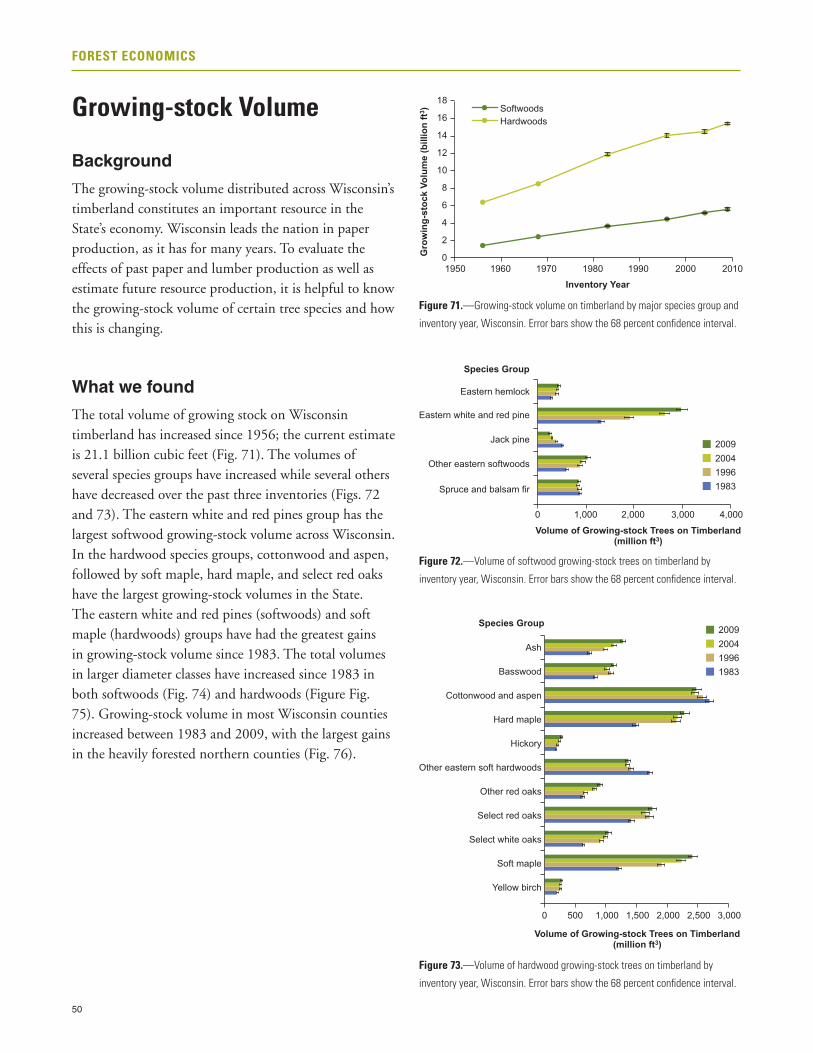
50
FOREST ECONOMICS
Growing-stock Volume
Background
Thegrowing-stockvolumedistributedacrossWisconsin’stimberlandconstitutesanimportantresourceintheState’seconomy.Wisconsinleadsthenationinpaperproduction,asithasformanyyears.Toevaluatetheeffectsofpastpaperandlumberproductionaswellasestimatefutureresourceproduction,itishelpfultoknowthegrowing-stockvolumeofcertaintreespeciesandhowthisischanging.
What we found
ThetotalvolumeofgrowingstockonWisconsintimberlandhasincreasedsince1956;thecurrentestimateis21.1billioncubicfeet(Fig.71).Thevolumesofseveralspeciesgroupshaveincreasedwhileseveralothershavedecreasedoverthepastthreeinventories(Figs.72and73).Theeasternwhiteandredpinesgrouphasthelargestsoftwoodgrowing-stockvolumeacrossWisconsin.Inthehardwoodspeciesgroups,cottonwoodandaspen,followedbysoftmaple,hardmaple,andselectredoakshavethelargestgrowing-stockvolumesintheState.Theeasternwhiteandredpines(softwoods)andsoftmaple(hardwoods)groupshavehadthegreatestgainsingrowing-stockvolumesince1983.Thetotalvolumesinlargerdiameterclasseshaveincreasedsince1983inbothsoftwoods(Fig.74)andhardwoods(FigureFig.75).Growing-stockvolumeinmostWisconsincountiesincreasedbetween1983and2009,withthelargestgainsintheheavilyforestednortherncounties(Fig.76).
Softwoods
Hardwoods
0
2
4
6
8
10
12
14
16
18
1950 1960 1970 1980 1990 2000 2010
Gro
win
g-st
ock
Volu
me
(bill
ion
ft3)
Inventory Year
2009
2004
1996
1983
0 1,000 2,000 3,000 4,000
Spruce and balsam fir
Other eastern softwoods
Jack pine
Eastern white and red pine
Eastern hemlock
Volume of Growing-stock Trees on Timberland (million ft3)
Species Group
2009
2004
1996
1983
Species Group
0 500 1,000 1,500 2,000 2,500 3,000
Yellow birch
Soft maple
Select white oaks
Select red oaks
Other red oaks
Other eastern soft hardwoods
Hickory
Hard maple
Cottonwood and aspen
Basswood
Ash
Volume of Growing-stock Trees on Timberland (million ft3)
Figure 71.—Growing-stock volume on timberland by major species group and
inventory year, Wisconsin. Error bars show the 68 percent confidence interval.
Figure 72.—Volume of softwood growing-stock trees on timberland by
inventory year, Wisconsin. Error bars show the 68 percent confidence interval.
Figure 73.—Volume of hardwood growing-stock trees on timberland by
inventory year, Wisconsin. Error bars show the 68 percent confidence interval.
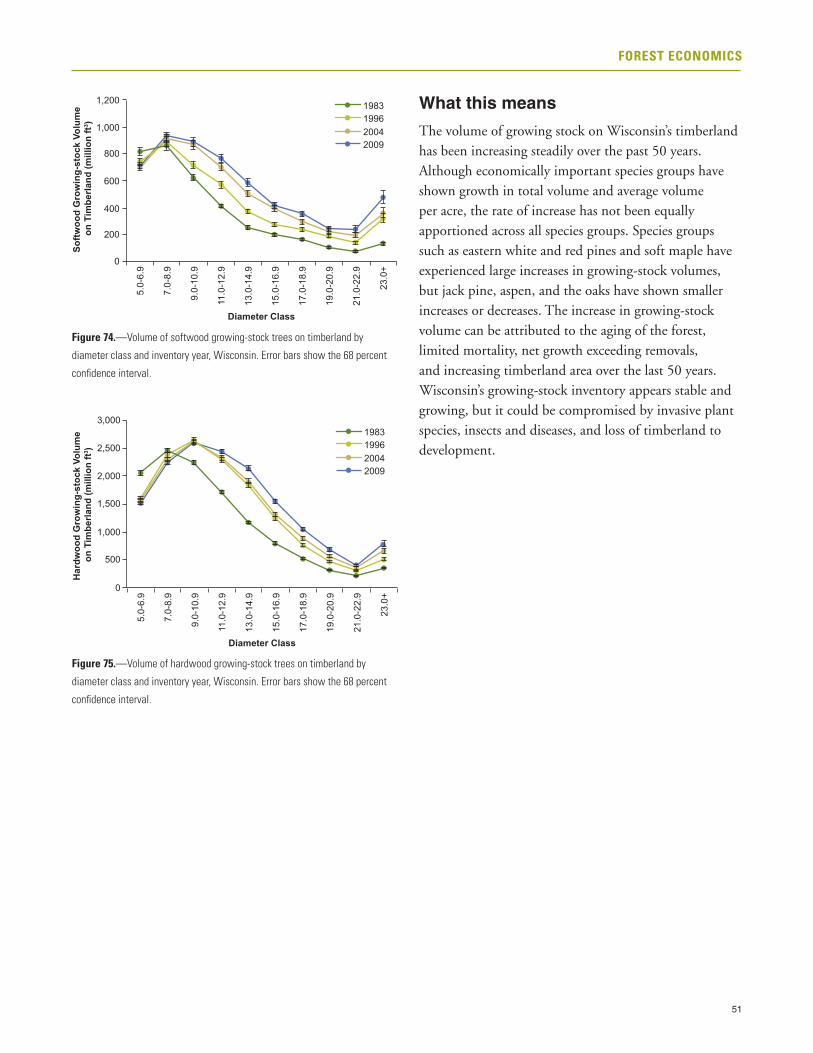
51
FOREST ECONOMICS
What this means
ThevolumeofgrowingstockonWisconsin’stimberlandhasbeenincreasingsteadilyoverthepast50years.Althougheconomicallyimportantspeciesgroupshaveshowngrowthintotalvolumeandaveragevolumeperacre,therateofincreasehasnotbeenequallyapportionedacrossallspeciesgroups.Speciesgroupssuchaseasternwhiteandredpinesandsoftmaplehaveexperiencedlargeincreasesingrowing-stockvolumes,butjackpine,aspen,andtheoakshaveshownsmallerincreasesordecreases.Theincreaseingrowing-stockvolumecanbeattributedtotheagingoftheforest,limitedmortality,netgrowthexceedingremovals,andincreasingtimberlandareaoverthelast50years.Wisconsin’sgrowing-stockinventoryappearsstableandgrowing,butitcouldbecompromisedbyinvasiveplantspecies,insectsanddiseases,andlossoftimberlandtodevelopment.
1983
1996
2004
2009
0
200
400
600
800
1,000
1,200
5.0
-6.9
7.0
-8.9
9.0
-10
.9
11.0
-12
.9
13
.0-1
4.9
15
.0-1
6.9
17
.0-1
8.9
19
.0-2
0.9
21
.0-2
2.9
23
.0+
Softw
ood
Gro
win
g-st
ock
Volu
me
on T
imbe
rland
(mill
ion
ft3 )
Diameter Class
1983
1996
2004
2009
Har
dwoo
d G
row
ing-
stoc
k Vo
lum
e on
Tim
berla
nd (m
illio
n ft3 )
0
500
1,000
1,500
2,000
2,500
3,000
5.0
-6.9
7.0
-8.9
9.0
-10.9
11.0
-12.9
13.0
-14.9
15.0
-16.9
17.0
-18.9
19.0
-20.9
21.0
-22.9
23.0
+
Diameter Class
Figure 74.—Volume of softwood growing-stock trees on timberland by
diameter class and inventory year, Wisconsin. Error bars show the 68 percent
confidence interval.
Figure 75.—Volume of hardwood growing-stock trees on timberland by
diameter class and inventory year, Wisconsin. Error bars show the 68 percent
confidence interval.
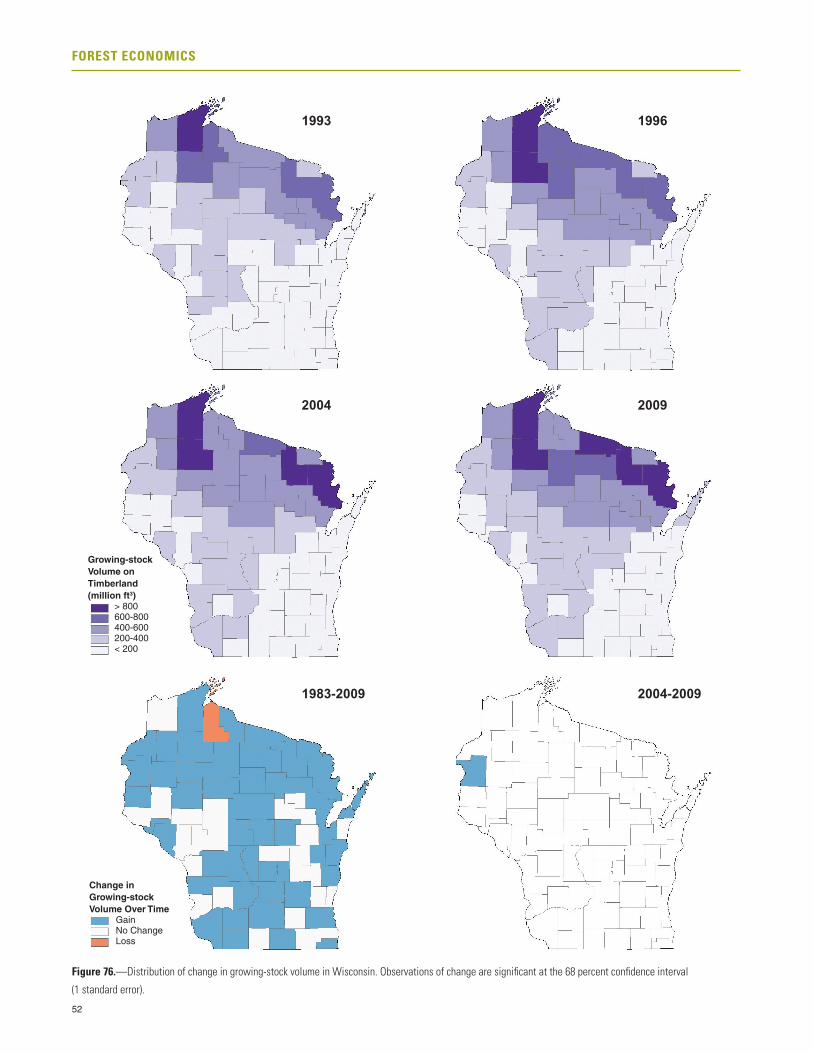
52
FOREST ECONOMICS
Figure 76.—Distribution of change in growing-stock volume in Wisconsin. Observations of change are significant at the 68 percent confidence interval
(1 standard error).
Change in Growing-stock Volume Over Time Gain No Change Loss
1993 1996
2004 2009
1983-2009 2004-2009
Growing-stock Volume on Timberland (million ft3) > 800 600-800 400-600 200-400 < 200
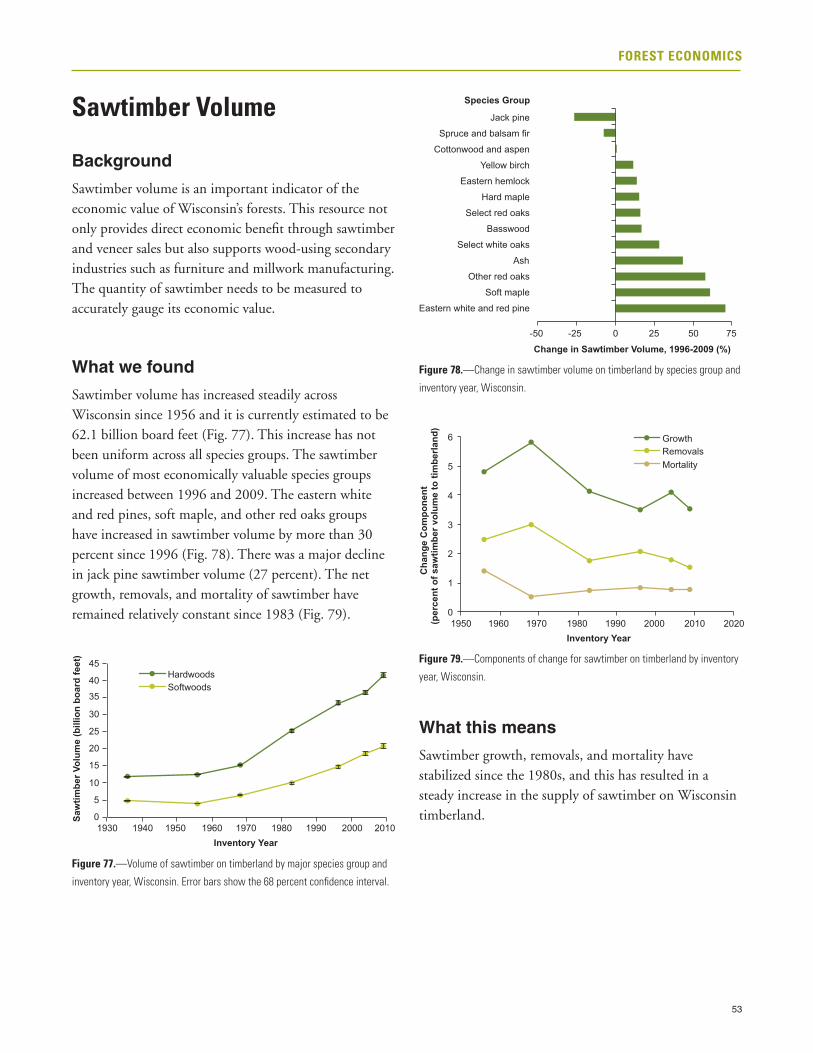
53
FOREST ECONOMICS
Sawtimber Volume
Background
SawtimbervolumeisanimportantindicatoroftheeconomicvalueofWisconsin’sforests.Thisresourcenotonlyprovidesdirecteconomicbenefitthroughsawtimberandveneersalesbutalsosupportswood-usingsecondaryindustriessuchasfurnitureandmillworkmanufacturing.Thequantityofsawtimberneedstobemeasuredtoaccuratelygaugeitseconomicvalue.
What we found
SawtimbervolumehasincreasedsteadilyacrossWisconsinsince1956anditiscurrentlyestimatedtobe62.1billionboardfeet(Fig.77).Thisincreasehasnotbeenuniformacrossallspeciesgroups.Thesawtimbervolumeofmosteconomicallyvaluablespeciesgroupsincreasedbetween1996and2009.Theeasternwhiteandredpines,softmaple,andotherredoaksgroupshaveincreasedinsawtimbervolumebymorethan30percentsince1996(Fig.78).Therewasamajordeclineinjackpinesawtimbervolume(27percent).Thenetgrowth,removals,andmortalityofsawtimberhaveremainedrelativelyconstantsince1983(Fig.79).
What this means
Sawtimbergrowth,removals,andmortalityhavestabilizedsincethe1980s,andthishasresultedinasteadyincreaseinthesupplyofsawtimberonWisconsintimberland.
Hardwoods
Softwoods
0
5
10
15
20
25
30
35
40
45
1930 1940 1950 1960 1970 1980 1990 2000 2010
Saw
timbe
r Vol
ume
(bill
ion
boar
d fe
et)
Inventory Year
-50 -25 0 25 50 75
Eastern white and red pine
Soft maple
Other red oaks
Ash
Select white oaks
Basswood
Select red oaks
Hard maple
Eastern hemlock
Yellow birch
Cottonwood and aspen
Spruce and balsam fir
Jack pine
Change in Sawtimber Volume, 1996-2009 (%)
Species Group
Growth
Removals
Mortality
0
1
2
3
4
5
6
1950 1960 1970 1980 1990 2000 2010 2020
Cha
nge
Com
pone
nt
(per
cent
of s
awtim
ber v
olum
e to
tim
berla
nd)
Inventory Year
Figure 77.—Volume of sawtimber on timberland by major species group and
inventory year, Wisconsin. Error bars show the 68 percent confidence interval.
Figure 78.—Change in sawtimber volume on timberland by species group and
inventory year, Wisconsin.
Figure 79.—Components of change for sawtimber on timberland by inventory
year, Wisconsin.
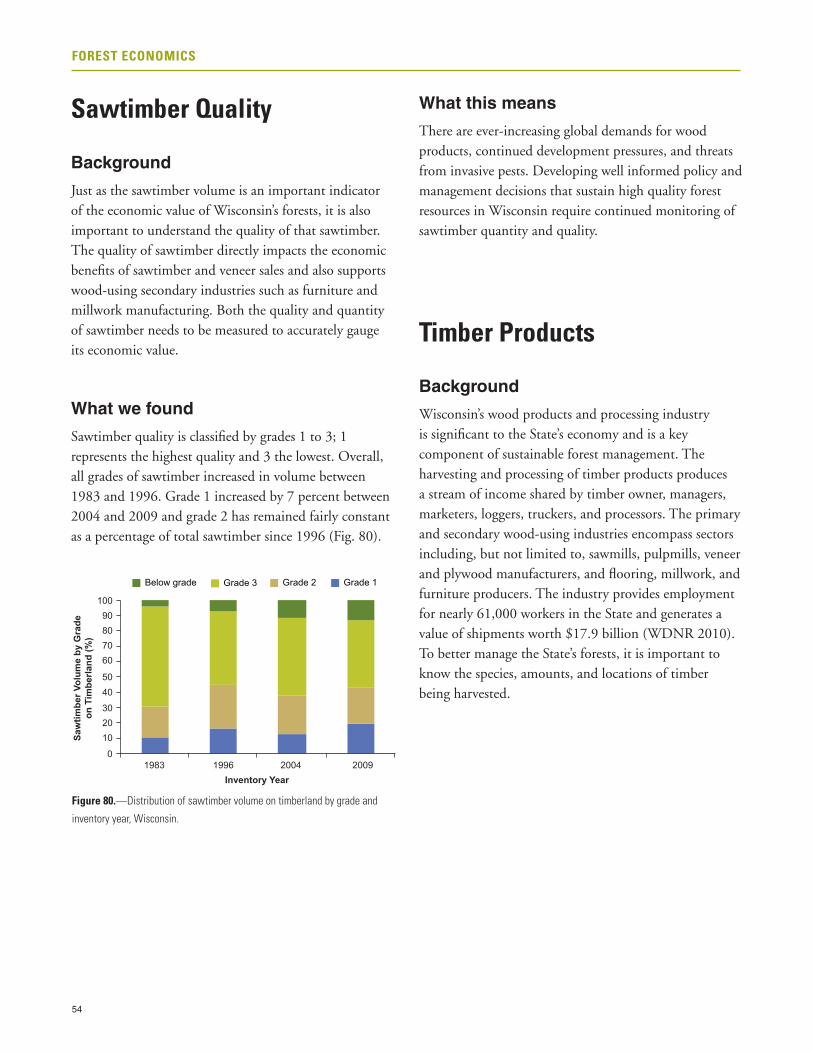
54
FOREST ECONOMICS
Sawtimber Quality
Background
JustasthesawtimbervolumeisanimportantindicatoroftheeconomicvalueofWisconsin’sforests,itisalsoimportanttounderstandthequalityofthatsawtimber.Thequalityofsawtimberdirectlyimpactstheeconomicbenefitsofsawtimberandveneersalesandalsosupportswood-usingsecondaryindustriessuchasfurnitureandmillworkmanufacturing.Boththequalityandquantityofsawtimberneedstobemeasuredtoaccuratelygaugeitseconomicvalue.
What we found
Sawtimberqualityisclassifiedbygrades1to3;1representsthehighestqualityand3thelowest.Overall,allgradesofsawtimberincreasedinvolumebetween1983and1996.Grade1increasedby7percentbetween2004and2009andgrade2hasremainedfairlyconstantasapercentageoftotalsawtimbersince1996(Fig.80).
What this means
Thereareever-increasingglobaldemandsforwoodproducts,continueddevelopmentpressures,andthreatsfrominvasivepests.DevelopingwellinformedpolicyandmanagementdecisionsthatsustainhighqualityforestresourcesinWisconsinrequirecontinuedmonitoringofsawtimberquantityandquality.
Timber Products
Background
Wisconsin’swoodproductsandprocessingindustryissignificanttotheState’seconomyandisakeycomponentofsustainableforestmanagement.Theharvestingandprocessingoftimberproductsproducesastreamofincomesharedbytimberowner,managers,marketers,loggers,truckers,andprocessors.Theprimaryandsecondarywood-usingindustriesencompasssectorsincluding,butnotlimitedto,sawmills,pulpmills,veneerandplywoodmanufacturers,andflooring,millwork,andfurnitureproducers.Theindustryprovidesemploymentfornearly61,000workersintheStateandgeneratesavalueofshipmentsworth$17.9billion(WDNR2010).TobettermanagetheState’sforests,itisimportanttoknowthespecies,amounts,andlocationsoftimberbeingharvested.
Below grade Grade 3 Grade 2 Grade 1
0
10
20
30
40
50
60
70
80
90
100
1983 1996 2004 2009
Saw
timbe
r Vol
ume
by G
rade
on
Tim
berla
nd (%
)
Inventory Year
Figure 80.—Distribution of sawtimber volume on timberland by grade and
inventory year, Wisconsin.
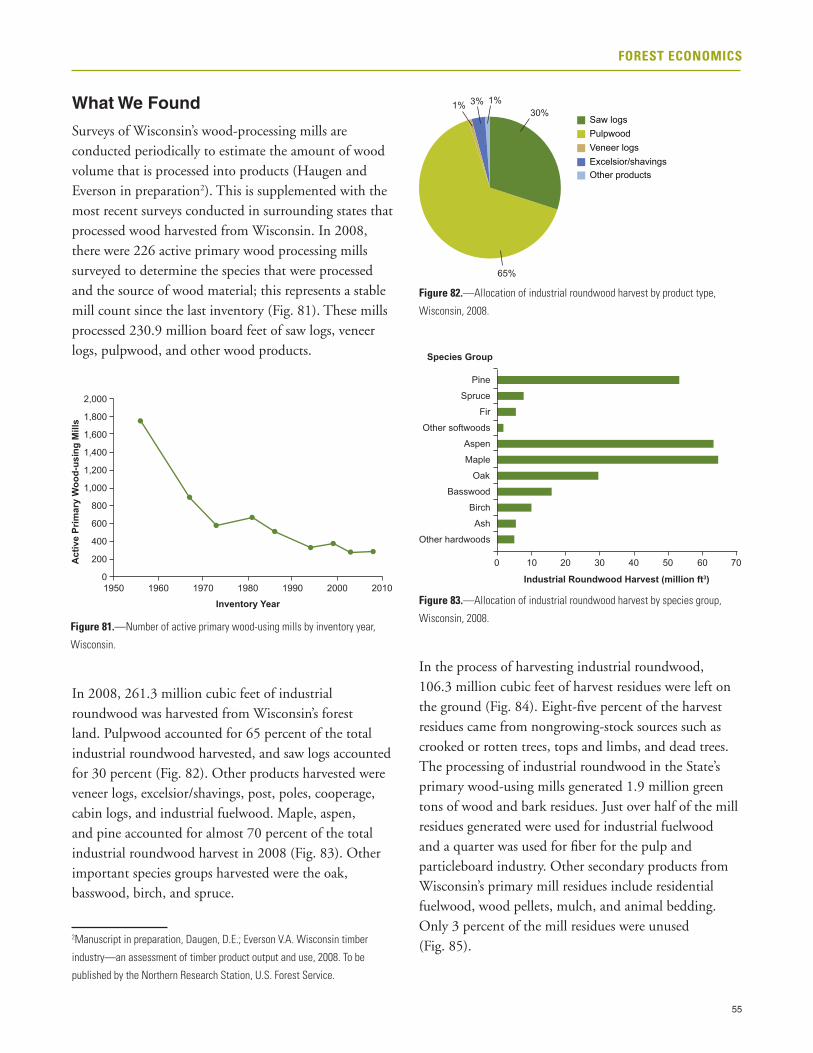
55
FOREST ECONOMICS
What We Found
SurveysofWisconsin’swood-processingmillsareconductedperiodicallytoestimatetheamountofwoodvolumethatisprocessedintoproducts(HaugenandEversoninpreparation2).ThisissupplementedwiththemostrecentsurveysconductedinsurroundingstatesthatprocessedwoodharvestedfromWisconsin.In2008,therewere226activeprimarywoodprocessingmillssurveyedtodeterminethespeciesthatwereprocessedandthesourceofwoodmaterial;thisrepresentsastablemillcountsincethelastinventory(Fig.81).Thesemillsprocessed230.9millionboardfeetofsawlogs,veneerlogs,pulpwood,andotherwoodproducts.
Intheprocessofharvestingindustrialroundwood,106.3millioncubicfeetofharvestresidueswereleftontheground(Fig.84).Eight-fivepercentoftheharvestresiduescamefromnongrowing-stocksourcessuchascrookedorrottentrees,topsandlimbs,anddeadtrees.TheprocessingofindustrialroundwoodintheState’sprimarywood-usingmillsgenerated1.9milliongreentonsofwoodandbarkresidues.Justoverhalfofthemillresiduesgeneratedwereusedforindustrialfuelwoodandaquarterwasusedforfiberforthepulpandparticleboardindustry.OthersecondaryproductsfromWisconsin’sprimarymillresiduesincluderesidentialfuelwood,woodpellets,mulch,andanimalbedding.Only3percentofthemillresidueswereunused(Fig.85).
0
200
400
600
800
1,000
1,200
1,400
1,600
1,800
2,000
1950 1960 1970 1980 1990 2000 2010
Act
ive
Prim
ary
Woo
d-us
ing
Mill
s
Inventory Year
1% 1%
30%
65%
3%
Saw logs
Pulpwood
Veneer logs
Excelsior/shavings
Other products
Pine
Spruce
Fir
Other softwoods
Aspen
Maple
Oak
Basswood
Birch
Ash
Other hardwoods
Industrial Roundwood Harvest (million ft3)
Species Group
706050403020100
Figure 81.—Number of active primary wood-using mills by inventory year,
Wisconsin.
Figure 82.—Allocation of industrial roundwood harvest by product type,
Wisconsin, 2008.
Figure 83.—Allocation of industrial roundwood harvest by species group,
Wisconsin, 2008.
2Manuscript in preparation, Daugen, D.E.; Everson V.A. Wisconsin timber
industry—an assessment of timber product output and use, 2008. To be
published by the Northern Research Station, U.S. Forest Service.
In2008,261.3millioncubicfeetofindustrialroundwoodwasharvestedfromWisconsin’sforestland.Pulpwoodaccountedfor65percentofthetotalindustrialroundwoodharvested,andsawlogsaccountedfor30percent(Fig.82).Otherproductsharvestedwereveneerlogs,excelsior/shavings,post,poles,cooperage,cabinlogs,andindustrialfuelwood.Maple,aspen,andpineaccountedforalmost70percentofthetotalindustrialroundwoodharvestin2008(Fig.83).Otherimportantspeciesgroupsharvestedweretheoak,basswood,birch,andspruce.
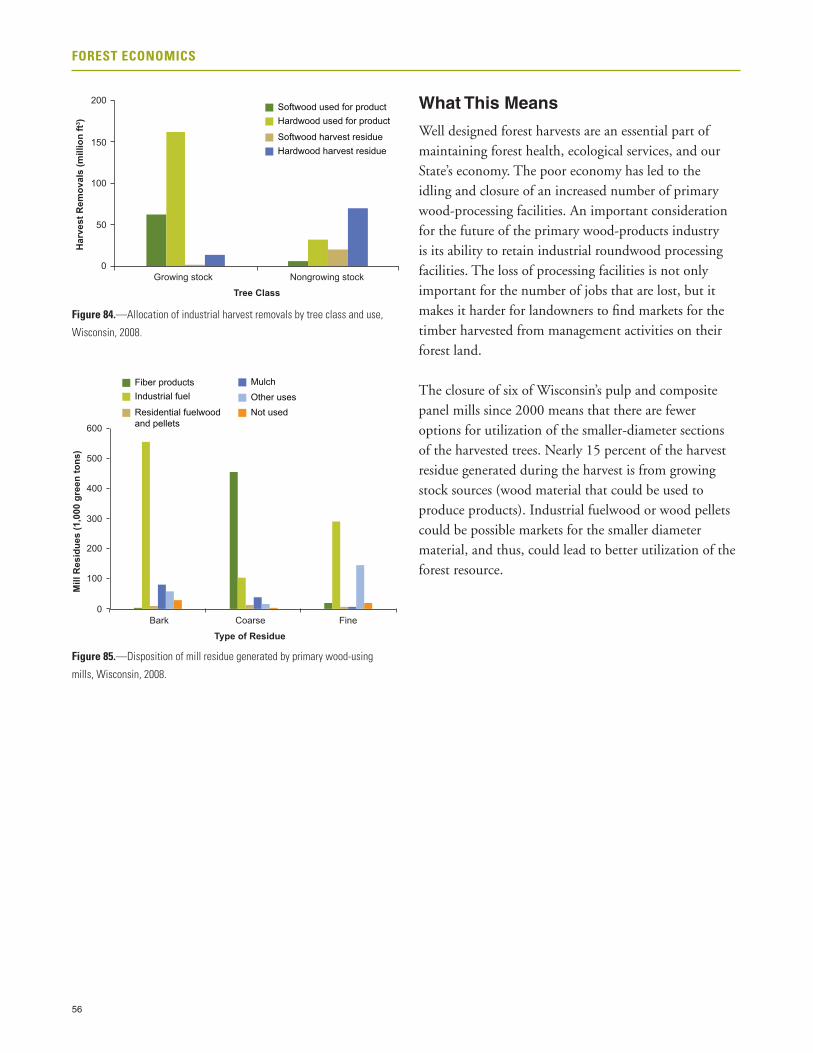
56
FOREST ECONOMICS
What This Means
Welldesignedforestharvestsareanessentialpartofmaintainingforesthealth,ecologicalservices,andourState’seconomy.Thepooreconomyhasledtotheidlingandclosureofanincreasednumberofprimarywood-processingfacilities.Animportantconsiderationforthefutureoftheprimarywood-productsindustryisitsabilitytoretainindustrialroundwoodprocessingfacilities.Thelossofprocessingfacilitiesisnotonlyimportantforthenumberofjobsthatarelost,butitmakesitharderforlandownerstofindmarketsforthetimberharvestedfrommanagementactivitiesontheirforestland.
TheclosureofsixofWisconsin’spulpandcompositepanelmillssince2000meansthattherearefeweroptionsforutilizationofthesmaller-diametersectionsoftheharvestedtrees.Nearly15percentoftheharvestresiduegeneratedduringtheharvestisfromgrowingstocksources(woodmaterialthatcouldbeusedtoproduceproducts).Industrialfuelwoodorwoodpelletscouldbepossiblemarketsforthesmallerdiametermaterial,andthus,couldleadtobetterutilizationoftheforestresource.
Fiber products
Industrial fuel
Residential fuelwood
and pellets
Mulch
Other uses
Not used
0
100
200
300
400
500
600
Bark Coarse Fine
Mill
Res
idue
s (1
,000
gre
en to
ns)
Type of Residue
Figure 85.—Disposition of mill residue generated by primary wood-using
mills, Wisconsin, 2008.
Softwood used for product
Hardwood used for product
Softwood harvest residue
Hardwood harvest residue
0
50
100
150
200
Growing stock Nongrowing stock
Har
vest
Rem
oval
s (m
illio
n ft3 )
Tree Class
Figure 84.—Allocation of industrial harvest removals by tree class and use,
Wisconsin, 2008.
5757
Data Sources and Techniques
Eastern white pine. Photo by Linda Haugen, U.S. Forest Service.
58
DATA SOURCES AND TECHNIQUES
Forest InventoryInformationontheconditionandstatusofforestsinWisconsinwasobtainedfromtheNorthernResearchStation’sForestInventoryandAnalysis(NRS-FIA)program.PreviousinventoriesoftheState’sforestresourceswerecompletedin1936,1956,1968,1983,1996,and2004(CunninghamandMoser1938;Cunninghametal.1939;Kotaretal.1999;Perryetal.2007;Schmidt1998;SpencerandThorne1972;Spenceretal.1988;StoneandThorne1961).
TabulardatacanbegeneratedattheForestInventoryandAnalysisDataCenterWebpageathttp://www.fiatools.fs.fed.us/.Additionaldetailscanbefoundin“Wisconsin’sForests2009:Statistics,Methods,andQualityAssurance,”ontheDVDintheinsidebackcoverpocketofthisbulletin.
ForadditionalinformationaboutFIA,contact:ProgramManager,ForestInventoryandAnalysis,NorthernResearchStation,1992FolwellAvenue,St.Paul,MN55108orStateForester,WisconsinDepartmentofNaturalResources,DivisionofForestry,P.O.Box7921,Madison,WI53707-7921.
National Woodland Owner Survey
InformationaboutfamilyforestownersiscollectedthroughtheU.S.ForestService’sNationalWoodlandOwnerSurvey(NWOS).TheNWOSisdesignedtoincreaseourunderstandingofowners’attitudes,behaviors,andrelatedcharacteristics(Butleretal.2005).IndividualsandprivategroupsidentifiedasforestownersbyFIAareinvitedtoparticipateintheNWOS.Datapresentedherearebasedonsurveyresponsescollectedbetween2002and2006from1,525randomlyselectedfamiliesandindividualswhoownforestlandinWisconsin.ForadditionalinformationabouttheNWOS,visit:http://www.fia.fs.fed.us/nwos.
Timber Products Output Inventory
InformationontheharvestanduseofforestproductsiscollectedunderacooperativeeffortoftheDivisionofForestryoftheWisconsinDepartmentofNaturalResources(WIDNR)andtheNorthernResearchStation(NRS).UsingaquestionnairedesignedtodeterminethesizeandcompositionofWisconsin’sforestproductsindustry,itsuseofroundwood(roundsectionscutfromtrees),anditsgenerationanddispositionofwoodresidues,WisconsinDivisionofForestrypersonnelvisitedall“known”primarywood-usingmillswithintheState.CompletedquestionnairesweresenttoNRSforprocessingandanalysis.Thelastcompletesurveywascollectedin2008(HaugenandEversoninpreparation2).Aspartofthisinventory,allindustrialroundwoodvolumesreportedonthequestionnaireswereconvertedtostandardunitsofmeasureusingregionalconversionfactors.TimberremovalsbysourceofmaterialandharvestresiduesgeneratedduringloggingwereestimatedfromstandardproductvolumesusingfactorsdevelopedfromloggingutilizationstudiespreviouslyconductedbyNRS.
Mapping Procedures
Mapsinthisreportwereconstructedusing(1)categoricalcoloringofWisconsin’scountiesaccordingtoforestattributes(suchasforestlandarea);(2)avariationofthek-nearest-neighbor(kNN)techniquetoapplyinformationfromforestinventoryplotstoremotelysensedMODISimagery(250-mpixelsize)basedonthespectralcharacterizationofpixelsandadditionalgeospatialinformation(Wilsonetal.2012);or(3)coloreddotstorepresentplotattributesatapproximateplotlocations.GeographicbasedatawasprovidedbytheNationalAtlasoftheUnitedStates(U.S.GeologicalSurvey2012).Anyadditionaldatasourcesarereportedwiththerelevantmaps.
59
Literature Cited
Bechtold,W.A.;Patterson,P.L.,eds.2005.The enhanced forest inventory and analysis program - national sampling design and estimation procedures.Gen.Tech.Rep.SRS-80.Asheville,NC:U.S.DepartmentofAgriculture,ForestService,SouthernResearchStation.85p.
Bechtold,W.A.;Scott,C.T.2005.The forest inventory and analysis plot design.In:Bechtold,W.A.;Patterson,P.L.,eds.Theenhancedforestinventoryandanalysisprogram-nationalsamplingdesignandestimationprocedures.Gen.Tech.Rep.SRS-80.Asheville,NC:U.S.DepartmentofAgriculture,ForestService,SouthernResearchStation:37-52.
Belcher,D.M.;Holdaway,M.R.;Brand,G.J.1982.A description of STEMS – the stand and tree evaluation and modeling system.Gen.Tech.Rep.NC-79.St.Paul,MN:U.S.DepartmentofAgriculture,ForestService,NorthCentralForestExperimentStation.18p.
Bennett,J.P.;Jepsen,E.A.;Roth,J.A.2006.Field responses of Prunus serotina and Asclepias syriaca to ozone around southern Lake Michigan.EnvironmentalPollution.142(2):354-366.
Butler,B.J.2008.Family forest owners of the United States, 2006.Gen.Tech.Rep.NRS-27.NewtownSquare,PA:U.S.DepartmentofAgriculture,ForestService,NorthernResearchStation.73p.
Butler,B.J.;Leatherberry,E.C.;Williams,M.S.2005.Design, implementation, and analysis methods for the National Woodland Owner Survey.Gen.Tech.Rep.NE-336.NewtownSquare,PA:U.S.DepartmentofAgriculture,ForestService,NortheasternResearchStation.43p.
Cappaert,D.;McCullough,D.G.;Poland,T.M.;Siegert,N.W.2005.Emerald ash borer in North America: a research and regulatory challenge.AmericanEntomologist.51(3):152-165.
Cunningham,R.N.;Moser,H.C.1938.Forest areas and timber volumes in the Lake States.Econ.NotesNo.10.St.Paul,MN:U.S.DepartmentofAgriculture,ForestService,LakeStatesForestExperimentStation.84p.
Cunningham,R.N.;Moser,H.C.;White,H.G.1939.Timber supplies, growth and depletion in the three Lake States.Econ.NotesNo.11.St.Paul,MN:U.S.DepartmentofAgriculture,ForestService,LakeStatesForestExperimentStation.38p.
Curtis,J.R.1959.The vegetation of Wisconsin: an ordination of plant communities.Madison,WI:UniversityofWisconsinPress.657p.
DellaSala,D.A.;Staus,N.L.;Strittholt,J.R.;Hackman,A.;Iacobelli,A.2001.An updated protected areas database for the United States and Canada.NaturalAreasJournal.21(2):124-135.
Fan,Z.;Shifley,S.R.;Spetich,M.A.;Thompson,F.R.,III.;Larsen,D.R.2003.Distribution of cavity trees in midwestern old-growth and second-growth forests.CanadianJournalofForestResearch.33:1481-1494.
Hahn,J.T.1984.Tree volume and biomass equations for the Lake States.Res.Pap.NC-250.St.Paul,MN:U.S.DepartmentofAgriculture,ForestService,NorthCentralForestExperimentStation.10p.
Heath,L.S;Hansen,M.H.;Smith,J.E.;Smith,W.B.;Miles,P.D.2009.Investigation into calculating tree biomass and carbon in the FIADB using a biomass expansion factor approach.In:ForestInventoryandAnalysis(FIA)symposium2008;2008October21-23;ParkCity,UT.Proc.RMRS-P-56CD.FortCollins,CO:U.S.DepartmentofAgriculture,ForestService,RockyMountainResearchStation.26p.[CD-ROM]
60
Homer,C.;Dewitz,J.;Fry,J.;Coan,M.;Hossain,N.;Larson,C.;Herold,N.;McKerrow,A.;VanDriel,J.N.;Wickham,J.2007.Completion of the 2001 National Land Cover Database for the conterminous United States.PhotogrammetricEngineeringandRemoteSensing.73(4):337-341.
Huang,C.;Goward,S.N.;Masek,J.G.;Thomas,N.;Zhu,Z.;Vogelmann,J.E.2010.An automated approach for reconstructing recent forest disturbance history using dense Landsat time series stacks.RemoteSensingofEnvironment.114(1):183-198.
Huang,C.;Yang,L.;Wylie,B.;Homer,C.2001.A strategy for estimating tree canopy density using Landsat 7 ETM+ and high resolution images over large areas.In:Thirdinternationalconferenceongeospatialinformationinagricultureandforestry;2001November5-7;Denver,CO.AnnArbor,MI:ERIMInternational,Inc.[CD-ROM]
Hunter,W.C.;Buehler,D.A.;Canterbury,R.A.;Confer,J.L.;Hamel,P.B.2001.Conservation of disturbance-dependent birds in eastern North America.WildlifeSocietyBulletin.29(2):440-455.
Kotar,J.;Kovach,J.A.;Brand,G.J.1999.Analysis of the 1996 Wisconsin forest statistics by habitat type.Gen.Tech.Rep.NC-207.St.Paul,MN:U.S.DepartmentofAgriculture,ForestService,NorthCentralForestExperimentStation.165p.
McRoberts,R.E.1999.Joint annual forest inventory and monitoring system, the North Central perspective. JournalofForestry.97(12):27-31.
McRoberts,R.E.2005.The enhanced forest inventory and analysis program.In:Bechtold,W.A.;Patterson,P.L.,eds.Theenhancedforestinventoryandanalysisprogram-nationalsamplingdesignandestimationprocedures.Gen.Tech.Rep.SRS-80.Asheville,NC:U.S.DepartmentofAgriculture,ForestService,SouthernResearchStation:1-10.
Miles,P.D.;Smith,W.B.2009.Specific gravity and other properties of wood and bark for 156 tree species found in North America.Res.Pap.NRS-38.NewtownSquare,PA:U.S.DepartmentofAgriculture,ForestService,NorthernResearchStation.35p.
MontréalProcessWorkingGroup.1999.The Montréal Process.Tokyo,Japan:MinistryofAgriculture,ForestryandFisheries.Availableat:http://www.rinya.maff.go.jp/mpci/home_e.html(AccessedMay9,2012).
Nowak,D.J.;Greenfield,E.J.2010.Urban and community forests of the North Central East region: Illinois, Indiana, Michigan, Ohio, Wisconsin.Gen.Tech.Rep.NRS-54.NewtownSquare,PA:U.S.DepartmentofAgriculture,ForestService,NorthernResearchStation.54p.
Olson,C.;Cholewa,A.F.2009.A Guide to nonnative invasive plants inventoried in the north by Forest Inventory and Analysis.Gen.Tech.Rep.NRS-52.NewtownSquare,PA:U.S.DepartmentofAgriculture,ForestService,NorthernResearchStation.194p.
Perry,C.H.;Everson,V.A.;Brown,I.K.;Cummings-Carlson,J.;Dahir,S.E.;Jepsen,E.A.;Kovach,J.;Labissoniere,M.D.;Mace,T.R.;Padley,E.A.;Rideout,R.B.;Butler,B.J.;Crocker,S.J.;Liknes,G.C.;Morin,R.S.;Nelson,M.D.;Wilson,B.T.;Woodall,C.W.2007.Wisconsin’s forests, 2004.Resour.Bull.NRS-23.NewtownSquare,PA:U.S.DepartmentofAgriculture,ForestService,NorthernResearchStation.104p.
Poland,T.M.;McCullough,D.G.2006.Emerald ash borer: invasion of the urban forest and the threat to North America’s ash resource.JournalofForestry.104(3):118-124.
61
Raile,G.K.1982.Estimating stump volume.Res.Pap.NC-224.St.Paul,MN:U.S.DepartmentofAgriculture,ForestService,NorthCentralForestExperimentStation.4p.
Schmidt,T.L.1998.Wisconsin’s forest statistics, 1996.Resour.Bull.NC-183.St.Paul,MN:U.S.DepartmentofAgriculture,ForestService,NorthCentralForestExperimentStation.150p.
Smith,J.E.;Heath,L.S.;Skog,K.E.;Birdsey,R.A.2006.Methods for calculating forest ecosystem and harvested carbon with standard estimates for forest types of the United States.Gen.Tech.Rep.NE-343.NewtownSquare,PA:U.S.DepartmentofAgriculture,ForestService,NortheasternResearchStation.216p.
Smith,W.B.1991.Assessing removals for North Central forest inventories.Resour.Bull.NC-299.St.Paul,MN:U.S.DepartmentofAgriculture,ForestService,NorthCentralForestExperimentStation.48p.
Spencer,J.S.;Thorne,H.W.1972.Wisconsin’s 1968 timber resource: a perspective.Resour.Bull.NC-15.St.Paul,MN:U.S.DepartmentofAgriculture,ForestService,NorthCentralForestExperimentStation.80p.
Spencer,J.S.;Smith,W.B.;Hahn,J.T.;Raile,G.K.1988.Wisconsin’s fourth forest inventory, 1983.Resour.Bull.NC-107.St.Paul,MN:U.S.DepartmentofAgriculture,ForestService,NorthCentralForestExperimentStation.158p.
Stone,R.N.;Thorne,H.W.1961.Wisconsin’s forest resources.Stn.Pap.90.St.Paul,MN:U.S.DepartmentofAgriculture,ForestService,LakeStatesForestExperimentStation.52p.
Stueve,K.M.;Housman,I.W.;Zimmerman,P.L.;Nelson,M.D.;Webb,J.B.;Perry,C.H.;Chastain,R.A.;Gormanson,D.D.;Huang,C.;Healey,S.P.;Cohen,W.B.2011a.Snow-covered Landsat time series stacks improve automated disturbance mapping accuracy in forested landscapes.RemoteSensingofEnvironment.115(12):3203-3219.
Stueve,K.M.;Perry,C.H.;Nelson,M.D.;Healey,S.P.;Hill,A.D.;Moisen,G.G.;Cohen,W.B.;Gormanson,D.D.;Huang,C.2011b.Ecological importance of intermediate windstorms rivals large, infrequent disturbances in the northern Great Lakes.Ecosphere.2(1):article2:1-21.
Tyrrell,L.E.;Crow,T.R.1994.Dynamics of dead wood in old-growth hemlock–hardwood forests of northern Wisconsin and northern Michigan.CanadianJournalofForestResearch.24(8):1672-1683.
U.S.CensusBureau.1994.Geographic areas reference manual.Washington,DC:U.S.DepartmentofCommerce,BureauoftheCensus.Availableat:http://www.census.gov/geo/www/garm.html(AccessedMay9,2012).
U.S.DepartmentofAgriculture,ForestService.2007.Forest Inventory and Analysis field methods for phase 3 measurements, version 4.0.Washington,DC:U.S.DepartmentofAgricultureForestService.Availableat:http://fia.fs.fed.us/library/field-guides-methods-proc/(AccessedMay9,2012).
U.S.DepartmentofAgriculture,NaturalResourcesConservationService.2012.The PLANTS database.Greensboro,NC:NationalPlantDataTeam.Availableat:http://plants.usda.gov(AccessedMay6,2012).
U.S.GeologicalSurvey.2012.The national atlas of the United States.Reston,VA:U.S.DepartmentofInterior,GeologicalSurvey.Availableat:http://nationalatlas.gov/(AccessedMay6,2012).
Wilson,B.T.;Lister,A.J.;Riemann,R.I.2012.A nearest-neighbor imputation approach to mapping tree species over large areas using forest inventory plots and moderate resolution raster data.ForestEcologyandManagement.271:182-198.
WisconsinDepartmentofNaturalResources.2005.Wisconsin’s strategy for wildlife species of greatest conservation need.Madison,WI:WisconsinDepartmentofNaturalResources.Availableat:http://dnr.wi.gov/org/land/er/WWAP/Plan/index.htm(AccessedMay6,2012).
WisconsinDepartmentofNaturalResources.2010.Wisconsin forest products industry.Madison,WI:WisconsinDepartmentofNaturalResources.6p.Availableat:http://dnr.wi.gov/topic/ForestBusinesses/documents/WisconsinForestProductsIndustry.pdf(AccessedMay6,2012).
62
Perry, Charles H.; Everson, Vern A.; Butler, Brett J.; Crocker, Susan J.; Dahir, Sally E.;
Diss-Torrance, Andrea L.; Domke, Grant M; Gormanson, Dale D.; Herrick, Sarah K.;
Hubbard, Steven S.; Mace, Terry R.; Miles, Patrick D.; Nelson, Mark D.; Rodeout, Richard B.;
Saunders, Luke T.; Stueve, Kirk M.; Wilson, Barry T.; Woodall, Christopher W. 2012.
Wisconsin’s Forests 2009. Resour. Bull. NRS-67. Newtown Square, PA: U.S. Department
of Agriculture, Forest Service, Northern Research Station. 62 p. [Includes DVD].
The second full annual inventory of Wisconsin’s forests reports more than 16.7 million acres
of forest land with an average volume of more than 1,400 cubic feet per acre. Forest land
is dominated by the oak/hickory forest-type group, which occupies slightly more than one
quarter of the total forest land area; the maple/beech/birch forest-type group occupies an
additional 23 percent. Forty-two percent of forest land consists of large diameter stands,
23 percent contains medium diameter stands, and 8 percent contains small diameter
stands. The volume of growing stock on timberland has been rising since the 1980s and
currently totals more than 21.1 billion cubic feet. The average annual net growth of growing
stock on forest land from 2005 to 2009 is approximately 572 million cubic feet per year. This
report includes additional information on forest attributes, land use change, carbon, timber
products, forest health, and statistics and quality assurance of data collection.
KEY WORDS: inventory, forest statistics, forest land, volume, biomass, carbon, growth,
removals, mortality, and forest health
The U.S. Department of Agriculture (USDA) prohibits discrimination in all its programs and activities on the basis of race, color, national origin, gender, religion, age, disability, political beliefs, sexual orientation, and marital or family status. (Not all prohibited bases apply to all programs.) Persons with disabilities who require alternative means for communication of program information (Braille, large print, audiotape, etc.) should contact USDA’s TARGET Center at (202) 720-2600 (voice and TDD). To file a complaint of discrimination, write USDA, Director, Office of Civil Rights, Room 326-W, Whitten Building, 14th and Independence Avenue, SW, Washington, DC 20250-9410, or call (202) 720-5964 (voice or TDD). USDA is an equal opportunity provider and employer.
DVD Contents
Wisconsin’s Forests 2009 (PDF)
Wisconsin’s Forests: Statistics, Methods, and Quality Assurance (PDF)
Wisconsin Inventory Database (CSV file folder)
Wisconsin Inventory Database (Access file)
Field guides that describe inventory procedures (PDF)
Database User Guides (PDF)
Wisconsin’s Forests 2009Statistics, Methods,
and Quality Assurance
United States Department of Agriculture
Forest Service
Resource Bulletin NRS-67

http://www.nrs.fs.fed.us