Embed Size (px)
Citation preview

Wisconsin Legislative Fiscal Bureau
January, 2017
Wisconsin Technical
College System
Informational Paper 31


Wisconsin Technical College System
Prepared by
Christa Pugh
Wisconsin Legislative Fiscal Bureau
One East Main, Suite 301
Madison, WI 53703
http://legis.wisconsin.gov/lfb


TABLE OF CONTENTS
System Overview ........................................................................................................................................... 1
Wisconsin Technical College System (WTCS) Board Organization ...................................................... 1
District Board Organization ...................................................................................................................... 2
Programs and Enrollments ........................................................................................................................ 3
System Finance............................................................................................................................................... 5
Property Taxes ........................................................................................................................................... 6
State Aid .................................................................................................................................................. 10
Tuition Revenues .................................................................................................................................... 15
Tuition Remissions.................................................................................................................................. 15
Federal Aid .............................................................................................................................................. 17
Self-Financing Operations and Miscellaneous Revenue ....................................................................... 18
Appendix I State General Aid Formula ................................................................................................. 19
Appendix II Tuition and Other Fees ........................................................................................................ 22
Appendix III WTCS Districts .................................................................................................................. 24


1
Wisconsin Technical College System
The nation's first system of vocational, tech-
nical and adult education was established in Wis-
consin in 1911. The purpose of the system was to
provide part-time educational opportunities for
youth and adults who were not enrolled in either
secondary or post-secondary schools. The origi-
nal vocational systems were run by public school
systems or by separate, citywide technical school
districts. However, by 1965, a statewide system
had been developed which consisted of two inter-
acting components, the State Board of Vocation-
al, Technical and Adult Education and local vo-
cational college districts, which shared responsi-
bility for the system.
In 1994, the name of the system was changed
to the Wisconsin Technical College System un-
der the provisions of 1993 Act 399. The system is
divided into 16 districts, which are shown in Ap-
pendix III, and has 48 main and satellite campus-
es that serve over 326,000 people annually.
This paper is divided into two sections and
contains three appendices. The first section pro-
vides an overview of system organization, pro-
grams and enrollments. The second section de-
scribes how the system is financed. The appen-
dices provide additional information on the gen-
eral aid formula and the calculation of student
tuition.
System Overview
Governance of the Wisconsin Technical Col-
lege System (WTCS) is shared between the
WTCS Board and the individual district boards.
Each level has statutory responsibilities that are
interconnected in many ways. The WTCS Board
is responsible for planning and coordinating the
system's programs and activities. The district
boards are responsible for local planning, budget-
ing, curriculum and course development, and
program implementation. Many district activities
are performed in consultation with the WTCS
Board or require Board approval to ensure con-
sistency statewide.
WTCS Board Organization
The WTCS Board consists of 13 members:
(a) an employer; (b) an employee; (c) one farmer;
(d) the State Superintendent of Public Instruction
or a designee; (e) the Secretary of Workforce
Development, or a designee; (f) the President of
the University of Wisconsin Board of Regents, or
a designee from among the Regents; (g) six pub-
lic members; and (h) one student. The employer,
employee, farmer, and public members are ap-
pointed by the Governor for staggered, six-year
terms. The student member is appointed by the
Governor for a two-year term.
An administrative staff of 55 full-time equiva-
lent positions is authorized for the Board. The
staff is headed by a State Director (commonly
known as the System President) who is appointed
by the Board. There are two division administra-
tor positions and an executive assistant.
The Board's major statutory responsibilities
are to:
• Hire a System President and staff.
• Initiate, develop, maintain, and supervise
programs with specific occupational orientations
below the baccalaureate level.
• Determine the organization, plan, scope,
and development of technical colleges.

2
• Review and approve district proposals to
develop or eliminate programs and courses of
study offered by districts.
• Distribute state aid to districts and audit
district financial and enrollment data required for
aid calculations.
• Review and approve district grant appli-
cations and facility proposals.
• Establish uniform program fees (tuition)
and materials fees for students.
• Certify district educational personnel.
• Coordinate with the Department of Pub-
lic Instruction in assisting local school boards in
the establishment of technical preparation pro-
grams in each public high school.
• Establish general policies and procedures
regarding travel and expenses, procurement, per-
sonnel, and service contracts for the district
boards.
District Board Organization
Each WTCS district is governed by a nine-
member board which, with the exception of the
board of the Milwaukee Area Technical College,
must include two employers, two employees,
three public members, a school district adminis-
trator, and an elected official who holds state or
local office. No two members may be officials of
the same unit of government, nor may any mem-
ber be on the school board that employs the
school district administrator member of the
board. Of the three public members, no more
than two may be employers and no more than
two may be employees, no more than three may
be school district administrators, and no more
than three may be elected officials. Board mem-
bers serve staggered three-year terms.
For the Milwaukee district board, under 2011
Act 286, seven of the nine members must be res-
idents of Milwaukee County. Five members must
represent employers, three of whom must repre-
sent employers with 15 or more employees, and
two of whom must represent employers with 100
or more employees. In addition, of the five mem-
bers representing employers, at least two mem-
bers must represent employers who are manufac-
turing businesses. Under 2015 Act 55, a person
representing an employer is required to have at
least two years of experience managing a busi-
ness entity, nonprofit organization, credit union,
or cooperative association with at least 15 em-
ployees or at least two years of experience man-
aging the finances or hiring of personnel of a
business entity, nonprofit organization, credit un-
ion, or cooperative association with at least 100
employees. Finally, the Milwaukee board must
include one school district administrator, one
state or local elected official, and two additional
members.
Appointments to the district boards are made
by local committees that consist of county board
chairs in 13 districts and school board presidents
in two (Southwest and Fox Valley). In general,
whether the committee consists of the county
board chairs or school board presidents is deter-
mined by which body originally initiated the
formation of the district. The exception is that for
Milwaukee, under 2011 Act 286, the appointment
committee consists of the Milwaukee county ex-
ecutive and the chairpersons of the Milwaukee,
Ozaukee, and Washington county boards. Prior to
Act 286, the district's school board presidents
composed the Milwaukee appointment commit-
tee. The appointment committee must develop a
plan of representation for board membership that
gives equal consideration to the general popula-
tion distribution and to the distribution of minori-
ties and women within the district. In addition,
the plan for Milwaukee must give equal consid-
eration to the distribution of minorities within the
City of Milwaukee.
After the plan of representation is developed,
the appointment committee may accept names for
board appointment from district residents. The

3
committee must hold a public hearing to discuss
the appointment of a new board member. The
district board representation plan and board ap-
pointments are also reviewed by the WTCS
Board. If the appointment committee cannot,
within 30 days of its first meeting, develop a rep-
resentation plan and appoint a district board, the
WTCS Board is required to do both.
The major statutory duties of district boards
are to:
• Hire a district president, staff, and teach-
ers.
• Develop or eliminate programs and
courses, with WTCS Board approval.
• Develop an annual budget and set a
property tax levy within statutory limits.
• Seek and obtain federal and foundation
grants.
• Provide educational programming, finan-
cial aid, guidance, and job placement services.
• Enter into contracts to provide educa-
tional or fiscal and management services.
• Develop a capital building program, sub-
ject to certain statutory restrictions.
Programs and Enrollments
Current law identifies the principal purposes
of the WTCS as providing: (a) occupational edu-
cation and training/retraining programs; and (b)
customized training and technical assistance to
business and industry. The additional purposes of
the system are to provide: (a) courses to high
school students through contracts with secondary
schools; (b) a collegiate transfer program; (c)
community services and avocational or self-
enrichment courses; (d) basic skills education;
and (e) education and services to minorities,
women, and handicapped or disadvantaged indi-
viduals.
The types of educational programs through
which the system fulfills its purposes are classi-
fied as follows:
Post-Secondary. Full-time programs that are
comprised of:
Collegiate Transfer. A two-year program in
which the liberal arts credits earned by students
may be transferred to a four-year university and
applied towards a baccalaureate degree. In 2015-
16, five districts offered such a program (Chip-
pewa Valley, Madison, Milwaukee, Nicolet and
Western), and state law limits the program's size
to no more than 25% of the total credit hours of-
fered by the district.
Associate Degree. A two-year, post-high
school program with specific course requirements
established by the WTCS Board.
Technical Diploma. A one- or two-year pro-
gram with specific course requirements estab-
lished by the WTCS Board.
Registered Apprenticeships. A combination of
from two to five years of on-the-job training and
classroom-related instruction.
Continuing Education. Part-time programs
that are comprised of vocational-adult, basic
skills education, and district/community services,
which include avocational or hobby courses and
activities offered with community groups.
Table 1 shows the number of full-time equiva-
lent (FTE) students enrolled in the WTCS in the
2015-16 academic year by program classifica-
tion. The distribution of FTE students between
program classifications varies, reflecting differ-
ences in program emphasis at each district. The
proportion of a district's FTE students in post-
secondary programs varies from a low of 82.0%
(Nicolet) to a high of 94.2% (Mid-State); the
statewide average is 89.0%. Of the total FTE stu-

4
dents enrolled in continuing education courses,
5,020 (66.5%) took courses primarily related to
basic skills education and courses for hearing or
visually impaired individuals. A total of 2,309
FTE students (30.6%) were enrolled in vocation-
al-adult courses while 224 FTE students (3.0%)
were enrolled in district/community service
courses. The actual number of individuals en-
rolled in continuing education programs is signif-
icantly higher than the FTE count would suggest
since each FTE student represents approximately
1,200 hours of instruction.
Full-time equivalency is used in the WTCS
because headcount enrollments in post-secondary
educational systems do not provide an accurate
reflection of the number of credit hours taken.
This is especially true in technical colleges due to
the large number of part-time students and short
course offerings. The WTCS computes FTEs on
the basis of a uniform 30 credits per year in all
programs.
Table 2 compares 2015-16 headcount enroll-
ments to FTE students for each district. The
number of students that equal one FTE varies
among districts (from 3.3 to 8.7), with a
statewide average of 4.8.
Table 1: Full-Time Equivalent (FTE) Students 2015-16 Academic Year
Continuing Post-Secondary Education Total % of % of % of Collegiate Associate Technical District District State District Transfer Degree Diploma Subtotal Total FTEs Total FTEs Total
Blackhawk 0 1,382 280 1,661 91.0% 165 9.0% 1,826 2.7% Chippewa Valley 333 2,702 624 3,659 92.5 297 7.5 3,956 5.8 Fox Valley 0 5,212 685 5,897 86.7 907 13.3 6,803 10.0 Gateway 0 4,110 455 4,565 89.8 518 10.2 5,083 7.4 Lakeshore 0 1,428 257 1,685 86.1 272 13.9 1,956 2.9 Madison Area 3,586 4,804 837 9,226 92.0 806 8.0 10,033 14.7 Mid-State 0 1,653 233 1,886 94.2 117 5.8 2,002 2.9 Milwaukee Area 2,617 5,848 888 9,353 86.2 1,496 13.8 10,849 15.9 Moraine Park 0 2,214 492 2,706 86.7 416 13.3 3,123 4.6 Nicolet Area 207 453 58 719 82.0 158 18.0 877 1.3 Northcentral 0 2,868 253 3,122 84.3 583 15.7 3,704 5.4 Northeast WI 0 5,283 863 6,147 91.3 584 8.7 6,731 9.8 Southwest WI 0 1,001 318 1,319 83.7 257 16.3 1,576 2.3 Waukesha Co. 0 3,289 512 3,801 90.7 389 9.3 4,190 6.1 Western 287 2,352 439 3,078 91.8 275 8.2 3,353 4.9 WI Indianhead 0 1,426 568 1,994 86.3 315 13.7 2,309 3.4
Total 7,030 46,024 7,763 60,817 89.0% 7,554 11.0% 68,371 100.0%
Table 2: Headcount as Compared to FTE Enrollment 2015-16 Academic Year
Headcount District Headcount FTEs Per FTE
Blackhawk 7,437 1,826 4.1 Chippewa Valley 16,336 3,956 4.1 Fox Valley 48,944 6,803 7.2 Gateway 19,998 5,083 3.9 Lakeshore 12,447 1,956 6.4 Madison Area 37,351 10,033 3.7 Mid-State 7,367 2,002 3.7 Milwaukee Area 35,627 10,849 3.3 Moraine Park 18,553 3,123 5.9 Nicolet Area 6,125 877 7.0 Northcentral 19,635 3,704 5.3 Northeast WI 33,472 6,731 5.0 Southwest WI 8,544 1,576 5.4 Waukesha Co. 22,742 4,190 5.4 Western 11,379 3,353 3.4 WI Indianhead 20,196 2,309 8.7 Total 326,153 68,371 4.8

5
Table 3 shows statewide FTE enrollments for
2006-07 through 2015-16. Since 2006-07, FTE
enrollment in the system has decreased by 919
FTEs or 1.3%, after rising 12.0% in 2009-10 in
the midst of a severe economic recession, fol-
lowed by five years of declines since 2010-11. In
general, FTE enrollments tend to vary inversely
with state and local economic conditions. During
periods of economic decline, individuals tend to
seek retraining; in periods of economic growth,
enrollments decline as individuals enter the job
market. Enrollment patterns in each district are
less predictable.
Table 3: Statewide FTE Enrollment 2006-07 to 2015-16 FTEs % Change
2006-07 69,290 --- 2007-08 70,587 1.9% 2008-09 73,969 4.8 2009-10 82,842 12.0 2010-11 83,921 1.3 2011-12 80,068 -4.6 2012-13 77,679 -3.0 2013-14 74,480 -4.1 2014-15 71,358 -4.2 2015-16 68,371 -4.2
System Finance
WTCS districts receive funding from five ma-
jor sources: (1) property taxes; (2) state aid, ex-
cluding funds transferred from other state agen-
cies; (3) tuition and fees; (4) federal aid; and (5)
self-financing operations and miscellaneous rev-
enues. Table 4 shows WTCS revenues by source
for 2015-16. Table 5 provides a breakdown of
revenue sources from 2006-07 through 2015-16.
Each of these sources is detailed in the following
sections.
Table 4: WTCS District Revenues -- 2015-16 ($ in Millions)
Amount % of Total Property Taxes $416.7 26.9% State Aid 513.8 33.1 Tuition and Fees 264.6 17.1 Federal Aid 61.5 4.0 Self-Financing/ Miscellaneous 293.9 18.9 Total $1,550.5 100.0% Note: Excludes revenues from increases or decreases in fund balance and proceeds from debt.
Table 5: WTCS District Revenues 2006-07 through 2015-16 ($ in Millions)
Property Taxes State Aid* Tuition & Fees Federal** Other*** Total
Percent Percent Percent Percent Percent Percent
Year Amount Change Amount Change Amount Change Amount Change Amount Change Amount Change 2006-07 $650.6 4.6% $135.5 -0.3% $182.4 7.6% $54.7 6.8% $266.6 15.8% $1,289.8 6.7% 2007-08 680.6 4.6 136.7 0.9 194.4 6.6 49.3 -9.9 269.6 1.1 1,330.6 3.2 2008-09 714.6 5.0 135.2 -1.1 217.8 12.0 49.1 -0.4 272.6 1.1 1,389.3 4.4 2009-10 742.6 3.9 137.0 1.3 259.0 18.9 58.0 18.1 275.9 1.2 1,472.5 6.0 2010-11 757.3 2.0 137.0 0.0 276.1 6.6 54.6 -5.9 282.2 2.3 1,507.2 2.4 2011-12 771.3 1.8 101.2 -26.1 279.0 1.1 48.0 -12.1 287.2 1.8 1,486.7 -1.4 2012-13 786.8 2.0 101.4 0.2 280.2 0.4 51.8 7.9 301.5 5.0 1,521.8 2.4 2013-14 796.7 1.3 102.9 1.5 281.3 0.4 55.2 6.6 297.5 -1.3 1,533.6 0.8 2014-15 407.1 -48.9 508.9 394.6 273.8 -2.7 59.2 7.2 316.8 6.5 1,565.8 2.1 2015-16 416.7 2.4 513.8 1.0 264.6 -3.4 61.5 3.9 293.9 -7.2 1,550.5 -1.0
*Includes general and categorical aids only; excludes aids to individuals and organizations, and funds received from other state agencies.
**Only shows federal aid not distributed as student financial aid.
***Self-financing operations, aids to individuals and organizations, funds from other state agencies, and miscellaneous revenues.

6
The expenditures supported by WTCS reve-
nues can be expressed in a variety of ways but
are most commonly divided into operational and
nonoperational costs. Operational costs are those
attributable to providing educational services re-
gardless of funding source. These costs include
instruction, instructional resources, student ser-
vices, physical plant, and general/administrative
costs. Nonoperational costs are other costs to the
districts such as debt service. A breakdown of
these costs for 2015-16 is shown in Table 6. The
difference between total system costs ($1,531.9
million) and total revenues ($1,550.5 million) in
2015-16 will result in revenues being carried over
as fund balances, which will be available for ex-
penditure in the current year.
Table 6 : WTCS District Costs – 2015-16 ($ in Millions) % of Amount Total
Operational Costs Instruction $695.6 45.4% Instructional Resources 24.7 1.6 Student Services 116.4 7.6 General/Administrative 145.2 9.5 Physical Plant 86.9 5.7
Nonoperational Costs* Debt Service 207.9 13.6 Other** 255.2 16.7
Total $1,531.9 100.0% *Excludes capital outlay. **Includes auxiliary operations.
Property Taxes
In 2015-16, property taxes accounted for
26.9% of technical college system revenues. Pri-
or to 2014-15, the property tax was the largest
source of revenue for the Technical College Sys-
tem. Between 2004-05 and 2013-14, the property
tax represented between 50.4% and 52.0% of to-
tal system revenues. Following the implementa-
tion of 2013 Act 145, which provided $406 mil-
lion annually for property tax relief aid associated
with the WTCS levy, the percentage of revenues
funded by property taxes decreased.
For much of the System's history, beginning
with the System's creation in 1911, districts were
restricted in how much property tax they could
levy by a mill rate. Beginning in the mid-1970s,
state law limited property taxes levied by each
WTCS district for all purposes except debt ser-
vice to $1.50 per $1,000 (or 1.5 mills) of the dis-
trict's equalized property valuation, which was
referred to as the operational mill rate. Under
2011 Act 32, a district board's tax levy in 2011
and 2012 could not exceed the greater of the fol-
lowing: (a) the district board's tax levy in 2010;
or (b) the amount generated using the mill rate
used for the tax levy in 2010. Each district's mill
rate was also prohibited from exceeding 1.5 mills
in those years.
Under 2013 Act 20, the 1.5 mill rate limit was
repealed and replaced with a levy limit that pro-
hibited any district from increasing its operation-
al levy in 2013 or any year thereafter by a per-
centage greater than the district's valuation factor.
The valuation factor is defined by law as a per-
centage equal to the greater of either zero percent
or the percentage change in the district's January
1 equalized value resulting from the aggregate
new construction in the district, less improve-
ments removed, between the previous year and
the current year, as determined by the Depart-
ment of Revenue (DOR).
Under 2013 Act 145, the Act 20 levy limit
was replaced with a revenue limit. Beginning in
the 2014-15 school year, each district is prohibit-
ed from increasing its revenue in any year by a
percentage greater than the district's valuation
factor. For purposes of this revenue limit, reve-
nue is defined as the sum of the tax levy and state
property tax relief aid. State general and categor-
ical aids are not counted towards the revenue lim-
it. The limit also excludes taxes levied for the
purpose of paying principal and interest on valid
bonds and notes, other than noncapital notes.
If a district's allowable revenue is greater than
its actual revenue in any year, that district's reve-

7
nue limit in the following school year may in-
crease by the difference between the prior year's
actual and allowable revenue, up to a maximum
increase of 0.5% of the actual revenue in that
year if approved by the district board in a three-
fourths vote. Exemptions are also provided for
refunded or rescinded property taxes, if those
taxes resulted in a redetermination of the district's
equalized valuation by DOR.
Table 7 shows the previous year's operating
levy and valuation factor used to calculate the
revenue limit for each district in 2016-17. Al-
lowed revenue for each district equals the 2015-
16 operating levy increased by a percentage equal
to the district's valuation factor. Revenue subject
to the revenue limit includes the district's operat-
ing tax levy and the state property tax relief aid
passed under 2013 Act 145, equal to a total of
$406 million annually.
If a district board wishes to exceed the reve-
nue limit, the board is required to submit a pro-
posed excess levy for a referendum. A referen-
dum by Blackhawk Technical College to exceed
its revenue limit, the first operational referendum
to be requested by a technical college, was reject-
ed by voters in August, 2014. If a district's board
exceeds its revenue limit without requesting a
referendum, the WTCS Board is required to re-
duce state general aid payments by an amount
equal to the amount of the excess revenue, ensur-
ing that the amount of excess revenue is not in-
cluded in determining the revenue limit for the
following year and continuing to subtract excess
revenue from state aid payments in future years if
necessary, except under certain circumstances
related to clerical errors.
There is no statutory limitation for taxes lev-
ied for debt service costs. However, a district's
bonded indebtedness may not exceed 2% of its
equalized property valuation. In addition, build-
ing projects costing more than $1,500,000, ex-
cluding remodeling or improvement projects and
any expenditures financed with gifts, grants or
federal funds, are subject to a mandatory referen-
dum. A referendum is also required if a district
proposes to borrow in excess of $1,500,000 for
remodeling or improvement projects. Finally, dis-
trict boards are prohibited from spending more
than $1,000,000 in reserve funds, consisting of
property tax revenues and investment earnings on
those revenues, to finance capital projects in ex-
cess of $1,500,000. Between 1990 and the fall of
2016, 15 debt levy referendums were approved
by voters and five referendums were denied.
Under 2011 Act 32, the referendum require-
ment for capital expenditures over $1.5 million
does not apply to the portion of a capital expendi-
ture funded with student housing payments for
the purchase, construction, or lease/purchase of a
student residence facility, if the district board us-
es no revenue derived from its tax levy, state aid,
or tuition for the acquisition of the facility. This
provision first applied to district board resolu-
tions adopted on the general effective date of the
bill (July 1, 2011). In addition, under 2013 Act
20, the referendum requirement does not apply to
capital expenditures of up to $2,500,000 if the
district board receives an equal amount of federal
funds for the project.

Table 7: Total Allowed and Actual Revenue By District - 2016-17
2015-16 2016-17
Actual Revenue Total
Actual Revenue Over/Under Over/Under
Allowed Actual Carryover Valuation Allowed Operating Property Allowed With
Levy Levy to 2016-17 Factor Revenue Levy Tax Relief Total Revenue Carryover
Blackhawk $16,279,000 $16,279,000 $0 0.01266 $16,485,100 $6,687,800 $9,797,300 $16,485,100 $0 $0
Chippewa Valley 30,815,900 30,815,900 0 0.01778 31,363,900 13,041,600 18,322,300 31,363,900 0 0
Fox Valley 50,402,400 50,402,400 0 0.01659 51,238,800 22,119,300 29,119,500 51,238,800 0 0
Gateway 52,611,700 52,611,700 0 0.01168 53,226,000 20,522,300 32,703,700 53,226,000 0 0
Lakeshore 18,123,400 18,123,400 0 0.01192 18,339,500 6,461,600 11,877,900 18,339,500 0 0
Madison Area 97,439,000 97,439,000 0 0.02047 99,433,800 38,539,600 60,894,200 99,433,800 0 0
Mid-State 16,870,900 16,870,900 0 0.01210 17,075,100 6,420,400 10,654,700 17,075,100 0 0
Milwaukee Area 105,599,700 105,599,700 0 0.01389 107,066,500 46,650,700 60,415,800 107,066,500 0 0
Moraine Park 30,985,300 30,985,300 0 0.01126 31,334,200 10,620,500 20,713,700 31,334,200 0 0
Nicolet Area 18,406,100 18,406,100 0 0.00617 18,519,700 3,738,100 14,781,600 18,519,700 0 0
Northcentral 22,919,000 22,919,000 0 0.01204 23,194,900 9,965,500 13,229,400 23,194,900 0 0
Northeast WI 45,112,900 45,111,800 1,100 0.01153 45,631,700 14,078,000 31,553,700 45,631,700 0 -1,100
Southwest WI* 11,255,900 11,255,900 0 0.01363 11,492,100 4,963,900 6,528,200 11,492,100 0 0
Waukesha Co. 54,202,800 53,638,300 268,200** 0.01628 54,511,200 10,418,900 43,219,300 53,638,200 - 873,000 -1,141,200
Western*** 26,003,400 26,003,400 0 0.01594 26,462,700 11,276,500 15,186,200 26,462,700 0 0
WI Indianhead 32,153,800 32,153,800 0 0.00899 32,442,900 5,440,500 27,002,400 32,442,900 0 0
*2016-17 allowed revenue includes $82,800 allowable levy increase due to rescinded taxes.
**Carryover of underlevy cannot exceed 0.5% of actual levy.
***2016-17 allowed revenue includes $44,800 allowable levy increase due to refunds due to contested assessments.
9
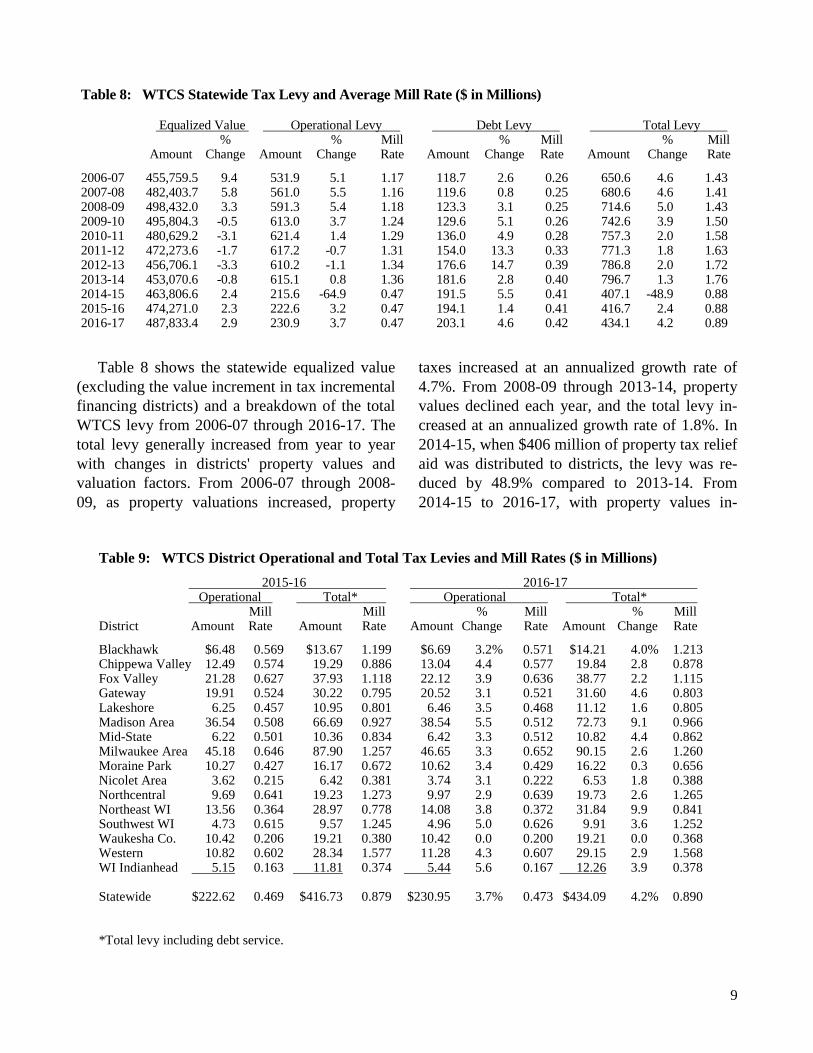
Table 8 shows the statewide equalized value
(excluding the value increment in tax incremental
financing districts) and a breakdown of the total
WTCS levy from 2006-07 through 2016-17. The
total levy generally increased from year to year
with changes in districts' property values and
valuation factors. From 2006-07 through 2008-
09, as property valuations increased, property
taxes increased at an annualized growth rate of
4.7%. From 2008-09 through 2013-14, property
values declined each year, and the total levy in-
creased at an annualized growth rate of 1.8%. In
2014-15, when $406 million of property tax relief
aid was distributed to districts, the levy was re-
duced by 48.9% compared to 2013-14. From
2014-15 to 2016-17, with property values in-
Table 8: WTCS Statewide Tax Levy and Average Mill Rate ($ in Millions) Equalized Value Operational Levy Debt Levy Total Levy % % Mill % Mill % Mill Amount Change Amount Change Rate Amount Change Rate Amount Change Rate
2006-07 455,759.5 9.4 531.9 5.1 1.17 118.7 2.6 0.26 650.6 4.6 1.43 2007-08 482,403.7 5.8 561.0 5.5 1.16 119.6 0.8 0.25 680.6 4.6 1.41 2008-09 498,432.0 3.3 591.3 5.4 1.18 123.3 3.1 0.25 714.6 5.0 1.43 2009-10 495,804.3 -0.5 613.0 3.7 1.24 129.6 5.1 0.26 742.6 3.9 1.50 2010-11 480,629.2 -3.1 621.4 1.4 1.29 136.0 4.9 0.28 757.3 2.0 1.58 2011-12 472,273.6 -1.7 617.2 -0.7 1.31 154.0 13.3 0.33 771.3 1.8 1.63 2012-13 456,706.1 -3.3 610.2 -1.1 1.34 176.6 14.7 0.39 786.8 2.0 1.72 2013-14 453,070.6 -0.8 615.1 0.8 1.36 181.6 2.8 0.40 796.7 1.3 1.76 2014-15 463,806.6 2.4 215.6 -64.9 0.47 191.5 5.5 0.41 407.1 -48.9 0.88 2015-16 474,271.0 2.3 222.6 3.2 0.47 194.1 1.4 0.41 416.7 2.4 0.88 2016-17 487,833.4 2.9 230.9 3.7 0.47 203.1 4.6 0.42 434.1 4.2 0.89
Table 9: WTCS District Operational and Total Tax Levies and Mill Rates ($ in Millions)
2015-16 2016-17 Operational Total* Operational Total* Mill Mill % Mill % Mill District Amount Rate Amount Rate Amount Change Rate Amount Change Rate
Blackhawk $6.48 0.569 $13.67 1.199 $6.69 3.2% 0.571 $14.21 4.0% 1.213 Chippewa Valley 12.49 0.574 19.29 0.886 13.04 4.4 0.577 19.84 2.8 0.878 Fox Valley 21.28 0.627 37.93 1.118 22.12 3.9 0.636 38.77 2.2 1.115 Gateway 19.91 0.524 30.22 0.795 20.52 3.1 0.521 31.60 4.6 0.803 Lakeshore 6.25 0.457 10.95 0.801 6.46 3.5 0.468 11.12 1.6 0.805 Madison Area 36.54 0.508 66.69 0.927 38.54 5.5 0.512 72.73 9.1 0.966 Mid-State 6.22 0.501 10.36 0.834 6.42 3.3 0.512 10.82 4.4 0.862 Milwaukee Area 45.18 0.646 87.90 1.257 46.65 3.3 0.652 90.15 2.6 1.260 Moraine Park 10.27 0.427 16.17 0.672 10.62 3.4 0.429 16.22 0.3 0.656 Nicolet Area 3.62 0.215 6.42 0.381 3.74 3.1 0.222 6.53 1.8 0.388 Northcentral 9.69 0.641 19.23 1.273 9.97 2.9 0.639 19.73 2.6 1.265 Northeast WI 13.56 0.364 28.97 0.778 14.08 3.8 0.372 31.84 9.9 0.841 Southwest WI 4.73 0.615 9.57 1.245 4.96 5.0 0.626 9.91 3.6 1.252 Waukesha Co. 10.42 0.206 19.21 0.380 10.42 0.0 0.200 19.21 0.0 0.368 Western 10.82 0.602 28.34 1.577 11.28 4.3 0.607 29.15 2.9 1.568 WI Indianhead 5.15 0.163 11.81 0.374 5.44 5.6 0.167 12.26 3.9 0.378 Statewide $222.62 0.469 $416.73 0.879 $230.95 3.7% 0.473 $434.09 4.2% 0.890 *Total levy including debt service.

10
creasing in each year and state property tax re-
lief aid unchanged at $406 million, the levy in-
creased at an annualized growth rate of 3.3%.
Table 9 indicates each district's operational
and total tax levy and mill rate for 2015-16 and
2016-17. The percent change in each district's
2016-17 levy from the 2015-16 amount is also
shown.
State Aid
Prior to 2014-15, state aid was provided to
WTCS districts either in the form of unrestrict-
ed general aid or through categorical aids which
were used to support specific programs or ser-
vices. Between 2004-05 and 2013-14, state aid
declined from 11.8% to 6.7% of total system rev-
enue.
Under 2013 Act 20, a number of changes
were made to state aid for technical college dis-
tricts. State general aid was increased and a new
formula was created under which a percentage of
general state aid is allocated to technical colleges
based on each college's performance on criteria
established by the WTCS Board. Act 20 also
changed the process by which state categorical
aids for WTCS are distributed. Prior to the
change, each biennial budget contained appropri-
ations for each of 14 different categorical aid
programs. Starting in the fiscal year 2014-15, all
existing categorical aid appropriations were con-
solidated into one appropriation, distributed by
the WTCS Board. The Board determines how to
distribute these funds to the districts, and is re-
quired to submit an annual report to DOA, the
Joint Committee on Finance, and the appropriate
standing committees of the Legislature describing
how the funds are distributed in each fiscal year.
Additionally, 2013 Act 145 further increased
the amount of state aid funding distributed to
WTCS by appropriating $406 million annually
for property tax relief aid associated with the
WTCS levy. This aid was distributed for the first
time in 2014-15. With the inclusion of property
tax relief aid, state aid equaled 33.1% of total
system revenue in 2015-16.
A breakdown of budgeted state aid for 2015-
16 and 2016-17 is shown in Table 10.
1. Property Tax Relief Aid. Of the $1.04
billion in total direct state aid provided to WTCS
districts in the 2015-17 biennium, $812 million
(or 78.4%) is designated as property tax relief
aid. This aid is distributed to the districts on the
third Friday in February. The percent of the funds
received by each district is determined using the
ratio of the individual district's equalized value to
the equalized value of all districts as of January
1, 2014. Property tax relief aid is counted under
each district's revenue limit, and therefore each
district's property tax relief aid reduces its opera-
tional levy by an equal amount.
2. General Aid. In the 2015-17 biennium,
$177.1 million is distributed as general, unre-
stricted aids to partially equalize the fiscal ca-
pacities of the 16 WTCS districts. The majority
of general aid (70% of 2016-17 general aid, or
$62.0 million) is distributed using a formula
through which districts with less property valua-
tion behind each student receive a higher per-
centage of their aidable costs because they are
Table 10: State Aid to WTCS Districts
2015-16 2016-17
State Aid Program* Budgeted Budgeted
Property Tax Relief Aid $406,000,000 $406,000,000
General Aids 88,534,900 88,534,900
Grants to District Boards 21,874,200 21,874,200
Fire Schools (PR) 600,000 600,000
Veteran Grant Jobs Pilot
Program (SEG) 0 500,000
Grants to Meet Emergency
Financial Need 0 320,000
Truck Driver Training (PR) 150,000 150,000
$517,159,100 $517,979,100
*Unless indicated, state aid programs are funded through general
purpose revenues (GPR).

11
less able to generate as much property tax reve-
nue at a given mill rate than districts with high
property valuations. In addition to partially equal-
izing the revenue available for district programs,
general aid is also provided as a form of property
tax relief. Appendix I provides further infor-
mation on the general aid formula, including a
description of the major components of the for-
mula, a sample aid calculation, an explanation of
variations in general aid support among districts,
and a discussion of the tax-base equalization goal
of the formula.
In 2016-17, the remaining 30% of general aid
(or $26.5 million) is distributed based on each
district's performance on performance criteria
described in state law. Under 2013 Act 20, in
2014-15, 10% of state general aid was deter-
mined by performance, and that percentage in-
creased to 20% in 2015-16 and 30% in 2016-17.
No funding would be allocated using the perfor-
mance criteria after the 2016-17 fiscal year.
The performance measures include: (a) the
placement rate of students in jobs related to stu-
dents' programs of study; (b) the number of de-
grees and certificates awarded in high-demand
fields, as determined by the Board and the De-
partment of Workforce Development; (c) the
number of programs or courses with industry-
validated curriculum; (d) the transition of adult
students from basic education to skills training;
(e) the number of adult students served by basic
education courses, adult high school or English
language learning courses, or courses that com-
bine basic skills and occupational training as a
means of expediting basic skills remediation, and
the success rate of adult students completing
these courses; (f) participation in dual enrollment
programs; (g) the workforce training provided to
businesses and individuals; (h) participation in
statewide or regional collaboration or efficiency
initiatives; (i) training or other services provided
to special populations or demographic groups
that can be considered unique to the district; and
(j) the development and implementation of a pol-
icy to award course credit for relevant education-
al experience or training not obtained at an insti-
tution of higher education, including skills train-
ing received during military service. This last cri-
terion was created in 2015 Act 55 and will first
apply to aid distributed in 2016-17.
Performance funding in each fiscal year is de-
termined by the district's performance in the three
previous fiscal years on seven of the ten perfor-
mance criteria, to be selected by the district prior
to the calculation of aid for each fiscal year. The
State Board is responsible for designing a system
to allocate the funds. The Board approved a plan
for performance spending in March, 2014, and
submitted a statutorily required report to the Joint
Committee on Finance in April, 2014, defining
the criteria for each performance measure and the
formulas that will be used to allocate funding
based on performance. The Board files annual
reports with the Committee on this aid.
Table 11 shows total general aid to WTCS
districts from 2006-07 through 2016-17. Aidable
costs represent expenditures, including debt
service, associated with providing postsecondary,
vocational-adult, and collegiate transfer programs
that are funded by property tax and state general
aid revenues. As the table indicates, the
percentage that general aid represents of aidable
cost has declined by 6.5 percentage points since
2006-07 (from 16.3% to the current estimate of
9.8%) and has declined in all but two of the last
10 years. However, the increase in aidable costs
has exceeded the rate of inflation (as measured
by the Consumer Price Index) in seven of those
10 years.
3. Grants to District Boards. Beginning in
2014-15, the System Board has the authority to
distribute $21.9 million annually in categorical
aid funding according to guidelines developed by
the Board. Table 12 lists the grant categories and
the funding designated by the Board for each in
2015-16. The table includes carryover funds from
the prior year.

12
Table 12: Grants to District Boards -- 2015-16
Grant Category Amount
Core Industry $5,384,500
Career Pathways 4,238,900
Workforce Advancement Training 3,895,400
Student Support 3,274,800
Systemwide Leadership 3,427,000
Developing Markets 1,490,700
Professional Development 1,000,000
Apprenticeship-Related Instruction 602,400
Total $23,313,700
Core Industry. This grant category is designed
to support training in core industry areas. Grant
funds may be used to purchase technology and
equipment or instructional materials, provide
training and professional development to instruc-
tors, and support curriculum adaption and in-
struction. In 2015-16, the Board awarded $5.4
million for core industry grants to technical col-
lege districts. With these funds, 22 grants were
awarded to 12 technical college districts.
Career Pathways. Career pathways are strate-
gies for earning the credentials necessary to ob-
tain employment within an occupational industry
and to advance to higher levels of employment in
that industry. Grants in this category may be used
for instruction, supportive and planning services,
professional development, the establishment of
dual credit agreements, and other activities that
support students' transitions into the workforce
and on to higher positions. Grants require match-
ing funds of 25% of the total project cost from
districts. In 2015-16, the Board awarded $4.2
million for career pathways grants. Nineteen
grants were awarded to 14 districts.
Workforce Advancement Training. These
funds support training for employees of estab-
lished businesses operating in Wisconsin, as well
as regional workforce and economic development
efforts. Training under these grants must focus
primarily on occupational skills, but can include
a combination of occupational, academic, or em-
ployability skills. Grants may be used to assess
the training needs of employees, develop curricu-
lum, provide staff development for instructional
staff, purchase supplies or equipment related to
instructional activities completed under the grant,
provide basic skills or English language learning
instruction, or provide technical assistance to
employers resulting in the advancement of cur-
rent employees or additional hiring of new em-
ployees. The Board awarded $3.9 million for
these grants in 2015-16. Grants are awarded
Table 11: State General Aids as a Percentage of Aidable Costs
State General Aids Aidable Costs* Aid as % Change
Amount % Change Amount % Change of Cost in CPI**
2006-07 $117,815,000 --- $723,358,432 --- 16.3% ---
2007-08 118,415,000 0.5% 761,517,440 5.3% 15.5% 2.8%
2008-09 118,415,000 0.0 787,347,196 3.4 15.0 3.8
2009-10 119,335,600 0.8 797,879,644 1.3 15.0 -0.4
2010-11 119,335,600 0.0 858,479,226 7.6 13.9 1.6
2011-12 83,534,900 -30.0 815,664,150 -5.0 10.2 3.2
2012-13 83,534,900 0.0 840,895,313 3.1 9.9 2.1
2013-14 83,534,900 0.0 855,260,147 1.7 9.8 1.5
2014-15 83,534,900 0.0 881,338,742 3.0 9.5 1.9
2015-16 88,534,900 6.0 894,290,401 1.5 9.9 0.1
2016-17 88,534,900 0.0 900,560,610 0.7 9.8 1.8
*Aidable costs are based on district estimates.
**Changes in Consumer Price Index-All Urban Consumers for calendar years 2006 through 2016. CPI-U for 2016 is estimated.

13
throughout the academic year.
Student Support. Student support grants are
intended to fund the creation, expansion, or im-
plementation of programs that provide direct ser-
vices to students. Allowable activities include
case management, advising, counseling and/or
career services, transition and accommodation
services for students with disabilities, tutoring,
emergency dependent care or transportation as-
sistance, and other services. Grants require
matching funds of 25% of the total project cost
from districts. In 2015-16, the Board awarded
$3.3 million for student support grants. With
these funds, grants were awarded to all 16 tech-
nical college districts.
Systemwide Leadership. Additional grants are
available to support projects that have a sys-
temwide impact, particularly projects that support
system goals related to performance funding cri-
teria. Examples of projects funded under this cat-
egory include a statewide veterans service sum-
mit and resource center to support specialized
services for veterans, curriculum review for
courses that are taught using the same curriculum
across the state, and the development of early
childhood education course articulation agree-
ments between high schools and technical colleg-
es. In 2015-16, the Board awarded $3.4 million
for grants funding statewide projects. Grants are
awarded throughout the academic year.
Developing Markets. Grants awarded under
the new markets category are designed to support
the development of programs that are new to a
district, including the development of curriculum
and instructional materials, the purchase of
equipment, staff development, and instruction. In
2015-16, the Board awarded $1.5 million for new
market grants to districts. Twelve grants were
awarded to nine technical college districts.
Professional Development. This category
supports professional development activities for
instructors and other staff, including activities
such as a peer coaching and mentoring program,
programs to ensure the currency of staff
knowledge and skills, in-service activities or
workshops, staff orientation, and other activities.
In 2015-16, the Board awarded $1 million for
professional development grants, and with these
funds, grants were awarded to all sixteen tech-
nical college districts.
Apprentice-Related Instruction. Grants
awarded under this category are intended to sup-
port systemwide apprenticeship curricula devel-
opment as well as provide direct support for con-
tractually required apprentice-related instruction
that cannot otherwise be provided due to limita-
tions in district fiscal capacity. Grants may be
used to review and revise curricula, ensure that
curricula is industry approved and aligns with
state standards, respond to industry demand out-
side of the normal budget process, support class-
room delivery or regional delivery through inter-
district partnerships, or other activities related to
apprentice instruction. In 2015-16, the Board
awarded $602,360 for this category, including
$300,000 for system-wide apprentice curriculum
and $302,360 for direct instruction support.
4. Fire Schools. District boards are required
to make fire fighter training programs available,
free of charge, to paid and volunteer municipal
fire departments. State aid reimburses districts for
the operation of these programs. Funding is pro-
vided as program revenue (PR) from fire dues
payments, a 2% assessment on fire insurance
premiums. In each of 2015-16 and 2016-17,
budgeted fire dues revenues for the program were
$600,000. In 2015-16, funding supported training
for 5,226 firefighters in programs conducted by
WTCS districts.
4. Veterans Job Grant Pilot Program.
2015 Act 55 created a one-year pilot program in
2016-17 to provide grants to technical college
districts to support programs or services for vet-
erans. Under the program, $500,000 SEG from
the veterans trust fund is provided for the grants.

14
Districts must provide matching funds of 50% of
the total project cost. No grant can be awarded
later than June 30, 2017.
Under state law, programs or services eligible
for grants include the following: (a) recruiting,
training, or graduating veterans in high demand
fields, as identified by the Department of Work-
force Development; (b) providing specialized sup-
port services for veterans, including career path-
way planning, case management, or advising by
experts in military education related to obtaining
credit for prior learning; (c) collaborations with
employers; (d) work-based learning activities, such
as internships, service learning, mentoring, job
coaching, and job shadowing; (e) specialized in-
structional methodologies that have been demon-
strated to be helpful for veterans to enhance stu-
dent retention and completion; (f) creating, ex-
panding, or implementing innovative methods that
provide direct services to help veterans complete
courses, semesters, programs, or certificates; (g)
counseling or career services; (h) targeted services
based on student need such as financial literacy,
career assessment and planning services, veterans
peer support groups, or tutoring; (i) accommoda-
tion and transition services, including assistive
technology such as adaptive equipment for injured
veterans; (j) providing access or referrals to emer-
gency dependent care and transportation assis-
tance; and (k) any other program or service for
veterans.
The Board is required to submit a report on the
program to the Joint Committee on Finance by
September 1, 2017, that includes the following in-
formation: (a) the technical colleges that received
grant funding and the amount of funding received
by each; (b) the programs or services funded
through the grant program; (c) the total number of
veterans supported through the program; and (d)
the amount of unencumbered funds, if any, that
lapsed to the veterans trust fund at the end of the
2015-17 biennium.
4. Grants for Emergency Financial Need.
2015 Act 282 created a program to provide small
grants to WTCS students experiencing emergen-
cy financial need. A student is eligible for fund-
ing under the program if his or her expected
family contribution, as determined by the federal
Free Application for Federal Student Aid (FAF-
SA), is less than $5,000. A financial emergency
is defined as an unplanned event causing an un-
anticipated expense that would cause a student
not to complete that term if a grant were not
available to cover the expense, such as charges
for medical treatment or vehicle repair. Expenses
including tuition, textbooks, student fees, alcohol
or tobacco, groceries, entertainment, legal ser-
vices, or fines or forfeitures resulting from legal
violations are not eligible.
Under the program, the Board distributes
funds to each technical college district based on
the anticipated need and demand for grants at
each technical college. Of the $320,000 provided
in 2016-17, the Board divided 25% of the total
funds equally among the districts ($80,000 total,
or $5,000 for each of the 16 districts); 50% (or
$160,000) based on each district's share of the
total number of WTCS students receiving Pell
Grants; and the remaining 25% based on need
until all funds are distributed.
Each technical college must create a brief ap-
plication process for grant funding, and decisions
on grant applications and disbursement of funds
must be made within five business days of a stu-
dent's application. Students must include with
their applications written proof of the nature and
amount of the expense, such as a bill.
Each technical college must collect and report
data related to the program, including the number
of grants awarded and the number of students
receiving grants, the types of expenses for which
students requested grants, the number of grant
applications denied, the total amount of grant
funding awarded and the amount available but
not awarded, and outcomes for students receiving

15
grants. The Board must submit an annual report
to the Legislature with this information by June
30 of each year, beginning in 2017.
5. Truck Driver Training Grants. Under
current law, there is an $8 assessment surcharge
on the commercial vehicle violations and convic-
tions that is available for grants to WTCS dis-
tricts that provide truck driver training. Currently,
Chippewa Valley, Fox Valley, and Waukesha
County technical colleges offer truck driver train-
ing programs. Although $150,000 annually is
budgeted for this program in the 2015-17 bienni-
um, data on the number of eligible commercial
vehicle violations and convictions in past years
indicate that actual surcharge revenue varies.
This is a continuing appropriation, and unex-
pended revenues carry over for distribution in
subsequent years. WTCS awarded grants to all
three truck driver training programs in 2015-16
which totaled $74,600 ($18,200 to Chippewa
Valley, $36,200 to Fox Valley, and $20,200 to
Waukesha County).
6. Work-Based Learning Grants to Trib-
al Colleges. The System Board awards funds to
support occupational training and work-based
learning experiences for youth and adults at two
tribal colleges: Lac Courte Oreilles Ojibwa
Community College and the College of Menomi-
nee Nation. Grant funds can support youth ap-
prenticeship programs for youth or adults, other
work-based learning or employability skills train-
ing for youth, basic skills or occupational skills
training for workers or unemployed adults, or
other services. Tribal gaming revenue provides
$594,000 annually for these grants. Lac Courte
Oreilles Ojibwa Community College and the Col-
lege of Menominee Nation are each eligible to
apply for up to $297,000 in funding.
Tuition Revenues
In 2015-16, 17.1% ($264.6 million) of total
WTCS revenue was generated through tuition
and fees. In 1975, the Legislature established a
statutory tuition policy for the WTCS based on a
percentage of cost methodology. Each year, the
WTCS Board sets separate resident tuition rates
for post-secondary and vocational-adult (PS/VA)
courses and collegiate transfer (CT) courses. For
both PS/VA and CT programs, tuition is based on
the districts' projections of costs and enrollments
in order to generate the percentage of costs re-
quired by law. This method automatically causes
tuition to increase as costs rise. Out-of-state stu-
dents pay fees based on 150% of resident tuition,
unless covered by a reciprocity agreement.
By law, tuition for state residents enrolled in
post-secondary (associate degree and technical
diploma) and vocational-adult programs is to be
set at the level necessary to generate revenue
equal to at least 14% of the estimated, statewide
operational cost of those programs. The WTCS
Board may set the percentage higher in order to
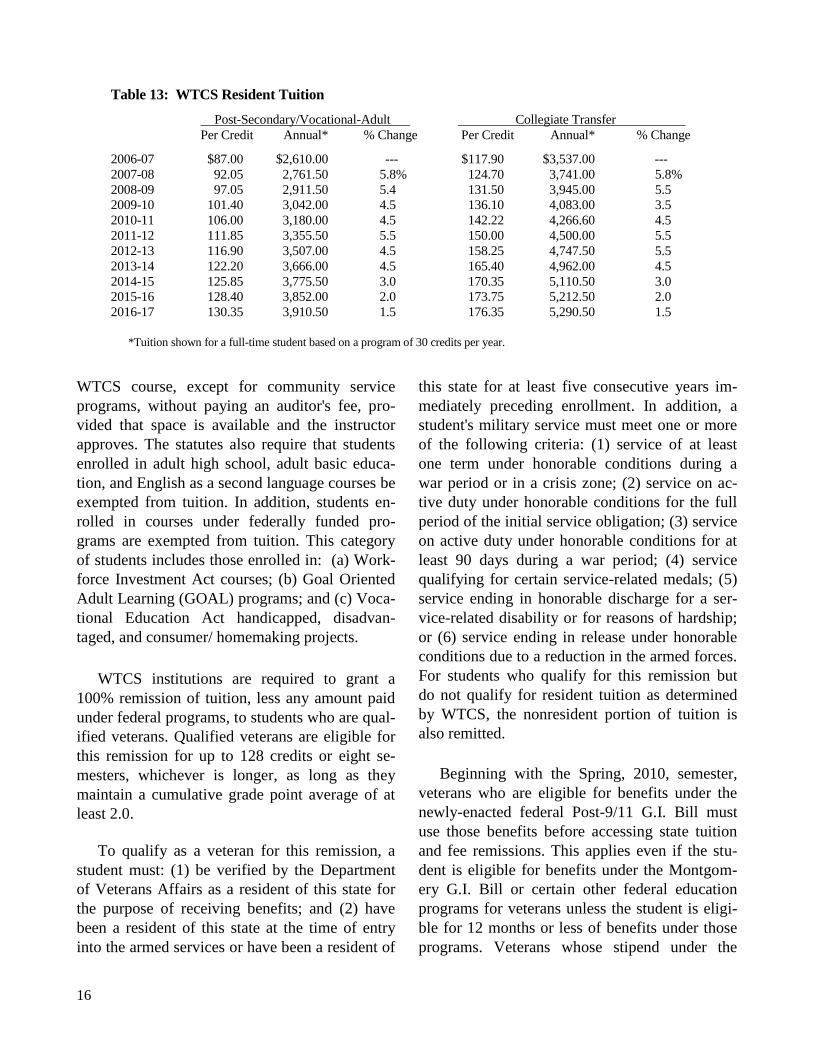
generate more tuition revenue. For 2016-17, resi-
dent tuition for PS/VA courses is $130.35 per
credit or $3,910.50 annually for a full-time stu-
dent. This rate was set to recover 21.5% of costs.
The uniform tuition charge for collegiate
transfer courses must equal at least 31% of the
estimated, statewide operational cost of such pro-
grams. This percentage was originally set for
comparability with resident tuition at the two-
year colleges in the UW System. In 2016-17, tui-
tion for collegiate transfer programs is $176.35
per credit or $5,290.50 annually, as compared to
annual tuition of $4,750 at the two-year UW Col-
leges. The current rate was set to recover 48.1%
of collegiate transfer costs.
Table 13 shows per credit and annual resident
tuition charges from 2006-07 through 2016-17.
Tuition Remissions
WTCS districts are required by law to exempt
from tuition students over age 62 who are en-
rolled in vocational-adult programs. In addition,
resident students age 60 and older may audit a
16
WTCS course, except for community service
programs, without paying an auditor's fee, pro-
vided that space is available and the instructor
approves. The statutes also require that students
enrolled in adult high school, adult basic educa-
tion, and English as a second language courses be
exempted from tuition. In addition, students en-
rolled in courses under federally funded pro-
grams are exempted from tuition. This category
of students includes those enrolled in: (a) Work-
force Investment Act courses; (b) Goal Oriented
Adult Learning (GOAL) programs; and (c) Voca-
tional Education Act handicapped, disadvan-
taged, and consumer/ homemaking projects.
WTCS institutions are required to grant a
100% remission of tuition, less any amount paid
under federal programs, to students who are qual-
ified veterans. Qualified veterans are eligible for
this remission for up to 128 credits or eight se-
mesters, whichever is longer, as long as they
maintain a cumulative grade point average of at
least 2.0.
To qualify as a veteran for this remission, a
student must: (1) be verified by the Department
of Veterans Affairs as a resident of this state for
the purpose of receiving benefits; and (2) have
been a resident of this state at the time of entry
into the armed services or have been a resident of
this state for at least five consecutive years im-
mediately preceding enrollment. In addition, a
student's military service must meet one or more
of the following criteria: (1) service of at least
one term under honorable conditions during a
war period or in a crisis zone; (2) service on ac-
tive duty under honorable conditions for the full
period of the initial service obligation; (3) service
on active duty under honorable conditions for at
least 90 days during a war period; (4) service
qualifying for certain service-related medals; (5)
service ending in honorable discharge for a ser-
vice-related disability or for reasons of hardship;
or (6) service ending in release under honorable
conditions due to a reduction in the armed forces.
For students who qualify for this remission but
do not qualify for resident tuition as determined
by WTCS, the nonresident portion of tuition is
also remitted.
Beginning with the Spring, 2010, semester,
veterans who are eligible for benefits under the
newly-enacted federal Post-9/11 G.I. Bill must
use those benefits before accessing state tuition
and fee remissions. This applies even if the stu-
dent is eligible for benefits under the Montgom-
ery G.I. Bill or certain other federal education
programs for veterans unless the student is eligi-
ble for 12 months or less of benefits under those
programs. Veterans whose stipend under the
Table 13: WTCS Resident Tuition
Post-Secondary/Vocational-Adult Collegiate Transfer
Per Credit Annual* % Change Per Credit Annual* % Change
2006-07 $87.00 $2,610.00 --- $117.90 $3,537.00 ---
2007-08 92.05 2,761.50 5.8% 124.70 3,741.00 5.8%
2008-09 97.05 2,911.50 5.4 131.50 3,945.00 5.5
2009-10 101.40 3,042.00 4.5 136.10 4,083.00 3.5
2010-11 106.00 3,180.00 4.5 142.22 4,266.60 4.5
2011-12 111.85 3,355.50 5.5 150.00 4,500.00 5.5
2012-13 116.90 3,507.00 4.5 158.25 4,747.50 5.5
2013-14 122.20 3,666.00 4.5 165.40 4,962.00 4.5
2014-15 125.85 3,775.50 3.0 170.35 5,110.50 3.0
2015-16 128.40 3,852.00 2.0 173.75 5,212.50 2.0
2016-17 130.35 3,910.50 1.5 176.35 5,290.50 1.5
*Tuition shown for a full-time student based on a program of 30 credits per year.
17
Montgomery G.I. Bill or certain other federal ed-
ucation programs would have exceeded the
amount of the monthly housing allowance pro-
vided under the Post-9/11 G.I. Bill (adjusted to
reflect the annual books and supplies stipend) are
reimbursed for the difference in these benefits.
In 2015-16, WTCS provided remissions total-
ing $2.5 million to 1,431 veterans. Supplemental
stipend payments were made to 418 veterans and
totaled $1.0 million.
In addition, WTCS institutions are required to
grant a full remission of fees, including tuition
and academic fees, for 128 credits or eight se-
mesters, whichever is longer, to the spouse, un-
remarried surviving spouse, and children of eligi-
ble veterans. An eligible veteran is one who: (1)
was a resident at the time of entry into the armed
services; (2) served under honorable conditions;
(3) either died on active duty, died on inactive
duty for training purposes, died as the result of a
service-related disability, or has been awarded at
least a 30% service-related disability rating; and
(4) was a resident of this state at the time of death
or service-related disability. Children of eligible
veterans are eligible if they are at least 17 years
old and not yet 26 years of age, regardless of
when the eligible veteran died or received his or
her disability rating. The recipient of the remis-
sion must maintain a cumulative grade point av-
erage of at least 2.0.
In 2015-16, technical colleges remitted $1.9
million in tuition and fees to 822 students under
the spouses and children provision.
Wisconsin technical college district boards
received reimbursements totaling $1.6 million
through an appropriation under the Higher Edu-
cational Aids Board. This amount fully reim-
bursed the district boards for all reimburse-
ment/supplemental payments made directly to
veterans and for 15.0% of tuition and fee remis-
sions provided to veterans, children, and spouses.
Under current law, district boards are required
to grant full remission of tuition to any resident
student who is the child or surviving spouse of a
fire fighter, law enforcement officer, correctional
officer, ambulance driver, or emergency medical
services technician, who was killed in the line of
duty in Wisconsin or who died as a result of a
qualifying disability, provided that the child or
surviving spouse is enrolled in a postsecond-
ary/vocational adult or collegiate transfer pro-
gram. Eligible students must maintain good aca-
demic standing and may receive the remission for
three years or until they have completed a suffi-
cient number of credits to complete the program
in which they are enrolled, whichever comes
first. In 2015-16, two students received remis-
sions totaling $3,000.
While the above categories of students are
exempt from paying tuition, the costs associated
with their instruction are included in the cost ba-
sis upon which tuition is determined. Conse-
quently, tuition for non-exempt students reflects
these costs.
Appendix II includes discussions of the tui-
tion formula, reciprocity agreements with other
states, and fees for student materials.
Federal Aid
In 2015-16, federal aid provided a total of
$288.6 million to technical college districts.
Based on past years, it is estimated that approxi-
mately 80% of the federal moneys received by
districts is for student financial aid. Student fi-
nancial aid is received by the colleges and passed
through to students, who then use aid to pay for
tuition, materials fees, books, and other fees paid
to technical colleges. Less financial aid, federal
aid provided 4.0% ($61.5 million) of technical
college district revenue in 2015-16.
The remaining federal funds are provided ei-
ther in the form of direct federal grants to indi-
vidual districts or as federal aid which the WTCS

18
Board receives and then distributes to districts.
After student aid, the following two programs are
the largest sources of federal revenue.
• Carl Perkins Career and Technical
Education Act ($11.3 million) -- Provides sup-
port for postsecondary and adult education
through: (1) a formula-based grant for services
to special populations and program improvement;
(2) competitive-based grants targeted for nontra-
ditional employment and training, pre-technical
learning, and work-based learning; and (3) tar-
geted grants for carrying out the technical educa-
tion program for criminal offenders. For 2015-16,
total funding was $20.2 million. The state grant
was split between WTCS ($11.3 million) and the
Department of Public Instruction ($9.0 million).
• Adult Education and Family Literacy
Act ($6.5 million) -- Provides support for pro-
grams and services in adult education and litera-
cy, including workplace literacy, family literacy,
and English literacy.
Other federal monies go to specific programs
at WTCS districts and are applied for directly by
the districts.
Self-Financing Operations and Miscellaneous
Revenue
In 2015-16, 18.9% ($293.9 million) of total
WTCS revenue was obtained from other sources,
including transfers from other state agencies,
auxiliary or self-financing operations, such as
food service and bookstores, equipment sales,
and interest income. In addition, districts may
enter into contracts to provide educational ser-
vices to businesses and industries, public and pri-
vate educational institutions, including school
districts, and government agencies.
As an example of funding received from other
state agencies, 2013 Act 139 provided approxi-
mately $31 million to the Department of Work-
force Development (DWD) for technical college
wait list reduction grants under DWD's Wiscon-
sin Fast Forward program. Grant awards of over
$28 million have been made to technical college
districts for wait list reduction.

19
APPENDIX I
State General Aid Formula
General aid is calculated according to the fol-
lowing formula factors:
1. Aidable Cost. The costs that are aided
under the formula include operational costs for
post-secondary, vocational-adult and collegiate
transfer instructional programs, and debt service.
The following items are not aidable under the
formula because they have already been offset by
sources other than the property tax or general aid:
• Auxiliary operations such as bookstores and
cafeterias;
• Community service programs, which are
primarily avocational courses;
• Federal aid;
• Student tuition and fees;
• State categorical aids; and
• Revenues from business and high school
contracts.
2. Full-Time Equivalent Students. The
equalization factor of the general aid formula re-
quires a calculation of full-time equivalent stu-
dents enrolled in post-secondary, vocational-adult
and collegiate transfer courses. Headcount en-
rollments do not provide an accurate reflection of
the number of students pursuing full-time pro-
grams due to the system's large number of part-
time students and short course offerings.
3. Equalization Index. The equalization
index compares the current year value of taxable
property (as equalized by the Department of Rev-
enue) behind each FTE student in a district to the
statewide average. If a district's per student val-
uation exceeds the statewide average, the index
will be less than 1.0; if a district's per student
valuation is lower than the statewide average, the
index will be greater than 1.0. A district with an
equalization index greater than 1.0 would receive
more than the statewide average reimbursement
under the aid formula. The equalized index is
multiplied by the district's aidable cost resulting
in an equalized aidable cost figure.
4. Nonstatutory Percentage Factor. Cur-
rent law does not require that a given percentage
of district aidable cost be reimbursed under the
formula. The percentage of cost that is reim-
bursed each year is calculated by dividing the
total amount available for general aid into the
total equalized aidable cost. In 2015-16, 7.66% of
total equalized aidable cost (or 8.13% of aidable
cost prior to application of the equalization indi-
ces) was supported by general aid.
Sample Aid Calculation
The following provides an example of the
computation of general aid for Moraine Park
Technical College based on 2015-16 data.
1. Aidable cost equals $36,982,786.
2. District equalized valuation per FTE stu-
dent equals $8,618,663.
3. Statewide equalized valuation per FTE
student equals $7,464,666.
4. $7,464,666 = 0.8661 which is the dis-
$8,618,663 trict's equalization index.
5. 0.8661 times $36,982,786 equals the dis-
trict's equalized aidable cost of $32,030,791.
6. The total amount available for general
aid ($70,827,900) is divided into the statewide
equalized aidable cost of $925,909,336 to yield
7.6496%.

20
7. The district's equalized aidable cost of
$32,030,791 is multiplied by 7.6496% to yield
$2,450,200 the district's estimated state aid enti-
tlement for 2015-16.
Aid Variations Among Districts
The two primary factors which determine the
level of state aid received by a district under the
formula are the level of aidable cost and the
equalization index. District aidable cost levels are
affected by various characteristics of a district
and its programs, including student enrollments
and the design and cost of educational programs.
In 2015-16, equalization indices ranged from
0.36759 at Nicolet to 1.64181 at Northcentral.
Table 14 provides 2015-16 state aid estimates
for each WTCS district. These figures will not be
finalized until the completion of cost and FTE
audits in June, 2017, when any necessary changes
will be made by adjusting 2016-17 aid payments.
Incorporation of the equalization factor under
the aid formula results in the provision of general
aid to individual districts at varying levels. In
2015-16, the proportion of aidable cost funded
through state aid varied from 2.8% at Nicolet to
12.6% at Northcentral, with a statewide average
of 8.1%. It should be noted that these aid esti-
mates use preliminary equalized valuation esti-
mates, which may differ from the actual valua-
tions.
The payment of state aid is based on estimat-
ed enrollment and cost data for the current fiscal
year. According to a WTCS Board rule, 85% of
general aid is distributed to districts between July
and February of each fiscal year. The remaining
15% is withheld by the Board for distribution in
June in the event that adjustments need to be
made in payments to districts based on revised
enrollment and cost data. Because general aid is
adjusted on the basis of audited cost and enroll-
ment data, variations between aid estimates and
actual amounts paid to any one district can occur.
For example, a change in the FTE enrollment for
one district can affect the computation of the
Table 14: State General Aid to WTCS Districts -- 2015-16
2015 Net Equalized
Equalized 2015-16 Equalized Equalization Aidable Aidable Percent
Valuation FTEs Value/FTE Index Cost Cost State Aid Aid/Cost
Blackhawk $11,446,603,627 1,617 $7,077,032 1.05477 $25,558,614 $26,958,459 $2,062,200 8.1%
Chippewa Valley 21,859,481,739 3,726 5,867,115 1.27229 43,187,581 54,947,127 4,203,200 9.7
Fox Valley 34,168,657,036 6,271 5,448,635 1.37001 76,086,910 104,239,828 7,973,900 10.5
Gateway 38,200,581,361 4,760 8,025,219 0.93015 65,187,782 60,634,415 4,638,300 7.1
Lakeshore 13,751,561,138 1,794 7,665,635 0.97378 24,529,957 23,886,782 1,827,200 7.4
Madison Area 72,461,464,359 9,513 7,617,103 0.97999 133,287,395 130,620,314 9,991,900 7.5
Mid-State 12,521,076,855 1,901 6,586,556 1.13332 22,533,664 25,537,852 1,953,500 8.7
Milwaukee Area 70,828,239,352 10,605 6,678,504 1.11772 154,410,925 172,588,179 13,202,300 8.6
Moraine Park 24,154,921,733 2,803 8,618,663 0.86610 36,982,786 32,030,791 2,450,200 6.6
Nicolet Area 16,861,471,147 830 20,306,873 0.36759 18,728,463 6,884,396 526,600 2.8
Northcentral 15,335,257,190 3,373 4,546,615 1.64181 35,310,685 57,973,436 4,434,700 12.6
Northeast WI 37,424,922,489 6,272 5,967,268 1.25094 67,237,855 84,110,522 6,434,100 9.6
Southwest WI 7,709,360,223 1,424 5,414,647 1.37861 18,225,249 25,125,511 1,922,000 10.5
Waukesha Co. 50,862,733,484 3,723 13,662,825 0.54635 59,957,637 32,757,855 2,505,800 4.2
Western 18,016,300,388 3,171 5,680,882 1.31400 51,537,878 67,720,772 5,180,300 10.1
WI Indianhead 31,642,630,873 2,151 14,711,952 0.50739 39,206,718 19,893,097 1,521,700 3.9
Total $477,245,262,994 63,934 $7,464,666 $871,970,099 $925,909,336 $70,827,900 8.1%

21
equalization index and, therefore, aid levels in all
districts.
Tax Base Equalization
A measure of the relative financial ability of
WTCS districts to generate local funds from
property taxes is incorporated under the general
aid formula through the equalization index. The
principle behind the equalization formula is that
those districts with relatively high property val-
uations behind each student generate more prop-
erty tax revenue at a given mill rate and, there-
fore, should receive less state aid per student than
districts with relatively low valuations per stu-
dent. For example, Waukesha, which has a high-
er-than-average property valuation behind each
student, receives less state aid than it would if
there was no equalization index. In 2015-16,
Waukesha would have received about $4.9 mil-
lion in state aid on a straight percentage reim-
bursement basis based on its net aidable cost, but
due to the equalization index, its aid payment was
approximately $2.6 million. On the other hand,
Northcentral, which had the lowest property val-
uation behind each student, would have received
about $2.9 million if all districts were provided
an equal percentage of cost, but instead received
$4.4 million because of the equalization index.
The general aid formula provides only partial
equalization. Full equalization would imply that
two districts with the same cost per student
would have the same mill rates. In fact, mill rates
between two districts with similar costs per stu-
dent can vary substantially.
The primary reason why the general aid for-
mula provides for less than full equalization is
that the application of the equalization index as-
sures the provision of state aid to all districts. No
matter how much greater a district's property val-
uation per student is than the statewide average,
the district will always receive some aid under
the formula.
Another reason for partial equalization is that
any nonaidable costs that are not funded by some
other source, such as federal revenue, tuition and
fees or user charges must be funded in full by the
property tax. Therefore, to the extent that a dis-
trict has costs that are not eligible for state aid
(primarily community service programs), its fis-
cal capacity is not totally equalized. Districts
with higher-than-average property values are in a
better position to finance those costs because they
can tax at a lower tax rate than districts with low-
er-than-average property values.
Due to the geographic size and composition of
the state's 16 WTCS districts, there is not as
much variation in valuations per student as com-
pared to K-12 school districts. For example, in
2015-16, WTCS district valuations per FTE
ranged from $20,306,873 at Nicolet to
$4,546,615 at Northcentral, a difference of ap-
proximately 4.5 to 1. For the same year, adjusted
school district valuations per pupil ranged from
$8,996,878 to $183,435, a difference of 49 to 1.

22
APPENDIX II
Tuition and Other Fees
Tuition Formula
Tuition for the WTCS is established using a
formula consisting of the following three factors:
1. Statutory Percentage. The statutes set the
percentage of cost to be raised through tuition.
There are currently two different percentages
used in establishing tuition: at least 14% for post-
secondary (excluding collegiate transfer) and vo-
cational-adult (PS/VA) courses; and at least 31%
for collegiate transfer (CT) courses.
2. Operational Costs. These are the costs to
the districts of providing PS/VA and CT courses.
Operational costs include the provision of in-
struction, instructional resources, student ser-
vices, research, physical plant, and administra-
tion. The statutes define operational costs, for the
purpose of calculating tuition, to mean only those
costs that are funded by tuition, state aid, and
property tax revenues.
3. Full-Time Equivalent Students (FTEs).
In order to provide an accurate estimate of the
workload in the Technical College System, an
FTE, rather than headcount, methodology is used.
However, not all FTE students are included when
calculating tuition as the result of statutory or
administrative exemptions. Total tuition-paying
(nonexempt) FTE students for the forthcoming
year are estimated by using the ratio of nonex-
empt FTEs to total FTEs for the previous year.
This percentage is applied to the total FTEs pro-
jected for the upcoming year to derive the num-
ber of FTEs who will be assessed tuition.
Tuition for resident students is calculated us-
ing the following equation:
[(Operational Costs x Target Tuition Recov-
ery Rate %) Number of FTEs] 30 credits =
per credit Tuition
It was estimated that, for 2016-17, PS/VA op-
erational costs would be $885,431,975 with
48,669 FTE students paying tuition. Collegiate
transfer costs were projected to be $78,433,689
with 7,129 FTE students. The Board decided on a
target recovery rate of 21.5% of PS/VA opera-
tional costs. Thus, using the formula above,
PS/VA tuition was calculated to be:
($885,431,975 x 0.215) / (48,669FTE) 30 =
$130.35 per credit (or $3,910.50 annually for
a full-time student)
The Board decided to recover 48.1% of the
collegiate transfer costs, thus collegiate transfer
tuition was calculated to be:
($78,433,689 x 0.481) / (7,129 FTE) 30 =
$176.35 per credit (or $5,290.50 annually for
a full-time student)
Out-of-state students must pay an additional
charge unless they are subject to a reciprocity
agreement, which is discussed later in this ap-
pendix. The total amount equals 150% of resident
tuition for the programs in which they are en-
rolled. In 2016-17, nonresident tuition equaled
$195.53 per credit for PS/VA ($5,865.90 annual-
ly) and $264.53 for collegiate transfer ($7,935.90
annually).
Although tuition is designed to recover a

23
specified amount of operational costs statewide,
the actual percentages can vary due to unantici-
pated changes in enrollments and costs.
Student Materials Fees
Annually, the WTCS Board sets uniform ma-
terials fees for all students in specific course cat-
egories to cover the costs of consumable materi-
als. The fees are in addition to tuition and apply
to avocational, vocational-adult, post-secondary,
and collegiate transfer courses, although some
community services courses have no materials
fees. Lower materials fees are charged for cours-
es with few consumable goods such as business,
home economics, technical, or general education
courses. Higher fees are charged in agricultural,
industrial, and service and health occupations
courses. Registration, parking, and book fees pol-
icies vary by district.
Reciprocity Agreements
The WTCS currently has reciprocity agree-
ments with institutions in four states: Minnesota,
Michigan, Illinois and Iowa. These agreements
were instituted to allow students in state border
communities to attend institutions that are more
conveniently located or that offer programs not
available in the student's home district.
Only the Minnesota agreement is systemwide.
In other words, Minnesota residents may attend
any WTCS institution and pay the tuition rate
charged to Wisconsin residents. The other
agreements are between individual community
colleges in those states and certain WTCS dis-
tricts. Gateway, Blackhawk, Chippewa Valley,
Southwest, Nicolet, Indianhead, and Northeast
each participate in agreements with one or more
community colleges in Michigan, Illinois, and/or
Iowa. Additional information on these agree-
ments is contained in the Legislative Fiscal Bu-
reau's informational paper entitled, "Education
and Income Tax Reciprocity Agreements."
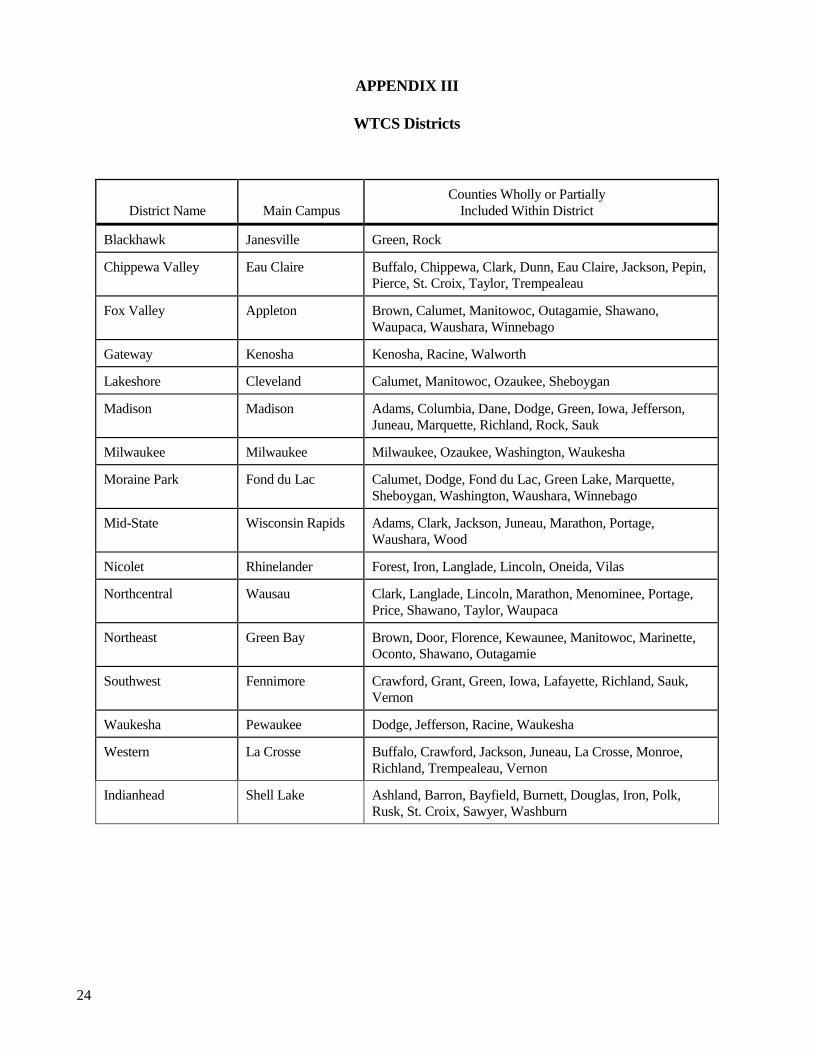
24
APPENDIX III
WTCS Districts
District Name
Main Campus
Counties Wholly or Partially
Included Within District
Blackhawk Janesville Green, Rock
Chippewa Valley Eau Claire Buffalo, Chippewa, Clark, Dunn, Eau Claire, Jackson, Pepin,
Pierce, St. Croix, Taylor, Trempealeau
Fox Valley Appleton Brown, Calumet, Manitowoc, Outagamie, Shawano,
Waupaca, Waushara, Winnebago
Gateway Kenosha Kenosha, Racine, Walworth
Lakeshore Cleveland Calumet, Manitowoc, Ozaukee, Sheboygan
Madison Madison Adams, Columbia, Dane, Dodge, Green, Iowa, Jefferson,
Juneau, Marquette, Richland, Rock, Sauk
Milwaukee Milwaukee Milwaukee, Ozaukee, Washington, Waukesha
Moraine Park Fond du Lac Calumet, Dodge, Fond du Lac, Green Lake, Marquette,
Sheboygan, Washington, Waushara, Winnebago
Mid-State Wisconsin Rapids Adams, Clark, Jackson, Juneau, Marathon, Portage,
Waushara, Wood
Nicolet Rhinelander Forest, Iron, Langlade, Lincoln, Oneida, Vilas
Northcentral Wausau Clark, Langlade, Lincoln, Marathon, Menominee, Portage,
Price, Shawano, Taylor, Waupaca
Northeast Green Bay Brown, Door, Florence, Kewaunee, Manitowoc, Marinette,
Oconto, Shawano, Outagamie
Southwest Fennimore Crawford, Grant, Green, Iowa, Lafayette, Richland, Sauk,
Vernon
Waukesha Pewaukee Dodge, Jefferson, Racine, Waukesha
Western La Crosse Buffalo, Crawford, Jackson, Juneau, La Crosse, Monroe,
Richland, Trempealeau, Vernon
Indianhead Shell Lake Ashland, Barron, Bayfield, Burnett, Douglas, Iron, Polk,
Rusk, St. Croix, Sawyer, Washburn