Embed Size (px)
Citation preview
Wisconsin School Report Cards A Study Examining School Achievement and Poverty in Public and Charter Schools Prepared by Forward Institute, Inc., a non-partisan public policy education foundation in Wisconsin
2012
Forward Institute, Inc. 12/5/2012

2

3
Author – Scott Wittkopf Co-Authors – Meg Turville-Heitz
Amy Janczy
Data Analysis – Kirstie K. Danielson, PhD
Forward Institute Board of Directors Scott Wittkopf
Meg Turville-Heitz Julie Wells
Nathaniel Haack Sara Schulz
This study was funded by a grant from the Andrew T. Wallen Memorial Education Foundation, Inc.
“Forward Institute is a non-partisan, non-profit progressive think tank for public policy issues in Wisconsin. The Institute combines original, government, and academic research with original message
and communication methods to educate and inform the public on critical progressive policies.”
www.forwardinstitutewi.org

4
Executive Summary This report documents findings from our analysis of the school performance data released through the Wisconsin Department of Public Instruction (DPI) Report Cards. For the purposes of this study, a charter school is defined by DPI in the Report Card data, indicated as “Y” in the “Charter School indicator” column of the DPI data spreadsheet.1 These charter schools include instrumentality and non-instrumentality entities. Public schools represent 95% (1,772 schools) of the total data set, charter schools 5% (101) of the total. The data show:
Higher DPI Report Card scores have a significant correlation with lower economically disadvantaged (ED) enrollment.
Almost half of the variation from school to school in DPI Report Card scores can be explained by the variation from school to school in level of ED enrollment.
On average, public schools have outperformed charter schools on DPI Report Card scores.
Even when adjusting for poverty (e.g. ED enrollment) in the analysis, public schools performed better on the DPI Report Cards than charter schools.
The aforementioned finding becomes most prominent in schools serving the poorest students.
We urge Wisconsin legislators to work with state educational leadership and citizens to address the significant correlation between economic disadvantage and educational outcome. Based on the Report Card data and this study, it is our recommendation that well-informed public policy should address the following:
Economic disadvantage should be acknowledged as a significant factor affecting education outcome. Future economic and education policies need to receive equal and collaborative consideration as the highest priority in the state budget. Both have significant impact on each other.
Any assessment having direct economic consequences for schools or teachers ought to
be conducted independent of the current Report Card scoring system. As the study clearly shows, a very significant factor affecting Report Card scores is poverty, something which is outside the control of teachers and schools. Public policy should therefore necessarily address economic justice as part of any serious effort to improve education, and schools today should not be labeled on the basis of factors beyond their control.
A re-evaluation of charter school performance, standards and accountability needs to be conducted and addressed immediately. It is clear from the results of this study that
1 Wisconsin DPI Report Card Data Spreadsheet http:reportcards.dpi.wi.gov/files/reportcards/xls/2011-
12reportcarddata.xlsx
5
overall, charter schools are underperforming at the core level of their mission – student excellence and achievement.2
The data clearly show that public schools are doing a better job offsetting the effects of poverty on education than their charter school counterparts. A concerted effort should be made to ascertain how and why this is the case, replicate that effort in charter schools, and reinforce those standards and methods.
A significant informational campaign should be engaged to inform the public about the results of this report and encourage participation in the future of education and economics in Wisconsin. Teachers deserve to be restored to their place as legitimate authorities on classroom education policies, as well as public policy addressing the local economic impact on students in classrooms.
Background The Wisconsin Department of Public Instruction (DPI) recently released Report Cards for a majority of public and charter schools in the state. Public schools comprise 95% (1,772 schools) of the total data set, charter schools comprise 5% (101) of the total.
The Report Cards represent a compilation of three years of data intended to provide a standard of measure for school, student, and teacher performance.3 Forward Institute is conducting an extensive study on the effects of Wisconsin 2011 Act 32 on high poverty vs. low poverty school students, to be completed in January 2013.4
As part of the data analysis in our Act 32 Study, we used the recent Report Cards to examine the correlations between poverty and educational outcome in Wisconsin charter and public schools. The Report Cards are an appropriate data source as they use the same criteria over a three-year period to obtain a percentile score. The Report Cards are also having a significant impact on policymakers as future education policy and assessment are being formed.5
2 La Causa charter school mission statement http://wisconsin.webschoolpro.com/la-causa-charter-
school_WI07936191121/mission.html
3 Wisconsin DPI Report Card website http://reportcards.dpi.wi.gov/
4 Forward Institute website, Research tab http://forwardinstitutewi.org/research/
5 Milwaukee Journal Sentinel, October 22, 2012 http://www.jsonline.com/news/education/new-school-
performance-report-cards-released-monday-gf79n66-175227591.html
6
Act 32 Biennial Budget Wisconsin has made a public policy decision over the last two biennial budgets to cut funding for public education. Wisconsin 2011 Act 32 reduced total state aids to school districts by $792 million. The current reduction follows a $284 million cut in the 2009-11 biennial state budget passed under Governor Jim Doyle. Together, these two biennial budgets have cut state aid to public school districts by more than one billion dollars.6 Act 32 also reduced the revenue limit in Wisconsin school districts by 5.5%. As a result, local school districts have lost $1.6 billion in revenue compared to prior budgets.7 The 2011-2013 biennial budget also provides funding in Milwaukee and Racine for low-income students to attend private schools at no charge. These school choice programs are funded at 61.6% with general program revenue (GPR) and 38.4% by the Milwaukee and Racine school districts through an adjustment to the district’s general equalization aid calculation. In fiscal year 2012, the state provided $143.6 million GPR for these school choice programs.8 There is a new emphasis on charter schools9 to address the growing problem of school performance, and there are more Wisconsin charter schools today than ever before.10 State funding of public education has been cut, while state funding to non-traditional charter schools has increased.11 All of the above factors have placed considerable strain on public school districts in Wisconsin; and has made charter schools more attractive to parents of economically disadvantaged children looking for educational solutions. Increase in Economically Disadvantaged Enrollment Wisconsin DPI defines an “Economically Disadvantaged” (ED) student as being in a family eligible for the federally funded school free or reduced price lunch program. The 2012-2013 income thresholds can be found in Table 2.
6 “Making Matters Worse: School Funding, Achievement Gaps and Poverty Under Wisconsin Act 32,” James J. Shaw
and Carolyn Kelley, May 4 2012, UW-Madison Educational Leadership and Policy Analysis http://elpa.education.wisc.edu/docs/elpa-documents/shawandkelleypolicybrief.pdf?sfvrsn=2 7 Ibid
8 Ibid
9 Milwaukee Journal Sentinel, November 14, 2012 http://www.jsonline.com/blogs/news/179212411.html
10 Allen J. Borsuk, Senior Fellow in Law and Public Policy, Marquette University, August 6, 2011
http://www.jsonline.com/news/education/127076393.html
11 Wisconsin 2011-2013 Budget, report pg. 42 http://budget.wisc.edu/wp-content/uploads/2011/03/Read-the-
states-Budget-in-Brief-summary..pdf
7
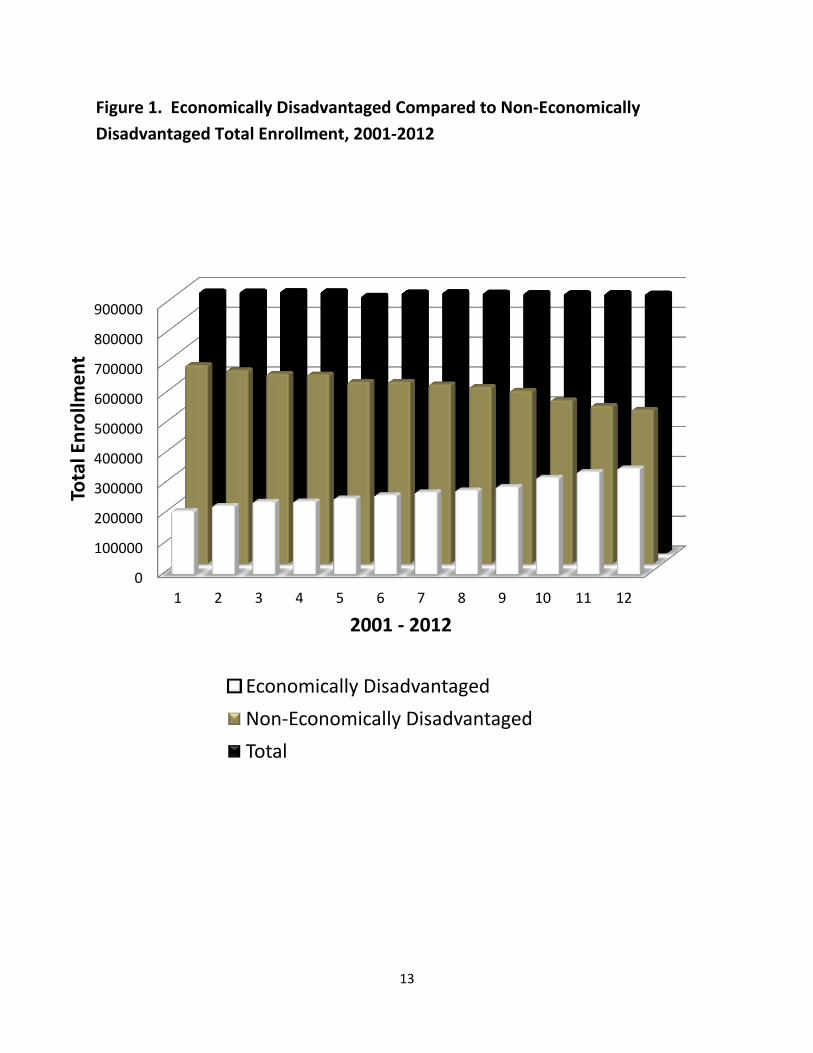
From 2001–2012, Wisconsin has seen a dramatic increase in ED students, and a significant decrease in non-ED students, as total enrollment has remained relatively constant. Total enrollment has decreased slightly from 877,379 in 2001 to 870,470 in 2012. ED enrollment has increased from 211,702 (24.1%) in 2001 to 354,830 (40.8%) in 2012. Non-ED enrollment has decreased from 665,677 (75.9%) in 2001 to 515,640 (59.2%) in 2012.12 See Figure 1.
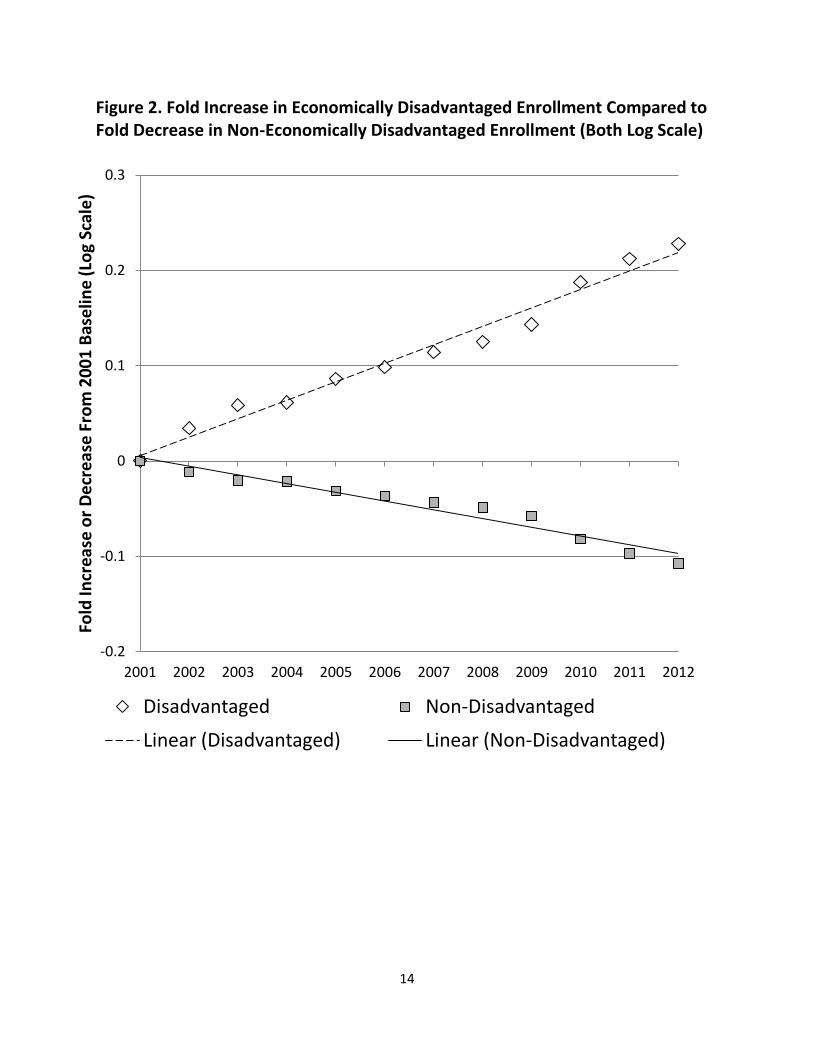
Significantly, the rate of increase in ED enrollment is larger than the rate of decrease in non-ED enrollment. This is illustrated in Figure 2 which converts the enrollment percentages over time to a fold change (increase or decrease on a log scale) relative to 2001 baseline. Note the difference in slope is twofold. Increase in ED enrollment ranges from 0 to 0.2; while the decrease in non-ED enrollment ranges from 0 to -0.1. This is likely a function of a growing income gap over time; as non-ED students graduate they are being replaced by new ED students. Coupled with non-ED students becoming ED because of economic conditions, there is a greater increase in ED students.
Simply stated, students in Wisconsin are becoming ED at an increasingly higher rate over the past decade. Our study found that charter schools do no better than public schools in helping low income students. If Wisconsin aims to move forward in educating an increasingly economically disadvantaged student population and preparing these students for life after high school, significant public policy changes must be made. Fiscal and educational policy must receive equal and intertwined consideration, for one has a significant effect on the other. Study Results Our study analysis of the Report Card data supports the following findings: 1. On average, public schools scored better on the Report Card scores than charter schools. See Figure 3. 2. Even when adjusting for poverty (e.g. ED enrollment) in the analysis, public schools performed better on the Report Cards than charter schools. 3. Public schools with high ED enrollment scored significantly higher than their charter school counterparts with high ED enrollment. 4. ED enrollment is a significant contributing factor in the Report Card scores; almost half of the variation in Report Card score from school to school can be explained by variation in ED enrollment from school to school.
12
Wisconsin DPI website http://dpi.state.wi.us/sig/index.html

8
Analysis
Raw data were extracted from Wisconsin DPI Report Card scores.13 Eleven percent of schools did not receive a Report Card score, having insufficient data to generate a score. These schools, for the most part, are charter schools of high ED enrollment and have been open one year or less. In addition, only the test scores of students meeting “full time” status are reported to DPI. This small number of unreported students and schools likely has an insignificant effect on outcomes. Also noteworthy, unreported schools and students largely fall into the ED category, and would likely serve to reinforce the results of our analysis.14
Data analysis was performed using SAS (version 9.2; SAS Institute, Cary, NC) by Dr. Kirstie K. Danielson, Assistant Professor, University of Illinois at Chicago. The SAS analysis is available on the Forward Institute website.15 Significant relevant findings are highlighted: Background 1. Mean Report Card score for all schools is 70.2%.16 2. Mean ED enrollment is 42.5% for all schools.17 3. Public schools represent 94.6% (1772) of total schools, charters comprise 5.4% (101) of total schools.18 Charters Compared to Public Schools 4. The analysis separates the schools by public and charter, and creates tertiles (three equal groups) of ED enrollment percentiles. The ED enrollment tertiles are as follows: High income tertile (0 - <30.4% ED enrollment) Middle income tertile (30.4 - <48.9% ED enrollment) Low income tertile (>48.9% ED enrollment)
13
Wisconsin DPI website http://reportcards.dpi.wi.gov/
14 Wisconsin DPI Report Card data http:reportcards.dpi.wi.gov/files/reportcards/xls/2011-12reportcarddata.xlsx
15 Dr. Kirstie K. Danielson, University of Illinois-Chicago, SAS analysis (version 9.2; SAS Institute, Cary, NC) 10/25/12
http://forwardinstitutewi.org/research/
16 Ibid pages 1-3; mean and plots of Report Card score distribution.
17 Ibid pages 4-6; mean and plots of ED enrollment distribution.
18 Ibid page 7

9
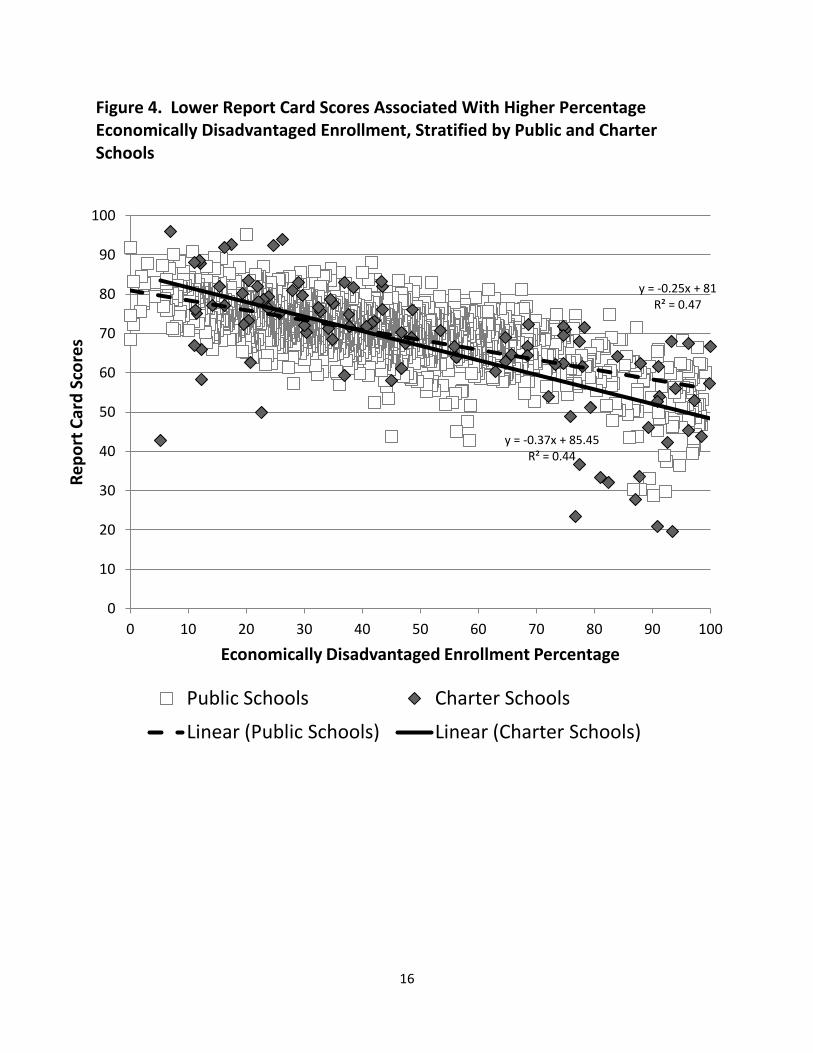
Based on this analysis, the distribution in ED enrollment in charters is significantly different from public schools. In comparing the tertile of highest economic disadvantage (low-income tertile), the percentage of charter schools (43.6%) that have higher ED enrollment is greater than the percentage of public schools (32.7%) that have higher ED enrollment.19 5. Analysis compares the mean Report Card scores of public and charter schools. Public school mean Report Card score is 70.4, while the charter school mean score is 66.7. The outcome of this test indicates that the public school mean Report Card score is significantly higher than the charter school mean Report Card score.20 The Relationship Between Report Card Scores and Economic Disadvantage 6. Analysis shows that even when statistically controlling for the differences in poverty (e.g. ED enrollment) between public and charter schools, public schools perform better on Report Card scores than charter schools. In essence, when “equalizing” the degree of poverty between public and charter schools, public schools have higher Report Card scores than charter schools. Further, this analysis indicates that ED enrollment has a significant effect on Report Card scores.21 7. Analysis of the association between Report Card score and ED enrollment for all schools, stratified by public and charters shows that almost half of the variation in Report Card scores from school to school can be explained by variation in ED enrollment (See Figure 4). The analysis also determines that while ED enrollment goes up, Report Card score goes down, but the negative effect is stronger for charter schools. For each 10% increase in ED enrollment, charter school Report Card score decreases by 3.7 points, where public school score
19
Dr. Kirstie K. Danielson, University of Illinois-Chicago, SAS analysis (version 9.2; SAS Institute, Cary, NC) 10/25/12
http://forwardinstitutewi.org/research/ page 8; Row 1 indicates N = public schools, and Row 2 Y = charter schools;
Columns 0, 1, and 2 represent the ED enrollment tertiles; Chi Square test (p=0.037) indicates significant difference
in ED enrollment distribution.
20 Ibid page 9; since the “Equality of Variances” at the bottom of the page has a p-value <0.0001, we use unequal
variances (Satterthwaite) for the Student’s t-test and the difference in mean scores is statistically significant,
p=0.02. Pages 10-11 show the linear regression which assumes equal variances.
21 Ibid page 13; public schools perform better than charters, p=0.02; and ED enrollment has a significant impact on
Report Card scores, p<0.0001.

10
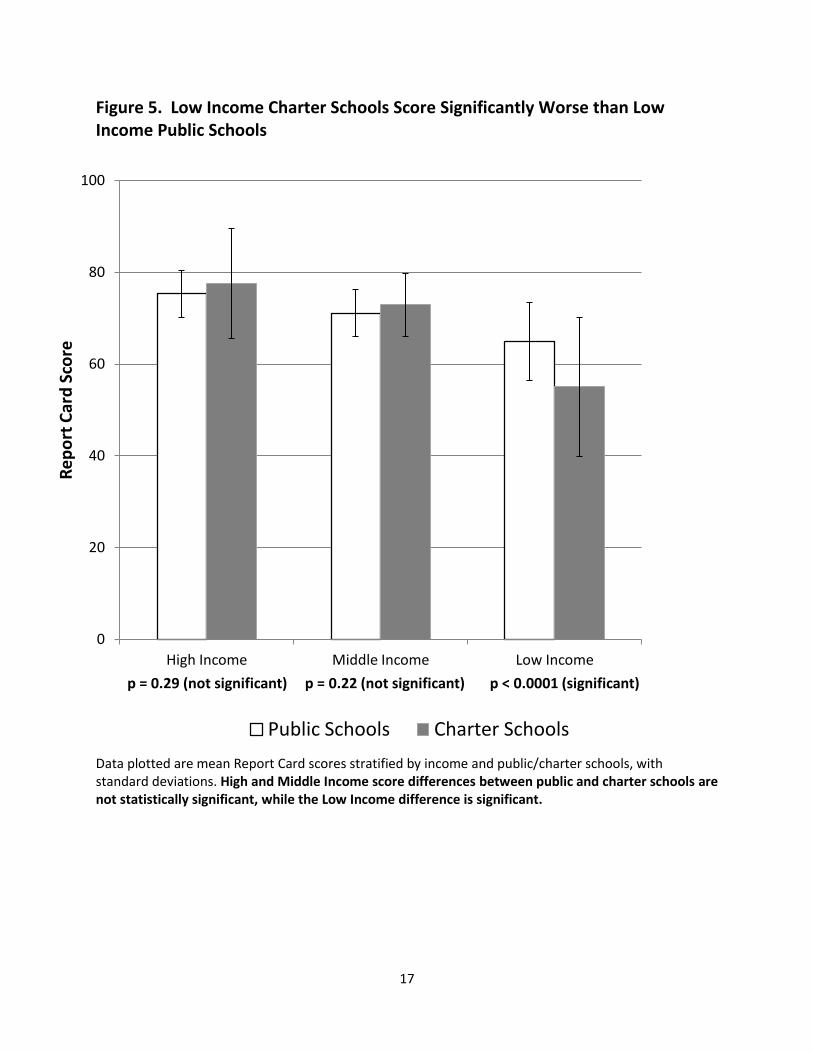
decreases by 2.5 points.22 This could be interpreted as the effects of poverty are lessened in public schools compared to charter schools.23 8. Mean Report Card scores between public and charter schools were compared within the high, middle, and low income tertiles described in number 4 above. Analysis showed no significant difference between public and charter school Report Card scores in high and middle income tertiles. There is, however, a highly significant difference in the low income tertile (see Table 1). A graph of the results can also be found in Figure 5. Table 1. Mean (Standard Deviation) Report Card Scores for Public and Charter Schools, stratified by Tertiles of Income (Percent of ED Enrollment)
High Income Middle Income Low Income
Percent of ED enrollment 0 - <30.4% 30.4 - <48.9% >48.9%
Public Score Mean 75.3 (5.2) 71.1 (5.2) 64.8 (8.5) Charter Score Mean 77.6 (12.0) 72.9 (6.9) 55.1 (15.1) Is difference significant? no no yes
Of the three tertiles, it is the low income tertile group which has a significant difference between public and charter schools.24 Public schools with high ED enrollment scored significantly higher than their charter school counterparts with high ED enrollment. Conclusions
The inequity of results in charter school performance is evident at the low end of the Report Card score outcomes. While the highest scoring school is a charter (96 – Wauwatosa STEM), the highest scoring public school is less than 1 point lower (95.1 – Caledonia Elementary, Portage Schools). By contrast, the lowest scoring school is also a charter. Milwaukee WORK Institute scored more than 10 points lower (19.6) than Milwaukee South Division High School, the lowest scoring public school (29.8). Three additional Milwaukee
22
Dr. Kirstie K. Danielson, University of Illinois-Chicago, SAS analysis (version 9.2; SAS Institute, Cary, NC) 10/25/12
http://forwardinstitutewi.org/research/ pages 14-15(16-17); variation in scores linked to ED enrollment R2 values
for public=0.47 and charter=0.44; negative slope of association between score and ED enrollment for charter
schools = -0.37, while the public school slope = -0.25; analysis on page 14 shows p<0.0001 for the difference in
slope between public and charter schools.
23 Statistical note: ED enrollment is centered at the median ED enrollment of 39%; therefore the intercepts in
Figure 3 refer to 0% ED enrollment, while the intercepts on pages 13-17 refer to 39% ED enrollment.
24 Ibid pages 18-20; numbers in parentheses indicate standard deviation for scores; High Income, p=0.29, Medium
Income, p=0.22, Low Income, p<0.0001

11
charter schools scored lower than this Milwaukee public high school; North Division Charter High School (21), Alliance School of Milwaukee (23.4), and Community High School (27.7).25
The economic reality of more students being forced into poverty and the effects of poverty on education are not being addressed effectively by current public policy. This study confirms that socio-economic policy and education are directly linked. Act 32 and prior economic policy decisions have cut funding to public education; worse yet, as the evidence clearly shows, the new focus on charter schools as a solution to educational outcomes for students in poverty requires serious re-assessment. The following public policy changes are critical to address these significant issues:
1. Economic disadvantage should be acknowledged as a significant factor affecting education outcome. Future economic and education policies need to receive equal and collaborative consideration as the highest priority in the state budget. Both have significant impact on each other.
2. Any assessment having direct economic consequences for schools or teachers ought to be conducted independent of the current Report Card scoring system. As the study clearly shows, a very significant factor affecting Report Card scores is poverty, something which is outside the control of teachers and schools. Public policy should therefore necessarily address economic justice as part of any serious effort to improve education, and schools today should not be labeled on the basis of factors beyond their control.
3. A re-evaluation of charter school performance, standards and accountability needs to be conducted and addressed immediately. It is clear from the results of this study that overall, charter schools are underperforming at the core level of their mission – student excellence and achievement.26
4. The data clearly show that public schools are doing a better job offsetting the effects of poverty on education than their charter school counterparts. A concerted effort should be made to ascertain how and why this is the case, replicate that effort in charter schools, and reinforce those standards and methods.
5. A significant informational campaign should be engaged to inform the public about the
results of this report and encourage participation in the future of education and
25
Wisconsin DPI website http://dpi.state.wi.us/reportcards/districts.html
26 La Causa charter school mission statement http://wisconsin.webschoolpro.com/la-causa-charter-
school_WI07936191121/mission.html
12
economics in Wisconsin. Teachers deserve to be restored to their place as legitimate authorities on classroom education policies, as well as public policy addressing the local economic impact on students in classrooms.
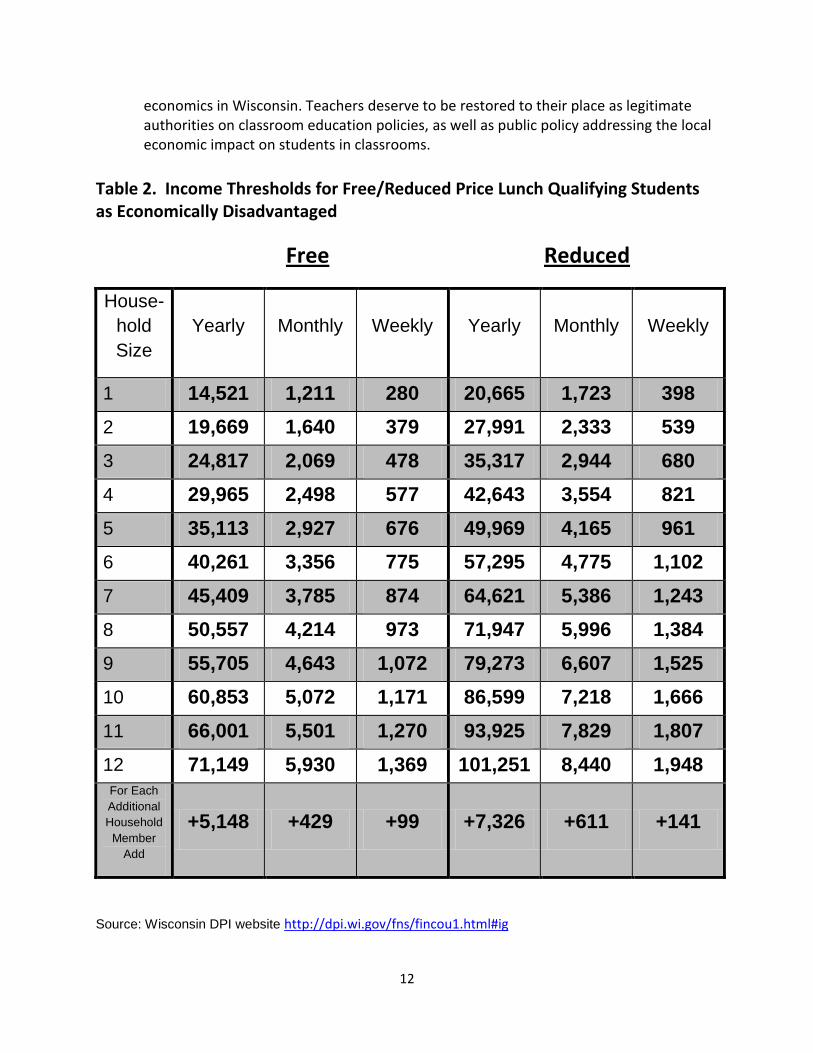
Table 2. Income Thresholds for Free/Reduced Price Lunch Qualifying Students as Economically Disadvantaged
Free Reduced
House-
hold
Size
Yearly Monthly Weekly Yearly Monthly Weekly
1 14,521 1,211 280 20,665 1,723 398
2 19,669 1,640 379 27,991 2,333 539
3 24,817 2,069 478 35,317 2,944 680
4 29,965 2,498 577 42,643 3,554 821
5 35,113 2,927 676 49,969 4,165 961
6 40,261 3,356 775 57,295 4,775 1,102
7 45,409 3,785 874 64,621 5,386 1,243
8 50,557 4,214 973 71,947 5,996 1,384
9 55,705 4,643 1,072 79,273 6,607 1,525
10 60,853 5,072 1,171 86,599 7,218 1,666
11 66,001 5,501 1,270 93,925 7,829 1,807
12 71,149 5,930 1,369 101,251 8,440 1,948 For Each
Additional
Household
Member
Add
+5,148 +429 +99 +7,326 +611 +141
Source: Wisconsin DPI website http://dpi.wi.gov/fns/fincou1.html#ig
13
Figure 1. Economically Disadvantaged Compared to Non-Economically
Disadvantaged Total Enrollment, 2001-2012
0
100000
200000
300000
400000
500000
600000
700000
800000
900000
1 2 3 4 5 6 7 8 9 10 11 12
Tota
l En
rollm
en
t
2001 - 2012
Economically Disadvantaged
Non-Economically Disadvantaged
Total
14
Figure 2. Fold Increase in Economically Disadvantaged Enrollment Compared to Fold Decrease in Non-Economically Disadvantaged Enrollment (Both Log Scale)
-0.2
-0.1
0
0.1
0.2
0.3
2001 2002 2003 2004 2005 2006 2007 2008 2009 2010 2011 2012
Fold
Incr
eas
e o
r D
ecr
eas
e F
rom
20
01
Bas
elin
e (
Log
Scal
e)
Disadvantaged Non-Disadvantaged
Linear (Disadvantaged) Linear (Non-Disadvantaged)

15
Figure 3. Distribution of Public and Charter School Report Card Scores
0 – 52.9 = Fails to meet expectations 53 – 62.9 = Meets few expectations
63 – 72.9 = Meets expectations 73 – 82.9 = Exceeds expectations
83 – 100 = Significantly exceeds expectations
0
5
10
15
20
25
30
35
0 5 10 15 20 25 30 35 40 45 50 55 60 65 70 75 80 85 90 95 100
Sco
re D
istr
ibu
tio
n a
s P
erc
en
t o
f To
tal
Report Card Score (Charter Mean = 66.7, Public Mean = 70.4)
Charter Public
16
Figure 4. Lower Report Card Scores Associated With Higher Percentage Economically Disadvantaged Enrollment, Stratified by Public and Charter Schools
y = -0.25x + 81 R² = 0.47
y = -0.37x + 85.45 R² = 0.44
0
10
20
30
40
50
60
70
80
90
100
0 10 20 30 40 50 60 70 80 90 100
Re
po
rt C
ard
Sco
res
Economically Disadvantaged Enrollment Percentage
Public Schools Charter Schools
Linear (Public Schools) Linear (Charter Schools)
17
Figure 5. Low Income Charter Schools Score Significantly Worse than Low Income Public Schools
Data plotted are mean Report Card scores stratified by income and public/charter schools, with standard deviations. High and Middle Income score differences between public and charter schools are not statistically significant, while the Low Income difference is significant.
0
20
40
60
80
100
High Income Middle Income Low Income
Re
po
rt C
ard
Sco
re
p = 0.29 (not significant) p = 0.22 (not significant) p < 0.0001 (significant)
Public Schools Charter Schools