Embed Size (px)
Citation preview

Wisconsin DOR's Interactive Data Visualizations
Bob SchmidtAdministrator
Division of Research and PolicyWisconsin Department of Revenue
Oct 9, 2018

Overview • Data Visualizations: Who/What/Why/How?• Concerns using new software – Moving from SAS and Excel to Tableau
• Examples and Demonstrations– Objectives– Process Improvement– Outcomes

Data VisualizationsWhat?• Interactive dashboards that let the users generate
the content they want from DOR data
Who?• By: DOR's Division of Research and Policy
– Staff of 14 charged with tax policy analysis– No dedicated staff for data visualizations
• For: The public, legislative staff, DOR staff, press, local officials, other agencies, researchers

Data VisualizationsWhy?• To increase access to commonly requested data, promote
transparency, and provide useful tools for public policy analysis
• It's not 1997 anymore– We have the tools (Tableau, Power BI, etc.)– We can do more than post PDFs and Excel Files
• Peer pressure -other states and organizations
How?• Tableau works for us, but plenty of options exist

Initial Concerns• Utilizing a new software tool
– Learning curve for analysts and customers– Backwards compatibility and software issues– Will Tableau be around in 5 years? 10 years?
• Taxpayer confidentiality– Current law and DOR policy preclude us from publishing
statistics for groups of 10 or fewer– Adds some work to tax return dashboards

Current State• 10 public facing dashboards• Seven analysts contributing• More "vizzes" in the works
– Individual Income Tax Data– Property Tax Rates Over Time– County Sales Tax Per Capita– Tobacco Products– Tax Expenditure Budget
• No formal training; learning from others and by experimenting
•Corporate Tax by Industry•Equalized Property Values•Local Gov. Dashboard•Motor Fuel Consumption•Police and Fire Fees•Sales Tax Distributions•Sales Tax by Industry•Tax Burden Rankings•Tax Revenue Since 1963•Wisconsin Exports

Equalized Property Values• One of our first interactive tools; it evolved from massive and
overly complicated excel files
Local Government Dashboard• Second-generation visualization; first tool designed
specifically for an outside "client" – State Budget Office
Sales Tax by Industry• Designed based on common questions from local gov.
officials, private sector, and internal audiences
Some Examples

Property Values• Previously available to the public in massive PDFs
– One municipality per page– Over 2,300 pages long (single year)– Data can extracted by DOR staff for analysis and
records/data requests in numerous formats• Comparisons across time and location require
multiple reports (#places x #years)

Property Values Then

Property ValuesObjectives: • On-Demand Analysis
– Allow comparisons of scale and change across municipal and county borders, by property class, over time
• Improve Access to Data– Make historical data, previously unavailable, accessible to
any/all interested parties • Increase DOR responsiveness
– Avoid assembling excel files and reports for the sake of answering ad-hoc requests
– Build a tool multipurpose tool

Property ValuesProcess flow and timing
• A single analyst can update the Excel file, Tableau database, and DOR website in a matter of hours
• No concerns over taxpayer confidentiality• Updates could be automated, eliminating the
need for the excel file
Equalization ProcessState and Local Finance Staff
(Months of Work)
DatabaseAug 15
Excel FileAug 15
Tableau& Website
Aug 15 or 16

Property Values Now
https://www.revenue.wi.gov/Pages/SLF/EqualizedValue.aspx


Local Gov. DashboardObjectives:• Mandate from the Governor• Initial budget of $150,000 and 1 position• Leverage existing tech, data, and staff to
create something modern and useful• Avoid new reporting requirements for local
governments

Local Gov. DashboardProcess flow and timing
• Municipal Finance Reports are processed in a decades-old mainframe system; a new system may allow for partial automation of process
Audit of Municipal Financial ReportsState and Local Finance Staff
(Months of Work)
Database and Summary Report
FinalizationJanuary X
Excel FileSame Day
Tableau& WebsiteSame Day
Other Data Sources

Local Gov. Dashboard
https://www.revenue.wi.gov/Pages/RA/Local-Government-Dashboard.aspx

Local Gov. Dashboard


Actual Cost: $0.00 | No Additional Staff

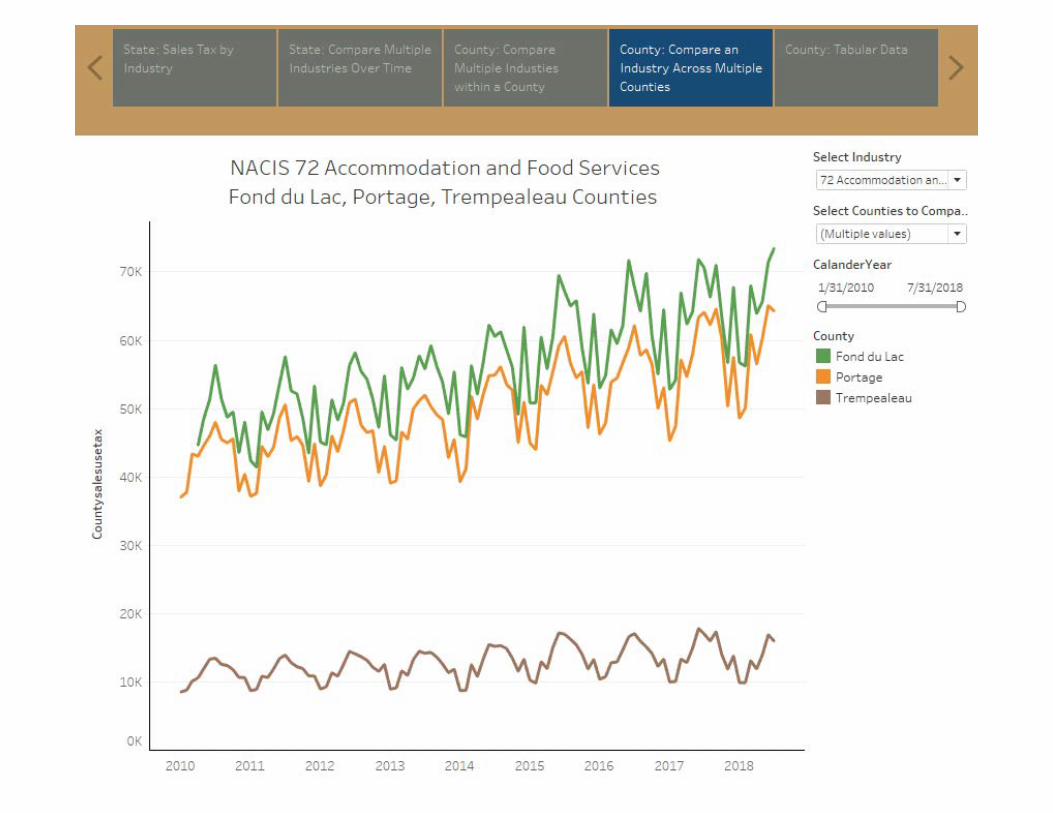
Sales Tax by IndustryObjectives:• Publish monthly sales tax data by industry and
geography (where possible)• Allow for some basic graphing and analysis• Protect Taxpayer Confidentiality– Statewide data: All 2-digit NAICS code– County data: Select 2-digit NAICS to avoid
disclosure issues (10 or fewer filers)

Sales Tax by Industry
https://www.revenue.wi.gov/Pages/RA/Sales-Use-Tax-Reported-by-Industry.aspx


Sales Tax by IndustryProcess flow and timing – January 1 transaction
Old Method (posting excel files)Suppression of confidential taxpayer data prevents us from pulling data directly into Tableau –we can't risk a mistake
Jan. Sales Tax ReturnDue Feb 28
Return Process/Late
ReturnsMarch 11
SQL OutputSame Day
Excel FileSame Day
Tableau& WebsiteSame Day
Web Team
2-3 Days

Data RequestsDOR WebsiteSocial Media
Getting the Word Out

Successes:ü Creation of more powerful data tools for internal/external useü Simple (in most cases) Interfaceü Low cost of implementationFuture Challenges:• Keep trying new visualizations• Automate where feasibleRisks:• Going too far – sometimes a simple spreadsheet is best• New normal – we need to be open to and ready for change• Software changes and contract issues
Final Thoughts

Contact:Bob Schmidt, Administrator
Division of Research and PolicyWisconsin Department of Revenue
Email: [email protected](608) 266-5773
Questions?


![Creating Interactive Visualizations for Twitter Datasets ...1211346/FULLTEXT01.pdf · Data-Driven Documents (D3) [15] is a JavaScript library to create interactive SVG visualizations](https://img.pdfslide.us/doc/110x75/5ec8fb64174e812a312c148f/creating-interactive-visualizations-for-twitter-datasets-1211346fulltext01pdf.jpg)