Embed Size (px)
Citation preview

Building Interactive Data Visualizations (with D3)
February 18th, 2015

Formerly
Questions? tweet @clearspandex

Formerly
Questions? tweet @clearspandex
+
Currently
Questions? tweet @clearspandex

Jonathan DinuDirector of Education, Galvanize
[email protected]@clearspandex
Questions? tweet @clearspandex
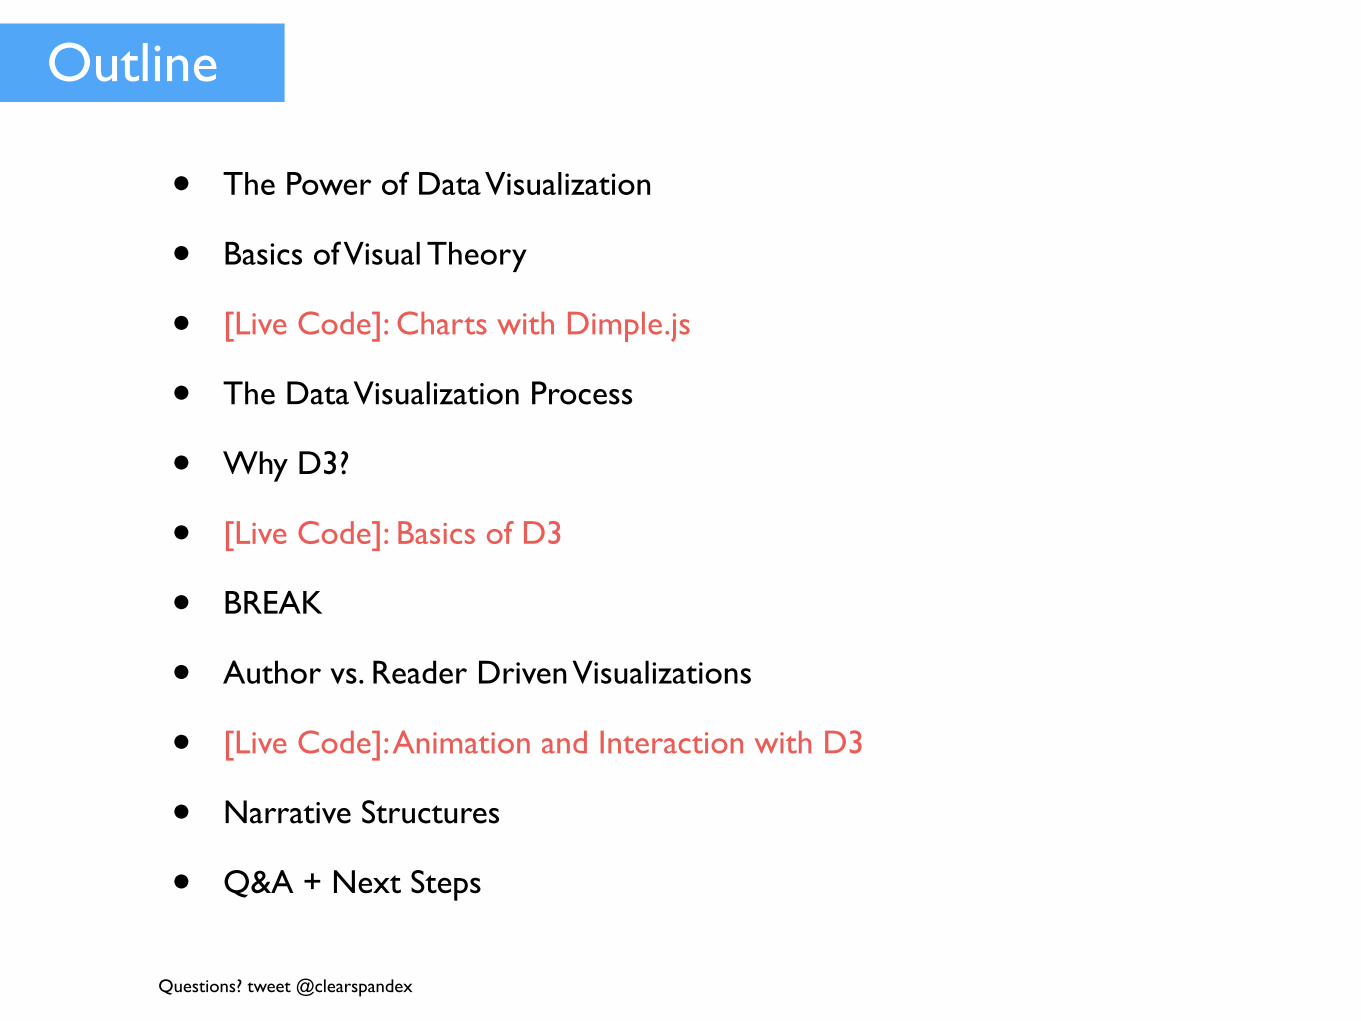
• The Power of Data Visualization
• Basics of Visual Theory
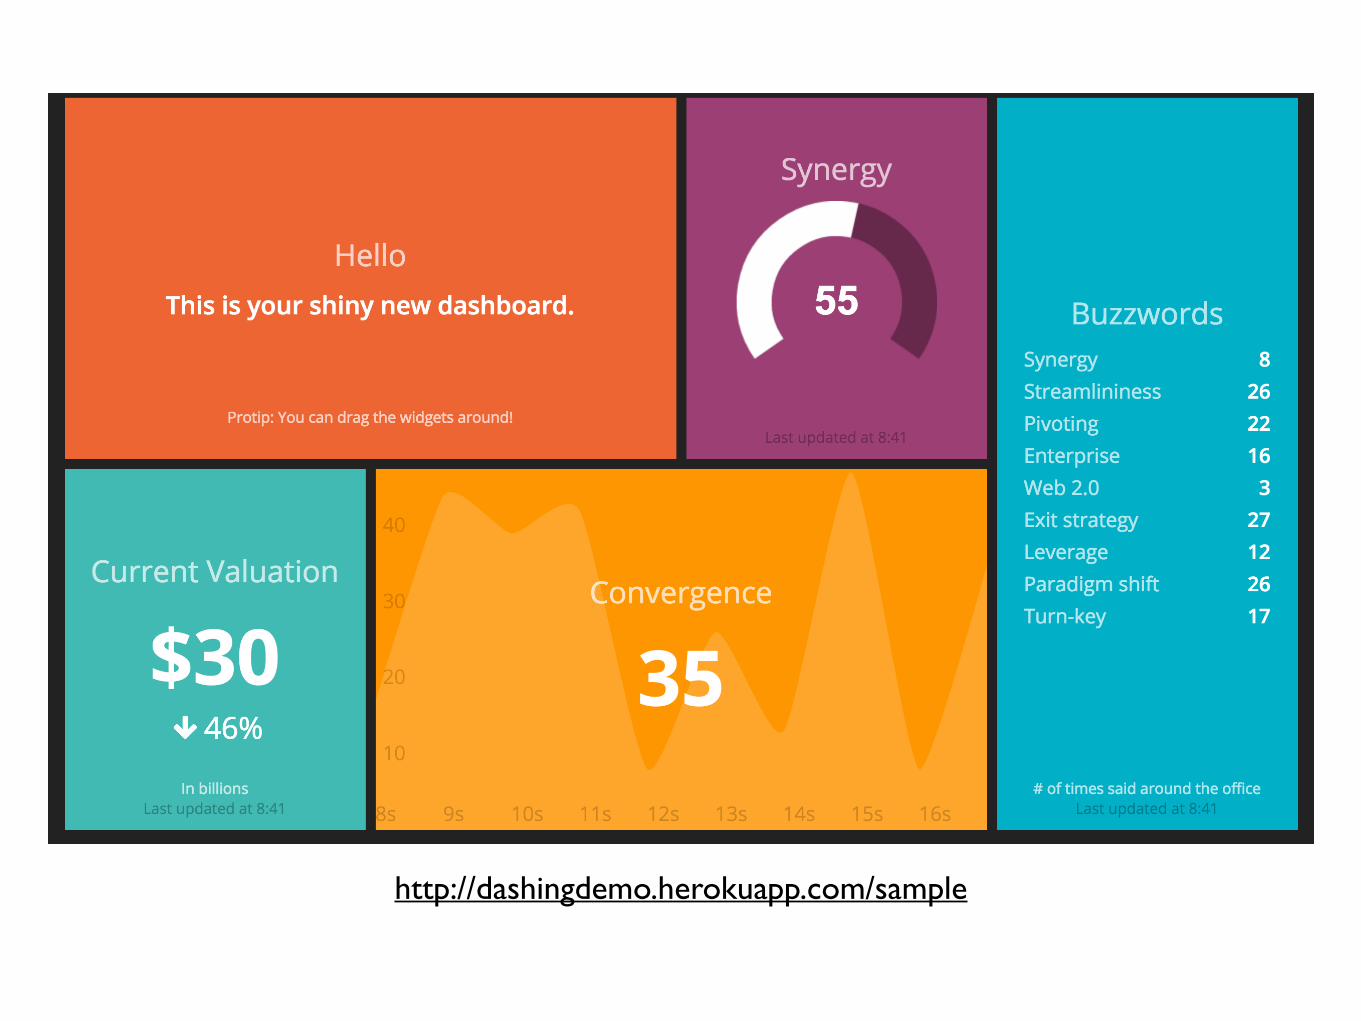
• [Live Code]: Charts with Dimple.js
• The Data Visualization Process
• Why D3?
• [Live Code]: Basics of D3
• BREAK
• Author vs. Reader Driven Visualizations
• [Live Code]: Animation and Interaction with D3
• Narrative Structures
• Q&A + Next Steps
Outline
Questions? tweet @clearspandex
Questions? tweet @clearspandex
The Power of Data Visualization

Questions? tweet @clearspandex
Graphical Excellence
“Excellence in statistical graphics consist of complex ideas communicated with clarity, precision, and
efficiency.”
-- Edward R. Tufte
Questions? tweet @clearspandex
Communication
“Your best insight is only as good as your ability to communicate it to others.”
-- Jonathan Dinu

http://www.facebookstories.com/stories/2200/data-visualization-photo-sharing-explosions
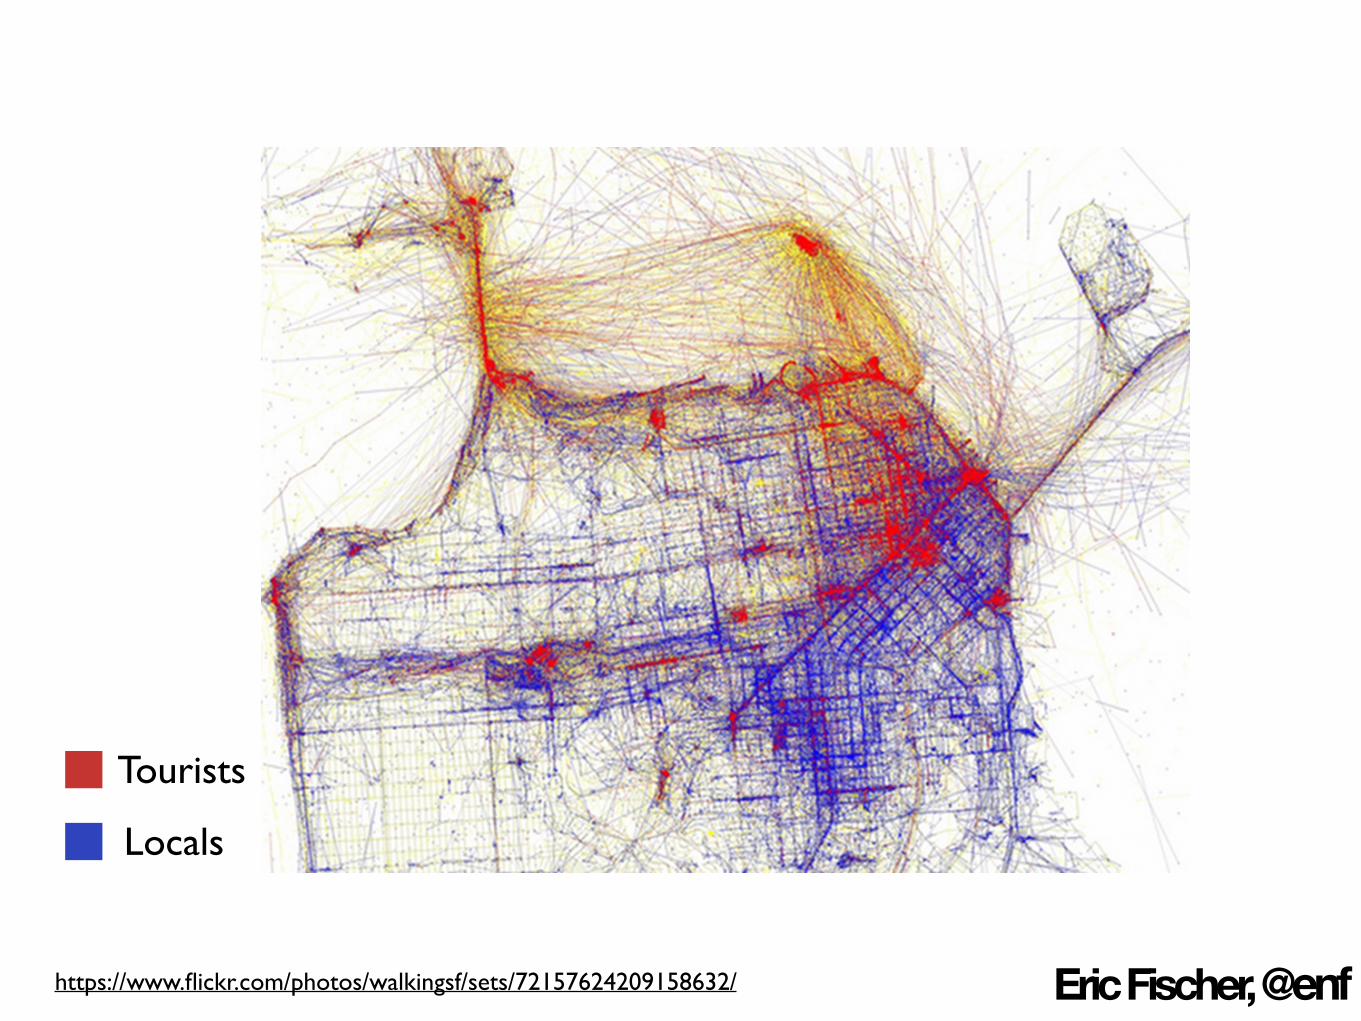
Eric Fischer, @enf
Tourists
Locals
https://www.flickr.com/photos/walkingsf/sets/72157624209158632/
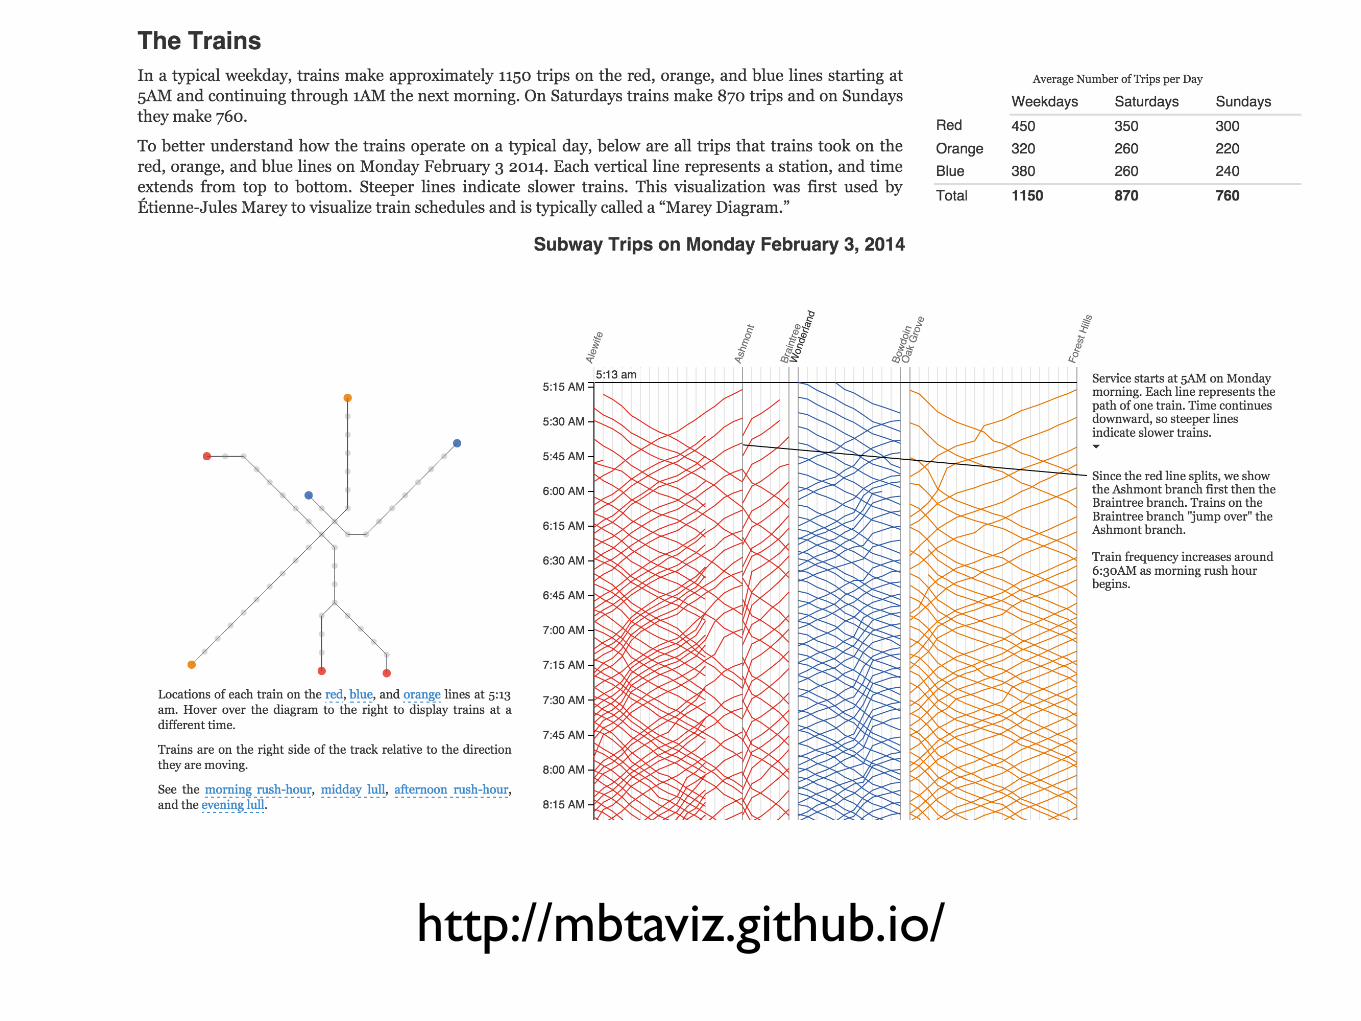
http://mbtaviz.github.io/

http://www.nytimes.com/interactive/2012/05/17/business/dealbook/how-the-facebook-offering-compares.html
Deconstructing a Data Visualization

Questions? tweet @clearspandex
Visual Encodings
Friday, July 18, 14

Questions? tweet @clearspandex
Friday, July 18, 14
http://extremepresentation.typepad.com/blog/2006/09/choosing_a_good.html

Questions? tweet @clearspandex
“Data graphics visually display measured quantities by means of the combined use of points, lines, a coordinate
system, numbers, symbols, words, shading, and color.”
-- Edward R. Tufte

Questions? tweet @clearspandex
• Add another city to chart (juxtaposition)• Change column visualized• Add scatter on top of line
LIVE CODE

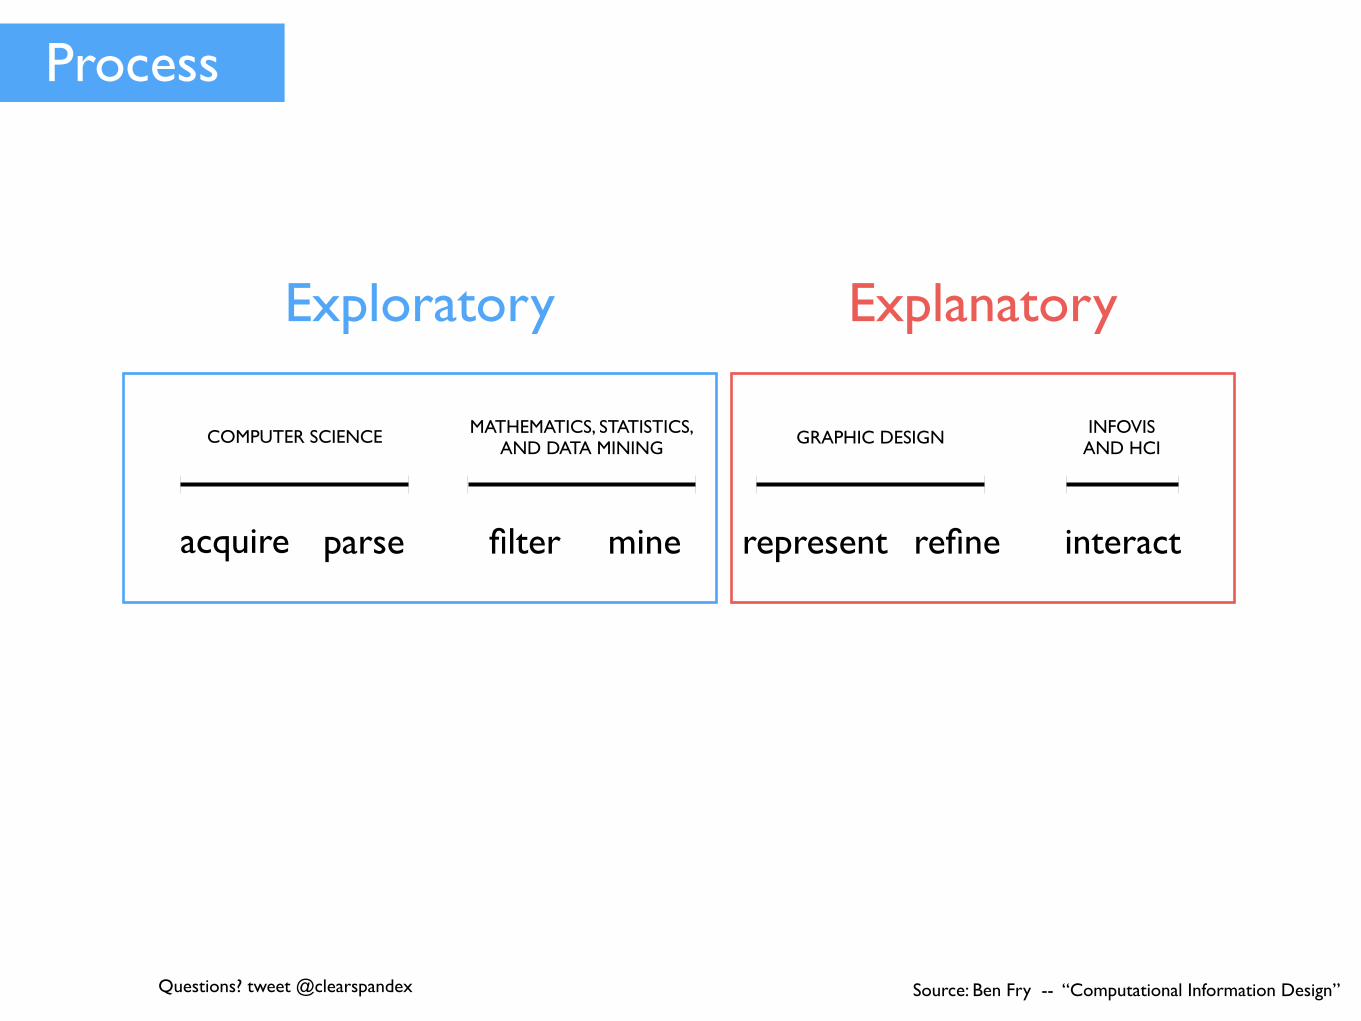
Process
Questions? tweet @clearspandex
COMPUTER SCIENCE INFOVISAND HCIGRAPHIC DESIGNMATHEMATICS, STATISTICS,
AND DATA MINING
acquire parse filter mine represent refine interact
Source: Ben Fry -- “Computational Information Design”
Process
Questions? tweet @clearspandex
COMPUTER SCIENCE INFOVISAND HCIGRAPHIC DESIGNMATHEMATICS, STATISTICS,
AND DATA MINING
acquire parse filter mine represent refine interact
Source: Ben Fry -- “Computational Information Design”
Exploratory Explanatory

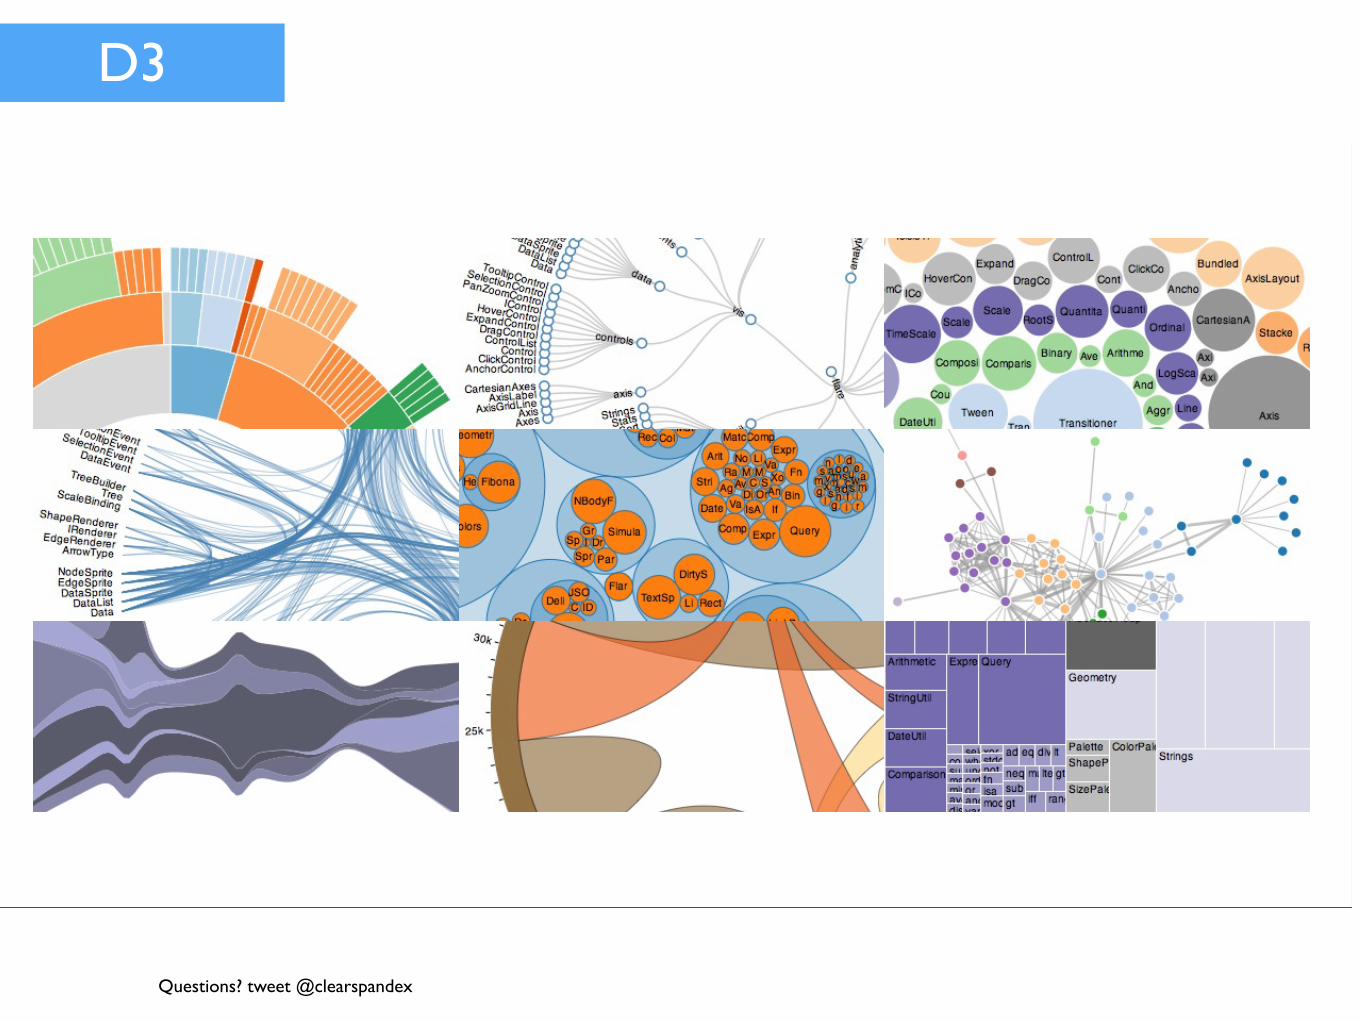
D3
Questions? tweet @clearspandex
Friday, July 18, 14
Friday, July 18, 14
Questions? tweet @clearspandex
D3
Questions? tweet @clearspandex
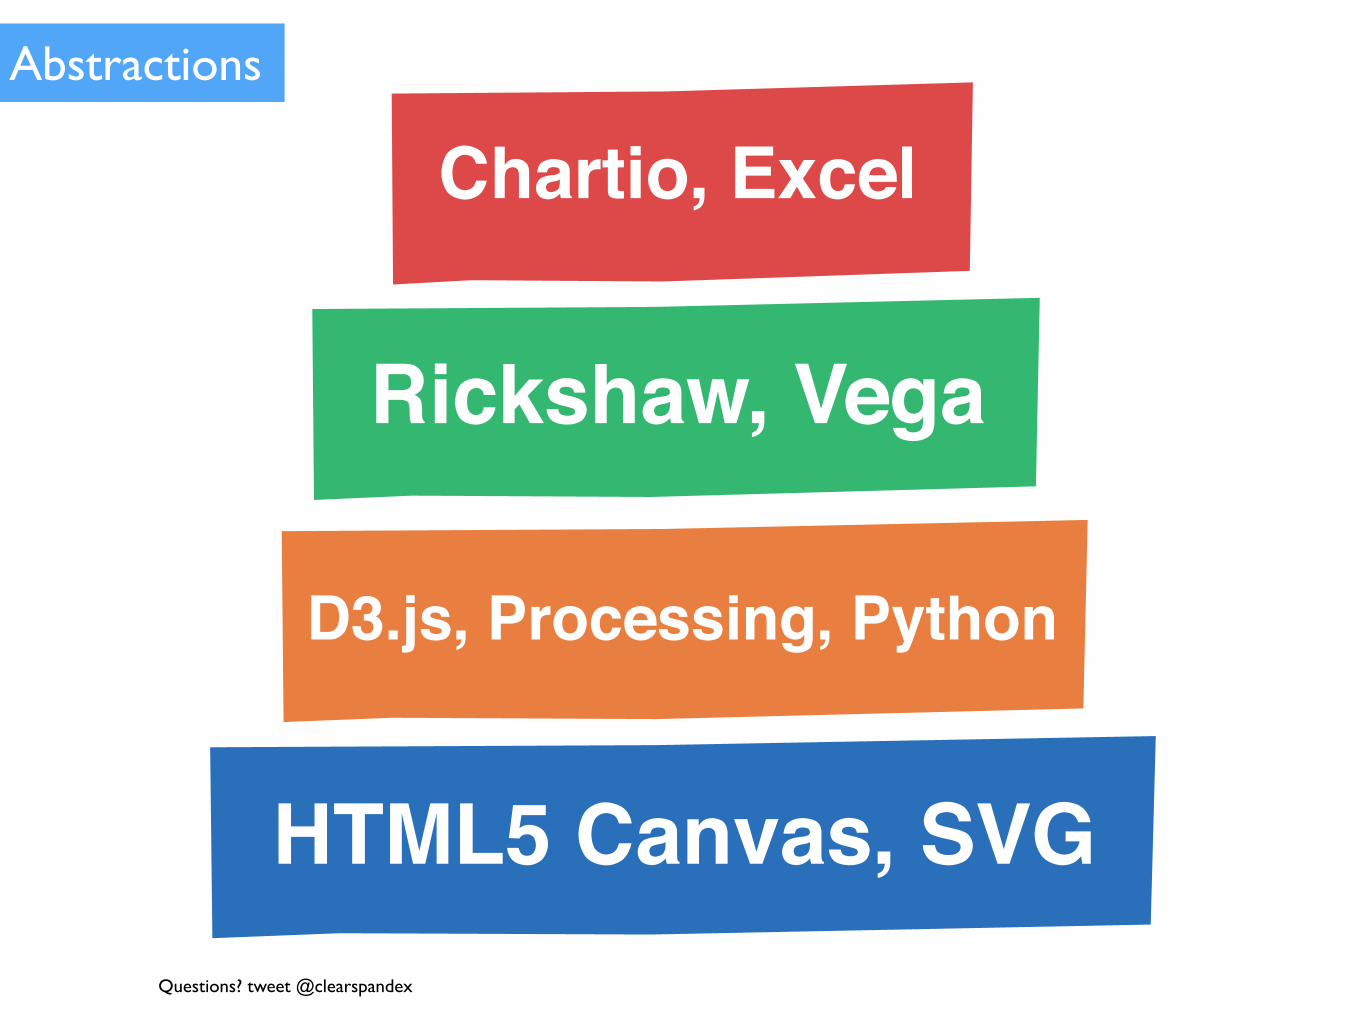
HTML5 Canvas, SVG
D3.js, Processing, Python
Rickshaw, Vega
Chartio, ExcelAbstractions
Questions?
Questions? tweet @clearspandex
Thank You!
Jonathan DinuDirector of Education, Galvanize
http://hopelessoptimism.com@clearspandex

Extra Slides
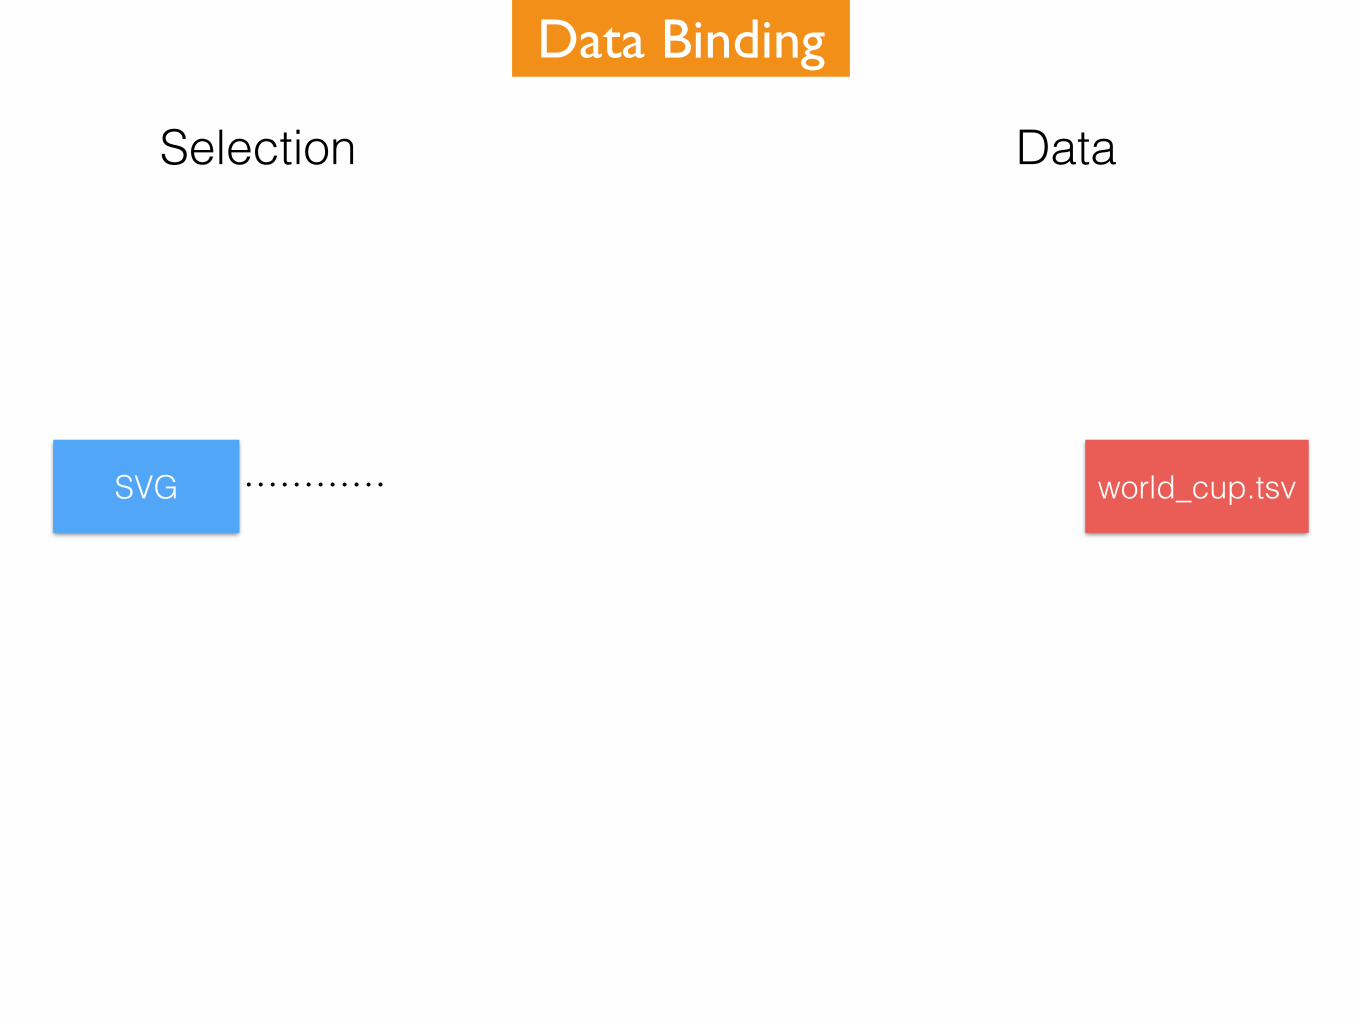
SVG
Selection Data
world_cup.tsv
Data Binding

SVG
Selection Data
world_cup.tsv
{ date: 27-5-1934 attendance: 25000 }
{ date: 27-5-1934 attendance: 16000 }
{ date: 31-5-1934 attendance: 23000 }
{ date: 31-5-1934 attendance: 12000 }
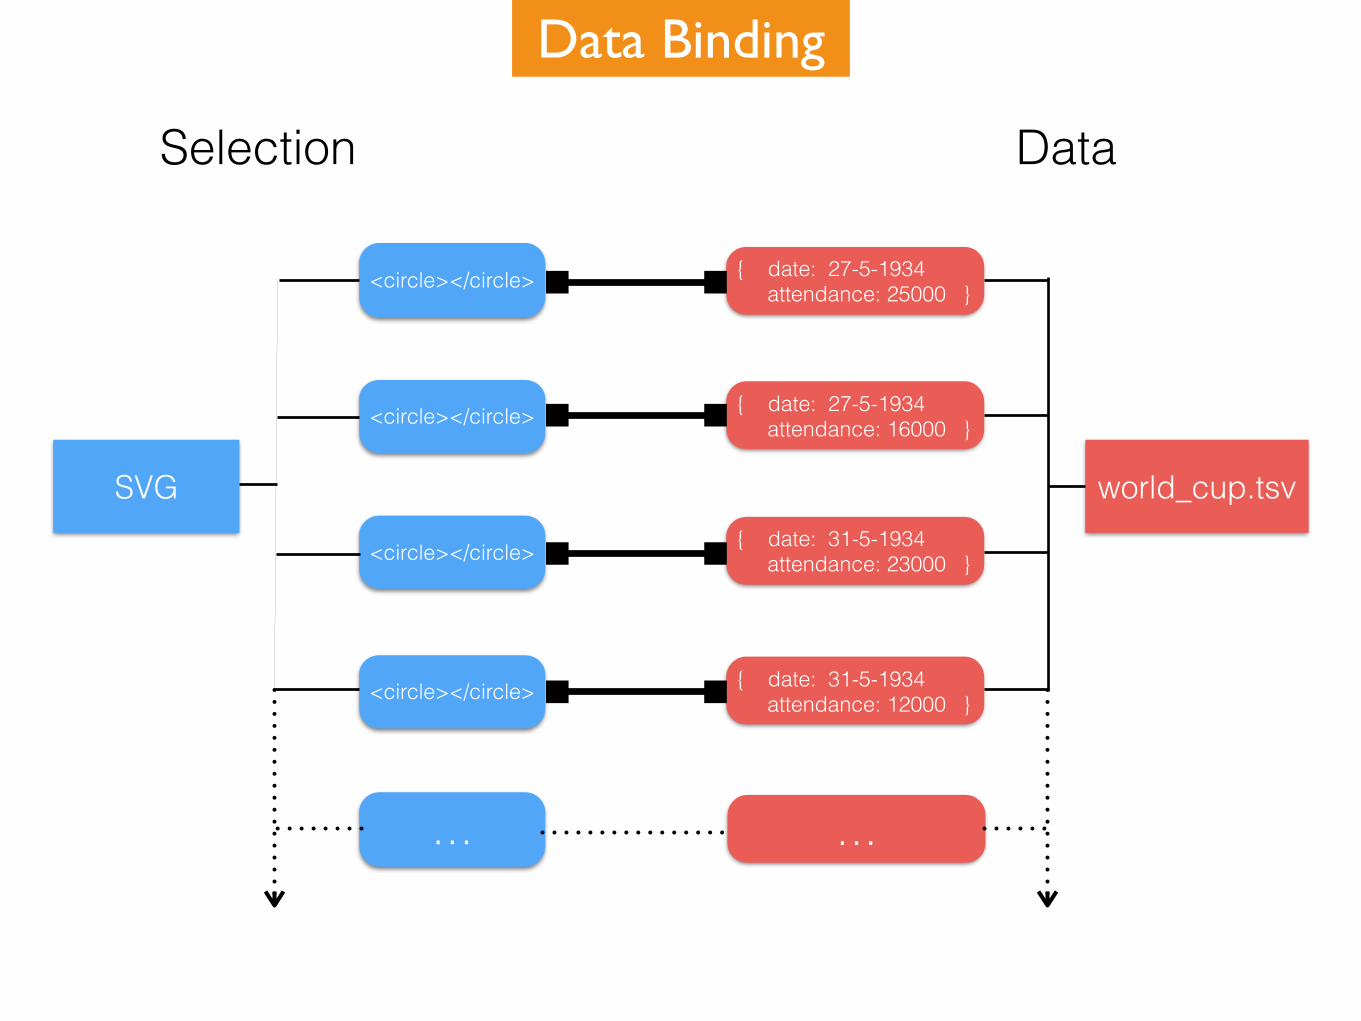
Data Binding

SVG
Selection Data
world_cup.tsv
{ date: 27-5-1934 attendance: 25000 }<circle></circle>
<circle></circle>
<circle></circle>
<circle></circle>
{ date: 27-5-1934 attendance: 16000 }
{ date: 31-5-1934 attendance: 23000 }
{ date: 31-5-1934 attendance: 12000 }
Data Binding
SVG
Selection Data
world_cup.tsv
{ date: 27-5-1934 attendance: 25000 }<circle></circle>
<circle></circle>
<circle></circle>
<circle></circle>
{ date: 27-5-1934 attendance: 16000 }
{ date: 31-5-1934 attendance: 23000 }
{ date: 31-5-1934 attendance: 12000 }
… …
Data Binding