Embed Size (px)
Citation preview
Sensors 2010, 10, 7236-7262; doi:10.3390/s100807236
sensors ISSN 1424-8220
www.mdpi.com/journal/sensors
Article
Wireless Sensor Network Deployment for Monitoring
Wildlife Passages
Antonio-Javier Garcia-Sanchez 1, Felipe Garcia-Sanchez
1,*, Fernando Losilla
1,
Pawel Kulakowski 2, Joan Garcia-Haro
1, Alejandro Rodríguez
3, José-Vicente López-Bao
3 and
Francisco Palomares 3
1 Department of Information and Communication Technologies, Technical University of Cartagena,
Campus Muralla del Mar, E-30202, Cartagena, Spain;
E-Mails: [email protected] (A.-J.G.-S.); [email protected] (F.L.);
[email protected] (J.G.-H.) 2 Department of Telecommunications, AGH University of Science and Technology, Al. Mickiewicza
30, 30-059 Krakow, Poland; E-Mail: [email protected] (P.K.) 3
Department of Conservation Biology, Estación Biológica de Doñana, CSIC, Avda. Américo
Vespucio s/n, E-41092, Sevilla, Spain; E-Mails: [email protected] (A.R.);
[email protected] (J.-V.L.-B.); [email protected] (F.P.)
* Author to whom correspondence should be addressed; E-Mail: [email protected];
Tel.: +34-968326537; Fax: +34-968325973.
Received: 1 February 2010; in revised form: 21 May 2010 / Accepted: 23 July 2010 /
Published: 3 August 2010
Abstract: Wireless Sensor Networks (WSNs) are being deployed in very diverse
application scenarios, including rural and forest environments. In these particular contexts,
specimen protection and conservation is a challenge, especially in natural reserves,
dangerous locations or hot spots of these reserves (i.e., roads, railways, and other civil
infrastructures). This paper proposes and studies a WSN based system for generic target
(animal) tracking in the surrounding area of wildlife passages built to establish safe ways
for animals to cross transportation infrastructures. In addition, it allows target identification
through the use of video sensors connected to strategically deployed nodes. This
deployment is designed on the basis of the IEEE 802.15.4 standard, but it increases the
lifetime of the nodes through an appropriate scheduling. The system has been evaluated for
the particular scenario of wildlife monitoring in passages across roads. For this purpose,
different schemes have been simulated in order to find the most appropriate network
OPEN ACCESS
Sensors 2010, 10
7237
operational parameters. Moreover, a novel prototype, provided with motion detector
sensors, has also been developed and its design feasibility demonstrated. Original software
modules providing new functionalities have been implemented and included in this
prototype. Finally, main performance evaluation results of the whole system are presented
and discussed in depth.
Keywords: wireless sensor network; simulation; tracking; wildlife monitoring
1. Introduction
Transportation infrastructures and other linear infrastructures are known to potentially have a
significant negative impact on animal wildlife [1]. Their effect is twofold. First, they reduce the size of
species populations as a consequence of road kills and the so-called edge effect, i.e., the reduction of
the population density in areas close to roads (due to animal aversion to the road system, human
activities, traffic noise or visual stimuli among others). Second, the movement of individuals between
populations fragmented by roads and other infrastructures may be reduced. This harmful effect, known
as barrier effect, may happen as a result of a physical impediment or, in the case of species with a more
complex nervous system, of a behavioral aversion. In any case, the generated division may have
demographical and genetic implications on the affected population. This is especially important for
highly endangered species with a reduced number of individuals, such as the Iberian lynx (Lynx
Pardinus), where inbreeding prompted by isolation may compromise the survival of the species.
In order to preserve wildlife populations, local exchange of animals must be allowed. Sometimes,
this could be achieved thanks to the use that some species make of drainage structures and other
passages not specifically designed for fauna [2,3] and, less frequently (because of their limited
number), of fauna specific passages.
Several factors have been found to modify usage rates of these passages [4-6]. Some of them stand
out such as the animal’s location relative to the preferred habitat for each taxon (animal group having
common ancestors). But, for some taxa, local conditions such as passage dimensions and land
conditions at the entrance of the passages (vegetation and level of human perturbation) are also
important [7]. It is therefore possible that a part of the passages are well-suited for a particular species
but a more or less considerable part of the individuals might be reluctant to use them due to local
conditions [8,9]. In this scenario it could be expected that more individuals were getting in the
surrounding area of the passages than the ones actually crossing.
There is, therefore, a need to estimate the efficiency of existing passages, establishing the
relationship between the number of animals making use of a certain passage and the number of them
deciding not to use it. Furthermore, knowledge about the paths followed by animals would also be
desirable in order to have a better understanding of animal reactions to wildlife passages. Both these
issues should be studied for different animal species, focusing on the relative effect of local conditions
versus the effect of those related to the landscape in passage surroundings. As a result, the most
appropriate locations for new artificial passages could be determined and the conditions of existing
Sensors 2010, 10
7238
ones could be improved to better address the needs of wildlife. Consequently, the effects of habitat
fragmentation could be reduced.
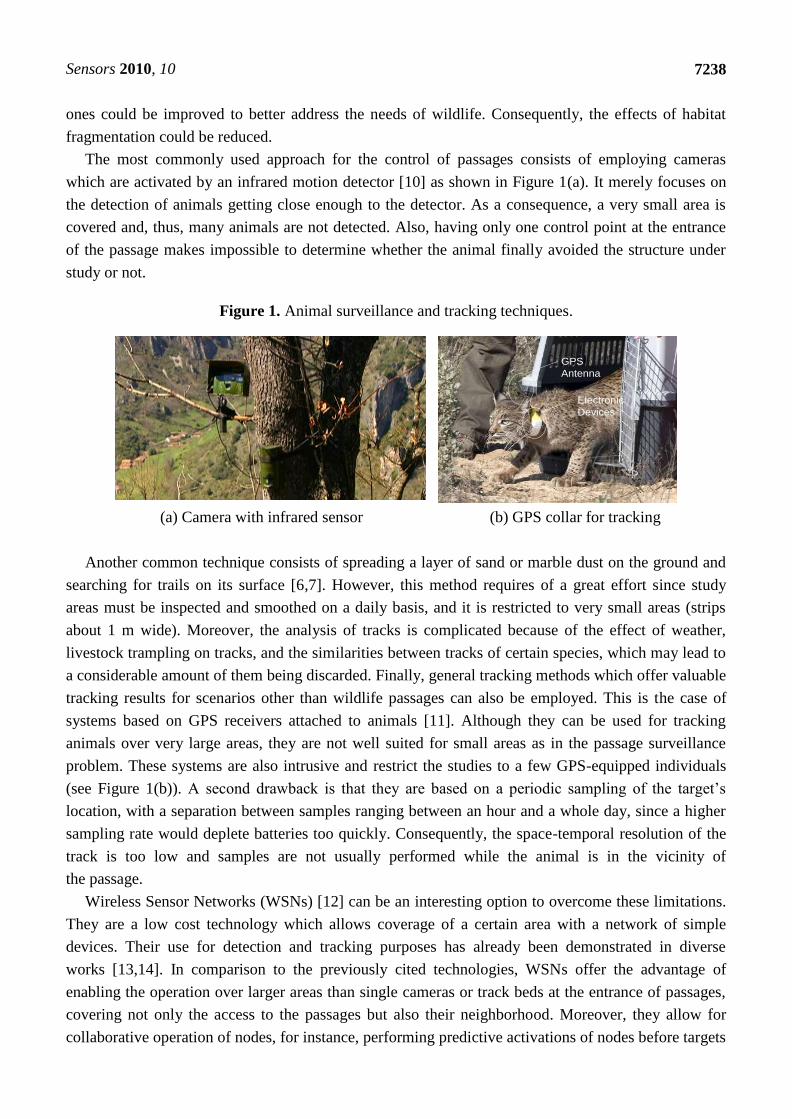
The most commonly used approach for the control of passages consists of employing cameras
which are activated by an infrared motion detector [10] as shown in Figure 1(a). It merely focuses on
the detection of animals getting close enough to the detector. As a consequence, a very small area is
covered and, thus, many animals are not detected. Also, having only one control point at the entrance
of the passage makes impossible to determine whether the animal finally avoided the structure under
study or not.
Figure 1. Animal surveillance and tracking techniques.
GPS
Antenna
Electronic
Devices
GPS
Antenna
Electronic
Devices
(a) Camera with infrared sensor (b) GPS collar for tracking
Another common technique consists of spreading a layer of sand or marble dust on the ground and
searching for trails on its surface [6,7]. However, this method requires of a great effort since study
areas must be inspected and smoothed on a daily basis, and it is restricted to very small areas (strips
about 1 m wide). Moreover, the analysis of tracks is complicated because of the effect of weather,
livestock trampling on tracks, and the similarities between tracks of certain species, which may lead to
a considerable amount of them being discarded. Finally, general tracking methods which offer valuable
tracking results for scenarios other than wildlife passages can also be employed. This is the case of
systems based on GPS receivers attached to animals [11]. Although they can be used for tracking
animals over very large areas, they are not well suited for small areas as in the passage surveillance
problem. These systems are also intrusive and restrict the studies to a few GPS-equipped individuals
(see Figure 1(b)). A second drawback is that they are based on a periodic sampling of the target’s
location, with a separation between samples ranging between an hour and a whole day, since a higher
sampling rate would deplete batteries too quickly. Consequently, the space-temporal resolution of the
track is too low and samples are not usually performed while the animal is in the vicinity of
the passage.
Wireless Sensor Networks (WSNs) [12] can be an interesting option to overcome these limitations.
They are a low cost technology which allows coverage of a certain area with a network of simple
devices. Their use for detection and tracking purposes has already been demonstrated in diverse
works [13,14]. In comparison to the previously cited technologies, WSNs offer the advantage of
enabling the operation over larger areas than single cameras or track beds at the entrance of passages,
covering not only the access to the passages but also their neighborhood. Moreover, they allow for
collaborative operation of nodes, for instance, performing predictive activations of nodes before targets
Sensors 2010, 10
7239
reach them [15,16]. They also can obtain more detailed tracks of targets inside the observed area than
the ones provided by GPS systems due to the use of a shorter sampling interval. But, more importantly,
they offer a less intrusive solution where animals are not required to carry electronic devices, which
also would restrict the study to a few individuals.
This paper proposes a WSN-based system to study animal behaviors in some crucial areas, with a
special interest in reactions to wildlife passage structures. It is composed not only of a camera at the
entrance of the passage, but also of a sensor network deployed in the surrounding area. All individuals
entering this area are tracked to check whether they make use of the passage or, on the contrary, refuse
to enter it. To the knowledge of the authors, this is the first application in the field that combines
photographic monitoring by sensor devices with tracking, which offers a better solution to the studied
problem. In the adopted approach, more than one camera is used to store pictures of detected animals,
even if they do not get close enough to the passage, providing information which can be used to
classify them according to their species and, in some cases, to identify them at the individual level.
From the WSN deployment point of view, this work presents a real WSN application where different
sensing capabilities (detection and photo capture) are integrated, scheduled and operate cooperatively,
exceeding widely the capabilities of the current tools [17].
The development of such a system in an area that is partially forested has raised several issues
which have been evaluated both through analysis and simulation. The presence of vegetation is one of
them, for which three different vegetation densities have been considered, ranging from 5
to 30 percents. Several node arrangements have also been tested in order to find an appropriate
distribution and behavior scheme of nodes, including square and hexagonal layouts (to cover the
maximum amount of land) as well as different operational cycles for nodes. Another important issue
which has been addressed is the inclusion of camera sensor nodes and the subsequent reduction in the
network lifetime. In order to tackle this problem several adaptations of current WSN systems (in
particular those based on the IEEE 802.15.4 standard [18]) have been developed, including the
enhancement of several application parameters, synchronization and medium access policies.
Regarding the implementation of the system, new software modules together with existing ones
have been implemented on top of hardware sensing platforms to which some special sensors have been
connected. For instance, a new software component has been developed to support the capture of color
pictures and therefore to overcome the limitations of current components restricted to black and white.
As regards the hardware devices, a new detector-node prototype for sensing the animals has been
designed and developed. Besides, because of their outdoor usage, these devices have been protected
from meteorological influences with an external casing.
The system is conceived for its deployment in areas with a radius of no more than a few tens of
meters, enough to track the directions and the speeds of targets moving around. It will be deployed at
selected passages in the Doñana National Park, in south-western Spain. This is a suitable environment
given the 200 km of roads in the 550 km2 of protected area, which houses many different animal
species, some of them threatened with extinction, such as the Iberian lynx. The Iberian lynx is of
special interest because of its high mobility through the landscape [19] and the increasing importance
of road casualties among its causes of mortality [20]. The designed WSN can provide new insights into
factors limiting species distributions and, thus, help in their study and conservation.
Sensors 2010, 10
7240
This proposed system is described in greater depth in the remaining part of this paper which is
organized as follows. Section 2 introduces the system with a special emphasis on the network devices.
Later, in Section 3, the WSN operation and a preliminary evaluation of its performance are described
in more detail. In Section 4 the system is evaluated through computer simulations. Section 5 presents
an in-place system deployment and, finally, conclusions and future directions of the investigation are
given in Section 6.
2. System Architecture and Technological Background
The following section gives an overview of WSNs and the technologies employed to control the use
of wildlife passages by the local fauna. For the proper functioning of this network several problems
must be addressed, including animal detection, classification and tracking their positions. To tackle
these problems, we propose a general architecture, which can be seen in Figure 2.
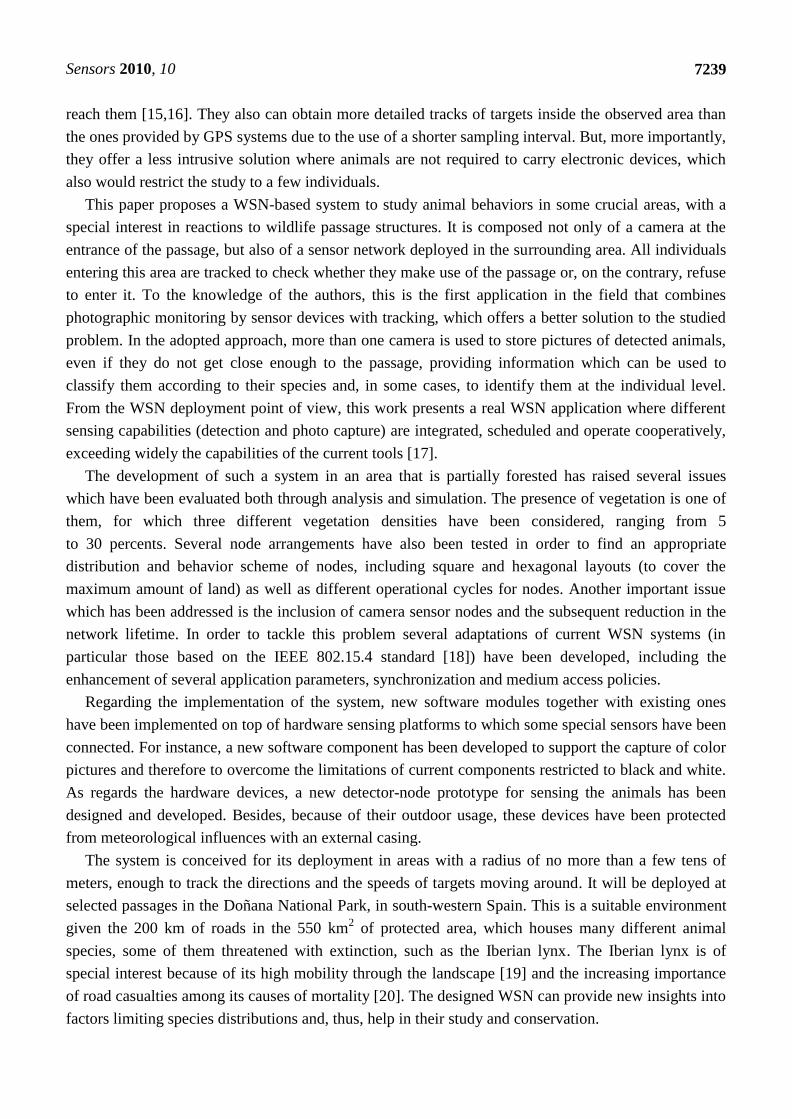
Figure 2. System architecture.
The Figure 2 shows a representative study area which covers the surroundings of a passage. To
analyze the behavior of animals, an area of 2.5 ha has been considered as appropriate. As stated in the
introduction, individuals entering this area may cross to the other side of the road through the passage.
It is interesting, then, to know the path and direction they followed. If, on the contrary, they do not
cross, their way out must also be stored.
The use of COTS (Commercial Off-The-Shelf) components is usual for the implementation of this
kind of systems. These devices provide a specific functionality and allow for the addition of new
Sensors 2010, 10
7241
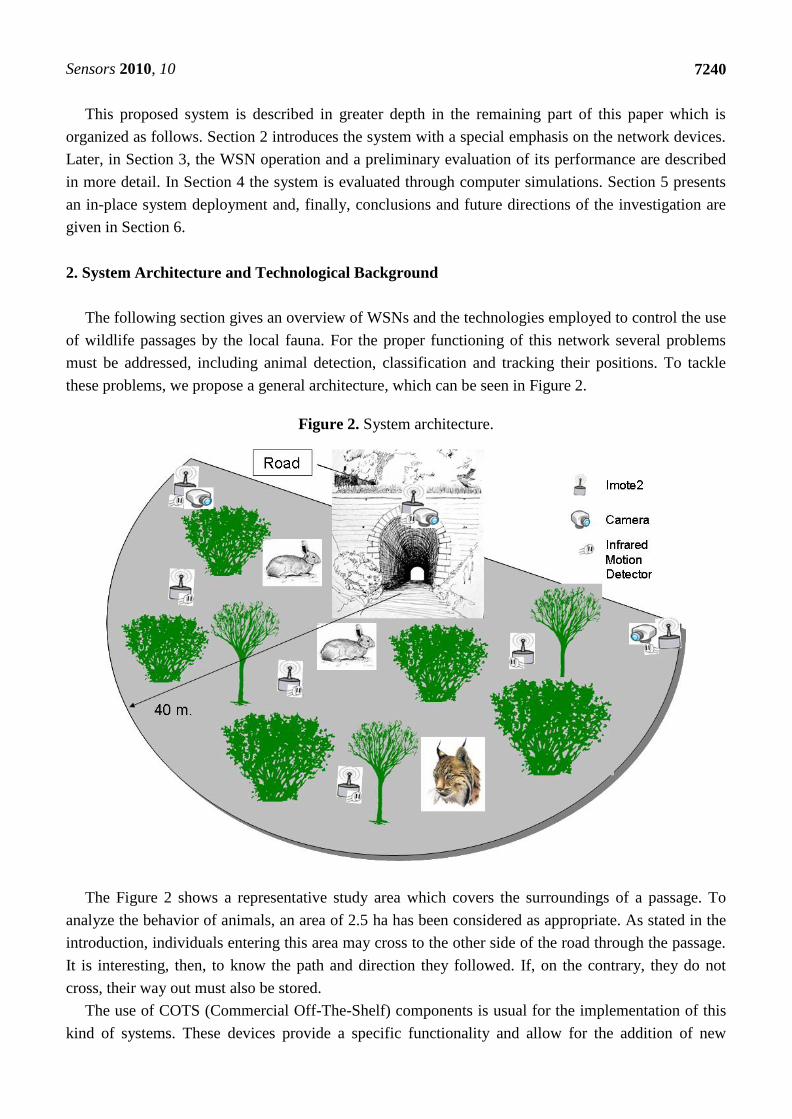
developments which may occur. For the deployment of the presented WSN a new hardware prototype
based on COTS components, called the detector node (shown in Figure 3), is proposed. A second
prototype, the camera node, in charge of the acquisition of photographs, has been built with the
available Imote2 technology. The former are low cost devices which are spread over the land at high
densities while the latter are slightly more expensive and less abundant nodes. Detection of targets is
carried out in all of these nodes by means of an infrared motion sensor (PIR), specifically a Panasonic
AMN41121 sensor [21]. Camera nodes, in addition, are in charge of gathering information for the
identification of targets with a camera sensor. As can be seen in Figure 2, three cameras nodes have
been placed in strategic positions in order to cover the largest patch of land with their camera sensors.
Figure 3. Hardware components. detector node.
Nodes are deployed throughout the area in order to achieve a detection and identification
probability quite close to 100%. For this purpose, two different network layouts will be examined in
the next section. According to them, nodes can be deployed either in a grid (square) layout or in a
hexagonal one. As it will be shown, this second layout allows coverage of a larger amount of terrain
with a smaller overlap between the detection areas of the nodes (and, potentially, a smaller number of
packet collisions when nodes attempt to access the radio channel for transmission). In addition, to
reduce power consumption, several operational schemes will also be tested. These will include
different sleep/wake cycles for the nodes, which for the considered speed of incoming animals should
still work properly.
Once a target is detected, nodes send a message to the camera nodes placed on top of the passage
where it is stored. The message is sent by using a one-hop transmission mechanism, which is
appropriate given the considered dimensions of the observation area. This information is no longer
forwarded to, for example, a base station, since real-time reaction to events is not required. On the
contrary, a storage device is connected to this camera node and an operator of the Doñana National
Park is in charge of downloading its content to a PC computer. At a later stage, data are processed and
analyzed by the users of the system.
Both types of nodes, detector and camera nodes, are based on the Imote2 sensor node platform [22]
produced by Crossbow. This hardware has been carefully selected among different current market

Sensors 2010, 10
7242
alternatives. Imote2 is a wireless sensor network device especially designed to develop applications
that need reliable wireless connections and high CPU requirements (for instance, multimedia
applications). Its main components are:
Marvell PXA271 XScale® Microprocessor CPU at 13–416 MHz that implements the different
operation modes (Deep Sleep, Sleep, Standby, Idle, etc.).
Wireless Coprocessor MMX DSP for accelerating multimedia operations.
256 KB SRAM, 32 MB FLASH, 32 MB SDRAM.
TI® CC2420 2.4 GHz radio module, transmission bitrate 250 kbps.
A high number of I/O ports. The presence of camera and PIR ports are remarkable.
The Imote2 mainboard is the main component of a modular platform consisting of a battery board,
which provides the energy for all the node operations, as well as several sensor boards that are
connected through different interfaces. The battery is composed by 3 AA NiMH rechargeable cell units
delivering 3,200 mAh. All the elements are contained in a watertight case with IP 67 protection. This
degree of protection is adequate for variable meteorological conditions. In particular, it offers a solar
and wind shield.
The movement detector nodes have been developed by the authors using the Imote2 mainboard.
These devices are formed by an ITS400CA [23] acquisition board and a PIR sensor. The ITS400CA is
a board provided by Crossbow which allows the user to add new sensors to the Imote2 mainboard. To
this end, the ITS400CA has Analog-To-Digital (ADC) converters with four analog channels (12-bit
digital output). The PIR sensor [21] provided by Panasonic has been selected for its low power
consumption and cost, as also for its high resolution and range (sensing range of 5 meters and a
detection angle of 120º). Its reduced power consumption (only 46 µA of the standby current) is
minimal in comparison to the rest of the subsystems of the mote. This is the reason why the PIR sensor
is not included in the power consumption of the hardware components of the nodes shown in Table 1.
The camera nodes are composed of the Imote2 mainboard, the battery board and the Imote
Multimedia Sensor board (IMB400 [24]). The IMB400 is composed, in turn, of the PIR and camera
sensors among others. The PIR sensor is the same as described for the movement detector nodes. The
OV7670 image sensor is a low voltage CMOS sensor that provides, in a small footprint package, the
full functionality of a color image video camera along with an image processor. Furthermore, some of
the most remarkable camera features are its resolution (640 480) and angle of view (90º). Both
sensors (camera and PIR) work in coordination with the Imote2 Multimedia Board. When the Passive
InfraRed (PIR) sensor detects a movement, the IMB400 activates the camera, allowing for low-power
operation when no presence is sensed.
Finally, the power consumption values of the Imote2 [25], which will be used in the following
section for calculating the lifetime of both the detector and camera nodes, are given. Table 1 shows
several energy consumption modes for these devices as a function of the state of each of the Imote2
hardware components, in particular the PXA271 CPU, CC2420 radio transceiver and OV7670 camera.
The different modes are the following. In the S0 mode, the CPU and clock resources are turned off.
When the nodes are in the S1 mode, the CPU is fully operative (e.g., processing of the detection of an
animal or an image capture) but the radio transceiver is not active. S2 and S3 are the reception and
transmission energy modes, respectively. In addition, the Imote2 needs extra power for changing its

Sensors 2010, 10
7243
operational mode. Cp is the power required for the transition between the S0 and S1 modes in order to
wake up the CPU. CR is the energy cost for waking up the radio transceiver and represents the energy
employed for the transition from the S1 mode to S2 or S3.
Table 1. Values of power-consumption of Imote2 when hardware works jointly.
3. System Operation and Preliminary Analysis
Following the scenario proposed in Section 2, a WSN consisting of a variable number of detector
nodes n along with the three camera nodes is considered. This system is in charge of recording the
behavior of animals approaching the passage. Those crossing the passage are supposed to be tracked
by a similar (symmetrical) WSN placed at the other side of the passage. Conversely, the studied
network will also be able to track animals coming through the opposite side of the passage. Going into
further detail, the basic operation of the system can be described as follows:
1. Nodes periodically sample their sensing coverage area. This sampling period is fixed, allowing
for a scheduled sleep time between samples (thus, saving energy).
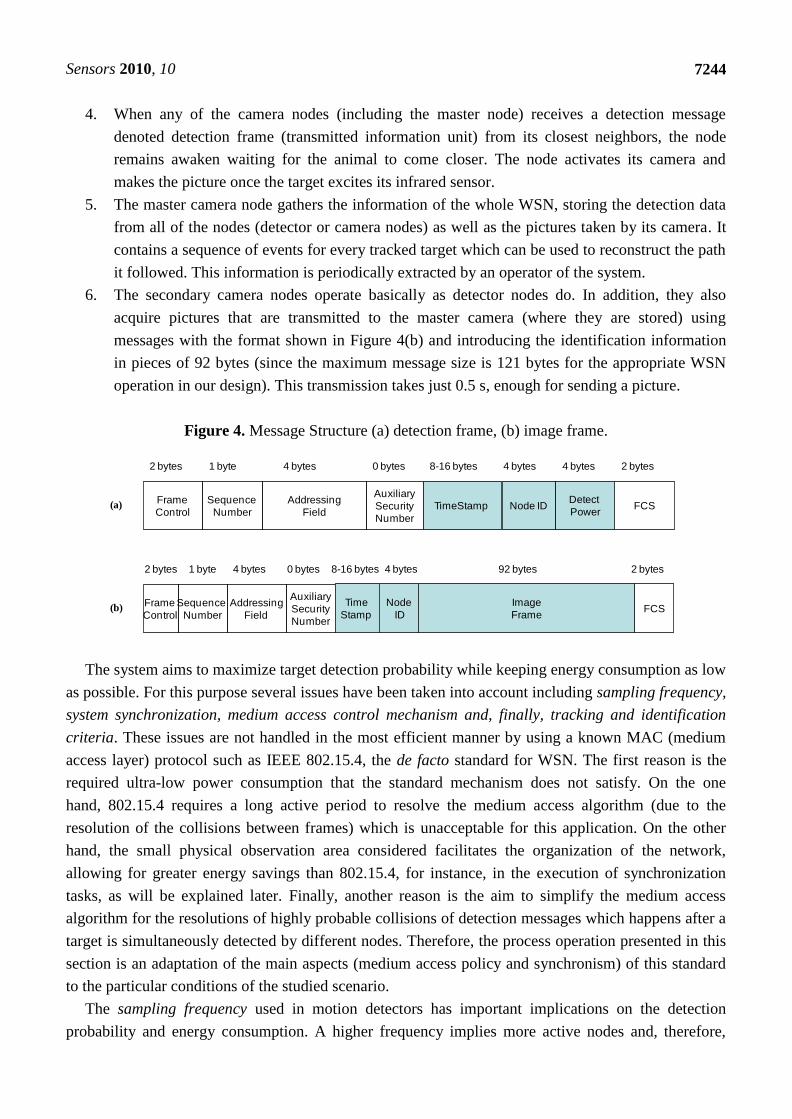
2. When a node detects a target, it originates a message that is transmitted (broadcast) to the
master node using a one-hop scheme. The rest of neighbor nodes also receive this message. The
structure of the sent message is shown in Figure 4(a), which includes a timestamp, the identifier
of the node and other details about the detection intensity. On the contrary, if during an active
period no target is detected by a node it remains in reception mode, waiting for notifications
from other nodes.
3. There is a small probability that the detection message does not arrive properly to the master
node due to the losses and distortions in the wireless communication channel. Therefore, some
of the neighbor nodes of the master camera node (at the entrance of the passage) forward the
detection message to the master node. In case when the detection message had already arrived
properly to the master node it is simply discarded. After completing the detection, the node that
has detected the target as well as those not involved in transmission/reception of the detection
message go to sleep.
Mode PXA271 -
CPU
CC2420 - Radio
module
OV7670 -
Image sensor Total
S0 (Deep-Sleep) 1.8 mW 144 nW 60 μW 1.86 mW
Cp 48.63 mJ
252 msec.
-
-
691 pJ
970 μsec
48.63 mJ
253 msec.
S1 (Normal) 193 mW 712 μW 60mW 253.71 mW
CR -
-
-
-
6.63 μJ
194 μsec
6.63 μJ
194 μsec
S2 (Receive) 193 mW 78 mW 60 mW 331 mW
S3 (Transmit) 193 mW 78 mW 60 mW 331 mW
Sensors 2010, 10
7244
4. When any of the camera nodes (including the master node) receives a detection message
denoted detection frame (transmitted information unit) from its closest neighbors, the node
remains awaken waiting for the animal to come closer. The node activates its camera and
makes the picture once the target excites its infrared sensor.
5. The master camera node gathers the information of the whole WSN, storing the detection data
from all of the nodes (detector or camera nodes) as well as the pictures taken by its camera. It
contains a sequence of events for every tracked target which can be used to reconstruct the path
it followed. This information is periodically extracted by an operator of the system.
6. The secondary camera nodes operate basically as detector nodes do. In addition, they also
acquire pictures that are transmitted to the master camera (where they are stored) using
messages with the format shown in Figure 4(b) and introducing the identification information
in pieces of 92 bytes (since the maximum message size is 121 bytes for the appropriate WSN
operation in our design). This transmission takes just 0.5 s, enough for sending a picture.
Figure 4. Message Structure (a) detection frame, (b) image frame.
Frame
Control
Sequence
Number
Addressing
Field
Auxiliary
Security
Number
TimeStamp FCS
2 bytes 1 byte 4 bytes 0 bytes 8-16 bytes 2 bytes
Node IDDetect
Power
4 bytes 4 bytes
Frame
Control
Sequence
Number
Addressing
Field
Auxiliary
Security
Number
Time
Stamp FCS
2 bytes 1 byte 4 bytes 0 bytes 8-16 bytes 2 bytes
Node
ID
Image
Frame
4 bytes 92 bytes
(a)
(b)
The system aims to maximize target detection probability while keeping energy consumption as low
as possible. For this purpose several issues have been taken into account including sampling frequency,
system synchronization, medium access control mechanism and, finally, tracking and identification
criteria. These issues are not handled in the most efficient manner by using a known MAC (medium
access layer) protocol such as IEEE 802.15.4, the de facto standard for WSN. The first reason is the
required ultra-low power consumption that the standard mechanism does not satisfy. On the one
hand, 802.15.4 requires a long active period to resolve the medium access algorithm (due to the
resolution of the collisions between frames) which is unacceptable for this application. On the other
hand, the small physical observation area considered facilitates the organization of the network,
allowing for greater energy savings than 802.15.4, for instance, in the execution of synchronization
tasks, as will be explained later. Finally, another reason is the aim to simplify the medium access
algorithm for the resolutions of highly probable collisions of detection messages which happens after a
target is simultaneously detected by different nodes. Therefore, the process operation presented in this
section is an adaptation of the main aspects (medium access policy and synchronism) of this standard
to the particular conditions of the studied scenario.
The sampling frequency used in motion detectors has important implications on the detection
probability and energy consumption. A higher frequency implies more active nodes and, therefore,
Sensors 2010, 10
7245
improves the detection probability. Nevertheless, it negatively impacts on energy consumption. Two
factors have been considered to find the appropriate sampling frequency: the sensing coverage of
nodes and the predicted movement of targets. The employed AMN sensor family allows detection up
to 3, 5 or 10 meters, depending on the selected type of sensor. The second factor, the movement of
animals, in opposition, is unpredictable. However the speed of targets is typically limited to 1 m/s. For
the presented scenario, values ranging from 0.3 m/s to 1m/s have been considered. The faster of these
values determines the sampling frequency of the nodes. Assuming a detection area of 5 meters, moving
targets at 1 m/s can be detected by a single node with a 0.5 probability (improving for slower targets).
This value is good enough since many nodes are performing detection and not necessarily all of them
have to detect the target.
The use of a periodical sampling also affects the communication between nodes. In the designed
system all nodes wake up simultaneously to perform detection, transmission/reception (if necessary)
and go to sleep again. This operation mode, known as schedule-driven [26], helps communication
mechanisms, but requires the synchronization of all nodes in the network. In WSN where
synchronization is needed (i.e., IEEE 802.15.4 networks in beacon-enabled mode [18]), the most
commonly employed method consists of transmitting a signaling frame (a communication message
without useful information) called beacon to all of the nodes. The beacon is a dedicated frame which
contains no application data and informs about the length of the transmission, reception and sleep
periods. The repetitive transmission of this frame facilitates node synchronization but increases the
power consumption.
Different protocols such as the B-MAC [27], solve the synchronization issue including long beacon
frames denoted as preambles that are transmitted whenever a node is out of synchronization, wasting
extra energy. For the proposed system, it was decided to use the frame containing the detection
message itself for the synchronization purpose. The purpose of this decision is to achieve an ultra-low
power consumption, decreasing the number of messages sent (by omitting beacons and preambles
frames) and preserving synchronization. Therefore, every time a target is detected the entire network is
synchronized. This is feasible since, in the presented WSN, active and sleep periods are invariable and
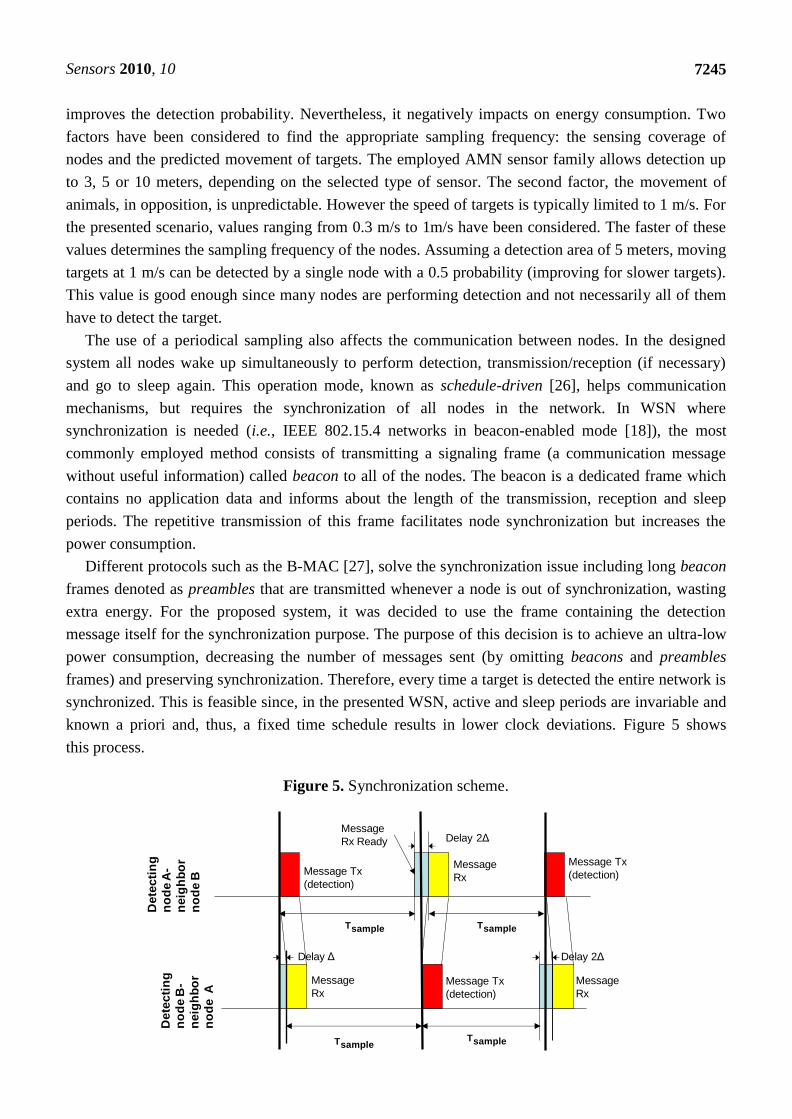
known a priori and, thus, a fixed time schedule results in lower clock deviations. Figure 5 shows
this process.
Figure 5. Synchronization scheme.
Message Tx
(detection)
De
tec
tin
g
no
de
A-
ne
igh
bo
r
no
de B
Delay 2Δ
Message Tx
(detection)
Delay Δ
Tsample
Message
Rx
Message Tx
(detection)
Message
Rx Ready
Delay 2Δ
Message
Rx
Message
Rx
Dete
cti
ng
no
de
B-
ne
igh
bo
r
no
de
A
Tsample
TsampleTsample

Sensors 2010, 10
7246
Node A sends a detection message to the master node which is heard by all neighbor nodes,
including node B, after a delay (Δ) caused by the radio propagation, the hardware operation, etc. In this
moment neighbor nodes are automatically synchronized. The process results in a slight deviation of the
beginning of the sampling period which does not affect the system operation.
This technique is quite useful in small size networks. However, a first synchronization must be
performed when the WSN is started since, initially, nodes are unconnected and unsynchronized. The
way this is performed is simple: nodes are continuously monitoring the radio channel until they receive
a “hello” frame from the master node (it is periodically transmitted during the synchronization phase).
Upon reception of the frame, nodes send back acknowledgements to the master node. When none of
these acknowledgements is transmitted during a period of one minute the synchronization phase
finishes and the WSN starts its basic operation as described at the beginning of this section. This
“hello” frame is also transmitted when the master camera node does not receive any data information
for a long time, around one hour. It helps to maintain the whole network constantly synchronized.
Synchronized nodes may attempt transmitting at the same time, competing for the medium access.
This issue can be solved with the CSMA-CA (Carrier Sense Multiple Access-Collision
Avoidance) [28] as the IEEE 802.15.4 standard does. In contrast to other medium access policies, this
mechanism allows for fast deployment of new nodes without any network re-design (good scalability).
CSMA-CA is based on the calculation of backoff periods. The duration of each backoff period is
of 20 symbols (320 µsec. in the 2.4 GHz band). When a frame is transmitted, it may begin at the start
boundary of the next backoff period [27], and it waits for a transmission according to the
following delays:
The CSMA-CA scheme determines a delay based on a random value of backoff periods.
The random value scales from 0 to 2BE
-1. As stated by different works [28,29], the BE,
called backoff exponent, is an exponential value ranging between 3 and 5.
In two consecutive attempts, the CCA (Clear Channel Assessment) mechanism listens to the
channel to be ensured the medium is free.
Once the CCA scheme senses the channel free, the node transmits the frame, then it must wait for a
time called interframe spacing to deliver the next frame. If the physical medium is busy, the
CSMA-CA channel access procedure is executed again with the node increasing the backoff exponent.
After two attempts, if the channel continues busy, the frame is discarded. Figure 6 shows this process.
In the proposed system, the CSMA-CA algorithm is partially applied. The active period of the system
including the CSMA-CA operation is limited to 10 msec. which allows for a packet transmission and,
at most, two potential subsequent attempts (pure CSMA-CA performs five attempts by
default [18]). This truncated algorithm has been chosen as a compromise between energy consumption
and physical detection probability. The pure CSMA-CA algorithm might resolve the medium access
system through its competitive mechanism and its repetitive attempts, but it also increases the
operation time in a considerable amount (and consequently the power consumption) in comparison to
the reduced active period of the system. However, the use of such a small active period with
CSMA-CA has also an undesired effect: frames may be lost due to collisions. These collisions may
occur either when two sensors detect simultaneously the same target or when several nodes detect
different targets (less likely to happen). However, the backoff algorithm offers a high probability of
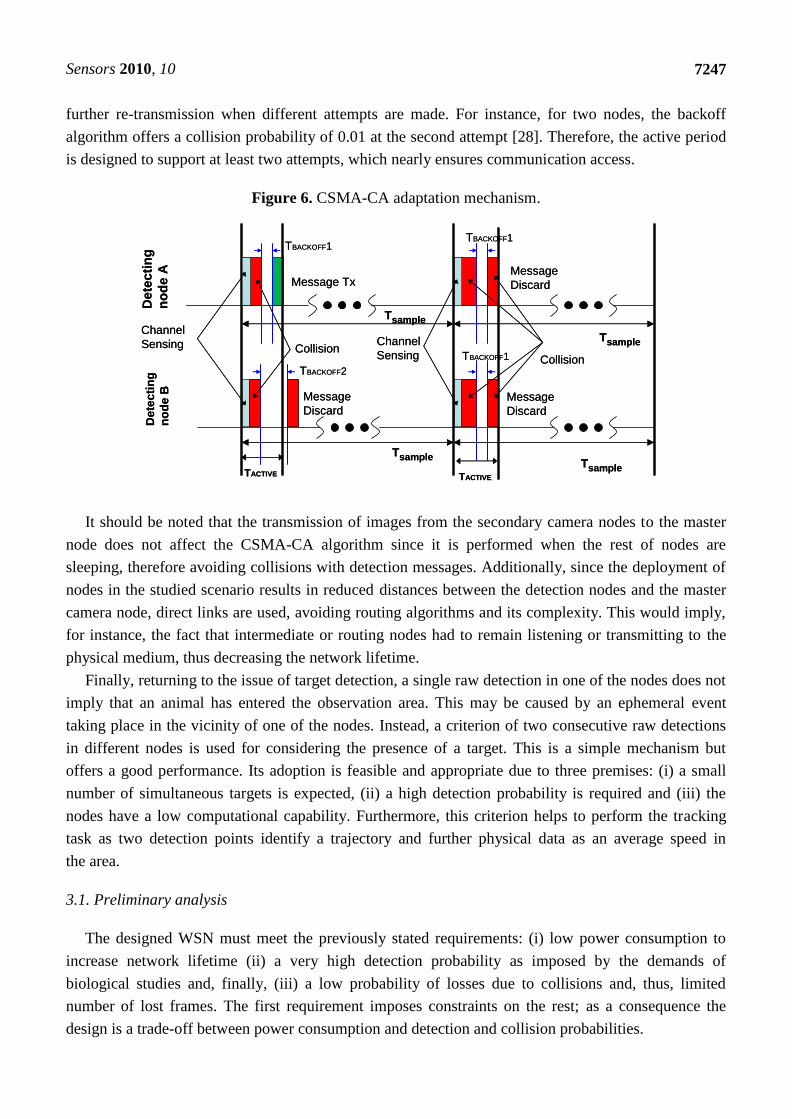
Sensors 2010, 10
7247
further re-transmission when different attempts are made. For instance, for two nodes, the backoff
algorithm offers a collision probability of 0.01 at the second attempt [28]. Therefore, the active period
is designed to support at least two attempts, which nearly ensures communication access.
Figure 6. CSMA-CA adaptation mechanism.
De
tecti
ng
no
de
A
Message Tx
TBACKOFF2
Channel
Sensing
Message
Discard
Dete
cti
ng
no
de
B
TBACKOFF1
Collision
Message
Discard
TBACKOFF1
Message
Discard
TBACKOFF1
Channel
Sensing
TACTIVE
Collision
Tsample
Tsample
Tsample
Tsample
TACTIVE
De
tecti
ng
no
de
A
Message Tx
TBACKOFF2
Channel
Sensing
Message
Discard
Dete
cti
ng
no
de
B
TBACKOFF1
Collision
Message
Discard
TBACKOFF1
Message
Discard
TBACKOFF1
Channel
Sensing
TACTIVE
Collision
Tsample
Tsample
Tsample
Tsample
TACTIVE
It should be noted that the transmission of images from the secondary camera nodes to the master
node does not affect the CSMA-CA algorithm since it is performed when the rest of nodes are
sleeping, therefore avoiding collisions with detection messages. Additionally, since the deployment of
nodes in the studied scenario results in reduced distances between the detection nodes and the master
camera node, direct links are used, avoiding routing algorithms and its complexity. This would imply,
for instance, the fact that intermediate or routing nodes had to remain listening or transmitting to the
physical medium, thus decreasing the network lifetime.
Finally, returning to the issue of target detection, a single raw detection in one of the nodes does not
imply that an animal has entered the observation area. This may be caused by an ephemeral event
taking place in the vicinity of one of the nodes. Instead, a criterion of two consecutive raw detections
in different nodes is used for considering the presence of a target. This is a simple mechanism but
offers a good performance. Its adoption is feasible and appropriate due to three premises: (i) a small
number of simultaneous targets is expected, (ii) a high detection probability is required and (iii) the
nodes have a low computational capability. Furthermore, this criterion helps to perform the tracking
task as two detection points identify a trajectory and further physical data as an average speed in
the area.
3.1. Preliminary analysis
The designed WSN must meet the previously stated requirements: (i) low power consumption to
increase network lifetime (ii) a very high detection probability as imposed by the demands of
biological studies and, finally, (iii) a low probability of losses due to collisions and, thus, limited
number of lost frames. The first requirement imposes constraints on the rest; as a consequence the
design is a trade-off between power consumption and detection and collision probabilities.
Sensors 2010, 10
7248
For the remainder of the paper, the different parameters of the WSN deployment are defined as
follows: the detection probability, πd, is the raw probability of detecting a target one time inside the
observation area, Sd. Then, we define the detection failure probability (the one we are interested), πe, as
the probability of a target get inside the observation area being not detected using the criteria of two
consecutives detections. Furthermore, the rejection probability, πr, reflects the probability that a
detection packet collides and does not reach the camera node in any of the retransmissions attempts. It
is independent of the detection probability. The parameter n is, in turn, the number of detector nodes
present in the WSN. The symbol δ denotes the period when nodes have their transceiver active
(transmitting or receiving), being Ts the sampling period of the motion detectors.
The detection probability is a function of the number of nodes n composing the network. Using a
fast approximation, the number of nodes can be obtained by dividing the entire Sd by the sensing
coverage of an individual infrared sensor. According to this, 32 nodes would be required to cover the
observation area. However this result is not realistic since several factors are not taken into account:
(1) the incompatibility between the shapes of the sensing areas of nodes which does not allow for a
uniform coverage of Sd, with overlap between them and dead detection angles because of obstacles,
(2) the final emplacement of nodes on a real scenario cannot be precisely determined a priori because
of the impossibility of using certain locations (in order to avoid obstacles) or the need to guarantee the
establishment of link between nodes. This considerations lead to an analysis which will be summarized
in the following paragraphs and which will be further checked with simulations in the next section of
the paper.
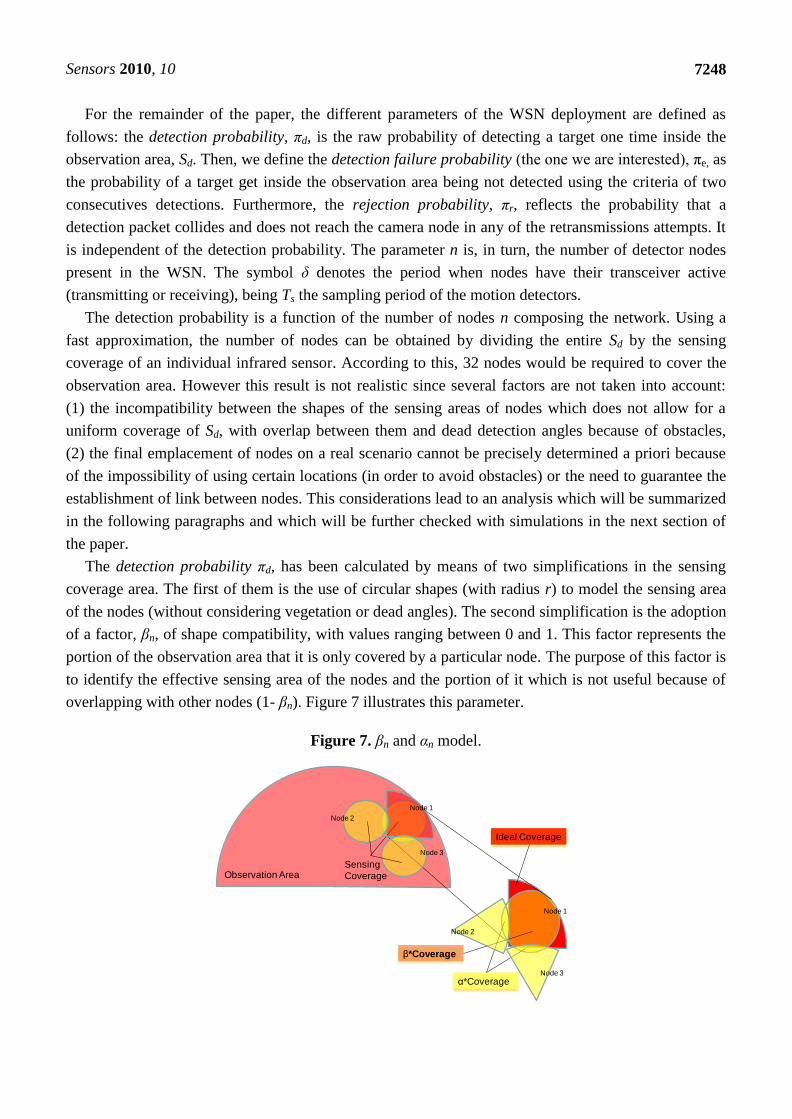
The detection probability πd, has been calculated by means of two simplifications in the sensing
coverage area. The first of them is the use of circular shapes (with radius r) to model the sensing area
of the nodes (without considering vegetation or dead angles). The second simplification is the adoption
of a factor, βn, of shape compatibility, with values ranging between 0 and 1. This factor represents the
portion of the observation area that it is only covered by a particular node. The purpose of this factor is
to identify the effective sensing area of the nodes and the portion of it which is not useful because of
overlapping with other nodes (1- βn). Figure 7 illustrates this parameter.
Figure 7. βn and αn model.
Observation AreaSensing
Coverage
β*Coverage
α*Coverage
Ideal Coverage
Node 1
Node 2
Node 3
Node 1
Node 2
Node 3
Sensors 2010, 10
7249
The detection probability, assuming nodes always active, can be expressed as:
n
mK dm
dk S
r
S
rnd
33
32
1
22
)1()()(
βk =0, k>n (space coverage) (1)
On the other hand, if only the effect of the scheduled-driven operation were considered, for a
sampling period Ts and a variable target speed, vtarget, the resulting expression would be:
setts
Tv
rTd
arg
)( (temporal coverage) (2)
Concluding, as combination of both (temporal activity is independent of the number of nodes):
n
mK dm
dk S
r
S
r
Tv
rTn
settsd
33
32
1
22
)1()(),(arg
βk =0, k>n (3)
The parameters denoted as βn constitute a series of values where one of them corresponds to a node
sensing area. Nevertheless, to facilitate the analysis, an average value is used, and it is independent
from the sensing coverage and the observation area. It can be easily deduced that a larger number of
nodes implies an increase in πd. The detection failure probability πe is calculated as πe = 1 − 2
d (using
the detection criterion explained before) indicating the percentage of targets which enter the area but
are not tracked by the system. It is shown in Figure 8(a).
The second aspect to consider is the rejection probability πr (the loss of messages during the
transmission). These losses are due to collisions, which are more probable than in other generic
scenarios, because of the overlapped sensing areas of the nodes and their similar schedule
(synchronization and detection information to transmit). The probability of these losses is given by the
CSMA-CA backoff algorithm that imposes a probability πr depending on the number of nodes
attempting to transmit at the same time. It should be remarked that only the detection message is
intended to be transmitted in two attempts. That is the number of opportunities to transmit during the
period Tactive imposed in order to save energy. From [30], the expression that defines the probability of
collision probability Pca (assuming synchronized nodes), which is valid for the first and second
attempts is:
1
)1(21
111
n
p
CWP
a
ca for a=1, 2. (4)
Where pa is the probability that the channel is free for the first or second attempts respectively:
pa=1 = 1−αn (n−32)/32 and pa=2 = 1−αn (n−32)/160 with αn = 0 for n ≤ 32, and the CW is the
contention window (a design parameter which depends on the capabilities and the electronics of the
nodes) of the communication protocol is set to a value of 32. Furthermore, the rejection probability
could be expressed as:
2
11
121121 **
aca
ca
cacacacacacar P
P
PPPPPP
(5)

Sensors 2010, 10
7250
Parameters αn are used as an approximation factor which represents the overlapped sensing area
(see Figure 7) and they can be substituted by an average value . Therefore the rejection probability
can be calculated as a function of this parameter against n. Figure 8 shows the obtained probabilities
for different values of and according to the number of nodes considered.
Figure 8. Detection failure and rejection probabilities: (a) using constant and different
values of , (b) using constant and different values of .
Using the energy consumption data given by the manufacturer (see Table 1), the power
consumption for a schedule-driven mechanism is calculated following the sequence shown in Figure 9
which takes into account the different power consumptions of each of the operational modes of the
hardware devices. Master camera node has a slightly higher duty cycle δ due to computing, tracking
processing and storing information times.
Figure 9. Power consumption analysis.
De
tectin
g
no
de
Ma
tse
r
Ca
me
ra n
ode
S0
δ time
Tactive
S0
2δ time
S0
δ time
2δ time
Tsleep
S1
S2
or
S3
S1
S2
or
S3
S0
T’sleepT’active
S1
S2or
S3 S1
S2 or
S3
Cp
Cp
Cp
Cp
CR
CR
CR
CR
Pow
er-
consum
ption
No Power-
consumption
De
tectin
g
no
de
Ma
tse
r
Ca
me
ra n
ode
S0
δ time
Tactive
S0
2δ time
S0
δ time
2δ time
Tsleep
S1
S2
or
S3
S1
S2
or
S3
S0
T’sleepT’active
S1
S2or
S3 S1
S2 or
S3
CpCp
CpCp
Cp
CpCp
CRCR
CRCR
CRCR
CRCR
Pow
er-
consum
ption
No Power-
consumption
Pow
er-
consum
ption
No Power-
consumption
Sensors 2010, 10
7251
From Figure 9, the scheduled power consumption is derived. The energy waste of the master
camera node is not computed because this node will have an external power supply in the final system.
However, the average power consumption P for the remaining sensor nodes may be computed as
follows:
sT
TSTSSTSTSP
TRANSTRANSactiveSleepd
21:2110:10210 )(
(6)
The transitions between different operational modes also consume energy, especially between
modes S0 and S1 (Cp). The use of the S1 mode (active CPU, inactive radio transceiver) is required
during the calibration phase of the PIR sensor prior to its use for detection at each cycle. After different
tests and according to manufacturer’s specifications, we establish this active period as 0.5 s. If a
sampling period TS of 5 s is considered, the following power consumption is obtained:
mWP gsend 165,315
1063,663,4801,02715,07,193237,48,1 3
sin
(7)
For the secondary cameras (increasing δ period to 0.51 s due to the time required for the
transmission of pictures to the master node):
mWP camerasI 25,705
1063,663,4851,03315,07,253737,386,1 3
(8)
The previous values state that the most restrictive nodes regarding power consumption and, thus,
the ones that determine the WSN lifetime are the secondary camera nodes. Nevertheless, it should be
noted that the consumption shown in (8) assumes that a target has just been photographed. In the worst
scenario, for a detection task in each sampling period, they may power off after 25.62 days. For a more
realistic case considering 100 targets per day, the lifetime extends to 49.19 days. Finally, the lifetime
expected for the scheduling process of the detector nodes (fixed value) is 57.76 days, which is enough
for a reasonable measurement season. This calculation has been performed for all the detector nodes
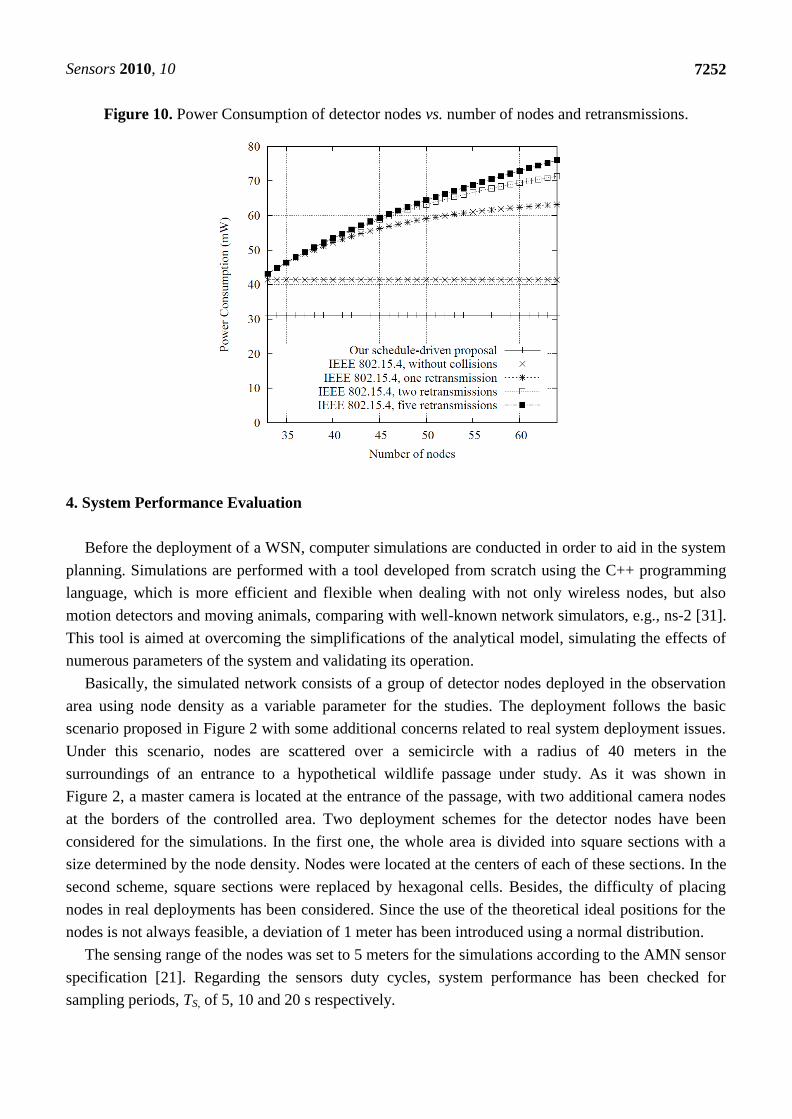
applying the presented CSMA-CA adaptation. To show its advantages, a comparison with the
IEEE 802.15.4 standard is given in Figure 10. The values shown in the figure have been obtained
configuring the IEEE 802.15.4 medium access layer with minimum beacon signaling and an
appropriate synchronization. Furthermore, the sampling period (Ts) and detector node configuration
(i.e., start/stop processes) are set to the same value than in our scheduled-driven proposal. The results
in the figure are represented as a function of the number of detector nodes and required retransmission
attempts. It can be seen that using the adaptation approach proposed in the paper considerably reduces
the power consumption in comparison to the IEEE 802.15.4 standard. For instance, comparing with a
deployment of 40 nodes and two allowed retransmissions our proposed system reduces the energy
consumption at least 40%. The difference is due to the consumption associated to the transmission of
the beacon frames used for signaling and the longer period during which IEEE 802.15.4 nodes remain
in the normal operation mode S1 (for operating the CPU), wasting more energy than in the sleep period
of our system.
Sensors 2010, 10
7252
Figure 10. Power Consumption of detector nodes vs. number of nodes and retransmissions.
4. System Performance Evaluation
Before the deployment of a WSN, computer simulations are conducted in order to aid in the system
planning. Simulations are performed with a tool developed from scratch using the C++ programming
language, which is more efficient and flexible when dealing with not only wireless nodes, but also
motion detectors and moving animals, comparing with well-known network simulators, e.g., ns-2 [31].
This tool is aimed at overcoming the simplifications of the analytical model, simulating the effects of
numerous parameters of the system and validating its operation.
Basically, the simulated network consists of a group of detector nodes deployed in the observation
area using node density as a variable parameter for the studies. The deployment follows the basic
scenario proposed in Figure 2 with some additional concerns related to real system deployment issues.
Under this scenario, nodes are scattered over a semicircle with a radius of 40 meters in the
surroundings of an entrance to a hypothetical wildlife passage under study. As it was shown in
Figure 2, a master camera is located at the entrance of the passage, with two additional camera nodes
at the borders of the controlled area. Two deployment schemes for the detector nodes have been
considered for the simulations. In the first one, the whole area is divided into square sections with a
size determined by the node density. Nodes were located at the centers of each of these sections. In the
second scheme, square sections were replaced by hexagonal cells. Besides, the difficulty of placing
nodes in real deployments has been considered. Since the use of the theoretical ideal positions for the
nodes is not always feasible, a deviation of 1 meter has been introduced using a normal distribution.
The sensing range of the nodes was set to 5 meters for the simulations according to the AMN sensor
specification [21]. Regarding the sensors duty cycles, system performance has been checked for
sampling periods, TS, of 5, 10 and 20 s respectively.
Sensors 2010, 10
7253
The sensor transmission parameters were the typical for Imote2 nodes [32] working in the 2.4 GHz
band. The connectivity between them was simulated according to a propagation model based on
empirical WSN outdoor measurements [33,34]. Additionally, the influence of vegetation was
introduced using the model extracted from the ITU-R P.833-6 recommendation [35]. However, in a
network located in such a small area, the existing vegetation has a negligible effect on the nodes
connectivity, even for trees and bushes covering 30% of the area (the maximum vegetation density
which can be found at some wildlife passages of the Doñana Park). Under these circumstances, the
number of detection messages requiring retransmission is less than 1.5%, which has a low impact on
the performance of the system.
For each analyzed scenario, at least 10,000 different random networks were simulated. For each
network, no less than 5,000 incoming targets were considered, each of them approaching to the
entrance of the passage and, then, crossing through it with a probability of 30% or leaving the
observation area (70% probability). According to previous studies of animal movement patterns, it was
assumed that the most of the animals were moving along the border of the motorway. This was
reflected on the simulated paths of animals, with 80% of them using the areas immediately adjacent to
the road and 20% coming from other directions (not parallel to the road). The animals speed was also
randomly generated within the range of 0.3–1.0 m/s. The number of tested events was enough to
obtain 95% confidence intervals for all the measures in the range of 5% for the estimated probabilities.
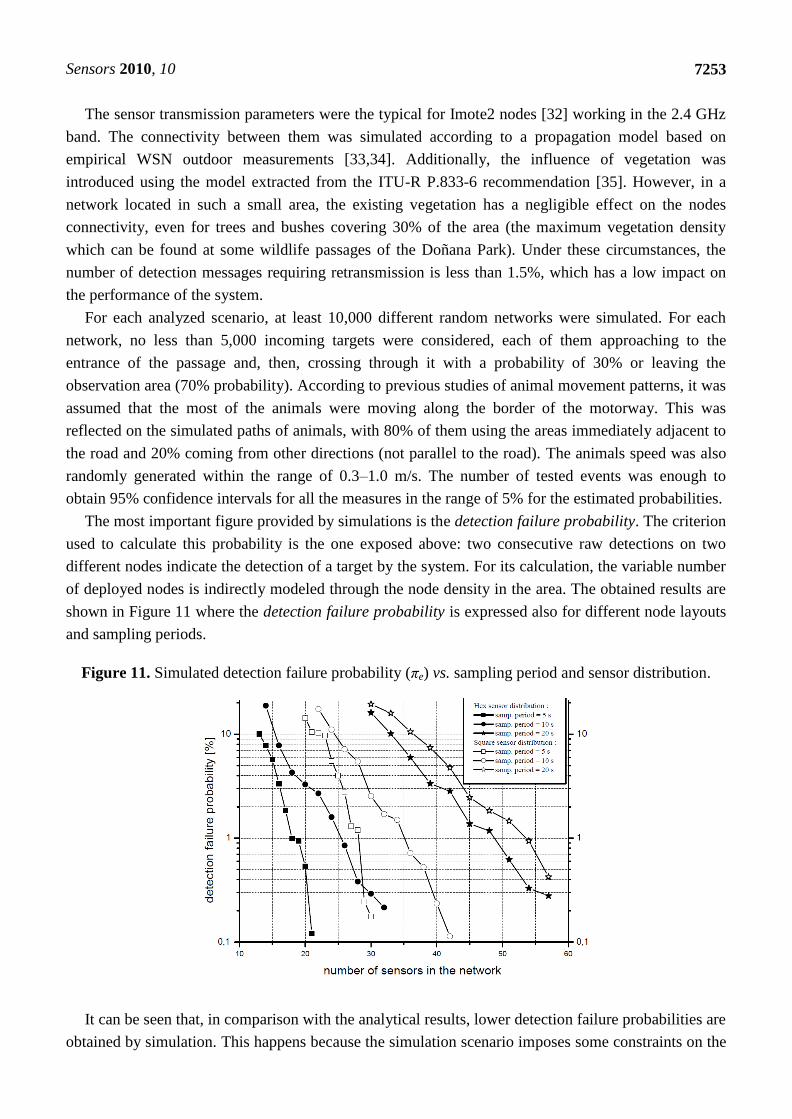
The most important figure provided by simulations is the detection failure probability. The criterion
used to calculate this probability is the one exposed above: two consecutive raw detections on two
different nodes indicate the detection of a target by the system. For its calculation, the variable number
of deployed nodes is indirectly modeled through the node density in the area. The obtained results are
shown in Figure 11 where the detection failure probability is expressed also for different node layouts
and sampling periods.
Figure 11. Simulated detection failure probability (πe) vs. sampling period and sensor distribution.
It can be seen that, in comparison with the analytical results, lower detection failure probabilities are
obtained by simulation. This happens because the simulation scenario imposes some constraints on the
Sensors 2010, 10
7254
movement of animals, as explained before. Results also show that a WSN with 20 nodes (a density
of 0.008 nodes per square meter) achieves satisfactory results; also, collisions are not an issue at this
density. Although the results are promising, two considerations must be taken into account: (i) a WSN
with 20 nodes does not cover the whole observation area, which means that tracking resolution is
lower (since there is a larger distance between nodes), and (ii) the WSN is more sensitive to node
failures or environmental events (false targets, weather, etc.).
Another remarkable aspect is the effect of the arrangement of nodes and the sampling period. As
can be expected from equation (2) introduced in the previous section, increasing the sampling period
leads to a higher failure rate. Nevertheless, the observed increase is larger than the theoretically
expected due to the particular simulation constraints which have been applied. Regarding the
arrangement of nodes, a hexagonal layout offers better performance than a square one. This is
explained by the fact that the former allows for a more uniform coverage of the entire observation area
while the square one results in larger overlapping areas between nodes and, thus, a smaller surface is
effectively covered.
It is also interesting to observe the effect of dead nodes in the network. During the lifetime of the
WSN deployed some nodes may be lost because of the weather, animals, or battery waste. Figure 12
shows how the system performs when random nodes fail. A hexagonal layout and two different
sampling periods (5 and 10 s separation between samples) have been used for this simulation.
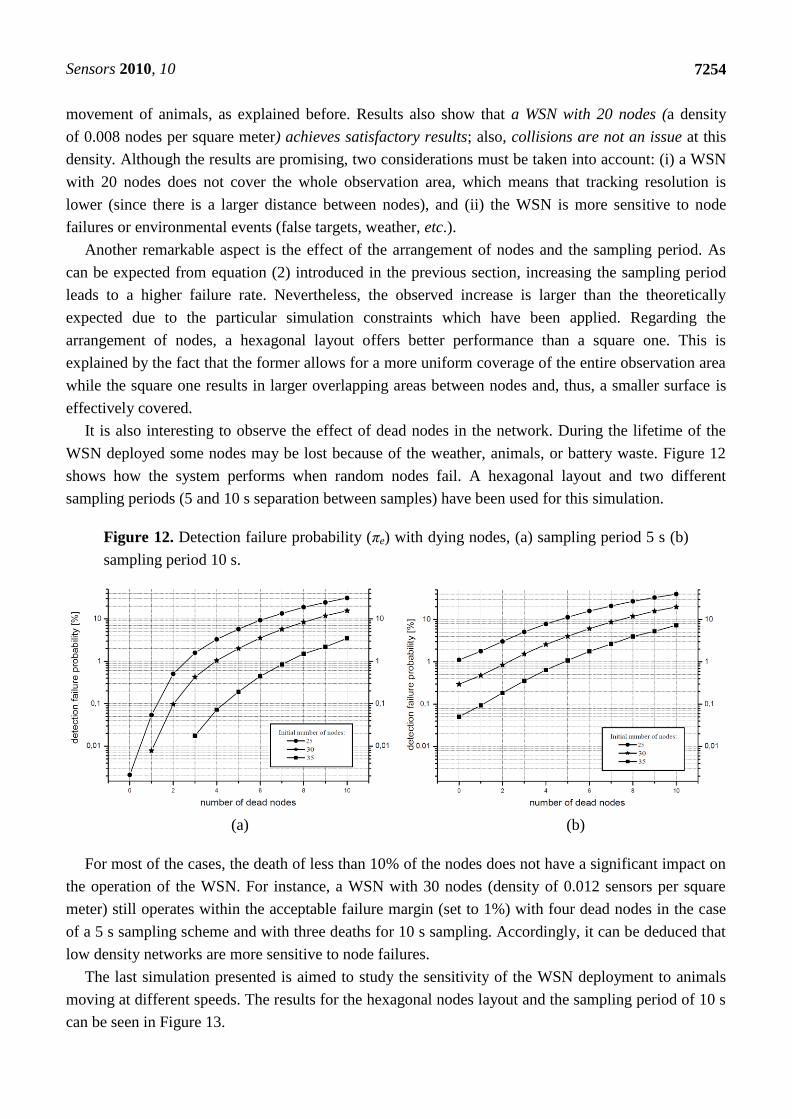
Figure 12. Detection failure probability (πe) with dying nodes, (a) sampling period 5 s (b)
sampling period 10 s.
For most of the cases, the death of less than 10% of the nodes does not have a significant impact on
the operation of the WSN. For instance, a WSN with 30 nodes (density of 0.012 sensors per square
meter) still operates within the acceptable failure margin (set to 1%) with four dead nodes in the case
of a 5 s sampling scheme and with three deaths for 10 s sampling. Accordingly, it can be deduced that
low density networks are more sensitive to node failures.
The last simulation presented is aimed to study the sensitivity of the WSN deployment to animals
moving at different speeds. The results for the hexagonal nodes layout and the sampling period of 10 s
can be seen in Figure 13.
(a) (b)

Sensors 2010, 10
7255
Figure 13. Detection failure probability (πe) vs. target speeds.
For the expected animal speeds (up to 1 m/s), the system performs satisfactorily. However, results
are not so good for faster targets (1.5 m/s), requiring a higher node density in the deployment (a shorter
sampling period would be equally advantageous). Thus, target speed is an important factor to consider
during the system design, especially for the cases when faster targets could be present.
5. Implementation and Deployment Details
This section describes implementation issues developed according to the requirements stated in the
previous sections of this paper. It is aimed at reproducing the same scenario that was used for the
simulation. Therefore, the network topology, traffic type, frame size and all the features previously
introduced can be tested on real devices. The objective is twofold: (i) to validate the analytical results
and simulation environment for detecting and identifying animals and (ii) to build a field trial scenario
in order to evaluate the service and assess its real feasibility.
Hardware components used in the prototype must provide capabilities for detecting, identifying and
tracking animals with the appropriate sensors. They were fully described in Section 2. Software
components, in turn, must be compatible with the hardware, and they also have to enable the
development of detection and picture-capturing applications. In the following subsection, the details
concerning the developed software components are explained. Finally, a field deployment of the
system is also shown.
5.1. Software
Sensor applications have been developed using TinyOS (version 2.0) [36] and the nesC language.
TinyOS is the most widely accepted operating system for WSN. NesC, in turn, is a C-based
programming language for writing TinyOS applications. They have been used to develop the
components and interfaces required by the system, which have been connected according to the
software architecture illustrated in Figure 14.
Sensors 2010, 10
7256
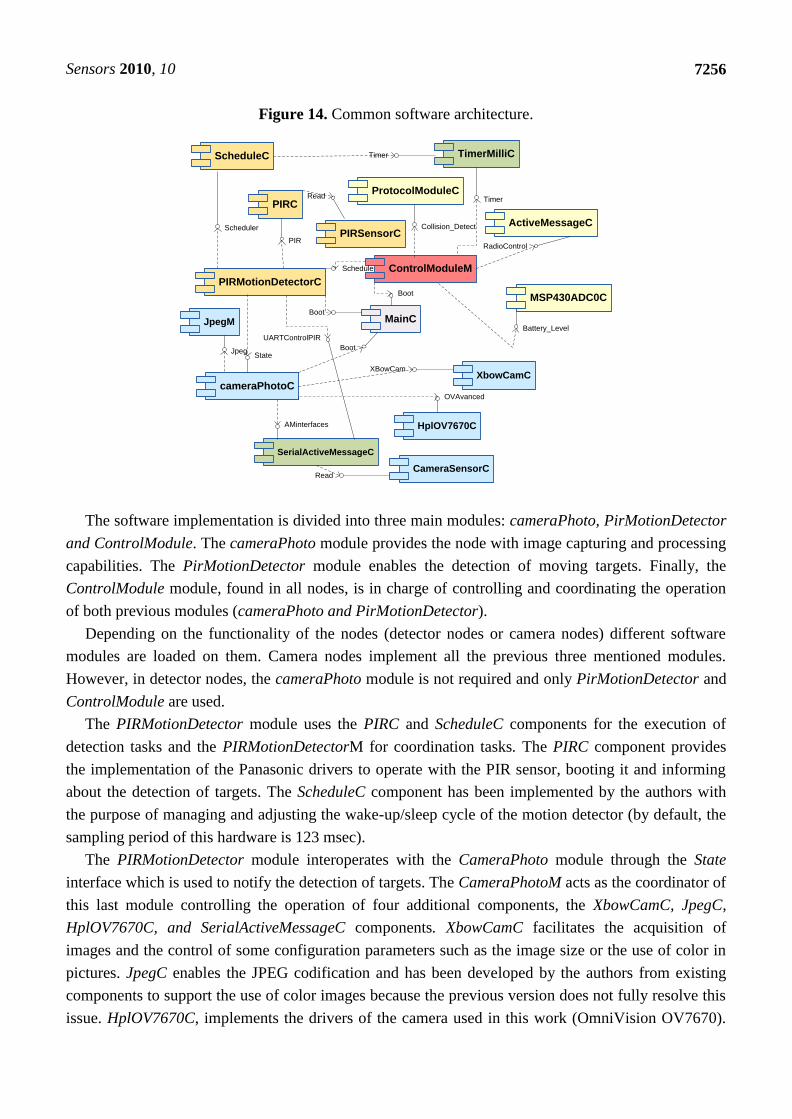
Figure 14. Common software architecture.
ControlModuleM
TimerMilliC
MainC
Boot
PIRMotionDetectorC
Timer
ActiveMessageC
RadioControl
Schedule
ProtocolModuleC
Collision_Detect
MSP430ADC0C
Battery_Level
ScheduleC Timer
PIRC
Scheduler
PIR
cameraPhotoC
State
PIRSensorC
Read
Boot
Boot
JpegM
XbowCamCXBowCam
HplOV7670C
OVAvanced
Jpeg
SerialActiveMessageC
CameraSensorCRead
AMinterfaces
UARTControlPIR
The software implementation is divided into three main modules: cameraPhoto, PirMotionDetector
and ControlModule. The cameraPhoto module provides the node with image capturing and processing
capabilities. The PirMotionDetector module enables the detection of moving targets. Finally, the
ControlModule module, found in all nodes, is in charge of controlling and coordinating the operation
of both previous modules (cameraPhoto and PirMotionDetector).
Depending on the functionality of the nodes (detector nodes or camera nodes) different software
modules are loaded on them. Camera nodes implement all the previous three mentioned modules.
However, in detector nodes, the cameraPhoto module is not required and only PirMotionDetector and
ControlModule are used.
The PIRMotionDetector module uses the PIRC and ScheduleC components for the execution of
detection tasks and the PIRMotionDetectorM for coordination tasks. The PIRC component provides
the implementation of the Panasonic drivers to operate with the PIR sensor, booting it and informing
about the detection of targets. The ScheduleC component has been implemented by the authors with
the purpose of managing and adjusting the wake-up/sleep cycle of the motion detector (by default, the
sampling period of this hardware is 123 msec).
The PIRMotionDetector module interoperates with the CameraPhoto module through the State
interface which is used to notify the detection of targets. The CameraPhotoM acts as the coordinator of
this last module controlling the operation of four additional components, the XbowCamC, JpegC,
HplOV7670C, and SerialActiveMessageC components. XbowCamC facilitates the acquisition of
images and the control of some configuration parameters such as the image size or the use of color in
pictures. JpegC enables the JPEG codification and has been developed by the authors from existing
components to support the use of color images because the previous version does not fully resolve this
issue. HplOV7670C, implements the drivers of the camera used in this work (OmniVision OV7670).

Sensors 2010, 10
7257
The last component, SerialActiveMessageC, manages and sends the compressed image data using the
serial interface of the node when a user collects them.
Finally, the ControlModule module is responsible for capabilities such as the transmission and
reception of frames over the radio channel (ActiveMessageC component), the management of the duty
cycle in the motion detector (via the Schedule interface), the implementation of a checking tool for the
battery level (the MSP430ADC0C) and the execution of the CSMA-CA medium access procedure
(ProtocolModuleC component).
5.2. Deployment of camera and detector nodes
In order to validate the simulation results obtained for energy consumption as well as the proper
operation of the devices, the WSN was deployed for a field trial following the layout proposed in
Figure 2. Nodes were deployed around a passage which lynxes and other animals use to cross roads.
Twenty detector nodes and three camera nodes were installed in a 2.5 ha semicircular area around
the passage.
The location of each of the nodes depends on its type. A camera node was placed on top of the
passage. A second camera-node was located on the edge of the road, 40 meters away from the passage,
and the last camera was placed, symmetrically, in the opposite side of the semicircle. The last two
emplacements were selected because a higher proportion of animals are expected to use this path to get
to the passage (they move by the path parallel to the road). The detector nodes were placed as in the
simulation scenario (hexagonal layout, Ts = 5 s). The camera nodes (except the one placed on the top
of the tunnel) and the detector nodes were placed 1 m above the ground. All these nodes were within
the radio coverage of the node at the entrance of the passage.
Figure 15 shows different pictures of the real deployment. Figures 15(a,b) depict the camera node
on top of the passage. Figure 15(c) illustrates a picture taken by this camera-sensor at the entrance of
the passage. One of the detector nodes, placed on an olive tree in front of the passage, can be seen in
turn in Figure 16.
Figure 15. Deployment of camera-sensor (a) Wildlife passage; (b) details of the
camera-sensor emplacement; (c) picture taken by the master camera-sensor.

Sensors 2010, 10
7258
Figure 16. Emplacement of one of the detector-sensors.
To validate the analytical results obtained for energy consumption, the sensor nodes were
reprogrammed to run an application for measuring and storing the energy consumption as a function of
time. Figure 17 shows the energy consumed by a detector node of the WSN. As it can be observed, it is
very similar to the results obtained analytically.
Figure 17. Instantaneous power consumption for detector node, oscilloscope capture.
Deep-Sleep
imote2 (S0)
PIR detection
Receive
Mode
(S2)
Transmission
of the event
(S3)
Wake-up imote2.
Transition mode
S0-S1
PIR
calibration.
Mode S1
Deep-Sleep
imote2 (S0)
PIR detection
Receive
Mode
(S2)
Transmission
of the event
(S3)
Wake-up imote2.
Transition mode
S0-S1
PIR
calibration.
Mode S1
6. Conclusions
This paper presents a WSN-based system for moving target monitoring in areas of special interest.
In particular, it has been applied for tracking animals approaching wildlife passages under roads.
Comparing with other surveillance systems installed on passages, which only allow for target detection
Sensors 2010, 10
7259
(providing no further information about animal behavior), the proposed system provides users
(biologists from the natural park) with additional information to analyze animal reactions to passages
according to different environment conditions. The information obtained can be used for analyzing in
details the effect of ecological conditions (e.g., environmental or disturbance factors) in the immediate
vicinity of passages on their use by target species, in order to improve passage permeability and,
ultimately, to mitigate the effects of habitat fragmentation on species conservation.
The system uses a combination of tracking capabilities, provided by infrared motion sensors,
together with target identification through the use of camera sensors. Two different hardware
prototypes, the camera nodes and the detector nodes, have been used for this purpose, each of them
with its own control and specific application software modules. These prototypes have been used to
deploy a WSN consisting of three of these camera nodes and a variable number of detector nodes. The
constraints which these devices impose on energy consumption have also been addressed by adapting
the 802.15.4 standard to the characteristics of the studied scenario, reducing the period while nodes are
active. Additionally analytical and simulation studies have been conducted in order to determine the
most appropriate network operational parameters to achieve a good trade-off between network lifetime
and target detection probability. In the paper, the effects of using different node layouts and densities
on system performance have been studied. Similarly, different time schedules for node operations have
also been tested.
For the real implementation of the system proposed in this work, a novel hardware prototype, the
detector node, has been developed using COTS components, with its own specific application
software. Furthermore, new software modules have been developed providing new functionalities in
the WSN system as color photos required to facilitate the identification tasks.
The system has been deployed at a wildlife passage in order to check its correct behavior. In the
future, it will be deployed in a larger number of sites with the purpose of acquiring biologically
valuable information. At a later stage, the system can be also used to monitor other facilities, like
feeders or water troughs. The inclusion of new features into the system is also considered, for example,
the possibility of automatically extracting gathered information from master nodes via cellular 3G
or 4G mobile networks.
Acknowledgements
This research has been supported by the Spanish project grants TEC2007-67966-01/TCM
(CON-PARTE-1), CALM TEC2010-21405-C02-02 and PR2009-0337 and it is also developed in the
framework of “Programa de Ayudas a Grupos de Excelencia de la Región de Murcia, de la Fundación
Séneca, Agencia de Ciencia y Tecnología de la RM”. It was also supported by Polish project grants
179/N-COST/2008/0 and DWM/MOB17/II/2008. The authors would like to thank two anonymous
reviewers for their valuable comments on this paper.
Sensors 2010, 10
7260
References
1. Forman, R.; Alexander, L. Roads and their major ecological effects. Annu. Rev. Ecol. Syst. 1998,
29, 207-231.
2. Yanes, M.; Velasco, J.M.; Suárez, F. Permeability of roads and railways to vertebrates: The
importance of culverts. Biol. Conserv. 1995, 71, 217-222.
3. Clevenger, A.P.; Chruszcz, B.; Gunson, K. Drainage culverts as habitat linkages and factors
affecting passage by mammals. J Appl. Ecol. 2001, 38, 1340-1349.
4. Rodríguez, A.; Crema, G.; Delibes, M. Factors affecting crossing of red foxes and wildcats
through non-wildlife passages across a high-speed railway. Ecography 1997, 20, 287-294.
5. Clevenger, A.P.; Waltho, N. Performance indices to identify attributes of highway crossing
structures facilitating movements of large mammals. Biol. Conserv. 2005, 121, 453-464.
6. Mata, C.; Hervás, I.; Herranz, J.; Malo, J.E.; Suárez, F. Seasonal changes in wildlife use of
motorway crossing structures and their implication for monitoring programmes. Res. Pt.
D-Transp. Environ. 2009, 14, 447-452.
7. Rodríguez, A.; Crema, G.; Delibes, M. Use of Non-wildlife passages across a high speed railway
by terrestrial vertebrates. J. Appl. Ecol. 1996, 33, 1527-1540.
8. Reed, D.F.; Ward, A.L. Efficacity of Methods Advocated to Reduce Deer-Vehicle Accidents:
Research and Rationale in the U.S.A. In Proceedings of Routes et Faune Sauvage. Actes du
Colloque, Ministere de l’Equipement, du Logement, de l’Aménagement du Territoire et des
Transports, Strasbourg, France, 5-7 July 1985; pp.285-293.
9. Foster, M.L.; Humphrey, S.R. Use of highway underpasses by Florida panthers and other wildlife.
Wildlife Soc. Bull. 1995, 23, 95-100.
10. Long, R.A; Donovan, T.M.; MacKay, P.; Zielinski, W.J.; Buzas, J.S. Comparing scat detection
dogs, cameras, and hair snares for surveying carnivores. J. Wildlife Manage. 2007, 71, 2018-2025.
11. Burdett, C.L.; Moen, R.A.; Niemi, G.J.; Mech, L.D. Defining space use and movements of
Canada lynx with global positioning system telemetry. J. Mammal. 2007, 88, 457-467.
12. Buratti, C.; Conti, A.; Dardari, D.; Verdone, R. An overview on wireless sensor networks
technology and evolution. Sensors 2009, 9, 6869-6896.
13. Kazuya, T.K.; Ueda, H.; Tamura, H.; Kawahara, K.; Oie, Y. Deployment design of wireless
sensor network for simple multi-point surveillance of a moving target. Sensors 2009, 9,
3563-3585.
14. Song, B.; Choi, H.; Lee, H.S. Surveillance Tracking System Using Passive Infrared Motion
Sensors in Wireless Sensor Network. In Proceedings of International Conference on Information
Networking (ICOIN 2008), Busan, South Korea, 12-14 December 2008; pp.1-5.
15. Monsef, E.; Subramanian, S. Hybrid Energy-Efficient Approach for Target Tracking Via Sensor
Networks. In Proceedings of International Conference on Advanced Computer Theory and
Engineering (ICACTE 2008), Phuket, Thailand, 20-22 December 2008; pp. 174-178.
16. Wang, X.; Ma, J.J.; Wang, S.; Bi, D.W. Cluster-based dynamic energy management for
collaborative target tracking in wireless sensor networks. Sensors 2007, 7, 1193-1215.

Sensors 2010, 10
7261
17. Imote2 Developers Group. Available online: http://tech.groups.yahoo.com/group/intel-mote2-
community (accessed on May 2010).
18. IEEE Computer Society, Part 15.4: Wireless Medium Access Control (MAC) and Physical Layer
(PHY) Specifications for Low-Rate Wireless Personal Area Networks(LR-WPANs), IEEE
Standard for Information Technology, 2006.
19. Palomares, F.; Delibes, M.; Ferreras, P.; Fedriani, J.M.; Calzada, J.; Revilla, E. Iberian Lynx in a
fragmented landscape: Predispersal, dispersal, and postdisperal habitats. Conserv. Biol. 2000, 14,
809-818.
20. Rodríguez, A.; Delibes, M. Patterns and causes of non-natural mortality in the Iberian lynx during
a 40-year period of range contraction, Biol. Conserv. 2004, 118, 151-161.
21. Panasonic. AMN41121 Motion Sensor datasheet. Available online: http://pewa.panasonic.com/
pcsd/product/sens/pdf_cat/amn.pdf (accessed on May 2010).
22. Omnivision OV7670 datasheet. Available online: www.ovt.com (accessed on May 2010).
23. Imote2 Datasheet website. Available online: http://www.xbow.com/Products/Product_pdf_
files/Wireless_pdf/ Imote2_Datasheet.pdf (accessed on May 2010).
24. ITS400 Datasheet Homepage. Available online: http://www.xbow.com/Products/Product_pdf_
files/Wireless_pdf/ ITS400_Datasheet.pdf (accessed on May 2010).
25. IMB400 Datasheet Homepage. Available online: http://www.xbow.com/Products/Product_pdf
_files/Wireless_pdf/Imote2_IMB400_Preliminary.pdf (accessed on May 2010).
26. Jung, D.; Teixeira, T.; Sawides, A.; Sensor node lifetime analysis: Models and tools. ACM Trans.
Sens. Netw. 2009, 5, 3:1-3:33.
27. Polastre, J.; Hill, J.; Culler, D. Versatile Low Power Media Access for Wireless Sensor Networks.
In Proceedings of the 2nd ACM International Conference on Embedded Networked Sensor
Systems (SenSys '04), Baltimore, MD, USA, 3-5 November 2004; pp. 95-107.
28. Lee, B.H.; Wu, H.K. Study on Backoff Algorithm for IEEE 802.15.4 LR-WPAN, In Proceeding
of 22nd International Conference on Advanced Information Networking and Applications,
Okinawa, Japan, 25-28 March 2008; pp. 403-409.
29. Suh, C.; Mir, Z.H.; Ko, Y.B. Design and implementation of enhanced IEEE 802.15.4 for
supporting multimedia service in Wireless Sensor Networks. Comput. Netw. 2008, 52, 2568-2581.
30. Jung, D.; Teixeira, T.; Barton-Sweeney A.; Savvides A. Model-Based Design Exploration of
Wireless Sensor Node Lifetimes. In Proceedings of the 4th European Conference on Wireless
Sensor Networks, Delft, The Netherlands, 29-31 January 2007; pp.277-292.
31. Network Simulator Website. Available online: http://www.isi.edu/nsnam/ns/ (accessed on 22
May 2010).
32. IMOTE2 CC2420 2.4 GHz IEEE 802.15.4/ZigBee-ready RF Transceiver specification. Available
online: http://focus.ti.com/lit/ds/symlink/cc2420.pdf (accessed on July 2010).
33. E-MORANS scenarios (from IST-NEWCOM project)—Sensor Networks Scenario. Available
online: http://grow.lx.it.pt/web/cost2100/contributions.html (accessed on May 2010).
34. Verdone, R.; Dardari, D.; Mazzini, G.; Conti, A. Wireless Sensor and Actuator
Networks—Technologies, Analysis and Design; Academic Press: London, UK, 2008.

Sensors 2010, 10
7262
35. ITU Recommendations, Recommendation ITU-R P.833-6, "Attenuation in vegetation", Geneva:
Switzerland, 2007.
36. TinyOS. An operating system for networked sensors homepage. Available online:
http://www.tinyos.net (accessed on July 2010).
© 2010 by the authors; licensee MDPI, Basel, Switzerland. This article is an Open Access article
distributed under the terms and conditions of the Creative Commons Attribution license
(http://creativecommons.org/licenses/by/3.0/).