Embed Size (px)
Citation preview
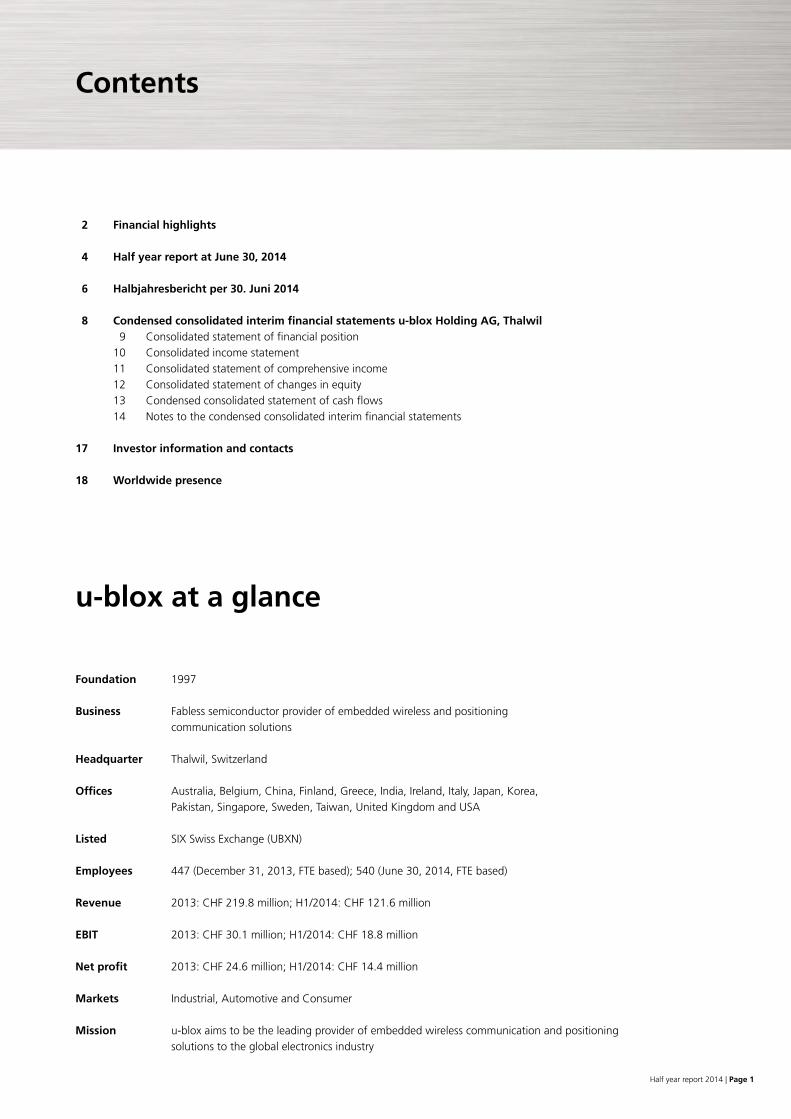
Wireless & Positioning SolutionsHALF YEAR REPORT 2014
Content
Foundation 1997
Business Fabless semiconductor provider of embedded wireless and positioning communication solutions
Headquarter Thalwil, Switzerland
Offices Australia, Belgium, China, Finland, Greece, India, Ireland, Italy, Japan, Korea, Pakistan, Singapore, Sweden, Taiwan, United Kingdom and USA
Listed SIX Swiss Exchange (UBXN)
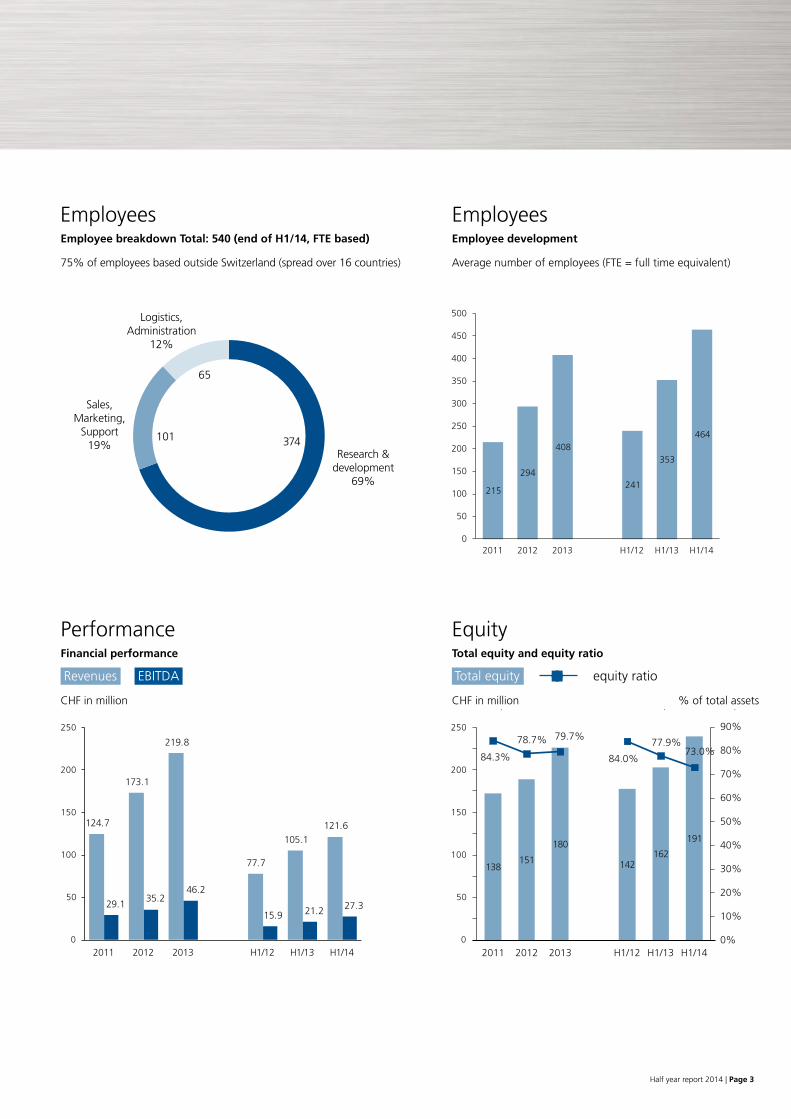
Employees 447 (December 31, 2013, FTE based); 540 (June 30, 2014, FTE based)
Revenue 2013: CHF 219.8 million; H1/2014: CHF 121.6 million
EBIT 2013: CHF 30.1 million; H1/2014: CHF 18.8 million
Net profit 2013: CHF 24.6 million; H1/2014: CHF 14.4 million
Markets Industrial, Automotive and Consumer
Mission u-blox aims to be the leading provider of embedded wireless communication and positioning solutions to the global electronics industry
u-blox at a glance
Half year report 2014 | Page 1
Contents
2 Financial highlights
4 Half year report at June 30, 2014
6 Halbjahresbericht per 30. Juni 2014
8 Condensed consolidated interim financial statements u-blox Holding AG, Thalwil 9 Consolidated statement of financial position10 Consolidated income statement11 Consolidated statement of comprehensive income12 Consolidated statement of changes in equity13 Condensed consolidated statement of cash flows14 Notes to the condensed consolidated interim financial statements
17 Investor information and contacts
18 Worldwide presence
Page 2 | Half year report 2014
Financial highlights
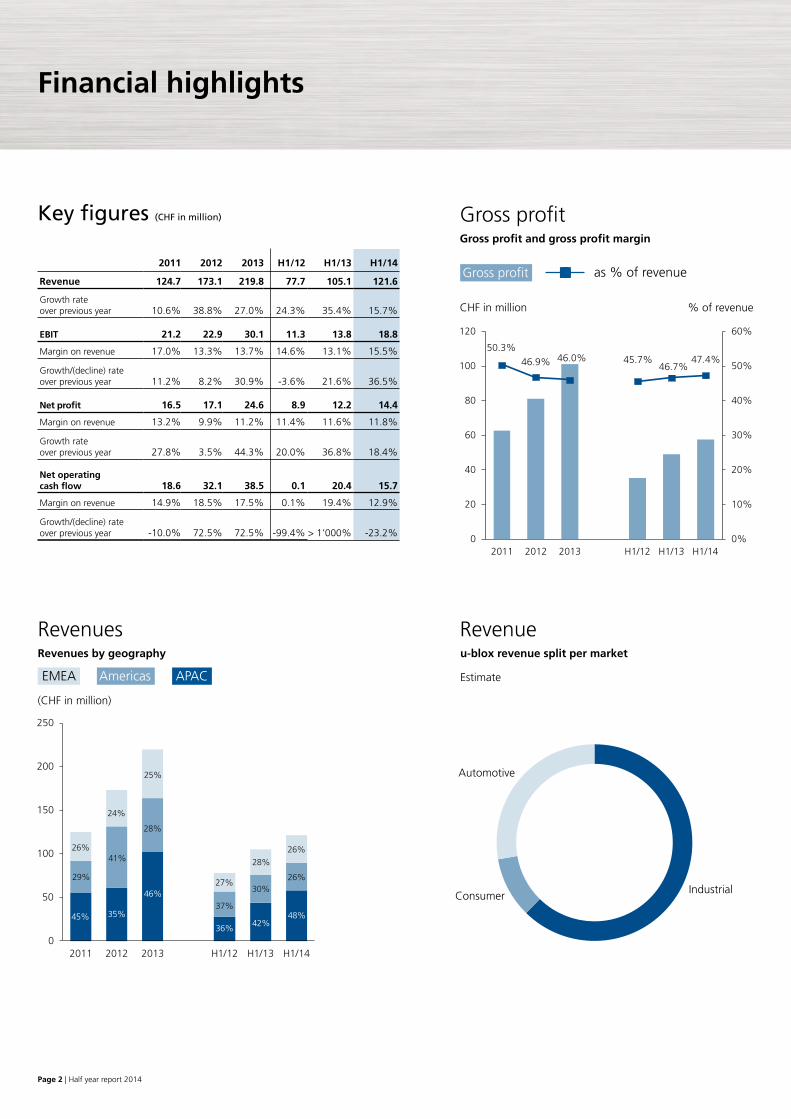
Key figures (CHF in million)
2011 2012 2013 H1/12 H1/13 H1/14
Revenue 124.7 173.1 219.8 77.7 105.1 121.6
Growth rate over previous year 10.6% 38.8% 27.0% 24.3% 35.4% 15.7%
EBIT 21.2 22.9 30.1 11.3 13.8 18.8
Margin on revenue 17.0% 13.3% 13.7% 14.6% 13.1% 15.5%
Growth/(decline) rate over previous year 11.2% 8.2% 30.9% -3.6% 21.6% 36.5%
Net profit 16.5 17.1 24.6 8.9 12.2 14.4
Margin on revenue 13.2% 9.9% 11.2% 11.4% 11.6% 11.8%
Growth rate over previous year 27.8% 3.5% 44.3% 20.0% 36.8% 18.4%
Net operating cash flow 18.6 32.1 38.5 0.1 20.4 15.7
Margin on revenue 14.9% 18.5% 17.5% 0.1% 19.4% 12.9%
Growth/(decline) rate over previous year -10.0% 72.5% 72.5% -99.4% > 1’000% -23.2%
CHF in million % of revenue
Gross profitGross profit and gross profit margin
Gross profit as % of revenue
Revenueu-blox revenue split per market
Estimate
Automotive
Consumer Industrial
Revenues
(CHF in million)
APACAmericasEMEA
Revenues by geography
0
50
100
150
200
250
2011 2012 2013 H1/12 H1/13 H1/14
24%
25%
35%
29%
41%
45%
46% 30%
28%
42%48%
26%
26%
27.8
28%
37%
36%
27%
26%
50.3%46.9% 46.0% 45.7%
46.7%47.4%
0%
10%
20%
30%
40%
50%
60%
0
20
40
60
80
100
120
2011 2012 2013 H1/12 H1/13 H1/14
(million CHF) % of revenue
Half year report 2014 | Page 3
CHF in million % of total assets
Equity
Total equity
Total equity and equity ratio
equity ratio
CHF in million
Performance
EBITDARevenues
Financial performance
EmployeesEmployee breakdown Total: 540 (end of H1/14, FTE based)
75% of employees based outside Switzerland (spread over 16 countries)
Logistics,Administration
12%
Sales,Marketing,
Support19%
Research &development
69%
65
101 374
EmployeesEmployee development
Average number of employees (FTE = full time equivalent)
138151
180
142162
191
84.3%
78.7% 79.7%
84.0%
77.9%73.0%
0%
10%
20%
30%
40%
50%
60%
70%
80%
90%
0
20
40
60
80
100
120
140
160
180
200
2011 2012 2013 H1/12 H1/13 H1/14
Total Equity Equity ratio
(million CHF) (% of total assets)
215
294
408
241
353
464
0
50
100
150
200
250
300
350
400
450
500
2011 2012 2013 H1/12 H1/13 H1/14
124.7
173.1
219.8
77.7
105.1 121.6
29.135.2
46.2
15.9 21.2 27.3
0
50
100
150
200
250
2011 2012 2013 H1/12 H1/13 H1/14
124.7
173.1
219.8
77.7
105.1 121.6
29.135.2
46.2
15.9 21.2 27.3
0
50
100
150
200
250
2011 2012 2013 H1/12 H1/13 H1/14
Page 4 | Half year report 2014
u-blox maintains growth, improves EBIT margin and makes progress in strategic development
u-blox (SIX:UBXN), a global leader in wireless and positioning semiconductors and modules, today announced revenue for the first half year 2014 of CHF 121.6 million. This constitutes a 15.7% increase over the first half year of 2013. Gross profit increased to CHF 57.6 million, resulting in a gross profit margin of 47.4%. EBIT for the first half year of 2014 was CHF 18.8 million, a strong growth of 36.5%. The net profit grew 18.4% to CHF 14.4 million. u-blox confirms its previously published guidance for the full year of revenues between CHF 264-275 million, with an EBIT in the range of CHF 35-39 million.
u-blox acquired the Malmö based (Sweden) connectBlue AB. After the balance sheet date, the Athens based (Greece) Antcor was acquired. Both firms come with proven technologies for short range radio (Bluetooth and Wi-Fi) communications.
Financial highlights of the first half of 2014
• Overall sales expanded by 15.7% (20% at constant exchange rates) to CHF 121.6 million as compared to H1 2013.
• Gross profit increased to CHF 57.6 million with gross profit margin reaching 47.4%.
• EBITDA of CHF 27.3 million was reached, with an EBITDA margin of 22.4%.
• EBIT grew 36.5% to CHF 18.8 million, resulting in an EBIT margin of 15.5%.
• Net profit grew 18.4% to CHF 14.4 million, or 11.8% of revenues during the period.
• Current assets increased by CHF 6.7 million compared to December 31, 2013, mainly due to the growth of the business.
• Capital expenditure before acquisitions was CHF 12.9 million mainly used for capacity expansion and investments for product development.
• A net operating cash flow of CHF 15.7 million was recorded.
Strong overall performanceAs compared to the same period in 2013, u-blox revenues based on billing location increased in Asia Pacific and EMEA. Asia Pacific sales experienced a strong growth of 33.1%, revenue in EMEA grew with 7.6% and the America sales were flat with –0.7% due to the decision by some US customers to outsource manufacturing to Asia. Without that effect, Americas would have grown by around 13%.
Continued growth in industrial marketsStrong performance was achieved in u-blox’ industrial markets. The driving application continued to be fleet management systems. This was followed by good performance in industrial timing and synchronization applications which grew remarkably as compared to the first half of 2013.
Telematics devices such as insurance boxes and Automatic Teller Machines/Point of Sales terminals experienced robust growth. Healthcare devices, which are included in the industrial sector, exhibited outstanding growth, becoming the company’s fastest growing industrial sector.
Sales into the global automotive and consumer markets were flat.
Strong profitabilityu-blox continued to achieve strong profitability with EBITDA growing by 29.0% and EBIT growing by 36.5%. Net profit growth of 18.4% was impacted by a higher tax rate as a consequence of
one-off accounting effects in deferred taxes.
Strategic products launched In the first half, u-blox launched several strategic products in both the wireless and positioning product lines that exploit cutting edge technologies. The world’s fastest LTE module, the TOBY-L2, was launched in January. It is the first LTE module on the market to deliver category 4 performance, capable of speeds up to 150 Mb/s. It also supports 3G and 2G networks, a crucial feature to allow our customers to upgrade their products already without compromising on network coverage. 4G LTE is the state-of-the-art in cellular communications, and is the fastest growing telecommunications standard in history.
On the positioning side of the business, u-blox successfully deployed its 8th generation positioning chip technology u-blox M8 into its industry-standard module series MAX, NEO and LEA. The modules can acquire and track all visible GPS, GLONASS, BeiDou, QZSS and SBAS satellites and can track any two satellite systems simultaneously for increased reliability, accuracy and faster acquisition time. u-blox M8 is at the forefront of global positioning technology, and is being offered alongside the company’s previous u-blox 7 based products in order to provide customers with both cost and performance optimized options.
The company introduced a revolutionary 3D dead reckoning chip which enables car navigation equipment to calculate a position within multi-level structures, a typical scenario when driving through stacked highways and multi-story park houses.
As a result of the connectBlue acquisition, u-blox incorporated seven new short range radio module products conforming to the Bluetooth and Wi-Fi standards. These products support u-blox’ strategy of providing both long-range and short-range wireless communication modules, a key requirement for providing end-to-end communication solutions in the Internet of Things.
Two new positioning modules with integrated antenna were launched,PAM and CAM. Both modules integrate u-blox’ core positioning chip technology together with u-blox’ embedded antenna know-how to provide complete, compact, stand-alone positioning solutions.
Business developmentSales increased strongly in several of our market sectors. Highlights during the first half year include:
• Double-digit sales increase of positioning chips and modules for fleet management and vehicle tracking applications, u-blox’ strongest market.
• Revenue from cellular and positioning components used for portable healthcare devices multiplied with the start of production of new end devices.
• Sales of GNSS receivers used to generate precision timing and frequency reference required by mobile base stations more than doubled.
• The TOBY-L100 4G LTE module was certified by Verizon Wireless, enabling customers to leverage the Verizon Wireless
network to develop high speed data connectivity for applications for the American markets.• Ctrack, a division of South Africa based Digicore, a leading
provider of fleet management and vehicle tracking solutions, selected u-blox as their strategic partner for embedded positioning and mobile communications technology.
• Swedish WTS (“Wonder Technology Solutions”) launched Trax, the world’s smallest and smartest personal tracking device for children and pets based on a u-blox positioning receiver module with integrated antenna and u-blox cellular module.
Half year report at June 30, 2014
Half year report 2014 | Page 5
AcquisitionsFrom the beginning of 2014 until the release of these half year results, u-blox acquired two companies which have developed mature technologies for short range wireless communications:
• Swedish connectBlue, an established provider of industrial-grade short range radio modules. connectBlue’s products support industry standards Bluetooth and Wi-Fi that enable the last hundreds of meters of connectivity between equipment and the internet. The company has 35 employees and was acquired on May 19, 2014 for 25 million CHF.
• Greek Antcor, a developer of Wi-Fi baseband intellectual property (IP). The purchase gives u-blox technology that will enable the company to develop ruggedized short range communication solutions tailored to demanding industrial and automotive environments. The company has 25 employees and was acquired on August 6, 2014 for 6.3 million CHF. This acquisition is therefore not calculated into the half year results.
These acquisitions expand u-blox’ ability to provide wireless communication components optimized for long-range as well as short-range communications. This is a key advantage for applica-tions in the “Internet of Things” where end devices such as sensors, meters and home appliances are often located within a few hundred meters of a cellular communications terminal or Wi-Fi router.
Condensed consolidated income statement
EmployeesThe number of employees worldwide increased during the first half of 2014. The company employed 550 people at June 30, 2014, an increase of 21.1% as compared to end of 2013.
Revenue breakdown u-blox operates in two segments:
• Wireless and positioning products u-blox develops and sells embedded positioning chips and
modules, and wireless modules which are used in automotive, industrial and consumer applications. Revenue was CHF 121.5 million for the first half of 2014 as compared to CHF 104.4 million in the first half of 2013.
• Wireless services u-blox offers wireless communication technology services in
terms of reference designs and software. In the first half of 2014, revenue for wireless services was CHF 9.5 million as compared to CHF 9.1 million during the first half year 2013.
Expanded global presenceUntil the release of this half year report, u-blox expanded its global organization through the two acquisitions, gaining a center of competence for short range radio modules based in Malmö, Sweden, and a research and development center for industrial Wi-Fi based in Athens, Greece.
Outlooku-blox is on track to meet its previously communicated guidance with revenues between CHF 264 -275 million with an EBIT in the range of CHF 35 – 39 million for the full year 2014. The company continues to gain traction in key markets where the “Internet of Things” is making strong inroads, particularly mobile healthcare devices, small cell communication base-stations, point-of-sales terminals and vehicle applications. Continued strong growth in all these market sectors is forecast.
The indications are based on exchange rates of 1.23 for EUR/CHF, 1.45 for GBP/CHF and 0.90 for USD/CHF. u-blox’ natural hedge against foreign exchange variations at the level of material costs helps maintain its relative gross margin. Revenue and EBIT, however, remain sensitive to the further variation of currency fluctuations against the Swiss Franc.
Fritz Fahrni Thomas Seiler Chairman of the Board of Directors CEO
locate, communicate, accelerate page 4
Condensed consolidated income statement
Revenue breakdown u-blox operates in two segments:
• Wireless and positioning products u-blox develops and sells embedded positioning chips and modules, and wireless modules which are used in automotive, industrial and consumer applications. Revenue was CHF 121.5 million for the first half of 2014 as compared to CHF 104.4 million in the first half of 2013.
• Wireless services u-blox offers wireless communication technology services in terms of reference designs and software. In the first half of 2014, revenue for wireless services was CHF 9.5 million as compared to CHF 9.1 million during the first half year 2013.
Expanded global presence Until the release of this half year report, u-blox expanded its global organization through the two acquisitions, gaining a center of competence for short range radio modules based in Malmö, Sweden, and a research and development center for industrial Wi-Fi based in Athens, Greece.
January - June Jan. - Dec.(in CHF 000s) 2014 2013 2013
(unaudited) (unaudited) (audited)
Revenue 121'625 105'106 219'813% growth 15.7% 35.4%Cost of sales -64'031 -56'003 -118'654
Gross profit 57'594 49'103 101'159% gross profit margin 47.4% 46.7% 46.0%
Operating expenses -38'897 -35'416 -71'192Other income 101 85 83
Operating profit (EBIT) 18'798 13'772 30'050% EBIT margin 15.5% 13.1% 13.7%
Financial income 1'090 299 1'013Finance costs -385 -331 -2'193
Profit before income tax (EBT) 19'503 13'740 28'870
Income tax expense -5'100 -1'577 -4'227
14'403 12'163 24'643% net profit margin 11.8% 11.6% 11.2%
Depreciation and amortization 8'489 7'383 16'138
EBITDA*) 27'287 21'155 46'188% EBITDA margin 22.4% 20.1% 21.0%
EBITDA growth 29.0% 33.2%EBIT growth 36.5% 21.6%Net profit growth 18.4% 36.8%
(*) EBITDA (earnings before interest, taxes, depreciation and amortization) calculated by adding depreciation and amortization to Operating profit(EBIT), in each case determined in accordance with IFRS.
Net profit, attributable to owners of the parent
Page 6 | Half year report 2014
Halbjahresbericht per 30. Juni, 2014
u-blox bleibt im ersten Halbjahr 2014 auf Wachstumskurs, verbessert EBIT-Marge und macht strategische Fortschritte u-blox (SIX: UBXN), ein führender globaler Anbieter von Halbleiterbau-steinen und Modulen für Elektroniksysteme im Bereich der Positionierung und drahtlosen Kommunikation, gibt heute einen Umsatz von CHF 121.6 Millionen für das erste Halbjahr 2014 bekannt. Das entspricht einem Umsatzwachstum von 15.7% gegenüber dem ersten Halbjahr 2013. Der Bruttogewinn steigt auf CHF 57.6 Millionen, woraus sich eine Bruttogewinnmarge von 47.4% ergibt. Der Betriebsgewinn (EBIT) für das erste Halbjahr 2014 beträgt CHF 18.8 Millionen, ein starkes Wachstum von 36.5%. Der Reingewinn wächst um 18.4% auf CHF 14.4 Millionen. u-blox bestätigt die zuvor veröffentlichte Prognose für das Gesamtjahr und erwartet einen Umsatz im Bereich von CHF 264 – 275 Millionen bei einem EBIT im Bereich von CHF 35–39 Millionen.
u-blox erwarb die connectBlue AB mit Sitz in Malmö (Schweden). Nach demBilanzstichtag wurde die Firma Antcor (Griechenland) mit Sitz in Athenübernommen. Beide Unternehmen verfügen über ausgereifte Technologienfür die Kurzstrecken-Funkkommunikation (Bluetooth und Wi-Fi). Finanzielle Kennzahlen für das erste Halbjahr 2014
• Der Gesamtumsatz konnte gegenüber dem ersten Halbjahr 2013 um 15.7% (20% zu konstanten Wechselkursen) auf CHF 121.6 Millionen gesteigert werden.
• Der Bruttogewinn stieg auf CHF 57.6 Millionen bei einer Bruttogewinnmarge von 47.4%.
• Der Betriebsgewinn vor Abschreibungen (EBITDA) betrug CHF 27.3 Millionen bei einer EBITDA-Marge von 22.4%.
• Der Betriebsgewinn (EBIT) wuchs um 36.5% auf CHF 18.8 Millio-nen, was einer EBIT-Marge von 15.5% entspricht.
• Der Reingewinn erhöhte sich im Berichtszeitraum um 18.4% auf CHF 14.4 Millionen oder 11.8% des Umsatzes.
• Das Umlaufvermögen erhöhte sich im Vergleich zum 31. Dezem-ber 2013 um CHF 6.7 Millionen, hauptsächlich infolge des Geschäftswachstums.
• Die Investitionen vor Akquisitionen betrugen CHF 12.9 Millionen, die in erster Linie für den Kapazitätsausbau und die Produkt-entwicklung getätigt wurden.
• Der Cashflow aus operativer Tätigkeit betrug CHF 15.7 Millionen. Allgemein starker Geschäftsverlaufu-blox konnte den Umsatz nach Fakturierungsort im ersten Halbjahr 2014 gegenüber dem Vergleichszeitraum 2013 in Asien-Pazifik und in der EMEA-Region steigern. In Asien-Pazifik wurde ein starkes Umsatzwachstum von 33.1% verzeichnet. In der EMEA-Region erzielte u-blox ein Umsatzplus von 7.6%; der Umsatz in Amerika blieb mit -0.7% praktisch unverändert, bedingt durch die Entscheidung einiger Kunden in den USA, die Produktion nach Asien auszulagern. Ohne diese Effekte wäre der Umsatz in Amerika um 13% gestiegen. Anhaltendes Wachstum im IndustriegütermarktIm u-blox Geschäftsbereich Industriegüter wurden erneut überdurch-schnittliche Ergebnisse erzielt. Wichtigster Umsatzträger waren erneut die Flottenmanagementsysteme, gefolgt von Zeitsynchronisations-anwendungen, die eine beachtliche Zunahme verzeichneten und ihren Umsatzbeitrag im Vergleich zum ersten Halbjahr 2013 deutlich steigerten.
Telematiksysteme, die unter anderem für Versicherungszwecke einge-setzt werden, und Geldautomaten/Kassenterminals erzielten ebenfalls ein stabiles Wachstum. Gesundheitsgeräte, die dem Industriegütermarkt zugeordnet sind, legten überdurchschnittlich zu und wurden das wachs-tumsstärkste Industriesegment des Unternehmens.
Der Umsatz in den weltweiten Automobil- und Konsumgütermärkten verlief konstant. Gute Rentabilität u-blox erreichte erneut eine sehr hohe Rentabilität mit einer EBITDA-Zunahme von 29.0% und einer Steigerung beim EBIT von 36.5%. Das Wachstum des Reingewinns betrug 18.4%, beeinflusst allerdings durch einen höheren Steuersatz aufgrund von Einmaleffekten im Bereich der latenten Steuern.
Markteinführung strategischer ProdukteIm ersten Halbjahr lancierte u-blox mehrere strategische Produkte in den Produktlinien Wireless und Positionierung, in denen neueste Technologien zum Einsatz kommen. Im Januar wurde mit TOBY-L2 das weltweit schnellste LTE-Modul auf den Markt gebracht. Es ist das erste am Markt erhältliche LTE-Modul der Kategorie 4, das Geschwindigkeiten von bis zu 150 Mbit/s unterstützt. Gleichzeitig bietet es Kompatibilität mit 3G und 2G-Netzen – ein wichtiges Merkmal, damit unsere Kunden ihre Produkte ohne Abstriche an die Netzabdeckung aufrüsten können. 4G LTE ist der aktuelle Stand des technisch Möglichen im Bereich der Mobilfunkkommunikation und der Telekommunikationsstandard mit der bisher rasantesten Verbreitung.
Im Bereich Positionierung brachte u-blox die bekannten Modulserien MAX, NEO und LEA auf Basis der 8. Generation der eigenen Positionie-rungschiptechnologie u-blox M8 auf den Markt. Die Module können alle Signale sichtbarer Satelliten der Systeme GPS, GLONASS, BeiDou, QZSS und SBAS empfangen und auswerten und beliebige zwei Satellitensysteme gleichzeitig nutzen, was zu erhöhter Zuverlässigkeit und Genauigkeit sowie schnelleren Aufstartzeiten führt. u-blox M8 ist die weltweit fortschrittlichste Positionierungstechnologie. Sie wird parallel mit den auf der Plattform u-blox 7 basierenden Produkten angeboten, um Kunden sowohl kosten- als auch leistungsoptimierte Optionen zur Verfügung zu stellen.
Das Unternehmen hat seinen ersten Chip mit der revolutionären 3D-Koppelnavigationstechnologie auf den Markt gebracht. Sie ermöglicht Fahrzeugnavigationssystemen die Berechnung einer Position beim Fahren auf mehreren Ebenen, ein typisches Szenario auf mehrstöckigen Strassen oder in Parkhäusern.
Als Ergebnis der connectBlue Akquisition konnte u-blox sieben neueKurzstreckenfunk-Module mit Bluetooth und Wi-Fi-Standard in dasProduktportfolio aufnehmen. Diese Produkte unterstützen u-blox‘ Strategie, Lang- und Kurzstreckenfunk-Module für drahtlose Kommu-nikation anbieten zu können. Beides sind Schlüsselanforderungen für ganzheitliche Kommunikationslösungen im „Internet der Dinge“ (Internet of Things).
Zudem wurden zwei neue Positionierungsmodule mit integrierter Antenneeingeführt: PAM und CAM. Beide Module verbinden die Positionierungs-chip-Kerntechnologie von u-blox mit dem Know-how von u-blox im Bereich integrierter Antennen zu kompakten, eigenständigen Komplett-lösungen für die Positionierung.
GeschäftsentwicklungIn mehreren Marktsektoren wurde ein starkes Umsatzwachstum erzielt. Höhepunkte aus dem ersten Halbjahr:
• Zweistelliger Umsatzanstieg bei Positionierungschips und modulen für Flottenmanagement- und Fahrzeugortungssysteme, dem stärksten Marktsegment von u-blox.
• Der Absatz von Mobilfunk- und Positionierungskomponenten für tragbare Geräte im Gesundheitsbereich hat sich mit dem Produktionsbeginn neuer Endgeräte vervielfacht.
• Der Verkauf von Positionierungsempfängern für Zeitsynchronisation in Mobilfunkbasisstationen hat sich mehr als verdoppelt.
• Das LTE-Modul TOBY-L100 4G LTE wurde von Verizon Wireless zertifiziert. Damit können Kunden das Netz von Verizon Wireless nutzen, um Anwendungen für den amerikanischen Markt mit Hochgeschwindigkeits-Datenkonnektivität auszustatten.
• Ctrack, ein Tochterunternehmen der südafrikanischen Digicore-Gruppe, eines führenden Anbieters von Flottenmanagement- und Fahrzeugortungslösungen, hat u-blox als strategischen Partner für eingebettete Positionierungs- und Mobilkommunikations-Technologie ausgewählt.
• WTS („Wonder Technology Solutions“) aus Schweden hat Trax, das weltweit kleinste und intelligenteste Personal Tracking-Gerät für Kinder und Haustiere, auf den Markt gebracht. Das Gerät basiert auf dem u-blox Positionierungsmodul mit integrierter Antenne und einem Mobilfunkmodul von u-blox.
Half year report 2014 | Page 7
AkquisitionenIm Zeitraum von Anfang 2014 bis zur Veröffentlichung dieser Halbjahresergebnisse hat u-blox zwei Unternehmen erworben, die ausgereifte Technologien für die Kurzstrecken-Funkkommunikation entwickelt haben:
• connectBlue aus Schweden, einen etablierten Anbieter von Kurzstrecken-Funkmodulen für den Einsatz in der Industrie. Die Produkte von connectBlue unterstützen die Industriestandards Bluetooth und Wi-Fi und ermöglichen die Internetanbindung von Geräten auf den letzten hundert Metern. Das Unternehmen beschäftigt 35 Mitarbeiter und wurde am 19. Mai 2014 für einen Kaufpreis von CHF 25 Millionen übernommen.
• Antcor aus Griechenland, einen Entwickler von geistigem Eigentum (IP) im Bereich Wi-Fi Basisband. Durch die Übernahme verfügt u-blox über Technologie, die dem Unternehmen die Entwicklung robuster Kurzstrecken-Kommunikationslösungen, speziell für anspruchsvolle Umgebungsbedingungen im Industrie- und Automobilbereich, ermöglichen wird. Antcor beschäftigt 25 Mitarbeiter und wurde am 6. August 2014 für einen Kaufpreis von CHF 6,3 Millionen übernommen. Diese Akquisition ist daher in den Halbjahresergebnissen nicht berücksichtigt.
Mit diesen Übernahmen baut u-blox seine Fähigkeit aus, Komponenten für die drahtlose Kommunikation anzubieten, die sowohl für die Langstrecken- als auch die Kurzstreckenkommunikation optimiert sind. Dies ist ein wichtiger Vorteil bei Anwendungen im „Internet der Dinge“ (Internet of Things), in dem Endgeräte wie Sensoren, Messgeräte und Haushaltsgeräte sich oftmals im Umkreis von wenigen hundert Metern eines Mobilfunkterminals oder Wi-Fi-Routers befinden.
Zusammengefasste konsolidierte Erfolgsrechnung
MitarbeiterDie Anzahl der Mitarbeiter weltweit hat sich im ersten Halbjahr 2014 erhöht. Zum 30. Juni 2014 beschäftigte das Unternehmen 550 Mitarbeiterinnen und Mitarbeiter. Das entspricht einer Zunahme von 21.1% gegenüber Ende 2013.
Umsatzaufteilung Die Geschäftstätigkeit von u-blox gliedert sich in zwei Segmente:
• Produkte im Bereich drahtlose Kommunikation und Positionierung u-blox entwickelt und verkauft integrierte Positionierungschips und module sowie drahtlose Kommunikationsmodule, die im Auto-
mobil-, Industriegüter- und Konsumgütermarkt Verwendung finden. Der Umsatz belief sich im ersten Halbjahr 2014 auf CHF 121.5 Millionen gegenüber CHF 104.4 Millionen im ersten Halbjahr 2013.
• Dienstleistungen für drahtlose Kommunikation u-blox bietet auch Dienstleistungen auf dem Gebiet der drahtlosen
Kommunikation in Form von Referenzdesigns und Software an. Im ersten Halbjahr 2014 betrug der Umsatz in diesem Segment CHF 9.5 Millionen gegenüber CHF 9.1 Millionen im ersten Halbjahr 2013.
Erweiterte globale PräsenzBis zur Veröffentlichung dieses Halbjahresberichts erweiterte u-blox die globale Organisation: Im Zuge der beiden Akquisitionen übernahm das Unternehmen ein Kompetenzzentrum für Kurzstreckenfunkmodule in Malmö (Schweden) und ein Forschungs- und Entwicklungszentrum für industrielle Wi-Fi-Anwendungen in Athen (Griechenland).
Ausblicku-blox ist auf gutem Weg, die zuvor veröffentlichte Umsatzprognose von CHF 264–275 Millionen bei einem EBIT im Bereich von CHF 35 –39 Millionen für das Gesamtjahr 2014 zu erfüllen. Das Unternehmen baut seine Position in wichtigen Märkten, in denen das „Internet der Dinge“ stark auf dem Vormarsch ist, weiter aus. Dies gilt insbesondere für mobile Gesundheitsgeräte, kleine Mobilfunkbasisstationen, Kassenterminals und Fahrzeuganwendungen. Für alle diese Marktsektoren wird ein anhaltend starkes Wachstum vorhergesagt.
Die Angaben basieren auf Wechselkursen von 1.23 für EUR/CHF, 1.45 für GBP/CHF und 0.90 für USD/CHF. Die natürliche Fremdwährungsabsicherung (Natural Hedge) auf Ebene der Materialkosten hilft die relative Bruttomarge zu stützen. Dennoch werden Umsatz und EBIT von weiteren Änderungen der Währungsbewertungen gegenüber dem Schweizer Franken abhängig sein.
locate, communicate, accelerate Seite 4
Zusammengefasste konsolidierte Erfolgsrechnung
Umsatzaufteilung Die Geschäftstätigkeit von u-blox gliedert sich in zwei Segmente:
• Produkte im Bereich drahtlose Kommunikation und Positionierung u-blox entwickelt und verkauft integrierte Positionierungschips und -module sowie drahtlose Kommunikationsmodule, die im Automobil-, Industriegüter- und Konsumgütermarkt Verwendung finden. Der Umsatz belief sich im ersten Halbjahr 2014 auf CHF 121.5 Millionen gegenüber CHF 104.4 Millionen im ersten Halbjahr 2013.
• Dienstleistungen für drahtlose Kommunikation u-blox bietet auch Dienstleistungen auf dem Gebiet der drahtlosen Kommunikation in Form von Referenzdesigns und Software an. Im ersten Halbjahr 2014 betrug der Umsatz in diesem Segment CHF 9.5 Millionen gegenüber CHF 9.1 Millionen im ersten Halbjahr 2013.
Erweiterte globale Präsenz Bis zur Veröffentlichung dieses Halbjahresberichts erweiterte u-blox die globale Organisation: Im Zuge der beiden Akquisitionen übernahm das Unternehmen ein Kompetenzzentrum für Kurzstreckenfunkmodule in
Jan. - Juni Jan. - Dez.(in Tausend CHF) 2014 2013 2013
(ungeprüft) (ungeprüft) (geprüft)
Umsatz 121'625 105'106 219'813Wachstumsrate gegenüber Vorjahr 15.7% 35.4%Herstellungskosten der verkauften Produkte -64'031 -56'003 -118'654
Bruttogewinn 57'594 49'103 101'159Bruttogewinnmarge in % 47.4% 46.7% 46.0%
Operative Kosten -38'897 -35'416 -71'192Übriger Ertrag 101 85 83
Betriebsgewinn (EBIT) 18'798 13'772 30'050EBIT-Marge 15.5% 13.1% 13.7%
Finanzertrag 1'090 299 1'013Finanzaufwand -385 -331 -2'193
Gewinn vor Steuern (EBT) 19'503 13'740 28'870
Steuern -5'100 -1'577 -4'227
Reingewinn 14'403 12'163 24'643Reingewinnmarge in % 11.8% 11.6% 11.2%
Abschreibungen 8'489 7'383 16'138EBITDA (1) 27'287 21'155 46'188EBITDA-Marge in % 22.4% 20.1% 21.0%
EBITDA Wachstum 29.0% 33.2%EBIT Wachstum 36.5% 21.6%Wachstum Reingewinn 18.4% 36.8%
(1) EBITDA (earnings before interest, taxes, depreciation and amortization) als Addition der Abschreibungen zum Betriebsgewinn (EBIT) berechnet, immer auf Grundlage der Regeln nach IFRS.
Fritz Fahrni Thomas Seiler Chairman of the Board of Directors CEO

Page 8 | Half year report 2014
u-blox Holding AG, ThalwilCondensed consolidated interimfinancial statements June 30, 2014
(in CHF 000s) NotesJune 30, 2014
(unaudited)December 31, 2013
(audited)
Assets
Current assets
Cash and cash equivalents 30’390 33’163
Marketable securities 24’920 27’395
Trade accounts receivable 35’179 29’204
Other receivables 6’799 6’765
Current tax assets 3’631 1’652
Inventory 26’509 22’671
Prepaid expenses and accrued income 1’619 1’501
Total current assets 129’047 122’351
Non-current assets
Property, plant and equipment 13’824 13’764
Goodwill 3 53’265 37’825
Other intangible assets 3 58’864 44’570
Financial assets 480 1’222
Deferred tax assets 6’104 6’777
Total non-current assets 132’537 104’158
Total assets 261’584 226’509
Liabilities and equity
Current liabilities
Trade accounts payable 15’823 15’318
Other payables 5’429 5’454
Current loans 4 20’000 0
Current tax liabilities 235 1’391
Accrued expenses 14’530 13’811
Total current liabilities 56’017 35’974
Non-current liabilities
Other payables 90 822
Provisions 2’761 1’879
Employee benefits 5’145 4’213
Deferred tax liabilities 6’619 3’185
Total non-current liabilities 14’615 10’099
Total liabilities 70’632 46’073
Shareholders’ equity
Share capital 5’899 5’810
Share premium 88’340 92’556
Retained earnings 96’713 82’070
Total equity, attributable to owners of the parent 190’952 180’436
Total liabilities and equity 261’584 226’509
These condensed consolidated interim financial statements should be read in conjunction with the accompanying notes.
Half year report 2014 | Page 9
Consolidated statement of financial position
Page 10 | Half year report 2014
Consolidated income statement
(in CHF 000s) NotesJan. - June 2014
(unaudited)Jan. - June 2013
(unaudited)Jan. - Dec. 2013
(audited)
Revenue 121’625 105’106 219’813
Cost of sales 2 -64’031 -56’003 -118’654
Gross profit 57’594 49’103 101’159
Distribution and marketing expenses -11’505 -10’412 -21’217
Research and development expenses -22’703 -20’134 -38’941
General and administrative expenses -4’689 -4’870 -11’034
Other income 101 85 83
Profit from operations (EBIT) 2 18’798 13’772 30’050
Financial income 1’090 299 1’013
Finance costs -385 -331 -2’193
Profit before income tax (EBT) 19’503 13’740 28’870
Income tax expense -5’100 -1’577 -4’227
Net profit, attributable toowners of the parent 14’403 12’163 24’643
Basic earnings per share (in CHF) 2.22 1.92 3.86
Diluted earnings per share (in CHF) 2.13 1.89 3.75
These consolidated interim financial statements should be read in conjunction with the accompanying notes.
Consolidated statement of comprehensive income
(in CHF 000s)Jan. - June 2014
(unaudited)Jan. - June 2013
(unaudited)Jan. - Dec. 2013
(audited)
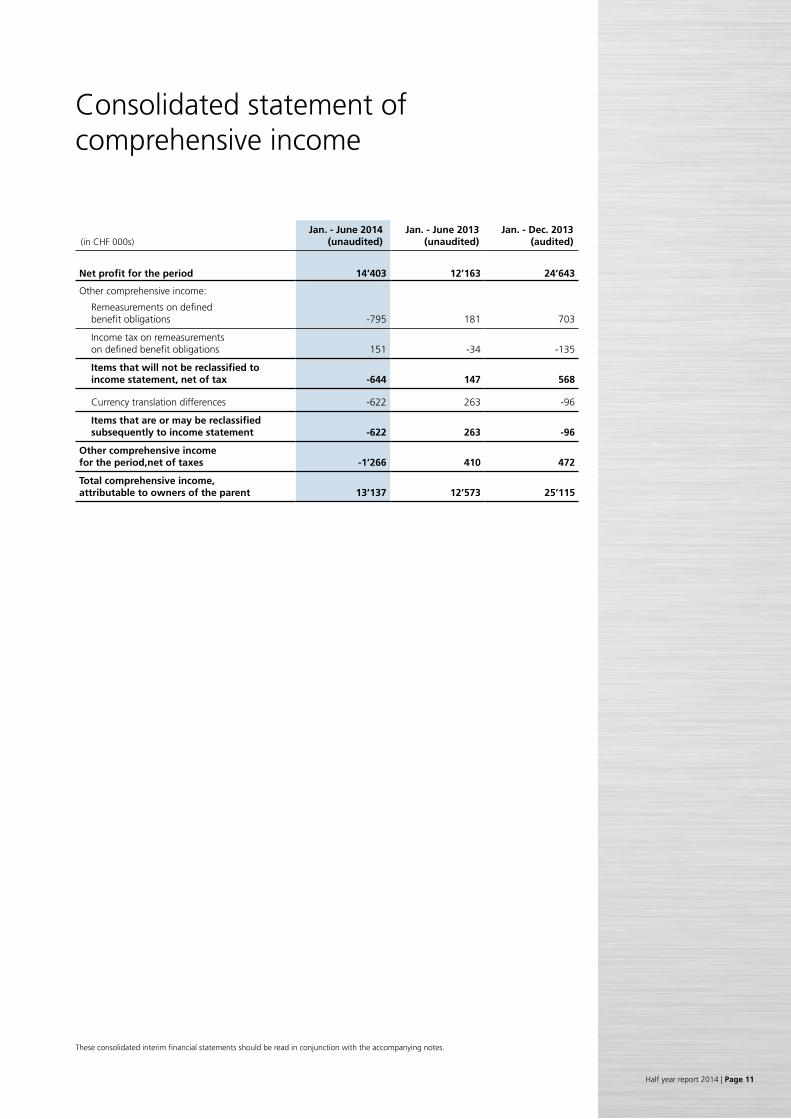
Net profit for the period 14’403 12’163 24’643
Other comprehensive income:
Remeasurements on definedbenefit obligations -795 181 703
Income tax on remeasurements on defined benefit obligations 151 -34 -135
Items that will not be reclassified to income statement, net of tax -644 147 568
Currency translation differences -622 263 -96
Items that are or may be reclassified subsequently to income statement -622 263 -96
Other comprehensive income for the period,net of taxes -1’266 410 472
Total comprehensive income, attributable to owners of the parent 13’137 12’573 25’115
These consolidated interim financial statements should be read in conjunction with the accompanying notes.
Half year report 2014 | Page 11
Page 12 | Half year report 2014
Consolidated statement of changes in equity
These consolidated interim financial statements should be read in conjunction with the accompanying notes.
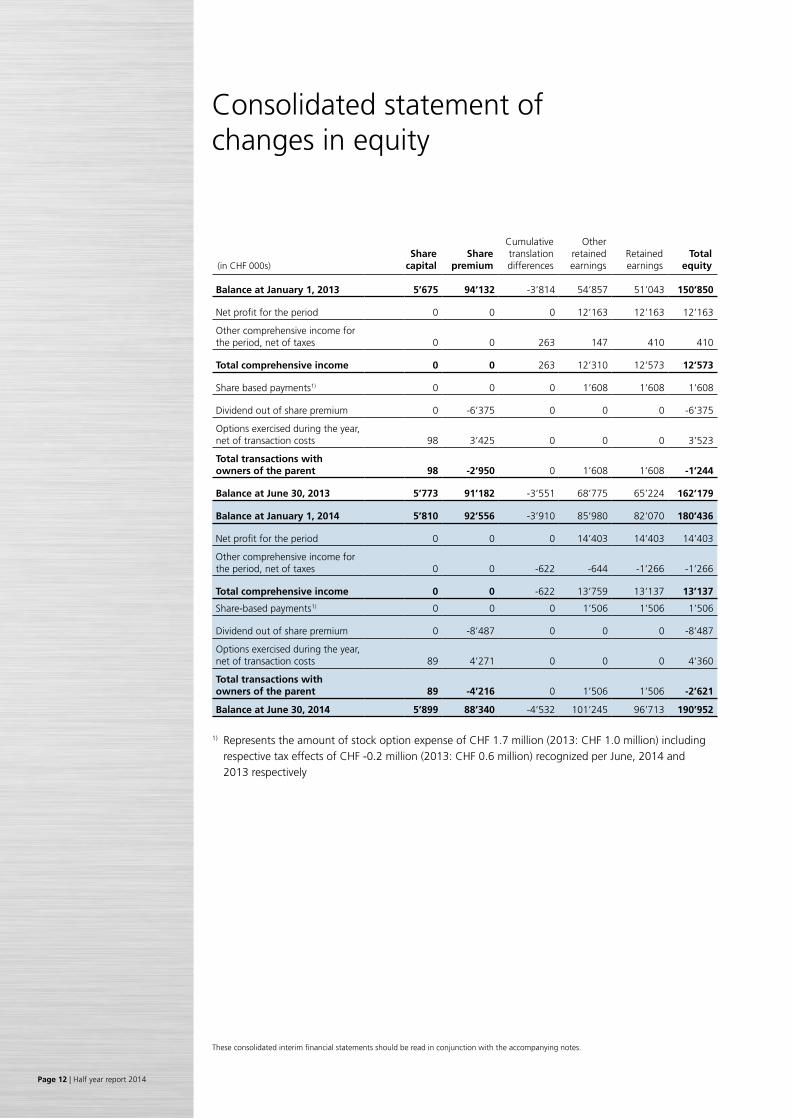
(in CHF 000s)Share
capitalShare
premium
Cumulative translation differences
Other retained earnings
Retainedearnings
Total equity
Balance at January 1, 2013 5’675 94’132 -3’814 54’857 51’043 150’850
Net profit for the period 0 0 0 12’163 12’163 12’163
Other comprehensive income for the period, net of taxes 0 0 263 147 410 410
Total comprehensive income 0 0 263 12’310 12’573 12’573
Share based payments1) 0 0 0 1’608 1’608 1’608
Dividend out of share premium 0 -6’375 0 0 0 -6’375
Options exercised during the year, net of transaction costs 98 3’425 0 0 0 3’523
Total transactions with owners of the parent 98 -2’950 0 1’608 1’608 -1’244
Balance at June 30, 2013 5’773 91’182 -3’551 68’775 65’224 162’179
Balance at January 1, 2014 5’810 92’556 -3’910 85’980 82’070 180’436
Net profit for the period 0 0 0 14’403 14’403 14’403
Other comprehensive income for the period, net of taxes 0 0 -622 -644 -1’266 -1’266
Total comprehensive income 0 0 -622 13’759 13’137 13’137
Share-based payments1) 0 0 0 1’506 1’506 1’506
Dividend out of share premium 0 -8’487 0 0 0 -8’487
Options exercised during the year, net of transaction costs 89 4’271 0 0 0 4’360
Total transactions with owners of the parent 89 -4’216 0 1’506 1’506 -2’621
Balance at June 30, 2014 5’899 88’340 -4’532 101’245 96’713 190’952
1) Represents the amount of stock option expense of CHF 1.7 million (2013: CHF 1.0 million) including respective tax effects of CHF -0.2 million (2013: CHF 0.6 million) recognized per June, 2014 and 1) 2013 respectively
Condensed statement of cash flows
These consolidated interim financial statements should be read in conjunction with the accompanying notes.
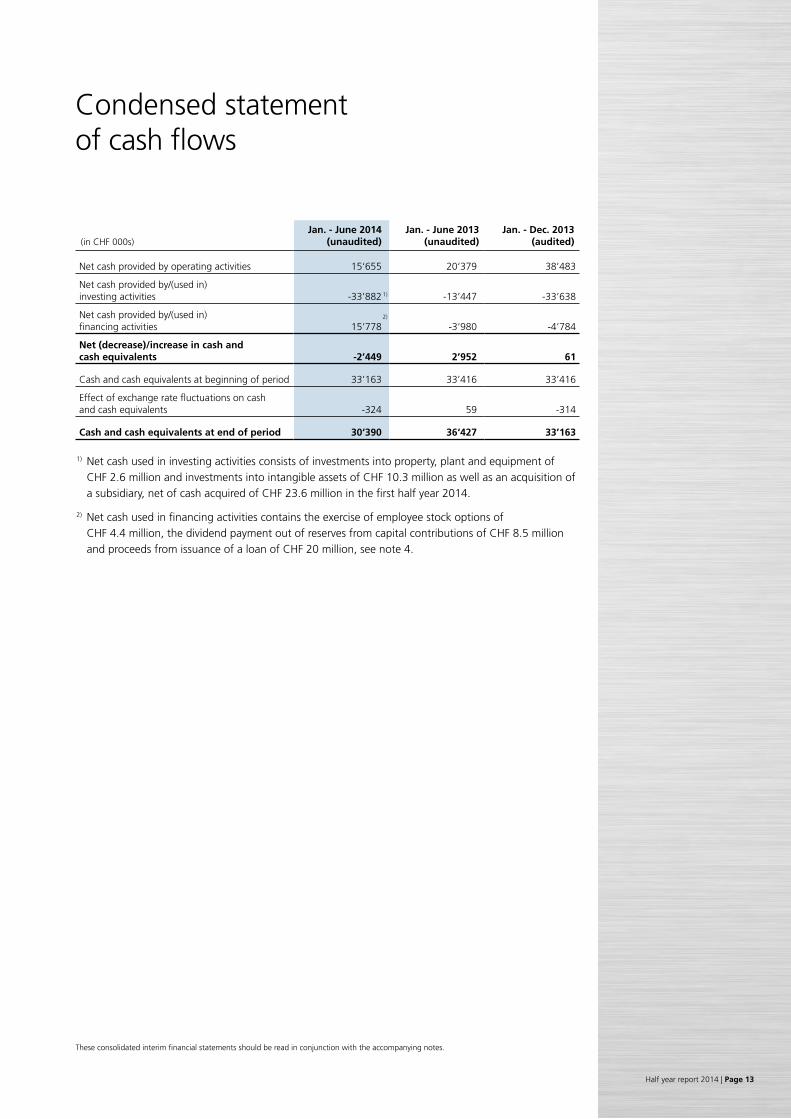
(in CHF 000s)Jan. - June 2014
(unaudited)Jan. - June 2013
(unaudited)Jan. - Dec. 2013
(audited)
Net cash provided by operating activities 15‘655 20‘379 38’483
Net cash provided by/(used in)investing activities -33’882 -13’447 -33’638
Net cash provided by/(used in) financing activities 15‘778 -3‘980 -4’784
Net (decrease)/increase in cash andcash equivalents -2’449 2’952 61
Cash and cash equivalents at beginning of period 33’163 33’416 33’416
Effect of exchange rate fluctuations on cash and cash equivalents -324 59 -314
Cash and cash equivalents at end of period 30‘390 36‘427 33’163
1) Net cash used in investing activities consists of investments into property, plant and equipment of CHF 2.6 million and investments into intangible assets of CHF 10.3 million as well as an acquisition of a subsidiary, net of cash acquired of CHF 23.6 million in the first half year 2014.
2) Net cash used in financing activities contains the exercise of employee stock options of CHF 4.4 million, the dividend payment out of reserves from capital contributions of CHF 8.5 million and proceeds from issuance of a loan of CHF 20 million, see note 4.
Half year report 2014 | Page 13
1)
2)
Page 15 | u-blox Annual Report 2008
Notes to the condensed consolidated interim financial statements
1 Basis of preparation of the condensed consolidated
interim financial statements
The condensed consolidated interim financial statements of u-blox Holding AG (‘u-blox’ or the ‘Group’) were prepared in accordance with IAS 34 “Interim Financial Reporting”. These condensed consolidated interim financial statements do not include all the notes contained in the consolidated annual financial statements, and for that reason should be read in conjunction with the consolidated annual financial statements for the year ended December 31, 2013.
The condensed consolidated interim financial statements have been prepared in Swiss francs (CHF), rounded to the nearest thousand. The accounting policies applied in the condensed consolidated interim financial statements are consistent with those used in the consolidated financial statements for the year ended December 31, 2013, except for the changes mentioned in the chapter below.
The preparation of the condensed consolidated interim financial statements requires management judgments, estimates and assumptions that affect the application of policies and reported amounts of assets and liabilities, income and expenses as well as disclosure of contingent assets and liabilities.
Although these judgments, estimates and assumptions are based on management’s best knowledge of current events and actions, actual results may ultimately differ from those estimates.
In the condensed consolidated interim financial statements significant estimates and assumptions made by management are not different from those made in the consolidated financial statements for the year ended December 31, 2013.
Income taxes are recognized based on best estimate of the weighted average annual tax rate for 2014. The Group operates in markets where no significant seasonal or cyclical variations in revenue are experienced during the financial year.
For the condensed consolidated interim financial statements, a EUR/CHF exchange rate of 1.215 and a USD/CHF exchange rate of 0.890 was applied at the end-of-period (31 December 2013 EUR/CHF 1.226, USD/CHF 0.889). For the period an average exchange rate of EUR/CHF 1.235 and USD/CHF 0.900 was applied (previous period: EUR/CHF 1.228, USD/CHF 0.944).
Changes in accounting policiesAs of January 1, 2014, u-blox adopted various new and amended International Financial Reporting Standards (IFRS) and Interpretations, none of which have a material impact on the consolidated financial statements of u-blox.
Page 14 | Half year report 2014
u-blox Annual Report 2008 | Page 16Half year report 2014 | Page 15
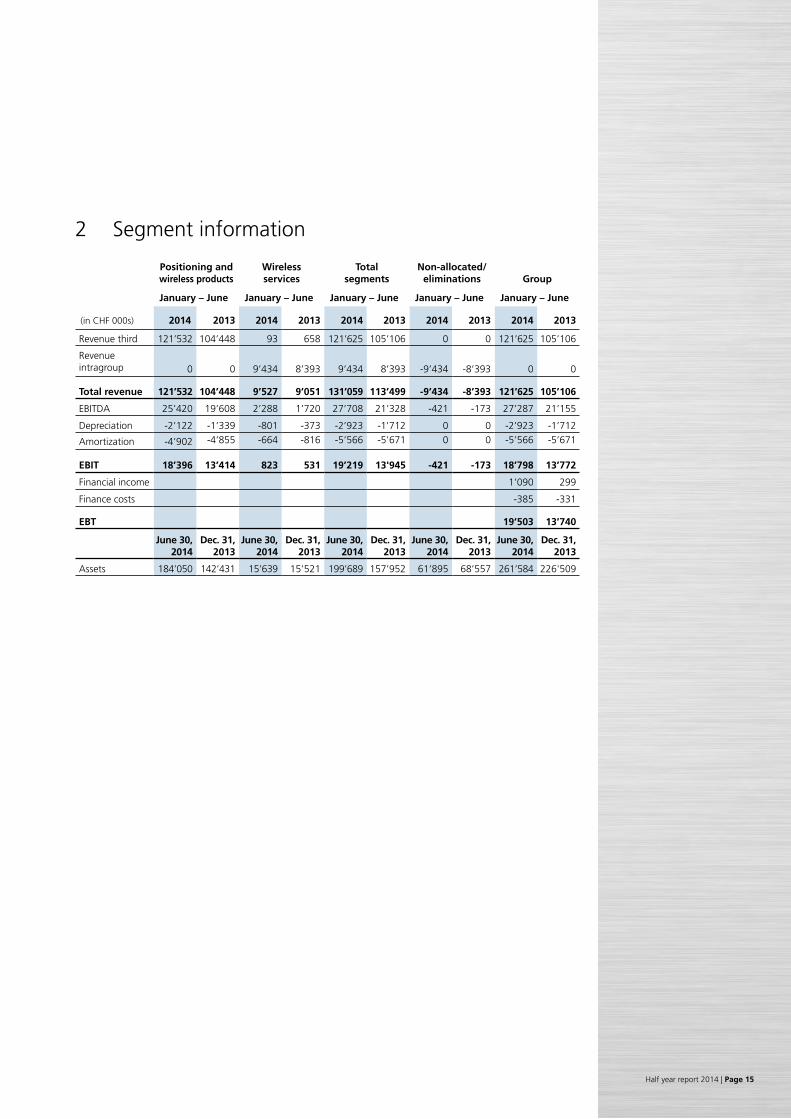
2 Segment information
Positioning andwireless products
Wireless services
Totalsegments
Non-allocated/ eliminations Group
January – June January – June January – June January – June January – June
(in CHF 000s) 2014 2013 2014 2013 2014 2013 2014 2013 2014 2013
Revenue third 121’532 104’448 93 658 121’625 105’106 0 0 121’625 105’106
Revenue intragroup 0 0 9’434 8’393 9’434 8’393 -9’434 -8’393 0 0
Total revenue 121’532 104’448 9’527 9’051 131’059 113’499 -9’434 -8’393 121’625 105’106
EBITDA 25’420 19’608 2’288 1’720 27’708 21’328 -421 -173 27’287 21’155
Depreciation -2’122 -1’339 -801 -373 -2’923 -1'712 0 0 -2’923 -1’712
Amortization -4’902 -4’855 -664 -816 -5’566 -5'671 0 0 -5’566 -5’671
EBIT 18’396 13’414 823 531 19’219 13'945 -421 -173 18’798 13’772
Financial income 1’090 299
Finance costs -385 -331
EBT 19’503 13’740
June 30,2014
Dec. 31,2013
June 30,2014
Dec. 31,2013
June 30,2014
Dec. 31,2013
June 30,2014
Dec. 31,2013
June 30,2014
Dec. 31,2013
Assets 184’050 142’431 15’639 15’521 199’689 157’952 61’895 68’557 261’584 226'509
Page 17 |
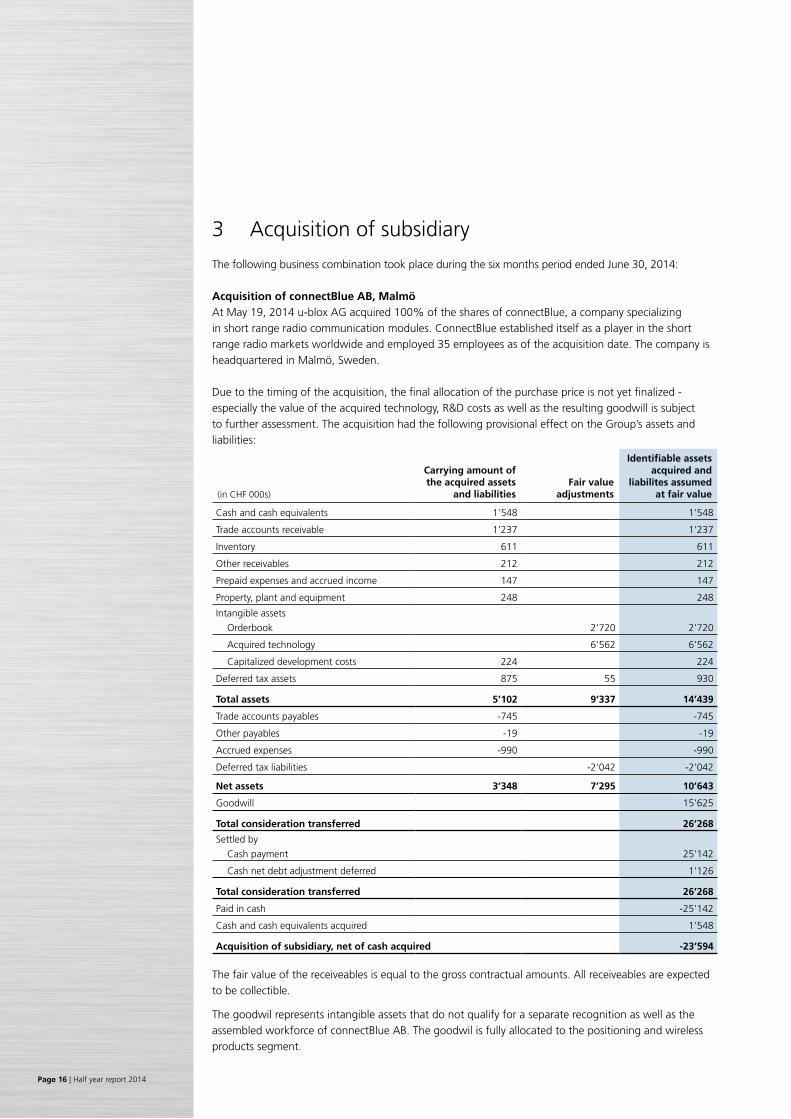
3 Acquisition of subsidiary
The following business combination took place during the six months period ended June 30, 2014:
Acquisition of connectBlue AB, MalmöAt May 19, 2014 u-blox AG acquired 100% of the shares of connectBlue, a company specializing in short range radio communication modules. ConnectBlue established itself as a player in the short range radio markets worldwide and employed 35 employees as of the acquisition date. The company is headquartered in Malmö, Sweden.
Due to the timing of the acquisition, the final allocation of the purchase price is not yet finalized - especially the value of the acquired technology, R&D costs as well as the resulting goodwill is subject to further assessment. The acquisition had the following provisional effect on the Group’s assets and liabilities:
Page 16 | Half year report 2014
(in CHF 000s)
Carrying amount of the acquired assets
and liabilitiesFair value
adjustments
Identifiable assets acquired and
liabilites assumed at fair value
Cash and cash equivalents 1’548 1’548
Trade accounts receivable 1’237 1’237
Inventory 611 611
Other receivables 212 212
Prepaid expenses and accrued income 147 147
Property, plant and equipment 248 248
Intangible assets
Orderbook 2’720 2’720
Acquired technology 6’562 6’562
Capitalized development costs 224 224
Deferred tax assets 875 55 930
Total assets 5’102 9’337 14’439
Trade accounts payables -745 -745
Other payables -19 -19
Accrued expenses -990 -990
Deferred tax liabilities -2’042 -2’042
Net assets 3’348 7’295 10’643
Goodwill 15’625
Total consideration transferred 26’268
Settled by
Cash payment 25’142
Cash net debt adjustment deferred 1’126
Total consideration transferred 26’268
Paid in cash -25’142
Cash and cash equivalents acquired 1’548
Acquisition of subsidiary, net of cash acquired -23’594
The fair value of the receiveables is equal to the gross contractual amounts. All receiveables are expected to be collectible.
The goodwil represents intangible assets that do not qualify for a separate recognition as well as the assembled workforce of connectBlue AB. The goodwil is fully allocated to the positioning and wireless products segment.
| Page 18Half year report 2014 | Page 17
Had connectBlue AB been taken over at January 1, 2014, the revenue had been increased by CHF 4.4 million and an EBIT had resulted of approximately CHF 19.2 million. The impact on revenue and profit since acquisition is not significant.
The name of the company was changed to u-blox, Malmö in August 2014.
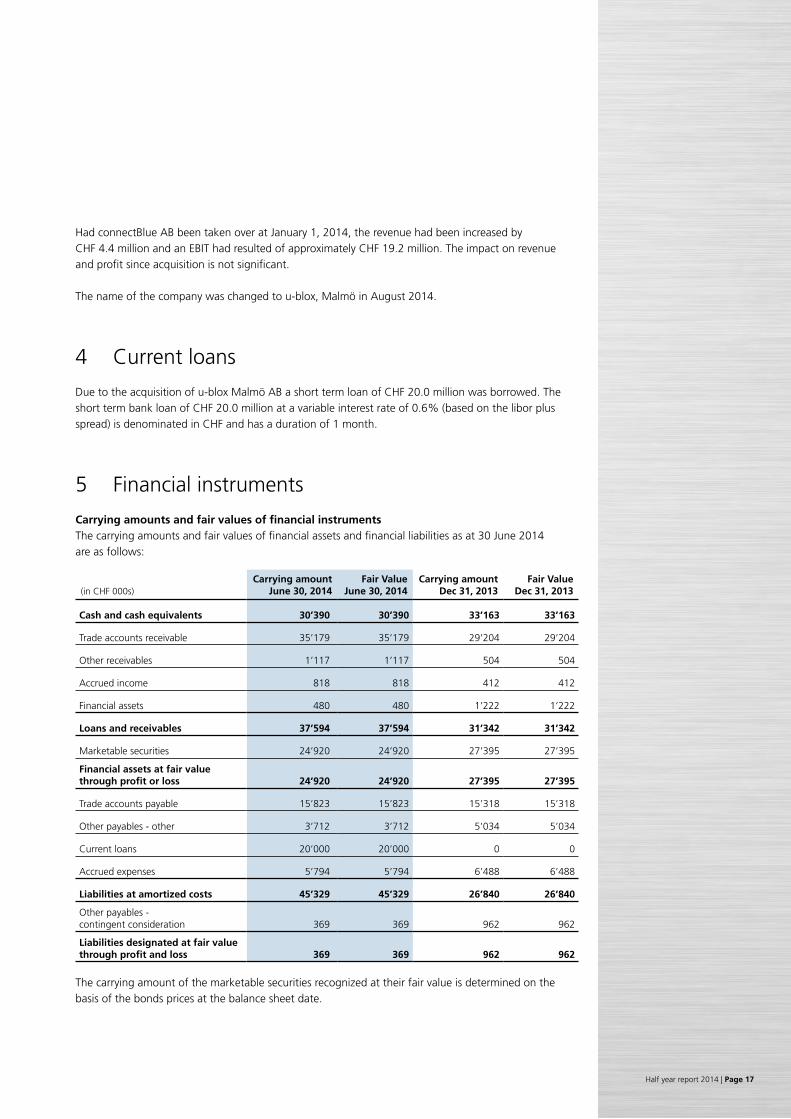
4 Current loans
Due to the acquisition of u-blox Malmö AB a short term loan of CHF 20.0 million was borrowed. The short term bank loan of CHF 20.0 million at a variable interest rate of 0.6% (based on the libor plus spread) is denominated in CHF and has a duration of 1 month.
5 Financial instruments
Carrying amounts and fair values of financial instruments The carrying amounts and fair values of financial assets and financial liabilities as at 30 June 2014are as follows:
(in CHF 000s)Carrying amount
June 30, 2014Fair Value
June 30, 2014Carrying amount
Dec 31, 2013Fair Value
Dec 31, 2013
Cash and cash equivalents 30’390 30’390 33’163 33’163
Trade accounts receivable 35’179 35’179 29’204 29’204
Other receivables 1’117 1’117 504 504
Accrued income 818 818 412 412
Financial assets 480 480 1’222 1’222
Loans and receivables 37’594 37’594 31’342 31’342
Marketable securities 24’920 24’920 27’395 27’395
Financial assets at fair value through profit or loss 24’920 24’920 27’395 27’395
Trade accounts payable 15’823 15’823 15’318 15’318
Other payables - other 3’712 3’712 5’034 5’034
Current loans 20’000 20’000 0 0
Accrued expenses 5’794 5’794 6’488 6’488
Liabilities at amortized costs 45’329 45’329 26’840 26’840
Other payables - contingent consideration 369 369 962 962
Liabilities designated at fair value through profit and loss 369 369 962 962
The carrying amount of the marketable securities recognized at their fair value is determined on the basis of the bonds prices at the balance sheet date.
Page 19 | u-blox Annual Report 2008Page 18 | Half year report 2014
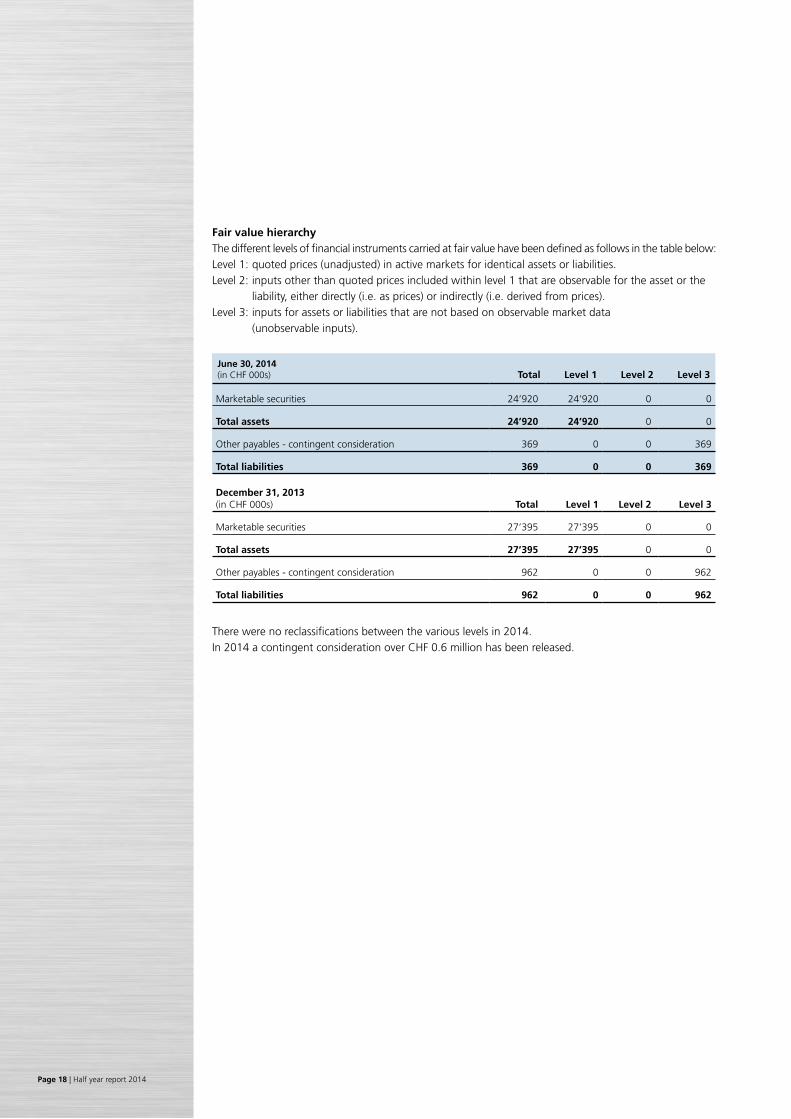
Fair value hierarchyThe different levels of financial instruments carried at fair value have been defined as follows in the table below:Level 1: quoted prices (unadjusted) in active markets for identical assets or liabilities.Level 2: inputs other than quoted prices included within level 1 that are observable for the asset or the liability, either directly (i.e. as prices) or indirectly (i.e. derived from prices).Level 3: inputs for assets or liabilities that are not based on observable market data (unobservable inputs).
June 30, 2014(in CHF 000s) Total Level 1 Level 2 Level 3
Marketable securities 24’920 24’920 0 0
Total assets 24’920 24’920 0 0
Other payables - contingent consideration 369 0 0 369
Total liabilities 369 0 0 369
December 31, 2013(in CHF 000s) Total Level 1 Level 2 Level 3
Marketable securities 27’395 27’395 0 0
Total assets 27’395 27’395 0 0
Other payables - contingent consideration 962 0 0 962
Total liabilities 962 0 0 962
There were no reclassifications between the various levels in 2014. In 2014 a contingent consideration over CHF 0.6 million has been released.
u-blox Annual Report 2008 | Page 20Half year report 2014 | Page 19
6 Dividend
On April 29, 2014 the Annual General Meeting of u-blox AG approved a gross dividend of CHF 1.30 per share. A total dividend amount of CHF 8.5 million was paid out on May 5, 2014.
7 Guarantees, pledges in favor of third parties and
other contingent liabilities
At June 30, 2014 and Dember 31, 2013 there were no guarantees in favour of third parties. The group is not exposed to any significant other contingent liabilities. There is no known threatened or pending litigation against any group company.
8 Subsequent events
Pending acquisition of Antcor Advanced Network Technologies S.A.At August 6, 2014 u-blox announced the acquisition of 100% of the shares of Antcor Advanced Network Technologies S.A. Athen (GR) a developer of Wi-Fi baseband intellectual property (IP).The acquisition at a price of approximately EUR 5 million excluding an earn-out which offers the sellers the possibility to participate in certain future revenues of the company. Due to the timing of the acqusition, the final allocation of the purchase price is not yet finalized.
The Board of Directors authorized on September 4, 2014 these condensed consolidated interim financial statements for publication.
Page 21 | Page 20 | Half year report 2014
Investor information and contacts
u-blox Holding AG
Corporate address
Investor relations
Website
Financial calendar
Ticker details for u-blox shares• Listing SIX Swiss Exchange• Ticker symbol UBXN• ISIN-No. CH0033361673• Swiss Security-No. 3336167• Reuters UBXN.S• Bloomberg UBXN:SW
u-blox Holding AGZürcherstrasse 688800 ThalwilSwitzerlandPhone +41 44 722 74 44Fax +41 44 722 74 47
Roland JudChief Financial Officer E-mail: [email protected]
www.u-blox.com
• Annual results 2014: March 19, 2015• Annual General Meeting 2014: April 28, 2015
| Page 22
DisclaimerThis document contains certain forward-looking statements. Such forward-looking statements reflect the current views of management and are subject to known and unknown risks, uncertainties and other factors that may cause actual results, performance or achievements of the u-blox Group to differ materially from those expressed or implied. These include risks related to the success of and demand for the Group’s products, the potential for the Group’s products to become obsolete, the Group’s ability to defend its intellectual property, the Group’s ability to develop and commercialize new products in a timely manner, the dynamic and competitive environment in which the Group operates, the regulatory environment, changes in currency exchange rates, the Group’s ability to generate revenues and profitability, and the Group’s ability to realize its expansion projects in a timely manner. Should one or more of these risks or uncertainties materialize, or should underlying assumptions prove incorrect, actual results may vary materially from those described in this report. u-blox is providing the information in this release as of this date and does not undertake any obligation to update any forward-looking statements contained in it as a result of new information, future events or otherwise.
ImprintPublisher / Copyright: September 2014 u-blox Holding AG, Thalwil, Switzerland.
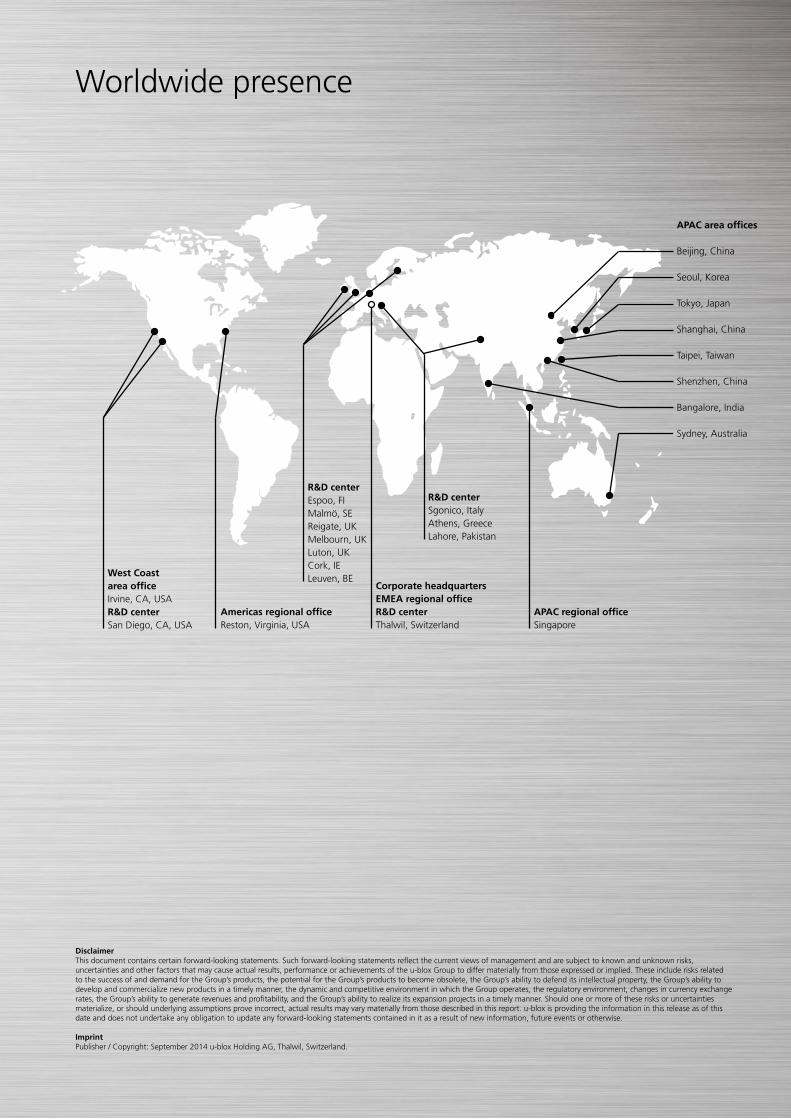
Worldwide presence
R&D centerEspoo, FIMalmö, SEReigate, UKMelbourn, UKLuton, UKCork, IELeuven, BE
R&D centerSgonico, ItalyAthens, GreeceLahore, Pakistan
Americas regional officeReston, Virginia, USA
West Coastarea officeIrvine, CA, USAR&D centerSan Diego, CA, USA
Corporate headquarters EMEA regional officeR&D centerThalwil, Switzerland
APAC regional officeSingapore
APAC area offices
Beijing, China
Seoul, Korea
Tokyo, Japan
Shanghai, China
Taipei, Taiwan
Shenzhen, China
Bangalore, India
Sydney, Australia