Embed Size (px)
Citation preview

Wireless Control Components
ASK / FSK Single Conversion Receivers
TDA 521X Version 1.1
Application Note February 2004

Edition 02.04Published by Infineon Technologies AG,Balanstraße 73,81541 München© Infineon Technologies AG February 2004.All Rights Reserved.Attention please!As far as patents or other rights of third parties are concerned, liability is only assumed for components, not for applications, processes and circuits im-plemented within components or assemblies.The information describes the type of component and shall not be considered as assured characteristics.Terms of delivery and rights to change design reserved.Due to technical requirements components may contain dangerous substances. For information on the types in question please contact your nearest Infineon Technologies Office.Infineon Technologies AG is an approved CECC manufacturer.PackingPlease use the recycling operators known to you. We can also help you – get in touch with your nearest sales office. By agreement we will take packing material back, if it is sorted. You must bear the costs of transport. For packing material that is returned to us unsorted or which we are not obliged to accept, we shall have to invoice you for any costs incurred.Components used in life-support devices or systems must be expressly authorized for such purpose!Critical components1 of the Infineon Technologies AG, may only be used in life-support devices or systems2 with the express written approval of the Infineon Technologies AG.1 A critical component is a component used in a life-support device or system whose failure can reasonably be expected to cause the failure of that life-
support device or system, or to affect its safety or effectiveness of that device or system.2 Life support devices or systems are intended (a) to be implanted in the human body, or (b) to support and/or maintain and sustain human life. If they
fail, it is reasonable to assume that the health of the user may be endangered.
ABM®, AOP®, ARCOFI®, ARCOFI®-BA, ARCOFI®-SP, DigiTape®, EPIC®-1, EPIC®-S, ELIC®, FALC®54, FALC®56, FALC®-E1, FALC®-LH, IDEC®, IOM®, IOM®-1, IOM®-2, IPAT®-2, ISAC®-P, ISAC®-S, ISAC®-S TE, ISAC®-P TE, ITAC®, IWE®, MUSAC®-A, OCTAT®-P, QUAT®-S, SICAT®, SICOFI®, SICOFI®-2, SICOFI®-4, SICOFI®-4µC, SLICOFI® are registered trademarks of Infineon Technologies AG.
ACE™, ASM™, ASP™, POTSWIRE™, QuadFALC™, SCOUT™ are trademarks of Infineon Technologies AG.
This Application Note describes the Single Conversion Receiver TDA 5210 in design step A3, TDA5211 in design step B4 and TDA5212 in design step C3.
Revision History
Current Version: 1.1 as of 11.02.04
Previous Version: -
Page(in previous Version)
Page(in current Version)
Subjects (major changes since last revision)
4-36 4-36 - 4-37 calculation changes of the slicing level time constant

1 Table of Contents
1 Table of Contents . . . . . . . . . . . . . . . . . . . . . . . . . . . . . . . . . . . . . . . . . . . . . . . . . . . . . . . . . . . . i
2 Product Overview . . . . . . . . . . . . . . . . . . . . . . . . . . . . . . . . . . . . . . . . . . . . . . . . . . . . . . . . . . . . 2-1
2.1 Abstract . . . . . . . . . . . . . . . . . . . . . . . . . . . . . . . . . . . . . . . . . . . . . . . . . . . . . . . . . . . . . . . 2-2
2.2 Product Description . . . . . . . . . . . . . . . . . . . . . . . . . . . . . . . . . . . . . . . . . . . . . . . . . . . . . . 2-2
2.3 Package Outlines . . . . . . . . . . . . . . . . . . . . . . . . . . . . . . . . . . . . . . . . . . . . . . . . . . . . . . . . 2-4
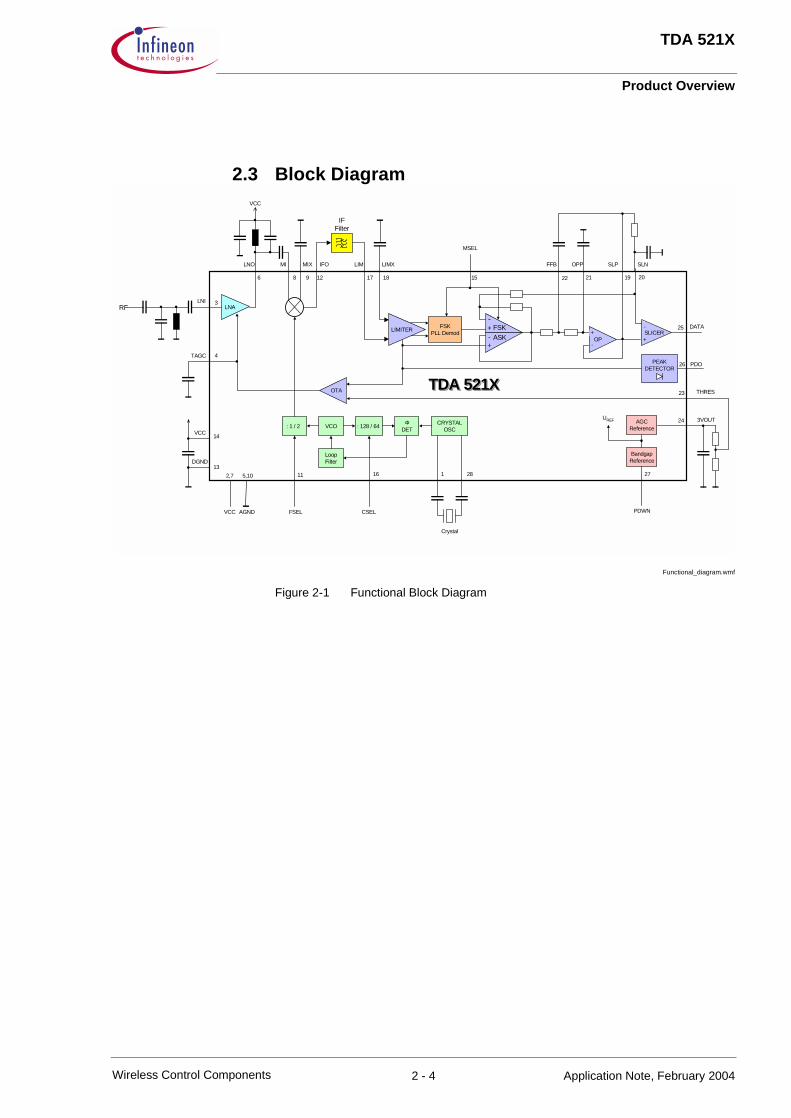
3 Pin Configuration and Function . . . . . . . . . . . . . . . . . . . . . . . . . . . . . . . . . . . . . . . . . . . . . . . . . 3-1
3.1 Pin Configuration . . . . . . . . . . . . . . . . . . . . . . . . . . . . . . . . . . . . . . . . . . . . . . . . . . . . . . . . 3-2
3.2 Pin Definition and Function. . . . . . . . . . . . . . . . . . . . . . . . . . . . . . . . . . . . . . . . . . . . . . . . . 3-3
4 Functional Description . . . . . . . . . . . . . . . . . . . . . . . . . . . . . . . . . . . . . . . . . . . . . . . . . . . . . . . . 4-1
4.1 Low-Noise Amplifier (LNA) . . . . . . . . . . . . . . . . . . . . . . . . . . . . . . . . . . . . . . . . . . . . . . . . . 4-2
4.2 AGC . . . . . . . . . . . . . . . . . . . . . . . . . . . . . . . . . . . . . . . . . . . . . . . . . . . . . . . . . . . . . . . . . . 4-8
4.3 Mixer. . . . . . . . . . . . . . . . . . . . . . . . . . . . . . . . . . . . . . . . . . . . . . . . . . . . . . . . . . . . . . . . . . 4-12
4.4 Overall Performance of the Front End . . . . . . . . . . . . . . . . . . . . . . . . . . . . . . . . . . . . . . . . 4-12
4.5 PLL Synthesizer . . . . . . . . . . . . . . . . . . . . . . . . . . . . . . . . . . . . . . . . . . . . . . . . . . . . . . . . . 4-14
4.6 Reference Oscillator . . . . . . . . . . . . . . . . . . . . . . . . . . . . . . . . . . . . . . . . . . . . . . . . . . . . . . 4-16
4.7 IF Section . . . . . . . . . . . . . . . . . . . . . . . . . . . . . . . . . . . . . . . . . . . . . . . . . . . . . . . . . . . . . . 4-24
4.7.1 IF Amplifier . . . . . . . . . . . . . . . . . . . . . . . . . . . . . . . . . . . . . . . . . . . . . . . . . . . . . . . . . . . . . 4-24
4.7.2 IF Filtering. . . . . . . . . . . . . . . . . . . . . . . . . . . . . . . . . . . . . . . . . . . . . . . . . . . . . . . . . . . . . . 4-24
4.8 ASK/FSK Switch Functional Description . . . . . . . . . . . . . . . . . . . . . . . . . . . . . . . . . . . . . . 4-27
4.8.1 FSK Mode. . . . . . . . . . . . . . . . . . . . . . . . . . . . . . . . . . . . . . . . . . . . . . . . . . . . . . . . . . . . . . 4-27
4.8.2 ASK Mode . . . . . . . . . . . . . . . . . . . . . . . . . . . . . . . . . . . . . . . . . . . . . . . . . . . . . . . . . . . . . 4-29
4.9 Demodulation . . . . . . . . . . . . . . . . . . . . . . . . . . . . . . . . . . . . . . . . . . . . . . . . . . . . . . . . . . . 4-30
4.9.1 ASK Demodulation . . . . . . . . . . . . . . . . . . . . . . . . . . . . . . . . . . . . . . . . . . . . . . . . . . . . . . . 4-30
4.9.2 FSK Demodulation . . . . . . . . . . . . . . . . . . . . . . . . . . . . . . . . . . . . . . . . . . . . . . . . . . . . . . . 4-32
4.10 Data Filtering . . . . . . . . . . . . . . . . . . . . . . . . . . . . . . . . . . . . . . . . . . . . . . . . . . . . . . . . . . . 4-34
4.11 Data Slicer . . . . . . . . . . . . . . . . . . . . . . . . . . . . . . . . . . . . . . . . . . . . . . . . . . . . . . . . . . . . . 4-35
4.12 Principle of the Precharge Circuit . . . . . . . . . . . . . . . . . . . . . . . . . . . . . . . . . . . . . . . . . . . . 4-44
4.13 Quiet Data Output during no Transmission . . . . . . . . . . . . . . . . . . . . . . . . . . . . . . . . . . . . . 4-48
4.14 Decoder . . . . . . . . . . . . . . . . . . . . . . . . . . . . . . . . . . . . . . . . . . . . . . . . . . . . . . . . . . . . . . . 4-51
4.15 Settling Time. . . . . . . . . . . . . . . . . . . . . . . . . . . . . . . . . . . . . . . . . . . . . . . . . . . . . . . . . . . . 4-51
4.16 Spurious Radiation . . . . . . . . . . . . . . . . . . . . . . . . . . . . . . . . . . . . . . . . . . . . . . . . . . . . . . . 4-54
4.17 Sensitivity Measurements. . . . . . . . . . . . . . . . . . . . . . . . . . . . . . . . . . . . . . . . . . . . . . . . . . 4-55
4.17.1 Test Setup . . . . . . . . . . . . . . . . . . . . . . . . . . . . . . . . . . . . . . . . . . . . . . . . . . . . . . . . . . . . . 4-55
4.17.2 Sensitivity of RKE Receivers . . . . . . . . . . . . . . . . . . . . . . . . . . . . . . . . . . . . . . . . . . . . . . . 4-56
4.17.3 Dependance of the ambient Temperature . . . . . . . . . . . . . . . . . . . . . . . . . . . . . . . . . . . . . 4-57
4.17.4 Sensitivity depending on the IF Filter Bandwidth . . . . . . . . . . . . . . . . . . . . . . . . . . . . . . . . 4-58
4.17.5 Dependance of Data Filter Bandwidth . . . . . . . . . . . . . . . . . . . . . . . . . . . . . . . . . . . . . . . . 4-59
5 Reference . . . . . . . . . . . . . . . . . . . . . . . . . . . . . . . . . . . . . . . . . . . . . . . . . . . . . . . . . . . . . . . . . . . 5-1
5.1 Test Circuit . . . . . . . . . . . . . . . . . . . . . . . . . . . . . . . . . . . . . . . . . . . . . . . . . . . . . . . . . . . . . 5-2
5.2 Test Board Layouts . . . . . . . . . . . . . . . . . . . . . . . . . . . . . . . . . . . . . . . . . . . . . . . . . . . . . . 5-3
5.3 Bill of Materials . . . . . . . . . . . . . . . . . . . . . . . . . . . . . . . . . . . . . . . . . . . . . . . . . . . . . . . . . . 5-5
6 List of Figures . . . . . . . . . . . . . . . . . . . . . . . . . . . . . . . . . . . . . . . . . . . . . . . . . . . . . . . . . . . . . . . i
7 List of Tables . . . . . . . . . . . . . . . . . . . . . . . . . . . . . . . . . . . . . . . . . . . . . . . . . . . . . . . . . . . . . . . . i

2 Product Overview
2.1 Abstract. . . . . . . . . . . . . . . . . . . . . . . . . . . . . . . . . . . . . . . . . . . . . . . . 2-22.2 Product Description . . . . . . . . . . . . . . . . . . . . . . . . . . . . . . . . . . . . . . 2-22.4 Package Outlines . . . . . . . . . . . . . . . . . . . . . . . . . . . . . . . . . . . . . . . . 2-5
Contents of this Chapter

Product Overview
TDA 521X
2.1 Abstract
This application note describes the operation of the TDA 5210 and TDA5211 evaluation boards. It demonstrates the design of a low-cost receiver for appli-cations in wireless I.S.M. data communication systems. Various application considerations are presented to assist system designers in implementing the device.
The application board of the TDA5210 can be operated in one of the assigned frequency bands for short-range devices (SRD) at either 434MHz or 868MHz, the application board of the TDA5211 at 315MHz. The receivers have been optimized for single-channel operation in systems using both amplitude shift key (ASK) modulation and frequency shift key (FSK) modulation. The board complies with the I-ETS 300 220 regulations.
2.2 Product Description
The TDA 5210/TDA5211 has been implemented in a 25GHz silicon bipolar pro-cess. It supports all low-power device (LPD) wireless applications with ASK and FSK modulated signals with data rates of up to 120kbit/s. The maximum achiev-able data rate also depends on the IF filter bandwidth and the local oscillator tolerance values.
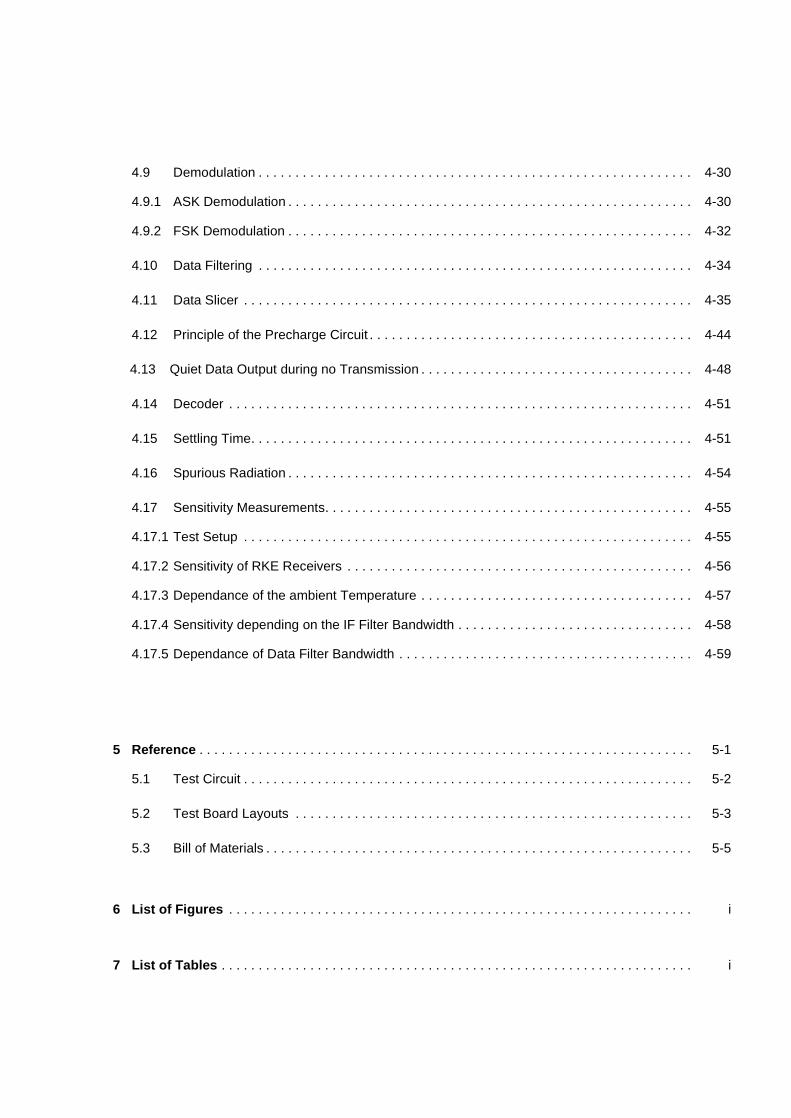
As can be seen from the block diagram in Figure 2-1, the basic concept of the TDA5210 is a single conversion receiver with an on-chip fully integrated PLL frequency synthesizer and an IF of nominally 10.7MHz. The 10.7MHz IF was selected because of the availability of low-cost ceramic filters in a variety of bandwidths between 60kHz and 280kHz. The user is free to select other IFs and/or filters that are compatible with the 3MHz - 25MHz bandwidth provided by the 90dB limiting IF-strip. The IF-limiter provides a received signal strength indi-cation (RSSI) with over 80dB dynamic range. The RSSI output is used as the demodulator for the ASK signals. In case of FSK a PLL is demodulating the sig-nals. The output of the ASK demodulator is DC-coupled internally to the data slicer. An on-chip 2nd order low-pass filter is provided at the demodulator output for both ASK and FSK modulation. Its upper frequency limit should be set to meet the baseband system requirements. The data slicer is an one-bit analog-to-digital converter that makes the bit decision and provides a digital data sig-nal. In accordance with the code being used for modulation, there is a choice between two different internal analog-to-digital converters. The conventional Adaptive Data Slicer utilizes a large capacitor to provide a DC reference for the bit decision. It should be used for the digital conversion of coded signals with no or only a small DC component. The alternative Clamping Data Slicer references its bit decision on the positive peak level of the data signal. It can be used with all unsymmetrical codes containing DC content. Since the clamping data slicer does not have to charge a large capacitor, it requires a shorter preamble and
2 - 2Wireless Control Components Application Note, February 2004

Product Overview
TDA 521X
exhibits a nearly instantaneous response time with some slight loss of sensitiv-ity. The local oscillator (LO) is a single-channel PLL frequency synthesizer. It is fully integrated on the chip.
Table 2-1 Summary of the Key Parameters of the Device
Selectable frequency range TDA5210: 400-440 and 810-870 MHzTDA5211: 310-350 MHz
Fully integrated VCO and PLL frequency synthesizer
ASK and FSK demodulation at data rates up to 120kbit/s NRZ
Supply voltage range 5.0 V ± 10%
Low supply current (6 mA typ. FSK mode, 5.3mA typ. ASK mode)
Reference frequency TDA510: 6.7 MHz or 13.4 MHzTDA511: 5.1 MHz or 10.2 MHz
IF frequency range 3 - 25MHz
Power down mode
Input sensitivity < -107 dBm in ASK mode
Input sensitivity < -100 dBm in FSK mode
Adaptive (RC) and peak data slicer
Low-pass filter with selectable cut-off frequency
2 - 3Wireless Control Components Application Note, February 2004
Product Overview
TDA 521X
2.3 Block Diagram
Functional_diagram.wmf
Figure 2-1 Functional Block Diagram
PDO
: 1 / 2 VCO : 128 / 64 Φ
DETCRYSTAL
OSC
DATA
Crystal
PDWNCSELFSEL
LoopFilter
BandgapReference
UREF
LNARF
-
+SLICER
TAGC
TDA 521XTDA 521XTDA 521X
VCC
VCC AGND
AGCReference
THRES
3VOUT
FSKPLL Demod
OTA
PEAKDETECTOR
LNI
DGND
-+
MIXLNO MI OPPFFB SLP
VCC
LIM LIMX
IFFilter
IFO SLN
MSEL
LIMITER
6 8 9 12 17 18 22 21 19 20
25
26
23
24
3
4
14
13
2,7 5,10 11
15
16 1 28 27
-+
ASK
FSK
OP
+
-
2 - 4Wireless Control Components Application Note, February 2004

Product Overview
TDA 521X
2.4 Package Outlines
P_TSSOP_28.EPS
Figure 2-2 P-TSSOP-28-1 package outlines
2 - 5Wireless Control Components Application Note, February 2004
3 Pin Configuration and Function
3.1 Pin Configuration . . . . . . . . . . . . . . . . . . . . . . . . . . . . . . . . . . . . . . . . 3-23.2 Pin Definition and Function. . . . . . . . . . . . . . . . . . . . . . . . . . . . . . . . . 3-3
Contents of this Chapter
Pin Configuration and Function
TDA 521X
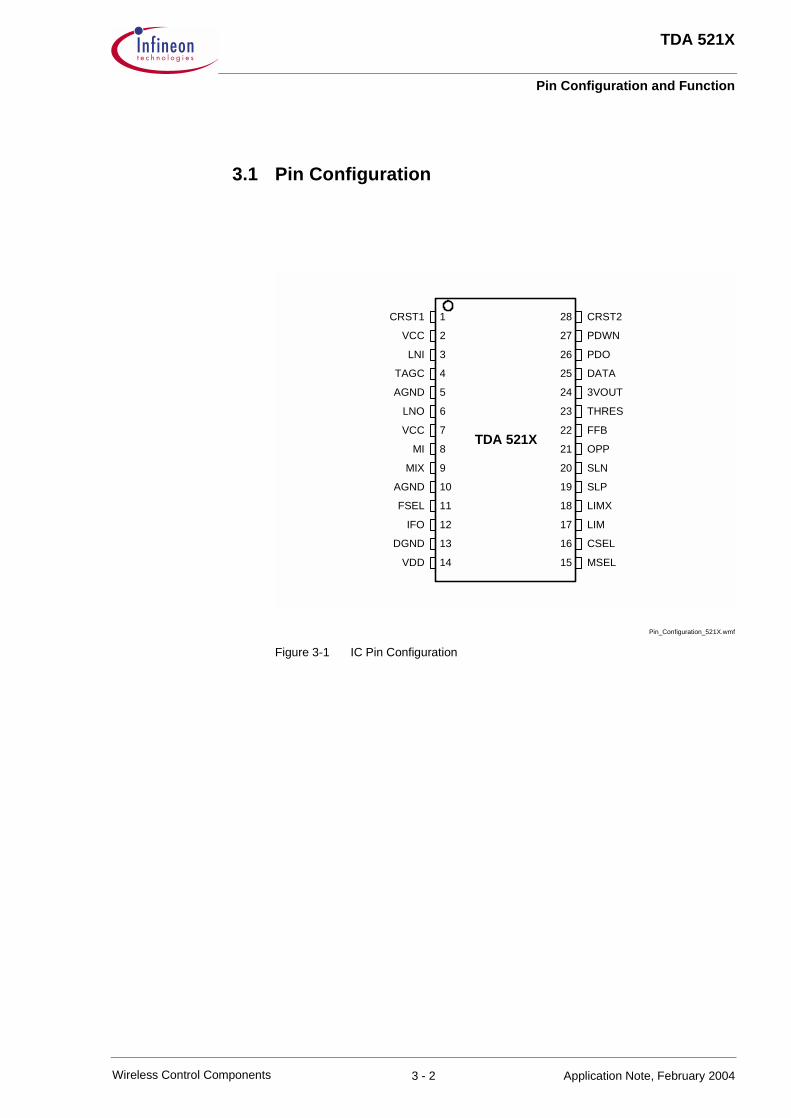
3.1 Pin Configuration
Pin_Configuration_521X.wmf
Figure 3-1 IC Pin Configuration
CRST2
PDWN
PDO
DATA
3VOUT
THRES
FFB
OPP
SLN
SLP
LIMX
LIM
CSEL
MSEL
CRST1
VCC
LNI
TAGC
AGND
LNO
VCC
MI
MIX
AGND
FSEL
IFO
DGND
VDD
1
2
3
4
5
6
7
8
9
10
11
12
13
14
28
27
26
25
24
23
22
21
20
19
18
17
16
15
TDA 521X
3 - 2Wireless Control Components Application Note, February 2004
Pin Configuration and Function
TDA 521X
3.2 Pin Definition and Function
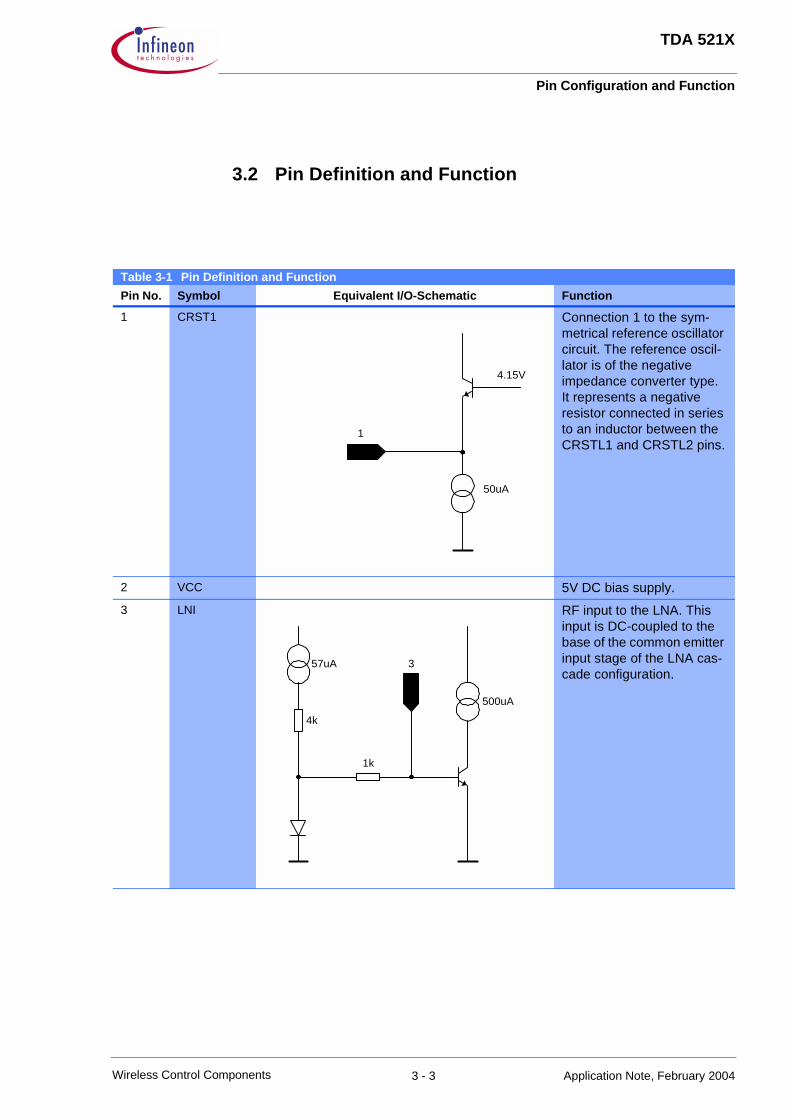
Table 3-1 Pin Definition and Function
Pin No. Symbol Equivalent I/O-Schematic Function
1 CRST1 Connection 1 to the sym-metrical reference oscillator circuit. The reference oscil-lator is of the negative impedance converter type. It represents a negative resistor connected in series to an inductor between the CRSTL1 and CRSTL2 pins.
2 VCC 5V DC bias supply.
3 LNI RF input to the LNA. This input is DC-coupled to the base of the common emitter input stage of the LNA cas-cade configuration.
4.15V
50uA
1
57uA
4k
1k
3
500uA
3 - 3Wireless Control Components Application Note, February 2004

Pin Configuration and Function
TDA 521X
8
1.7V
9
400uA
2k 2k
4 TAGC This pin is used for the gain control of the LNA. The gain of the LNA can be reduced by approx.18dB. The threshold voltage for the gain control function is 1.3V. The control sensitivity is -1dB/8mV See Section 4.2
5 AGND Ground connection for the analog section
6 LNO Output of the receiver RF low-noise amplifier (LNA). Collector of the common base output stage of a cas-cade configuration. A DC path to VCC can be sup-plied by the output matching network.
7 VCC 5V DC bias supply.
8
9
MI
MIX
Symmetrical input to the mixer. The inputs are DC-coupled to the base of the input stage of a Gilbert Cell mixer configuration.
10 AGND Ground connection for the analog section
1k
3uA
1.4uA
1.7V
4.3V
4
6
1k
5V
8
1.7V
9
400uA
2k 2k
3 - 4Wireless Control Components Application Note, February 2004

Pin Configuration and Function
TDA 521X
11 FSEL TDA5210:This pin is used to select the desired operat-ing frequency range of the receiver. FSEL ≤ 0.2V will give access to the 868MHz fre-quency range. FSEL ≥ 1.4V or an open will set the receiver to the 434MHz mode.TDA5211: Not applicable, has to be left open!
12 IFO RF mixer output. This pin is the single-ended IF output of the mixer. The output impedance is set internally to 330Ω. It interfaces directly with 10.7MHz stan-dard ceramic IF filters.
13 DGND Ground connection for digi-tal electronics.
14 VDD DC bias supply to the digital section
15 MSEL ASK/FSK Modulation For-mat Selector
750
2k
11
1.2V
2.2V
4.5k
6012
300uA
15
1.2V
3.6k
3 - 5Wireless Control Components Application Note, February 2004

Pin Configuration and Function
TDA 521X
16 CSELTDA5210/TDA5211:A logic low (CSEL< 0.2V) applied at this pin sets the internal frequency divider for a reference frequency of 13.xx MHz/10.xx MHz. A logic high (CSEL > 1.4V) or an open will be applied for a reference frequency of 6.xx MHz/5.xx MHz.
17
18
LIM
LIMX
Input to the IF amplifier/lim-iter. The input is DC-cou-pled to the base of the first differential stage of the IFF amplifier strip. The differen-tial input impedance is set internally to 330Ω to meet standard 10.7MHz ceramic filter requirements.
19 SLP Output of the low-pass filter, directly coupled to the non-inverting input of the data slicer. An external RC low-pass filter connected to the inverting input SLN, pin 20 of the data slicer sets the reference level for the data slicer/comparator to the average DC level of the data bit stream.
1.2V
80k16
330
15k
15k
18
17
2.4V
75uA
19
80µA
15uA
3k100
3 - 6Wireless Control Components Application Note, February 2004

Pin Configuration and Function
TDA 521X
20 SLN This pin is used for setting the data slicer reference level. A RC low-pass filter from the filter output SLP, pin19 provides the compar-ator with an average DC level of the data bit stream. When applying the peak detector interface, the peak voltage of the data signal at PDO, pin 26 is tapped to determine the bit decision threshold voltage.
21 OPP Non inverting input of the low-pass filter operational amplifier. A capacitor to ground will be applied as part of a second order Sallen-Key low-pass filter.
22 FFB Access point to place a capacitor to the output of the low-pass filter. This capacitor is part of the net-work building the Sallen-Key low-pass filter.
23 THRES The voltage at this pin sets the receiver input level to a value where the AGC circuit comes into operation. THRES is the inverting input of a differential opera-tional transimpedance amplifier that is used to compare the internal RSSI voltage of the IF amplifier with the voltage applied to THRES. The voltage at THRES can be set by a voltage divider attached to the reference voltage at 3VOUT, Pin 24.
5uA
20
10k
21200
5uA
100k
5uA
22
10k
5uA
23
3 - 7Wireless Control Components Application Note, February 2004
Pin Configuration and Function
TDA 521X
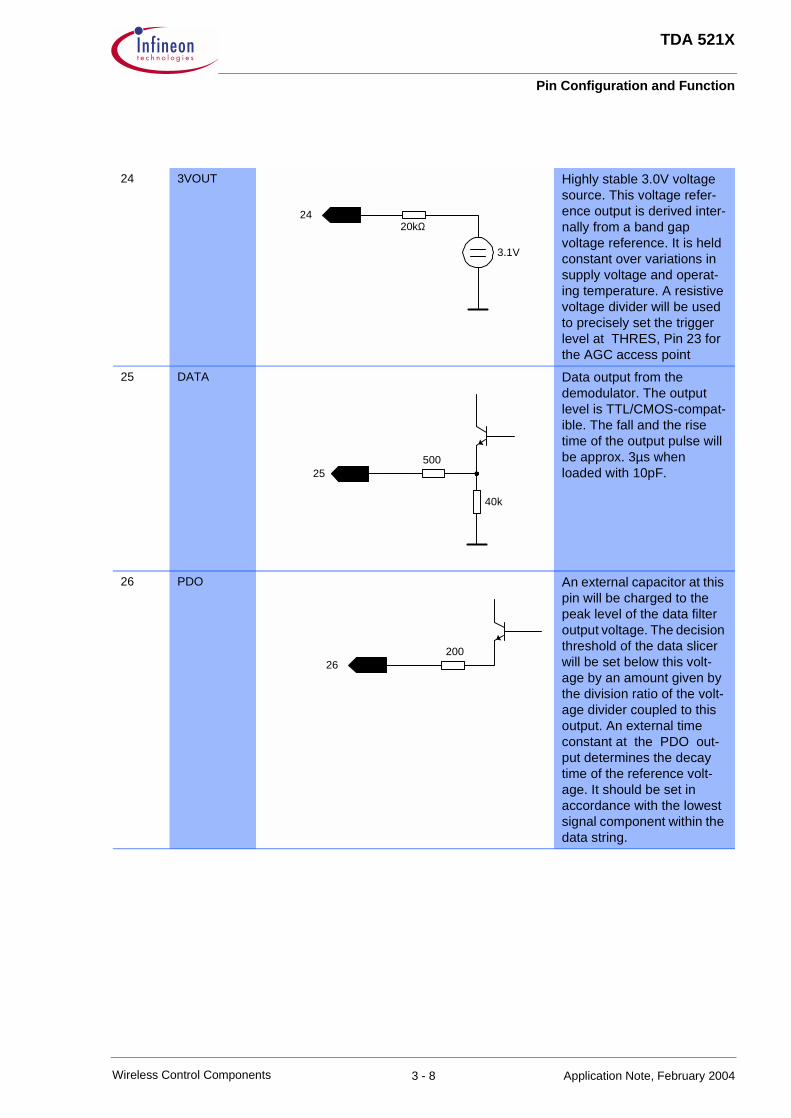
24 3VOUT Highly stable 3.0V voltage source. This voltage refer-ence output is derived inter-nally from a band gap voltage reference. It is held constant over variations in supply voltage and operat-ing temperature. A resistive voltage divider will be used to precisely set the trigger level at THRES, Pin 23 for the AGC access point
25 DATA Data output from the demodulator. The output level is TTL/CMOS-compat-ible. The fall and the rise time of the output pulse will be approx. 3µs when loaded with 10pF.
26 PDO An external capacitor at this pin will be charged to the peak level of the data filter output voltage. The decision threshold of the data slicer will be set below this volt-age by an amount given by the division ratio of the volt-age divider coupled to this output. An external time constant at the PDO out-put determines the decay time of the reference volt-age. It should be set in accordance with the lowest signal component within the data string.
3.1V
2420kΩ
25500
40k
26200
3 - 8Wireless Control Components Application Note, February 2004
Pin Configuration and Function
TDA 521X
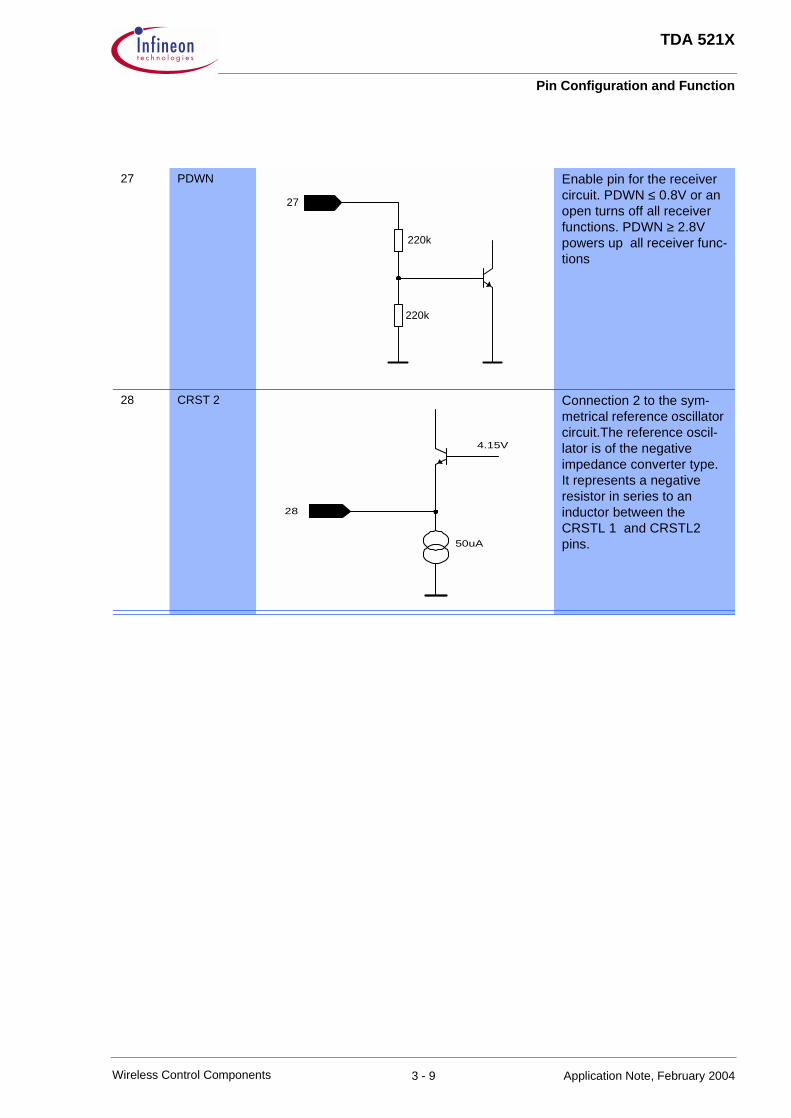
27 PDWN Enable pin for the receiver circuit. PDWN ≤ 0.8V or an open turns off all receiver functions. PDWN ≥ 2.8V powers up all receiver func-tions
28 CRST 2 Connection 2 to the sym-metrical reference oscillator circuit.The reference oscil-lator is of the negative impedance converter type. It represents a negative resistor in series to an inductor between the CRSTL 1 and CRSTL2 pins.
27
220k
220k
4.15V
50uA
28
3 - 9Wireless Control Components Application Note, February 2004
4 Functional Description
4.1 Low-Noise Amplifier (LNA) . . . . . . . . . . . . . . . . . . . . . . . . . . . . . . . . . 4-24.2 AGC . . . . . . . . . . . . . . . . . . . . . . . . . . . . . . . . . . . . . . . . . . . . . . . . . . 4-84.3 Mixer . . . . . . . . . . . . . . . . . . . . . . . . . . . . . . . . . . . . . . . . . . . . . . . . . 4-114.4 Overall Performance of the Front End . . . . . . . . . . . . . . . . . . . . . . . 4-124.5 PLL Synthesizer . . . . . . . . . . . . . . . . . . . . . . . . . . . . . . . . . . . . . . . . 4-134.6 Reference Oscillator . . . . . . . . . . . . . . . . . . . . . . . . . . . . . . . . . . . . . 4-154.7 IF Section . . . . . . . . . . . . . . . . . . . . . . . . . . . . . . . . . . . . . . . . . . . . . 4-224.8 ASK/FSK Switch Functional Description . . . . . . . . . . . . . . . . . . . . . 4-254.9 Demodulation . . . . . . . . . . . . . . . . . . . . . . . . . . . . . . . . . . . . . . . . . . 4-274.10 Data Filtering . . . . . . . . . . . . . . . . . . . . . . . . . . . . . . . . . . . . . . . . . . 4-314.11 Data Slicer . . . . . . . . . . . . . . . . . . . . . . . . . . . . . . . . . . . . . . . . . . . . 4-324.12 Principle of the Precharge Circuit . . . . . . . . . . . . . . . . . . . . . . . . . . . 4-434.13 Quiet Data Output during no Transmission . . . . . . . . . . . . . . . . . . . 4-464.14 Decoder . . . . . . . . . . . . . . . . . . . . . . . . . . . . . . . . . . . . . . . . . . . . . . 4-494.15 Settling Time. . . . . . . . . . . . . . . . . . . . . . . . . . . . . . . . . . . . . . . . . . . 4-494.16 Spurious Radiation . . . . . . . . . . . . . . . . . . . . . . . . . . . . . . . . . . . . . . 4-514.17 Sensitivity Measurements. . . . . . . . . . . . . . . . . . . . . . . . . . . . . . . . . 4-52
Contents of this Chapter

Functional Description
TDA 521X
4.1 Low-Noise Amplifier (LNA)
The low-noise amplifier is an on-chip high-gain amplifier operating at a current of 0.5mA. The gain can be reduced by approx. 18dB by applying a high state to the TAGC input, pin 4. The S-parameters of the LNA and the input to the mixer are shown in the following table.
Matching the LNA input to the source impedance of the generator and matching the LNA output to the mixer input has to be done by a LC network. Both net-works used on the evaluation boards have been designed to achieve best selectivity at a designed loss of 2 to 3dB for each filter. The low-loss and hence low Q design is mandatory in order to keep the circuit tuning-free. This low-loss design achieves a high voltage gain of the LNA and hence a good sensitivity of the receiver. Higher losses result in better selectivity at the expense of gain and sensitivity.
It is good practice to design such a network utilizing an appropriate linear CAE design tool. Even a very simple version can be used very efficiently. A very practical way to design the network will be shown below.
As an example, the design of the input-matching network for an 868MHz appli-cation will be demonstrated in detail.
Table 4-1 S-Parameters of the LNA
Parameter 315 MHz 434 MHz 868 MHz
S11 LNA, high gain 0.895 -25.5deg 0.873 -34.7deg 0.738 -73.5deg
S11 LNA, low gain 0.918 -25.2deg 0.899 -35.4deg 0.772 -80.2deg
S21 LNA, high gain 1.577 150.3deg 1.509 138.2deg 1.419 101.7deg
S21 LNA, low gain 0.193 153.7deg 0.183 140.6deg 0.179 109.1deg
S12 LNA, high gain 0.003 128.2deg 0.023 172.3deg
S12 LNA, low gain 0.001 -153.5deg 0.022 173.4deg
S22 LNA, high gain 0.897 -10.3deg 0.886 -12.9deg 0.866 -24.2deg
S22 LNA, low gain 0.907 -10.5deg 0.897 -13.6deg 0.868 -26.3deg
S11 MIX 0.954 -10.9deg 0.942 -14.4deg 0.918 -28.1deg
4 - 2Wireless Control Components Application Note, February 2004

Functional Description
TDA 521X
LNA_matching..wmf
Figure 4-1 LNA input matching network
As shown in the circuit diagram in Figure 4-1, the input filter represents a single tuned parallel resonance circuit loaded by three resistors: RP1, the generator resistor transformed to the circuit, RP2, which collects the filter component losses, and RP3, the LNA input resistor transformed to the circuit.
By dimensioning
the overall performance of the filter will be optimized: the best selectivity will be achieved at lowest losses. The design example will be done for assumed filter losses of 2-3 dB.
The power efficiency of the network in Figure 4-1 is:
with the QL and QU, the loaded and unloaded quality factors of the circuit.
The unloaded QU of the circuit is given by:
50Ω
UG
C1
C2
C3
L1 S11LNA
TDA5200
RP1
IG
CI' C2 L1 RP2 C3' RP3
31 RPRP =
21
−=U
L
Q
Qη
Z
RP2 =UQ
4 - 3Wireless Control Components Application Note, February 2004

Functional Description
TDA 521X
The characteristic impedance of the circuit is
The effective total capacitance adds up to:
The resonance frequency fo is
The loaded QL of the circuit will be:
The 3dB bandwidth B for the single tuned LC network can be calculated from:
A tuning-free design is required on grounds of cost. In order to minimize the complexity of the circuit, the application example uses a single tuned LC parallel circuit for both the antenna input matching network and the matching network between the LNA output and the mixer input.
The requirement for a tuning-free implementation provides the basis for dimen-sioning the networks.
Due to component and manufacturing tolerances, the frequency of the reso-nance circuit may vary by ∆f from the designed frequency. This will result in loss of gain of the LNA, and therefore in reduced sensitivity of the receiver. In order to limit this sensitivity loss, the two circuits in the application example are dimen-sioned in such a way that each of them exhibits a maximum additional loss of 3 dB under worst-case tolerance conditions.
Typical relevant tolerance values are:
Table 4-2 Tolerance Values of the LNA Input Matching Circuit
∆f/f
Tolerance of C ± 2% ± 1%
Tolerance of L ± 2% ± 1%
Manuf. tolerance Board Placing the components on the pads
± 2%± 2%
Total frequency tolerance ± 6%
totCL
C
L
00
2
1
1Z
ωω ==
=
'32'1Ctot CCC ++=
00 2 fπω =
Z
RPRPRPQ
)3//2//1(L =
B
fQ 0
L =
4 - 4Wireless Control Components Application Note, February 2004

Functional Description
TDA 521X
Detuning losses will be low for a higher 3dB bandwidth and hence for a low loaded QL of the circuit. With an assumed drop in gain by max. 3 dB per circuit, the required QL is
QL : loaded Q of resonance circuitfr : operating frequency∆f : frequency offset of resonance circuit
Using chip inductors of size 0805, an unloaded QU of
can be achieved for the resonance circuits. The Q of the capacitors are greater by at least a factor of 5, so their losses are not taken into account.
The filter losses for each circuit at the LNA input and output will be:
This value applies to optimum dimensioning, where the generator resistance and the load resistance are both transformed into an equal conductance of RP1 = RP3 in parallel to the resonance circuit.
The selectivity of these circuits is not impressive due to their low loaded QL. In the example, the image frequency rejection for ∆f = 2* fIF = 21.4MHz is there-fore only
This result can be improved (still with a tuning-free design) by using high Q, pre-tuned resonators, e.g. based on SAW structures or ceramic filters.
It is rather unusual to design an LC filter for a specified loaded QL. The following description outlines a very practical method for the design of such a filter. This procedure is not as attractive as a CAE design but it is very effective. The exam-ple applies for the input matching circuit of the LNA with a frequency of 868MHz.
As a first step, a convenient combination of C1 and C3 has to be found to transform the generator resistance and the LNA input resistance to the same conductance RP1=RP3 across the parallel resonance circuit. This can be very elegantly done on the PCB by use of a VNA. This method offers the advantage that all parasitic elements of the board are captured.
Experimental values of C1 and C3 have been found on the evaluation board with a frequency of 868MHz as
3.82/ =∆≤ ffQ rL
)869(40
)434(30
MHz
MHzQU ≈
)868(0.2628.
)434(8.2523.1
2
MHzdB
MHzdBQ
Qa
U
L
−≅
−≅=
−=
)868(2.16.02
)434(4.42.22
MHzdBdB
MHzdBdBaif
=×
=×=
pFC
pFC
6.53
11
==
4 - 5Wireless Control Components Application Note, February 2004

Functional Description
TDA 521X
In the next step the value of L1 will be calculated.
Considering the formula of QL and QU and the above decided values of QL and QU yields the following equation for the ratio QU/QL
and therefore
The resultant value of the conductance has been measured as
which yields the value of RP2
The inductance L1 is calculated, using the formular for QU and Z given above
and
The (standard) value selected is
The size of the capacitor C2 required to set the circuit to resonance is once again most easily found empirically. The resonant frequency in general will not be hit accurately enough with standard component values. There is still some room for adjustment by changing the positions of L1 and C3 on the board and by changing the orientation of L1 (!). If these variation options are not satisfac-tory, then C1 or C3 can be changed slightly, violating rule (1). The resultant slight loss of receiver sensitivity can be tolerated.
The values of the components imparted in the circuit should fall within a range where they can be handled electrically. The circuit itself gives some freedom in the determination of the characteristic impedance Z and hence in the compo-nent values. The component values may be selected to conform to certain cri-teria.
One selection criterion for the filter components is that their value remains within technically manageable limits. For example, it may be specified that the C values should not exceed 10pF. Up to this value they are available with abso-lute tolerances of ± 0.1pF. Frequency-determining C’s should not fall below 2.2pF because of the ± 0.1pF tolerance specification. Inductances below 3.3nH also pose problems due to the increasing influence of lead inductances. Once the inductance value exceeds approximately 33nH with a frequency of 868MHz, their effective impedance is capacitive due to their self-resonance.
3//2//1
28.4
3.8
40
RPRPRP
RP
Q
Q
L
U ===
( )3||18.32 RPRPRP ×=
Ω== 30031 RPRP
Ω= 5702RP
Ω=Ω==≥ 25.1440
57020
UQ
RPLZ ω
nHZ
L 6.210
=≥ω
nHL 3.31 =
4 - 6Wireless Control Components Application Note, February 2004

Functional Description
TDA 521X
The overall frequency response of the LNA is shown in the following figures. The midband voltage gain from the receiver input to the mixer input is +21dB/+18dB with a frequency of 434/868 MHz, for instance.
LNAvoltage_vsfreq.wmf
Figure 4-2 LNA voltage gain vs. frequency of 434MHz receiver
Inputref_vsfreq1.wmf
Figure 4-3 Input reflection and relative gain of the LNA vs. frequency at 869MHz
4 - 7Wireless Control Components Application Note, February 2004

Functional Description
TDA 521X
4.2 AGC
The receiver incorporates an “automatic gain control” (AGC) function to change its gain in accordance with the RF input level. Applying this function will improve the power handling capability of the receiver by almost 20dB. Increasing the voltage at the TAGC control input (Pin 4) beyond a level of approx. 1.3V will reduce the gain of the LNA by 19dB/18dB with 434/868 MHz by shifting the bias point to a low-level current. The low gain mode of the LNA will result in a power handling capability of the receiver for input levels up to 0dBm without degrada-tion. A low signal or an open at TAGC sets the LNA to the high gain mode.
LNA_autom.WMF
Figure 4-4 AGC circuit
The AGC function is controlled by a comparator connected to the RSSI voltage. The decision threshold for the start of the AGC function is set by the comparator reference voltage. This voltage is tapped down from the precision 3.0V voltage source at the 3VOUT port (Pin 24) via the R4-R5 voltage divider. If the RSSI voltage reaches the comparator threshold voltage, then the TAGC voltage is pulled up by the transconductance comparator output current. The LNA passes over to the low gain mode.
The threshold of the AGC should be set to the lowest possible receiver input level, in order to optimize the large-signal response of the receiver for the widest possible input level range. However, it must be set higher than the receiver sen-
4
LNA
RSSI (0.8 - 2.8V)
VCC
Gain controlvoltage
OTA+3.1 V
Iload
RSSI > Uthreshold: Iload=4.2µA
RSSI < Uthreshold: Iload= -1.5µA
UC
C5
Uc:< 2.6V : Gain highUc:> 2.6V : Gain low
Ucmax= VCC - 0.7VUcmin = 1.67V
R4 R5
3VOUT
24 23
Uthreshold
20kΩ
THRES
TAGC
C18
4 - 8Wireless Control Components Application Note, February 2004

Functional Description
TDA 521X
sitivity limit by at least the value of the gain reduction, so that the mixer does not operate at its sensitivity threshold. With the specified LNA gain reduction of approx. 18 dB, it is recommended that the threshold be dimensioned to a receiver input level of at least 25...30 dB higher than the sensitivity limit value. Figure 4-5 shows the AGC function for a transition level set to -85dBm by a combination of R4=330kΩ and R5=330kΩ.
RSSI.wmf
Figure 4-5 RSSI voltage as a function of input level for AGC implementation
The AGC function is filtered via C5. C5 is charged by the current source at the comparator output by a 4.2µA source and a 1.5µA sink current for a fast attack and slow decay time. The AGC operation should not be triggered by the data signal. Since the AGC operates in a linear mode without any hysteresis, there always is some range of the receiver input level, where the AGC will be affected by the data signal.
The AGC gain at TAGC is 10dB/80mV. Due to the very high total gain within the AGC, the loop will only be stable in case of ASK for
Because of the RF-level is independent from the logik level in case of FSK, the value of C5 is not so critical.
For ASK the following has to be considered:
A recommended value for C5 is 47nF
0
0,5
1
1,5
2
2,5
3
-130 -110 -90 -70 -50 -30 -10
Pe / dBm
RS
SI /
V
AGC disabled
AGCimplementation
nFC 105 ≥
4 - 9Wireless Control Components Application Note, February 2004

Functional Description
TDA 521X
For a receiver input level above the static AGC threshold level, the RSSI data signal at SLP (Pin19) will show a characteristic overshoot at the positive pulse edge. It is caused by the AGC loop trying to level down the RSSI signal to the preset threshold value. The amplitude and duration of the overshoot is directly related to C5. In order to keep the overshoot below 30% of the signal amplitude, C5 should be designed for a value as shown in the subsequent table.
where TL is the longest period of no signal change within the data sequence.
The design of the data slicer has to consider the distorted pulse shape. This will be quite unproblematic when applying the adaptive data slicer. For most coding schemes, C5 can even be set to 1/5 of the above value then without a significant degradation of performance.
Using a too small capacitor and receiving an ASK signal with a field strength that is within the control range of the AGC may result in a distortion of the signal at the data filter output.
After the positive edge of the signal the AGC reduces the LNA gain and there-fore also the data filter output voltage. The transition from high to low (no RF-signal) induces the AGC to enhance the LNA gain and subsequently the data filter output voltage again. Depending on the time constant of the slicing level a data (slicer output) signal as shown in the Figure 4-6 can be the result.
Table 4-3 Dependence of TL Value on C5
TL C5
0.25ms 10nF
1ms 47nF
2ms 150nF
4 - 10Wireless Control Components Application Note, February 2004

Functional Description
TDA 521X
Example for a too small AGC capacitor relating to the largest low time:
-70dBm_low=9ms_duty-cycle=50%.wmf
Figure 4-6 AGC time constant; RF-Level=-70dBm
When applying the peak data slicer, however, the threshold has to be reduced to cover the overshoot voltage. A combination of R2=100kΩ and R3=390kΩ should be imparted then. Setting the threshold to this lower level will reduce the receiver sensitivity by approx. 6dB, however.
4.3 Mixer
The Double Balanced Mixer is based on a Gilbert Cell configuration with a sym-metrical input and a single-ended output. The output presents a 330Ω termina-tion which directly interfaces to 10.7MHz ceramic filters. A LC matching network is used to connect the LNO to the MI or the MIX input. The conversion voltage gain of the mixer with the internal load of 330Ω is 21dB. The receiver uses low-side LO injection. This avoids interference caused by signals at the image fre-quency range when operated with high-side injection.
Increasing the external load of 330Ω would generally lead to an improved 1dB compression point and also an improvement of the IIP3.
4 - 11Wireless Control Components Application Note, February 2004

Functional Description
TDA 521X
4.4 Overall Performance of the Front End
Table 4-4 shows the overall performance of the LNA and of the mixer at a fre-quency of 434MHz. Table 4-5 summarizes the same results for the evaluation board operated at 868 MHz.
The IIP3 of the mixer and subsequently of the whole system can be shifted to a higher level by adding a resistor between the mixer output and GND. But of course this additional resistor results in a higher current consumption.
Table 4-4 Measured Mixer Performance at 434 MHz
Parameter LNAlow gain high gain
LNA&Mixerlow gain high gain
Gain 1 dB 21dB 22 dB 42 dB
Receiver sensitivity - 95 dBm - 112 dBm
IIP3 -10 dBm - 10 dBm -28 dBm -48 dBm
1dB compression - 18 dBm - 15 dBm - 31 dBm - 53 dBm
Table 4-5 Measured Mixer Performance at 868 MHz
Parameter LNAlow gain high gain
LNA&Mixerlow gain high gain
Gain 0 dB 19 dB 19 dB 40 dB
Receiver sensitivity - 95 dBm - 112 dBm
IIP3 -5 dBm - 14 dBm -26 dBm -35 dBm
1dB compression - 6 dBm - 15 dBm - 34 dBm - 55 dBm
Table 4-6 Measured Mixer Performance at 315 MHz
Parameter LNAlow gain high gain
LNA&Mixerlow gain high gain
Gain 2 dB 21 dB 23 dB 42 dB
Receiver sensitivity - 95 dBm - 113 dBm
IIP3 -13 dBm - 10 dBm -25 dBm -43 dBm
1dB compression - 7 dBm - 14 dBm - 35 dBm - 54 dBm
4 - 12Wireless Control Components Application Note, February 2004

Functional Description
TDA 521X
4.5 PLL Synthesizer
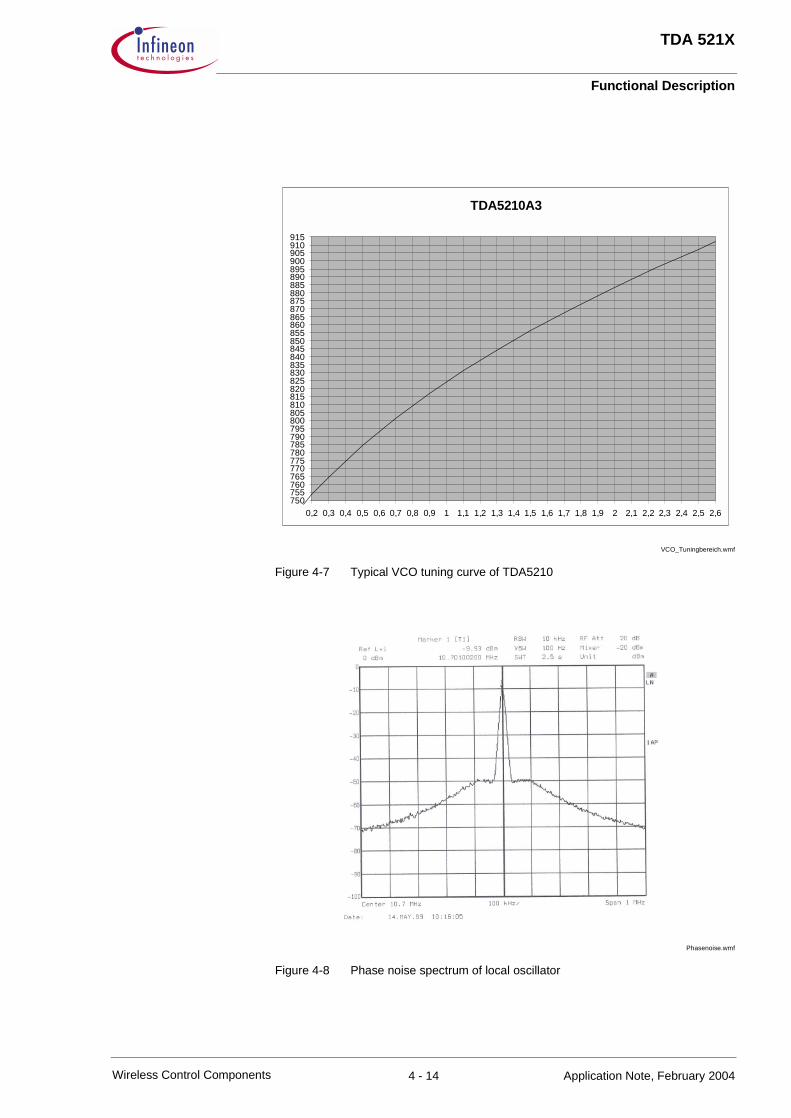
The basic circuit of the PLL frequency synthesizer consists of a VCO operating at a nominal frequency of 840MHz in case of TDA5210 and 330MHz in case of TDA5211 respectively, a frequency divider with a division ratio of either 64 or 128, a frequency/phase discriminator and a reference oscillator. The reference oscillator of the TDA5210 operates at either 13.4MHz or 6.7MHz, the oscillator of the TDA5211 at either 10.2MHz or 5.1MHz. In case of operation at 868.4 MHz the VCO operates at 857.7MHz, for example, This frequency is divided by 64 for operation at a reference frequency of 13.4015625MHz or by 128 at a ref-erence frequency of 6.70078125MHz. For 315MHz, for which the TDA5211 has do be used, the VCO frequency of 651.4MHz can also be divided either by 64 requires a reference frequency of 10.178125MHz or by 128 requires a referenc frequency of 5.0890625MHz.
The VCO signal is directly applied to the mixer stage when operating the receiver at 868MHz. For operation at 434MHz and 315MHz respectively, the VCO signal is divided by two to build the injection signal to the mixer. The VCO of the TDA5210 covers a typical frequency range of 765MHz to 910MHz at the limits of the tuning voltage of 4.7V and 2.4V, the one of the TDA5211 covers a frequency range of typically little less than 590MHz to 720MHz inbetween its tuning voltage range. An example of a typical tuning curve is presented in Fig-ure 4-7, the phase noise spectrum of the VCO signal measured with a resolu-tion bandwidth of 10kHz in Figure 4-8. The phase noise spectrum shows the characteristic noise suppression within the loop bandwidth of 150kHz. Side-band noise outside the loop bandwidth at a frequency offset of ±200kHz can be specified at -87dBc/Hz. This noise sets the limit of the adjacent channel sup-pression of the receiver.The selectivity of the IF filter is bypassed this way.
Table 4-7 Measured IIP3 at 434 MHz vs addition resistor
Resistor value Additional Supply Current (FSK)
low gain high gain
IIP3LNA&Mixer
low gain high gain
no resistor 0 -20 dBm -40 dBm
4k7 320µA - 15.5 dBm - 35.5 dBm
1k2 850µA -11 dBm -31 dBm
4 - 13Wireless Control Components Application Note, February 2004
Functional Description
TDA 521X
VCO_Tuningbereich.wmf
Figure 4-7 Typical VCO tuning curve of TDA5210
Phasenoise.wmf
Figure 4-8 Phase noise spectrum of local oscillator
TDA5210A3
750755760765770775780785790795800805810815820825830835840845850855860865870875880885890895900905910915
0,2 0,3 0,4 0,5 0,6 0,7 0,8 0,9 1 1,1 1,2 1,3 1,4 1,5 1,6 1,7 1,8 1,9 2 2,1 2,2 2,3 2,4 2,5 2,6
4 - 14Wireless Control Components Application Note, February 2004

Functional Description
TDA 521X
4.6 Reference Oscillator
The receiving frequency and its stability are determined by the reference crystal and the associated oscillator circuit.
The oscillator is a symmetrical configuration of the negative impedance con-verter type. A resistor and a capacitor are “sign-inverted” to give a negative resistance in series with an inductance between the oscillator ports CRST1 and CRST2, pin1 and pin28. The equivalent impedance parameters of the oscillator presented in Section 5.1.3 of the Specification have been taken between pin1 and pin28 of the TDA521X on the evaluation board.
The value of the capacitor necessary to achieve that the oscillator is operating at the intended frequency is determined by the reactive (inductive) part of the negative resistance of the oscillator circuit and by the crystal specifications given by the crystal manufacturer.
Crystal_loard1.wmf
Figure 4-9 Determination of Series Capacitance Value for the Crystal Oscillator
A crystal is specified with a load capacitance CL. The series capacitor CS needed to achieve the wanted oscillation frequency in presence of the above mentioned series reactance imposed by the oscillator circuit can be calculated according to the following formula.
with CL the load capacitance (refer to the quartz crystal specification).
Examples:
6.7 MHz: CL = 12 pF XL=695 Ω CS = 9.56 pF
13.401 MHz: CL = 12 pF XL=1010 Ω CS = 5.94 pF
These values may be obtained in high accuracy by putting two capacitors in series to the quartz, such as 27pF and 15pF in the 6.7MHz case and 22pF and 8.2pF in the 13.401MHz case. The calculation of CS or the two serial resistors respectively for TDA5211 and a oscillator frequency of either 5.1MHz or 10.2MHz can be done in the same way, of course.
CS
CrystalInput
impedance
Z1-28TDA521X
CRST2
28
CRST1
1
LL
S
XfC
Cπ2
11
+=
4 - 15Wireless Control Components Application Note, February 2004
Functional Description
TDA 521X
The frequency stabilities of both the receiver and the transmitter and the mod-ulation bandwidth set the limit for the bandwidth of the IF filter. To achieve a high receiver sensitivity and efficient suppression of adjacent interference signals, the narrowest possible IF bandwidth should be realized.
The frequency stability of the center frequency of the receiver is affected by a number of factors:
Tuning tolerance of the crystal
Temperature stability of the crystal
Aging of the crystal
Tolerance of the load capacitor CL
Tuning tolerance of the oscillator circuit
Temperature stability of the oscillator circuit
The first three items are parameters of the crystal specified by the manufac-turer.
The so called pulling sensitivity describes the magnitude of the frequency change relating to the variation of the load capacitor.
It seems do be the best to chose CL as large as possible to get a small pulling sensitivity and subsequently keep the influence of the serial capacitor and of its tolerances as small as possible. But CL mustn’t mixed up with the serial capac-itance Cs. CL is the effective value of the capacitance applied to the crystal and is calculated by dividing the impedance in this particular case the capacitive reactance by the angular frequency “ω”.
Where Losc is the inductivity of the oscillator occuring on the output between pin 1 and pin 28.
With the aid of this formular it becomes obviously that the higher the serial capacitance Cs, the higher the influence of Losc. Subsequently the tolerances of the oscillator isn’t only described by the serial capacitor but also by the toler-ances of des oscillator inductivity and even in particular by the absolute value of this inductivity.
L
s
s
LL C
f
f
CC
C
C
D
δ
δ
δδ
'
)(2 20
1 =+⋅
−=
oscS
L
LC
C21
1
ω−
=
4 - 16Wireless Control Components Application Note, February 2004

Functional Description
TDA 521X
Relative frequency change per changing of Cs
Relative frequency change per changing of Losc
In the suitable range for the serial capacitor, either capacitors with a tolerance of 0,1pF or with a tolerance of 1% are available.
The tolerance of the internal oscillator inductivity is much higher, so the induc-tivity is the dominating value for the tolerance over a large CL/C0 range.
Assuming the crystal parameters,
fs’ = 13,40155MHz, C1=4,75fF, C0=1,29pF
and an inductivity of the oscillator of 12µH,
Figure 4-10 shows the frequency error of the oscillator caused by a 20% devi-ation of the inductivity as a function of CL/C0. Below the frequency error caused by a deviation of the serial capacitor Cs by 0.1pF from the correct value shown in Figure 4-11 and by 1% from the correct value shown in Figure 4-12, both as a function of CL/C0. The entire error caused by the inductivity and Cs is repre-sented in Figure 4-13, one the one hand with the constant deviation ∆Cs of 0.1pF, one the other hand with the constant relative failure ∆Cs/Cs of 1%
( ) ( )LOSCLOS
S
S
CLCC
C
C
f
f
21 12
'
ωδ
δ
+×+×
−=
( )LOSCL
CLSC
SD 21 ω+×=
( )( )
22
12
2'2
'
LLO
SOSC
S
S
CCC
Cf
SL
f
f
×+×
×−= π
δ
( ) 22'2 LSL
CfC
D ××= πδδ
4 - 17Wireless Control Components Application Note, February 2004

Functional Description
TDA 521X
.
Tol_caused_by_Losc.wmf
Figure 4-10 Tolerances caused by ∆L of 20%
Tol_caused_by_dCs=0.1pF.wmf
Figure 4-11 Tolerance of the oscillator caused by ∆Cs of 0.1pF
∆∆∆∆frel(dL) vs CL/C0
-40
-35
-30
-25
-20
-15
-10
-5
0
0,5
1,5
2,5
3,5
4,5
5,5
6,5
7,5
8,5
9,5
10,5
11,5
12,5
CL/C0
df/
fs' [
pp
m]
dfrel vs CL/C0
∆∆∆∆frel(dCs=const) vs CL/C0
-80
-70
-60
-50
-40
-30
-20
-10
0
0,5
1,5
2,5
3,5
4,5
5,5
6,5
7,5
8,5
9,5
10,5
11,5
12,5
CL/C0
df/
fs' [
pp
m]
dfrel(dCs=const) vs CL/C0
4 - 18Wireless Control Components Application Note, February 2004

Functional Description
TDA 521X
Tol_caused_by_dCs=1%.wmf
Figure 4-12 Tolerance of the oscillator caused by ∆Cs of 1%
Tol_caused_by_Losc_and_Cs.wmf
Figure 4-13 Tolerance of the oscillator caused by ∆L and ∆Cs
∆∆∆∆frel(dCs/Cs=const) vs CL/C0
-6
-5
-4
-3
-2
-1
0
0,5
1,5
2,5
3,5
4,5
5,5
6,5
7,5
8,5
9,5
10,5
11,5
12,5
CL/C0
df/
fs' [
pp
m]
dfrel(dCs/Cs=const) vs CL/C0
-∆∆∆∆fges/fs' vs CL/C0
0
10
20
30
40
50
60
70
80
0,5
1,5
2,5
3,5
4,5
5,5
6,5
7,5 8,5
9,510
,511
,512
,5
CL/C0
-dfg
es/f
s' [
pp
m]
for fixed dCs/Cs and dL/L (see table) for fixed dCs and dL/L
4 - 19Wireless Control Components Application Note, February 2004
Functional Description
TDA 521X
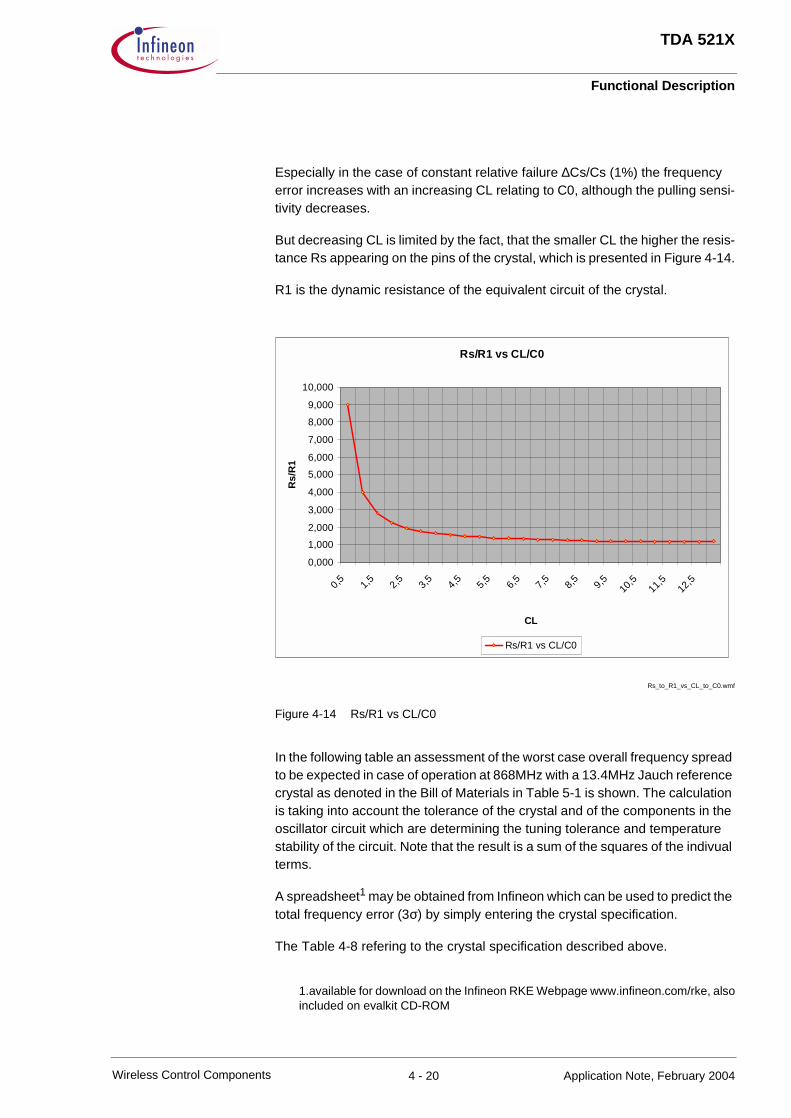
Especially in the case of constant relative failure ∆Cs/Cs (1%) the frequency error increases with an increasing CL relating to C0, although the pulling sensi-tivity decreases.
But decreasing CL is limited by the fact, that the smaller CL the higher the resis-tance Rs appearing on the pins of the crystal, which is presented in Figure 4-14.
R1 is the dynamic resistance of the equivalent circuit of the crystal.
Rs_to_R1_vs_CL_to_C0.wmf
Figure 4-14 Rs/R1 vs CL/C0
In the following table an assessment of the worst case overall frequency spread to be expected in case of operation at 868MHz with a 13.4MHz Jauch reference crystal as denoted in the Bill of Materials in Table 5-1 is shown. The calculation is taking into account the tolerance of the crystal and of the components in the oscillator circuit which are determining the tuning tolerance and temperature stability of the circuit. Note that the result is a sum of the squares of the indivual terms.
A spreadsheet1 may be obtained from Infineon which can be used to predict the total frequency error (3σ) by simply entering the crystal specification.
The Table 4-8 refering to the crystal specification described above.
1.available for download on the Infineon RKE Webpage www.infineon.com/rke, alsoincluded on evalkit CD-ROM
Rs/R1 vs CL/C0
0,000
1,000
2,000
3,000
4,000
5,000
6,000
7,000
8,000
9,000
10,000
0,5
1,5
2,5
3,5
4,5
5,5 6,5
7,5 8,5
9,5
10,5
11,5
12,5
CL
Rs/
R1
Rs/R1 vs CL/C0
4 - 20Wireless Control Components Application Note, February 2004

Functional Description
TDA 521X
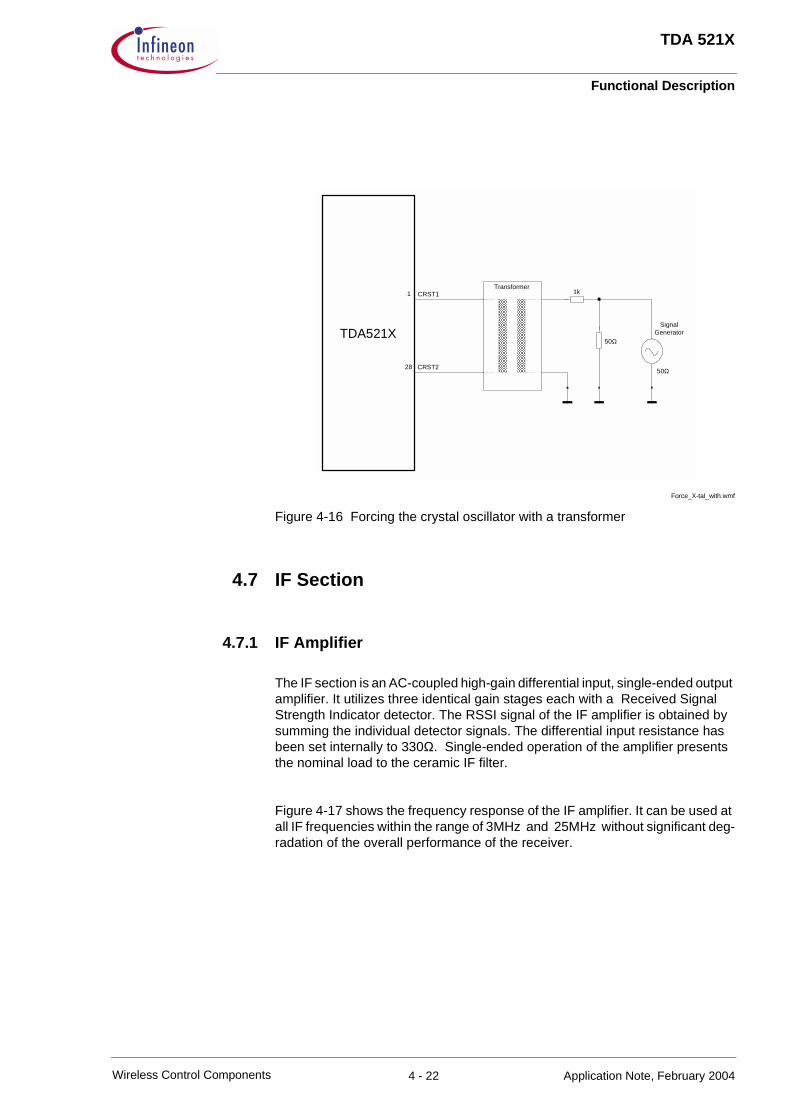
There is also the possibility to force the oscillator with an external signal, shown in Figure 4-15 and Figure 4-16.
Force_X-tal_without.wmf
Figure 4-15 Forcing the crystal oscillator without a transformer
Table 4-8 Assessment of the Frequency Error of the Crystal Oscillator
Tolerance of the crystal
tuning ± 10ppm ± 10ppm
temperature stability ±20ppm ± 20ppm
Tolerance of the circuit
tolerance of the series load capacitor ±1% ± 3ppm
tolerance of the oscillator circuit (3 σ spread of internal component values assumed),
calculated with spread sheet
±33ppm
Total frequency error (3 σ spread)
without temperature drift, according to spread sheet ± 34ppm
with temperature drift ± 54ppm
1
CRST2
TDA521XSignal
Generator
50Ω
1k
50Ω
28
CRST1
4 - 21Wireless Control Components Application Note, February 2004
Functional Description
TDA 521X
Force_X-tal_with.wmf
Figure 4-16 Forcing the crystal oscillator with a transformer
4.7 IF Section
4.7.1 IF Amplifier
The IF section is an AC-coupled high-gain differential input, single-ended output amplifier. It utilizes three identical gain stages each with a Received Signal Strength Indicator detector. The RSSI signal of the IF amplifier is obtained by summing the individual detector signals. The differential input resistance has been set internally to 330Ω. Single-ended operation of the amplifier presents the nominal load to the ceramic IF filter.
Figure 4-17 shows the frequency response of the IF amplifier. It can be used at all IF frequencies within the range of 3MHz and 25MHz without significant deg-radation of the overall performance of the receiver.
CRST1
28
TDA521XSignal
Generator
50Ω
Transformer1k
50Ω
1
CRST2
4 - 22Wireless Control Components Application Note, February 2004

Functional Description
TDA 521X
Frequency response IF.ampl.wmf
Figure 4-17 Frequency response of the IF amplifier.
4.7.2 IF Filtering
The TDA 521X has been designed to be used with a low-cost ceramic IF filter. Those filters are supplied with a wide variety of bandwidth between 60kHz and 300kHz. The nominal input and output impedance is specified at 330Ω. The fre-quency response of such a filter with a nominal bandwidth of 230kHz imparted to the evaluation board is shown in Figure 4-18. The filter characteristic may be degraded by oscillator and signal feed-through to the input of the IF amplifier. Both signals may convert to the IF frequency at the IF amplifier, bypassing the IF filter. This effect can be clearly demonstrated at high input levels. A simple low-pass filter in front of the IF amplifier may keep the RF signals from entering. In most cases a careful layout of the board gives adequate decoupling.
Please note that the far off suppression may be as low as 30 dB. Filters like the Murata SFE 10.7 MA5-A even show a peak at 4.5MHz in the frequency response. Thus beside the excepted IF of 10.7MHz also unwanted signals 6.2MHz away from the IF may influence the following demodulation chain.
-60
-50
-40
-30
-20
-10
0
10
1 10 100
f/MHz
a/d
B
4 - 23Wireless Control Components Application Note, February 2004

Functional Description
TDA 521X
Frequencyresponse.wmf
Figure 4-18 IF frequency response
The bandwidth of the IF filter should be set to a value where the modulation sig-nal is reliably transferred under the influence of the frequency tolerance of the transmitter and the receiver.
The IF bandwidth therefore should be:
BIF ≥ ± (108ppm+14ppm) * 434MHz = ± 53kHz = 106kHz
Table 4-9 Design Example: IF Bandwidth Calculation (3σ value)
Transmit frequency 434.4MHz
Modulation ASK4kbit/s 4kbit/s
Frequency tolerance of the transmitter
± 63ppm
Frequency tolerance of the receiver
± 54ppm
Tolerance of the center frequency of the IF filter
± 30kHz ± 69ppm
Total tolerance ±108ppm
Spectrum of modulation ±1.5*4kbit/s = ± 6kHz ±14ppm
4 - 24Wireless Control Components Application Note, February 2004

Functional Description
TDA 521X
4.8 ASK/FSK Switch Functional Description
The TDA5210 is containing an ASK/FSK switch which can be controlled via Pin 15 (MSEL). This switch is actually consisting of 2 operational amplifiers that are having a gain of 1 in case of the ASK amplifier and a gain of 11 in case of the FSK amplifier in order to achieve an appropriate demodulation gain charac-teristic. In order to compensate for the DC-offset generated especially in case of the FSK PLL demodulator there is a feedback connection between the threshold voltage of the bit slicer comparator (Pin 20) to the negative input of the FSK switch amplifier. This is shown in the following figure.
ask_fsk_datapath.WMF
Figure 4-19 ASK/FSK mode datapath
4.8.1 FSK Mode
The FSK datapath has a bandpass characterisitc due to the feedback shown above (highpass) and the data filter (lowpass). The lower cutoff frequency f2 is determined by the external RC-combination. The upper cutoff frequency f3 is determined by the data filter bandwidth.
The demodulation gain of the FSK PLL demodulator is 180µV/kHz. This gain is increased by the gain v of the FSK switch, which is 11. Therefore the resulting dynamic gain of this circuit is 2mV/kHz within the bandpass. The gain for the DC content of FSK signal remains at 180µV/kHz. The cutoff frequencies of the bandpass have to be chosen such that the spectrum of the data signal is influ-enced in an acceptable amount.
In case that the user data is containing long sequences of logical zeroes the effect of the drift-off of the bit slicer threshold voltage can be lowered if the offset voltage inherent at the negative input of the slicer comparator (Pin 20) is used. The comparator has no hysteresis built in.
RF1 int
100k
RF2 int
100kv = 1
19
RF4 int
30k
RF3 int
300k
DATA Out
AC
DCtyp. 2 V
1.5 V......2.5 V
0.18 mV/kHz
FSK PLL Demodulator
RSSI (ASK signal)
C14R1
ASK/FSK Switch
ASK
FSK+-
+-
22
25
C13C12
20ASK mode : v=1FSK mode : v=11
21
15 MSEL
FFB OPP SLP SLN
Comp-
+
Data Filter
4 - 25Wireless Control Components Application Note, February 2004

Functional Description
TDA 521X
This offset voltage is generated by the bias current of the negative input of the comparator (i.e. 20nA) running over the external resistor R. This voltage raises the voltage appearing at pin 20 (e.g. 1mV with R = 100kΩ). In order to obtain benefit of this asymmetrical offset for the demodulation of long zeros the lower of the two FSK frequencies should be chosen in the transmitter as the zero-symbol frequency.
In the following figure the shape of the above mentioned bandpass is shown.
frequenzy_char.WMF
Figure 4-20 Frequency characterstic in case of FSK mode
The cutoff frequencies are calculated with the following formulas:
f3 is the 3dB cutoff frequency of the data filter - see Section 4.10.
Example:
R1 = 100kΩ, C13 = 47nF
This leads to f1 = 44Hz and f2 = 485Hz
v
0dB
3dB
v-3dB
f
20dB/dec -40dB/dec
f1 f2 f3
gain (pin19)
DC
0.18mV/kHz 2mV/kHz
1333013301
2
11
CkR
kRf
×Ω+Ω×
=π
112 11 ffvf ×=×=
dBff 33 =
4 - 26Wireless Control Components Application Note, February 2004
Functional Description
TDA 521X
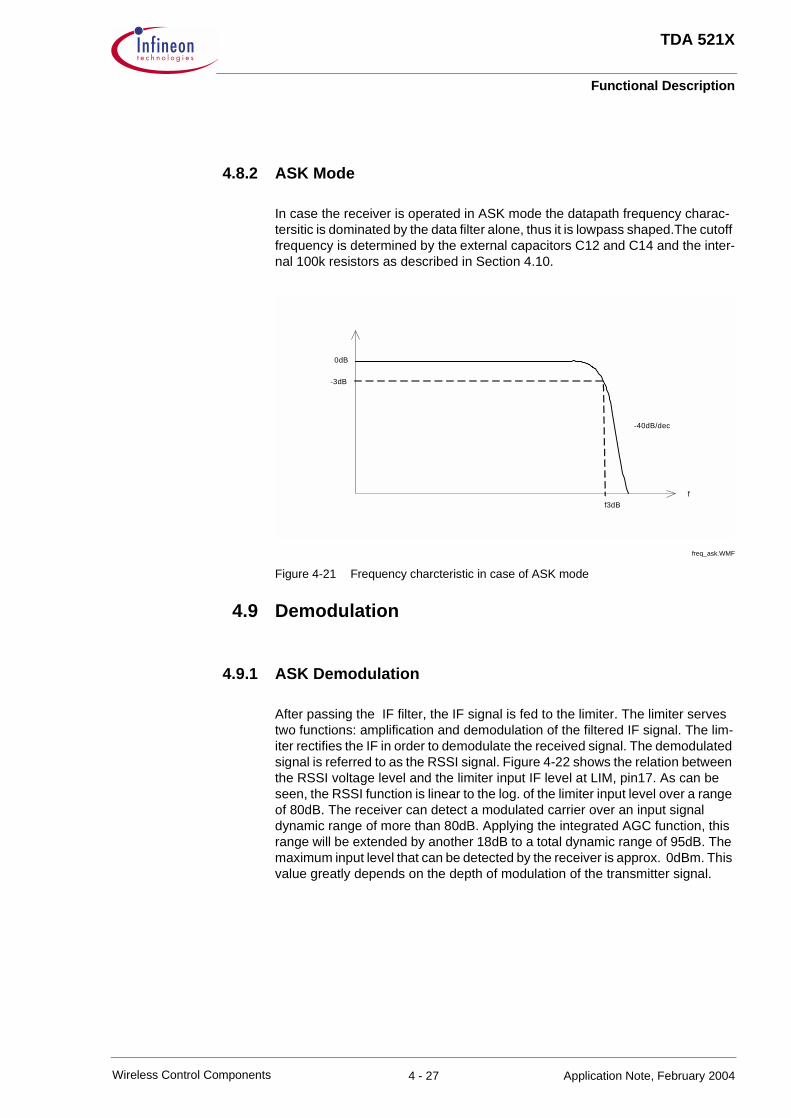
4.8.2 ASK Mode
In case the receiver is operated in ASK mode the datapath frequency charac-tersitic is dominated by the data filter alone, thus it is lowpass shaped.The cutoff frequency is determined by the external capacitors C12 and C14 and the inter-nal 100k resistors as described in Section 4.10.
freq_ask.WMF
Figure 4-21 Frequency charcteristic in case of ASK mode
4.9 Demodulation
4.9.1 ASK Demodulation
After passing the IF filter, the IF signal is fed to the limiter. The limiter serves two functions: amplification and demodulation of the filtered IF signal. The lim-iter rectifies the IF in order to demodulate the received signal. The demodulated signal is referred to as the RSSI signal. Figure 4-22 shows the relation between the RSSI voltage level and the limiter input IF level at LIM, pin17. As can be seen, the RSSI function is linear to the log. of the limiter input level over a range of 80dB. The receiver can detect a modulated carrier over an input signal dynamic range of more than 80dB. Applying the integrated AGC function, this range will be extended by another 18dB to a total dynamic range of 95dB. The maximum input level that can be detected by the receiver is approx. 0dBm. This value greatly depends on the depth of modulation of the transmitter signal.
0dB
-3dB
f
-40dB/dec
f3dB
4 - 27Wireless Control Components Application Note, February 2004

Functional Description
TDA 521X
Limiter_char.wmf
Figure 4-22 Limiter demodulator characteristics
RSSI_vs_LNA.wmf
Figure 4-23 RSSI Voltage vs. Receiver Input Level
Figure 4-18, Figure 4-22 and Figure 4-23 give some interesting information about the interaction of the different gain blocks of the receiver.
The voltage gain between the antenna input and the limiter input is 40dB.
The LNA block adds approx. 7dB of noise at the mixer input to the receiver.
Following the formula for the noise figure NFc of cascaded blocks with individ-ual noise figures NF1 and NF2 and the gain G1
0
0,5
1
1,5
2
2,5
3
-120 -100 -80 -60 -40 -20 0 20
Pe / dBm
RS
SI
/ V
0
0,5
1
1,5
2
2,5
3
-120 -100 -80 -60 -40 -20Pe / dBm
RS
SI
/ V
RSSI LNA ON
RSSI LNA OFF
1
121
G
NFNFNFC
−+=
4 - 28Wireless Control Components Application Note, February 2004
Functional Description
TDA 521X
it is quite evident that the given factor of 7dB ≅ 5 is the factor between the two terms of the above formula. Applying this formula, it can be concluded that the LNA gain, GLNA can be reduced by 3dB without degrading the overall noise characteristics of the receiver significantly. The factor between the two terms in the formula will then be 4dB ≅ 2.5, then resulting in a total noise figure of
The noise of the LNA (having a noise figure of NFLNA) will then contribute just
1.4 ≅ 1.4dB to the total noise of the receiver.
The converter block (LNA in cascade with the mixer stage) adds approx. 10dB of noise to the receiver at the input of the limiter. Applying the above formula for the cascaded noise figure again, it can be concluded that the converter gain could be reduced by 6dB without reducing the overall sensitivity of the receiver significantly. The receiver sensitivity will drop by 1.4dB.
The circuit thus gives some margin to apply filters with higher losses at the IF and at the LNA output.
4.9.2 FSK Demodulation
The FSK-Demodulator realized in the TDA521X is a PLL-Demodulator.
The phase of the IF-signal and VCO output signal are compared against one another in the “phase detector circuit” (PD). The voltage on the phase detector output is proportional to the phase difference of the two input signals. This volt-age is feed via the loop filter to the VCO-control input, to track and match the VCO-frequency to the IF-frequency. Applying a FM/FSK-signal the loop filter output signal is an image of the original NF-signal modulated onto the carrier coupled with a DC-voltage as a function of the center frequency. To reduce the influence of the center frequency on the DC-voltage on the output of FSK-switch and data filter subsequently, a negative DC-feedback is realized as explained in Chapter 4.8.1 (see also Figure 4-19).
Because of the wide bandwith of the PLL of ±500kHz, not only fast catching, but also demodulation of a RF-frequency causing an IF-frequency in that band is enabled. Therefore deviation of the IF-frequency from the nominal value - inside the band of ±500kHz - , caused by the tolerances of the reference oscillator for instance, does not effect the FSK-demodulation.
LNALNALNA
MXLNAC NF 1.4 )
2.5
1 1 ( NF
G
1 - NF NF NF =+=+=
4 - 29Wireless Control Components Application Note, February 2004

Functional Description
TDA 521X
FSK-PLL-Dem.wmf
Figure 4-24 Block diagram of the FSK-PLL-Demodulator
The amplitude on the PLL-Demodulator output is not depending on the IF-signal amplitude, but only on the deviation of the FSK-signal. Using a data signal with a frequency between f2 and f3 according Figure 4-20 in Chapter 4.8.1, not too close by one of this, the amplitude on the output of the FSK-switch is still only a function of the deviation. Outside of this bandwith the amplitude is also a func-tion of the frequency of the data signal, as shown in Figure 4-20. The upper cut-off-frequency f3 is round about 52kHz as indicated in Table 4-10.
a. dB relating to the reference. Reference value is amplitude at 5kHz
Table 4-10 Data-Frequency response of the FSK-switch
Frequency of the data signal
Amplitude on the FSK-switch out Deviation
[kHz] [mV] [dBr]a [kHz]
5 714 0 ±150
20 659 -0.7 ±150
30 636 -1 ±150
43 567 -2 ±150
52 506 -3 ±150
62.5 420 -4.6 ±150
IF-Signal
VCO
PDNF-Signal
Loop Filter
4 - 30Wireless Control Components Application Note, February 2004

Functional Description
TDA 521X
4.10 Data Filtering
Utilising the on-board voltage follower and the two 100kΩ on-chip resistors a 2nd order Sallen-Key low pass data filter can be constructed by adding 2 exter-nal capacitors between pins 19 (SLP) and 22 (FFB) and to pin 21 (OPP) as depicted in the following figure and described in the following formulas1. As can be seen from Figure 4-25, the cutoff frequency can be set by the external com-ponents C12 and C14. The data filter bandwidth should be set according to the highest frequency component of the baseband signal received. A wider data fil-ter bandwidth does reduce the sensitivity by passing a wider spectrum of noise to the data slicer.
Filter_Design.wmf
Figure 4-25 Data Filter Design
with
Q...quality factor of the poles
Where in case of a Bessel filter a = 1.3617, b = 0.618
and thus Q = 0.577
1. taken from Tietze/Schenk: Halbleiterschaltungstechnik, Springer Berlin, 1999
22 21 19RF1 int
100k 100k
C14 C12
RF2 int
SLPOPPFFB
dBdB fQR
bC
fR
bQC
33 412
2
214
ππ==
RRR FF == int2int1
a
bQ =
4 - 31Wireless Control Components Application Note, February 2004

Functional Description
TDA 521X
and in case of a Butterworth filter a = 1.414, b = 1
and thus Q = 0.71
Example: Butterworth filter with f3dB = 5kHz and R = 100kΩ:
C14 = 450pF, C12 = 225pF
4.11 Data Slicer
The filtered data signal is fed to the data slicer, which is a one-bit analog-to-dig-ital converter that makes the bit decision and provides a digital data slicer. There are two different internal analog-to-digital converters. They differ in how to generate the slice reference.
DataSlicer_adaptive.wmf
Figure 4-26 Data slicer with adaptive slice reference
As can be seen from Figure 4-26, the first circuit is the conventional adaptive data slicer deriving the threshold by means of a separate low-pass filter. This data slicer should be used for digital conversion of coded signals with no or only small DC components. The low-pass filter is designed for a long time constant in order to derive the average RSSI value (DC component of data) as an adap-tive reference for the data slicer. As a design rule, the time constant TA should be at least 3 times the longest period TL of no signal change within the data sequence
TA can be calculated as
R1, RF3 int, RF4 int and C13 see also Figure 4-1
LA TT ×≥ 3
FSKforCv
RRIIRC
RRR
RRT
and
ASKforCRRIIRCRRR
RRRT
FF
FF
FA
FFFF
FFA
...13)(1
131
1
...13)(1131
)(1
int4int3
int4int3
int4
int4int3int4int3
int4int3
⋅+
=⋅++
⋅=
⋅+=⋅+++⋅
=
4 - 32Wireless Control Components Application Note, February 2004
Functional Description
TDA 521X
This will result in a temporary shift of the reference level by -3.5dB of the data signal amplitude.
The time constant selected directly affects the data slicer run-in time and as a result the receiver settling time.
The calculation above yields the TA of the TDA521X, in contrast to the one from TDA520X, where TA has to be calculated as
The Relation between TA and the lower cut-off frequency f2 of the ASK/FSK-Switch (see also chapter „4.8.1 FSK Mode“) is shown below.
Considering the formula of f2 given in chapter „4.8.1 FSK Mode“
it can be easily seen, that f2 can also be calculated as
Applying additional the formula of TA given above, f2 can be calculated as
Naming the ratio between TA / TL as „rt“ and considering, that
the ratio between fdata min and f2 is given as
Example:
Choosing TA at least three times higher than TL (rt = 3), as recommended above, results in
which should be sufficiently high for most of the applications.
The applications shown in Figure 4-28, Figure 4-29 and Figure 4-31 are only usable in ASK mode.
131 CRTA ×=
12 fvf ⋅=
v
RRIIRC
fvfFF )(1
132
1
int4int312 +
⋅⋅=⋅=
π
ATf
⋅=
π2
12
Ldata T
f⋅
=2
1min
τπ rf
fdata ⋅=2
min
425,932
min ≈⋅= πf
fdata
4 - 33Wireless Control Components Application Note, February 2004

Functional Description
TDA 521X
As can be seen in Figure 4-19 the ASK/FSK switch is connected via a 300k and 30k resistor with pin 20. That’s the reason why the resistance R2IIR3 “seen” by pin 20 in Figure 4-27 and Figure 4-28 must not be too high, otherwise a inad-missible ripple caused by the data signal is applied to the negative input of the data slicer.
Figure 4-27 shows the alternate clamping data slicer which references its bit decision to the positive peak level of the data signal. This data slicer can be used with coding schemes employing high DC content. The decay time con-stant TP of the peak detector should be designed to hold the detector voltage level well above the decision threshold of the comparator for a time long enough to bridge the longest time TL with no level change within the data stream. This is most important for low data levels at the sensitivity threshold of the receiver. On the other hand TP should be short enough to follow the variations of the received signal level. As a design rule, the time constant should be
The comparator threshold will be set by the division ratio of the voltage divider R2 /R3. The voltage drop across R2 acts like an additional offset voltage across the comparator input. It should be set to a value just big enough for a glitch-free decoding of a noisy signal at the receiver sensitivity threshold. Setting the threshold beyond the noise level of the receiver will give an operation similar to a squelch function. The data output will be held in a high state without a signal at the receiver input then. There will be some degradation in receiver sensitivity when applying the clamping data slicer.
Dataslicerclamp.wmf
Figure 4-27 Data slicer with clamping slice reference
The data output DATA, pin25 is a common collector stage utilizing an internal pull-down resistor of 40kΩ. The bandwidth of this output is limited to approx. 60kHz when loaded by 1MΩ//10pF. This limits the data rate to a maximum of 120kbit/s. Higher capacitive loading at the data output will further reduce the bandwidth. The bandwidth of the RSSI decoder, the low-pass filter and the data slicer are internally limited to >100kHz.
1TL 20 C15 R3)(R2 TP ×≥×+=
2019 25
DATA
Slicer
LPFilter
26
C15 R2 R3
SLNPDOSLP
4 - 34Wireless Control Components Application Note, February 2004

Functional Description
TDA 521X
In case of using the adaptive data slicer the evaluation board has been designed for
The longest uncompensated DC component of the decoded data stream there-fore should not exceed 1.5ms. The lower frequency of the data stream is limited to 330Hz this way. When using the peak data slicer, TP has been designed for
The longest uncompensated DC component of the data stream is limited to 2.1ms now. The lower frequency limit of the data slicer has been extended down to 250Hz.
The disadvantage of the application shown in Figure 4-27 is the dependance of the duty cycle on the DC level of the data filter output signal and therefore also on the RF level.
The necessary slicing level for getting a duty cycle of approximately 50% for a stronger signal is to low for a weak signal. Because of this the sensitivity is vir-tually reduced.
Coding schemes with long break times between the preamble and the real data, for instance the shark protocol, cause also problems with such an application.
Even for a large decay time Tp=(R2+R3)*C15 , causing problems after inter-ferer appears, the slicing level will drop below the data filter output voltage because of discharging C16 against GND, especially for small signals.
To avoid on the one hand the necessity of too large decay time and therefore large recovery time after appearance of interferer or on the other hand a invalid data signal the following application shown in Figure 4-28 is useful.
DataSlicerDataValid.wmf
Figure 4-28 Slicing level derived from peak detector1
1.As the circuits or parts of the circuits shown in Figure 4-28, Figure 4-31, Figure 4-34 and Figure 4-35 are not used in the Infineon Evalboard an index is used (not onlya number).
msnFkCRTA 7.447100131 =×Ω=×=
msnFkkCRRTP 4347)820100(15)32( =×Ω+Ω=×+=
2019 2526
R2
SLNPDO
DataFilter
Slicer
SLP DATA
R3
C15 Rdisch
4 - 35Wireless Control Components Application Note, February 2004
Functional Description
TDA 521X
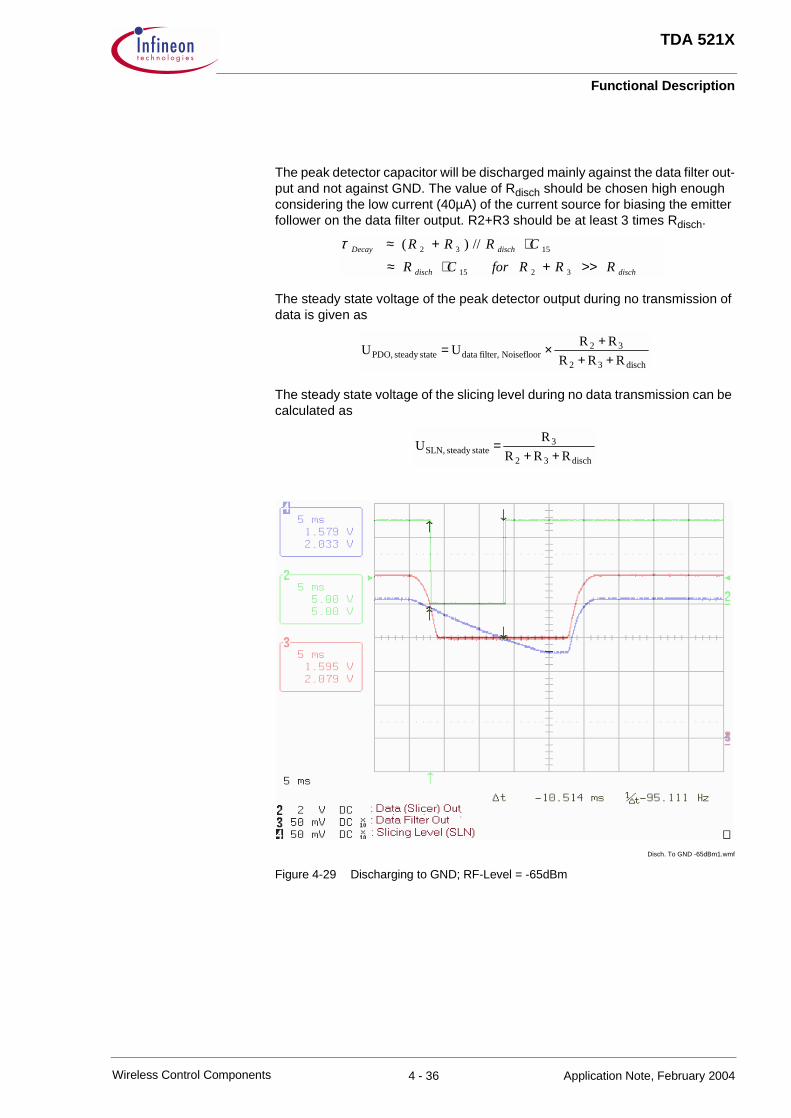
The peak detector capacitor will be discharged mainly against the data filter out-put and not against GND. The value of Rdisch should be chosen high enough considering the low current (40µA) of the current source for biasing the emitter follower on the data filter output. R2+R3 should be at least 3 times Rdisch.
The steady state voltage of the peak detector output during no transmission of data is given as
The steady state voltage of the slicing level during no data transmission can be calculated as
Disch. To GND -65dBm1.wmf
Figure 4-29 Discharging to GND; RF-Level = -65dBm
dischdisch
dischDecay
RRRforCR
CRRR
>>+⋅≈
⋅+≈
3215
1532 //)(τ
disch32
32Noisefloor filter, datastatesteady PDO, RRR
RR U U
+++
×=
disch32
3statesteady SLN, RRR
R U
++=
4 - 36Wireless Control Components Application Note, February 2004

Functional Description
TDA 521X
Disch. To data f. out -100dBm.wmf
Figure 4-30 Discharging to data filter out; RF-Level = -100dBm
After a sudden increased RF level or a short time period in power down mode the following application shown in Figure 4-31 is very useful to achieve a very short settling time of the slicing level. This can be done without the usage of the precharge circuit, but it has to be mentioned that only ASK mode will work with this kind of application.
DataslicerFast.wmf
Figure 4-31 Precharging with peak detector
2019 2526
R1SLNPDO
DataFilter
Slicer
SLP DATA
RP
C13CP
4 - 37Wireless Control Components Application Note, February 2004

Functional Description
TDA 521X
For the best functionality the value of Cp should be the same as the value of C13. To avoid influence on the steady state of the slicing level Rp should be chosen to a value of at least 10 times R13. A to small Rp value causes also an additional ripple voltage of the slicing level. An example for various values of Rp is given in Figure 4-32 and Figure 4-33 below).
Average of slicing level
Figure 4-32 Average of slicing level
Ripple of slicing level
Figure 4-33 Ripple of slicing level
Average of Slicing Level
0
0,5
1
1,5
2
2,5
1000 316,228 100 31,6228 10 3,16228 1 0,31623 0,1 0,03162
ta/tp
Usl
icin
g a
vera
ge
Average of Slicing Level
Ripple of Slicing Level
0
5
10
15
20
25
30
35
40
45
50
1000 316,228 100 31,6228 10 3,16228 1 0,31623 0,1 0,03162
ττττa/ττττp
Usl
icin
g R
ipp
le [m
V]
Ripple of Uslicing level
4 - 38Wireless Control Components Application Note, February 2004

Functional Description
TDA 521X
The best solution for all demands mentioned above, combining the advantages off the other applications is shown below in Figure 4-34.
inv_slicing_level.wmf
Figure 4-34 Adapting impedance slicing level generation
inv_slicing_level_trans1.wmf
Figure 4-35 Adapting impedance slicing level generation and buffer
Data Slicer
Data Filter
+
-
Data(Slicer)
Out
SlicingLevel
Slicing LevelGeneration
R1SLR2SL
CSL
D2SL
D1SL
TDA521X
SLP19
SLN20
Data Slicer
Data Filter
+
-
Data(Slicer)
Out
SlicingLevel
Slicing LevelGeneration
R1SL R2SL
CSL
T2SL
T1SL
TDA521X
R3nSL
R4nSL
R4pSL
R3pSL
R3nSL,R4nSL, R3pSL and R4pSL "only" optional
19 SLP
20 SLN
4 - 39Wireless Control Components Application Note, February 2004

Functional Description
TDA 521X
The two diodes D1SL and D2SL are working as a voltage controlled resistor. For a slight deviation of the slicing level from the instantaneous value off the data filter output signal the impedance of the diode, driven in forward direction, is higher than for a larger deviation. The higher the deviation the lower the imped-ance of the forward driven diode. The function of the circuit presented in Figure 4-35 is the same except the using of the transistors instead of the diodes work-ing simultaneously as buffer for the possibility to use a smaller value of R2SL.
The dimensioning of the circuit is not realy critical. The product of R2SL*CSL, the theoretical lower limit value of the time constant, should be round about ten times smaller than the inverse value of the highest “data frequency”1 to reach a very fast settling time.
Depending on the longest possible period of no changing of the logik level dur-ing one transmission - time between preamble and data for instance - the R2SL*CSL product can be chosen more or less smaller. As can be seen in the measurements below, a R2SL*CSL product of round about 100µs is one the one hand by far large enough to tide over a brake of 10ms, on the other hand small enough to reach a proper slicing level within the half period of a 1kHz signal. But also an R2SL*CSL product of less than 10µs is sufficient to tide over a brake of 10ms, shown in Figure 4-38, enabling a very short settling time for the slicing level as can be seen in Figure 4-39. The measurement presented in Figure 4-39 is done with the circuit shown in Figure 4-35, - slicing level generation and buffer without the optional resistors R3n, R4n, R3p, R4p - because of the small value of R2SL.
This application works for FSK as well as for ASK and make the use of pre-charge circuit described in the next chapter unnecessary.
But please note, that in case of FSK this circuit is not only decisive for the time constant TA, but also for the cut-off frequencies f1 and f2 (see also Chapter 4.8.1).
The components R1SL, R2SL, D1SL and D2SL decide the resistance value, which can be used in the calculation of TA, f1 and f2 instead of R1.
The capacitor value CSL can be inserted instead of C13 in those formulas.
1. Fundamental frequency of the data signal, not to mix up with the data rate.
4 - 40Wireless Control Components Application Note, February 2004

Functional Description
TDA 521X
T(Data-low)=10ms_Var_b.wmf
Figure 4-36 Measuring circuit with R2*C=127µs with 10ms of low level respectively
RF-off to -80dBm_Var_b.wmf
Figure 4-37 Response time of circuit with R2*C=127µs; Data frequency = 1kHz
4 - 41Wireless Control Components Application Note, February 2004
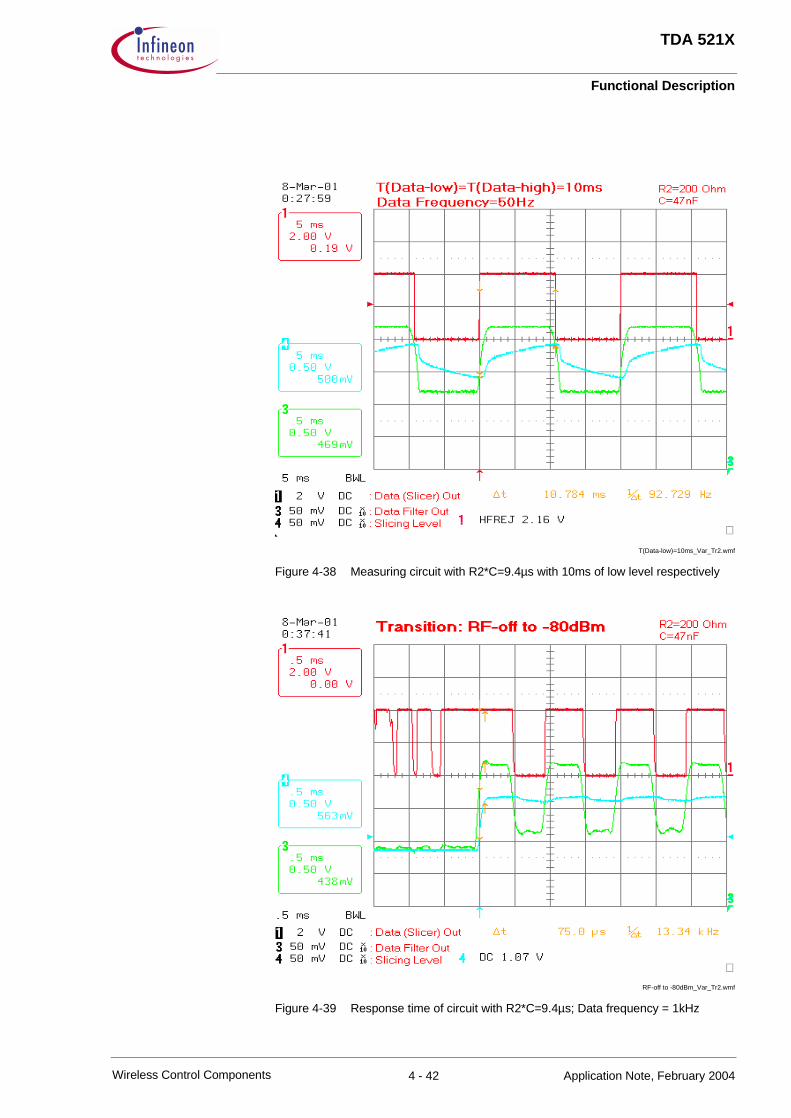
Functional Description
TDA 521X
T(Data-low)=10ms_Var_Tr2.wmf
Figure 4-38 Measuring circuit with R2*C=9.4µs with 10ms of low level respectively
RF-off to -80dBm_Var_Tr2.wmf
Figure 4-39 Response time of circuit with R2*C=9.4µs; Data frequency = 1kHz
4 - 42Wireless Control Components Application Note, February 2004

Functional Description
TDA 521X
4.12 Principle of the Precharge Circuit
In case the data slicer threshold shall be generated with an external RC network as described in Section 4.11 it is necessary to use large values for the capacitor C attached to the SLN pin (pin 20) in order to achieve long time constants. This results also from the fact that the choice of the value for R connected between the SLP and SLN pins (pins 19 and 20) is limited by the 330kΩ resistor appear-ing in parallel to R as can be seen in Figure 4-19. Apart from this a resistor value of 100kΩ leads to a voltage offset of 1mv at the comparator input as described in Section 4.8.1. The resulting startup time constant τ1 can be calculated with:
In case R1 is chosen to be 100kΩ and C13 is chosen as 47nF this leads to
When the device is turned on this time constant dominates the time necessary for the device to be able to demodulate data properly. In the powerdown mode the capacitor is only discharged by leakage currents.
In order to reduce the turn-on time in the presence of large values of C a pre-charge circuit was included in the TDA5210 as shown in the following figure.
precharge.wmf
Figure 4-40 Principle of the precharge circuit
This circuit charges the capacitor C13 with an inrush current Iload of 240µA for a duration of T2 until the voltage Uc appearing on the capacitor is equal to the voltage Us at the input of the data filter. This voltage is limited to 2.5V. As soon as these voltages are equal or the duration T2 is exceeded the precharge circuit is disabled.
( ) 13330||11 CkR ×Ω=τ
( ) msnFknFkk 6.3477747330||1001 =×Ω=×ΩΩ=τ
Iload
+3.1V
20k
+
-
OTA
+2.4V
R4 R5
24 23
Uthreshold
C13
0 / 240uA+
-
20 19
R1
Data Filter ASK/FSK Switch
C18
U2
Us
UcUc<UsUc>Us
U2<2.4V : I=240uAU2>2.4V : I=0
R4+R5=600k
SLNTHRES3VOUT SLP
4 - 43Wireless Control Components Application Note, February 2004

Functional Description
TDA 521X
τ2 is the time constant of the charging process of C18 which can be calculated as
as the sum of R4 and R5 is sufficiently large and thus can be neglected. T2 can then be calculated according to the following formula:
The voltage transient during the charging of C18 is shown in the following fig-ure:
e-Fkt1.wmf
Figure 4-41 Voltage appearing on C18 during precharging process
The voltage appearing on the capacitor C13 connected to pin 20 is shown in the following figure. It can be seen that due to the fact that it is charged by a con-stant current source it exhibits a linear increase in voltage which is limited to USmax = 2.5V which is also the approximate operating point of the data filter input. The time constant appearing in this case can be denoted as T3, which can be calculated with
18202 Ck ×Ω=τ
6.1
34.2
1
1ln 222 ×=
−= ττ
V
VT
U 2
2
3 V
2 .4 V
T 2
13240
5.2
240
13max3 C
A
V
A
CUT S ×=
×=
µµ
4 - 44Wireless Control Components Application Note, February 2004

Functional Description
TDA 521X
e-Fkt2.wmf
Figure 4-42 Voltage transient on capacitor C13 attached to pin 20
As an example the choice of C18 = 20nF and C13 = 47nF yields
τ2 = 0.4ms
T2 = 0.64ms
T3 = 0.49ms
This means that in this case the inrush current could flow for a duration of 0.64ms but stops already after 0.49ms when the USmax limit has been reached. T3 should always be chosen to be shorter than T2.
It has to be noted finally that during the turn-on duration T2 the overall device power consumption is increased by the 240µA needed to charge C13.
The precharge circuit may be disabled if C18 is not equipped. This yields a T2 close to zero. Note that the sum of R4 and R5 has to be 600kΩ in order to pro-duce 3V at the THRES pin as this voltage is internally used also as the refer-ence for the FSK demodulator.
Us
T3
Uc
4 - 45Wireless Control Components Application Note, February 2004

Functional Description
TDA 521X
4.13 Quiet Data Output during no Transmission
Using one of the above mentioned circuits to generate the slicing level the data slicer will provide a stochastic signal. For some application like the duty cycle mode, where a µC is set to idle mode and should only “waken” if valid data are available, a quite data output or the additional information ”No Data” during no transmission is required. For such an application one of the the following circuit is a possible solution. The circuit shown in Figure 4-43 shows a much higher temperature sensitivity as the circuit shown in Figure 4-44. Please note, that the temperature sensitivity inherent in the circuit of Figure 4-43 is mainly caused by the temperature gradient of the base-emitter voltage of T2FND.
FSK-Noise-Det1.wmf
Figure 4-43 FSK-Noise-Detector (not temperature stablized version)
To compensate the temperature dependence of T2FND only one additional tran-sistor has to be used to get a differential pair as presented in Figure 4-44. Another advantage of this circuit is the possibility to modify the threshold level1 without changing the gain of the previous stage and subsequently influencing the tolerances by changing the voltage divider R13FND - R14FND. To avoid tog-gling of the “Data-Detector Output” for an input signal at the threshold level a hysteresis can be realized by selecting a proper value of R12FND.
1.Level of the RF-signal where the “Noise-Detector” switches to high (data valid) is“threshold-high”, level where it switches to low (noise detected) is “threshold-low”.
5V
R6FND180Ω
5V 5V 5V
R5FND1k
C3FND100nF
R7FND27k
T2FNDBC327
C4FND47nF
R10FND56k
T3FNDBC337
R11FND12k
R12FND470kR9FND
390ΩR8FND10k
T1FNDBC337
R4FND470kC2FND
4n7R3FND220Ω
C1FND100pFR1FND
2k2
C5FND100nF
DataDetector Out
High = Datavalid
PeakDetect.
26
TDA521X
R2FND22kPDO
4 - 46Wireless Control Components Application Note, February 2004

Functional Description
TDA 521X
FSK-Noise-Det2.wmf
Figure 4-44 FSK-Noise-Detector (Temperature-stabilized version)
A comparison between the circuit shown in Figure 4-43 and the temperature stabilized circuit of Figure 4-44 is presented in Table 4-11 below, measured in a 868MHz board.
In point of fact the temperature drift caused by T1FND isn’t covered by the mea-surement shown in Table 4-11, but it amounts only round about 0.4dB over the measured temperature range.
Table 4-11 Temperature sensitivity
Temperature Alteration of “threshold-high”
not temperature stabilized circuit Figure 4-43
Temperature stabilized circuit in Figure 4-44
[°C] [dBm] [dBm]
50 -100.4 -99.7
60 -99.4 -99.7
70 -98.4 -99.7
80 -97.2 -99.7
90 -95.5 -99.7
100 -92.6 -99.7
105 -90.1 -99,7
Peak Detect.
26
TDA 521X5V5V 5V 5V
C3FND100nF
C4FND47nF
T4FNDBC337
R11FND12k
C24n7
C1FND100pF
C5FND100nF
DataDetector Out
High = Datavalid
R14FND 47k
R9FND390Ω
R10FND56k
R8FND10k
R16FND100k
R12FND800k
R13FND100k
R5FND1k
R4FND470k
R3FND220Ω
R1FND2k2
R2FND22k R6FND
180Ω
R7FND33k
BC
557
T3FNDBC557
T1FNDBC337
T2 F
ND
R15
FN
D
1k
PDO
4 - 47Wireless Control Components Application Note, February 2004
Functional Description
TDA 521X
The hysteresis of the realized temperature stabilized circuit is round about 0.7dB resulting to a “threshold-low” of -100.4dBm in temperature range up to 105°C.
But of course both the hysteresis and the threshold can be modified as described above.
The data detector output signal can be used as an interrupt signal to waken the µC for instead. To get a quiet data slicer output during no transmission, the data (slicer) output ha sto be combined with the data detector output via a AND or NAND gate. Using a NAND it has to be observed that data are inverted and, unlike using a AND, the quiescent state is high.
4 - 48Wireless Control Components Application Note, February 2004

Functional Description
TDA 521X
4.14 Decoder
For demonstration purposes, a standalone decoder device has been added to the receiver board. The HCS 512 (Microchip) is a decoder capable of respond-ing to the code-hopping sequences sent by the encoder device HCS 360 (Microchip) at the transmitter side. Both devices, the encoder and the decoder, must be programmed with an identical customer code. Each decoder can undergo a learning process with up to 5 individual transmitters. Synchronization will be established following a defined learning sequence. Closing the “learn” contact will light up the LED for approx. 2s. Opening the contact after the LED has turned off sets the decoder to the learn mode. Activating the transmitter then will transfer the synchronization data. This completes the learning process. The LED will then light up for 500ms each time a synchronized transmitter sig-nal is received.
4.15 Settling Time
Some receiver applications target an average supply current of 1mA and less. If an intermittent receiver operation is allowed, the supply current may easily be reduced from the typical value of 4.6mA to less than 1mA. The pulsed opera-tion of the receiver can be controlled by a signal applied to the PDWN, pin27 input. A high state will enable the receiver. For pulsed receiver operation, a number of parameters need to be considered, such as receiver settling time, system response time and on-off duration.
The receiver settling time depends on a number of application parameters:
Power up signal slew rate
Data slicer design
RF settling time
The RF settling time depends on the start-up time of the reference oscillator, the settling time of the PLL loop and the settling time of the bias of the receiver blocks. Due to the high excessive gain of the reference oscillator and the wide bandwidth of the PLL loop filter of 150kHz, the VCO will lock within a time of less than 1ms. The settling time of the receiver bias depends primarily on the size of the blocking capacitor C11. The impedance of capacitor C11 has, however, to be low compared to the input impedance of the IF amplifier at the IF fre-quency of 10.7MHz. A capacitor of 100pF gives a 1dB loss of IF gain at the input impedance of 330Ω. Applying C11=10nF will give a bias settling time of the IF amplifier of only 200µs.
The settling time of the data slicer is given by the low-pass characteristic of the imparted filter functions.
4 - 49Wireless Control Components Application Note, February 2004
Functional Description
TDA 521X
The settling time of the data slicer using the precharge circuit is mainly decided by C13 and the operating point of the data filter Us as described in chapter 4.12. The maximum value of Us is round about 2.5V resulting in a maximum settling time for a valid data signal:
For a capacitor C13=47nF (Infineon evaluation board):
The crystal oscillator settling time is proportional to the ratio of the motional inductivity (L1)1 of the crystal to the effective negative resistor of the whole cir-cuit.
For a given frequency of the crystal the inductivity and also Q is indirect propor-tional to the motional capacitance (C1)1 of the crystal.
Assuming a fixed value of the motional capacitance L11 decreases with the square of the frequency.
Therefore the start up time of the crystal oscillator is decreased proportinal to an increasing of the motional capacitance and with the square of the frequency.
To achive a short start up time of the oscillator a step edge of the power supply is helpful, so the use of unnecessary large “blocking capacitors” should be avoided.
All the individual settling times have to be considered in finding the total settling time of the receiver. On the evaluation board they are
Bias settling time 0.2ms
Start-up time of the reference oscillator < 0.6ms
Power supply slew rate < 1ms
TSA 0.49ms
TSP 0.3ms
The settling time of the evaluation receiver will be less than 3ms utilizing the sliding data slicer together with the precharge circuit.
1.Parameter of a crystal not to be exchanged with the components of the evalboard.
A
CUT S
µ240
13max3
×=
msT 49.03 ≈
R
LTSOSC
1~
4 - 50Wireless Control Components Application Note, February 2004

Functional Description
TDA 521X
4.16 Spurious Radiation
The receiver has to meet the European Telecommunications Standards Institute ETS 300 220 requirements. Other requirements may apply for other countries.
The product family of short range devices (SRD) is divided into three classes of equipment, each having its own set of minimum performance criteria. This clas-sification is based upon the impact on persons and/or goods in case the equip-ment does not operate above the specified minimum performance level under electromagnetic compatibility (EMC) stress.
Class 1 SRD equipment is a highly reliable communication media; e.g. serving human life inherent systems, which result in a physical risk to a person. Appli-cations of this class are fire detection, personal identification, telemetry in vehi-cles, etc.
Class 2 is relevant for medium reliable SRD communication. This is the case when causing inconvenience to persons, which cannot simply be overcome by other means. Such as, cargo handling systems, domestic telemetry, car alarms, vehicle detection and many others.
Class 3 is responsible for standard reliable SRD communication systems, caus-ing inconvenience to persons, which can simply be overcome by other means. This is relevant for garage door openers, car lock/unlock devices, radio remote control television and audio, door bell and so on.
According to ETS 300 220, the limits for spurious radiation on the receiver side are applicable to all receiver classes:
Two different types of emission have to be considered, conducted (antenna port) and board radiation. Conducted emission is defined as the spurious power level at the antenna port. Radiated emission is defined as the “effective radiated power” (ERP) emitted by the board.
The most important spurious signal is the LO signal. The low power design of the VCO and a careful PCB layout keep the spurious radiation well below the limits. The spurious levels at the relevant frequencies measured at the evalua-tion board can be summarized as:
The TDA 5210 conforms to the ETS 300 220 requirements.
Table 4-12 Spurious Radiation Levels
Source of emission Receiver Frequency Limit
434 MHz 868 MHz ETS 300 220
Antenna port VCO 858MHz -90dBm -73dBm -57dBm
VCO/2 423MHz -102dBm <-120dBm -57dBm
Radiated ERP VCO 858MHz -73dBm -67dBm -57dBm
VCO/2 423MHz <-120dBm <-100dBm -57dBm
1GHz below dBm -57
1GHz above dBm -47
4 - 51Wireless Control Components Application Note, February 2004
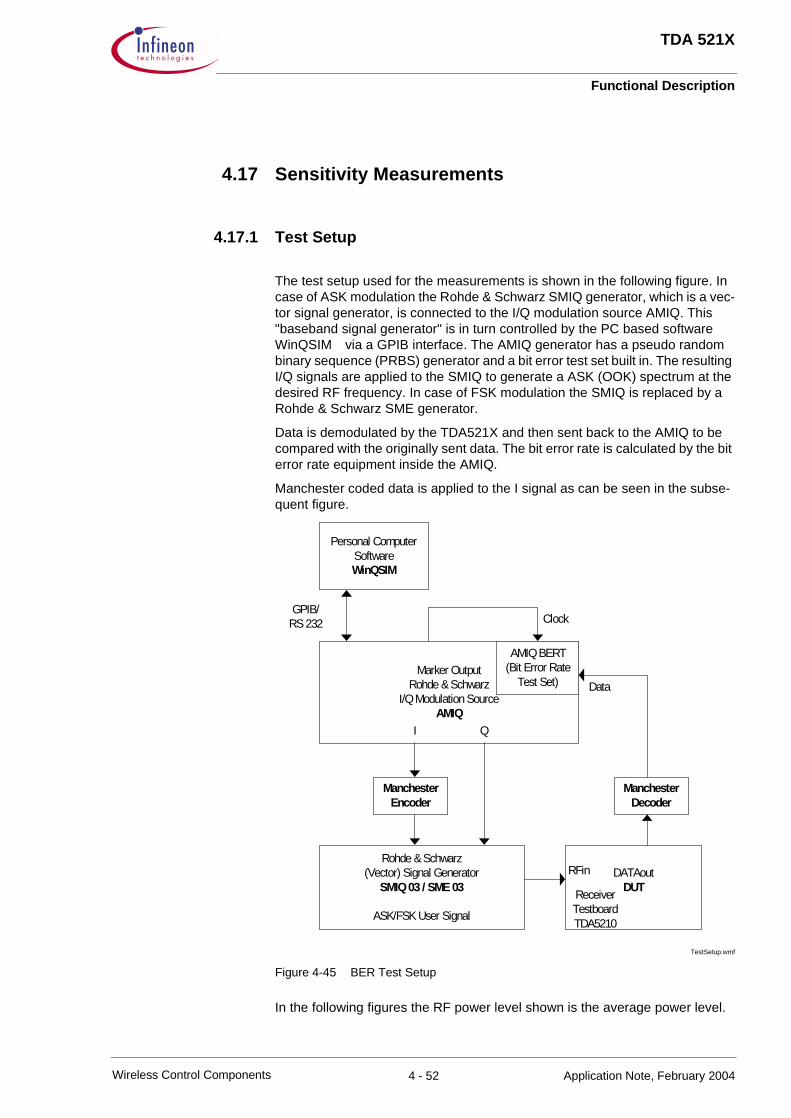
Functional Description
TDA 521X
4.17 Sensitivity Measurements
4.17.1 Test Setup
The test setup used for the measurements is shown in the following figure. In case of ASK modulation the Rohde & Schwarz SMIQ generator, which is a vec-tor signal generator, is connected to the I/Q modulation source AMIQ. This "baseband signal generator" is in turn controlled by the PC based software WinQSIM via a GPIB interface. The AMIQ generator has a pseudo random binary sequence (PRBS) generator and a bit error test set built in. The resulting I/Q signals are applied to the SMIQ to generate a ASK (OOK) spectrum at the desired RF frequency. In case of FSK modulation the SMIQ is replaced by a Rohde & Schwarz SME generator.
Data is demodulated by the TDA521X and then sent back to the AMIQ to be compared with the originally sent data. The bit error rate is calculated by the bit error rate equipment inside the AMIQ.
Manchester coded data is applied to the I signal as can be seen in the subse-quent figure.
TestSetup.wmf
Figure 4-45 BER Test Setup
In the following figures the RF power level shown is the average power level.
Personal ComputerSoftwareWinQSIM
Marker OutputRohde & Schwarz
I/Q Modulation SourceAMIQ
AMIQ BERT(Bit Error Rate
Test Set)
GPIB/RS 232 Clock
Data
ManchesterEncoder
Rohde & Schwarz(Vector) Signal Generator
SMIQ 03 / SME 03
ASK/FSK User Signal
ManchesterDecoder
I Q
DATAoutDUT
RFin
ReceiverTestboardTDA5210
4 - 52Wireless Control Components Application Note, February 2004

Functional Description
TDA 521X
These investigations have been made on an Infineon evaluation board using a data rate of 4 kBit/s with manchester encoding, a IF filter bandwidth of 280 kHz and a data filter bandwidth of 5 kHz. This is the standard configuration of our evaluation boards. All these measurements have been undertaken with several evaluation boards, so that production scattering and component tolerances are already included in these results.
4.17.2 Sensitivity of RKE Receivers
The following frequency derivates of the TDA 521x family have been tested:
TDA 5210 working at 434 and 868 MHz
TDA 5211 working at 315 MHz
TDA 5212 working at 915 MHz
The target bit error rate (BER) is specified to a value of 2.10-3. This value is the criteria to determine the sensitivity.
Frequency Derivates.wmf
Figure 4-46 Sensitivity of RKE Receivers
As can be seen in Figure 4-46 the TDA 5211 shows the best performance, this is because of minimum noise matching at the front end. Thus it has to be men-tioned that the other derivates also show the same behavior, if the matching network at the front end would be matched for minimum noise.
4 - 53Wireless Control Components Application Note, February 2004

Functional Description
TDA 521X
The ASK sensitivity can be up to -113 dBm. In case of FSK -110 dBm are achievable, using a deviation of 150 kHz peak to peak. All these values are measured at an ambient temperature of about 20 °C.
4.17.3 Dependence of the ambient temperature
Demonstrating a wide band of application possibilities the temperature behavior must not be forgotten. In automotive systems the demanded temperature range is from -40 °C to +85 °C. Showing the receivers very good performance a BER measurement at the temperature of +105 °C is also documented in the follow-ing graph.
Temperature.wmf
Figure 4-47 Temperature Behaviour
Notice that the sensitivity variation in this temperature range of -40 °C to +105 °C is only about 2.5 to 3 dB.
4 - 54Wireless Control Components Application Note, February 2004

Functional Description
TDA 521X
4.17.4 Sensitivity depending on the IF Filter Bandwidth
A significant place to influence the receivers sensitivity is the bandwidth of the applied IF filter.
IF Filter Bandwidth.wmf
Figure 4-48 Variable IF FIlter Bandwidth
In the case of ASK using a data rate of 4 kBit/s the IF filter bandwidth can be reduced very dramatically to about 150 kHz resulting in a 1 dB improved sensi-tivity. A similar situation takes place in the FSK mode, where deviation has to be taken into account. A very practicable configuration is to set the IF bandwidth to a value of about 1.5 times the peak to peak deviation. Concerning these aspects the bandwidth should be chosen small enough. With respect to the quartz circuitry tolerances, which influence the receiving frequency, a to small IF filter bandwidth will reduce the sensitivity again. So a compromise has to be made. For further details on IF bandwidth calculation see also Section 4.7.2.
4 - 55Wireless Control Components Application Note, February 2004

Functional Description
TDA 521X
4.17.5 Dependence of Data Filter Bandwidth
Explaining this effect it has to be mentioned that a data rate of 4 kBit/s using manchester encoding results in a data frequency of 2 kHz to 4 kHz depending on the occurring data pattern. The test pattern given by the AMIQ is a pseudo random binary sequency (PRBS9) with a 9 bit shift register. This pattern varies the resulting data frequency up to 4 kHz.
Data Filter Bandwidth ASK.wmf
Figure 4-49 Variation of Data Filter Bandwidth in case of ASK
4 - 56Wireless Control Components Application Note, February 2004

Functional Description
TDA 521X
Data Filter Bandwidth FSK.wmf
Figure 4-50 Variation of Data Filter Bandwidth in case of FSK
As can be seen in the last two figures, a data filter bandwidth of about 5 kHz shows optimal performance. Both lowering and increasing this bandwidth results in less sensitivity. Thus the best results can be achieved using a data filter bandwidth of 1.25 times the maximum of the appearing data frequency.
4 - 57Wireless Control Components Application Note, February 2004

5 Reference
5.1 Test Circuit . . . . . . . . . . . . . . . . . . . . . . . . . . . . . . . . . . . . . . . . . . . . . 5-25.2 Test Board Layouts. . . . . . . . . . . . . . . . . . . . . . . . . . . . . . . . . . . . . . . 5-35.3 Bill of Materials . . . . . . . . . . . . . . . . . . . . . . . . . . . . . . . . . . . . . . . . . . 5-5
Contents of this Chapter
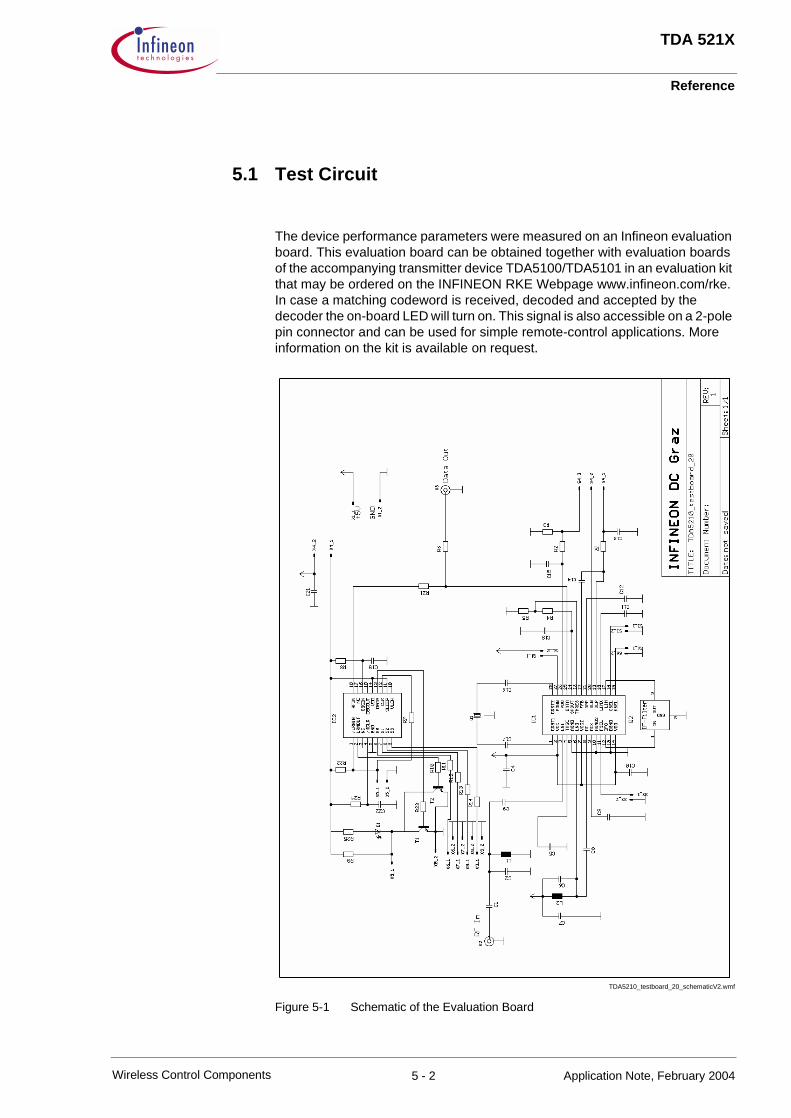
Reference
TDA 521X
5.1 Test Circuit
The device performance parameters were measured on an Infineon evaluation board. This evaluation board can be obtained together with evaluation boards of the accompanying transmitter device TDA5100/TDA5101 in an evaluation kit that may be ordered on the INFINEON RKE Webpage www.infineon.com/rke. In case a matching codeword is received, decoded and accepted by the decoder the on-board LED will turn on. This signal is also accessible on a 2-pole pin connector and can be used for simple remote-control applications. More information on the kit is available on request.
TDA5210_testboard_20_schematicV2.wmf
Figure 5-1 Schematic of the Evaluation Board
5 - 2Wireless Control Components Application Note, February 2004

Reference
TDA 521X
5.2 Test Board Layouts
TDA5210_testboard_20_topV3.wmf
Figure 5-2 Top Side of the Evaluation Board
TDA5210_testboard_20_bot.wmf
Figure 5-3 Bottom Side of the Evaluation Board
5 - 3Wireless Control Components Application Note, February 2004

Reference
TDA 521X
TDA5210_testboard_20_plcV2.wmf
Figure 5-4 Component Placement on the Evaluation Board
5 - 4Wireless Control Components Application Note, February 2004

Reference
TDA 521X
5.3 Bill of Materials
The following components are necessary for evaluation either of the TDA5210 used at 434MHz or 868MHz or of the TDA5211 at 315MHz without use of a Microchip HCS512 decoder.
Table 5-1 Bill of Materials
Ref Value Specification
R1 100kΩ 0805, ± 5%
R2 100kΩ 0805, ± 5%
R3 820kΩ 0805, ± 5%
R4 240kΩ 0805, ± 5%
R5 360kΩ 0805, ± 5%
R6 10kΩ 0805, ± 5%
L1 315MHz: 15nH434 MHz: 15nH868 MHz: 3.3nH
Toko, PTL2012-F15N0GToko, PTL2012-F15N0GToko, PTL2012-F3N3C
L2 315MHz: 12pF434 MHz: 8.2pF868 MHz: 3.9nH
0805, COG, ± 1%0805, COG, ± 0.1pF
Toko, PTL2012-F3N9C
C1 315MHz: 12pF434MHz: 1pF868MHz: 1pF
0805, COG, ± 1%0805, COG, ± 0.1pF0805, COG, ± 0.1pF
C2 315MHz: 10pF434 MHz: 4.7pF868 MHz: 3.9pF
0805, COG, ± 1%0805, COG, ± 0.1pF0805, COG, ± 0.1pF
C3 315MHz: 6.8pF434 MHz: 6.8pF868 MHz: 5.6pF
0805, COG, ± 0.1pF0805, COG, ± 0.1pF0805, COG, ± 0.1pF
C4 100pF 0805, COG, ± 5%
C5 47nF 1206, X7R, ± 10%
C6 315MHz: 15nH434 MHz: 10nH868 MHz: 3.9pF
Toko, PTL2012-F10N0GToko, PTL2012-F10N0G
0805, COG, ± 0.1pF
C7 100pF 0805, COG, ± 5%
C8 315MHz: 33pF434 MHz: 33pF868 MHz: 22pF
0805, COG, ± 5%0805, COG, ± 5%0805, COG, ± 5%
C9 100pF 0805, COG, ± 5%
C10 10nF 0805, X7R, ± 10%
C11 10nF 0805, X7R, ± 10%
C12 220pF 0805, COG, ± 5%
C13 47nF 0805, X7R, ± 10%
C14 470pF 0805, COG, ± 5%
5 - 5Wireless Control Components Application Note, February 2004

Reference
TDA 521X
Please note that in case of operation at 315MHz and 434 MHz a capacitor has to be soldered in place of L2 and an inductor in place of C6.
The following components are necessary in addition to the above mentioned ones for evaluation of the TDA5210 in conjunction with a Microchip HCS512 decoder.
Table 5-1 Bill of materials (continued)
Ref Value Specification
C15 47nF 0805, X7R, ± 5%
C16 8.2pF 0805, COG, ± 0.1pF
C17 22pF 0805, COG, ± 1%
C18 22nF 0805, X7R, ± 5%
Q1315 MHz:(fRF–10.7MHz)/32 434 MHz:(fRF–10.7MHz)/32
868MHz:(fRF–10.7MHz)/64
HC49/U, fundamental mode, CL = 12pF,e.g. 315MHz: Jauch Q 10,178130-S11-12-10/20e.g. 434.2MHz: Jauch Q 13,234370-S11-12-10/20e.g. 868.4MHz: Jauch Q 13,401550-S11-12-10/20
Q2 SFE10.7MA5-A orSKM107M1-A20-10
MurataToko
X2, X3 142-0701-801 Johnson
X1, X4, S1-S3, S6
2-pole pin connector
S4 3-pole pin connector, or not equipped
IC1 315 MHz: TDA5211434 MHz:TDA5210868 MHz: TDA5210
Infineon
Table 5-2 Bill of Materials Addendum
Ref Value Specification
R7 100kΩ 0805, ± 5%
R8 10kΩ 0805, ± 5%
R9 100kΩ 0805, ± 5%
R10 22kΩ 0805, ± 5%
R11 100Ω 0805, ± 5%
R12 100Ω 0805, ± 5%
R13 100Ω 0805, ± 5%
R14 100Ω 0805, ± 5%
R21 22kΩ 0805, ± 5%
R22 10kΩ 0805, ± 5%
R23 22kΩ 0805, ± 5%
R24 820kΩ 0805, ± 5%
R25 560Ω 0805, ± 5%
5 - 6Wireless Control Components Application Note, February 2004
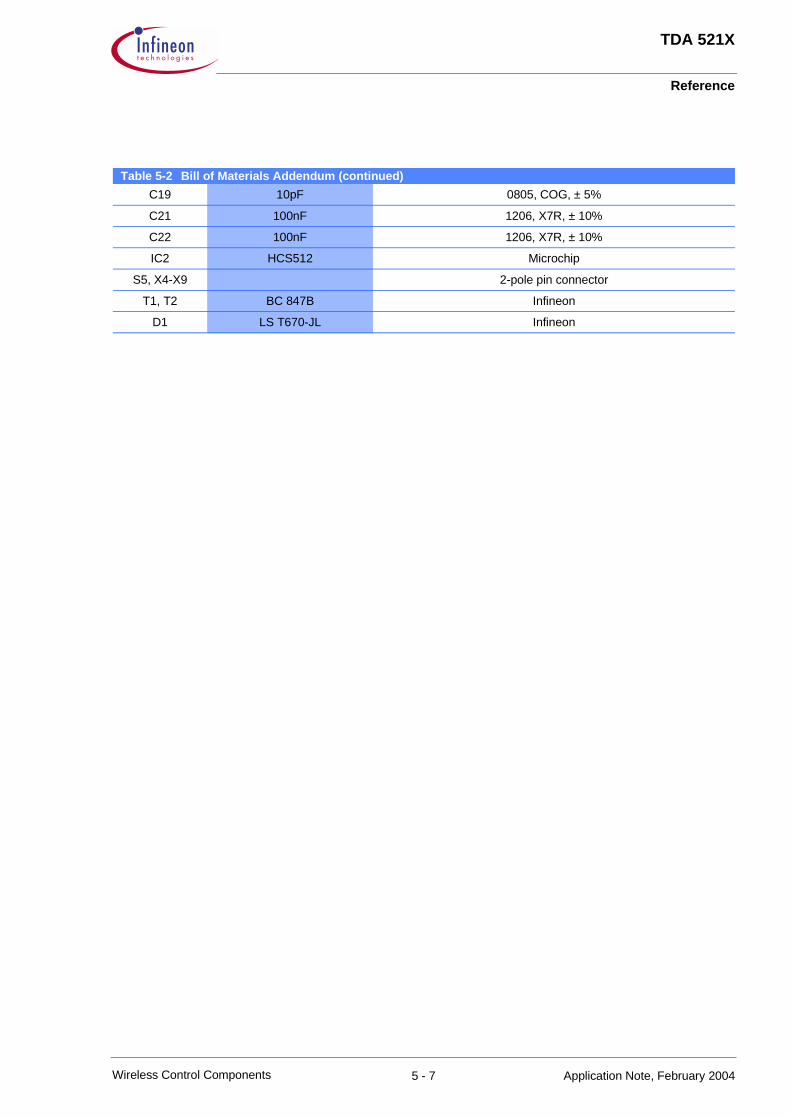
Reference
TDA 521X
Table 5-2 Bill of Materials Addendum (continued)
C19 10pF 0805, COG, ± 5%
C21 100nF 1206, X7R, ± 10%
C22 100nF 1206, X7R, ± 10%
IC2 HCS512 Microchip
S5, X4-X9 2-pole pin connector
T1, T2 BC 847B Infineon
D1 LS T670-JL Infineon
5 - 7Wireless Control Components Application Note, February 2004

List of Figures
TDA 521X
6 List of Figures
Figure 2-1 Functional Block Diagram . . . . . . . . . . . . . . . . . . . . . . . . . . . . . . . . . . . . . . . . . . . . . . . 2-3
Figure 2-2 P-TSSOP-28-1 package outlines . . . . . . . . . . . . . . . . . . . . . . . . . . . . . . . . . . . . . . . . . 2-4
Figure 3-1 IC Pin Configuration . . . . . . . . . . . . . . . . . . . . . . . . . . . . . . . . . . . . . . . . . . . . . . . . . . . 3-2
Figure 4-1 LNA input matching network . . . . . . . . . . . . . . . . . . . . . . . . . . . . . . . . . . . . . . . . . . . . . 4-3
Figure 4-2 LNA voltage gain vs. frequency of 434MHz receiver . . . . . . . . . . . . . . . . . . . . . . . . . . . 4-7
Figure 4-3 Input reflection and relative gain of the LNA vs. frequencyat 869MHz . . . . . . . . . . . . . . . . . . . . . . . . . . . . . . . . . . . . . . . . . . . . . . . . . . . . . . . . . . . 4-7
Figure 4-4 AGC circuit . . . . . . . . . . . . . . . . . . . . . . . . . . . . . . . . . . . . . . . . . . . . . . . . . . . . . . . . . . 4-8
Figure 4-5 RSSI voltage as a function of input level for AGC implementation . . . . . . . . . . . . . . . . 4-9
Figure 4-6 AGC time constant; RF-Level=-70dBm . . . . . . . . . . . . . . . . . . . . . . . . . . . . . . . . . . . . . 4-11
Figure 4-7 Typical VCO tuning curve of TDA5210 . . . . . . . . . . . . . . . . . . . . . . . . . . . . . . . . . . . . . 4-15
Figure 4-7 Determination of Series Capacitance Value for the Quartz Oscillator . . . . . . . . . . . . . . 4-13
Figure 4-8 Phase noise spectrum of local oscillator . . . . . . . . . . . . . . . . . . . . . . . . . . . . . . . . . . . . 4-15
Figure 4-9 Determination of Series Capacitance Value for the Quartz Oscillator . . . . . . . . . . . . . . 4-16
Figure 4-10 Tolerances caused by DL of 20% . . . . . . . . . . . . . . . . . . . . . . . . . . . . . . . . . . . . . . . . . 4-19
Figure 4-11 Tolerances of the oscillator caused by DCs of 0.1pF . . . . . . . . . . . . . . . . . . . . . . . . . . 4-18
Figure 4-12 Tolerances of the oscillator caused by DCs of 1% . . . . . . . . . . . . . . . . . . . . . . . . . . . . 4-20
Figure 4-13 Tolerances of the oscillator caused by DCs and DCs . . . . . . . . . . . . . . . . . . . . . . . . . . 4-20
Figure 4-14 Rs/R1 vs CL/C0 . . . . . . . . . . . . . . . . . . . . . . . . . . . . . . . . . . . . . . . . . . . . . . . . . . . . . . . 4-21
Figure 4-15 Forcing the crystal oscillator without transformer . . . . . . . . . . . . . . . . . . . . . . . . . . . . . 4-22
Figure 4-16 Forcing the crystal oscillator with transformer . . . . . . . . . . . . . . . . . . . . . . . . . . . . . . . . 4-23
Figure 4-17 Frequency response of the IF amplifier . . . . . . . . . . . . . . . . . . . . . . . . . . . . . . . . . . . . . 4-24
Figure 4-18 IF frequency response . . . . . . . . . . . . . . . . . . . . . . . . . . . . . . . . . . . . . . . . . . . . . . . . . . 4-25
Figure 4-19 ASK/FSK mode datapath . . . . . . . . . . . . . . . . . . . . . . . . . . . . . . . . . . . . . . . . . . . . . . . 4-27
Figure 4-20 Frequency characteristic in case of FSK mode . . . . . . . . . . . . . . . . . . . . . . . . . . . . . . . 4-28
Figure 4-21 Frequency characteristic in case of ASK mode . . . . . . . . . . . . . . . . . . . . . . . . . . . . . . . 4-29
Figure 4-22 Limiter demodulator characteristic . . . . . . . . . . . . . . . . . . . . . . . . . . . . . . . . . . . . . . . . . 4-30
Figure 4-23 RSSI Voltage vs. Receiver Input Level . . . . . . . . . . . . . . . . . . . . . . . . . . . . . . . . . . . . . 4-31
Figure 4-24 Block diagram of the FSK-PLL-Demodulator . . . . . . . . . . . . . . . . . . . . . . . . . . . . . . . . 4-32
Figure 4-25 Data Filter Design . . . . . . . . . . . . . . . . . . . . . . . . . . . . . . . . . . . . . . . . . . . . . . . . . . . . . 4-34
Figure 4-26 Data slicer with adaptive slice reference . . . . . . . . . . . . . . . . . . . . . . . . . . . . . . . . . . . . 4-36
Figure 4-27 Data slicer with clamping slice reference . . . . . . . . . . . . . . . . . . . . . . . . . . . . . . . . . . . 4-37
Figure 4-28 Precharging with peak detector . . . . . . . . . . . . . . . . . . . . . . . . . . . . . . . . . . . . . . . . . . . 4-38
Figure 4-29 Average of slicing level . . . . . . . . . . . . . . . . . . . . . . . . . . . . . . . . . . . . . . . . . . . . . . . . . 4-39
Figure 4-30 Ripple of slicing level . . . . . . . . . . . . . . . . . . . . . . . . . . . . . . . . . . . . . . . . . . . . . . . . . . . 4-39
Figure 4-31 Slicing level derived from peak detektor . . . . . . . . . . . . . . . . . . . . . . . . . . . . . . . . . . . . 4-40
Figure 4-32 Discharging to GND; RF-Level = -65dBm . . . . . . . . . . . . . . . . . . . . . . . . . . . . . . . . . . . 4-41
Figure 4-33 Discharging to data filter out; RF-Level = -100dBm . . . . . . . . . . . . . . . . . . . . . . . . . . . . 4-41
Figure 4-34 Adapting impedance slicing level generation . . . . . . . . . . . . . . . . . . . . . . . . . . . . . . . . . 4-42
List of Figures - iWireless Control Components Application Note, February 2004

List of Figures
TDA 521X
Figure 4-34 Adapting impedance slicing level generation and buffer . . . . . . . . . . . . . . . . . . . . . . . . 4-42
Figure 4-36 Measuring circuit with R2*C=127µs with 10ms of low level respectively . . . . . . . . . . . . 4-43
Figure 4-37 Response time of circuit with R2*C=127µs; Data frequency = 1kHz . . . . . . . . . . . . . . . 4-44
Figure 4-38 Measuring circuit with R2*C=9.4µs with 10ms of low level respectively . . . . . . . . . . . . 4-44
Figure 4-39 Response time of circuit with R2*C=9.4µs; Data frequency = 1kHz . . . . . . . . . . . . . . . 4-45
Figure 4-40 Principle of the precharge circuit . . . . . . . . . . . . . . . . . . . . . . . . . . . . . . . . . . . . . . . . . . 4-46
Figure 4-41 Voltage appearing on C2 during precharging process . . . . . . . . . . . . . . . . . . . . . . . . . . 4-47
Figure 4-42 Voltage transient on capacitor C attached to pin20 . . . . . . . . . . . . . . . . . . . . . . . . . . . . 4-48
Figure 4-43 FSK-Noise-Detector (low price version) . . . . . . . . . . . . . . . . . . . . . . . . . . . . . . . . . . . . . 4-49
Figure 4-44 FSK-Noise-Detector (Temperature-stabilized version). . . . . . . . . . . . . . . . . . . . . . . . . . 4-50
Figure 4-45 BER Test Setup . . . . . . . . . . . . . . . . . . . . . . . . . . . . . . . . . . . . . . . . . . . . . . . . . . . . . . . 4-56
Figure 4-46 Sensitivity of RKE Receivers . . . . . . . . . . . . . . . . . . . . . . . . . . . . . . . . . . . . . . . . . . . . . 4-57
Figure 4-47 Temperature Behaviour . . . . . . . . . . . . . . . . . . . . . . . . . . . . . . . . . . . . . . . . . . . . . . . . . 4-58
Figure 4-48 Variable IF Filter Bandwidth . . . . . . . . . . . . . . . . . . . . . . . . . . . . . . . . . . . . . . . . . . . . . . 4-59
Figure 4-49 Variation of Data Filter Bandwidth in case of ASK . . . . . . . . . . . . . . . . . . . . . . . . . . . . . 4-60
Figure 4-50 Variation of Data Filter Bandwidth in case of FSK . . . . . . . . . . . . . . . . . . . . . . . . . . . . . 4-61
Figure 5-1 Schematic of the Evaluation Board . . . . . . . . . . . . . . . . . . . . . . . . . . . . . . . . . . . . . . . . 5-2
Figure 5-2 Top Side of the Evaluation Board . . . . . . . . . . . . . . . . . . . . . . . . . . . . . . . . . . . . . . . . . 5-3
Figure 5-3 Bottom Side of the Evaluation Board . . . . . . . . . . . . . . . . . . . . . . . . . . . . . . . . . . . . . . . 5-3
Figure 5-4 Component Placement on the Evaluation Board . . . . . . . . . . . . . . . . . . . . . . . . . . . . . . 5-4
List of Figures - iiWireless Control Components Application Note, February 2004

List of Tables
List of Tables - i
TDA 521X
Wireless Control Components
Application Note, February 2004
7 List of Tables
Table 2-1 Summary of the Key Parameters of the Device . . . . . . . . . . . . . . . . . . . . . . . . . . . . . . 2-3
Table 3-1 Pin Definition and Function . . . . . . . . . . . . . . . . . . . . . . . . . . . . . . . . . . . . . . . . . . . . . . 3-3
Table 4-1 S-Parameters of the LNA . . . . . . . . . . . . . . . . . . . . . . . . . . . . . . . . . . . . . . . . . . . . . . . 4-2
Table 4-2 Tolerance Values of the LNA Input Matching Circuit . . . . . . . . . . . . . . . . . . . . . . . . . . . 4-4
Table 4-3 Dependence of TL Value on C5 . . . . . . . . . . . . . . . . . . . . . . . . . . . . . . . . . . . . . . . . . . 4-10
Table 4-4 Measured Mixer Performance at 434 MHz . . . . . . . . . . . . . . . . . . . . . . . . . . . . . . . . . . 4-12
Table 4-5 Measured Mixer Performance at 869 MHz . . . . . . . . . . . . . . . . . . . . . . . . . . . . . . . . . . 4-12
Table 4-6 Measured Mixer Performance at 315 . . . . . . . . . . . . . . . . . . . . . . . . . . . . . . . . . . . . . . 4-13
Table 4-7 Measured IIP3 at 434 MHz . . . . . . . . . . . . . . . . . . . . . . . . . . . . . . . . . . . . . . . . . . . . . . 4-13
Table 4-8 Assessment of the Frequency Error of the Crystal Oscillator . . . . . . . . . . . . . . . . . . . . 4-22
Table 4-9 Design Example: IF Bandwidth Calculation (3σ value) . . . . . . . . . . . . . . . . . . . . . . . . . 4-25
Table 4-10 Frequency response of the FSK-switch . . . . . . . . . . . . . . . . . . . . . . . . . . . . . . . . . . . . . 4-33
Table 4-10 Temperature sensitivity . . . . . . . . . . . . . . . . . . . . . . . . . . . . . . . . . . . . . . . . . . . . . . . . . 4-50
Table 4-11 Spurious Radiation Levels . . . . . . . . . . . . . . . . . . . . . . . . . . . . . . . . . . . . . . . . . . . . . . . 4-55
Table 5-1 Bill of Materials . . . . . . . . . . . . . . . . . . . . . . . . . . . . . . . . . . . . . . . . . . . . . . . . . . . . . . . 5-5
Table 5-2 Bill of Materials Addendum . . . . . . . . . . . . . . . . . . . . . . . . . . . . . . . . . . . . . . . . . . . . . . 5-6


![Components for Wireless Communication Mechanical/Electrical … · 2017-12-14 · Wireless Communication Components [Nguyen et al., 1998] Texas Christian University Department of](https://img.pdfslide.us/doc/110x75/5f508fa37a2b4f622060fadd/components-for-wireless-communication-mechanicalelectrical-2017-12-14-wireless.jpg)