Embed Size (px)
Citation preview
Small Watershed Hydrology WinTR–55 User Guide
ConservationEngineeringDivision
WinTR–55 User Guide, January 2009
Issued January 2009
The U.S. Department of Agriculture (USDA) prohibits discrimination in all its programs and activities on the basis of race, color, national origin, age, disability, and where applicable, sex, marital status, familial status, parental status, religion, sexual orientation, genetic information, political beliefs, reprisal, or because all or a part of an individual’s income is derived from any public assistance program. (Not all prohibited bases apply to all programs.) Persons with disabilities who require alternative means for communication of program information (Braille, large print, audiotape, etc.) should contact USDA’s TARGET Center at (202) 720-2600 (voice and TDD). To file a com-plaint of discrimination, write to USDA, Director, Office of Civil Rights, 1400 Independence Avenue, S.W., Washington, DC 20250-9410, or call (800) 795-3272 (voice) or (202) 720-6382 (TDD). USDA is an equal opportunity provider and employer.

WinTR–55 User Guide, January 2009 i
Preface The WinTR–55 Small Watershed Hydrology Computer Program Version 1.00 has been developed to operate within the Windows® operating sys-tem. This guide assists the new or occasional user prepare input and run the program.
This version of WinTR–55 is improved over the 1992 version with the fol-lowing features:
• inclusionofWindows® interface
• useofWinTR–20forcalculations
The program and supporting materials may be downloaded from the Web site http://www.wsi.nrcs.usda.gov/products/W2Q/H&H/Tools_Models/WinTR55.html. The materials available include a Frequently Asked Ques-tions file, a tutorial, and other training material.
Please e-mail any problems to the WinTR–55 development team at [email protected] or contact the NRCS hydraulic engineer in your state.
WinTR–55 Small Watershed Hydrology was developed by:
Ralph Roberts, U.S. Department of Agriculture, Agricultural Research Service, MD
Jolyne Lea, U.S. Department of Agriculture, Natural Resources Conser-vation Service, OR
Laurel Foreman, U.S. Department of Agriculture, Natural Resources Conservation Service, IA
Helen Fox Moody, U.S. Department of Agriculture, Natural Resources Conservation Service, MD
Quan D. Quan, U.S. Department of Agriculture, Natural Resources Con-servation Service, MD
William Merkel, U.S. Department of Agriculture, Natural Resources Conservation Service, MD
Karl Visser, U.S. Department of Agriculture, Natural Resources Conser-vation Service, TX
Claudia Hoeft, U.S. Department of Agriculture, Natural Resources Con-servation Service, Washington, DC
Al McNeill, U.S. Department of Agriculture, Natural Resources Conser-vation Service, SC
John McClung, U.S. Department of Agriculture, Natural Resources Con-servation Service, AR
Tony Funderburk, U.S. Department of Agriculture, Natural Resources Conservation Service, TX
Jon Werner, U.S. Department of Agriculture, Natural Resources Conser-vation Service, retired
Roger Cronshey, U.S. Department of Agriculture, Natural Resources Conservation Service, retired
Don Woodward, U.S. Department of Agriculture, Natural Resources Conservation Service, retired
Many volunteer users from the U.S. Department of Agriculture, the Natu-ral Resources Conservation Service, and the private sector provided extensive testing and comments. They helped make this version a much better product.
Acknowledgments

ii WinTR–55 User Guide, January 2009
WinTR–55 User Guide, January 2009 iii
Contents
Introduction ................................................................................................................................................... 1
Historical background ......................................................................................................................................................1
Program description .........................................................................................................................................................1
Model overview .................................................................................................................................................................1
Capabilities and limitations ..............................................................................................................................................2
Model input .................................................................................................................................................... 3
Minimum data requirements ............................................................................................................................................3
User responsibility ............................................................................................................................................................3
Watershed sub-areas and reaches ...................................................................................................................................3
Welcome to WinTR–55 window .......................................................................................................................................6
WinTR–55 Main Window ...................................................................................................................................................8
Land Use Details window ...............................................................................................................................................14
Land Use Summary for Sub-area window ....................................................................................................................15
Custom Curve Number window ....................................................................................................................................15
Time of Concentration Details window ........................................................................................................................18
Reach Data window ........................................................................................................................................................20
Reach Flow Path window ...............................................................................................................................................23
Structure Data window ...................................................................................................................................................24
Storm Data window ........................................................................................................................................................30
Custom Rainfall Distribution window ..........................................................................................................................33
Dimensionless Unit Hydrograph window ....................................................................................................................35
Graphics windows ...........................................................................................................................................................35
Running WinTR–55 ....................................................................................................................................... 39
WinTR–55 processes .......................................................................................................................................................39
WinTR–20 processes .......................................................................................................................................................40
Viewing Output ............................................................................................................................................. 41
Output Definition window ..............................................................................................................................................43
Plotting and viewing hydrographs .................................................................................................................................45
Appendix A—Examples
Appendix B—Equations
Apendix C—References
Small Watershed Hydrology
iv WinTR–55 User Guide, January 2009
Tables
Table 1 WinTR–55 capabilities and limitations ..............................................................................................................2
Table 2 Sample watershed flows ......................................................................................................................................3
Table 3 WinTR–55 file display .........................................................................................................................................42
Table 4 WinTR–55 reports ........................................................................................................................................................ 44
Figures
Figure 1 WinTR–55 system schematic ..............................................................................................................................2
Figure 2 Sample watershed schematic .............................................................................................................................3
Figure 3 Window entry features .........................................................................................................................................4
Figure 4 Additional window entry features ......................................................................................................................5
Figure 5 Pipe outlet schematics .......................................................................................................................................26
Figure 6 Short-tube flow assumption not valid ..............................................................................................................26
Figure 7 Weir outlet schematic ........................................................................................................................................27
WinTR–55 User Guide, January 2009 v
Windows
Window 1 Welcome to WinTR–55 window .....................................................................................................................6
Window 2 Help for Welcome to WinTR–55 window .....................................................................................................7
Window 3 WinTR–55 Main Window ................................................................................................................................8
Window 4 WinTR–55 Main Window File menu ..............................................................................................................9
Window 5 WinTR–55 Main Window Options menu .......................................................................................................9
Window 6 WinTR–55 Main Window ProjectData menu ..............................................................................................10
Window 7 WinTR–55 Main Window GlobalData menu ...............................................................................................10
Window 8 WinTR–55 Main Window Run menu ...........................................................................................................11
Window 9 WinTR–55 Main Window Help menu ..........................................................................................................11
Window 10 Land Use Details window .............................................................................................................................14
Window 11 Land Use Summary for Sub-area window ..................................................................................................15
Window 12 Custom Curve Number window ..................................................................................................................16
Window 13 Land Use Details window with Custom Curve Number ...........................................................................17
Window 14 Time of Concentration Details window......................................................................................................18
Window 15 Reach Data window ......................................................................................................................................20
Window 16 Channel Rating plot ......................................................................................................................................22
Window 17 Reach Flow Path window ...........................................................................................................................23
Window 18 Structure Data (pipe outlet) window ..........................................................................................................24
Window 19 Structure Data (weir outlet) window .........................................................................................................27
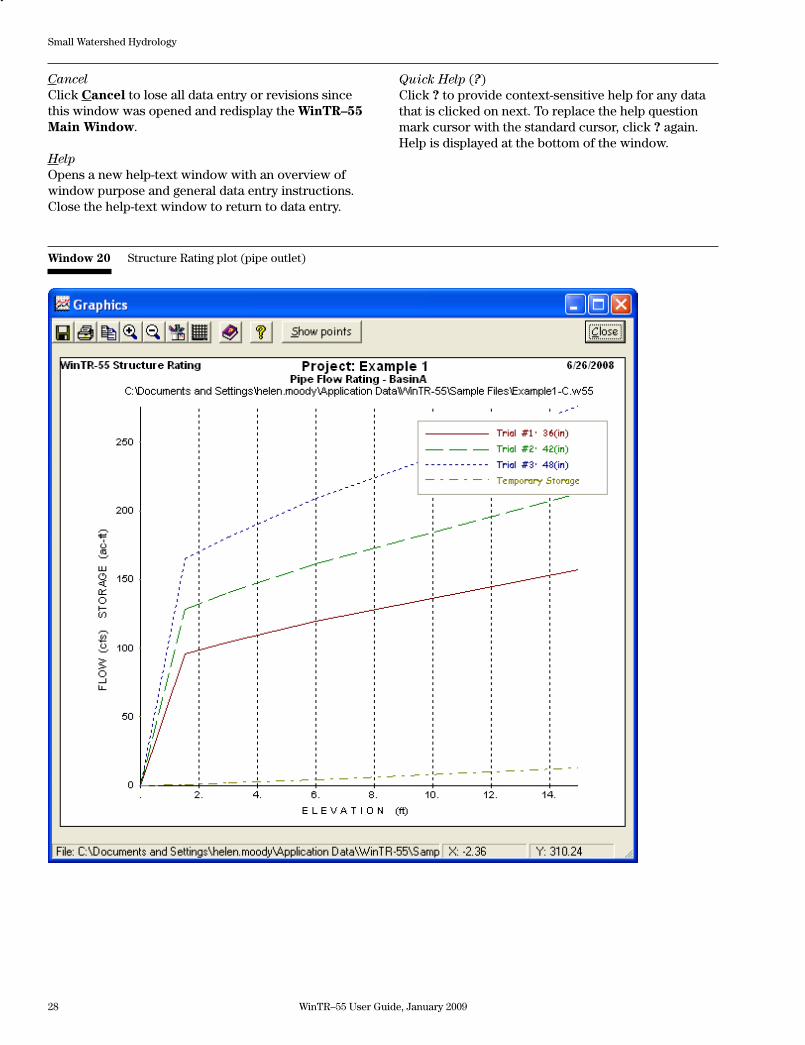
Window 20 Structure Rating plot (pipe outlet) ..............................................................................................................28
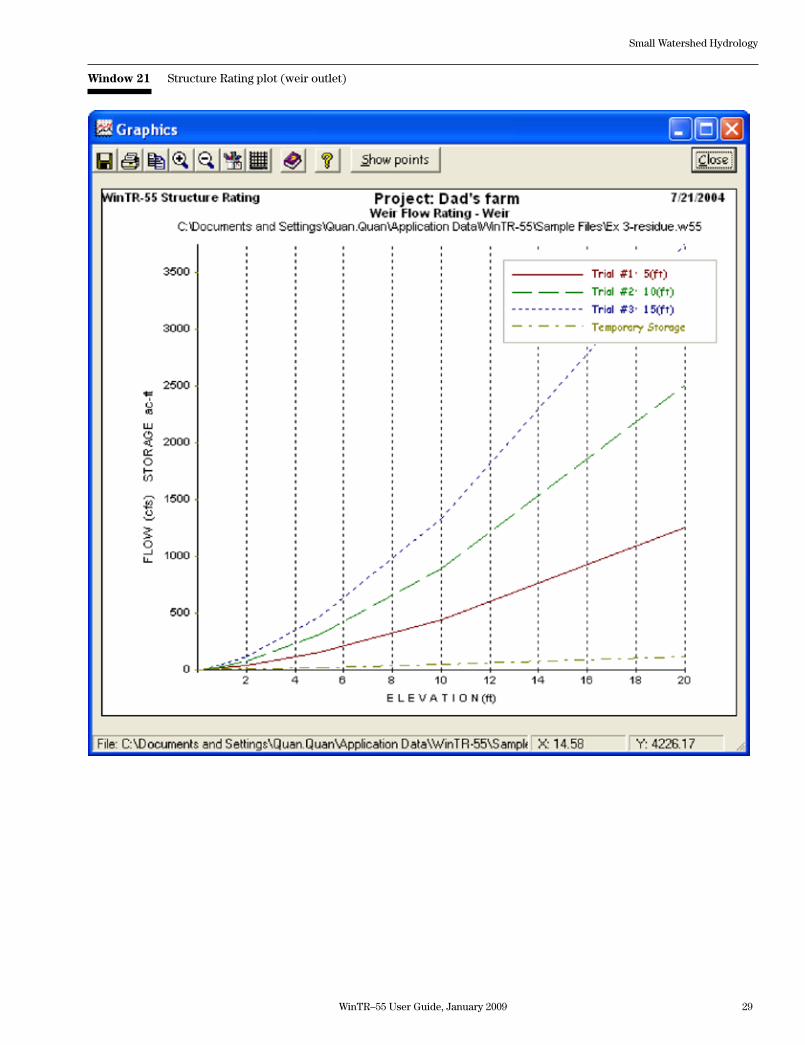
Window 21 Structure Rating plot (weir outlet) .............................................................................................................29
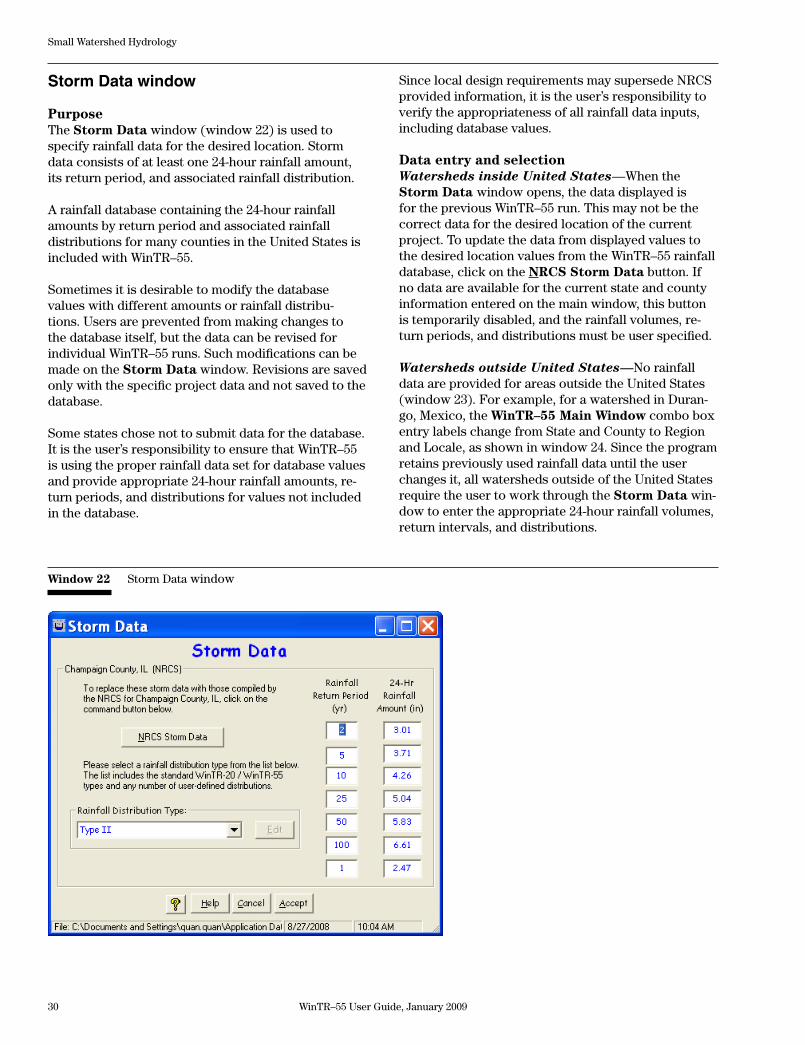
Window 22 Storm Data window .....................................................................................................................................30
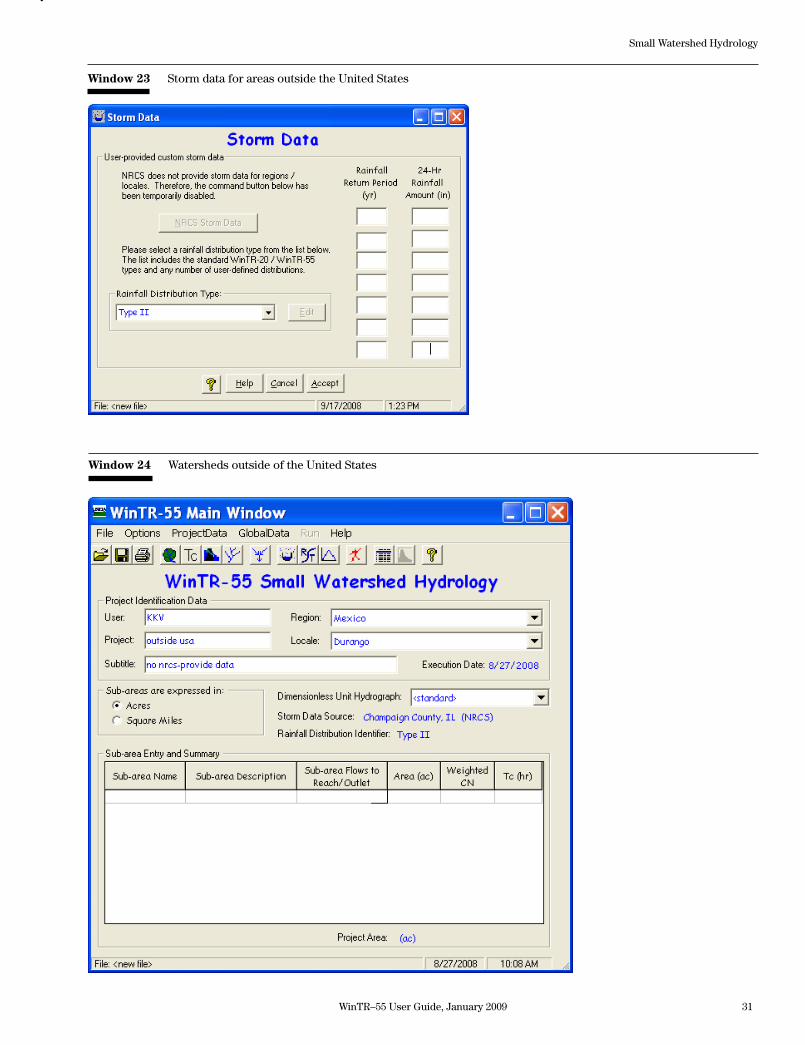
Window 23 Storm data for areas outside the United States .........................................................................................31
Window 24 Watersheds outside of the United States....................................................................................................31
Window 25 Differing state/county and storm data source example ...........................................................................32
vi WinTR–55 User Guide, January 2009
Window 26 Custom Rainfall Distribution window ........................................................................................................34
Window 27 Custom Rainfall Distribution plot ...............................................................................................................34
Window 28 Dimensionless unit hydrograph window ...................................................................................................35
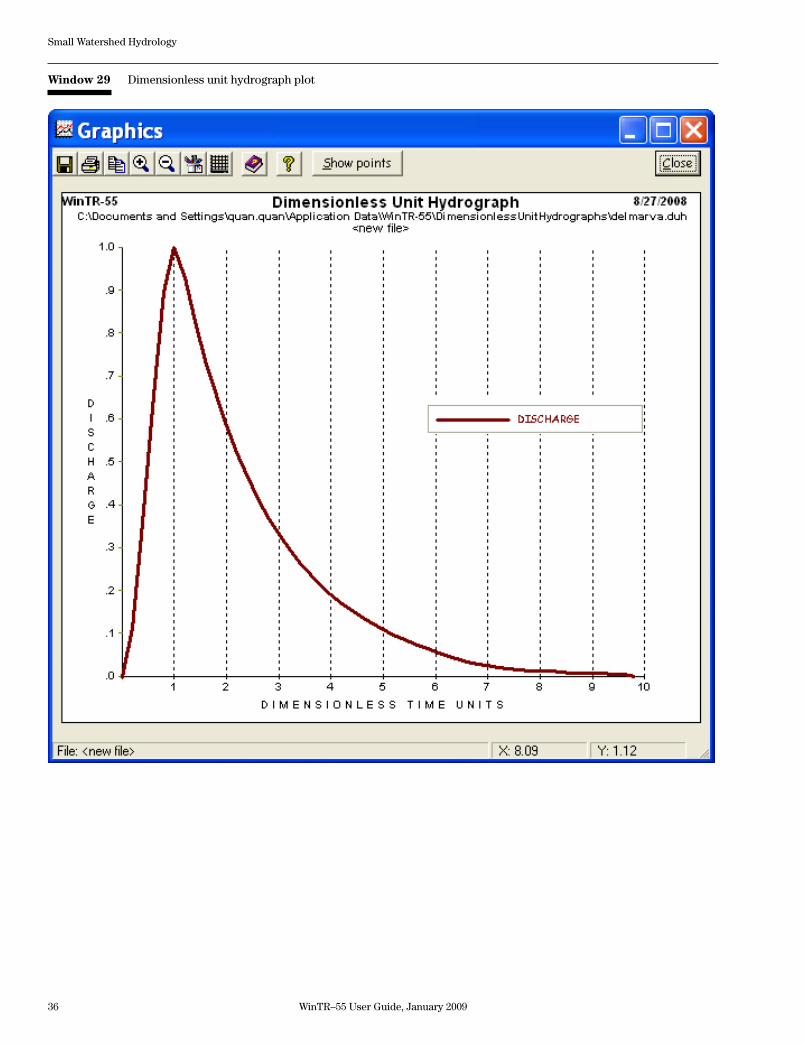
Window 29 Dimensionless unit hydrograph plot ...........................................................................................................36
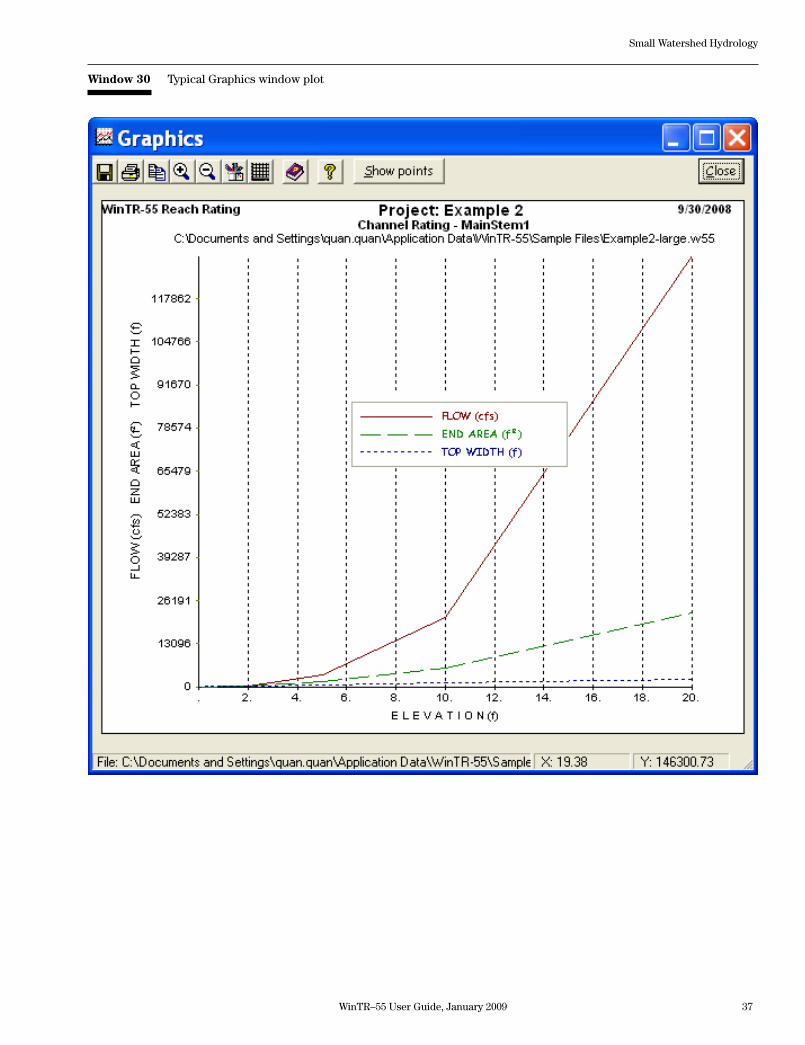
Window 30 Typical Graphics window plot .....................................................................................................................37
Window 31 File Display window .....................................................................................................................................41
Window 32 Output Definition window ............................................................................................................................42
Window 33 Output Graphics window .............................................................................................................................45
Window 34 Graphics window output plot .....................................................................................................................46
Window 35 Output plot zoom feature .............................................................................................................................47
WinTR–55 User Guide, January 2009 1
Small Watershed Hydrology
Introduction
Historical background
Technical Release 55 (TR–55) Urban Hydrology for Small Watersheds was first issued by the Soil Conser-vation Service (SCS) in January 1975 as a simplified procedure for calculating storm runoff volume, peak rate of discharge, and storage volumes for storm water management structures. TR–55 was applicable only for the SCS Type II rainfall distribution and required the user to perform manual calculations.
In September 1986, SCS released a major revision to TR–55. This version included three additional rainfall distributions (Type I, IA, and III) and defined the veloc-ity method of computing time of concentration by splitting the time of concentration flow path into three distinct flow segments for sheet flow, shallow concen-trated flow, and channel flow. A computer program was also released that automated the computations. The wide acceptance and use of TR–55 by public and private users generated a great deal of feedback used by SCS to identify where improvements could be made in the procedures and the computer program.
A WinTR–55 work group was formed in the spring of 1998 to modernize and revise the technical release and the computer software. The following changes were made to the program:
• ThesourcecodewasupgradedtoMicrosoft® Visual Basic® 6.0.
• Datainputphilosophywaschangedandtheprogram revised to use a hydrograph computa-tional routine instead of generalized tables and graphs.
• AWindows® interface and output post-proces-sor were developed.
As a result, the hydrograph generation capability of the software was greatly enhanced as the user can now flood route hydrographs through stream reaches and reservoirs.
The availability and technical capabilities of the per-sonal computer have significantly changed the phi-losophy of problem solving for the engineer. Computer availability eliminated the need for the TR–55 manual
methods, thus the graphs and tables in the older docu-ments have been eliminated.
This user guide covers the procedures used in and the operation of the WinTR–55 computer program. Part 630 of the Natural Resources Conservation Service (NRCS) National Engineering Handbook (NEH) pro-vides detailed information on NRCS hydrology and is the technical reference for this document. Appendix C, which lists all the references, contains a list of the NEH Part 630 chapters and their subjects. Users who are not familiar with NRCS hydrologic procedures should refer to the appropriate chapters for back-ground information and the details of procedural techniques.
Program description
WinTR–55 is a single-event rainfall-runoff, small wa-tershed hydrologic model. The model generates hydro-graphs from both urban and agricultural areas and at selected points along the stream system. Hydrographs are routed downstream through channels and/or res-ervoirs.Multiplesub-areascanbemodeledwithinthewatershed.
Model overview
A watershed consists of sub-areas (land areas) and reaches (major flow paths in the watershed). For each sub-area, a hydrograph is generated based on land and climate characteristics. Reaches are designated as either channel reaches, through which hydrographs are routed based on physical stream characteristics, or as storage reaches, through which hydrographs are routed based on reservoir storage and outlet charac-teristics. Sub-area and reach hydrographs are com-bined as needed to represent the accumulation of flow as water moves from the upland areas down through the watershed reach network. The watershed outlet represents the location at which all runoff from the watershed is accumulated.
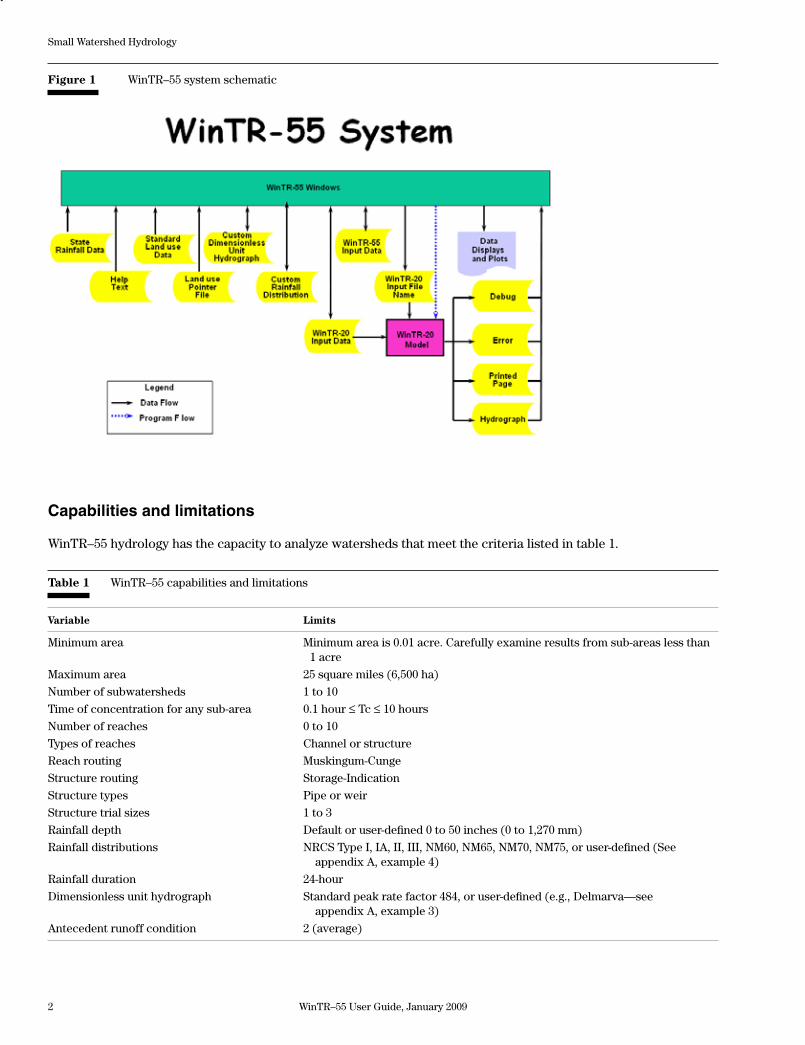
WinTR–55 uses the WinTR–20 (Version 1.11) compu-tational routine for generating, routing, and adding hydrographs. The WinTR–55 system is illustrated in figure 1. This figure shows the relationship between WinTR–55 and WinTR–20, as well as the file associa-tions within the modeling system.
2 WinTR–55 User Guide, January 2009
Small Watershed Hydrology
Capabilities and limitations
WinTR–55 hydrology has the capacity to analyze watersheds that meet the criteria listed in table 1.
Table 1 WinTR–55 capabilities and limitations
Variable Limits
Minimum area Minimum area is 0.01 acre. Carefully examine results from sub-areas less than 1 acre
Maximum area 25 square miles (6,500 ha)
Number of subwatersheds 1 to 10
Time of concentration for any sub-area 0.1 hour ≤ Tc ≤ 10 hours
Number of reaches 0 to 10
Types of reaches Channel or structure
Reach routing Muskingum-Cunge
Structure routing Storage-Indication
Structure types Pipe or weir
Structure trial sizes 1 to 3
Rainfall depth Default or user-defined 0 to 50 inches (0 to 1,270 mm)
Rainfall distributions NRCS Type I, IA, II, III, NM60, NM65, NM70, NM75, or user-defined (See appendix A, example 4)
Rainfall duration 24-hour
Dimensionless unit hydrograph Standard peak rate factor 484, or user-defined (e.g., Delmarva—see appendix A, example 3)
Antecedent runoff condition 2 (average)
Figure 1 WinTR–55 system schematic
WinTR–55 User Guide, January 2009 3
Small Watershed Hydrology
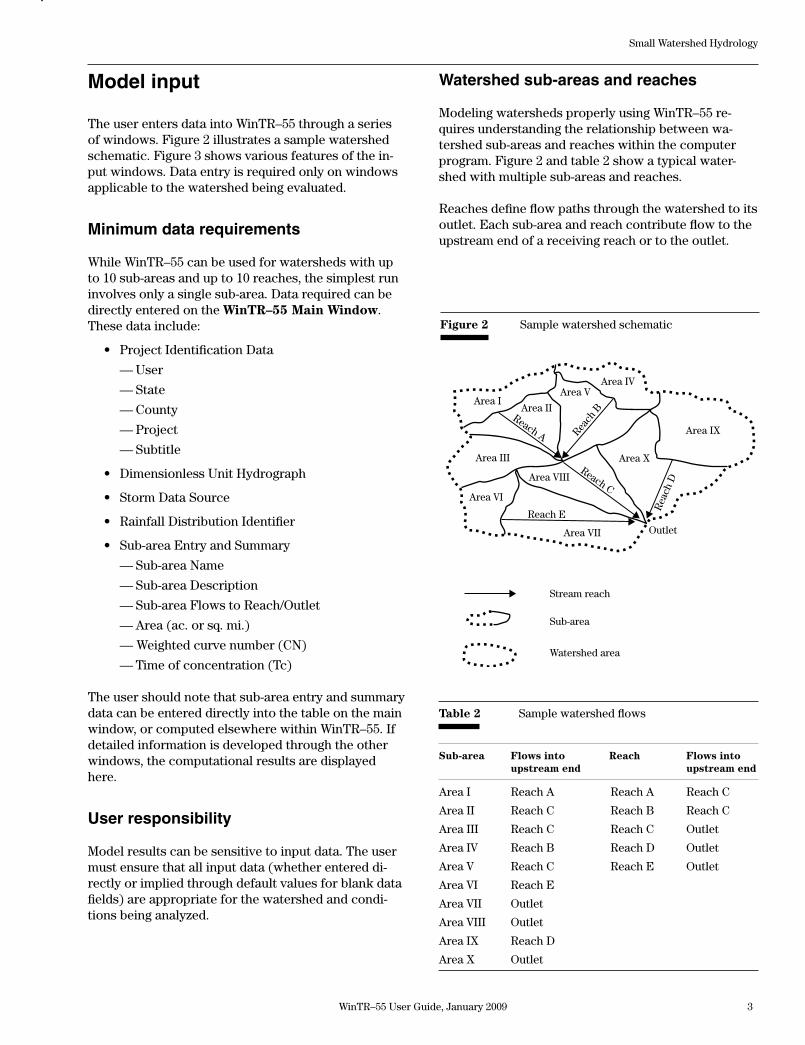
Figure 2 Sample watershed schematic
Model input
The user enters data into WinTR–55 through a series of windows. Figure 2 illustrates a sample watershed schematic. Figure 3 shows various features of the in-put windows. Data entry is required only on windows applicable to the watershed being evaluated.
Minimum data requirements
While WinTR–55 can be used for watersheds with up to 10 sub-areas and up to 10 reaches, the simplest run involves only a single sub-area. Data required can be directly entered on the WinTR–55 Main Window. These data include:
• ProjectIdentificationData
— User
— State
— County
— Project
— Subtitle
• DimensionlessUnitHydrograph
• StormDataSource
• RainfallDistributionIdentifier
• Sub-areaEntryandSummary
— Sub-area Name
— Sub-area Description
— Sub-area Flows to Reach/Outlet
— Area (ac. or sq. mi.)
— Weighted curve number (CN)
— Time of concentration (Tc)
The user should note that sub-area entry and summary data can be entered directly into the table on the main window, or computed elsewhere within WinTR–55. If detailed information is developed through the other windows, the computational results are displayed here.
User responsibility
Model results can be sensitive to input data. The user must ensure that all input data (whether entered di-rectly or implied through default values for blank data fields) are appropriate for the watershed and condi-tions being analyzed.
Table 2 Sample watershed flows
Sub-area Flows into Reach Flows into upstream end upstream end
Area I Reach A Reach A Reach C
Area II Reach C Reach B Reach C
Area III Reach C Reach C Outlet
Area IV Reach B Reach D Outlet
Area V Reach C Reach E Outlet
Area VI Reach E
Area VII Outlet
Area VIII Outlet
Area IX Reach D
Area X Outlet
Area IV
Area IX
Area X
Area VArea I
Area III
Area VI
Area VIII
Area II
Area VII Outlet
Reach C
Reach E
Rea
ch D
Reach A Reach
BStream reach
Sub-area
Watershed area
Watershed sub-areas and reaches
Modeling watersheds properly using WinTR–55 re-quires understanding the relationship between wa-tershed sub-areas and reaches within the computer program. Figure 2 and table 2 show a typical water-shed with multiple sub-areas and reaches.
Reaches define flow paths through the watershed to its outlet. Each sub-area and reach contribute flow to the upstream end of a receiving reach or to the outlet.
4 WinTR–55 User Guide, January 2009
Small Watershed Hydrology
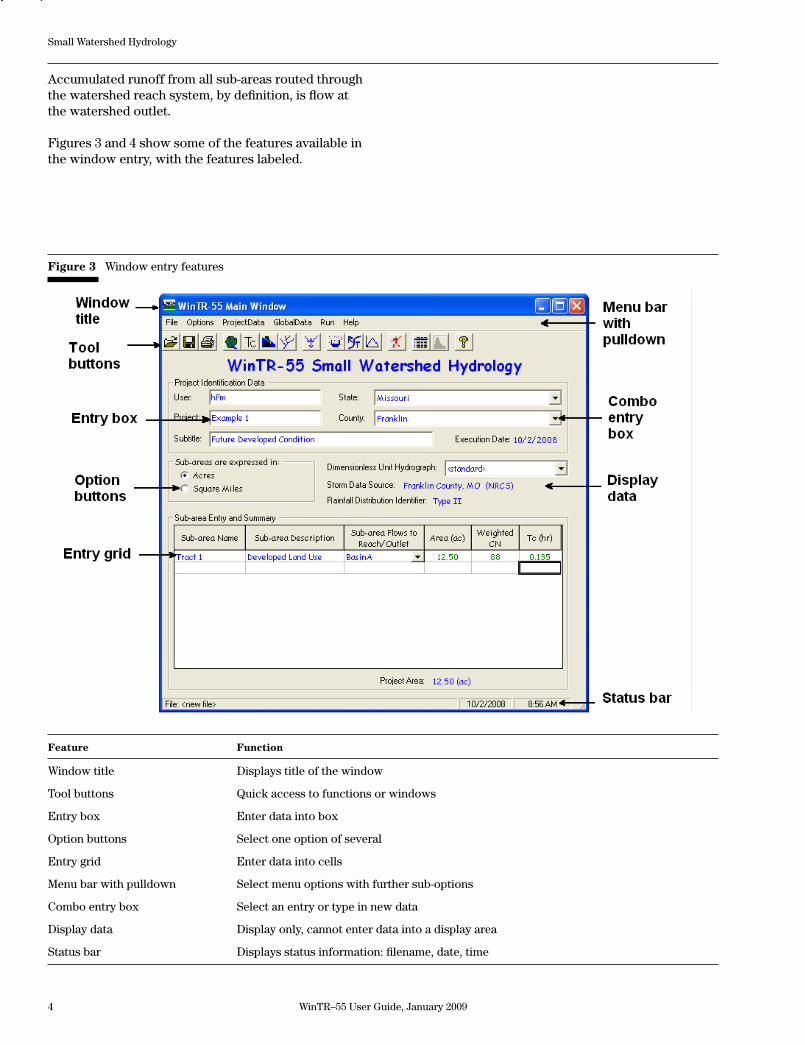
Figure 3 Window entry features
Accumulated runoff from all sub-areas routed through the watershed reach system, by definition, is flow at the watershed outlet.
Figures 3 and 4 show some of the features available in the window entry, with the features labeled.
Feature Function
Window title Displays title of the window
Tool buttons Quick access to functions or windows
Entry box Enter data into box
Option buttons Select one option of several
Entry grid Enter data into cells
Menu bar with pulldown Select menu options with further sub-options
Combo entry box Select an entry or type in new data
Display data Display only, cannot enter data into a display area
Status bar Displays status information: filename, date, time
WinTR–55 User Guide, January 2009 5
Small Watershed Hydrology
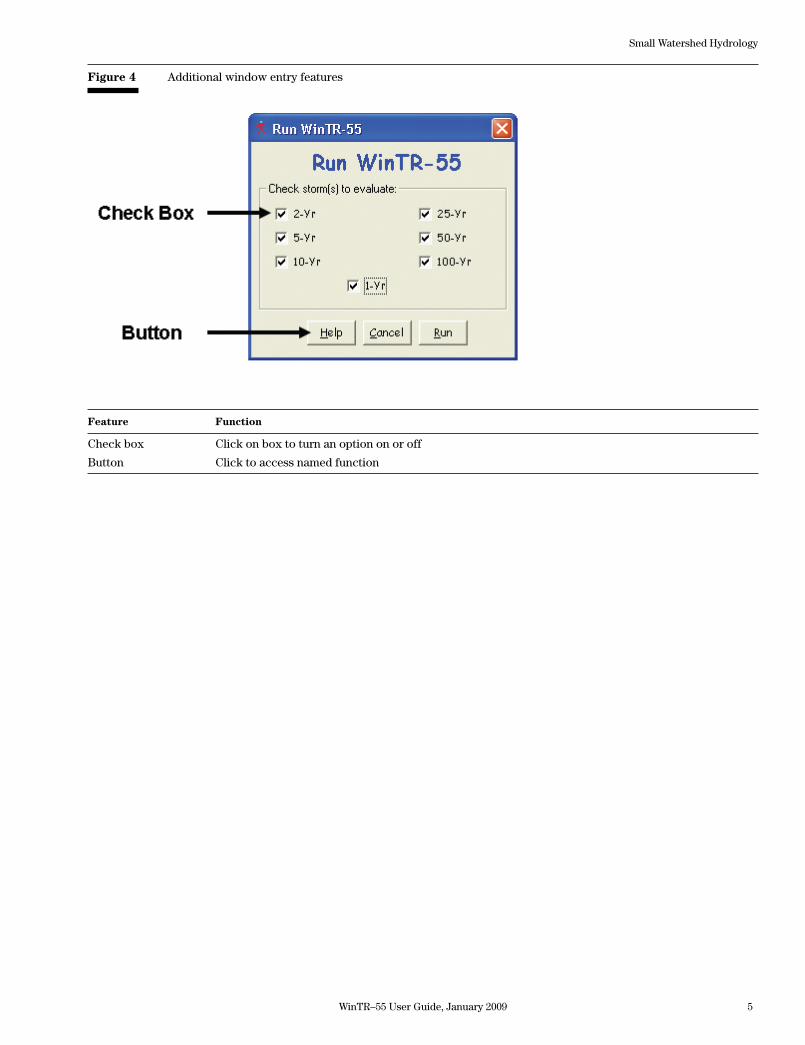
Figure 4 Additional window entry features
Feature Function
Check box Click on box to turn an option on or off
Button Click to access named function
6 WinTR–55 User Guide, January 2009
Small Watershed Hydrology
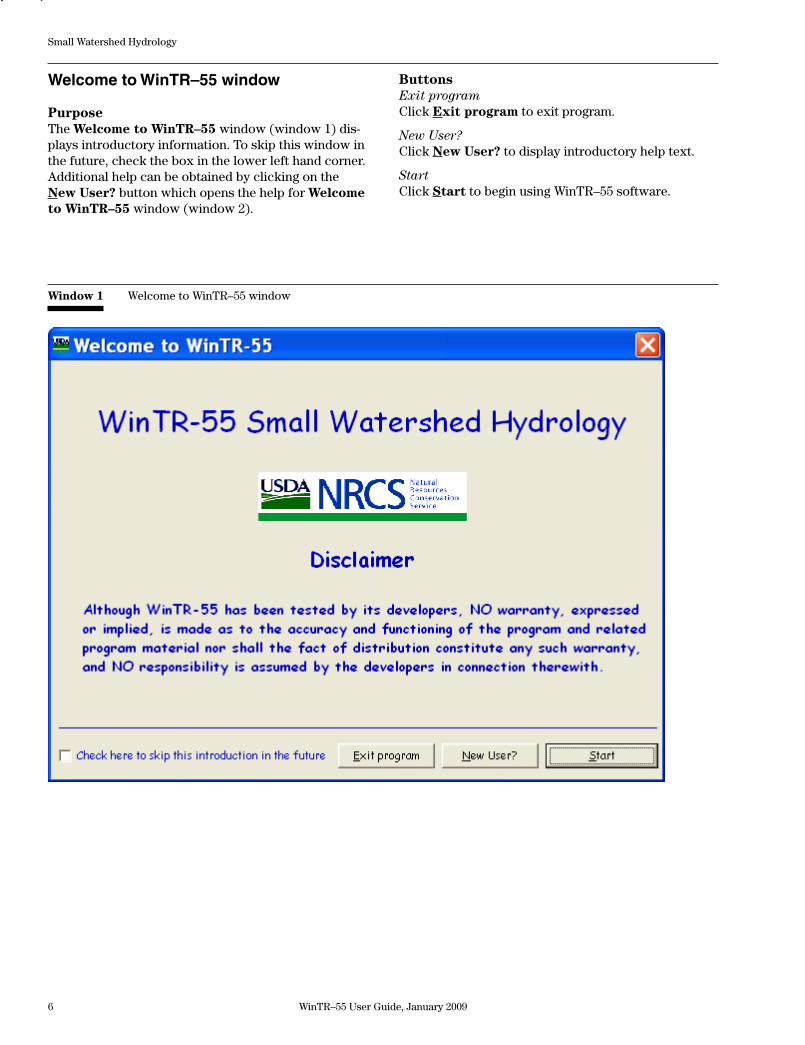
Window 1 Welcome to WinTR–55 window
Welcome to WinTR–55 window
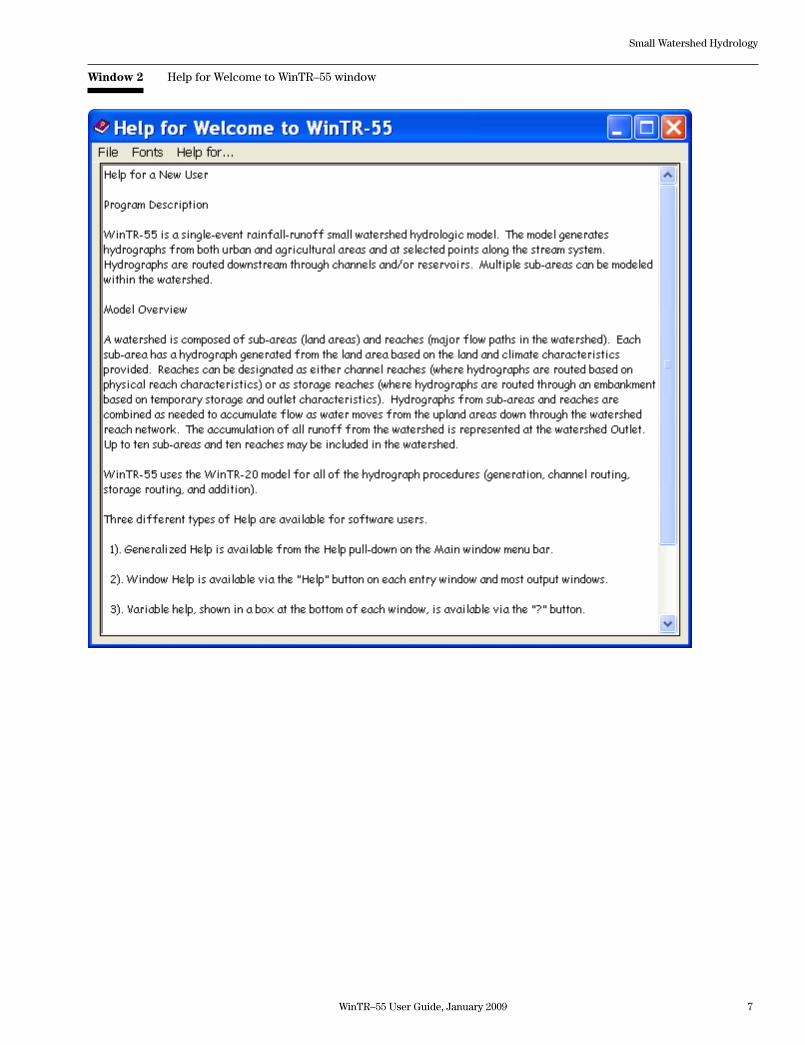
PurposeThe Welcome to WinTR–55 window (window 1) dis-plays introductory information. To skip this window in the future, check the box in the lower left hand corner. Additional help can be obtained by clicking on the New User? button which opens the help for Welcome to WinTR–55 window (window 2).
ButtonsExit programClick Exit program to exit program.
New User?Click New User? to display introductory help text.
StartClick Start to begin using WinTR–55 software.
WinTR–55 User Guide, January 2009 7
Small Watershed Hydrology
Window 2 Help for Welcome to WinTR–55 window
8 WinTR–55 User Guide, January 2009
Small Watershed Hydrology
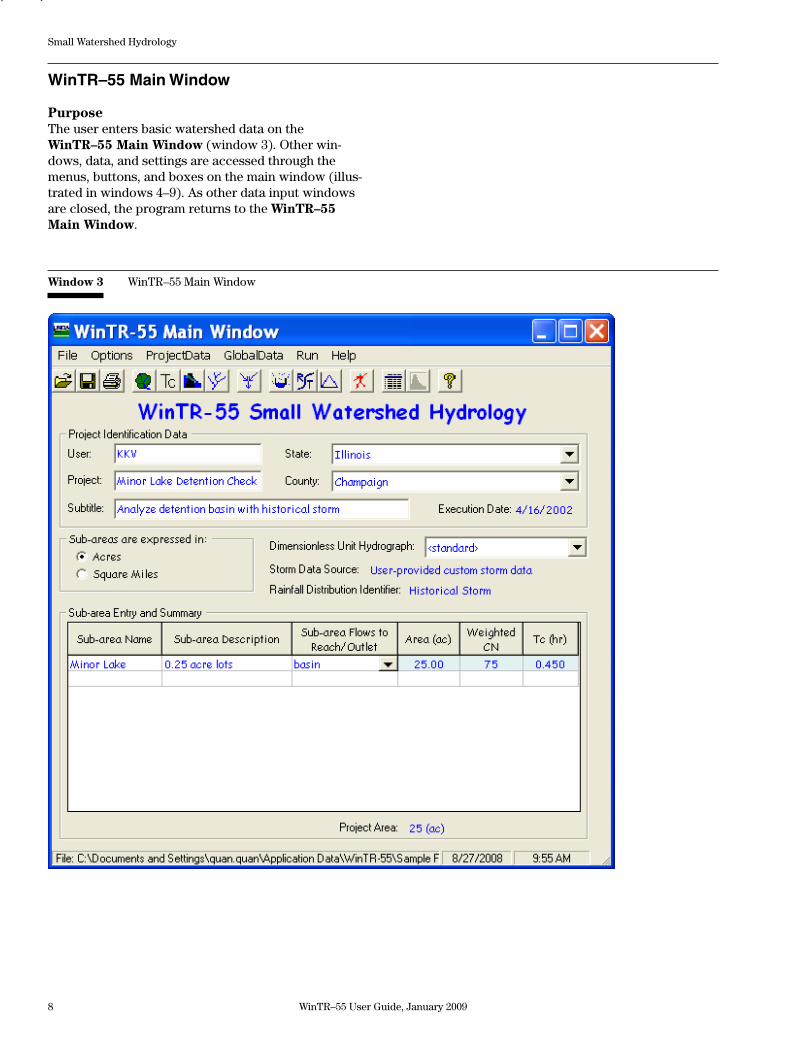
Window 3 WinTR–55 Main Window
WinTR–55 Main Window
PurposeThe user enters basic watershed data on the WinTR –55 Main Window (window 3). Other win-dows, data, and settings are accessed through the menus, buttons, and boxes on the main window (illus-trated in windows 4–9). As other data input windows are closed, the program returns to the WinTR–55 Main Window.
WinTR–55 User Guide, January 2009 9
Small Watershed Hydrology
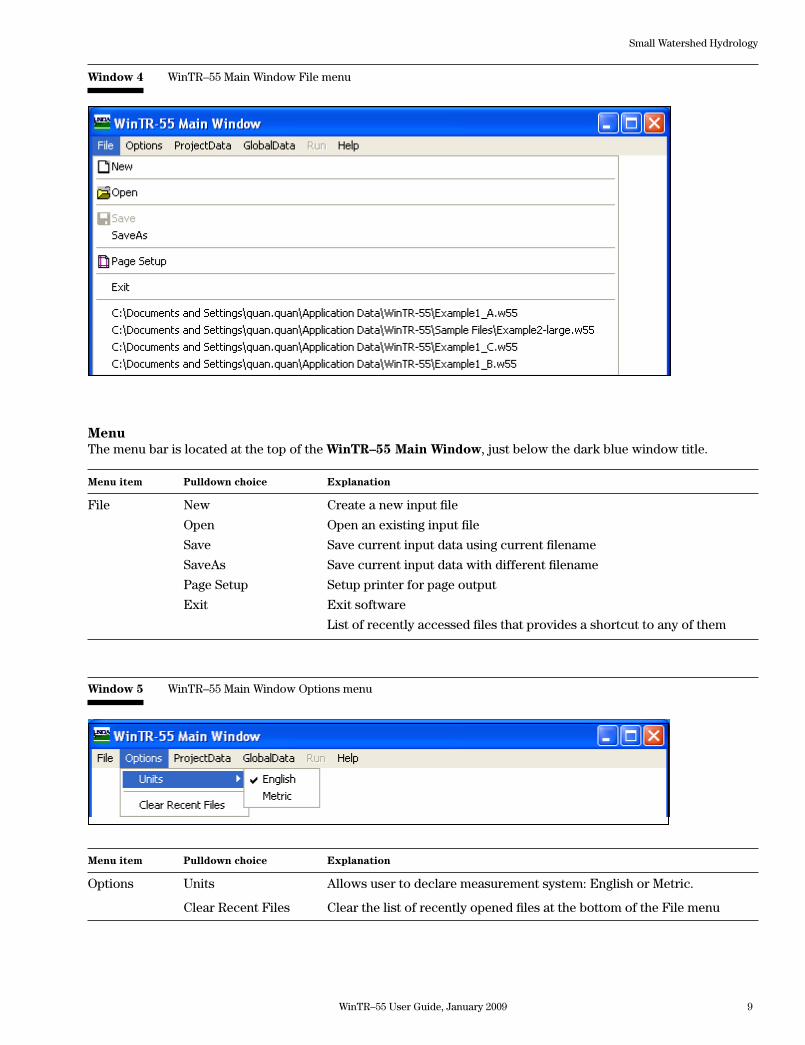
Window 4 WinTR–55 Main Window File menu
Window 5 WinTR–55 Main Window Options menu
MenuThe menu bar is located at the top of the WinTR–55 Main Window, just below the dark blue window title.
Menu item Pulldown choice Explanation
File New Create a new input file
Open Open an existing input file
Save Save current input data using current filename
SaveAs Save current input data with different filename
Page Setup Setup printer for page output
Exit Exit software
List of recently accessed files that provides a shortcut to any of them
Menu item Pulldown choice Explanation
Options Units Allows user to declare measurement system: English or Metric.
Clear Recent Files Clear the list of recently opened files at the bottom of the File menu
10 WinTR–55 User Guide, January 2009
Small Watershed Hydrology
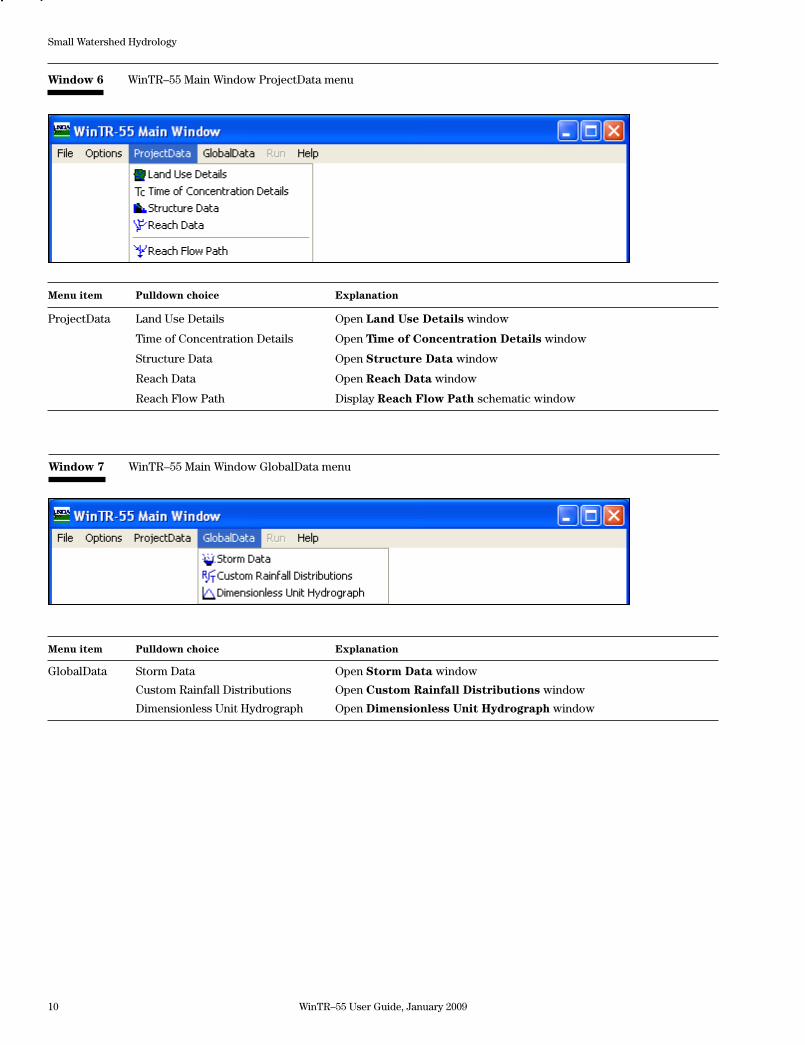
Menu item Pulldown choice Explanation
ProjectData Land Use Details Open Land Use Details window
Time of Concentration Details Open Time of Concentration Details window
Structure Data Open Structure Data window
Reach Data Open Reach Data window
Reach Flow Path Display Reach Flow Path schematic window
Window 6 WinTR–55 Main Window ProjectData menu
Window 7 WinTR–55 Main Window GlobalData menu
Menu item Pulldown choice Explanation
GlobalData Storm Data Open Storm Data window
Custom Rainfall Distributions Open Custom Rainfall Distributions window
Dimensionless Unit Hydrograph Open Dimensionless Unit Hydrograph window
WinTR–55 User Guide, January 2009 11
Small Watershed Hydrology
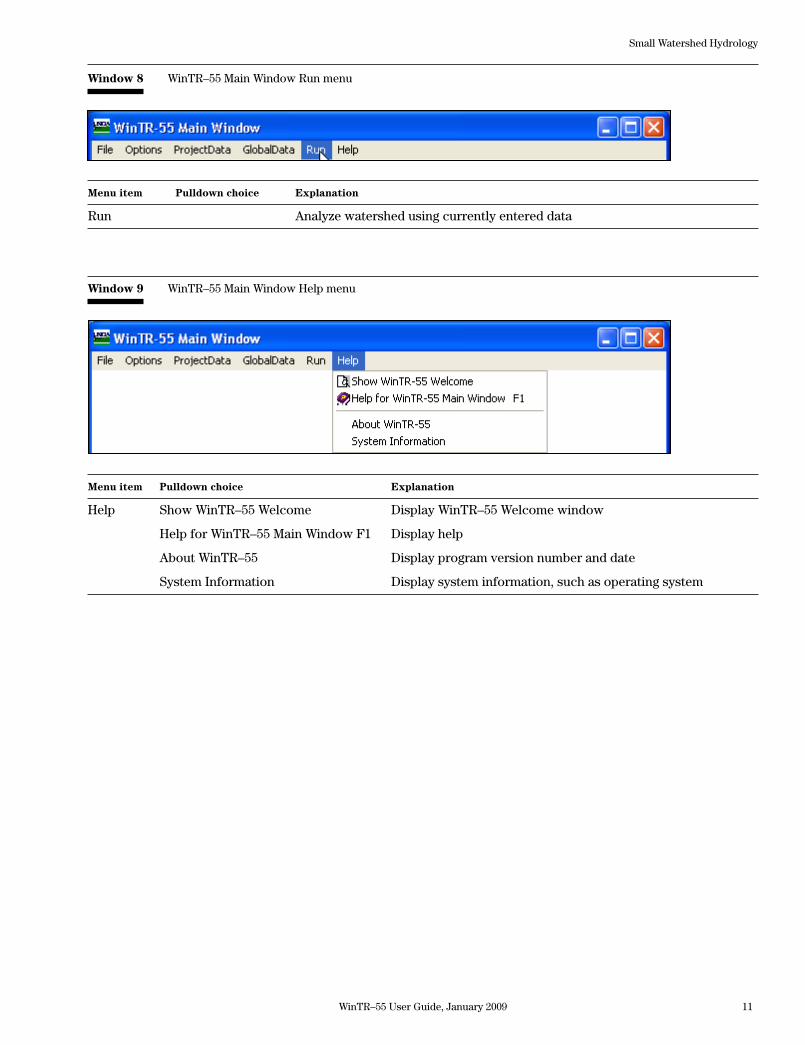
Menu item Pulldown choice Explanation
Help Show WinTR–55 Welcome Display WinTR–55 Welcome window
Help for WinTR–55 Main Window F1 Display help
About WinTR–55 Display program version number and date
System Information Display system information, such as operating system
Window 9 WinTR–55 Main Window Help menu
Window 8 WinTR–55 Main Window Run menu
Menu item Pulldown choice Explanation
Run Analyze watershed using currently entered data
12 WinTR–55 User Guide, January 2009
Small Watershed Hydrology
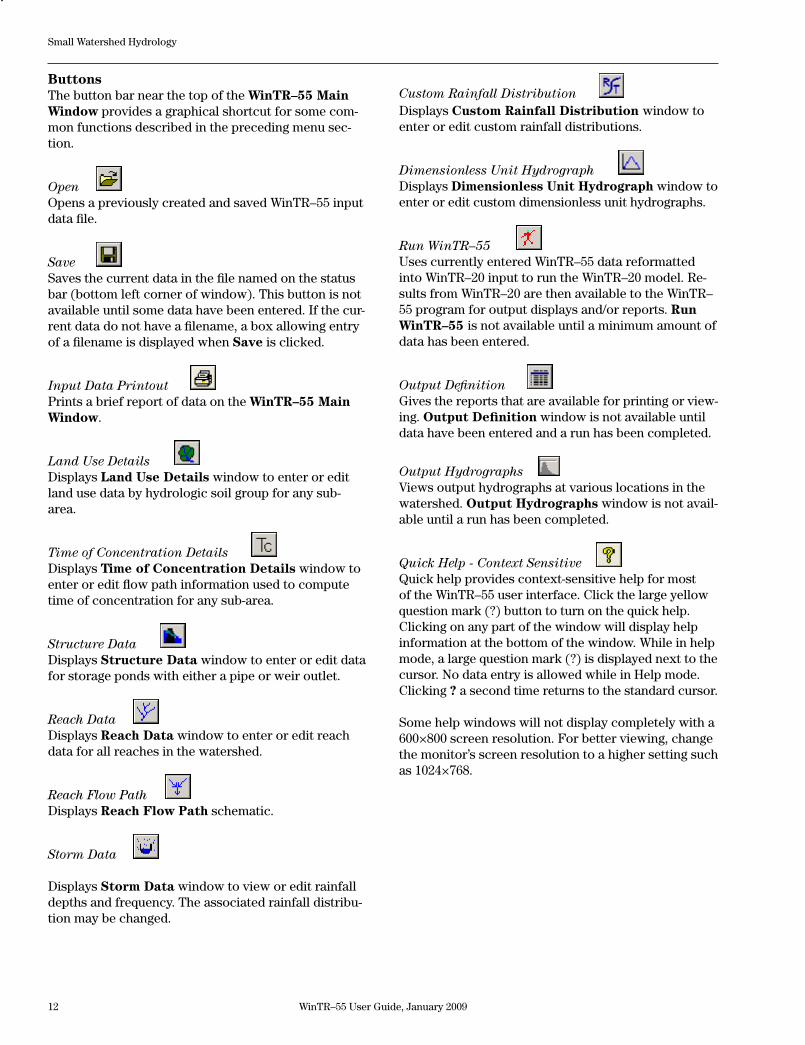
Custom Rainfall Distribution Displays Custom Rainfall Distribution window to enter or edit custom rainfall distributions.
Dimensionless Unit Hydrograph Displays Dimensionless Unit Hydrograph window to enter or edit custom dimensionless unit hydrographs.
Run WinTR–55 Uses currently entered WinTR–55 data reformatted into WinTR–20 input to run the WinTR–20 model. Re-sults from WinTR–20 are then available to the WinTR–55 program for output displays and/or reports. Run WinTR–55 is not available until a minimum amount of data has been entered.
Output Definition Gives the reports that are available for printing or view-ing. Output Definition window is not available until data have been entered and a run has been completed.
Output Hydrographs Views output hydrographs at various locations in the watershed. Output Hydrographs window is not avail-able until a run has been completed.
Quick Help - Context Sensitive Quick help provides context-sensitive help for most of the WinTR–55 user interface. Click the large yellow question mark (?) button to turn on the quick help. Clicking on any part of the window will display help information at the bottom of the window. While in help mode, a large question mark (?) is displayed next to the cursor. No data entry is allowed while in Help mode. Clicking ? a second time returns to the standard cursor.
Some help windows will not display completely with a 600×800 screen resolution. For better viewing, change the monitor’s screen resolution to a higher setting such as 1024×768.
ButtonsThe button bar near the top of the WinTR–55 Main Window provides a graphical shortcut for some com-mon functions described in the preceding menu sec-tion.
Open Opens a previously created and saved WinTR–55 input data file.
Save Saves the current data in the file named on the status bar (bottom left corner of window). This button is not available until some data have been entered. If the cur-rent data do not have a filename, a box allowing entry of a filename is displayed when Save is clicked.
Input Data Printout Prints a brief report of data on the WinTR–55 Main Window.
Land Use Details Displays Land Use Details window to enter or edit land use data by hydrologic soil group for any sub-area.
Time of Concentration Details Displays Time of Concentration Details window to enter or edit flow path information used to compute time of concentration for any sub-area.
Structure Data Displays Structure Data window to enter or edit data for storage ponds with either a pipe or weir outlet.
Reach Data Displays Reach Data window to enter or edit reach data for all reaches in the watershed.
Reach Flow Path Displays Reach Flow Path schematic.
Storm Data
Displays Storm Data window to view or edit rainfall depths and frequency. The associated rainfall distribu-tion may be changed.
WinTR–55 User Guide, January 2009 13
Small Watershed Hydrology
Project identification dataThe user enters the following information on the Project Identification Data portion of the WinTR–55 Main Window. Data to be entered are user name, project name, subtitle, and location of project by state and county. State and county names may be selected from pulldown menus. WinTR–55 can be used for loca-tions outside of the United States by entering a name for the new location that is not on the pulldown state names list. This will cause the state and county labels to change to region and locale (window 24). State and county names supplied with the program cannot be edited. User-entered names can be edited. Entering a single letter jumps to the first match in the list.
Execution dateThe execution date shown on the main window is the current date, or for a saved file, it is the date on which the file was saved.
Sub–areas are expressed inHere, the user specifies which units are used for ex-pressing drainage areas. If English units are used, the options are acres or square miles. If metric (SI) units are used, the options are hectares or square kilome-ters. The user specifies which system (English or Metric) is used to express drainage area sizes using the Options–Units menu items.
Dimensionless unit hydrographThe default dimensionless unit hydrograph is the NRCS standard dimensionless unit hydrograph with a peak rate factor of 484 (NEH630.16). A different dimensionless unit hydrograph may be specified by se-lecting from the pulldown menu or by creating a new one through the Dimensionless Unit Hydrograph window.
Storm data sourceUpon opening WinTR–55, storm data used for the pre-vious run is listed here. The storm data source listed on the WinTR–55 Main Window is not automatically changed when new state and county information are entered. It is very important that the storm data source displayed is the desired data.
WinTR–55 includes a database of 24-hour rainfall values for most of the United States. This data can be viewed or edited through the Storm Data window (window 22). Data for locations not found in the da-tabase are entered on the Storm Data window. User-entered values or modifications to the database values are indicated by a note User-provided custom storm data. Use of database values with no modifications is indicated by the appropriate state and county names being displayed as the Storm Data source.
Rainfall distribution identifierRainfall distribution is included as part of the rainfall database. However, a different rainfall distribution may be specified on the Storm Data window (window 22), or by defining a custom rainfall distribution and entering it on the Custom Rainfall Distribution window (window 26).
Sub-area entry and selectionSub-area information is entered or edited on the sub-area entry and summary table. Sub-area names are up to 10 characters long with at least one alphabetical character. A sub-area description (up to 25 characters) may also be included. The Sub-area Flows to Reach/Outlet is used to describe the upper end of the reach into which the runoff from each sub-area flows on its way to the watershed outlet. The user enters the ap-propriate reach name (up to 10 alphanumeric charac-ters) here, or selects from a pulldown menu if reaches are defined on the Reach Data window.
The reach name Outlet is reserved for the most down-stream point of the watershed being evaluated and is always the final reach for every WinTR–55 run. Sub-area drainage area (Area), weighted curve number (Weighted CN), and time of concentration (Tc) may be entered directly into this table or computed using more detailed information on the Land Use Details window and Time of Concentration Details win-dow. Data entered directly into the table will be dis-played in blue, while data computed within WinTR–55 will be displayed in green.
Double-clicking on a column entry within the Sub-area Entry and Summary table opens the appropriate data input window, Land Use Details, Time of Concen-tration Details, or Reach Data, for additional data entry or editing.
Total watershed area (Project Area) is displayed in the lower right hand corner of this table.
Status barThe path and filename of the current data are dis-played on the left side of the status bar at the bottom of the window. If no file name has been assigned to the current data, <new file> appears in this location. The remainder of the status bar contains the current date and time. The same status bar appears on all other large size data entry windows.
14 WinTR–55 User Guide, January 2009
Small Watershed Hydrology
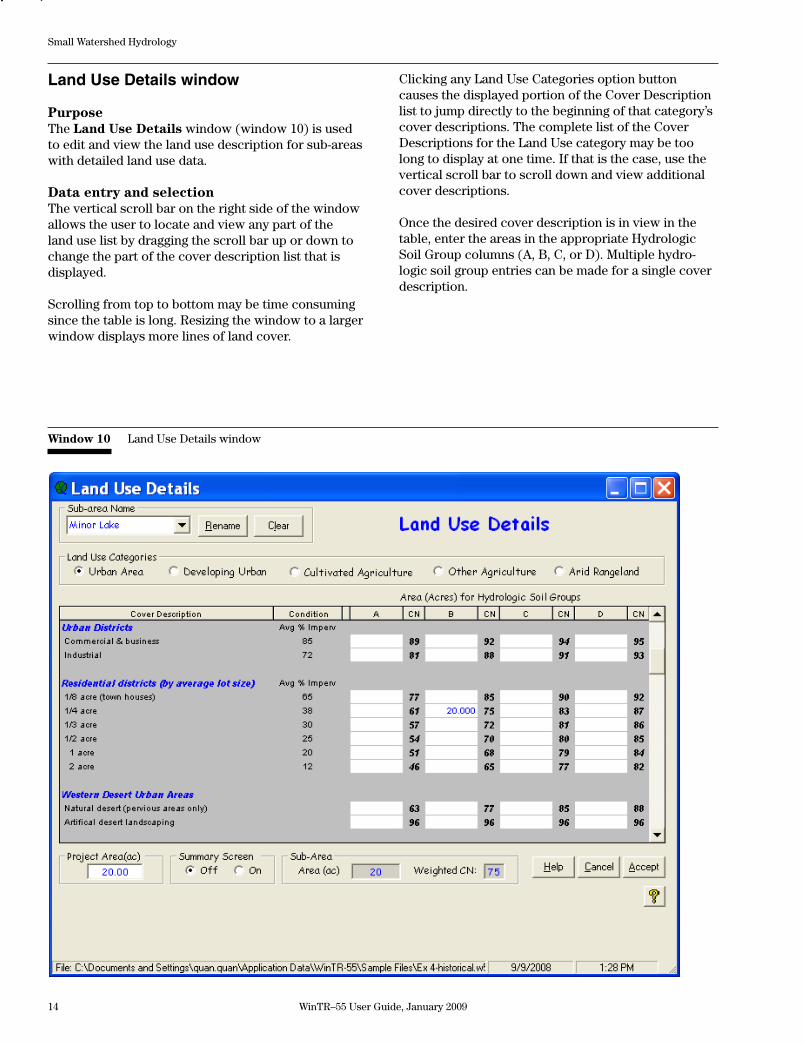
Land Use Details window
PurposeThe Land Use Details window (window 10) is used to edit and view the land use description for sub-areas with detailed land use data.
Data entry and selectionThe vertical scroll bar on the right side of the window allows the user to locate and view any part of the land use list by dragging the scroll bar up or down to change the part of the cover description list that is displayed.
Scrolling from top to bottom may be time consuming since the table is long. Resizing the window to a larger window displays more lines of land cover.
Clicking any Land Use Categories option button causes the displayed portion of the Cover Description list to jump directly to the beginning of that category’s cover descriptions. The complete list of the Cover Descriptions for the Land Use category may be too long to display at one time. If that is the case, use the vertical scroll bar to scroll down and view additional cover descriptions.
Once the desired cover description is in view in the table, enter the areas in the appropriate Hydrologic Soil Group columns (A, B, C, or D). Multiple hydro-logic soil group entries can be made for a single cover description.
Window 10 Land Use Details window
WinTR–55 User Guide, January 2009 15
Small Watershed Hydrology
Click on the Sub-area Name combo box in the upper left corner to select a previously named sub-area and display its data. To enter a new sub-area, click in the combo box and type in a new name.
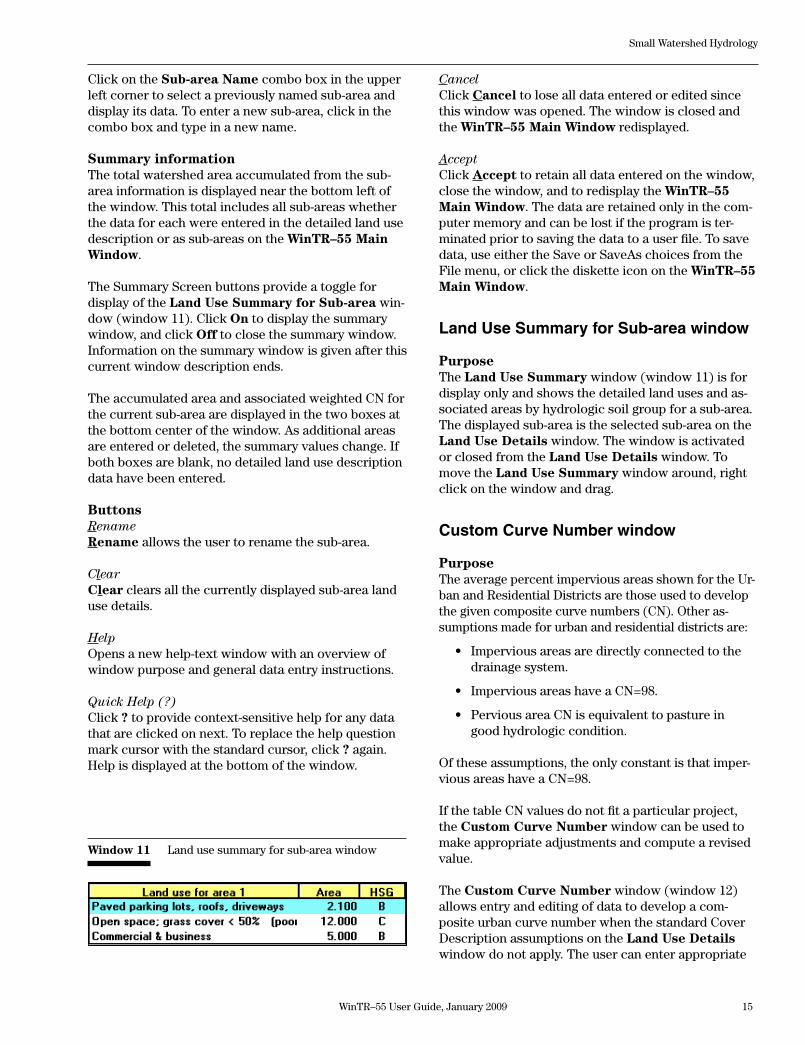
Summary informationThe total watershed area accumulated from the sub-area information is displayed near the bottom left of the window. This total includes all sub-areas whether the data for each were entered in the detailed land use description or as sub-areas on the WinTR–55 Main Window.
The Summary Screen buttons provide a toggle for display of the Land Use Summary for Sub-area win-dow (window 11). Click On to display the summary window, and click Off to close the summary window. Information on the summary window is given after this current window description ends.
The accumulated area and associated weighted CN for the current sub-area are displayed in the two boxes at the bottom center of the window. As additional areas are entered or deleted, the summary values change. If both boxes are blank, no detailed land use description data have been entered.
ButtonsRenameRename allows the user to rename the sub-area.
ClearClear clears all the currently displayed sub-area land use details.
Help Opens a new help-text window with an overview of window purpose and general data entry instructions.
Quick Help (?)Click ? to provide context-sensitive help for any data that are clicked on next. To replace the help question mark cursor with the standard cursor, click ? again. Help is displayed at the bottom of the window.
CancelClick Cancel to lose all data entered or edited since this window was opened. The window is closed and the WinTR–55 Main Window redisplayed.
AcceptClick Accept to retain all data entered on the window, close the window, and to redisplay the WinTR–55 Main Window. The data are retained only in the com-puter memory and can be lost if the program is ter-minated prior to saving the data to a user file. To save data, use either the Save or SaveAs choices from the File menu, or click the diskette icon on the WinTR–55 Main Window.
Land Use Summary for Sub-area window
PurposeThe Land Use Summary window (window 11) is for display only and shows the detailed land uses and as-sociated areas by hydrologic soil group for a sub-area. The displayed sub-area is the selected sub-area on the Land Use Details window. The window is activated or closed from the Land Use Details window. To move the Land Use Summary window around, right click on the window and drag.
Custom Curve Number window
PurposeThe average percent impervious areas shown for the Ur-ban and Residential Districts are those used to develop the given composite curve numbers (CN). Other as-sumptions made for urban and residential districts are:
• Imperviousareasaredirectlyconnectedtothedrainage system.
• ImperviousareashaveaCN=98.
• PerviousareaCNisequivalenttopastureingood hydrologic condition.
Of these assumptions, the only constant is that imper-viousareashaveaCN=98.
If the table CN values do not fit a particular project, the Custom Curve Number window can be used to make appropriate adjustments and compute a revised value.
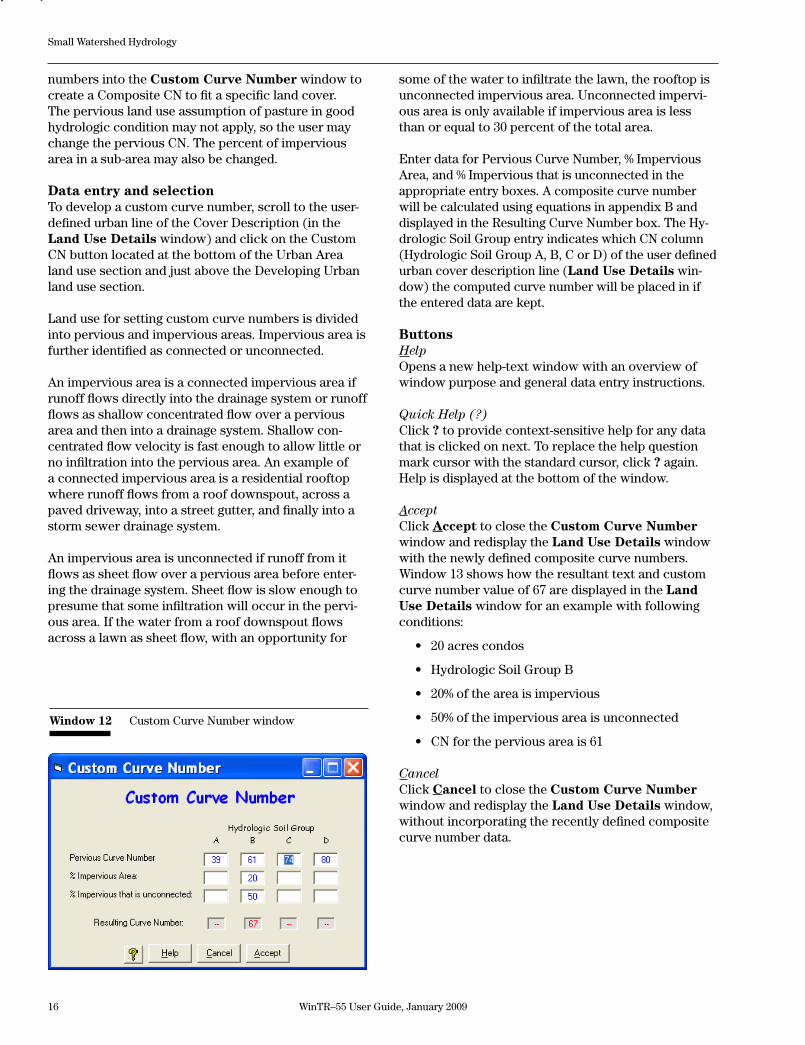
The Custom Curve Number window (window 12) allows entry and editing of data to develop a com-posite urban curve number when the standard Cover Description assumptions on the Land Use Details window do not apply. The user can enter appropriate
Window 11 Land use summary for sub-area window
16 WinTR–55 User Guide, January 2009
Small Watershed Hydrology
numbers into the Custom Curve Number window to create a Composite CN to fit a specific land cover. The pervious land use assumption of pasture in good hydrologic condition may not apply, so the user may change the pervious CN. The percent of impervious area in a sub-area may also be changed.
Data entry and selectionTo develop a custom curve number, scroll to the user-defined urban line of the Cover Description (in the Land Use Details window) and click on the Custom CN button located at the bottom of the Urban Area land use section and just above the Developing Urban land use section.
Land use for setting custom curve numbers is divided into pervious and impervious areas. Impervious area is further identified as connected or unconnected.
An impervious area is a connected impervious area if runoff flows directly into the drainage system or runoff flows as shallow concentrated flow over a pervious area and then into a drainage system. Shallow con-centrated flow velocity is fast enough to allow little or no infiltration into the pervious area. An example of a connected impervious area is a residential rooftop where runoff flows from a roof downspout, across a paved driveway, into a street gutter, and finally into a storm sewer drainage system.
An impervious area is unconnected if runoff from it flows as sheet flow over a pervious area before enter-ing the drainage system. Sheet flow is slow enough to presume that some infiltration will occur in the pervi-ous area. If the water from a roof downspout flows across a lawn as sheet flow, with an opportunity for
some of the water to infiltrate the lawn, the rooftop is unconnected impervious area. Unconnected impervi-ous area is only available if impervious area is less than or equal to 30 percent of the total area.
Enter data for Pervious Curve Number, % Impervious Area, and % Impervious that is unconnected in the appropriate entry boxes. A composite curve number will be calculated using equations in appendix B and displayed in the Resulting Curve Number box. The Hy-drologic Soil Group entry indicates which CN column (Hydrologic Soil Group A, B, C or D) of the user defined urban cover description line (Land Use Details win-dow) the computed curve number will be placed in if the entered data are kept.
ButtonsHelp Opens a new help-text window with an overview of window purpose and general data entry instructions.
Quick Help (?)Click ? to provide context-sensitive help for any data that is clicked on next. To replace the help question mark cursor with the standard cursor, click ? again. Help is displayed at the bottom of the window.
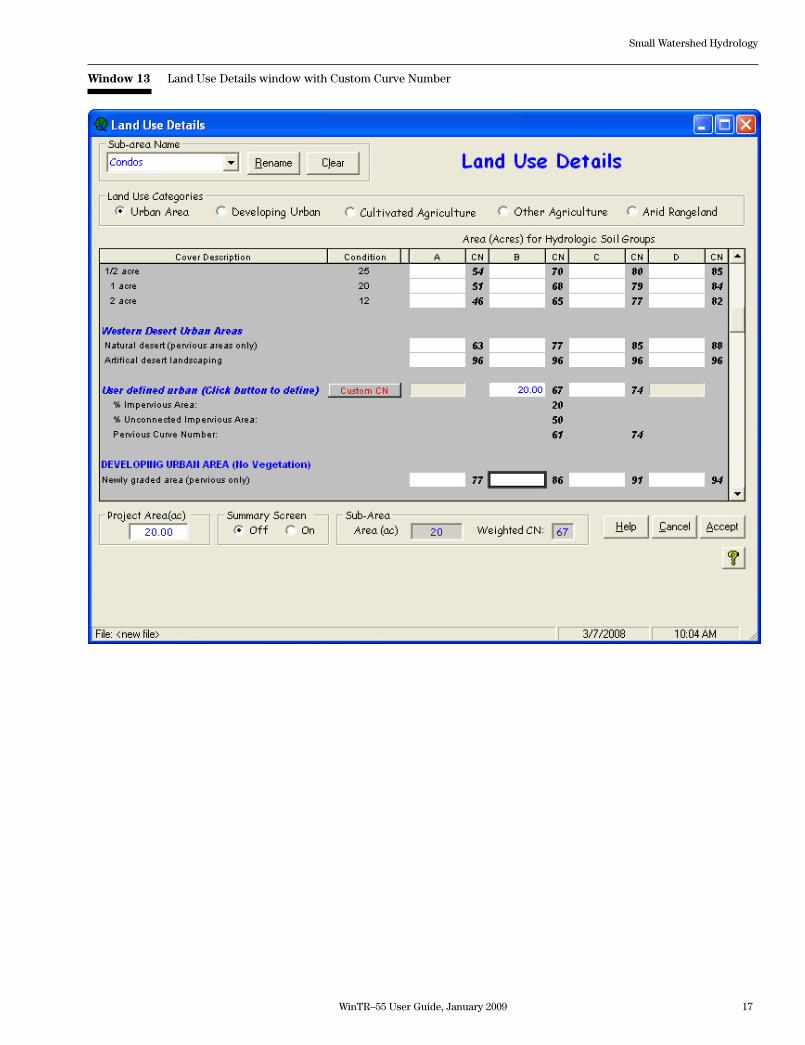
AcceptClick Accept to close the Custom Curve Number window and redisplay the Land Use Details window with the newly defined composite curve numbers. Window 13 shows how the resultant text and custom curve number value of 67 are displayed in the Land Use Details window for an example with following conditions:
• 20acrescondos
• HydrologicSoilGroupB
• 20%oftheareaisimpervious
• 50%oftheimperviousareaisunconnected
• CNfortheperviousareais61
CancelClick Cancel to close the Custom Curve Number window and redisplay the Land Use Details window, without incorporating the recently defined composite curve number data.
Window 12 Custom Curve Number window
WinTR–55 User Guide, January 2009 17
Small Watershed Hydrology
Window 13 Land Use Details window with Custom Curve Number
18 WinTR–55 User Guide, January 2009
Small Watershed Hydrology
Window 14 Time of Concentration Details window
Time of Concentration Details window
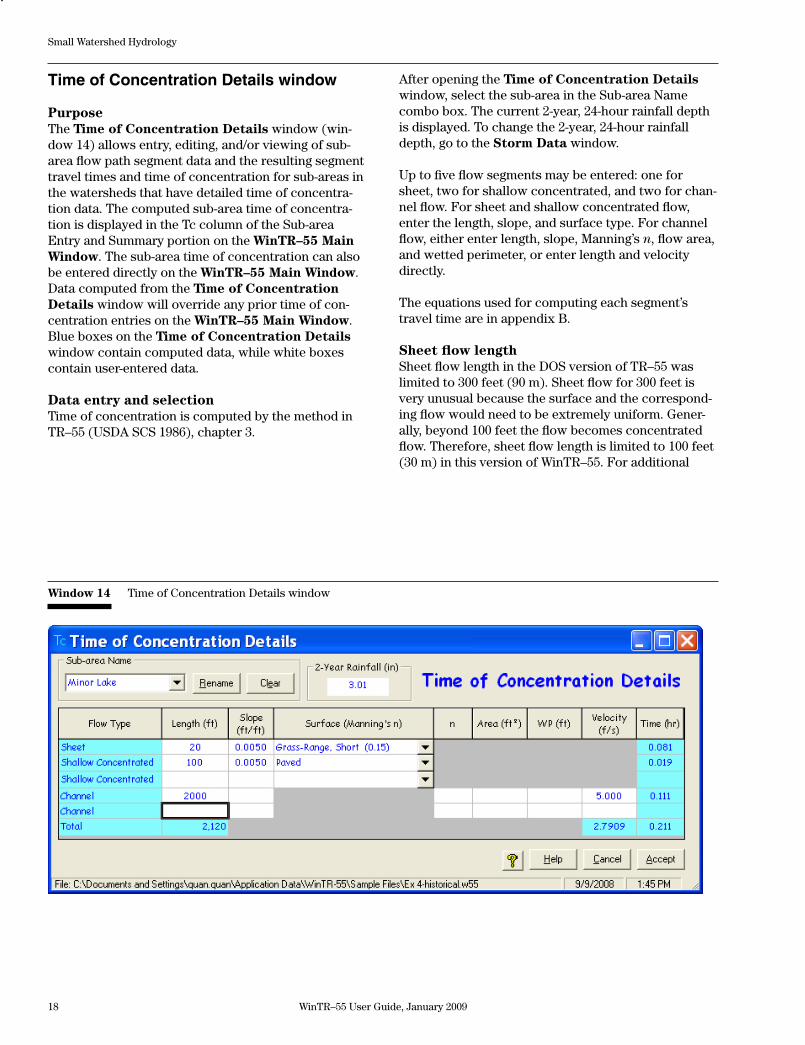
PurposeThe Time of Concentration Details window (win-dow 14) allows entry, editing, and/or viewing of sub-area flow path segment data and the resulting segment travel times and time of concentration for sub-areas in the watersheds that have detailed time of concentra-tion data. The computed sub-area time of concentra-tion is displayed in the Tc column of the Sub-area Entry and Summary portion on the WinTR–55 Main Window. The sub-area time of concentration can also be entered directly on the WinTR–55 Main Window. Data computed from the Time of Concentration Details window will override any prior time of con-centration entries on the WinTR–55 Main Window. Blue boxes on the Time of Concentration Details window contain computed data, while white boxes contain user-entered data.
Data entry and selectionTime of concentration is computed by the method in TR–55 (USDA SCS 1986), chapter 3.
After opening the Time of Concentration Details window, select the sub-area in the Sub-area Name combo box. The current 2-year, 24-hour rainfall depth is displayed. To change the 2-year, 24-hour rainfall depth, go to the Storm Data window.
Up to five flow segments may be entered: one for sheet, two for shallow concentrated, and two for chan-nel flow. For sheet and shallow concentrated flow, enter the length, slope, and surface type. For channel flow, either enter length, slope, Manning’s n, flow area, and wetted perimeter, or enter length and velocity directly.
The equations used for computing each segment’s travel time are in appendix B.
Sheet flow lengthSheet flow length in the DOS version of TR–55 was limited to 300 feet (90 m). Sheet flow for 300 feet is very unusual because the surface and the correspond-ing flow would need to be extremely uniform. Gener-ally, beyond 100 feet the flow becomes concentrated flow. Therefore, sheet flow length is limited to 100 feet (30 m) in this version of WinTR–55. For additional
WinTR–55 User Guide, January 2009 19
Small Watershed Hydrology
information, see Sheet Flow references (References on time of concentration with respect to sheet flow length, Merkel 2001) at http://www.wsi.nrcs.usda.gov/products/W2Q/H&H/Tools_Models/WinTR55.html.
ButtonsRenameRename allows the user to rename the sub-area.
ClearClear clears all the currently displayed time of con-centration details.
HelpOpens a new help-text window with an overview of window purpose and general data entry instructions.
Quick Help (?)Click ? to provide context-sensitive help for any data that is clicked on next. To replace the help question mark cursor with the standard cursor, click ? again. Help is displayed at the bottom of the window.
CancelClick Cancel to lose all data entry or revisions since this window was opened and redisplay the WinTR–55 Main Window.
AcceptClick Accept to retain all data entered or edited on the window, close the window, and redisplay the WinTR–55 Main Window. To save the data file, go to the WinTR–55 Main Window, and click the diskette icon or Save or SaveAs on the File menu.
20 WinTR–55 User Guide, January 2009
Small Watershed Hydrology
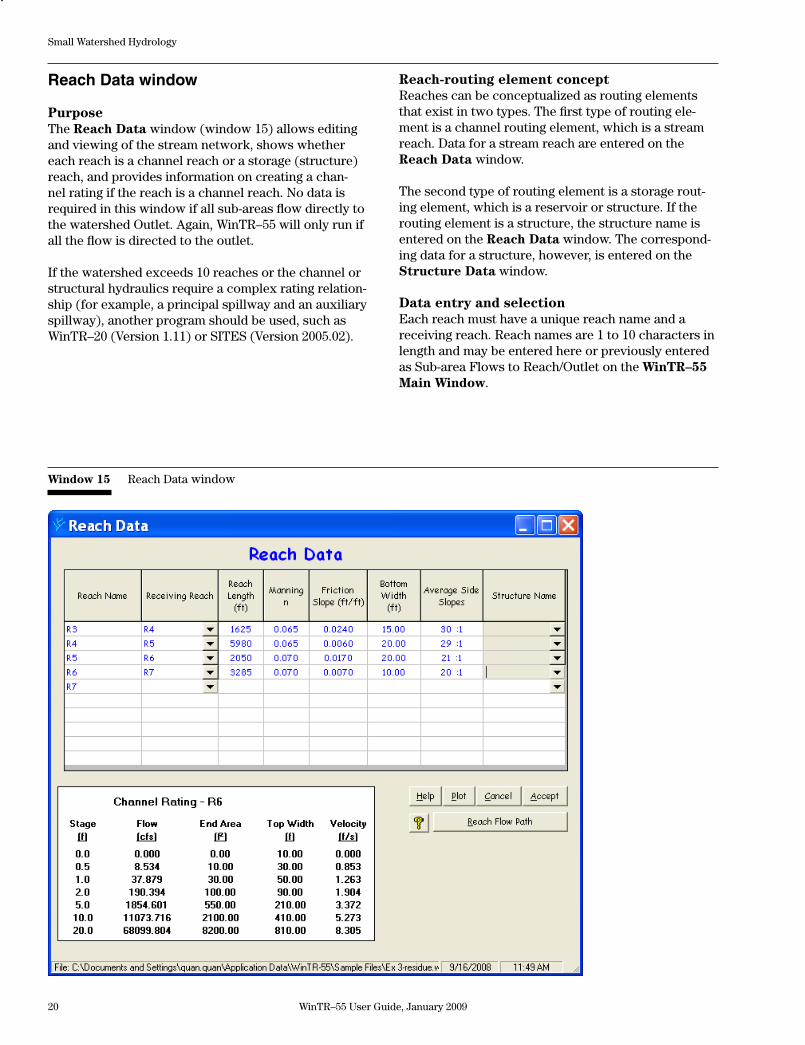
Reach-routing element conceptReaches can be conceptualized as routing elements that exist in two types. The first type of routing ele-ment is a channel routing element, which is a stream reach. Data for a stream reach are entered on the Reach Data window.
The second type of routing element is a storage rout-ing element, which is a reservoir or structure. If the routing element is a structure, the structure name is entered on the Reach Data window. The correspond-ing data for a structure, however, is entered on the Structure Data window.
Data entry and selectionEach reach must have a unique reach name and a receiving reach. Reach names are 1 to 10 characters in length and may be entered here or previously entered as Sub-area Flows to Reach/Outlet on the WinTR–55 Main Window.
Window 15 Reach Data window
Reach Data window
PurposeThe Reach Data window (window 15) allows editing and viewing of the stream network, shows whether each reach is a channel reach or a storage (structure) reach, and provides information on creating a chan-nel rating if the reach is a channel reach. No data is required in this window if all sub-areas flow directly to the watershed Outlet. Again, WinTR–55 will only run if all the flow is directed to the outlet.
If the watershed exceeds 10 reaches or the channel or structural hydraulics require a complex rating relation-ship (for example, a principal spillway and an auxiliary spillway), another program should be used, such as WinTR–20 (Version 1.11) or SITES (Version 2005.02).
WinTR–55 User Guide, January 2009 21
Small Watershed Hydrology
A downstream receiving reach is required for each reach. A pulldown choice list provides previously en-tered reach names to chose from along with the water-shed outlet. If a new name is entered into the receiving reach box, it will also be added to the reach name list as long as the current number of reaches is less than 10. If the current number of reaches is 10, then no new names are accepted in the receiving reach box.
When data are entered on the reach line for one type of routing, the box(es) for the other routing type will be grayed out. Data may still be entered in a gray box but will cause previously entered data on the line of the other routing type to be lost. Data for only one type of routing per line is retained.
To channel route, enter data for reach length, Man-ning’s n, friction slope, bottom width, and side slope. The reach length will be either the stream channel length or the flood plain length for the reach. Which length is used depends on whether expected flows are within bank or out of bank. The other parameters de-fine a representative cross section for the reach. Based on the channel cross section information entered, a channel rating relationship for the reach is computed and displayed below the grid. The equations used in development of the channel rating are in appendix B.
To storage route, enter a structure name, or select from the choice list (if the structure has been previ-ously described). To edit or view structure data, dou-ble click the Structure Name to display the Struc-ture Data window.
Selecting a representative cross section A WinTR–55 reach cross section is either a rectan-gular, triangular, or trapezoidal channel. The rating is based on the channel bottom width, side slope, Manning’s n, and friction slope data. The cross section rating includes Manning’s equation discharges for fixed depths at the cross section (0.5, 1.0, 2.0, 5.0, 10.0, and 20.0 feet).
The Muskingum-Cunge flood routing method estimates how the hydrograph changes as it flows through the reach utilizing this rating information (Chow, Maid-ment, and Mays 1988; Maidment 1993; or Ponce 1989). Typically, reach storage reduces and delays the peak discharge. In addition, the hydrograph peak becomes more rounded.
During a WinTR–55 run, all selected storms use one cross section rating for a reach. For this reason, se-lecting a representative cross section for the reach is extremely important. Generally, the channel has a
capacity of a 5-year discharge or less (if the channel has a large capacity, the following information may not apply). If the peak discharge stays in the channel banks and the channel dimensions and roughness are entered, then the routing is reasonable. If the peak discharge flow overtops the channel banks, the reach routing is still based on the channel shape extend-ing the side slopes up to 20 feet, which will not give a good representative stage-discharge relationship.
Using channel cross-sectional data to represent the flood plain cross section will generally raise the peak discharge at the downstream end of the reach and translate it downstream sooner than if the flood plain and its storage are considered. The impact varies with the flood plain width and its associated roughness.
The user must judge what is a reasonable approxima-tion of the shape of the cross section above the chan-nel banks. For example, the 2-year channel could be a 10-foot bottom width stream with 2:1 side slopes and 0.04 Manning’s n. However, the 100-year flow area might be represented by a 100-foot bottom width flood plain with 10:1 side slopes and 0.07 Manning’s n. However, WinTR–55 only accepts one set of data to represent the channel reach for all storms.
If the channel-only (no flood plain) approximation is unreasonable, one alternative is to enter a reach cross section representative of the flood plain (width, side slope, and Manning’s n). This alternative neglects the effect of the channel on the total cross section rating.
A second alternative is to use a hydraulic model, such as U.S. Army Corps of Engineers HEC–RAS, to de-velop the total cross section rating to include both the channel and flood plain. Then use the NRCS WinTR–20 hydrologic model to develop and route the storm hydrographs.
ButtonsHelp Opens a new help-text window with an overview of window purpose and general data entry instructions. Close the help-text window to return to data entry.
Quick Help (?)Click ? to provide context-sensitive help for any data that is clicked on next. To replace the help question mark cursor with the standard cursor, click ? again. Help is displayed at the bottom of the window.
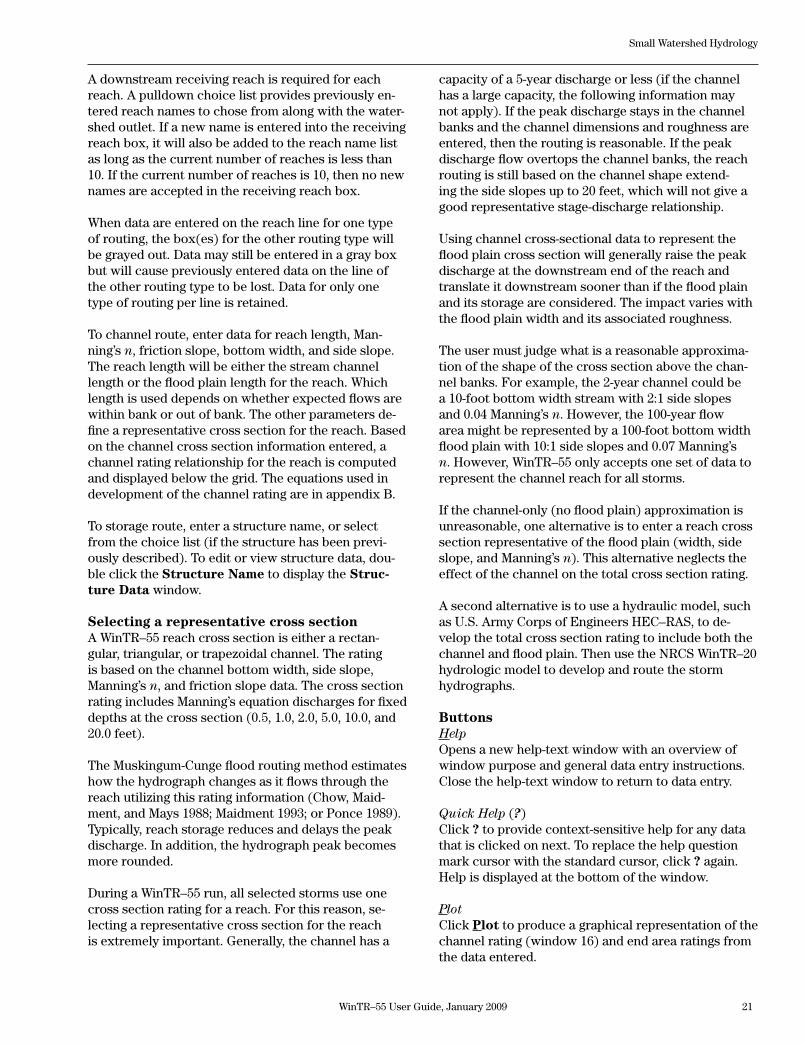
PlotClick Plot to produce a graphical representation of the channel rating (window 16) and end area ratings from the data entered.
22 WinTR–55 User Guide, January 2009
Small Watershed Hydrology
Cancel Click Cancel to lose all data entry or revisions since this window was opened and redisplay the WinTR–55 Main Window.
AcceptThis button saves all data, closes the window, and returns to the WinTR–55 Main Window. To save the data file, go to the WinTR–55 Main Window, and click on the Save icon, or select File Save or SaveAs from the menu.
Reach Flow PathClick Reach Flow Path to display the Reach Flow Path window (window 17).
Window 16 Channel Rating plot
WinTR–55 User Guide, January 2009 23
Small Watershed Hydrology
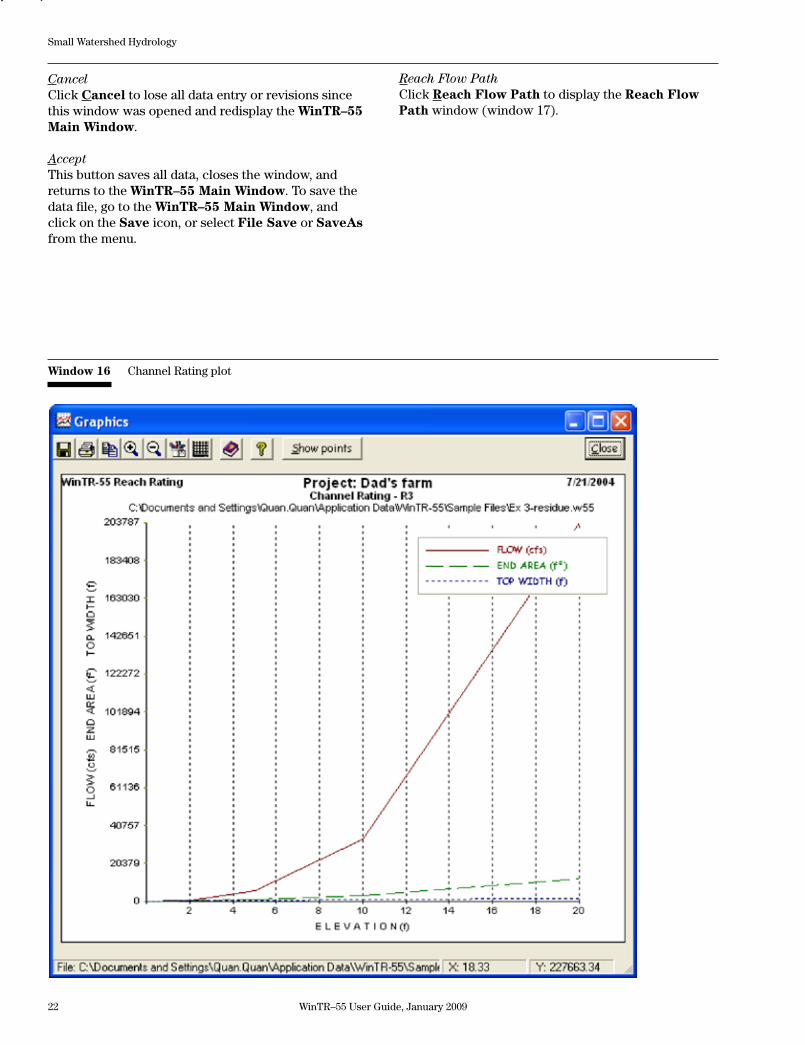
Reach Flow Path window
PurposeThe Reach Flow Path window (window 17) displays a reach schematic of the currently entered reach, sub-area, and structure information. If the user clicks on Outlet in the Reach Flow Path Diagram, the total drainage area of the project appears below the Blue - Reaches label in the window.
ButtonsDetailThis button toggles between displaying detailed infor-mation with labels as shown in window 17 or display-ing labels only in the schematic.
Window 17 Reach Flow Path window
Help Opens a new help-text window with an overview of window purpose and general data entry instructions. Close the help-text window to return to data entry.
Quick Help (?)Click ? to provide context-sensitive help for any data that is clicked on next. To replace the help question mark cursor with the standard cursor, click ? again. Help is displayed at the bottom of the window.
CloseThis button closes the Reach Flow Path window and returns to the previously displayed window.
24 WinTR–55 User Guide, January 2009
Small Watershed Hydrology
Window 18 Structure Data (pipe outlet) window
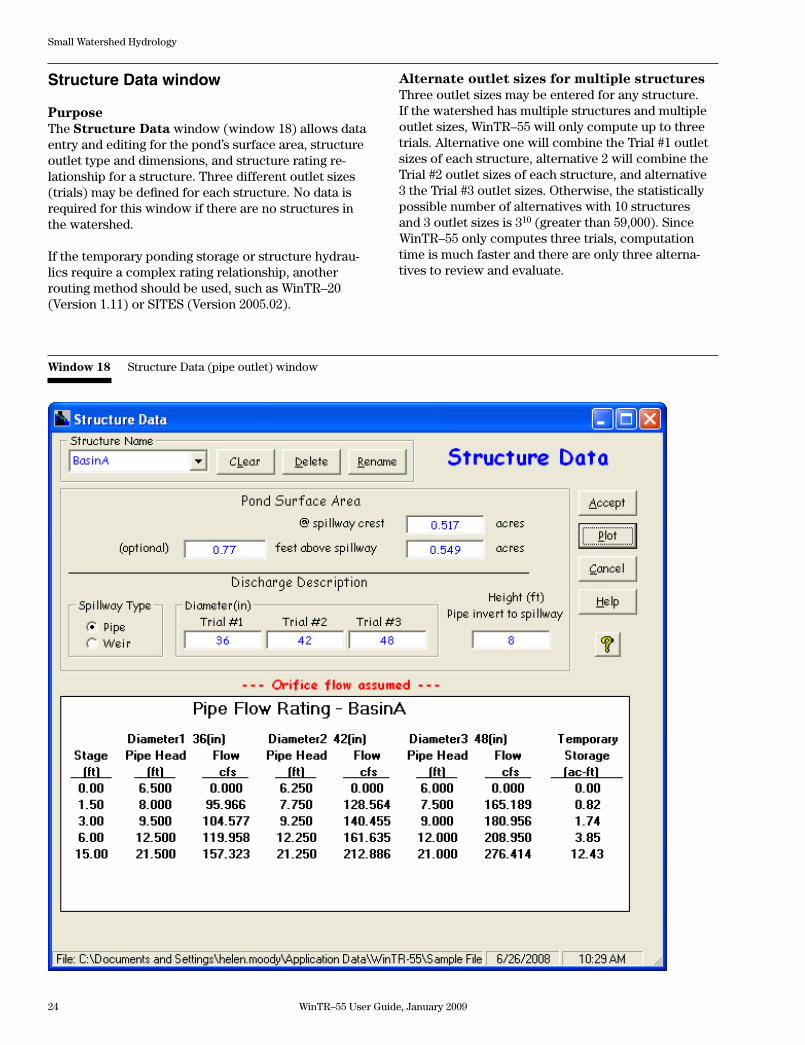
Structure Data window
PurposeThe Structure Data window (window 18) allows data entry and editing for the pond’s surface area, structure outlet type and dimensions, and structure rating re-lationship for a structure. Three different outlet sizes (trials) may be defined for each structure. No data is required for this window if there are no structures in the watershed.
If the temporary ponding storage or structure hydrau-lics require a complex rating relationship, another routing method should be used, such as WinTR–20 (Version 1.11) or SITES (Version 2005.02).
Alternate outlet sizes for multiple structuresThree outlet sizes may be entered for any structure. If the watershed has multiple structures and multiple outlet sizes, WinTR–55 will only compute up to three trials. Alternative one will combine the Trial #1 outlet sizes of each structure, alternative 2 will combine the Trial #2 outlet sizes of each structure, and alternative 3 the Trial #3 outlet sizes. Otherwise, the statistically possible number of alternatives with 10 structures and 3 outlet sizes is 310 (greater than 59,000). Since WinTR–55 only computes three trials, computation time is much faster and there are only three alterna-tives to review and evaluate.
WinTR–55 User Guide, January 2009 25
Small Watershed Hydrology
Data entry and selectionEnter the structure name (1 to 10 characters) or select from the choice list in the combo box. If data have been previously entered for the structure name, it will be displayed in the combo boxes in the window. If no data have been previously entered, all other entries will be blank. The first eight characters in structure names must be unique in each file. For example, Struc-ture1 and Structure2 are invalid names because the first eight characters of the name are not unique. How-ever, Struct1 and Struct2 are valid structure names.
Enter the pond surface area at the spillway crest eleva-tion and, optionally, a height above the spillway crest and the pond surface area at that height. The pond area and height data are used to calculate temporary storage volumes for the ponded area. If surface area at the spillway crest elevation is entered without an optional second surface area, the pond is assumed to have vertical sides, and volume is based upon a con-stant surface area. If a second area at some elevation above the principal spillway crest elevation is given, it is assumed the pond cross section is trapezoidal and incremental storage volume is computed based upon a variable surface area.
Select the Spillway Type (Pipe or Weir). The default is pipe.
Pipe outletIf pipe is selected, one to three pipe diameters may be specified along with the height from the outlet invert to the spillway inlet crest for each diameter. WinTR–55 will compute pipe head from the entered data. The minimum pipe diameter is 6 inches (152.4 mm). To satisfy the short-tube flow assumptions as described in the next section, the minimum height (outlet to spill-way) should be at least twice the largest pipe diameter being evaluated. The discharge equations used in the structure rating are in appendix B. Once the first pipe diameter and height are entered, a pipe rating table is generated using the pipe discharge equations in appen-dix B and displayed below the Outlet Description on the Structure Data window. The table is updated as additional information is entered or is revised.
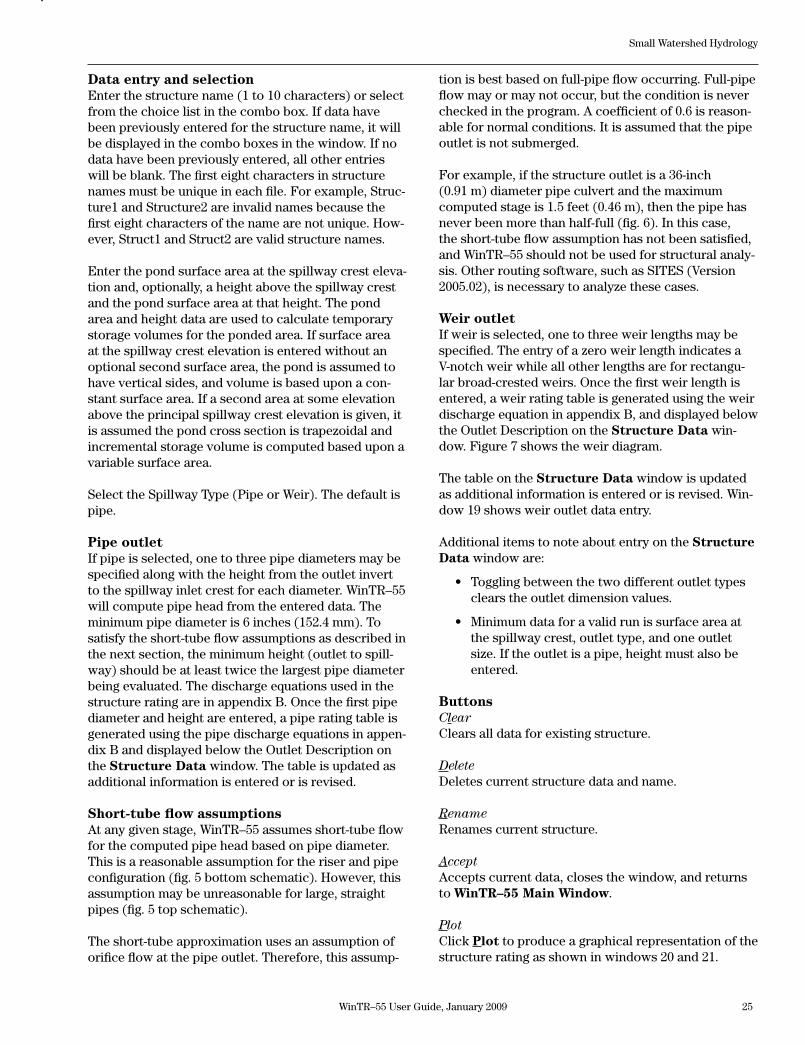
Short-tube flow assumptionsAt any given stage, WinTR–55 assumes short-tube flow for the computed pipe head based on pipe diameter. This is a reasonable assumption for the riser and pipe configuration (fig. 5 bottom schematic). However, this assumption may be unreasonable for large, straight pipes (fig. 5 top schematic).
The short-tube approximation uses an assumption of orifice flow at the pipe outlet. Therefore, this assump-
tion is best based on full-pipe flow occurring. Full-pipe flow may or may not occur, but the condition is never checked in the program. A coefficient of 0.6 is reason-able for normal conditions. It is assumed that the pipe outlet is not submerged.
For example, if the structure outlet is a 36-inch (0.91 m) diameter pipe culvert and the maximum computed stage is 1.5 feet (0.46 m), then the pipe has never been more than half-full (fig. 6). In this case, the short-tube flow assumption has not been satisfied, and WinTR–55 should not be used for structural analy-sis. Other routing software, such as SITES (Version 2005.02), is necessary to analyze these cases.
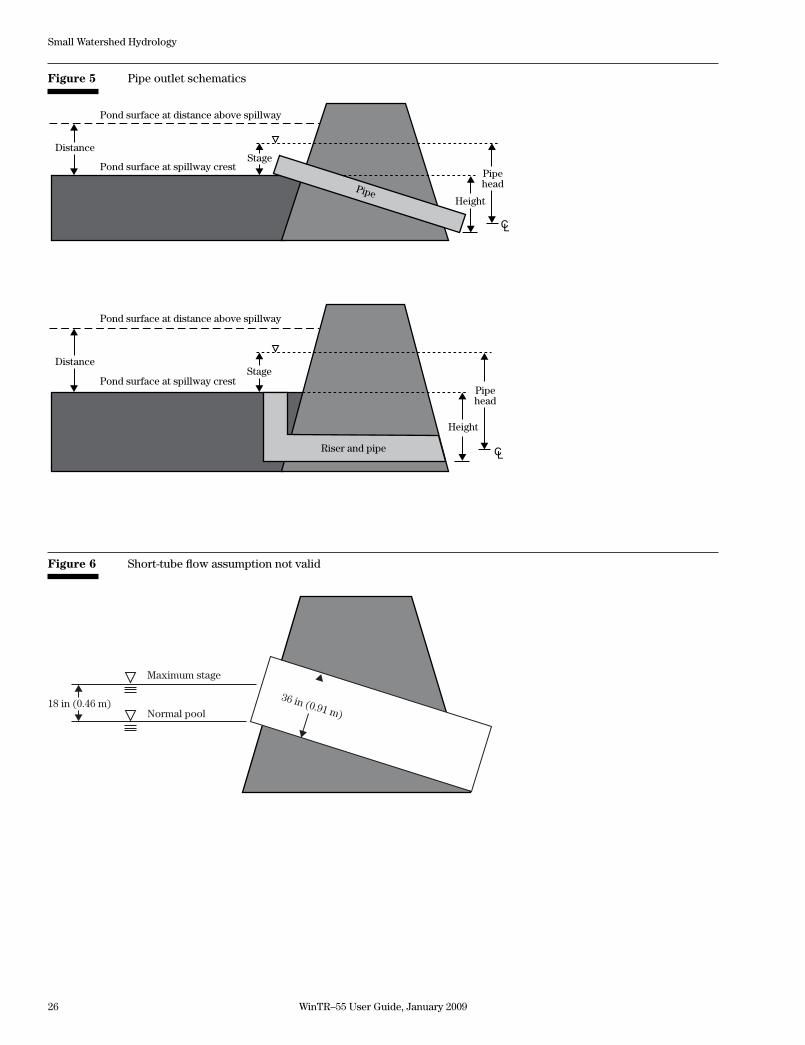
Weir outletIf weir is selected, one to three weir lengths may be specified. The entry of a zero weir length indicates a V-notch weir while all other lengths are for rectangu-lar broad-crested weirs. Once the first weir length is entered, a weir rating table is generated using the weir discharge equation in appendix B, and displayed below the Outlet Description on the Structure Data win-dow. Figure 7 shows the weir diagram.
The table on the Structure Data window is updated as additional information is entered or is revised. Win-dow 19 shows weir outlet data entry.
Additional items to note about entry on the Structure Data window are:
• Togglingbetweenthetwodifferentoutlettypesclears the outlet dimension values.
• Minimumdataforavalidrunissurfaceareaatthe spillway crest, outlet type, and one outlet size. If the outlet is a pipe, height must also be entered.
ButtonsClear Clears all data for existing structure.
Delete Deletes current structure data and name.
Rename Renames current structure.
AcceptAccepts current data, closes the window, and returns to WinTR–55 Main Window.
PlotClick Plot to produce a graphical representation of the structure rating as shown in windows 20 and 21.
26 WinTR–55 User Guide, January 2009
Small Watershed Hydrology
Figure 5 Pipe outlet schematics
Pipe
CL
StageDistance
Pond surface at spillway crest
Pond surface at distance above spillway
Height
Pipehead
Riser and pipe CL
StageDistance
Pond surface at spillway crest
Pond surface at distance above spillway
Height
Pipehead
Figure 6 Short-tube flow assumption not valid
18 in (0.46 m)36 in (0.91 m)
Maximum stage
Normal pool
WinTR–55 User Guide, January 2009 27
Small Watershed Hydrology
Window 19 Structure Data (weir outlet) window
Weir crestStageDistance
Pond surface at spillway crest
Pond surface at distance above spillway
Figure 7 Weir outlet schematic
28 WinTR–55 User Guide, January 2009
Small Watershed Hydrology
CancelClick Cancel to lose all data entry or revisions since this window was opened and redisplay the WinTR–55 Main Window.
HelpOpens a new help-text window with an overview of window purpose and general data entry instructions. Close the help-text window to return to data entry.
Window 20 Structure Rating plot (pipe outlet)
Quick Help (?)Click ? to provide context-sensitive help for any data that is clicked on next. To replace the help question mark cursor with the standard cursor, click ? again. Help is displayed at the bottom of the window.
WinTR–55 User Guide, January 2009 29
Small Watershed Hydrology
Window 21 Structure Rating plot (weir outlet)
30 WinTR–55 User Guide, January 2009
Small Watershed Hydrology
Storm Data window
PurposeThe Storm Data window (window 22) is used to specify rainfall data for the desired location. Storm data consists of at least one 24-hour rainfall amount, its return period, and associated rainfall distribution.
A rainfall database containing the 24-hour rainfall amounts by return period and associated rainfall distributions for many counties in the United States is included with WinTR–55.
Sometimes it is desirable to modify the database values with different amounts or rainfall distribu-tions. Users are prevented from making changes to the database itself, but the data can be revised for individual WinTR–55 runs. Such modifications can be made on the Storm Data window. Revisions are saved only with the specific project data and not saved to the database.
Some states chose not to submit data for the database. It is the user’s responsibility to ensure that WinTR–55 is using the proper rainfall data set for database values and provide appropriate 24-hour rainfall amounts, re-turn periods, and distributions for values not included in the database.
Window 22 Storm Data window
Since local design requirements may supersede NRCS provided information, it is the user’s responsibility to verify the appropriateness of all rainfall data inputs, including database values.
Data entry and selectionWatersheds inside United States —When the Storm Data window opens, the data displayed is for the previous WinTR–55 run. This may not be the correct data for the desired location of the current project. To update the data from displayed values to the desired location values from the WinTR–55 rainfall database, click on the NRCS Storm Data button. If no data are available for the current state and county information entered on the main window, this button is temporarily disabled, and the rainfall volumes, re-turn periods, and distributions must be user specified.
Watersheds outside United States—No rainfall data are provided for areas outside the United States (window 23). For example, for a watershed in Duran-go, Mexico, the WinTR–55 Main Window combo box entry labels change from State and County to Region and Locale, as shown in window 24. Since the program retains previously used rainfall data until the user changes it, all watersheds outside of the United States require the user to work through the Storm Data win-dow to enter the appropriate 24-hour rainfall volumes, return intervals, and distributions.
WinTR–55 User Guide, January 2009 31
Small Watershed Hydrology
Window 23 Storm data for areas outside the United States
Window 24 Watersheds outside of the United States
32 WinTR–55 User Guide, January 2009
Small Watershed Hydrology
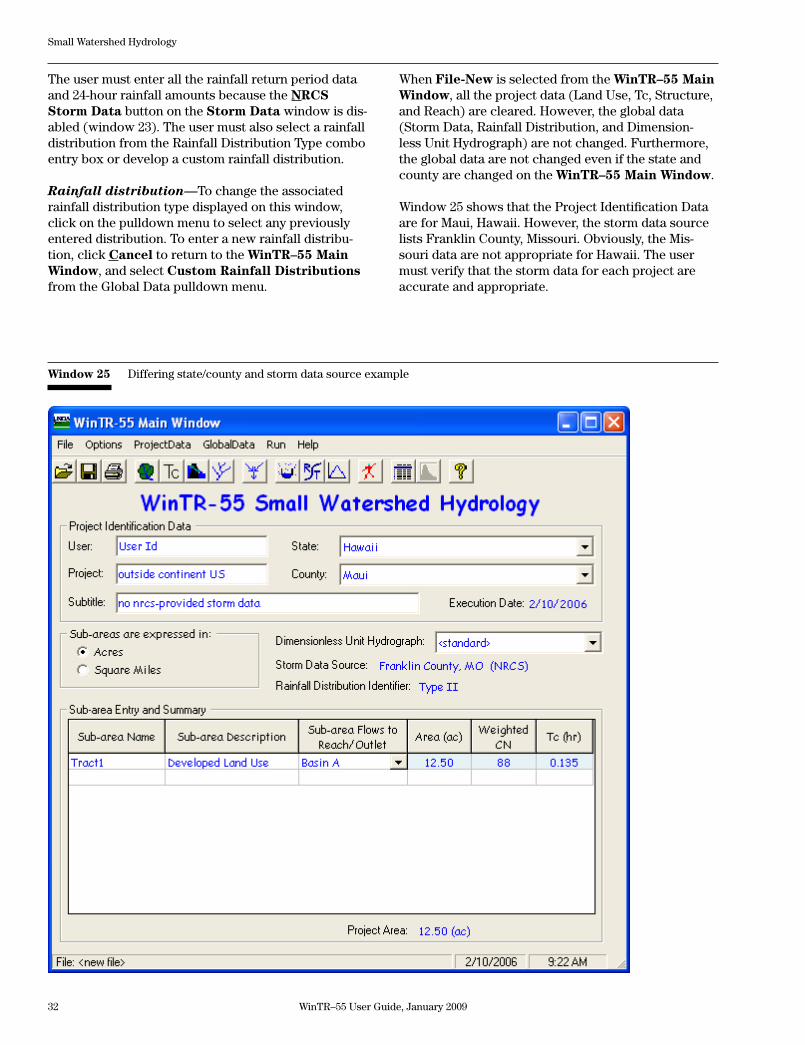
Window 25 Differing state/county and storm data source example
The user must enter all the rainfall return period data and 24-hour rainfall amounts because the NRCS Storm Data button on the Storm Data window is dis-abled (window 23). The user must also select a rainfall distribution from the Rainfall Distribution Type combo entry box or develop a custom rainfall distribution.
Rainfall distribution—To change the associated rainfall distribution type displayed on this window, click on the pulldown menu to select any previously entered distribution. To enter a new rainfall distribu-tion, click Cancel to return to the WinTR–55 Main Window, and select Custom Rainfall Distributions from the Global Data pulldown menu.
When File-New is selected from the WinTR–55 Main Window, all the project data (Land Use, Tc, Structure, and Reach) are cleared. However, the global data (Storm Data, Rainfall Distribution, and Dimension-less Unit Hydrograph) are not changed. Furthermore, the global data are not changed even if the state and county are changed on the WinTR–55 Main Window.
Window 25 shows that the Project Identification Data are for Maui, Hawaii. However, the storm data source lists Franklin County, Missouri. Obviously, the Mis-souri data are not appropriate for Hawaii. The user must verify that the storm data for each project are accurate and appropriate.
WinTR–55 User Guide, January 2009 33
Small Watershed Hydrology
Template files for storm data —Some users may use the same storm data set or sets repeatedly. If these data sets are not NRCS storm data sets, it would become tedious to re-enter the same rainfall data for each project. To create a template file, click File-New on the WinTR–55 Main Window to clear all the project data. Then enter the desired custom storm data. All the project data (Land Use, Tc, Structure, and Reach) have been cleared in the file. Save this file with a filename descriptive of the storm data.
To use this storm data for future projects, open this template file with the storm data first. Then proceed by entering project data (Land Use, Tc, Structure, and Reach). Make sure to save the project file with a differ-ent name so the template file is not overwritten.
ButtonsNRCS Storm DataThis button retrieves NRCS rainfall data if available. If the button is not available, the rainfall is not available in the database. Therefore, the user must supply all the rainfall data.
HelpOpens a new help-text window with an overview of window purpose and general data entry instructions. Close the help-text window to return to data entry.
Quick Help (?)Click ? to provide context-sensitive help for any data that is clicked on next. To replace the help question mark cursor with the standard cursor, click ? again. Help is displayed at the bottom of the window.
CancelClick Cancel to lose all data entry or revisions since this window was opened and redisplay the WinTR–55 Main Window.
AcceptAccept applies all new data, closes the window, and returns to the WinTR–55 Main Window. To save the data file, go to the WinTR–55 Main Window, and click Save or select File Save from the menu.
Custom Rainfall Distribution window
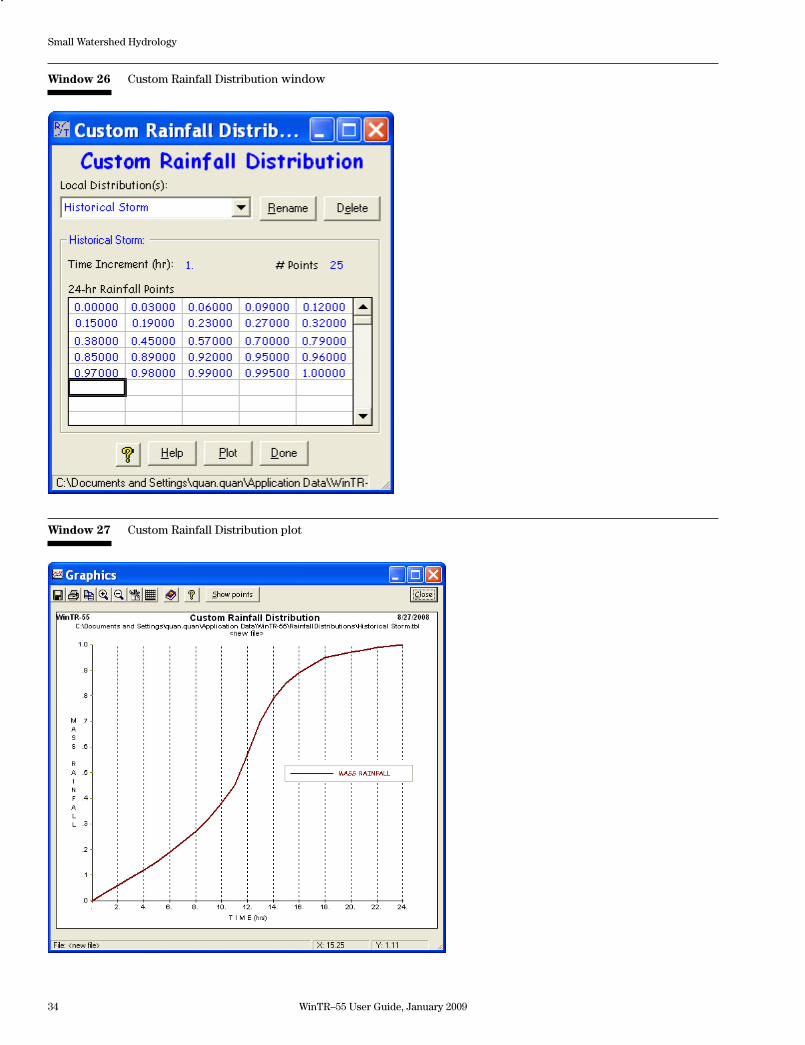
PurposeThe Custom Rainfall Distribution window (window 26) allows the user to input and revise nonstandard 24-hour rainfall distributions. The standard rainfall distri-butions in WinTR–55 may not be edited or deleted.
The first point of each distribution is 0.00000, and the last point should be 1.00000. No blank points are allowed. Each successive point must be equal to or larger than the previous one. Data are read left to right, starting at the top line and continuing to the bot-tom line. A maximum of 500 data points is allowed.
Data entry and selectionTo enter a new distribution, type the name into the Lo-cal Distribution(s) entry box. To delete a distribution, select the distribution name from the pulldown menu, and then click Delete.
As rainfall distribution data are entered, WinTR–55 automatically displays the number of points entered and adjusts the time increment in hours for that num-ber of points.
To view the Edit menu, right-click the mouse when the cursor is on a data point. The Edit menu allows the user to create and revise data points for the current rainfall distribution. Insert Point inserts a blank data point before the current point. Delete Point removes the current data point and moves successive points up. Click within a cell to edit the data in that cell.
ButtonsRenameRename is used to rename the currently displayed rainfall distribution.
DeleteThis button deletes the current distribution.
PlotClicking on Plot produces a graphical representation of the current rainfall distribution (window 27). Only one distribution may be displayed at a time.
DoneDone on the Custom Rainfall Distribution window prompts WinTR–55 to save the distribution and re-turn to the WinTR–55 Main Window. Note that this process is different than saving project-specific data, such as Land Use Details, which only updates data in memory.
34 WinTR–55 User Guide, January 2009
Small Watershed Hydrology
Window 26 Custom Rainfall Distribution window
Window 27 Custom Rainfall Distribution plot
WinTR–55 User Guide, January 2009 35
Small Watershed Hydrology
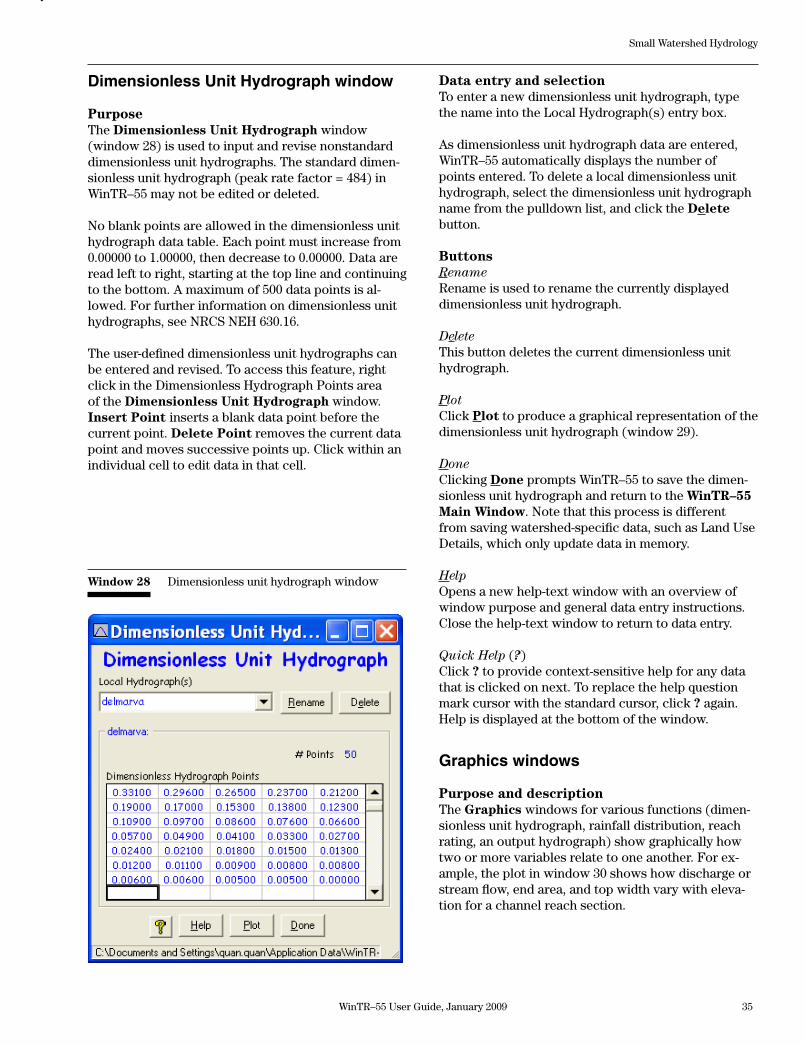
Dimensionless Unit Hydrograph window
PurposeThe Dimensionless Unit Hydrograph window (window 28) is used to input and revise nonstandard dimensionless unit hydrographs. The standard dimen-sionlessunithydrograph(peakratefactor=484)inWinTR–55 may not be edited or deleted.
No blank points are allowed in the dimensionless unit hydrograph data table. Each point must increase from 0.00000 to 1.00000, then decrease to 0.00000. Data are read left to right, starting at the top line and continuing to the bottom. A maximum of 500 data points is al-lowed. For further information on dimensionless unit hydrographs, see NRCS NEH 630.16.
The user-defined dimensionless unit hydrographs can be entered and revised. To access this feature, right click in the Dimensionless Hydrograph Points area of the Dimensionless Unit Hydrograph window. Insert Point inserts a blank data point before the current point. Delete Point removes the current data point and moves successive points up. Click within an individual cell to edit data in that cell.
Data entry and selectionTo enter a new dimensionless unit hydrograph, type the name into the Local Hydrograph(s) entry box.
As dimensionless unit hydrograph data are entered, WinTR–55 automatically displays the number of points entered. To delete a local dimensionless unit hydrograph, select the dimensionless unit hydrograph name from the pulldown list, and click the Delete button.
ButtonsRenameRename is used to rename the currently displayed dimensionless unit hydrograph.
DeleteThis button deletes the current dimensionless unit hydrograph.
PlotClick Plot to produce a graphical representation of the dimensionless unit hydrograph (window 29).
DoneClicking Done prompts WinTR–55 to save the dimen-sionless unit hydrograph and return to the WinTR–55 Main Window. Note that this process is different from saving watershed-specific data, such as Land Use Details, which only update data in memory.
HelpOpens a new help-text window with an overview of window purpose and general data entry instructions. Close the help-text window to return to data entry.
Quick Help (?)Click ? to provide context-sensitive help for any data that is clicked on next. To replace the help question mark cursor with the standard cursor, click ? again. Help is displayed at the bottom of the window.
Graphics windows
Purpose and descriptionThe Graphics windows for various functions (dimen-sionless unit hydrograph, rainfall distribution, reach rating, an output hydrograph) show graphically how two or more variables relate to one another. For ex-ample, the plot in window 30 shows how discharge or stream flow, end area, and top width vary with eleva-tion for a channel reach section.
Window 28 Dimensionless unit hydrograph window
36 WinTR–55 User Guide, January 2009
Small Watershed Hydrology
Window 29 Dimensionless unit hydrograph plot
WinTR–55 User Guide, January 2009 37
Small Watershed Hydrology
Window 30 Typical Graphics window plot
38 WinTR–55 User Guide, January 2009
Small Watershed Hydrology
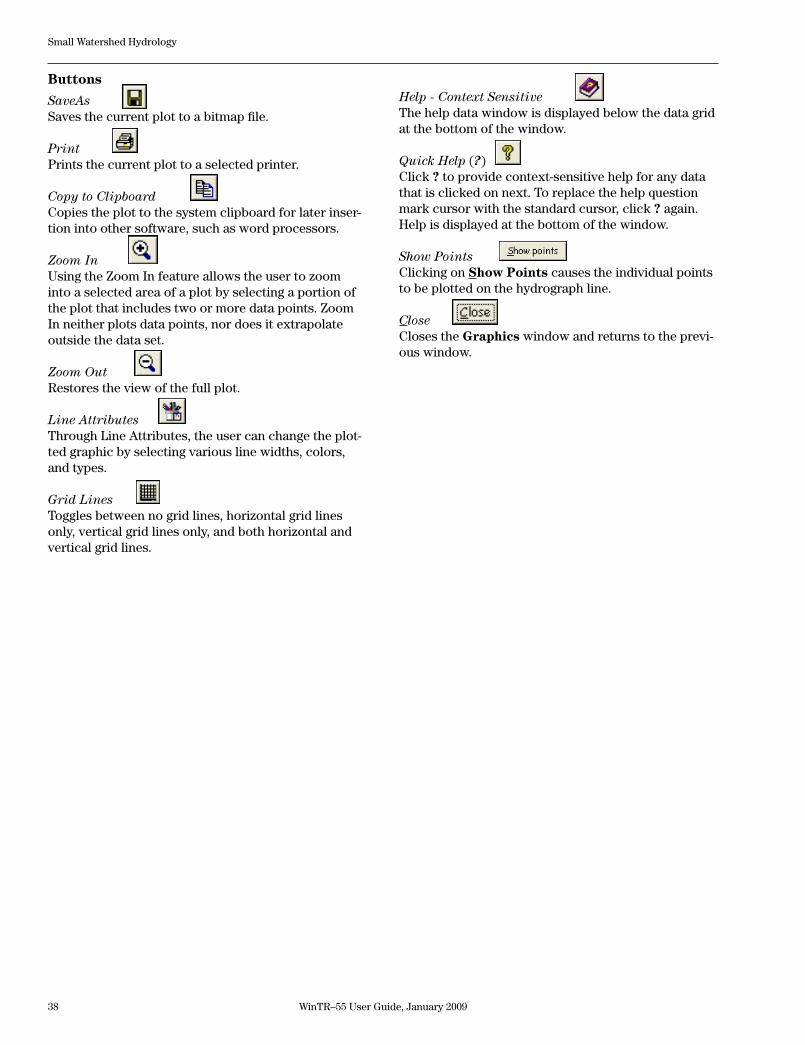
Buttons
SaveAs Saves the current plot to a bitmap file.
Print Prints the current plot to a selected printer.
Copy to Clipboard Copies the plot to the system clipboard for later inser-tion into other software, such as word processors.
Zoom In Using the Zoom In feature allows the user to zoom into a selected area of a plot by selecting a portion of the plot that includes two or more data points. Zoom In neither plots data points, nor does it extrapolate outside the data set.
Zoom Out Restores the view of the full plot.
Line Attributes Through Line Attributes, the user can change the plot-ted graphic by selecting various line widths, colors, and types.
Grid Lines Toggles between no grid lines, horizontal grid lines only, vertical grid lines only, and both horizontal and vertical grid lines.
Help - Context Sensitive The help data window is displayed below the data grid at the bottom of the window.
Quick Help (?) Click ? to provide context-sensitive help for any data that is clicked on next. To replace the help question mark cursor with the standard cursor, click ? again. Help is displayed at the bottom of the window.
Show Points Clicking on Show Points causes the individual points to be plotted on the hydrograph line.
Close Closes the Graphics window and returns to the previ-ous window.
WinTR–55 User Guide, January 2009 39
Small Watershed Hydrology
Land use parametersA sub-area drainage area and weighted runoff curve number may be entered directly on the Sub-area Entry and Summary portion of the WinTR–55 Main Win-dow or computed from land use data entered on the Land Use Details window. For each hydrologic soil group land cover complex, the area covered is entered on the Land Use Details window by individual sub-areas in the watershed. The land use areas entered are summed to determine the sub-area drainage area. They are also used to weigh the applicable runoff curve numbers for the land use hydrologic soil group combi-nation to produce a sub-area weighted curve number. The equation used in the curve number weighting is in appendix B. Curve number values in the Sub-area Entry and Summary portion of the WinTR–55 Main Window are coded in either green or blue text. Green text indicates a value computed on the Land Use Details window, while blue text indicates a value that was entered directly.
The optional Custom CN button on the land use details table allows the user to compute a weighted curve number for a cover description that is not covered by the standard cover description assumptions on the Land Use Details window. Custom curve numbers are computed based upon a given pervious area curve number (from one of the standard table values), the percentage of the impervious area in the sub-area (CN=98),andthepercentageoftheimperviousareasthat are not directly connected to the flow path.
Channel rating tableA channel rating table is generated for each reach with channel information entered. The rating table consists of discharge, cross section end area, top width, and velocity for depths from 0 to 20 feet (0–6.1 meters). This range should cover all WinTR–55 applications. The rating table data are displayed below the entry portion of the Reach Data window when sufficient data are entered to perform the calculations. The equations used for each of the rating parameters are in appendix B.
Structure rating tableFor each reach that has structure information entered, a structure rating table is generated. The information in the rating table depends on the structure outlet type (pipe or weir). The pipe outlet rating table consists of stage, pipe head, pipe flow, and temporary storage. The weir table consists of stage, weir flow, and tem-porary storage. One to three pipe diameters or weir lengths can be entered. A set of seven stages, based on multiples of the smallest pipe diameter, is computed for pipes, and similarly, a set of seven stages from 0 to 20 feet (0–6.1 meters), is computed for weirs. The
Running WinTR–55
To run the WinTR–55 model, click Run on the menu bar, or click the Run WinTR–55 button. When the Run WinTR–55 window opens, choose which storm fre-quencies to run by checking the appropriate boxes, and click the Run button. A WinTR–20 input data file is prepared, and the WinTR–20 model is run produc-ing hydrographs for all of the sub-areas and reaches (upstream and downstream), as well as for the water-shed outlet. If the run is successful, the Hydrograph Peak/Peak Time table is displayed in the File Display window. If the run is unsuccessful, the Error file from WinTR–20 is displayed in the File Display window. Any data errors need to be corrected before another run is attempted.
Disclaimer Although WinTR–55 has been tested by its develop-ers, NO warranty, expressed or implied, is made as to the accuracy and functioning of the program and related program material nor shall the fact of distribution constitute any such warranty, and NO responsibility is assumed by the developers in con-nection therewith.
WinTR–55 processes
WinTR–55 preprocesses data during data entry for WinTR–20 hydrograph computations. The preprocess-ing computations are time of concentration, land use parameters, channel rating table, and structure rating table.
Time of concentration (Tc)Sub-area Tc may be entered directly on the Sub-area Entry and Summary portion of the WinTR–55 Main Window, or it may be computed from the detailed flow path data entered on the WinTR–55 Time of Concen-tration Details window. Data entry and computations are subdivided into three types of flow (sheet, shallow concentrated, and channel flow). While data for only one sheet flow segment can be entered, one or two segments of data can be entered for both the shallow concentrated and channel flows. The total computed travel times for each flow path segment are indicated on the entry window as is the Tc (sum of the travel times). The equations used to compute the various travel times for each segment type are in appendix B. Tc values in the Sub-area Entry and Summary portion of the WinTR–55 Main Window are coded in either green or blue text. Green text indicates a value com-puted on the WinTR–55 Time of Concentration Details window, while the blue text indicates a value that was entered directly.
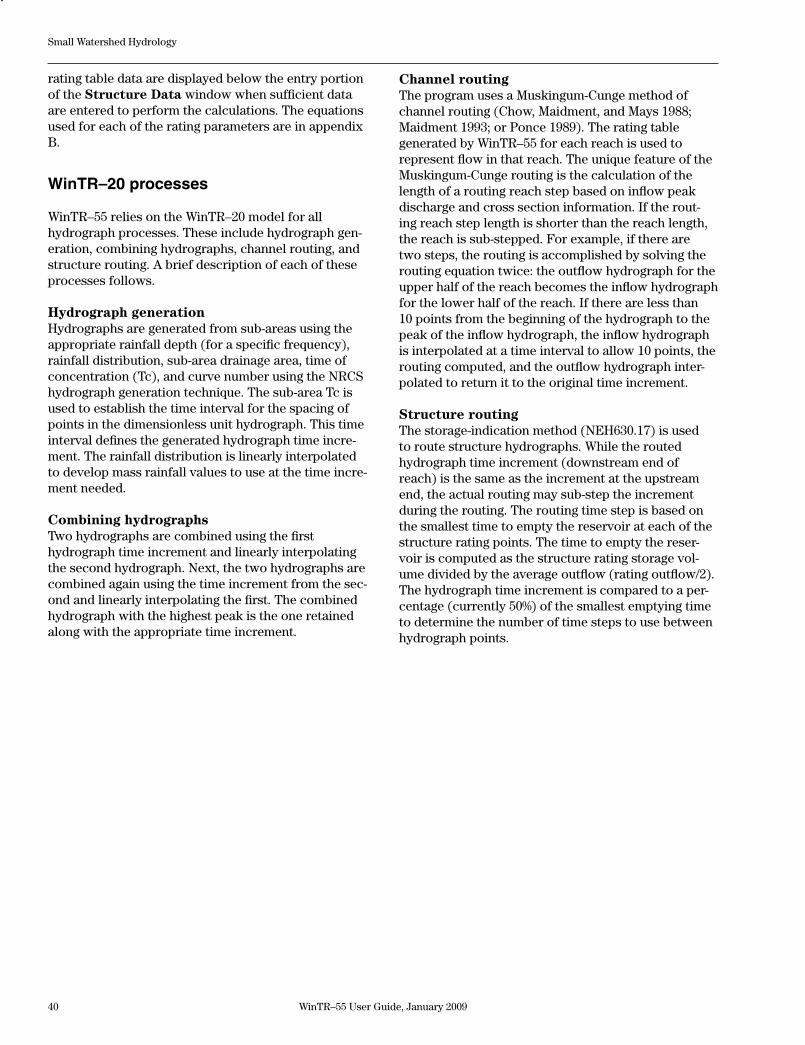
40 WinTR–55 User Guide, January 2009
Small Watershed Hydrology
rating table data are displayed below the entry portion of the Structure Data window when sufficient data are entered to perform the calculations. The equations used for each of the rating parameters are in appendix B.
WinTR–20 processes
WinTR–55 relies on the WinTR–20 model for all hydrograph processes. These include hydrograph gen-eration, combining hydrographs, channel routing, and structure routing. A brief description of each of these processes follows.
Hydrograph generationHydrographs are generated from sub-areas using the appropriate rainfall depth (for a specific frequency), rainfall distribution, sub-area drainage area, time of concentration (Tc), and curve number using the NRCS hydrograph generation technique. The sub-area Tc is used to establish the time interval for the spacing of points in the dimensionless unit hydrograph. This time interval defines the generated hydrograph time incre-ment. The rainfall distribution is linearly interpolated to develop mass rainfall values to use at the time incre-ment needed.
Combining hydrographsTwo hydrographs are combined using the first hydrograph time increment and linearly interpolating the second hydrograph. Next, the two hydrographs are combined again using the time increment from the sec-ond and linearly interpolating the first. The combined hydrograph with the highest peak is the one retained along with the appropriate time increment.
Channel routingThe program uses a Muskingum-Cunge method of channel routing (Chow, Maidment, and Mays 1988; Maidment 1993; or Ponce 1989). The rating table generated by WinTR–55 for each reach is used to represent flow in that reach. The unique feature of the Muskingum-Cunge routing is the calculation of the length of a routing reach step based on inflow peak discharge and cross section information. If the rout-ing reach step length is shorter than the reach length, the reach is sub-stepped. For example, if there are two steps, the routing is accomplished by solving the routing equation twice: the outflow hydrograph for the upper half of the reach becomes the inflow hydrograph for the lower half of the reach. If there are less than 10 points from the beginning of the hydrograph to the peak of the inflow hydrograph, the inflow hydrograph is interpolated at a time interval to allow 10 points, the routing computed, and the outflow hydrograph inter-polated to return it to the original time increment.
Structure routingThe storage-indication method (NEH630.17) is used to route structure hydrographs. While the routed hydrograph time increment (downstream end of reach) is the same as the increment at the upstream end, the actual routing may sub-step the increment during the routing. The routing time step is based on the smallest time to empty the reservoir at each of the structure rating points. The time to empty the reser-voir is computed as the structure rating storage vol-ume divided by the average outflow (rating outflow/2). The hydrograph time increment is compared to a per-centage (currently 50%) of the smallest emptying time to determine the number of time steps to use between hydrograph points.
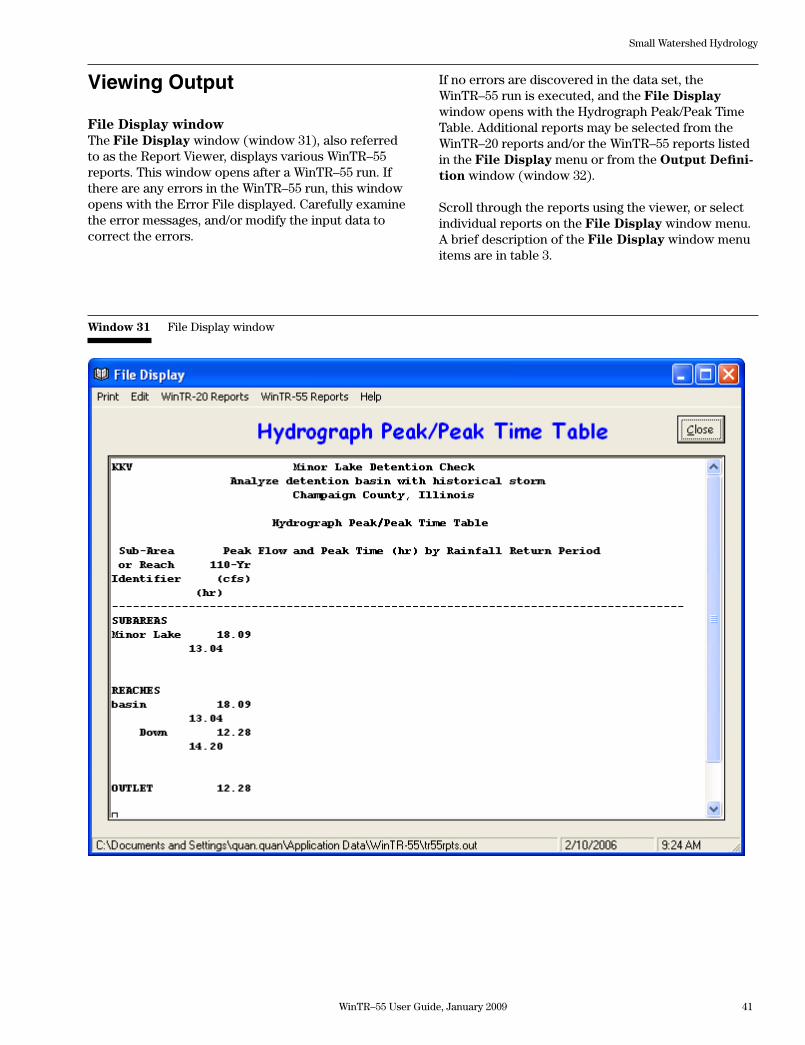
WinTR–55 User Guide, January 2009 41
Small Watershed Hydrology
Viewing Output
File Display windowThe File Display window (window 31), also referred to as the Report Viewer, displays various WinTR–55 reports. This window opens after a WinTR–55 run. If there are any errors in the WinTR–55 run, this window opens with the Error File displayed. Carefully examine the error messages, and/or modify the input data to correct the errors.
Window 31 File Display window
If no errors are discovered in the data set, the WinTR–55 run is executed, and the File Display window opens with the Hydrograph Peak/Peak Time Table. Additional reports may be selected from the WinTR–20 reports and/or the WinTR–55 reports listed in the File Display menu or from the Output Defini-tion window (window 32).
Scroll through the reports using the viewer, or select individual reports on the File Display window menu. A brief description of the File Display window menu items are in table 3.
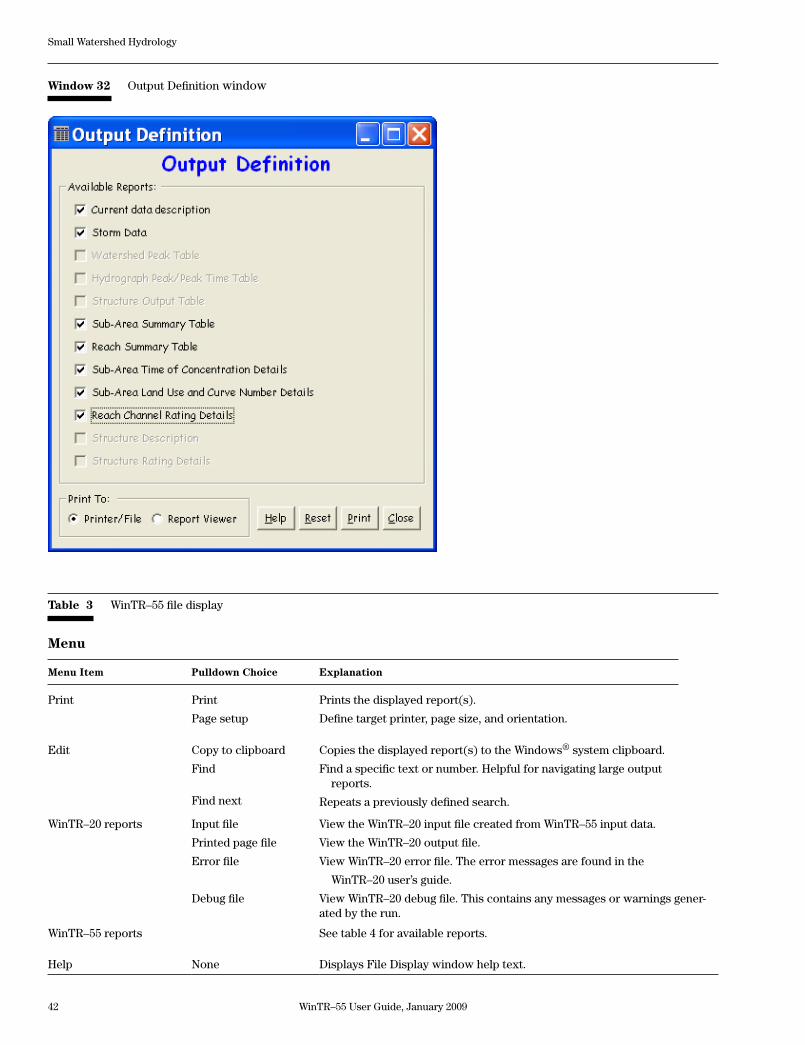
42 WinTR–55 User Guide, January 2009
Small Watershed Hydrology
Table 3 WinTR–55 file display
Menu
Menu Item Pulldown Choice Explanation
Print Print
Page setup
Prints the displayed report(s).
Define target printer, page size, and orientation.
Edit Copy to clipboard
Find
Find next
Copies the displayed report(s) to the Windows® system clipboard.
Find a specific text or number. Helpful for navigating large output reports.
Repeats a previously defined search.
WinTR–20 reports Input file
Printed page file
Error file
Debug file
View the WinTR–20 input file created from WinTR–55 input data.
View the WinTR–20 output file.
View WinTR–20 error file. The error messages are found in the
WinTR–20 user’s guide.
View WinTR–20 debug file. This contains any messages or warnings gener-ated by the run.
WinTR–55 reports See table 4 for available reports.
Help None Displays File Display window help text.
Window 32 Output Definition window
WinTR–55 User Guide, January 2009 43
Small Watershed Hydrology
ButtonsCloseClick Close to close the File Display window. If you were using the report viewer, you will be returned to the Output Definition window. Otherwise you will be returned to the WinTR–55 Main Window.
Output Definition window
Once rainfall data are entered, the Output Definition button on the WinTR–55 Main Window is enabled. Prior to executing a WinTR–55 run, it is possible to select reports for viewing. However, some report op-tions may be grayed out, indicating that reports are not available for viewing until an error-free WinTR–55 run is executed.
Click the Output Definition icon to open the Output Definition window (window 32). Specify output by clicking the box to the left of the desired report. Out-put may be sent to a file or to the report viewer, de-pending on which option is selected.
Available reportsAvailable reports shown in the Output Definition window are summarized in table 4.
ButtonsHelpOpens a new help-text window with an overview of window purpose and general data entry instructions. Close the help-text window to return to data entry.
All/ResetIf no report boxes are checked, the button label is All. Click All to check all the reports that are available. If all the report boxes are checked, the label toggles to Reset, which will clear all the check boxes.
View/PrintThis button label toggles between View and Print, depending on which option button is selected, either Printer/File or Report Viewer.
CloseClick Close to close the Output Definition window and return to the WinTR–55 Main Window.
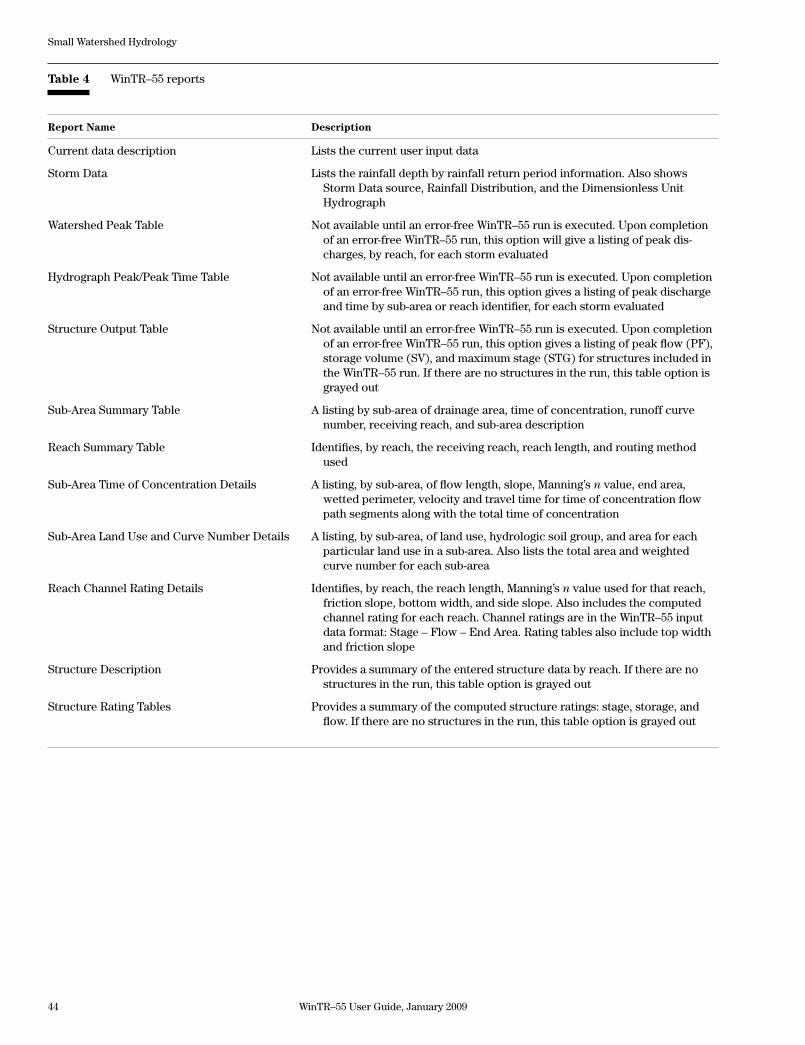
44 WinTR–55 User Guide, January 2009
Small Watershed Hydrology
Table 4 WinTR–55 reports
Report Name Description
Current data description Lists the current user input data
Storm Data Lists the rainfall depth by rainfall return period information. Also shows Storm Data source, Rainfall Distribution, and the Dimensionless Unit Hydrograph
Watershed Peak Table Not available until an error-free WinTR–55 run is executed. Upon completion of an error-free WinTR–55 run, this option will give a listing of peak dis- charges, by reach, for each storm evaluated
Hydrograph Peak/Peak Time Table Not available until an error-free WinTR–55 run is executed. Upon completion of an error-free WinTR–55 run, this option gives a listing of peak discharge and time by sub-area or reach identifier, for each storm evaluated
Structure Output Table Not available until an error-free WinTR–55 run is executed. Upon completion of an error-free WinTR–55 run, this option gives a listing of peak flow (PF), storage volume (SV), and maximum stage (STG) for structures included in the WinTR–55 run. If there are no structures in the run, this table option is grayed out
Sub-Area Summary Table A listing by sub-area of drainage area, time of concentration, runoff curve number, receiving reach, and sub-area description
Reach Summary Table Identifies, by reach, the receiving reach, reach length, and routing method used
Sub-Area Time of Concentration Details A listing, by sub-area, of flow length, slope, Manning’s n value, end area, wetted perimeter, velocity and travel time for time of concentration flow path segments along with the total time of concentration
Sub-Area Land Use and Curve Number Details A listing, by sub-area, of land use, hydrologic soil group, and area for each particular land use in a sub-area. Also lists the total area and weighted curve number for each sub-area
Reach Channel Rating Details Identifies, by reach, the reach length, Manning’s n value used for that reach, friction slope, bottom width, and side slope. Also includes the computed channel rating for each reach. Channel ratings are in the WinTR–55 input data format: Stage – Flow – End Area. Rating tables also include top width and friction slope
Structure Description Provides a summary of the entered structure data by reach. If there are no structures in the run, this table option is grayed out
Structure Rating Tables Provides a summary of the computed structure ratings: stage, storage, and flow. If there are no structures in the run, this table option is grayed out
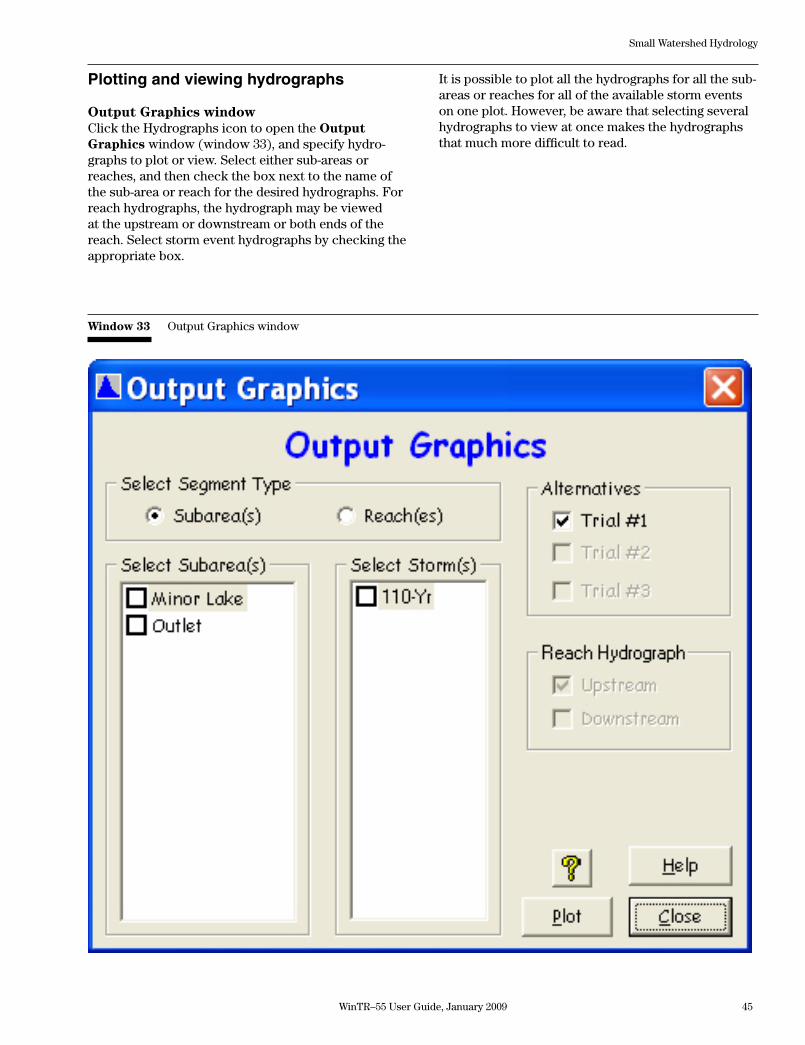
WinTR–55 User Guide, January 2009 45
Small Watershed Hydrology
Plotting and viewing hydrographs
Output Graphics windowClick the Hydrographs icon to open the Output Graphics window (window 33), and specify hydro-graphs to plot or view. Select either sub-areas or reaches, and then check the box next to the name of the sub-area or reach for the desired hydrographs. For reach hydrographs, the hydrograph may be viewed at the upstream or downstream or both ends of the reach. Select storm event hydrographs by checking the appropriate box.
Window 33 Output Graphics window
It is possible to plot all the hydrographs for all the sub-areas or reaches for all of the available storm events on one plot. However, be aware that selecting several hydrographs to view at once makes the hydrographs that much more difficult to read.
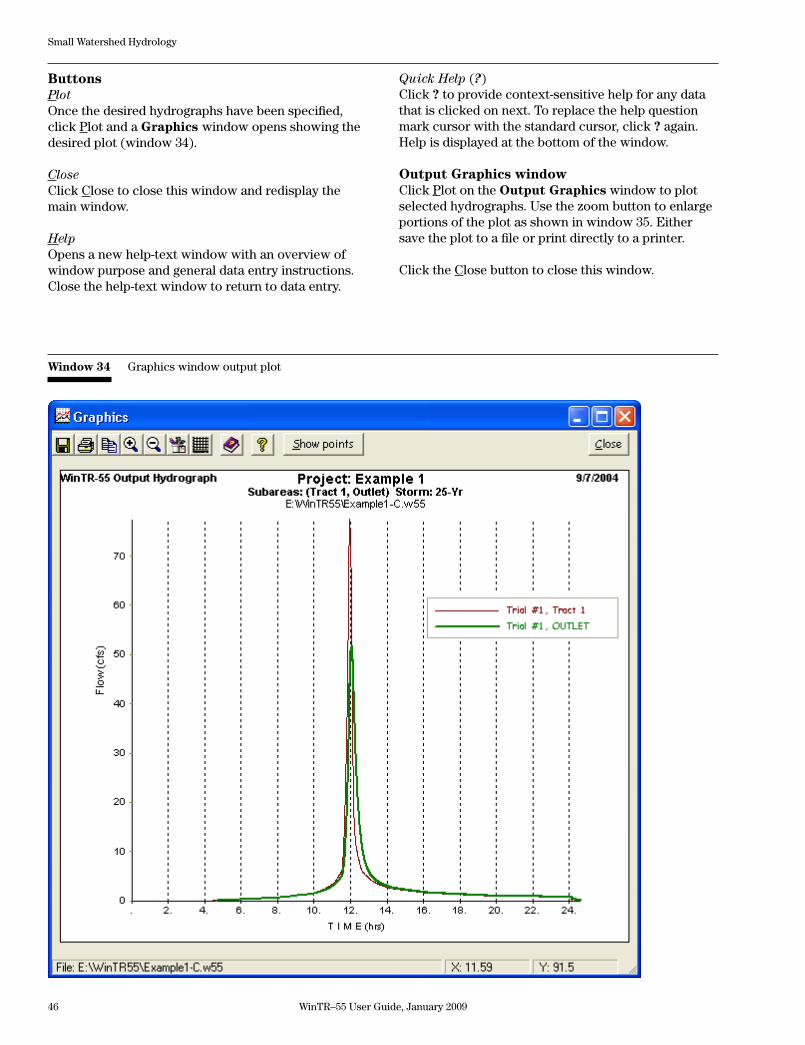
46 WinTR–55 User Guide, January 2009
Small Watershed Hydrology
Window 34 Graphics window output plot
ButtonsPlotOnce the desired hydrographs have been specified, click Plot and a Graphics window opens showing the desired plot (window 34).
Close Click Close to close this window and redisplay the main window.
Help Opens a new help-text window with an overview of window purpose and general data entry instructions. Close the help-text window to return to data entry.
Quick Help (?)Click ? to provide context-sensitive help for any data that is clicked on next. To replace the help question mark cursor with the standard cursor, click ? again. Help is displayed at the bottom of the window.
Output Graphics windowClick Plot on the Output Graphics window to plot selected hydrographs. Use the zoom button to enlarge portions of the plot as shown in window 35. Either save the plot to a file or print directly to a printer.
Click the Close button to close this window.
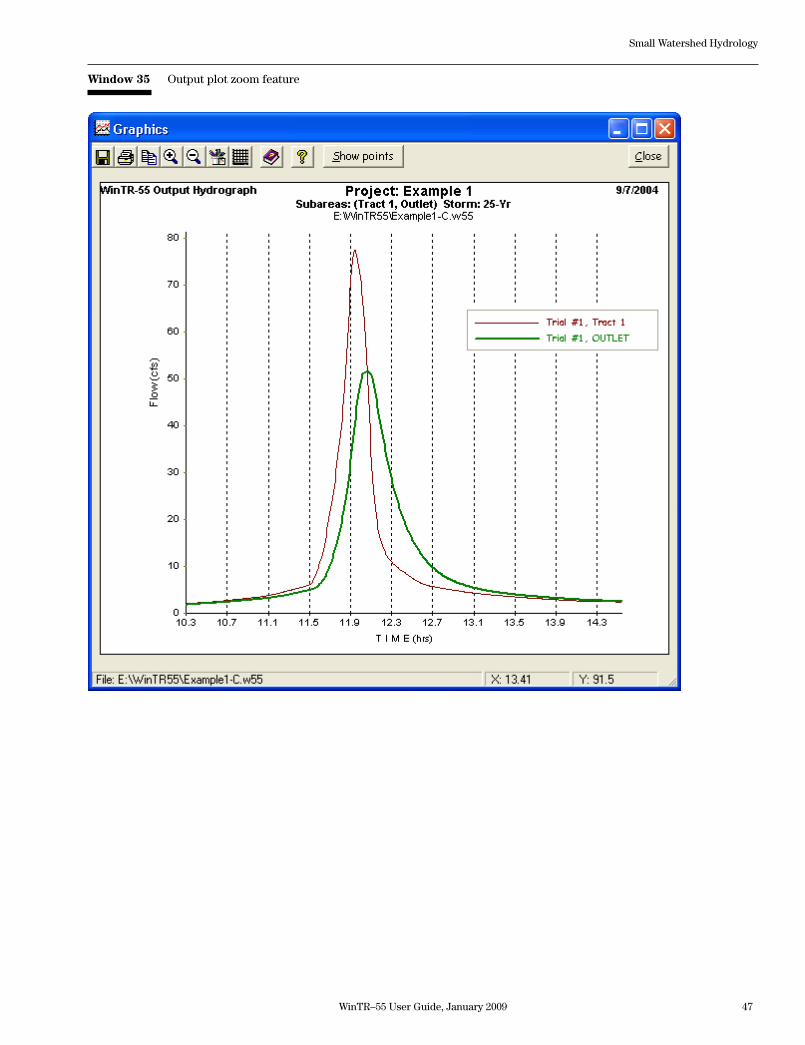
WinTR–55 User Guide, January 2009 47
Small Watershed Hydrology
Window 35 Output plot zoom feature

WinTR–55 User Guide, January 2009
Appendices
Appendix A Examples
Example 1 Determining Runoff From a Single Sub-area for the Existing
and Developed Conditions and Sizing a Detention Basin
Example 2 Evaluating Larger Watersheds and User-defined Storm Data
Example 3 Custom Dimensionless Unit Hydrograph
Example 4 Custom Rainfall Distribution
Appendix B Equations
Appendix C References

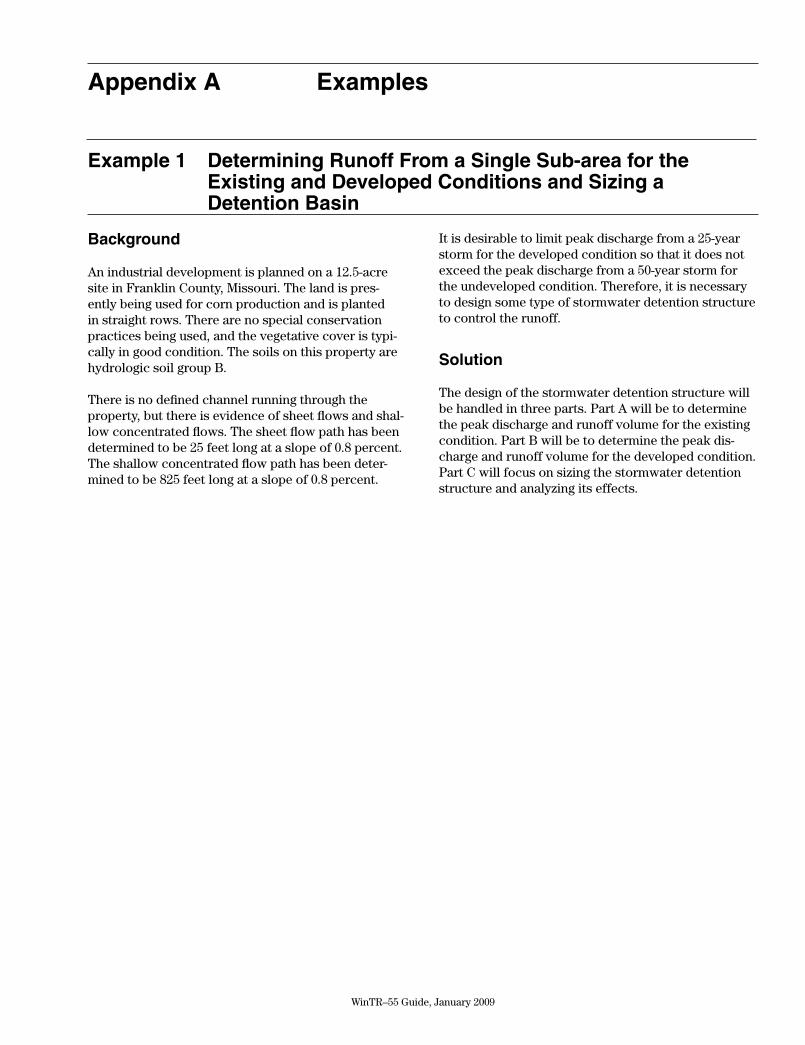
WinTR–55 Guide, January 2009
Background
An industrial development is planned on a 12.5-acre site in Franklin County, Missouri. The land is pres-ently being used for corn production and is planted in straight rows. There are no special conservation practices being used, and the vegetative cover is typi-cally in good condition. The soils on this property are hydrologic soil group B.
There is no defined channel running through the property, but there is evidence of sheet flows and shal-low concentrated flows. The sheet flow path has been determined to be 25 feet long at a slope of 0.8 percent. The shallow concentrated flow path has been deter-mined to be 825 feet long at a slope of 0.8 percent.
It is desirable to limit peak discharge from a 25-year storm for the developed condition so that it does not exceed the peak discharge from a 50-year storm for the undeveloped condition. Therefore, it is necessary to design some type of stormwater detention structure to control the runoff.
Solution
The design of the stormwater detention structure will be handled in three parts. Part A will be to determine the peak discharge and runoff volume for the existing condition. Part B will be to determine the peak dis-charge and runoff volume for the developed condition. Part C will focus on sizing the stormwater detention structure and analyzing its effects.
Example 1 Determining Runoff From a Single Sub-area for the Existing and Developed Conditions and Sizing a Detention Basin
Appendix A Examples
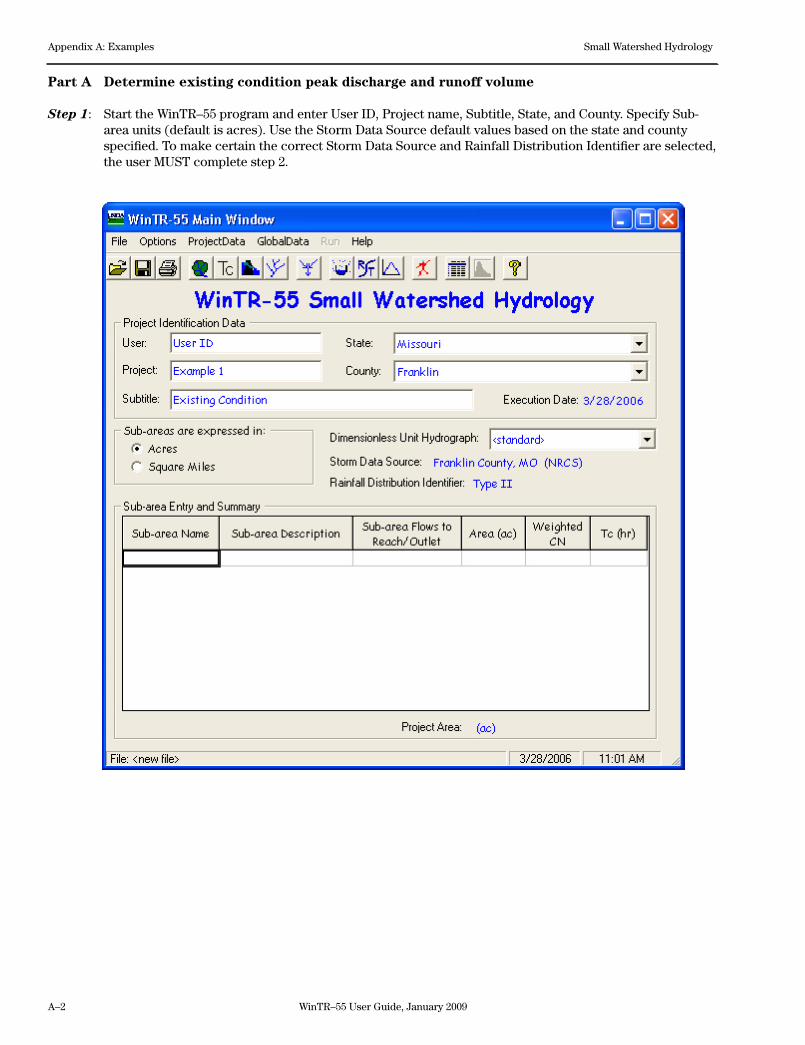
A–2 WinTR–55 User Guide, January 2009
Appendix A: Examples Small Watershed Hydrology
Part A Determine existing condition peak discharge and runoff volume
Step 1: Start the WinTR–55 program and enter User ID, Project name, Subtitle, State, and County. Specify Sub-area units (default is acres). Use the Storm Data Source default values based on the state and county specified. To make certain the correct Storm Data Source and Rainfall Distribution Identifier are selected, the user MUST complete step 2.
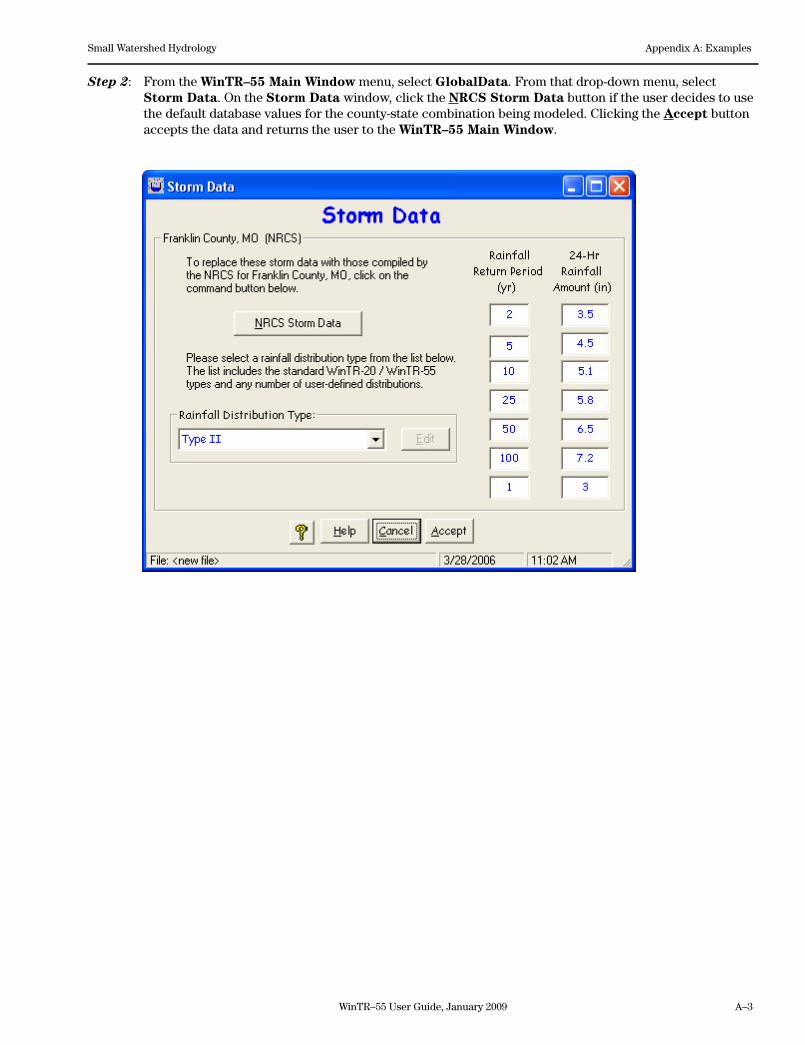
WinTR–55 User Guide, January 2009 A–3
Small Watershed Hydrology Appendix A: Examples
Step 2: From the WinTR–55 Main Window menu, select GlobalData. From that drop-down menu, select Storm Data. On the Storm Data window, click the NRCS Storm Data button if the user decides to use the default database values for the county-state combination being modeled. Clicking the Accept button accepts the data and returns the user to the WinTR–55 Main Window.
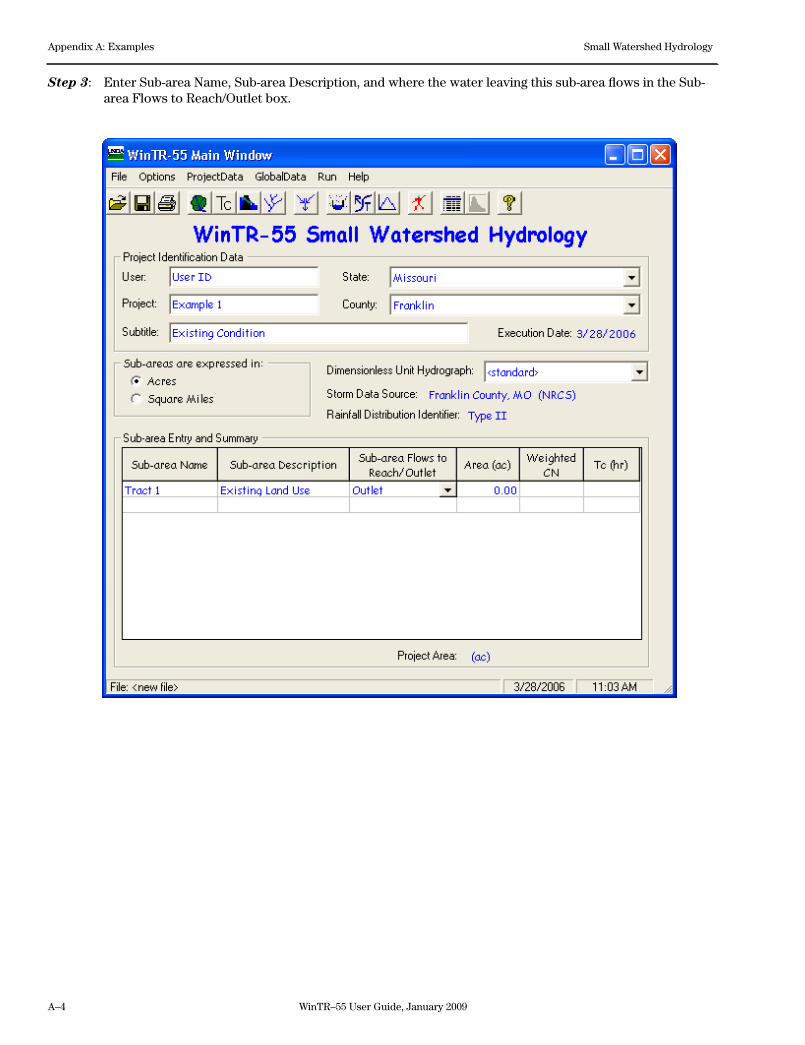
A–4 WinTR–55 User Guide, January 2009
Appendix A: Examples Small Watershed Hydrology
Step 3: Enter Sub-area Name, Sub-area Description, and where the water leaving this sub-area flows in the Sub-area Flows to Reach/Outlet box.
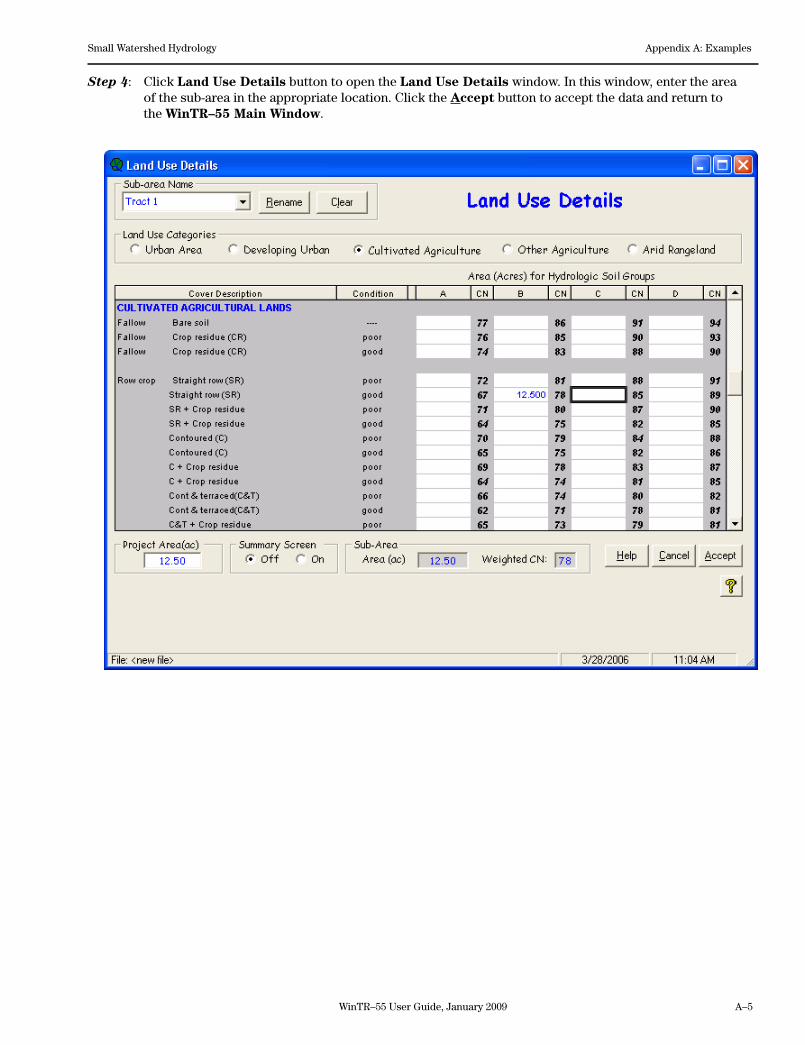
WinTR–55 User Guide, January 2009 A–5
Small Watershed Hydrology Appendix A: Examples
Step 4: Click Land Use Details button to open the Land Use Details window. In this window, enter the area of the sub-area in the appropriate location. Click the Accept button to accept the data and return to the WinTR–55 Main Window.
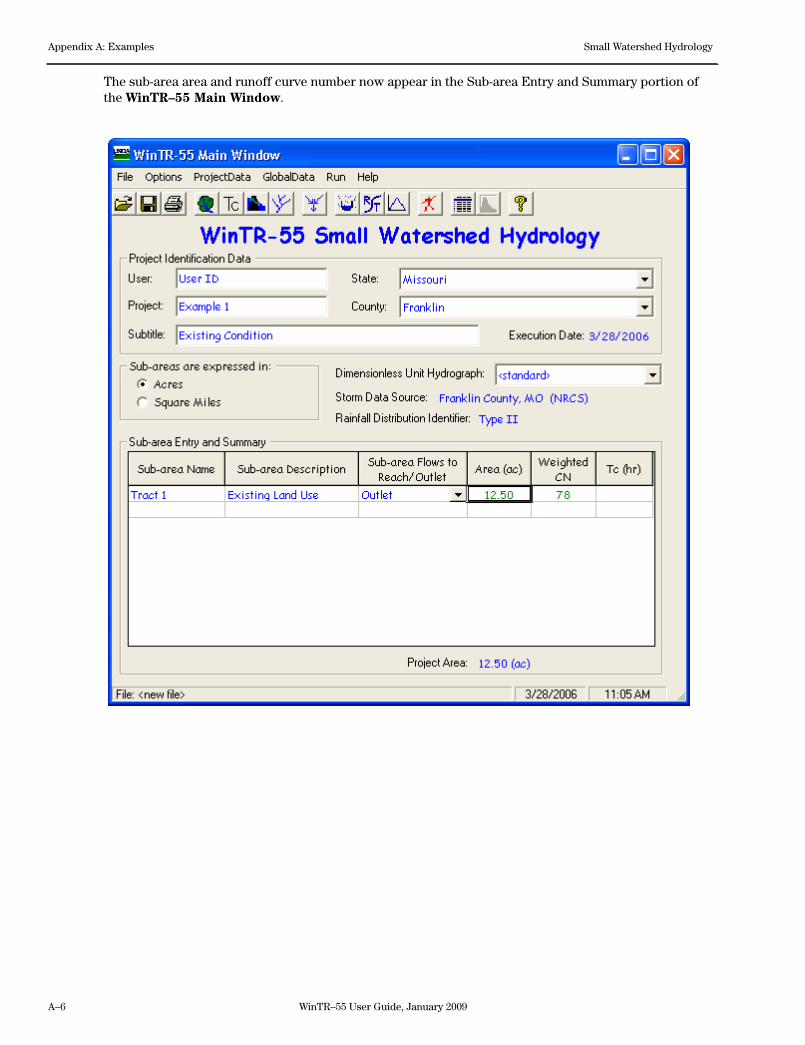
A–6 WinTR–55 User Guide, January 2009
Appendix A: Examples Small Watershed Hydrology
The sub-area area and runoff curve number now appear in the Sub-area Entry and Summary portion of the WinTR–55 Main Window.
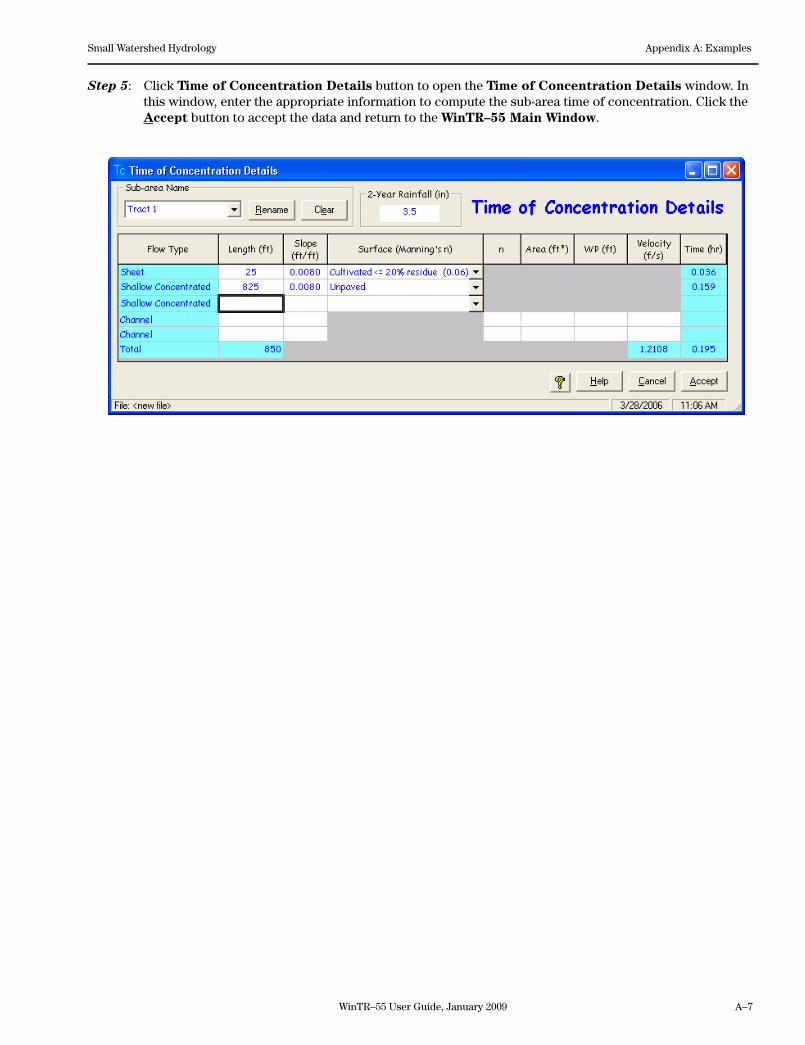
WinTR–55 User Guide, January 2009 A–7
Small Watershed Hydrology Appendix A: Examples
Step 5: Click Time of Concentration Details button to open the Time of Concentration Details window. In this window, enter the appropriate information to compute the sub-area time of concentration. Click the Accept button to accept the data and return to the WinTR–55 Main Window.
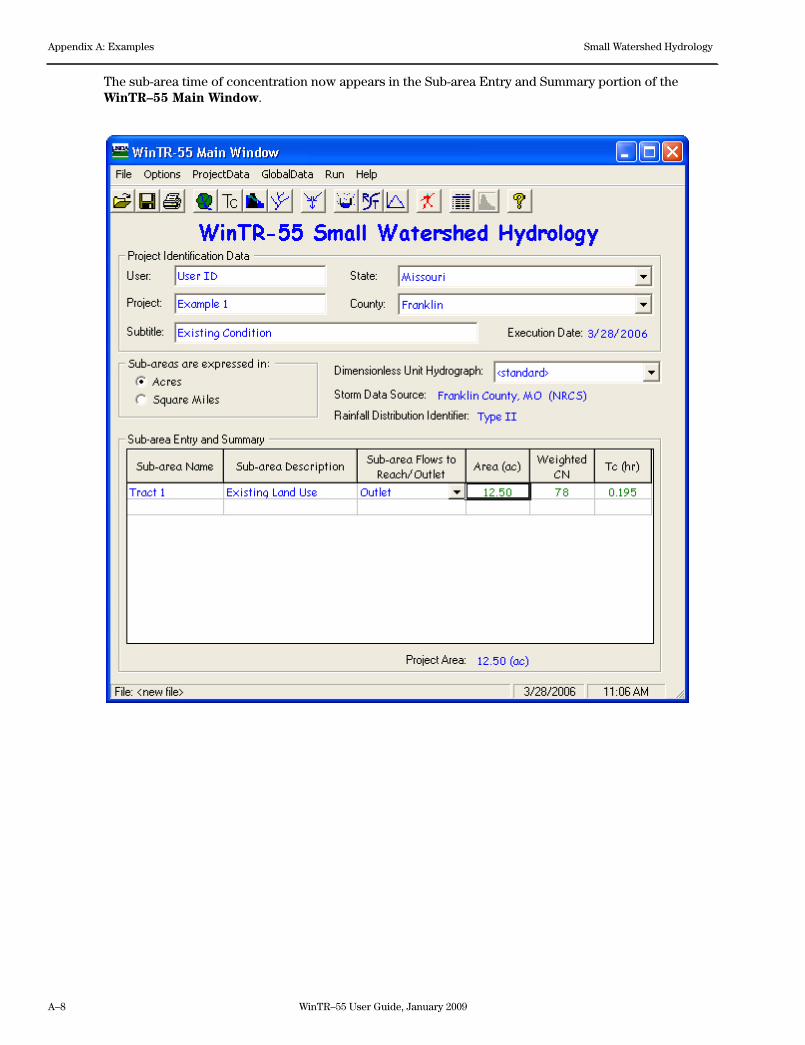
A–8 WinTR–55 User Guide, January 2009
Appendix A: Examples Small Watershed Hydrology
The sub-area time of concentration now appears in the Sub-area Entry and Summary portion of the WinTR–55 Main Window.
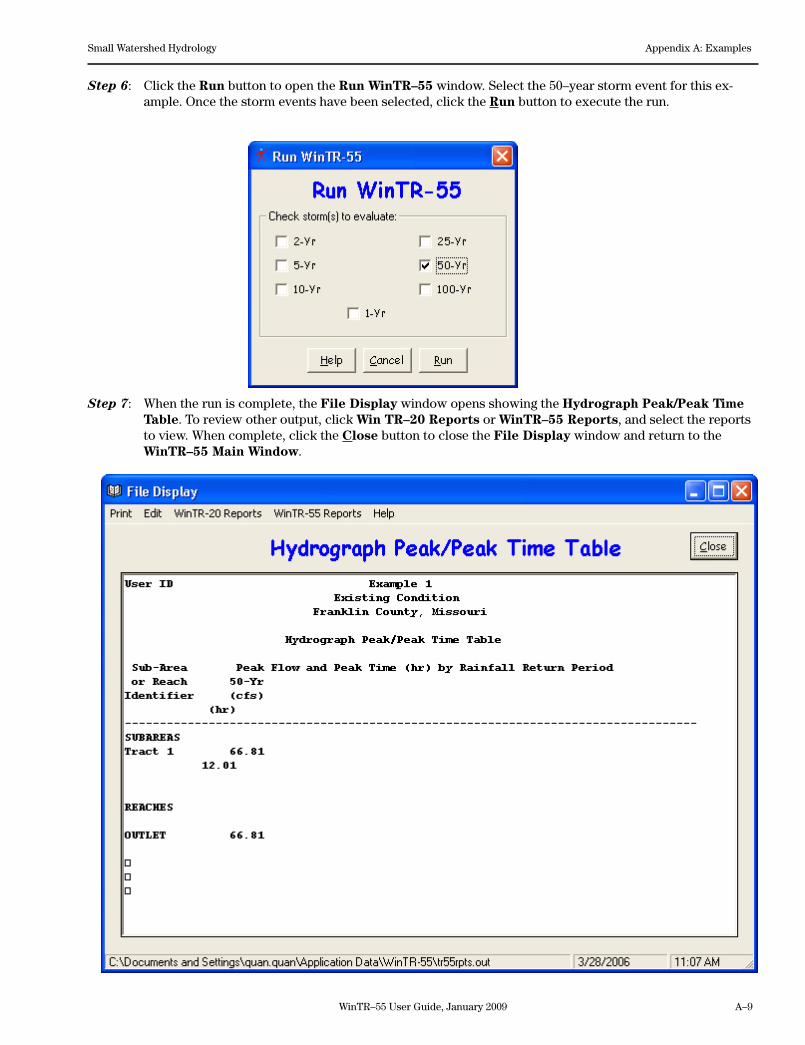
WinTR–55 User Guide, January 2009 A–9
Small Watershed Hydrology Appendix A: Examples
Step 6: Click the Run button to open the Run WinTR–55 window. Select the 50–year storm event for this ex-ample. Once the storm events have been selected, click the Run button to execute the run.
Step 7: When the run is complete, the File Display window opens showing the Hydrograph Peak/Peak Time Table. To review other output, click Win TR–20 Reports or WinTR–55 Reports, and select the reports to view. When complete, click the Close button to close the File Display window and return to the WinTR–55 Main Window.
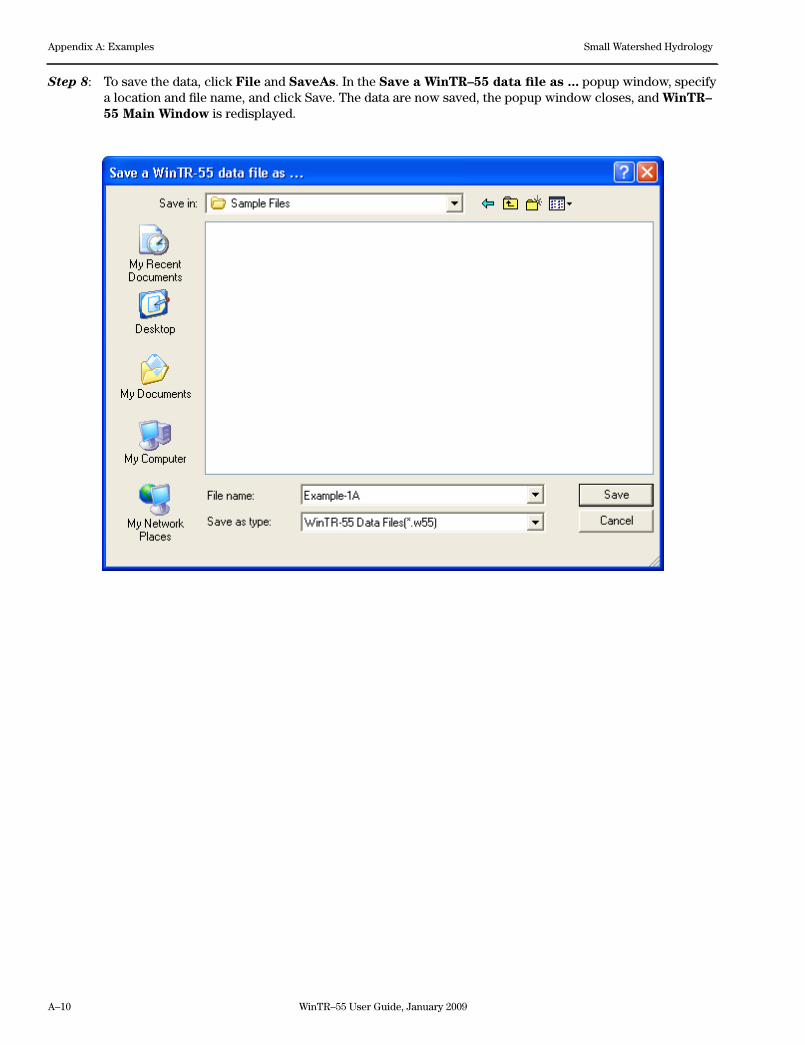
A–10 WinTR–55 User Guide, January 2009
Appendix A: Examples Small Watershed Hydrology
Step 8: To save the data, click File and SaveAs. In the Save a WinTR–55 data file as ... popup window, specify a location and file name, and click Save. The data are now saved, the popup window closes, and WinTR–55 Main Window is redisplayed.
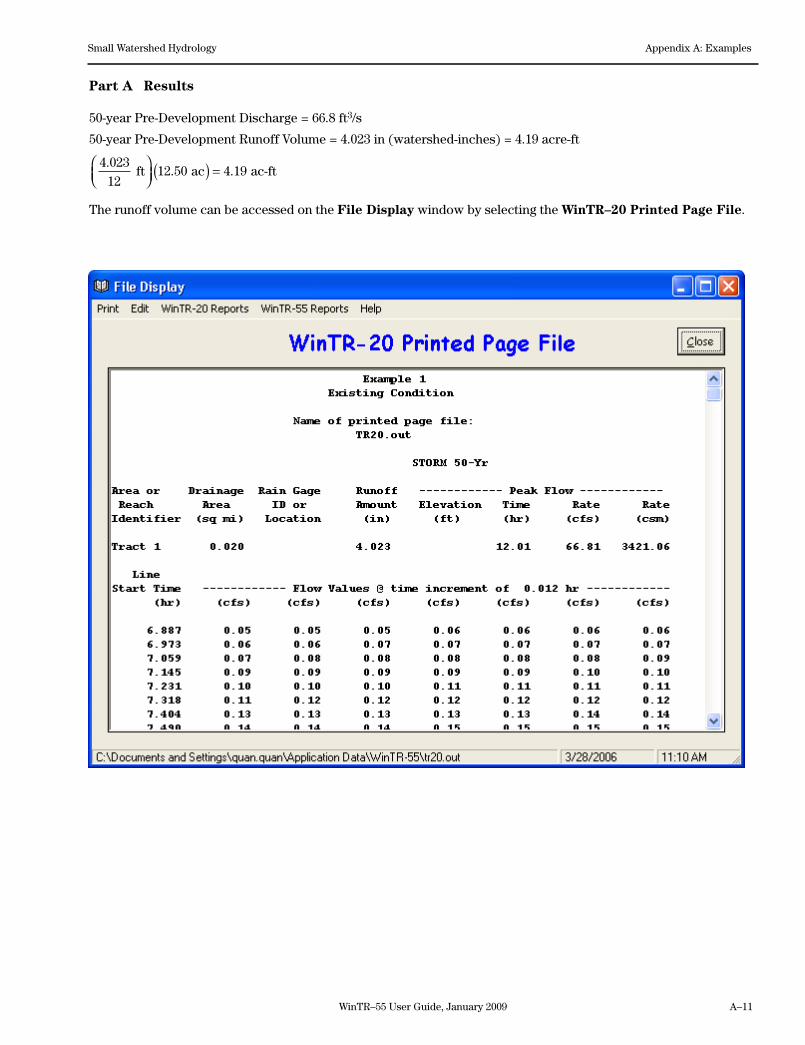
WinTR–55 User Guide, January 2009 A–11
Small Watershed Hydrology Appendix A: Examples
Part A Results
50-yearPre-DevelopmentDischarge=66.8ft3/s
50-yearPre-DevelopmentRunoffVolume=4.023in(watershed-inches)=4.19acre-ft
4 023
1212 50 4 19
.. . ft ac ac-ft
( ) =
The runoff volume can be accessed on the File Display window by selecting the WinTR–20 Printed Page File.
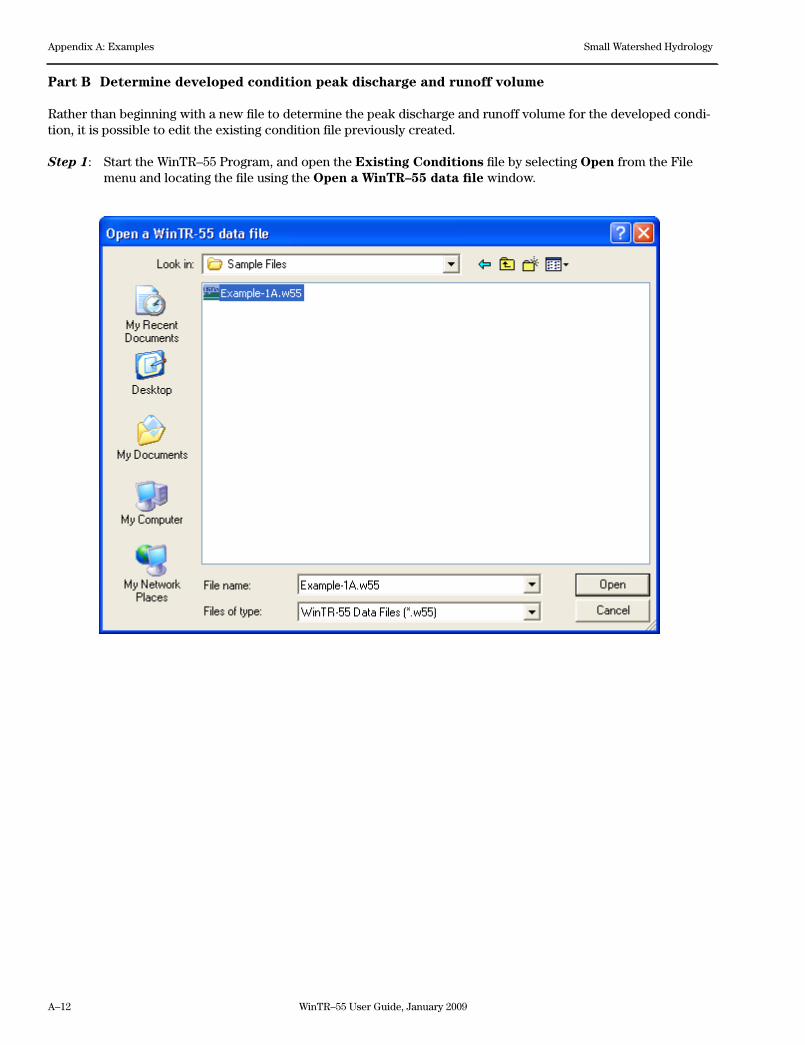
A–12 WinTR–55 User Guide, January 2009
Appendix A: Examples Small Watershed Hydrology
Part B Determine developed condition peak discharge and runoff volume
Rather than beginning with a new file to determine the peak discharge and runoff volume for the developed condi-tion, it is possible to edit the existing condition file previously created.
Step 1: Start the WinTR–55 Program, and open the Existing Conditions file by selecting Open from the File menu and locating the file using the Open a WinTR–55 data file window.
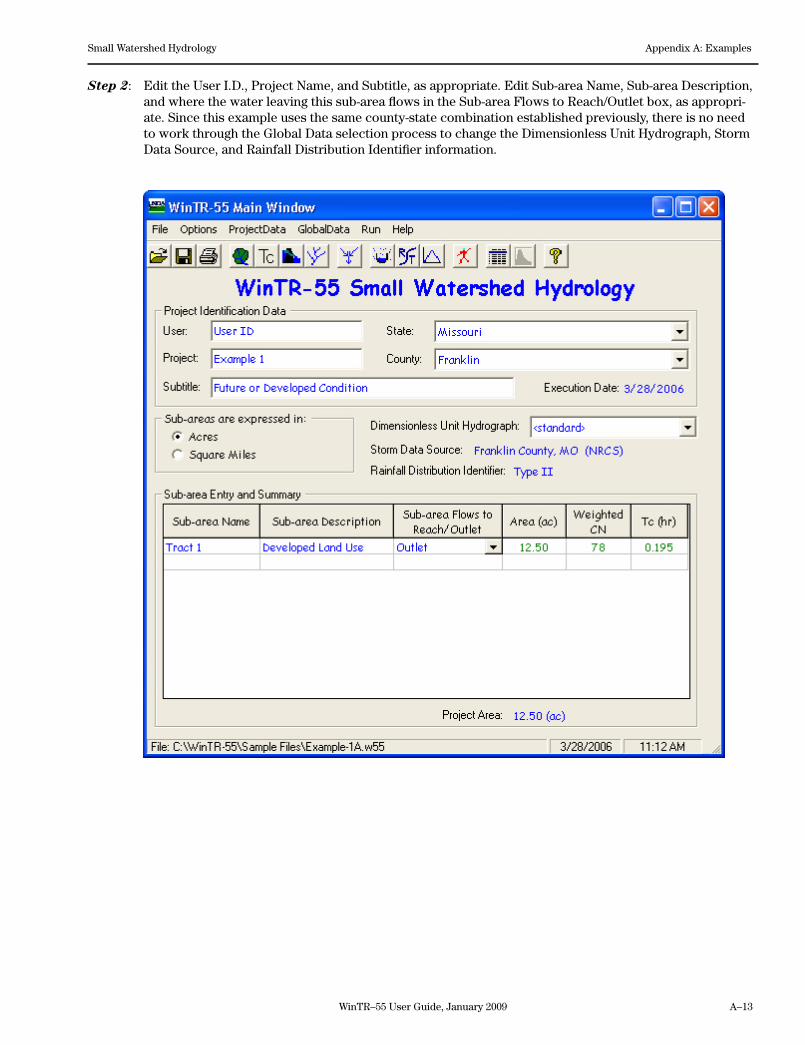
WinTR–55 User Guide, January 2009 A–13
Small Watershed Hydrology Appendix A: Examples
Step 2: Edit the User I.D., Project Name, and Subtitle, as appropriate. Edit Sub-area Name, Sub-area Description, and where the water leaving this sub-area flows in the Sub-area Flows to Reach/Outlet box, as appropri-ate. Since this example uses the same county-state combination established previously, there is no need to work through the Global Data selection process to change the Dimensionless Unit Hydrograph, Storm Data Source, and Rainfall Distribution Identifier information.
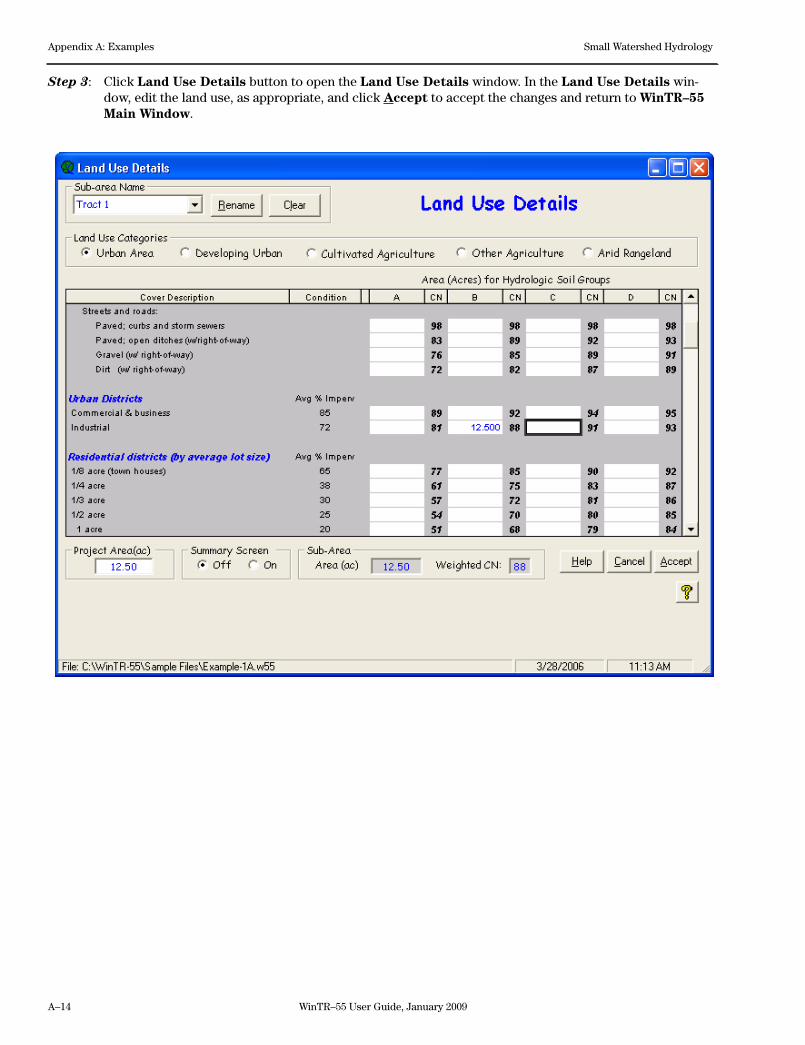
A–14 WinTR–55 User Guide, January 2009
Appendix A: Examples Small Watershed Hydrology
Step 3: Click Land Use Details button to open the Land Use Details window. In the Land Use Details win-dow, edit the land use, as appropriate, and click Accept to accept the changes and return to WinTR–55 Main Window.
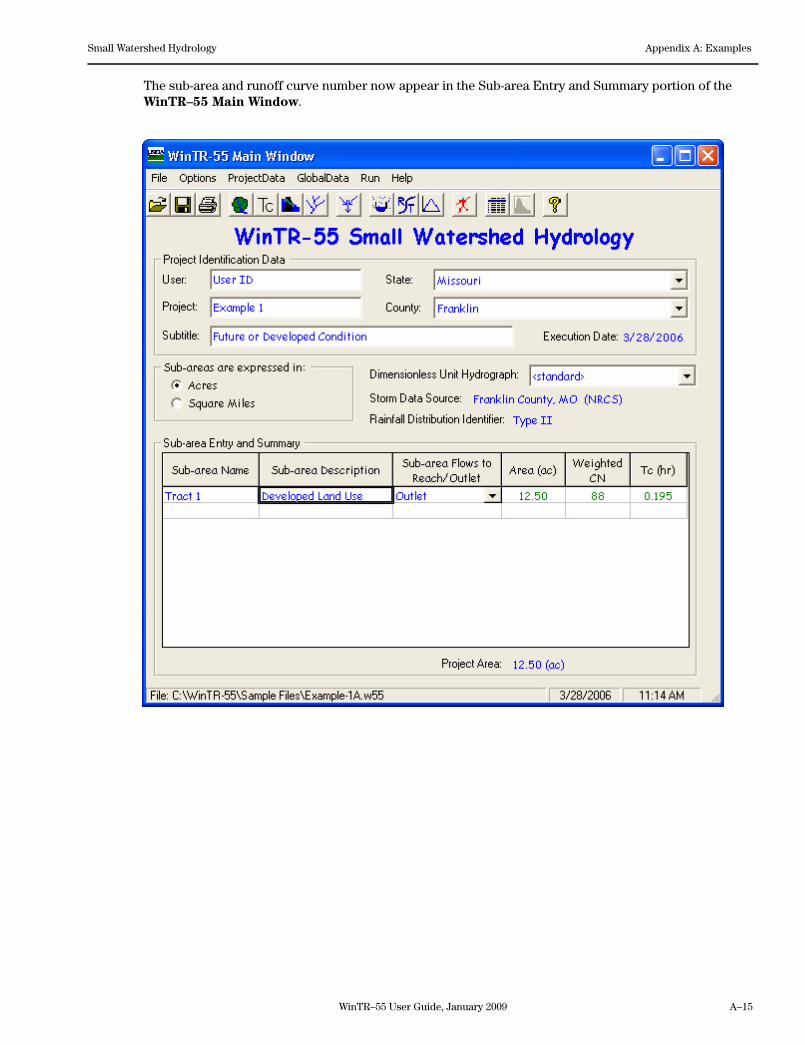
WinTR–55 User Guide, January 2009 A–15
Small Watershed Hydrology Appendix A: Examples
The sub-area and runoff curve number now appear in the Sub-area Entry and Summary portion of the WinTR–55 Main Window.
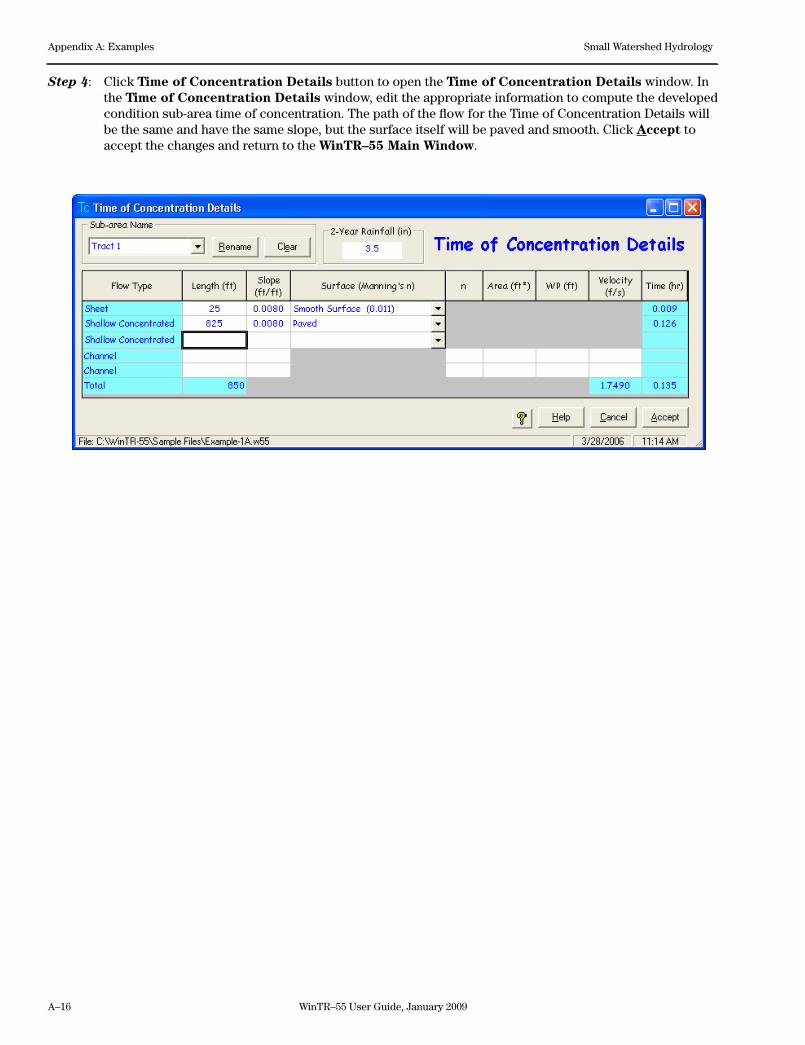
A–16 WinTR–55 User Guide, January 2009
Appendix A: Examples Small Watershed Hydrology
Step 4: Click Time of Concentration Details button to open the Time of Concentration Details window. In the Time of Concentration Details window, edit the appropriate information to compute the developed condition sub-area time of concentration. The path of the flow for the Time of Concentration Details will be the same and have the same slope, but the surface itself will be paved and smooth. Click Accept to accept the changes and return to the WinTR–55 Main Window.
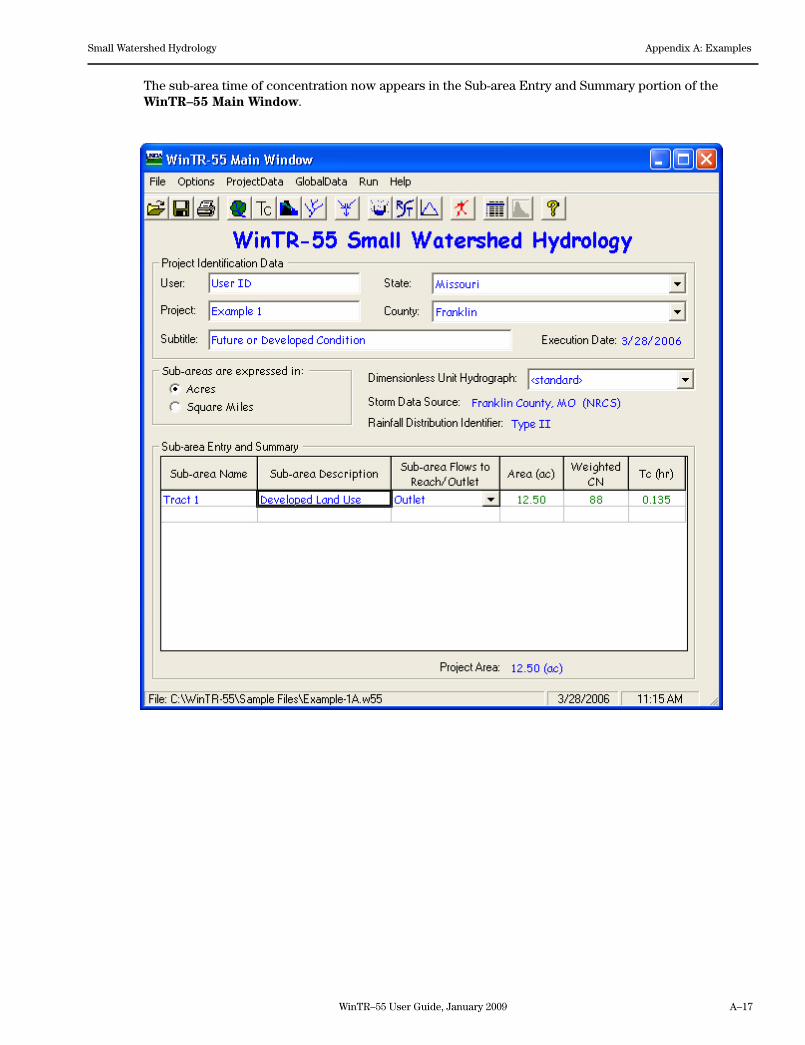
WinTR–55 User Guide, January 2009 A–17
Small Watershed Hydrology Appendix A: Examples
The sub-area time of concentration now appears in the Sub-area Entry and Summary portion of the WinTR–55 Main Window.
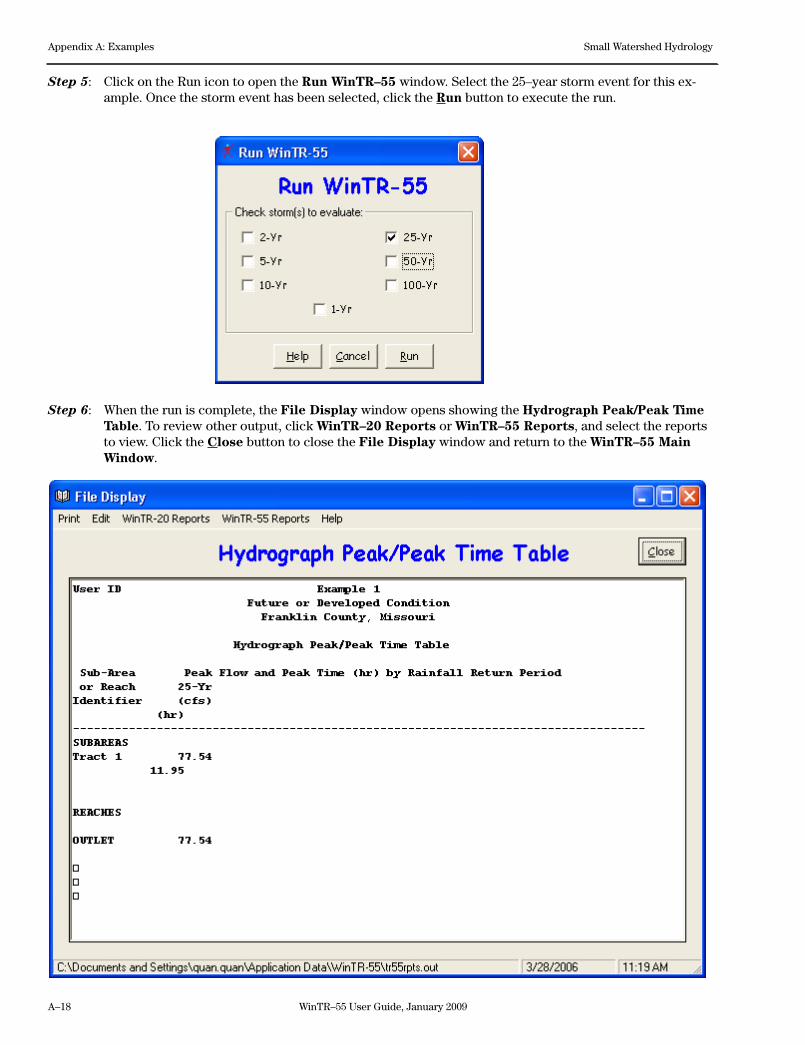
A–18 WinTR–55 User Guide, January 2009
Appendix A: Examples Small Watershed Hydrology
Step 5: Click on the Run icon to open the Run WinTR–55 window. Select the 25–year storm event for this ex-ample. Once the storm event has been selected, click the Run button to execute the run.
Step 6: When the run is complete, the File Display window opens showing the Hydrograph Peak/Peak Time Table. To review other output, click WinTR–20 Reports or WinTR–55 Reports, and select the reports to view. Click the Close button to close the File Display window and return to the WinTR–55 Main Window.
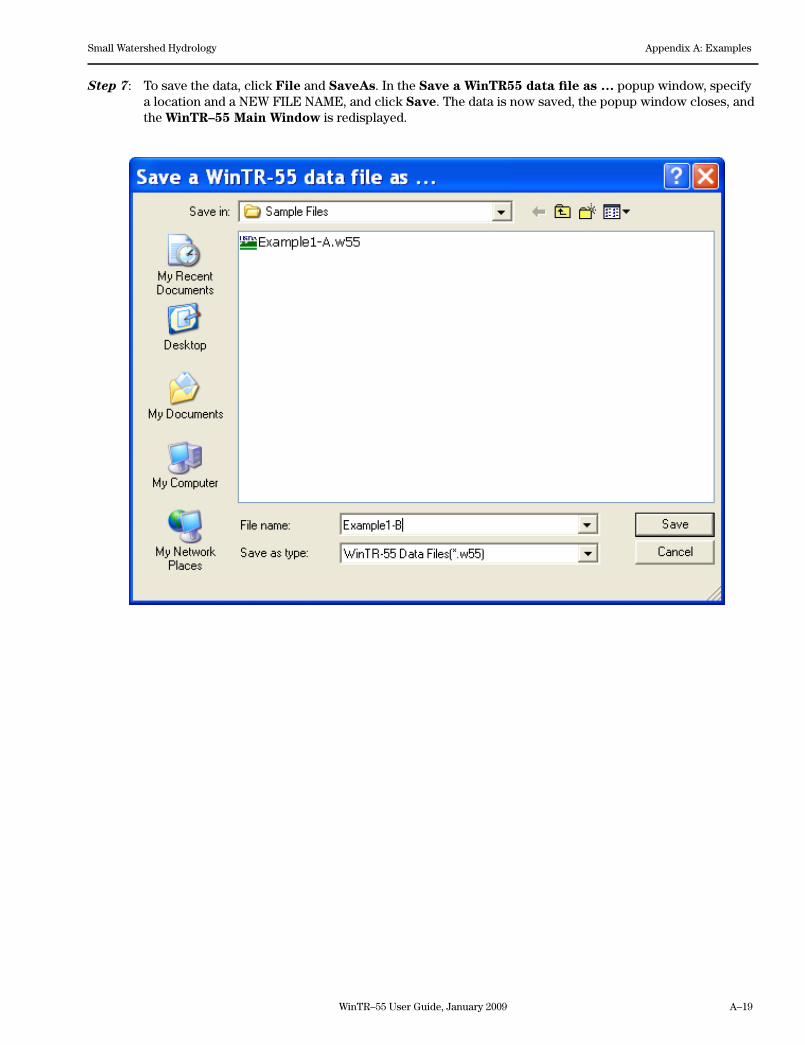
WinTR–55 User Guide, January 2009 A–19
Small Watershed Hydrology Appendix A: Examples
Step 7: To save the data, click File and SaveAs. In the Save a WinTR55 data file as … popup window, specify a location and a NEW FILE NAME, and click Save. The data is now saved, the popup window closes, and the WinTR–55 Main Window is redisplayed.
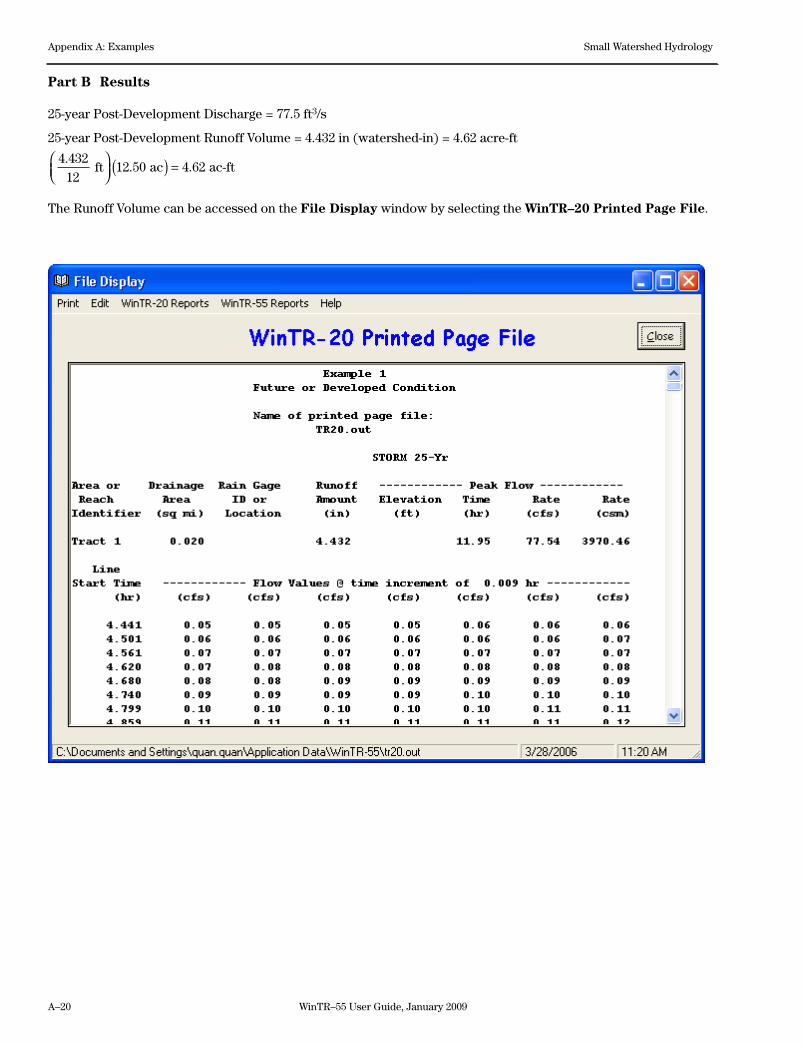
A–20 WinTR–55 User Guide, January 2009
Appendix A: Examples Small Watershed Hydrology
Part B Results
25-yearPost-DevelopmentDischarge=77.5ft3/s
25-yearPost-DevelopmentRunoffVolume=4.432in(watershed-in)=4.62acre-ft
4 432
1212 50 4 62
.. . ft ac ac-ft
( ) =
The Runoff Volume can be accessed on the File Display window by selecting the WinTR–20 Printed Page File.
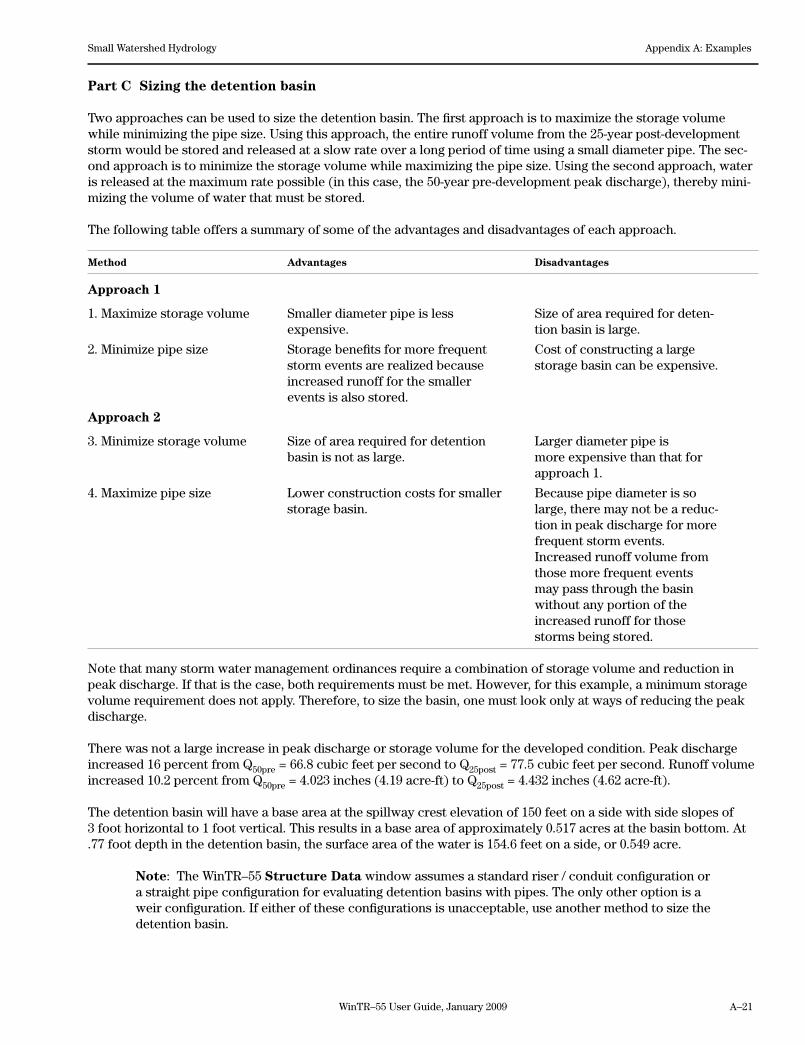
WinTR–55 User Guide, January 2009 A–21
Small Watershed Hydrology Appendix A: Examples
Part C Sizing the detention basin
Two approaches can be used to size the detention basin. The first approach is to maximize the storage volume while minimizing the pipe size. Using this approach, the entire runoff volume from the 25-year post-development storm would be stored and released at a slow rate over a long period of time using a small diameter pipe. The sec-ond approach is to minimize the storage volume while maximizing the pipe size. Using the second approach, water is released at the maximum rate possible (in this case, the 50-year pre-development peak discharge), thereby mini-mizing the volume of water that must be stored.
The following table offers a summary of some of the advantages and disadvantages of each approach.
Method Advantages Disadvantages
Approach 1
1. Maximize storage volume Smaller diameter pipe is less Size of area required for deten- expensive. tion basin is large.
2. Minimize pipe size Storage benefits for more frequent Cost of constructing a large storm events are realized because storage basin can be expensive. increased runoff for the smaller events is also stored.
Approach 2
3. Minimize storage volume Size of area required for detention Larger diameter pipe is basin is not as large. more expensive than that for approach 1.
4. Maximize pipe size Lower construction costs for smaller Because pipe diameter is so storage basin. large, there may not be a reduc- tion in peak discharge for more frequent storm events. Increased runoff volume from those more frequent events may pass through the basin without any portion of the increased runoff for those storms being stored.
Note that many storm water management ordinances require a combination of storage volume and reduction in peak discharge. If that is the case, both requirements must be met. However, for this example, a minimum storage volume requirement does not apply. Therefore, to size the basin, one must look only at ways of reducing the peak discharge.
There was not a large increase in peak discharge or storage volume for the developed condition. Peak discharge increased 16 percent from Q50pre=66.8cubicfeetpersecondtoQ25post=77.5cubicfeetpersecond.Runoffvolumeincreased 10.2 percent from Q50pre=4.023inches(4.19acre-ft)toQ25post=4.432inches(4.62acre-ft).
The detention basin will have a base area at the spillway crest elevation of 150 feet on a side with side slopes of 3 foot horizontal to 1 foot vertical. This results in a base area of approximately 0.517 acres at the basin bottom. At .77 foot depth in the detention basin, the surface area of the water is 154.6 feet on a side, or 0.549 acre.
Note: The WinTR–55 Structure Data window assumes a standard riser / conduit configuration or a straight pipe configuration for evaluating detention basins with pipes. The only other option is a weir configuration. If either of these configurations is unacceptable, use another method to size the detention basin.
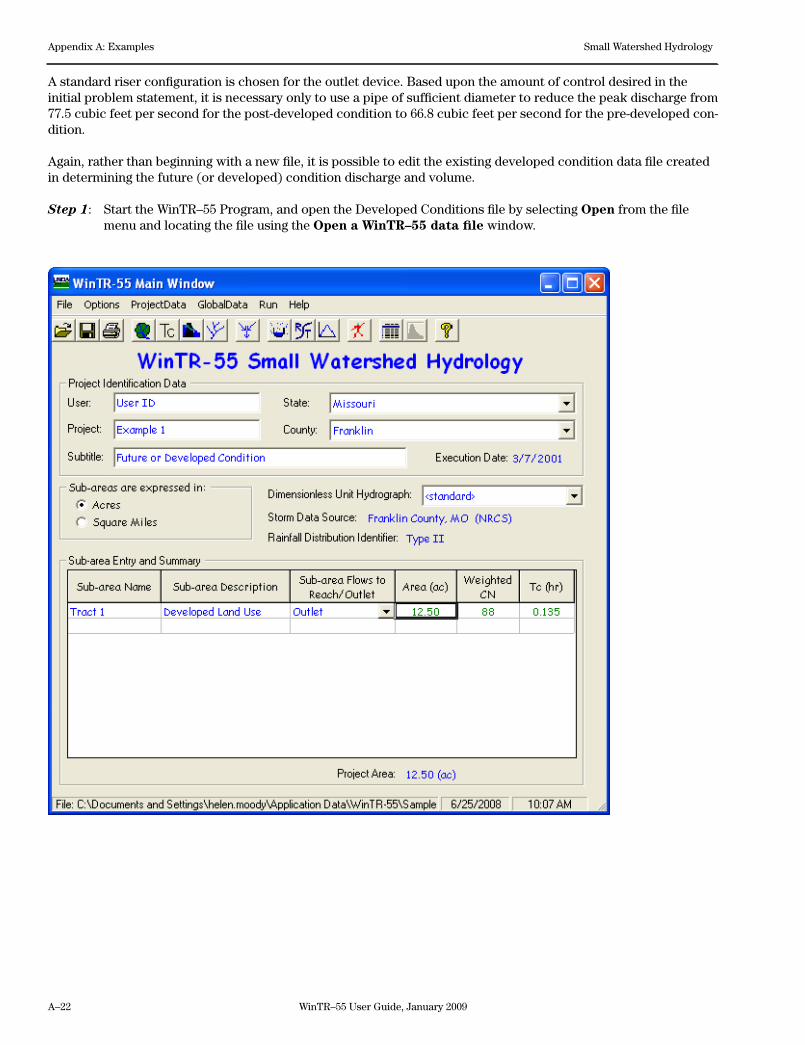
A–22 WinTR–55 User Guide, January 2009
Appendix A: Examples Small Watershed Hydrology
A standard riser configuration is chosen for the outlet device. Based upon the amount of control desired in the initial problem statement, it is necessary only to use a pipe of sufficient diameter to reduce the peak discharge from 77.5 cubic feet per second for the post-developed condition to 66.8 cubic feet per second for the pre-developed con-dition.
Again, rather than beginning with a new file, it is possible to edit the existing developed condition data file created in determining the future (or developed) condition discharge and volume.
Step 1: Start the WinTR–55 Program, and open the Developed Conditions file by selecting Open from the file menu and locating the file using the Open a WinTR–55 data file window.
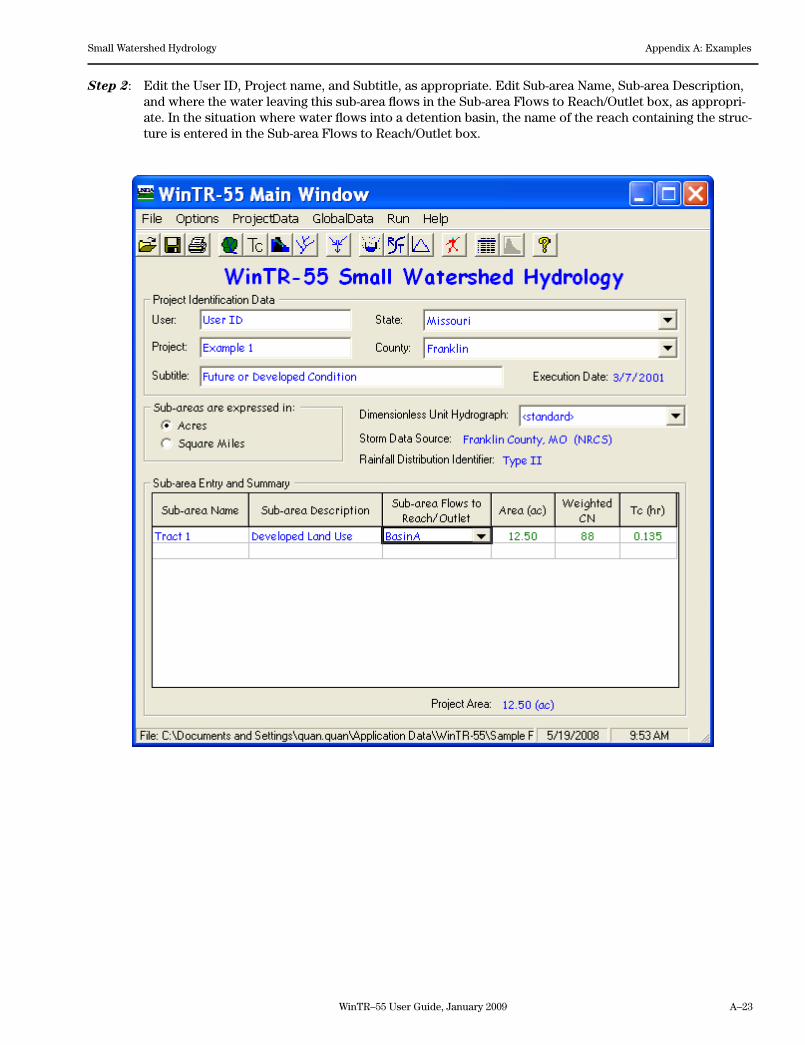
WinTR–55 User Guide, January 2009 A–23
Small Watershed Hydrology Appendix A: Examples
Step 2: Edit the User ID, Project name, and Subtitle, as appropriate. Edit Sub-area Name, Sub-area Description, and where the water leaving this sub-area flows in the Sub-area Flows to Reach/Outlet box, as appropri-ate. In the situation where water flows into a detention basin, the name of the reach containing the struc-ture is entered in the Sub-area Flows to Reach/Outlet box.
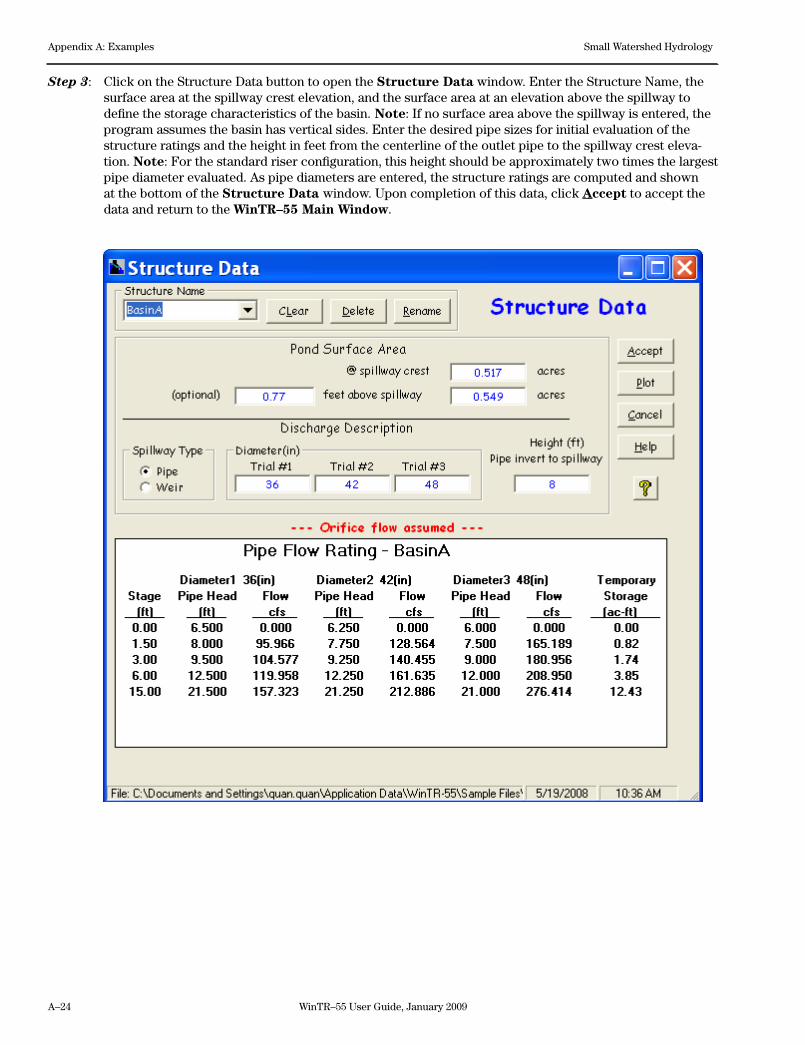
A–24 WinTR–55 User Guide, January 2009
Appendix A: Examples Small Watershed Hydrology
Step 3: Click on the Structure Data button to open the Structure Data window. Enter the Structure Name, the surface area at the spillway crest elevation, and the surface area at an elevation above the spillway to define the storage characteristics of the basin. Note: If no surface area above the spillway is entered, the program assumes the basin has vertical sides. Enter the desired pipe sizes for initial evaluation of the structure ratings and the height in feet from the centerline of the outlet pipe to the spillway crest eleva-tion. Note: For the standard riser configuration, this height should be approximately two times the largest pipe diameter evaluated. As pipe diameters are entered, the structure ratings are computed and shown at the bottom of the Structure Data window. Upon completion of this data, click Accept to accept the data and return to the WinTR–55 Main Window.
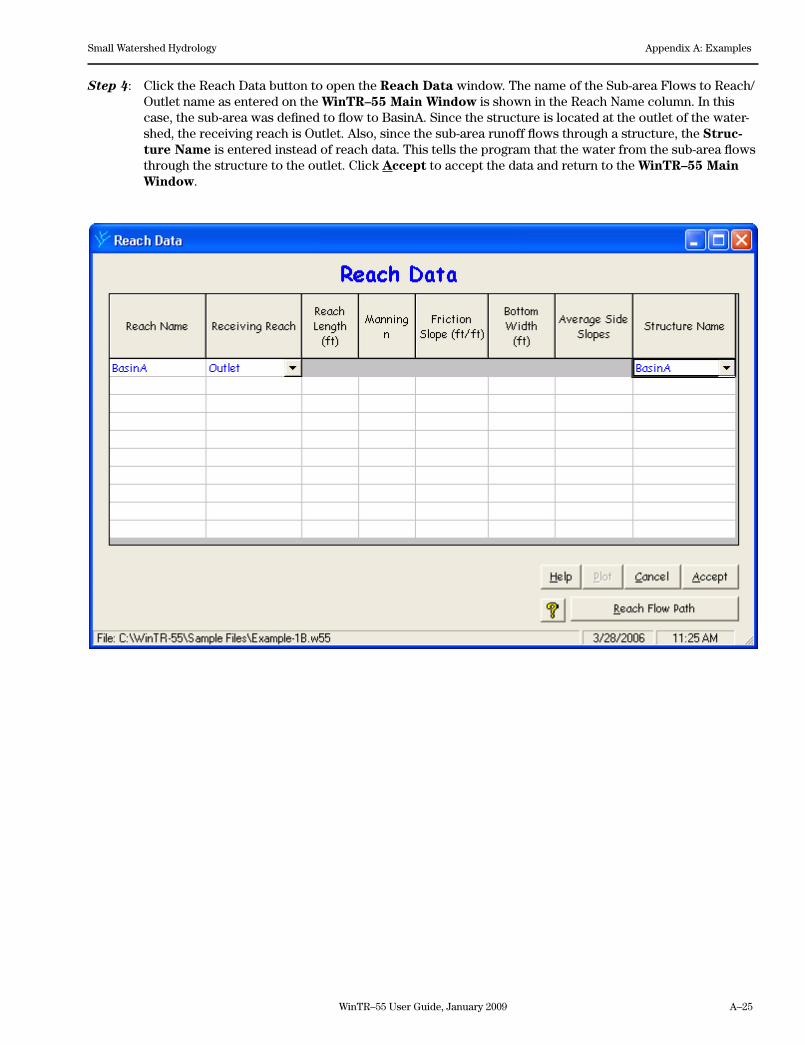
WinTR–55 User Guide, January 2009 A–25
Small Watershed Hydrology Appendix A: Examples
Step 4: Click the Reach Data button to open the Reach Data window. The name of the Sub-area Flows to Reach/Outlet name as entered on the WinTR–55 Main Window is shown in the Reach Name column. In this case, the sub-area was defined to flow to BasinA. Since the structure is located at the outlet of the water-shed, the receiving reach is Outlet. Also, since the sub-area runoff flows through a structure, the Struc-ture Name is entered instead of reach data. This tells the program that the water from the sub-area flows through the structure to the outlet. Click Accept to accept the data and return to the WinTR–55 Main Window.
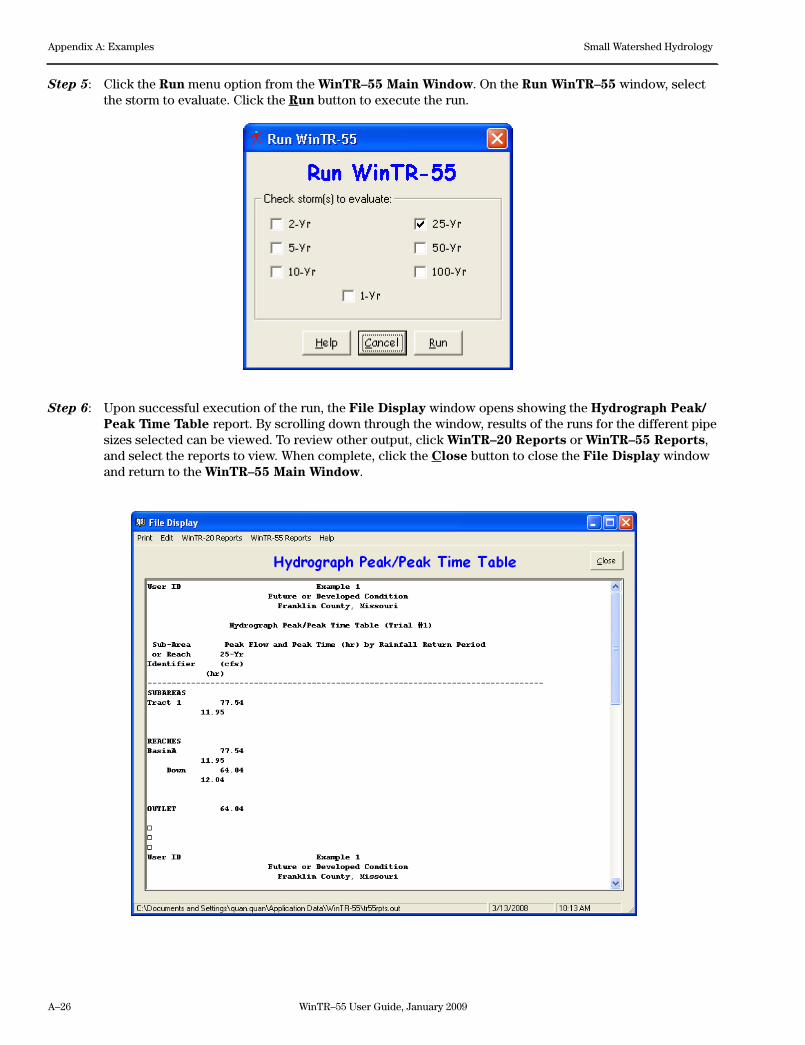
A–26 WinTR–55 User Guide, January 2009
Appendix A: Examples Small Watershed Hydrology
Step 5: Click the Run menu option from the WinTR–55 Main Window. On the Run WinTR–55 window, select the storm to evaluate. Click the Run button to execute the run.
Step 6: Upon successful execution of the run, the File Display window opens showing the Hydrograph Peak/Peak Time Table report. By scrolling down through the window, results of the runs for the different pipe sizes selected can be viewed. To review other output, click WinTR–20 Reports or WinTR–55 Reports, and select the reports to view. When complete, click the Close button to close the File Display window and return to the WinTR–55 Main Window.
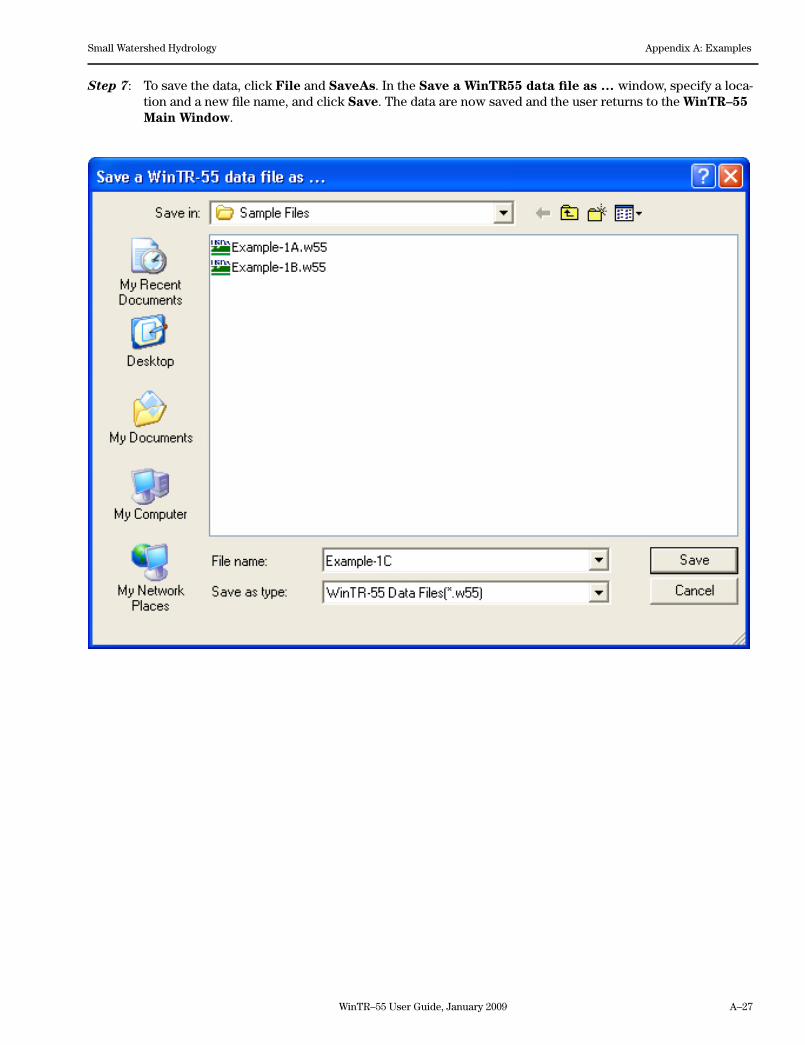
WinTR–55 User Guide, January 2009 A–27
Small Watershed Hydrology Appendix A: Examples
Step 7: To save the data, click File and SaveAs. In the Save a WinTR55 data file as … window, specify a loca-tion and a new file name, and click Save. The data are now saved and the user returns to the WinTR–55 Main Window.
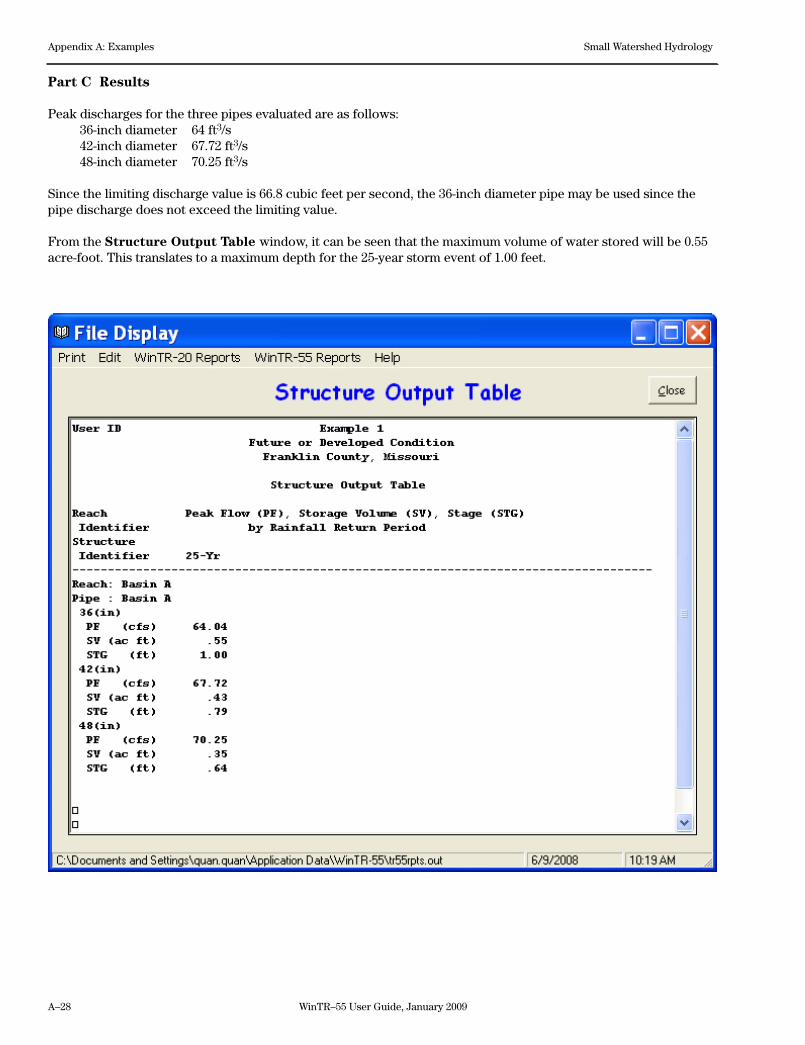
A–28 WinTR–55 User Guide, January 2009
Appendix A: Examples Small Watershed Hydrology
Part C Results
Peak discharges for the three pipes evaluated are as follows: 36-inch diameter 64 ft3/s 42-inch diameter 67.72 ft3/s 48-inch diameter 70.25 ft3/s
Since the limiting discharge value is 66.8 cubic feet per second, the 36-inch diameter pipe may be used since the pipe discharge does not exceed the limiting value.
From the Structure Output Table window, it can be seen that the maximum volume of water stored will be 0.55 acre-foot. This translates to a maximum depth for the 25-year storm event of 1.00 feet.
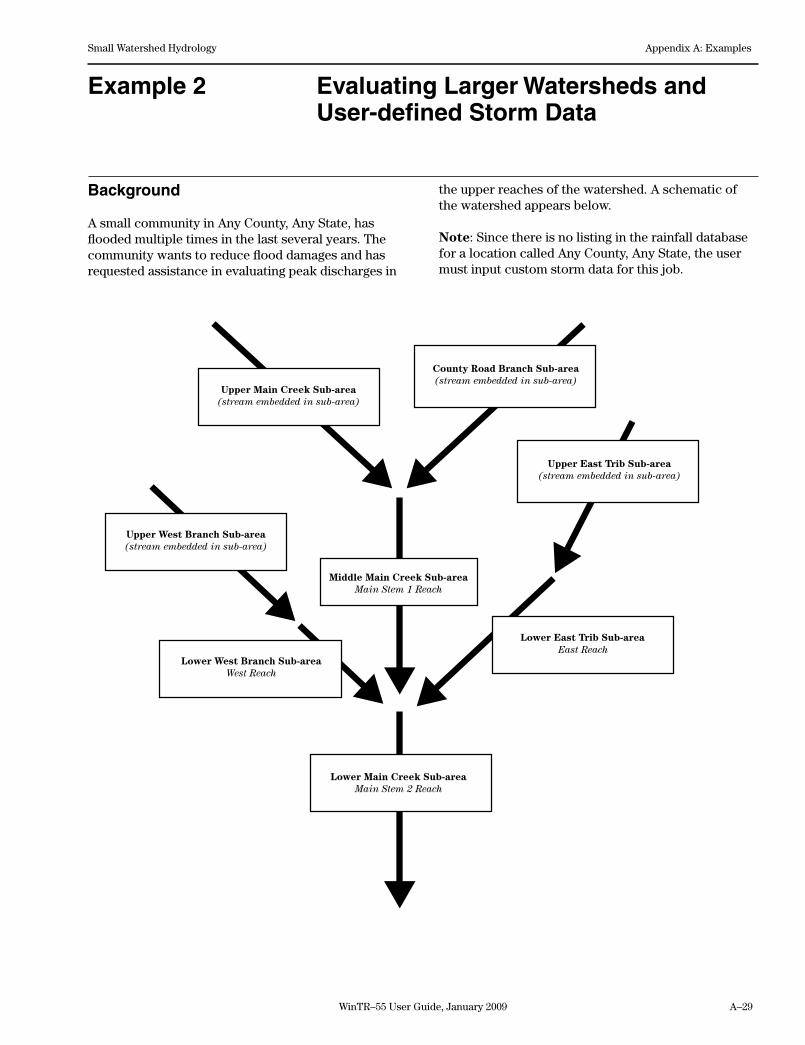
WinTR–55 User Guide, January 2009 A–29
Small Watershed Hydrology Appendix A: Examples
Example 2 Evaluating Larger Watersheds and User-defined Storm Data
Background
A small community in Any County, Any State, has flooded multiple times in the last several years. The community wants to reduce flood damages and has requested assistance in evaluating peak discharges in
the upper reaches of the watershed. A schematic of the watershed appears below.
Note: Since there is no listing in the rainfall database for a location called Any County, Any State, the user must input custom storm data for this job.
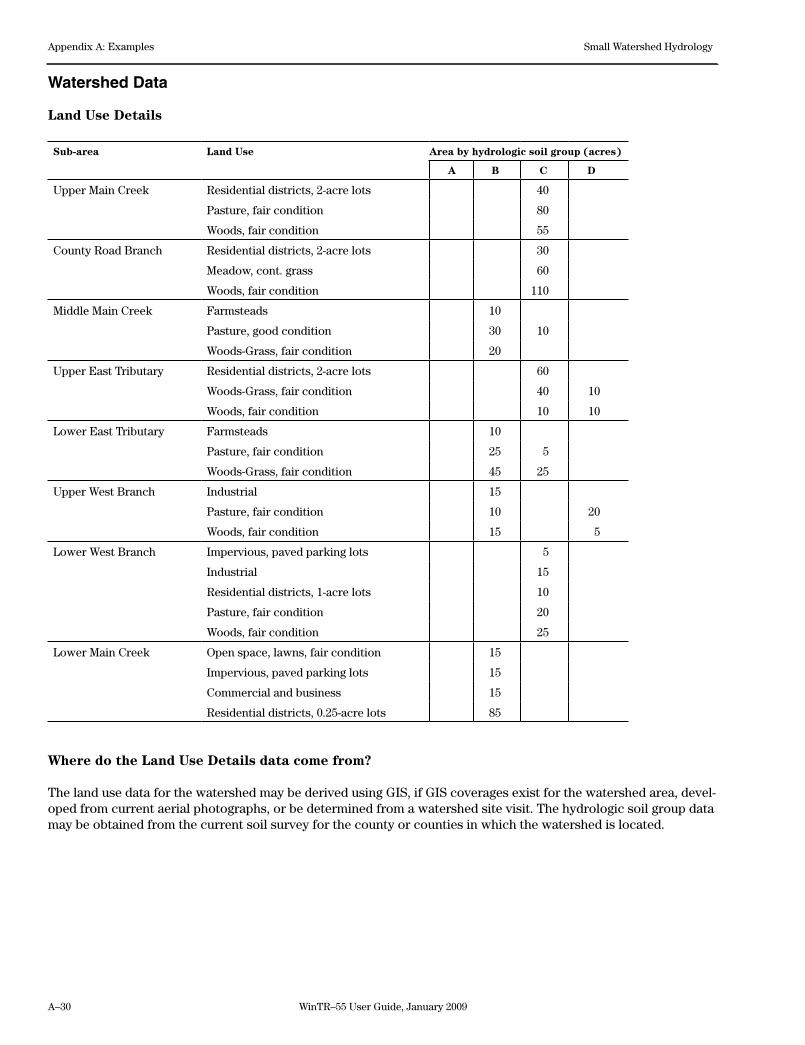
A–30 WinTR–55 User Guide, January 2009
Appendix A: Examples Small Watershed Hydrology
Watershed Data
Land Use Details
Sub-area Land Use Area by hydrologic soil group (acres)
A B C D
Upper Main Creek Residential districts, 2-acre lots 40
Pasture, fair condition 80
Woods, fair condition 55
County Road Branch Residential districts, 2-acre lots 30
Meadow, cont. grass 60
Woods, fair condition 110
Middle Main Creek Farmsteads 10
Pasture, good condition 30 10
Woods-Grass, fair condition 20
Upper East Tributary Residential districts, 2-acre lots 60
Woods-Grass, fair condition 40 10
Woods, fair condition 10 10
Lower East Tributary Farmsteads 10
Pasture, fair condition 25 5
Woods-Grass, fair condition 45 25
Upper West Branch Industrial 15
Pasture, fair condition 10 20
Woods, fair condition 15 5
Lower West Branch Impervious, paved parking lots 5
Industrial 15
Residential districts, 1-acre lots 10
Pasture, fair condition 20
Woods, fair condition 25
Lower Main Creek Open space, lawns, fair condition 15
Impervious, paved parking lots 15
Commercial and business 15
Residential districts, 0.25-acre lots 85
Where do the Land Use Details data come from?
The land use data for the watershed may be derived using GIS, if GIS coverages exist for the watershed area, devel-oped from current aerial photographs, or be determined from a watershed site visit. The hydrologic soil group data may be obtained from the current soil survey for the county or counties in which the watershed is located.
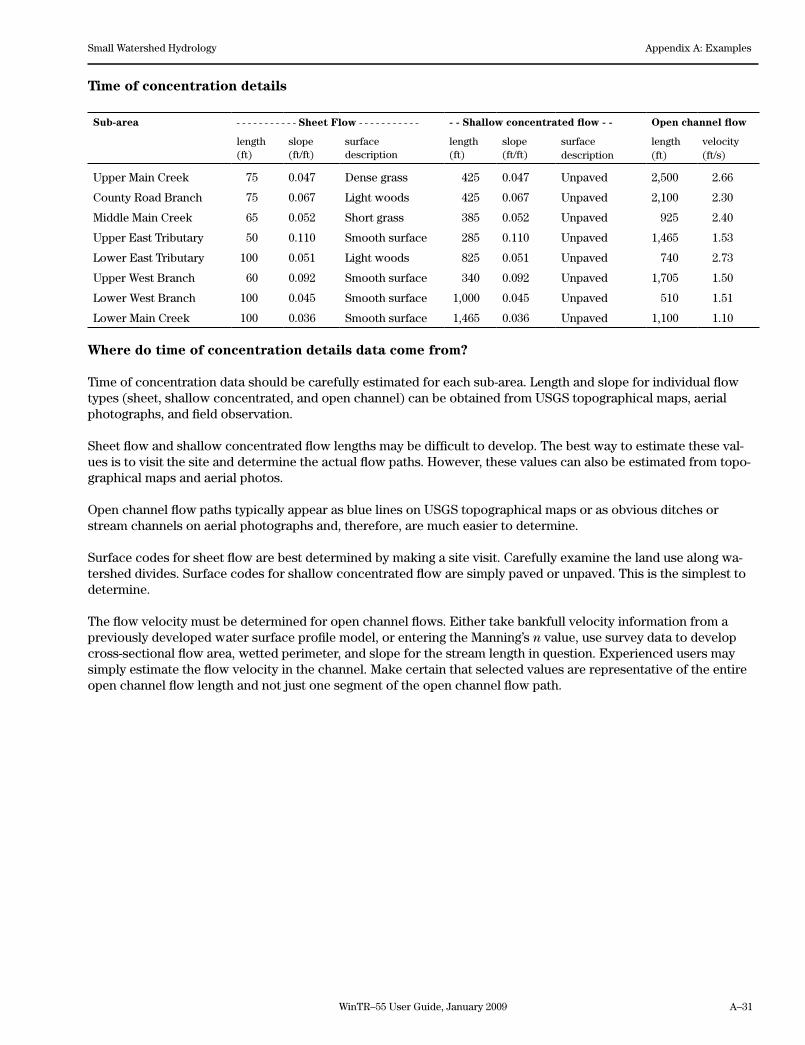
WinTR–55 User Guide, January 2009 A–31
Small Watershed Hydrology Appendix A: Examples
Time of concentration details
Sub-area - - - - - - - - - - - Sheet Flow - - - - - - - - - - - - - Shallow concentrated flow - - Open channel flow
length (ft)
slope (ft/ft)
surface description
length (ft)
slope (ft/ft)
surface length velocity description (ft) (ft/s)
Upper Main Creek 75 0.047 Dense grass 425 0.047 Unpaved 2,500 2.66
County Road Branch 75 0.067 Light woods 425 0.067 Unpaved 2,100 2.30
Middle Main Creek 65 0.052 Short grass 385 0.052 Unpaved 925 2.40
Upper East Tributary 50 0.110 Smooth surface 285 0.110 Unpaved 1,465 1.53
Lower East Tributary 100 0.051 Light woods 825 0.051 Unpaved 740 2.73
Upper West Branch 60 0.092 Smooth surface 340 0.092 Unpaved 1,705 1.50
Lower West Branch 100 0.045 Smooth surface 1,000 0.045 Unpaved 510 1.51
Lower Main Creek 100 0.036 Smooth surface 1,465 0.036 Unpaved 1,100 1.10
Where do time of concentration details data come from?
Time of concentration data should be carefully estimated for each sub-area. Length and slope for individual flow types (sheet, shallow concentrated, and open channel) can be obtained from USGS topographical maps, aerial photographs, and field observation.
Sheet flow and shallow concentrated flow lengths may be difficult to develop. The best way to estimate these val-ues is to visit the site and determine the actual flow paths. However, these values can also be estimated from topo-graphical maps and aerial photos.
Open channel flow paths typically appear as blue lines on USGS topographical maps or as obvious ditches or stream channels on aerial photographs and, therefore, are much easier to determine.
Surface codes for sheet flow are best determined by making a site visit. Carefully examine the land use along wa-tershed divides. Surface codes for shallow concentrated flow are simply paved or unpaved. This is the simplest to determine.
The flow velocity must be determined for open channel flows. Either take bankfull velocity information from a previously developed water surface profile model, or entering the Manning’s n value, use survey data to develop cross-sectional flow area, wetted perimeter, and slope for the stream length in question. Experienced users may simply estimate the flow velocity in the channel. Make certain that selected values are representative of the entire open channel flow length and not just one segment of the open channel flow path.
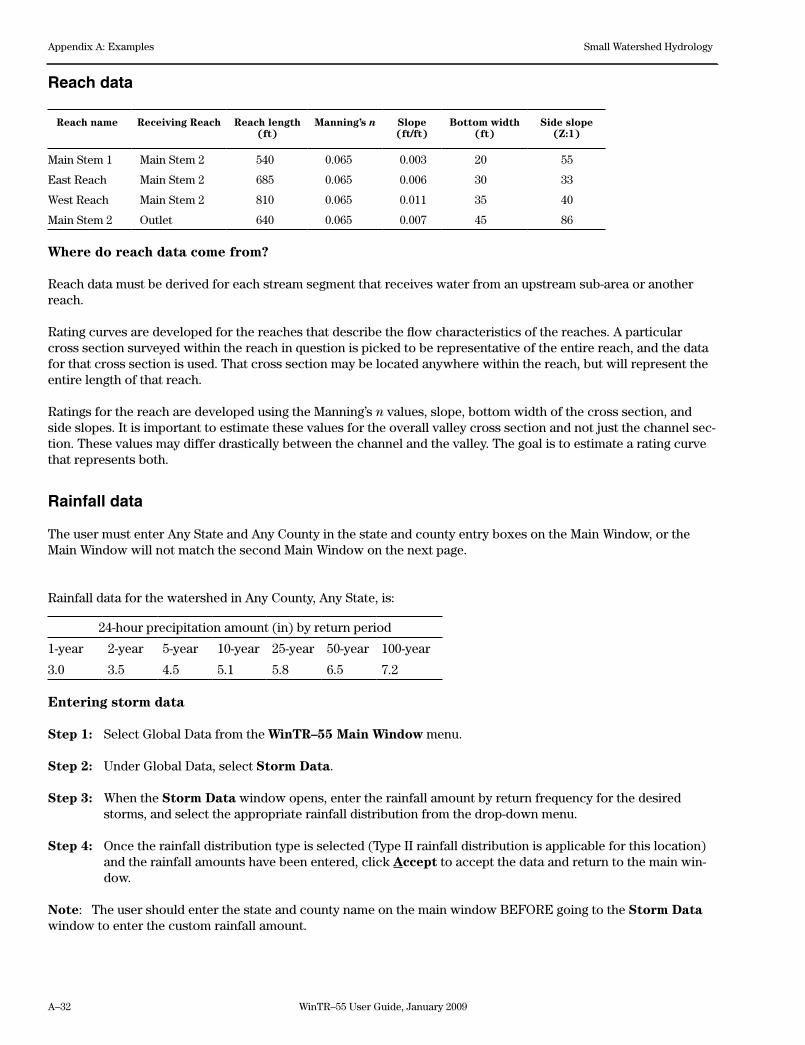
A–32 WinTR–55 User Guide, January 2009
Appendix A: Examples Small Watershed Hydrology
Reach data
Reach name Receiving Reach Reach length (ft)
Manning’s n Slope (ft/ft)
Bottom width (ft)
Side slope (Z:1)
Main Stem 1 Main Stem 2 540 0.065 0.003 20 55
East Reach Main Stem 2 685 0.065 0.006 30 33
West Reach Main Stem 2 810 0.065 0.011 35 40
Main Stem 2 Outlet 640 0.065 0.007 45 86
Where do reach data come from?
Reach data must be derived for each stream segment that receives water from an upstream sub-area or another reach.
Rating curves are developed for the reaches that describe the flow characteristics of the reaches. A particular cross section surveyed within the reach in question is picked to be representative of the entire reach, and the data for that cross section is used. That cross section may be located anywhere within the reach, but will represent the entire length of that reach.
Ratings for the reach are developed using the Manning’s n values, slope, bottom width of the cross section, and side slopes. It is important to estimate these values for the overall valley cross section and not just the channel sec-tion. These values may differ drastically between the channel and the valley. The goal is to estimate a rating curve that represents both.
Rainfall data
The user must enter Any State and Any County in the state and county entry boxes on the Main Window, or the Main Window will not match the second Main Window on the next page.
Rainfall data for the watershed in Any County, Any State, is:
24-hour precipitation amount (in) by return period
1-year 2-year 5-year 10-year 25-year 50-year 100-year
3.0 3.5 4.5 5.1 5.8 6.5 7.2
Entering storm data
Step 1: Select Global Data from the WinTR–55 Main Window menu.
Step 2: Under Global Data, select Storm Data.
Step 3: When the Storm Data window opens, enter the rainfall amount by return frequency for the desired storms, and select the appropriate rainfall distribution from the drop-down menu.
Step 4: Once the rainfall distribution type is selected (Type II rainfall distribution is applicable for this location) and the rainfall amounts have been entered, click Accept to accept the data and return to the main win-dow.
Note: The user should enter the state and county name on the main window BEFORE going to the Storm Data window to enter the custom rainfall amount.
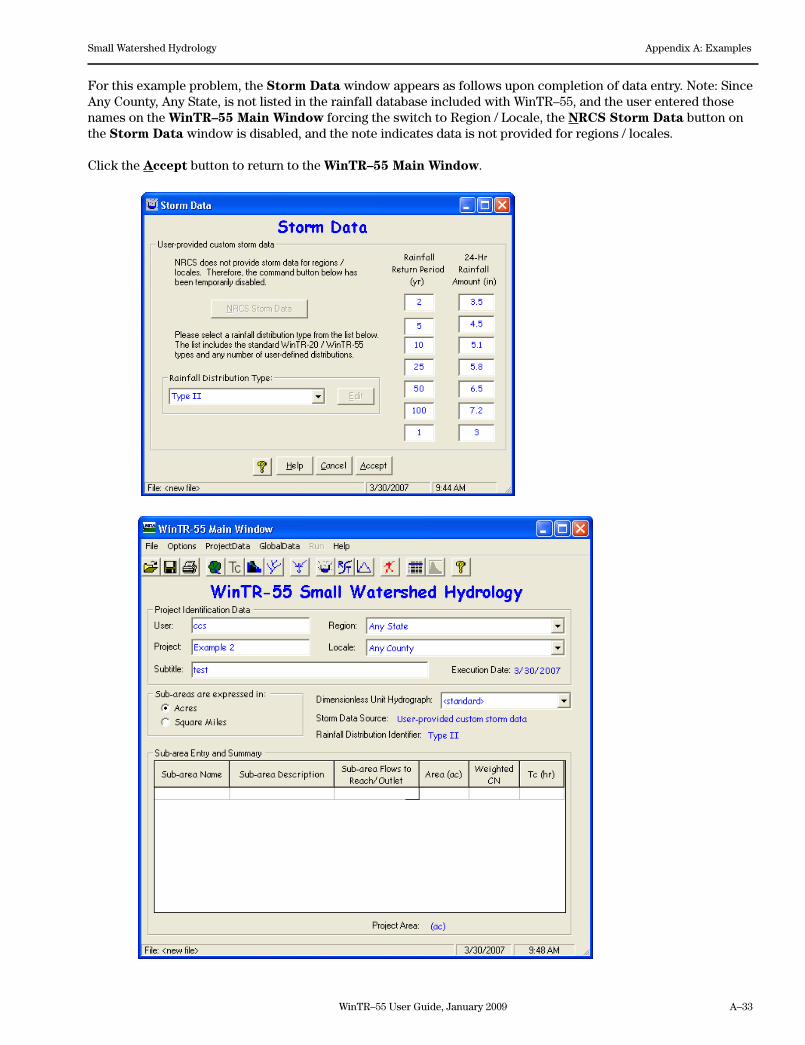
WinTR–55 User Guide, January 2009 A–33
Small Watershed Hydrology Appendix A: Examples
For this example problem, the Storm Data window appears as follows upon completion of data entry. Note: Since Any County, Any State, is not listed in the rainfall database included with WinTR–55, and the user entered those names on the WinTR–55 Main Window forcing the switch to Region / Locale, the NRCS Storm Data button on the Storm Data window is disabled, and the note indicates data is not provided for regions / locales.
Click the Accept button to return to the WinTR–55 Main Window.
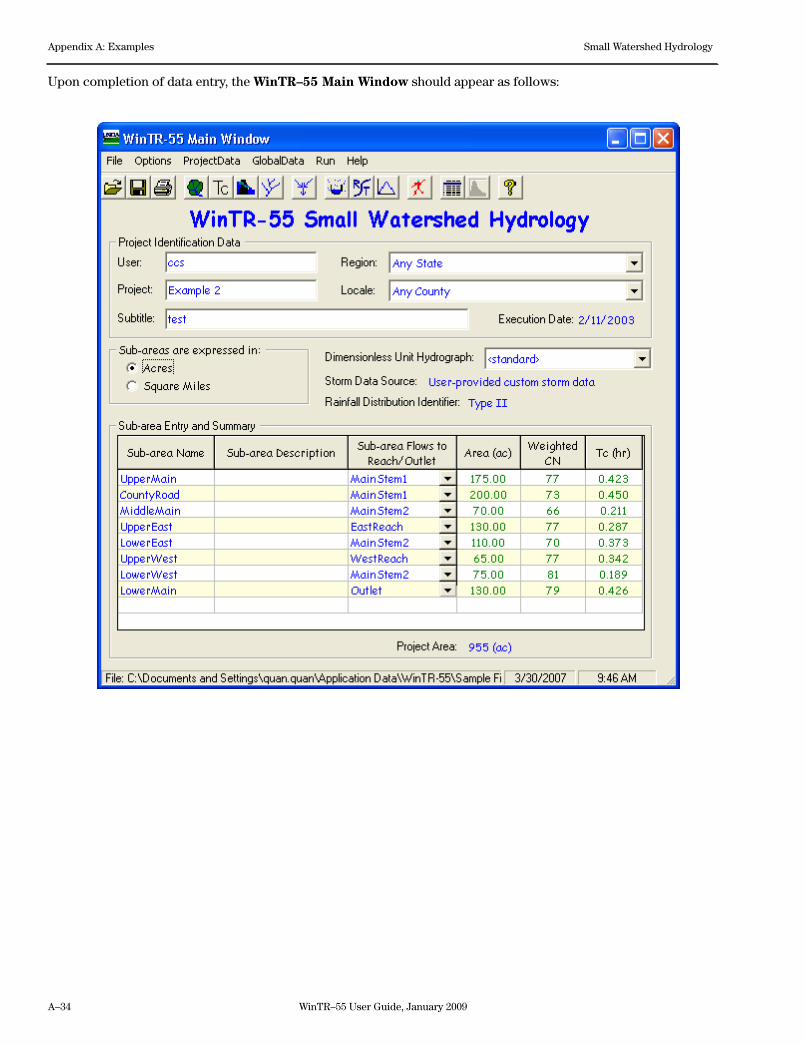
A–34 WinTR–55 User Guide, January 2009
Appendix A: Examples Small Watershed Hydrology
Upon completion of data entry, the WinTR–55 Main Window should appear as follows:
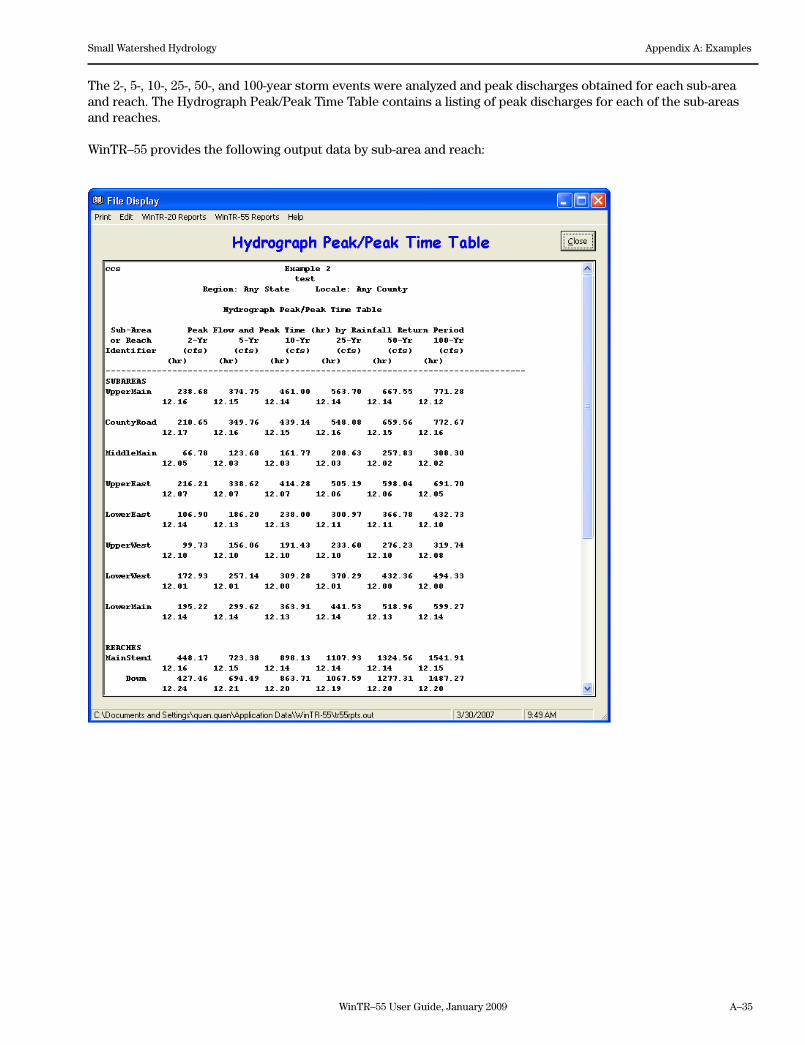
WinTR–55 User Guide, January 2009 A–35
Small Watershed Hydrology Appendix A: Examples
The 2-, 5-, 10-, 25-, 50-, and 100-year storm events were analyzed and peak discharges obtained for each sub-area and reach. The Hydrograph Peak/Peak Time Table contains a listing of peak discharges for each of the sub-areas and reaches.
WinTR–55 provides the following output data by sub-area and reach:
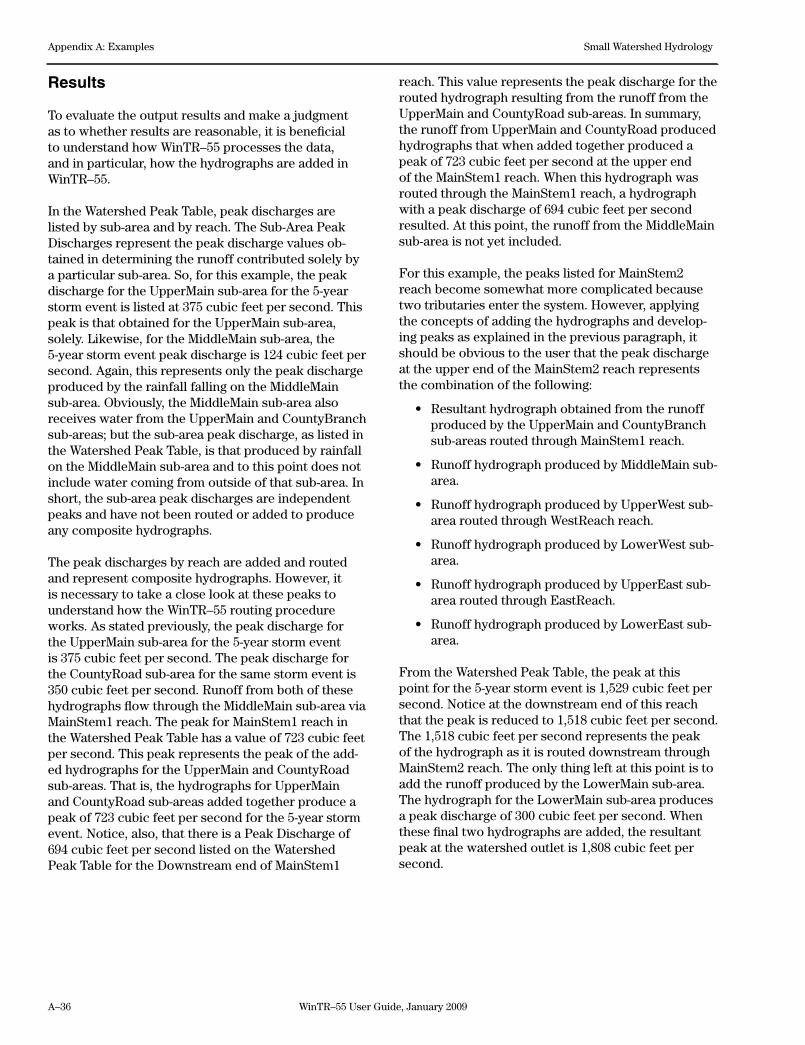
A–36 WinTR–55 User Guide, January 2009
Appendix A: Examples Small Watershed Hydrology
Results
To evaluate the output results and make a judgment as to whether results are reasonable, it is beneficial to understand how WinTR–55 processes the data, and in particular, how the hydrographs are added in WinTR–55.
In the Watershed Peak Table, peak discharges are listed by sub-area and by reach. The Sub-Area Peak Discharges represent the peak discharge values ob-tained in determining the runoff contributed solely by a particular sub-area. So, for this example, the peak discharge for the UpperMain sub-area for the 5-year storm event is listed at 375 cubic feet per second. This peak is that obtained for the UpperMain sub-area, solely. Likewise, for the MiddleMain sub-area, the 5-year storm event peak discharge is 124 cubic feet per second. Again, this represents only the peak discharge produced by the rainfall falling on the MiddleMain sub-area. Obviously, the MiddleMain sub-area also receives water from the UpperMain and CountyBranch sub-areas; but the sub-area peak discharge, as listed in the Watershed Peak Table, is that produced by rainfall on the MiddleMain sub-area and to this point does not include water coming from outside of that sub-area. In short, the sub-area peak discharges are independent peaks and have not been routed or added to produce any composite hydrographs.
The peak discharges by reach are added and routed and represent composite hydrographs. However, it is necessary to take a close look at these peaks to understand how the WinTR–55 routing procedure works. As stated previously, the peak discharge for the UpperMain sub-area for the 5-year storm event is 375 cubic feet per second. The peak discharge for the CountyRoad sub-area for the same storm event is 350 cubic feet per second. Runoff from both of these hydrographs flow through the MiddleMain sub-area via MainStem1 reach. The peak for MainStem1 reach in the Watershed Peak Table has a value of 723 cubic feet per second. This peak represents the peak of the add-ed hydrographs for the UpperMain and CountyRoad sub-areas. That is, the hydrographs for UpperMain and CountyRoad sub-areas added together produce a peak of 723 cubic feet per second for the 5-year storm event. Notice, also, that there is a Peak Discharge of 694 cubic feet per second listed on the Watershed Peak Table for the Downstream end of MainStem1
reach. This value represents the peak discharge for the routed hydrograph resulting from the runoff from the UpperMain and CountyRoad sub-areas. In summary, the runoff from UpperMain and CountyRoad produced hydrographs that when added together produced a peak of 723 cubic feet per second at the upper end of the MainStem1 reach. When this hydrograph was routed through the MainStem1 reach, a hydrograph with a peak discharge of 694 cubic feet per second resulted. At this point, the runoff from the MiddleMain sub-area is not yet included.
For this example, the peaks listed for MainStem2 reach become somewhat more complicated because two tributaries enter the system. However, applying the concepts of adding the hydrographs and develop-ing peaks as explained in the previous paragraph, it should be obvious to the user that the peak discharge at the upper end of the MainStem2 reach represents the combination of the following:
• Resultanthydrographobtainedfromtherunoffproduced by the UpperMain and CountyBranch sub-areas routed through MainStem1 reach.
• RunoffhydrographproducedbyMiddleMainsub-area.
• RunoffhydrographproducedbyUpperWestsub-area routed through WestReach reach.
• RunoffhydrographproducedbyLowerWestsub-area.
• RunoffhydrographproducedbyUpperEastsub-area routed through EastReach.
• RunoffhydrographproducedbyLowerEastsub-area.
From the Watershed Peak Table, the peak at this point for the 5-year storm event is 1,529 cubic feet per second. Notice at the downstream end of this reach that the peak is reduced to 1,518 cubic feet per second. The 1,518 cubic feet per second represents the peak of the hydrograph as it is routed downstream through MainStem2 reach. The only thing left at this point is to add the runoff produced by the LowerMain sub-area. The hydrograph for the LowerMain sub-area produces a peak discharge of 300 cubic feet per second. When these final two hydrographs are added, the resultant peak at the watershed outlet is 1,808 cubic feet per second.
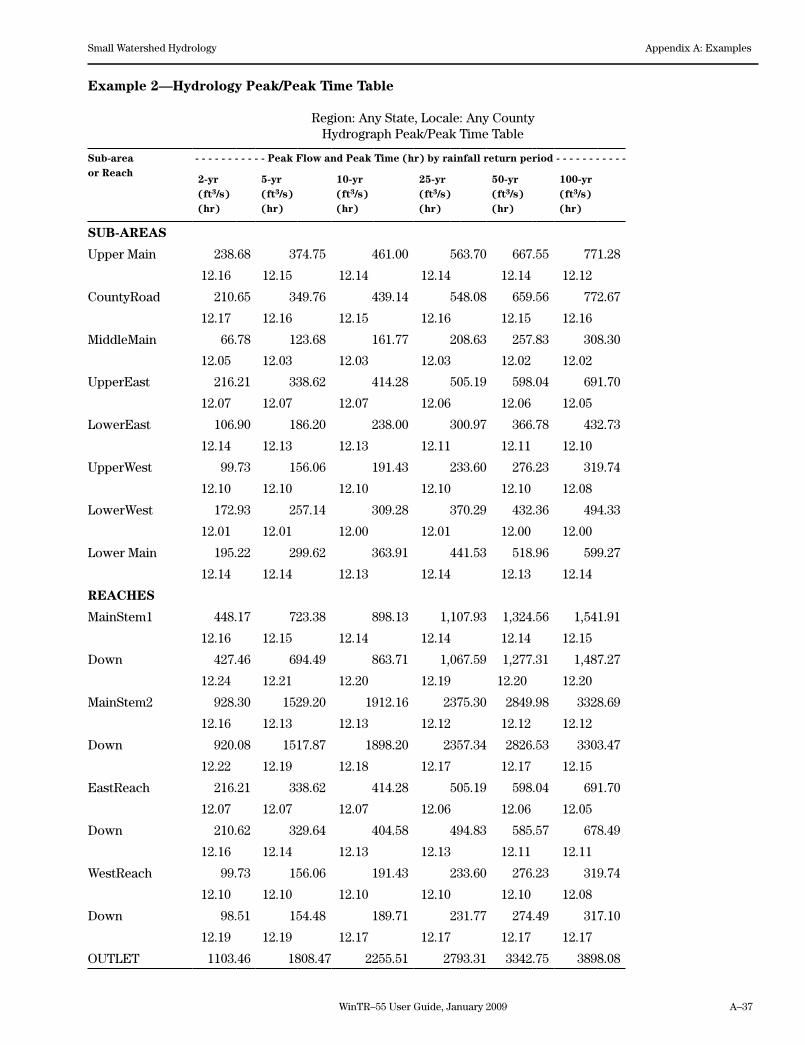
WinTR–55 User Guide, January 2009 A–37
Small Watershed Hydrology Appendix A: Examples
Example 2—Hydrology Peak/Peak Time Table
Region: Any State, Locale: Any CountyHydrograph Peak/Peak Time Table
Sub-areaor Reach
- - - - - - - - - - - Peak Flow and Peak Time (hr) by rainfall return period - - - - - - - - - - -
2-yr(ft3/s)(hr)
5-yr(ft3/s)(hr)
10-yr(ft3/s)(hr)
25-yr(ft3/s)(hr)
50-yr(ft3/s)(hr)
100-yr(ft3/s)(hr)
SUB-AREAS
Upper Main 238.68 374.75 461.00 563.70 667.55 771.28
12.16 12.15 12.14 12.14 12.14 12.12
CountyRoad 210.65 349.76 439.14 548.08 659.56 772.67
12.17 12.16 12.15 12.16 12.15 12.16
MiddleMain 66.78 123.68 161.77 208.63 257.83 308.30
12.05 12.03 12.03 12.03 12.02 12.02
UpperEast 216.21 338.62 414.28 505.19 598.04 691.70
12.07 12.07 12.07 12.06 12.06 12.05
LowerEast 106.90 186.20 238.00 300.97 366.78 432.73
12.14 12.13 12.13 12.11 12.11 12.10
UpperWest 99.73 156.06 191.43 233.60 276.23 319.74
12.10 12.10 12.10 12.10 12.10 12.08
LowerWest 172.93 257.14 309.28 370.29 432.36 494.33
12.01 12.01 12.00 12.01 12.00 12.00
Lower Main 195.22 299.62 363.91 441.53 518.96 599.27
12.14 12.14 12.13 12.14 12.13 12.14
REACHES
MainStem1 448.17 723.38 898.13 1,107.93 1,324.56 1,541.91
12.16 12.15 12.14 12.14 12.14 12.15
Down 427.46 694.49 863.71 1,067.59 1,277.31 1,487.27
12.24 12.21 12.20 12.19 12.20 12.20
MainStem2 928.30 1529.20 1912.16 2375.30 2849.98 3328.69
12.16 12.13 12.13 12.12 12.12 12.12
Down 920.08 1517.87 1898.20 2357.34 2826.53 3303.47
12.22 12.19 12.18 12.17 12.17 12.15
EastReach 216.21 338.62 414.28 505.19 598.04 691.70
12.07 12.07 12.07 12.06 12.06 12.05
Down 210.62 329.64 404.58 494.83 585.57 678.49
12.16 12.14 12.13 12.13 12.11 12.11
WestReach 99.73 156.06 191.43 233.60 276.23 319.74
12.10 12.10 12.10 12.10 12.10 12.08
Down 98.51 154.48 189.71 231.77 274.49 317.10
12.19 12.19 12.17 12.17 12.17 12.17
OUTLET 1103.46 1808.47 2255.51 2793.31 3342.75 3898.08

A–38 WinTR–55 User Guide, January 2009
Appendix A: Examples Small Watershed Hydrology
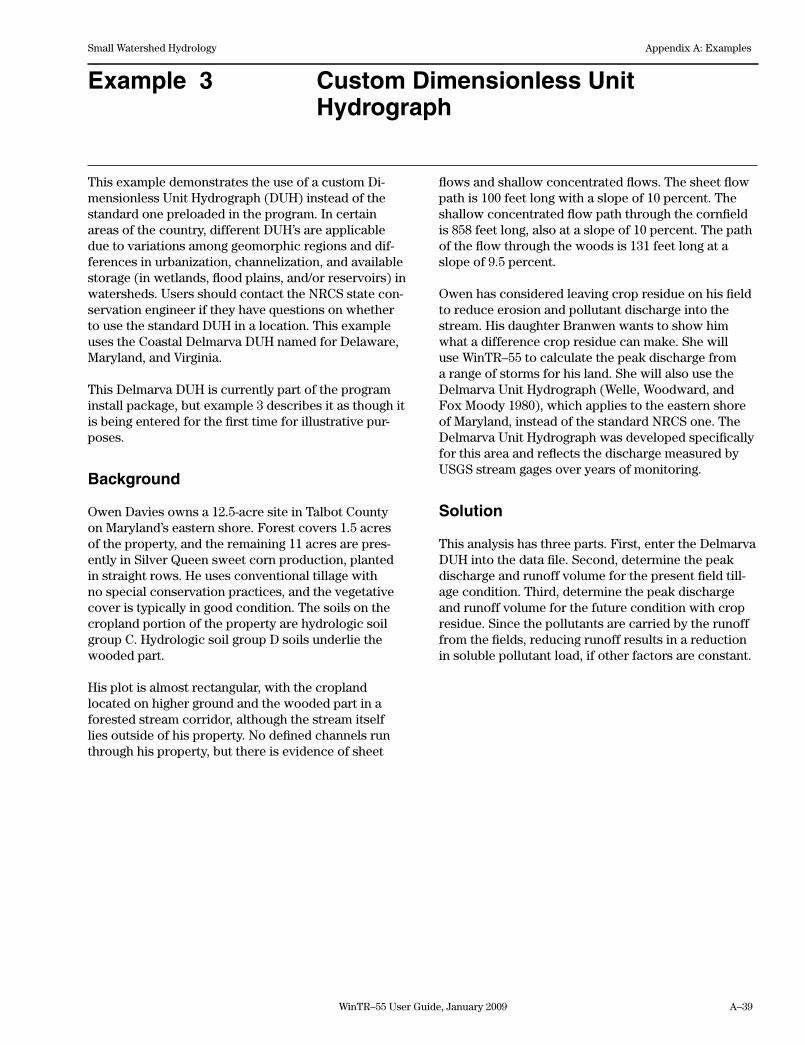
WinTR–55 User Guide, January 2009 A–39
Small Watershed Hydrology Appendix A: Examples
Example 3 Custom Dimensionless Unit Hydrograph
This example demonstrates the use of a custom Di-mensionless Unit Hydrograph (DUH) instead of the standard one preloaded in the program. In certain areas of the country, different DUH’s are applicable due to variations among geomorphic regions and dif-ferences in urbanization, channelization, and available storage (in wetlands, flood plains, and/or reservoirs) in watersheds. Users should contact the NRCS state con-servation engineer if they have questions on whether to use the standard DUH in a location. This example uses the Coastal Delmarva DUH named for Delaware, Maryland, and Virginia.
This Delmarva DUH is currently part of the program install package, but example 3 describes it as though it is being entered for the first time for illustrative pur-poses.
Background
Owen Davies owns a 12.5-acre site in Talbot County on Maryland’s eastern shore. Forest covers 1.5 acres of the property, and the remaining 11 acres are pres-ently in Silver Queen sweet corn production, planted in straight rows. He uses conventional tillage with no special conservation practices, and the vegetative cover is typically in good condition. The soils on the cropland portion of the property are hydrologic soil group C. Hydrologic soil group D soils underlie the wooded part.
His plot is almost rectangular, with the cropland located on higher ground and the wooded part in a forested stream corridor, although the stream itself lies outside of his property. No defined channels run through his property, but there is evidence of sheet
flows and shallow concentrated flows. The sheet flow path is 100 feet long with a slope of 10 percent. The shallow concentrated flow path through the cornfield is 858 feet long, also at a slope of 10 percent. The path of the flow through the woods is 131 feet long at a slope of 9.5 percent.
Owen has considered leaving crop residue on his field to reduce erosion and pollutant discharge into the stream. His daughter Branwen wants to show him what a difference crop residue can make. She will use WinTR–55 to calculate the peak discharge from a range of storms for his land. She will also use the Delmarva Unit Hydrograph (Welle, Woodward, and Fox Moody 1980), which applies to the eastern shore of Maryland, instead of the standard NRCS one. The Delmarva Unit Hydrograph was developed specifically for this area and reflects the discharge measured by USGS stream gages over years of monitoring.
Solution
This analysis has three parts. First, enter the Delmarva DUH into the data file. Second, determine the peak discharge and runoff volume for the present field till-age condition. Third, determine the peak discharge and runoff volume for the future condition with crop residue. Since the pollutants are carried by the runoff from the fields, reducing runoff results in a reduction in soluble pollutant load, if other factors are constant.
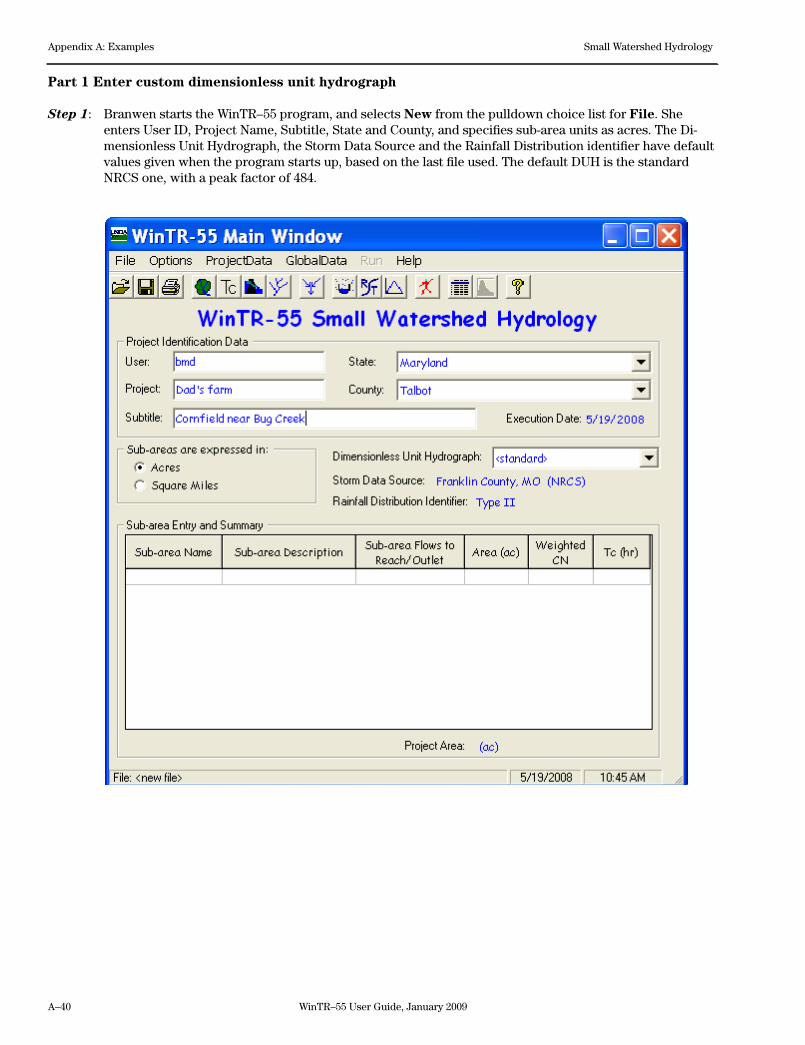
A–40 WinTR–55 User Guide, January 2009
Appendix A: Examples Small Watershed Hydrology
Part 1 Enter custom dimensionless unit hydrograph
Step 1: Branwen starts the WinTR–55 program, and selects New from the pulldown choice list for File. She enters User ID, Project Name, Subtitle, State and County, and specifies sub-area units as acres. The Di-mensionless Unit Hydrograph, the Storm Data Source and the Rainfall Distribution identifier have default values given when the program starts up, based on the last file used. The default DUH is the standard NRCS one, with a peak factor of 484.
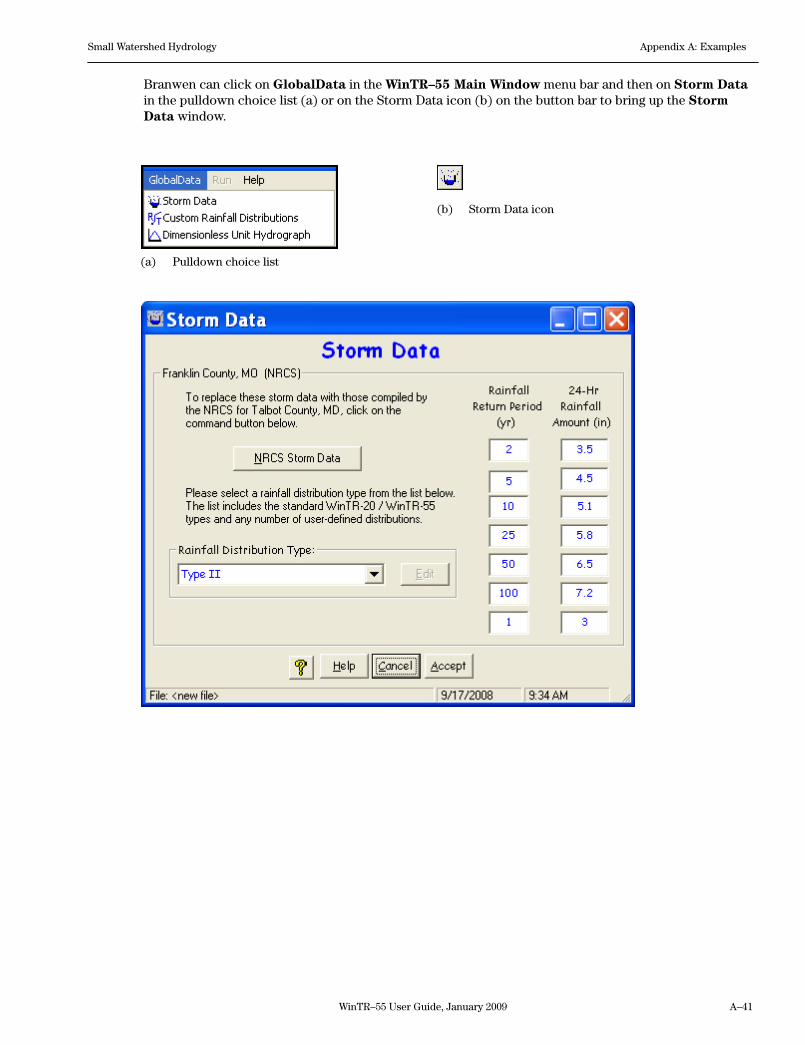
WinTR–55 User Guide, January 2009 A–41
Small Watershed Hydrology Appendix A: Examples
(a) Pulldown choice list
(b) Storm Data icon
Branwen can click on GlobalData in the WinTR–55 Main Window menu bar and then on Storm Data in the pulldown choice list (a) or on the Storm Data icon (b) on the button bar to bring up the Storm Data window.
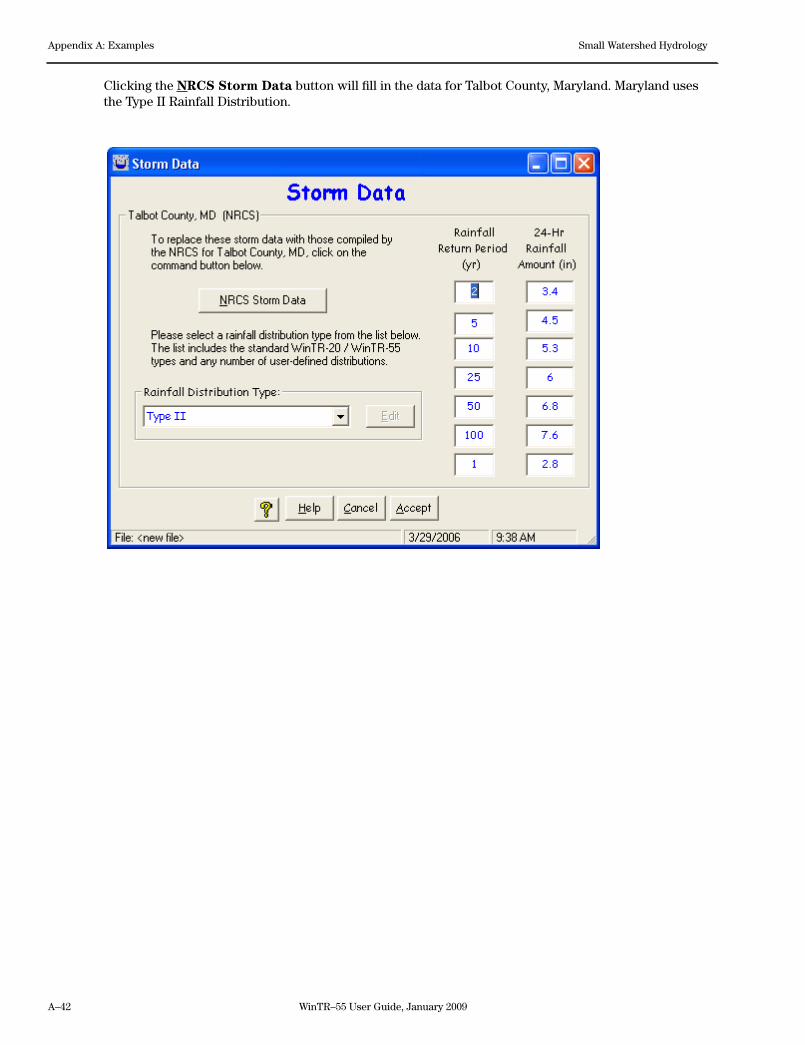
A–42 WinTR–55 User Guide, January 2009
Appendix A: Examples Small Watershed Hydrology
Clicking the NRCS Storm Data button will fill in the data for Talbot County, Maryland. Maryland uses the Type II Rainfall Distribution.
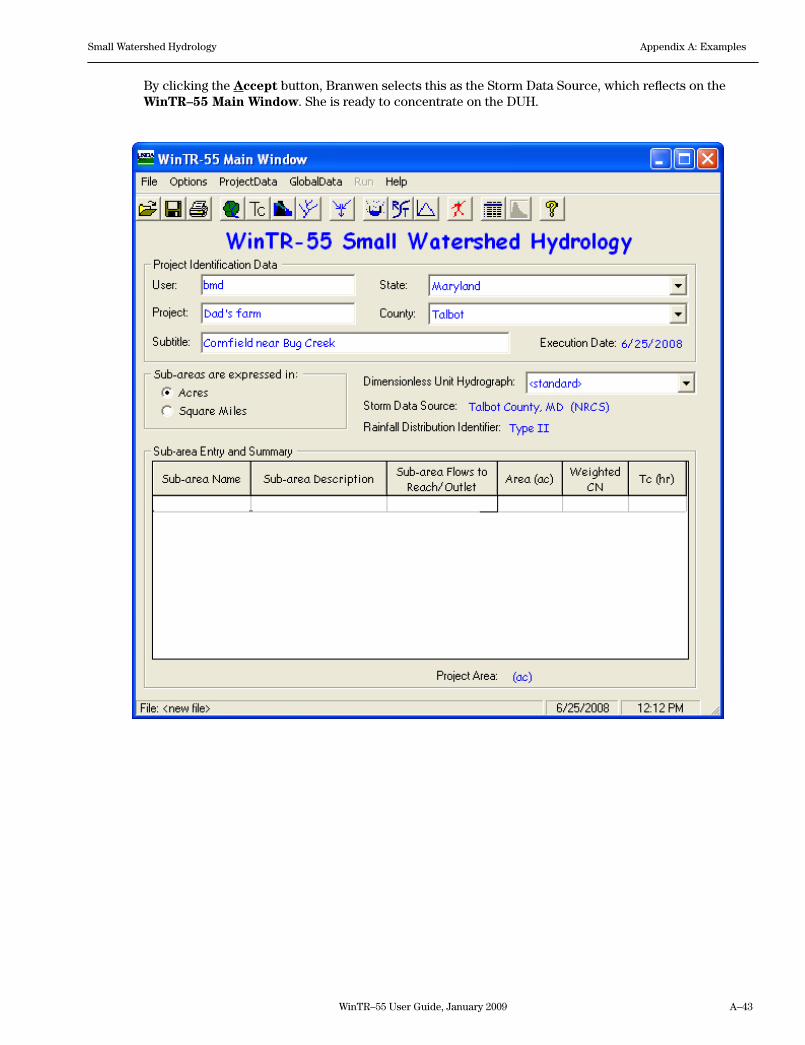
WinTR–55 User Guide, January 2009 A–43
Small Watershed Hydrology Appendix A: Examples
By clicking the Accept button, Branwen selects this as the Storm Data Source, which reflects on the WinTR–55 Main Window. She is ready to concentrate on the DUH.
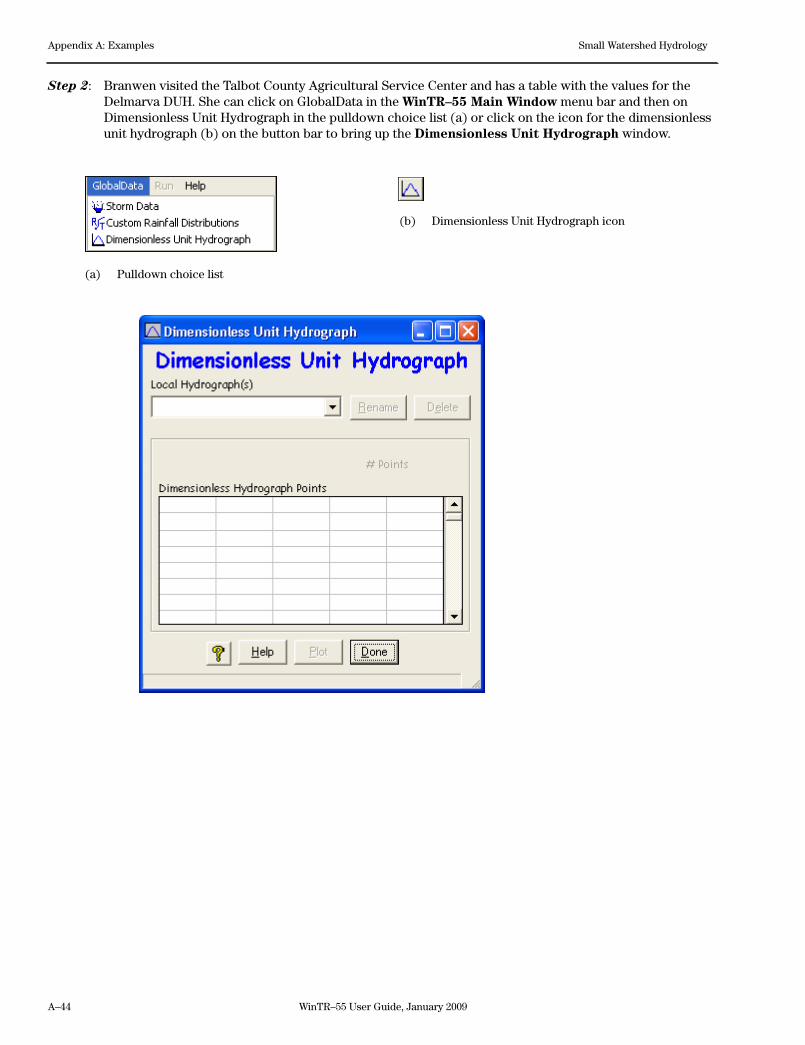
A–44 WinTR–55 User Guide, January 2009
Appendix A: Examples Small Watershed Hydrology
Step 2: Branwen visited the Talbot County Agricultural Service Center and has a table with the values for the Delmarva DUH. She can click on GlobalData in the WinTR–55 Main Window menu bar and then on Dimensionless Unit Hydrograph in the pulldown choice list (a) or click on the icon for the dimensionless unit hydrograph (b) on the button bar to bring up the Dimensionless Unit Hydrograph window.
(a) Pulldown choice list
(b) Dimensionless Unit Hydrograph icon
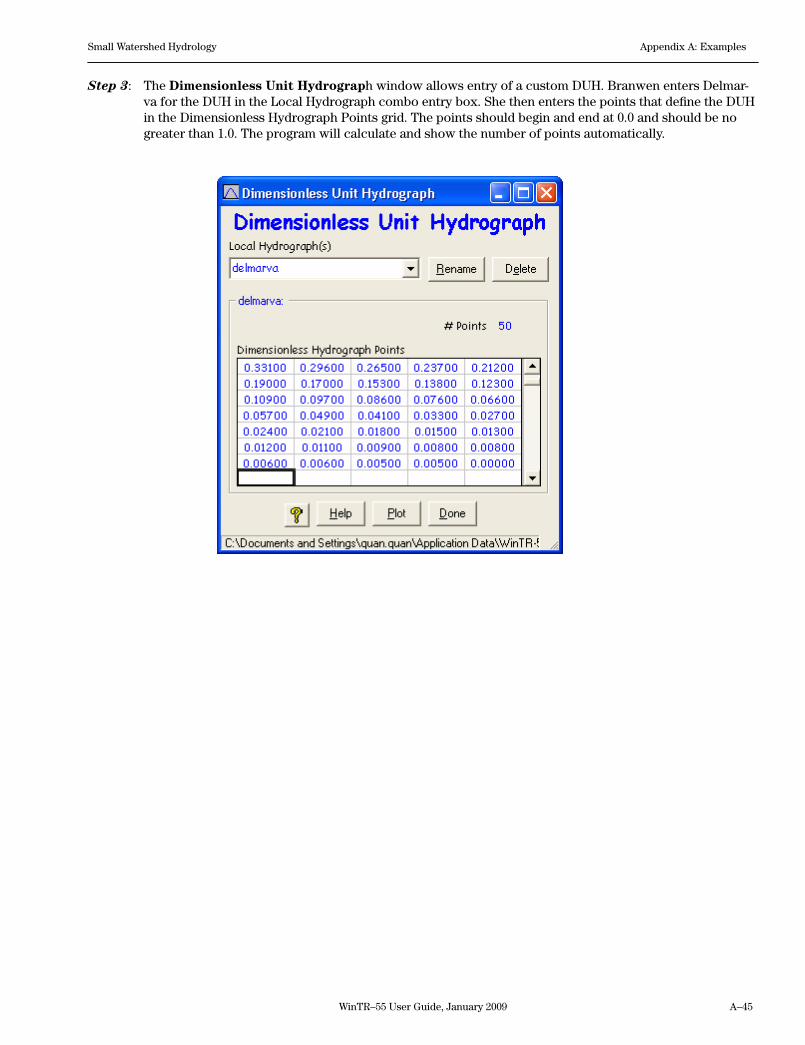
WinTR–55 User Guide, January 2009 A–45
Small Watershed Hydrology Appendix A: Examples
Step 3: The Dimensionless Unit Hydrograph window allows entry of a custom DUH. Branwen enters Delmar-va for the DUH in the Local Hydrograph combo entry box. She then enters the points that define the DUH in the Dimensionless Hydrograph Points grid. The points should begin and end at 0.0 and should be no greater than 1.0. The program will calculate and show the number of points automatically.
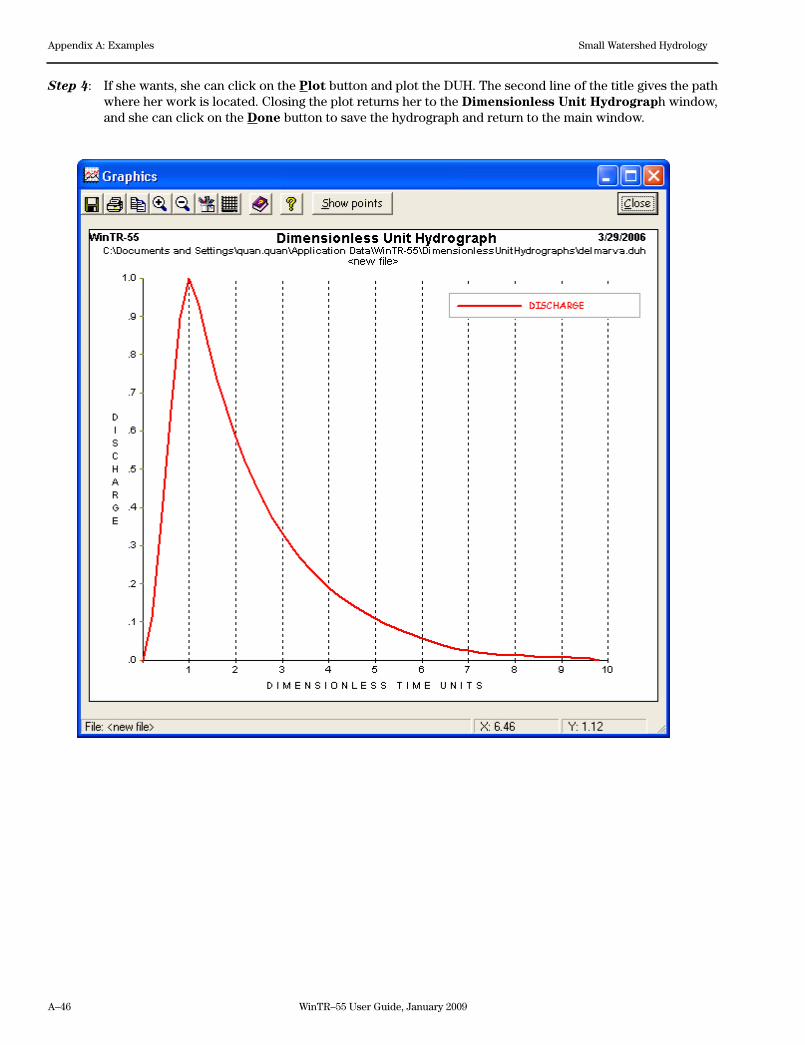
A–46 WinTR–55 User Guide, January 2009
Appendix A: Examples Small Watershed Hydrology
Step 4: If she wants, she can click on the Plot button and plot the DUH. The second line of the title gives the path where her work is located. Closing the plot returns her to the Dimensionless Unit Hydrograph window, and she can click on the Done button to save the hydrograph and return to the main window.
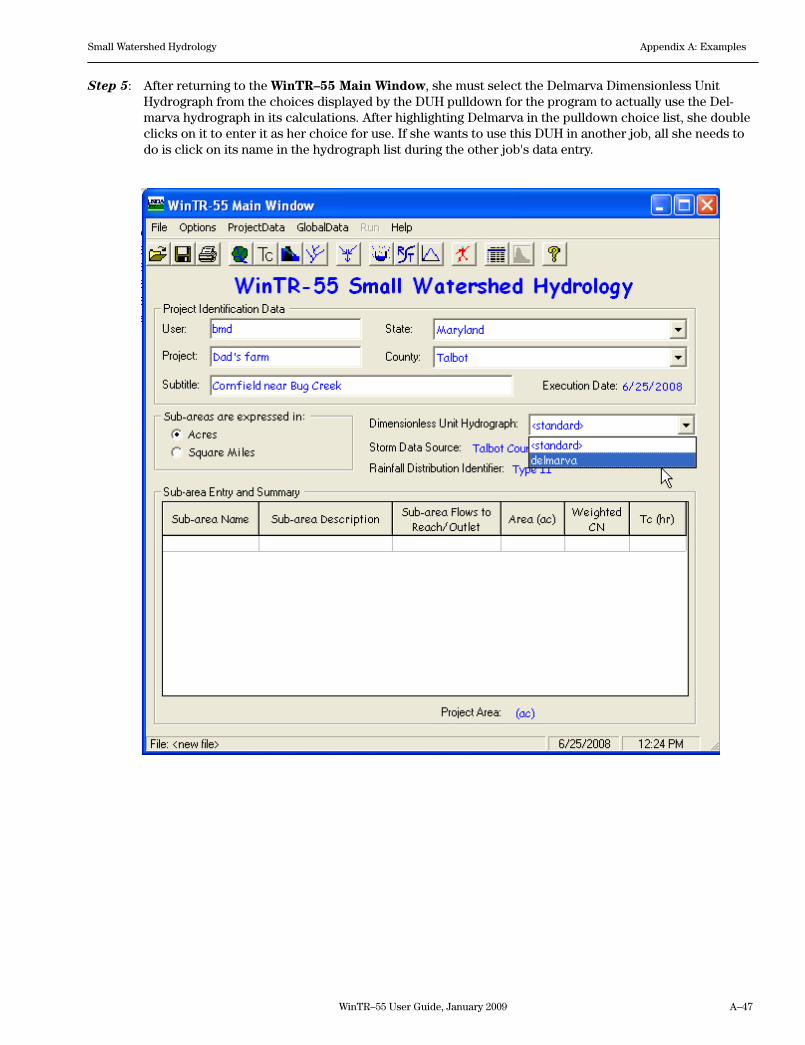
WinTR–55 User Guide, January 2009 A–47
Small Watershed Hydrology Appendix A: Examples
Step 5: After returning to the WinTR–55 Main Window, she must select the Delmarva Dimensionless Unit Hydrograph from the choices displayed by the DUH pulldown for the program to actually use the Del-marva hydrograph in its calculations. After highlighting Delmarva in the pulldown choice list, she double clicks on it to enter it as her choice for use. If she wants to use this DUH in another job, all she needs to do is click on its name in the hydrograph list during the other job's data entry.
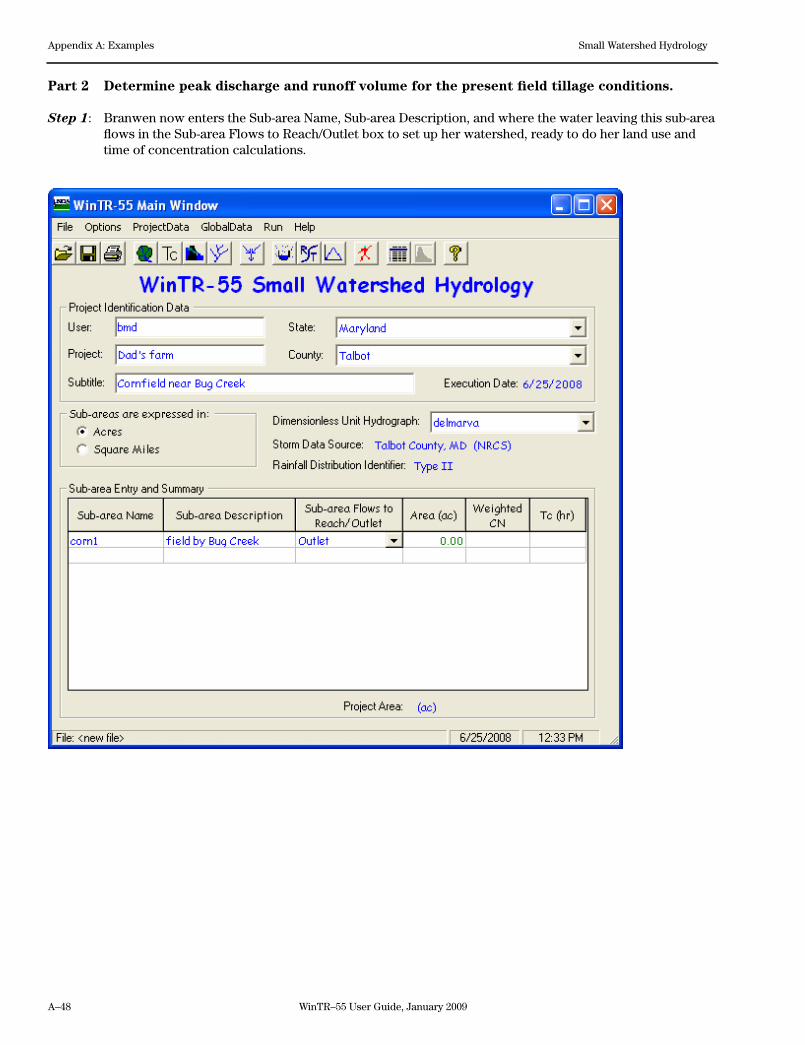
A–48 WinTR–55 User Guide, January 2009
Appendix A: Examples Small Watershed Hydrology
Part 2 Determine peak discharge and runoff volume for the present field tillage conditions.
Step 1: Branwen now enters the Sub-area Name, Sub-area Description, and where the water leaving this sub-area flows in the Sub-area Flows to Reach/Outlet box to set up her watershed, ready to do her land use and time of concentration calculations.
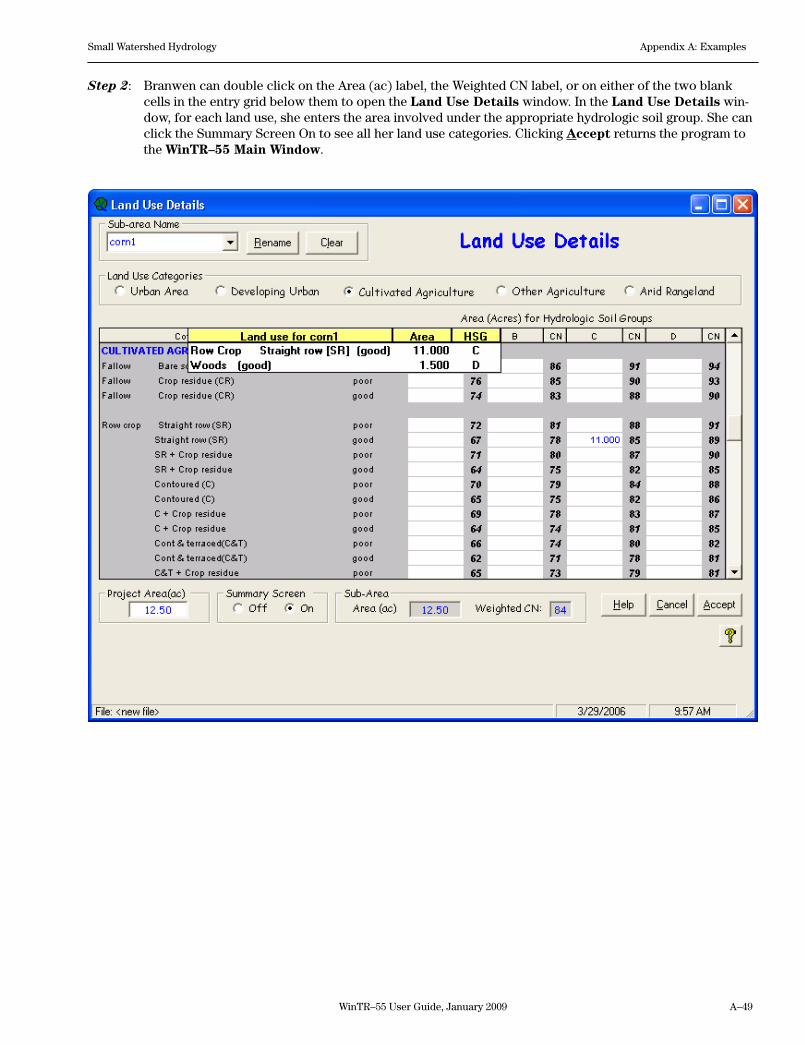
WinTR–55 User Guide, January 2009 A–49
Small Watershed Hydrology Appendix A: Examples
Step 2: Branwen can double click on the Area (ac) label, the Weighted CN label, or on either of the two blank cells in the entry grid below them to open the Land Use Details window. In the Land Use Details win-dow, for each land use, she enters the area involved under the appropriate hydrologic soil group. She can click the Summary Screen On to see all her land use categories. Clicking Accept returns the program to the WinTR–55 Main Window.
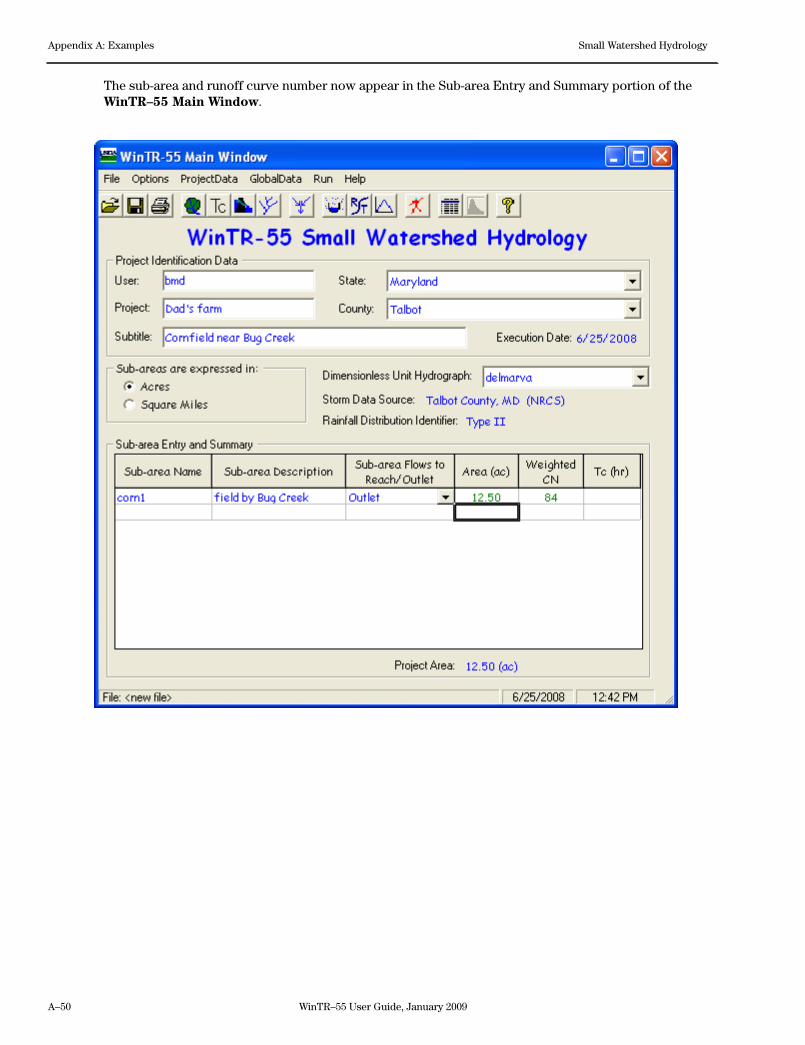
A–50 WinTR–55 User Guide, January 2009
Appendix A: Examples Small Watershed Hydrology
The sub-area and runoff curve number now appear in the Sub-area Entry and Summary portion of the WinTR–55 Main Window.
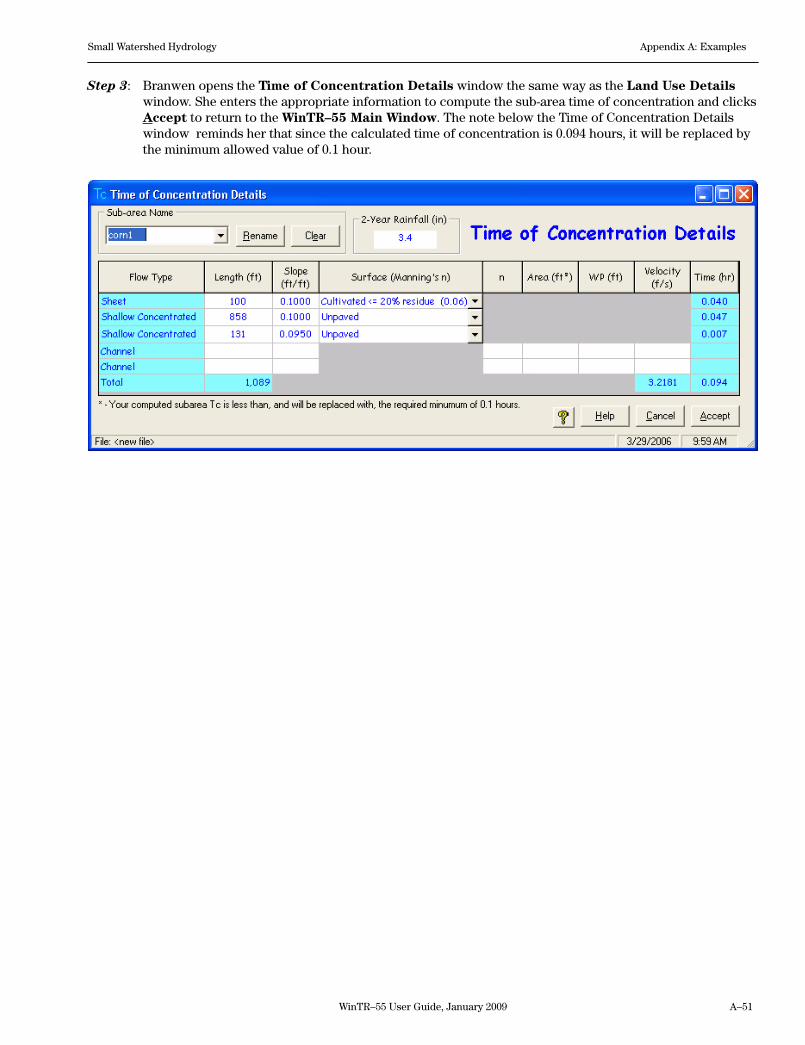
WinTR–55 User Guide, January 2009 A–51
Small Watershed Hydrology Appendix A: Examples
Step 3: Branwen opens the Time of Concentration Details window the same way as the Land Use Details window. She enters the appropriate information to compute the sub-area time of concentration and clicks Accept to return to the WinTR–55 Main Window. The note below the Time of Concentration Details window reminds her that since the calculated time of concentration is 0.094 hours, it will be replaced by the minimum allowed value of 0.1 hour.
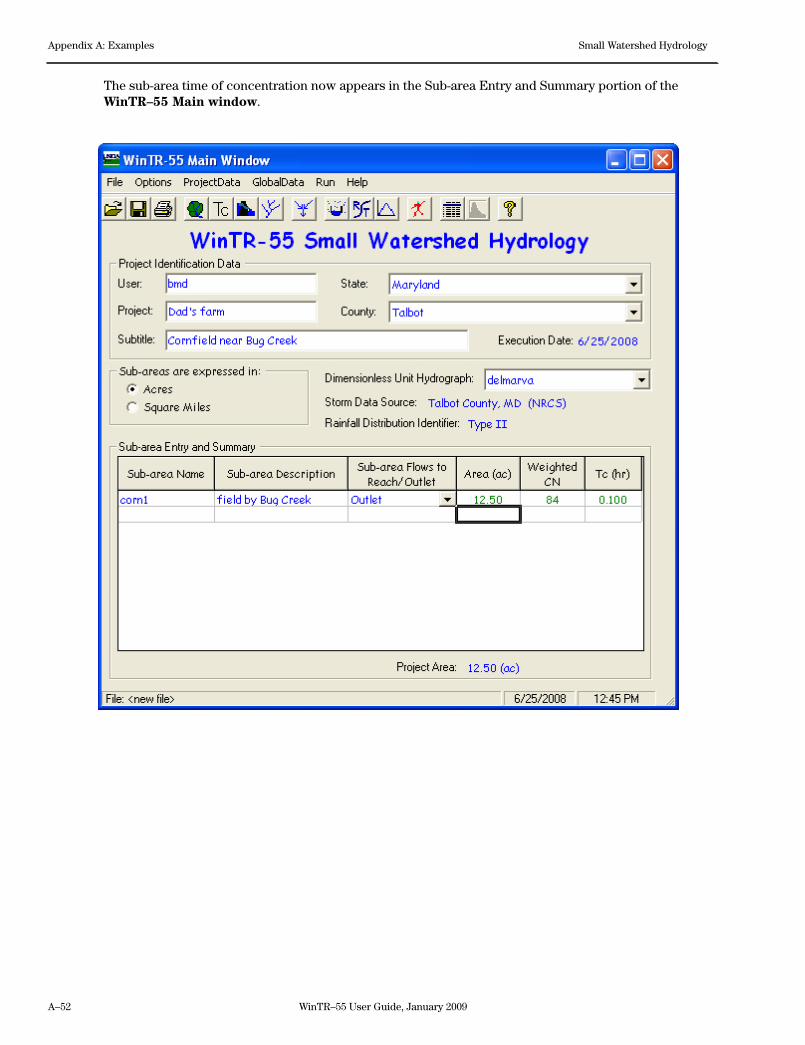
A–52 WinTR–55 User Guide, January 2009
Appendix A: Examples Small Watershed Hydrology
The sub-area time of concentration now appears in the Sub-area Entry and Summary portion of the WinTR–55 Main window.
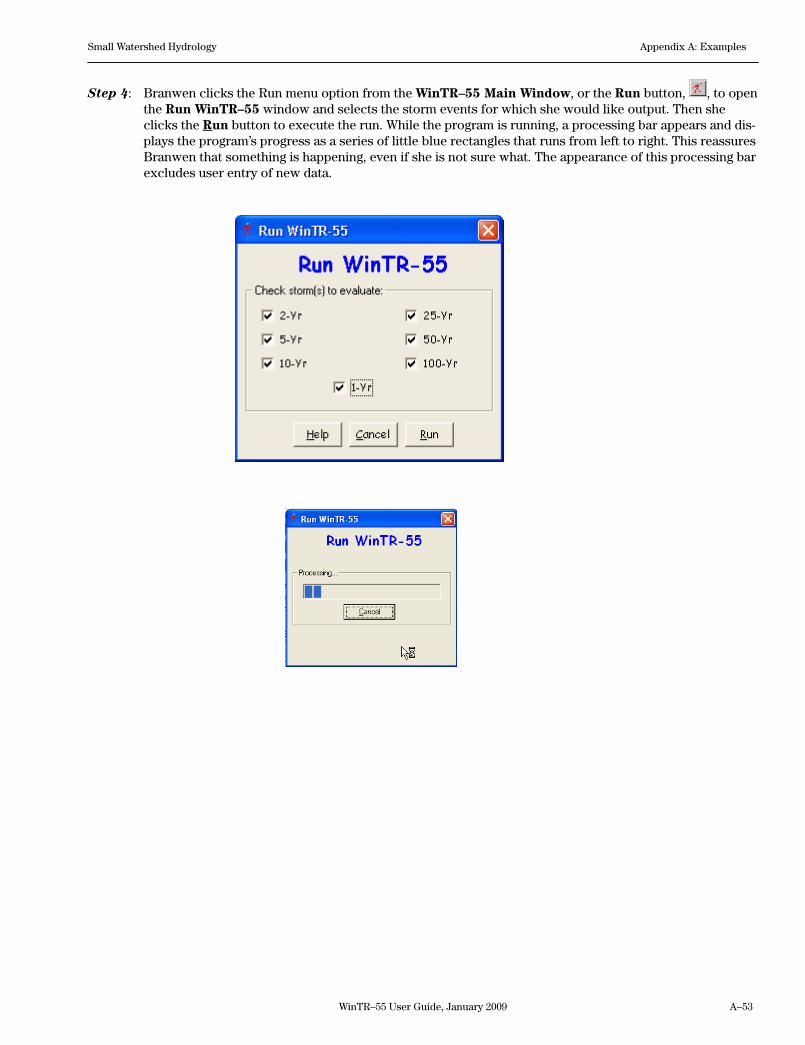
WinTR–55 User Guide, January 2009 A–53
Small Watershed Hydrology Appendix A: Examples
Step 4: Branwen clicks the Run menu option from the WinTR–55 Main Window, or the Run button, , to open the Run WinTR–55 window and selects the storm events for which she would like output. Then she clicks the Run button to execute the run. While the program is running, a processing bar appears and dis-plays the program’s progress as a series of little blue rectangles that runs from left to right. This reassures Branwen that something is happening, even if she is not sure what. The appearance of this processing bar excludes user entry of new data.
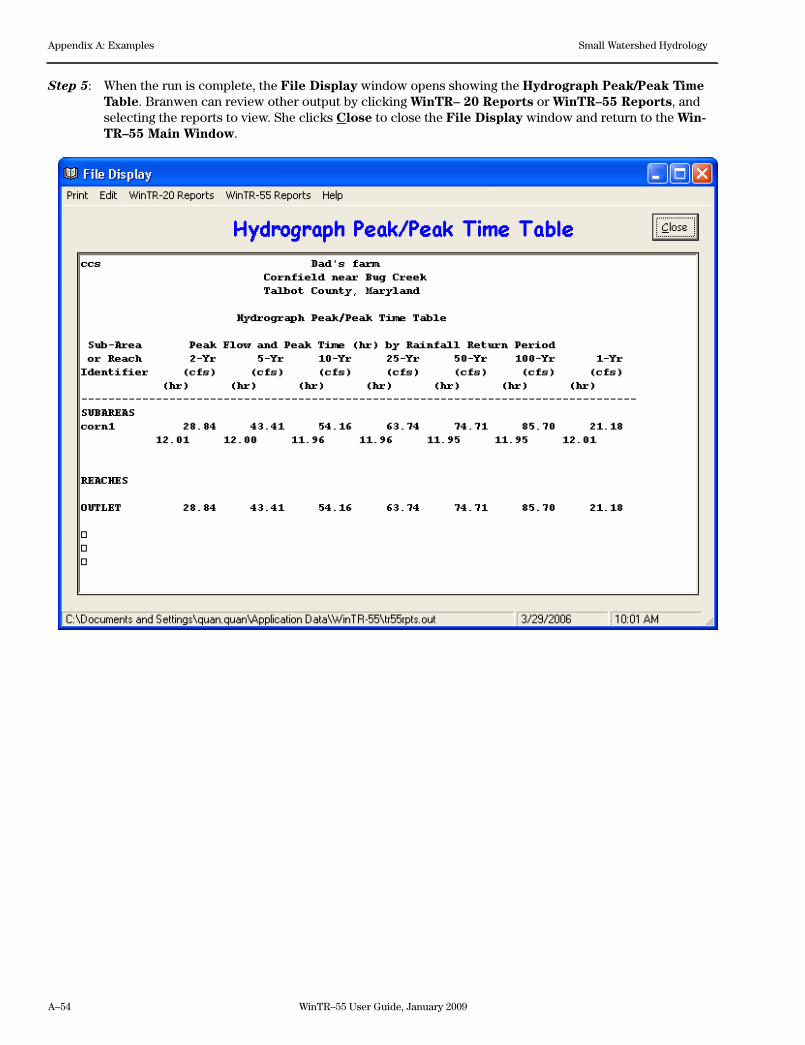
A–54 WinTR–55 User Guide, January 2009
Appendix A: Examples Small Watershed Hydrology
Step 5: When the run is complete, the File Display window opens showing the Hydrograph Peak/Peak Time Table. Branwen can review other output by clicking WinTR– 20 Reports or WinTR–55 Reports, and selecting the reports to view. She clicks Close to close the File Display window and return to the Win-TR–55 Main Window.
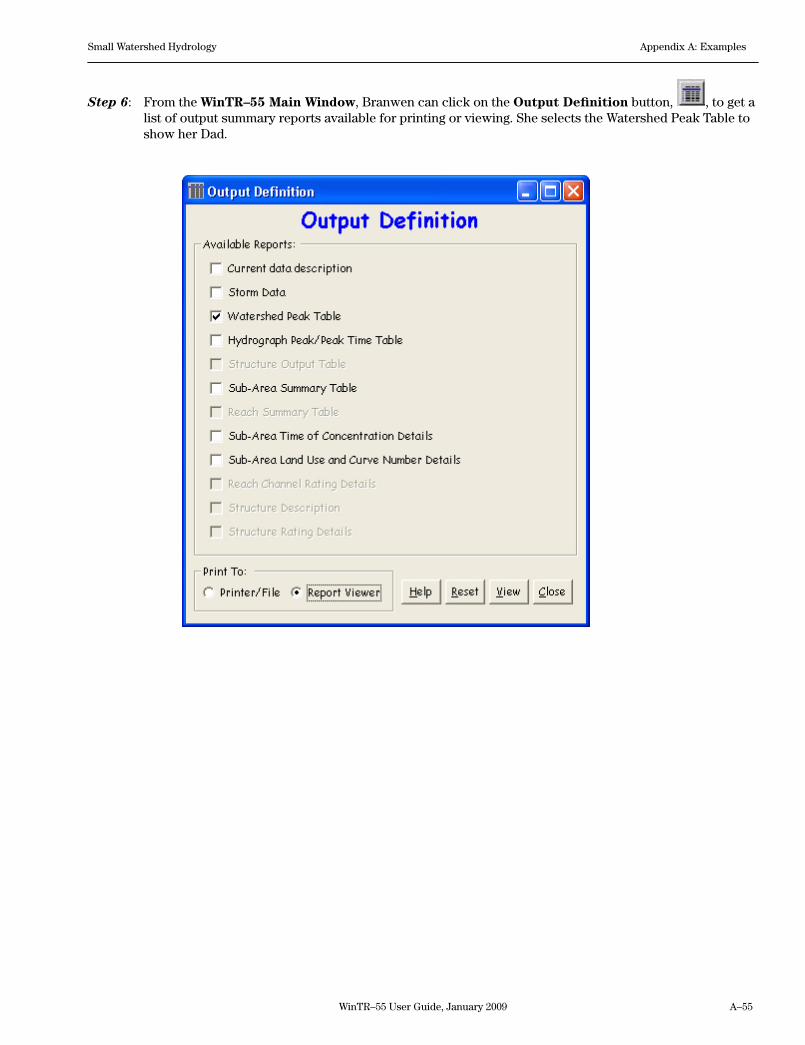
WinTR–55 User Guide, January 2009 A–55
Small Watershed Hydrology Appendix A: Examples
Step 6: From the WinTR–55 Main Window, Branwen can click on the Output Definition button, , to get a list of output summary reports available for printing or viewing. She selects the Watershed Peak Table to show her Dad.
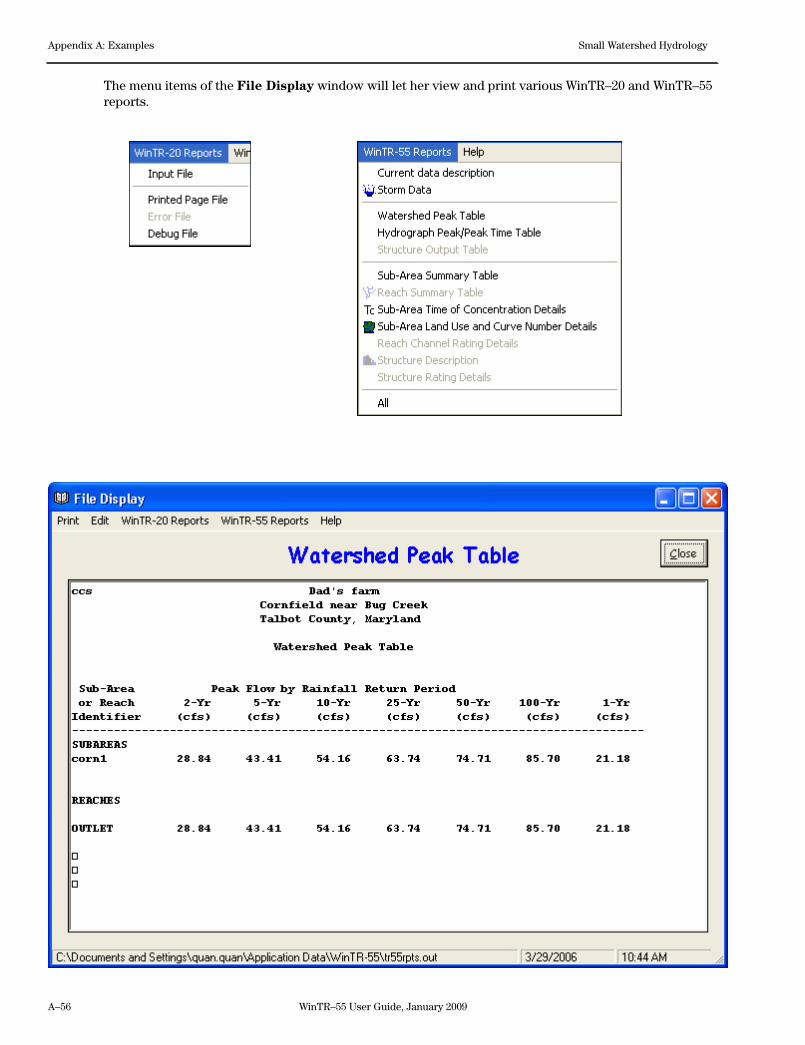
A–56 WinTR–55 User Guide, January 2009
Appendix A: Examples Small Watershed Hydrology
The menu items of the File Display window will let her view and print various WinTR–20 and WinTR –55 reports.
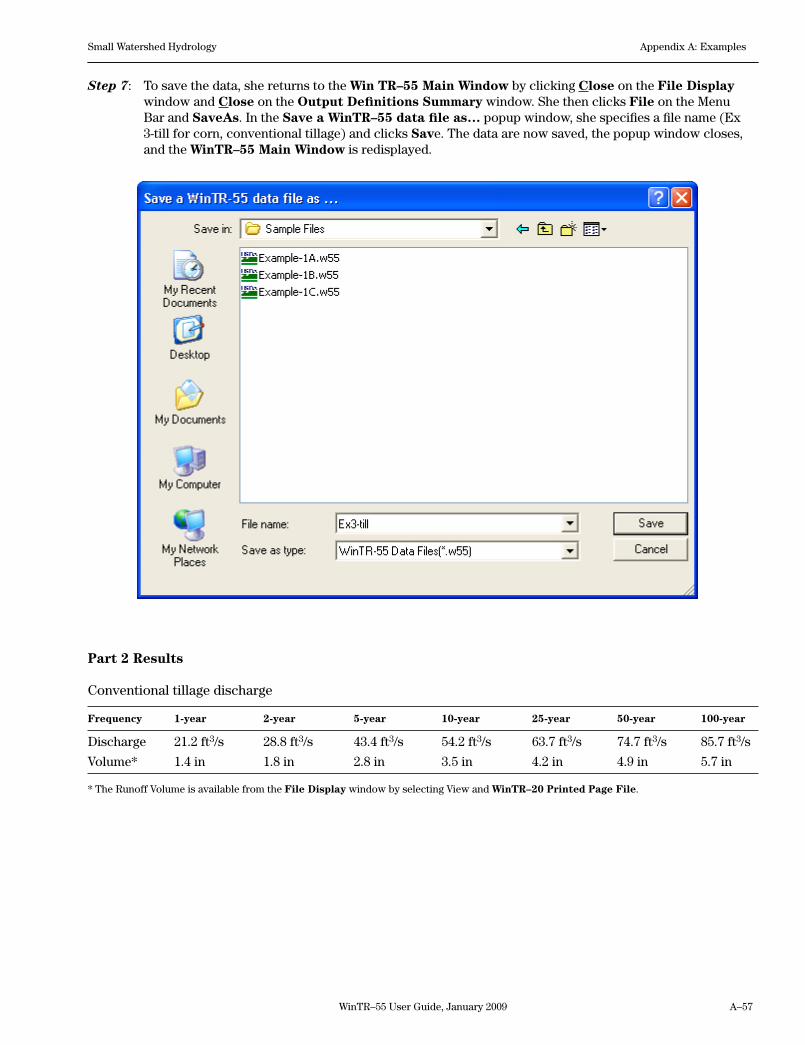
WinTR–55 User Guide, January 2009 A–57
Small Watershed Hydrology Appendix A: Examples
Step 7: To save the data, she returns to the Win TR–55 Main Window by clicking Close on the File Display window and Close on the Output Definitions Summary window. She then clicks File on the Menu Bar and SaveAs. In the Save a WinTR–55 data file as… popup window, she specifies a file name (Ex 3-till for corn, conventional tillage) and clicks Save. The data are now saved, the popup window closes, and the WinTR–55 Main Window is redisplayed.
Part 2 Results
Conventional tillage discharge
Frequency 1-year 2-year 5-year 10-year 25-year 50-year 100-year
Discharge 21.2 ft3/s 28.8 ft3/s 43.4 ft3/s 54.2 ft3/s 63.7 ft3/s 74.7 ft3/s 85.7 ft3/s
Volume* 1.4 in 1.8 in 2.8 in 3.5 in 4.2 in 4.9 in 5.7 in
* The Runoff Volume is available from the File Display window by selecting View and WinTR–20 Printed Page File.
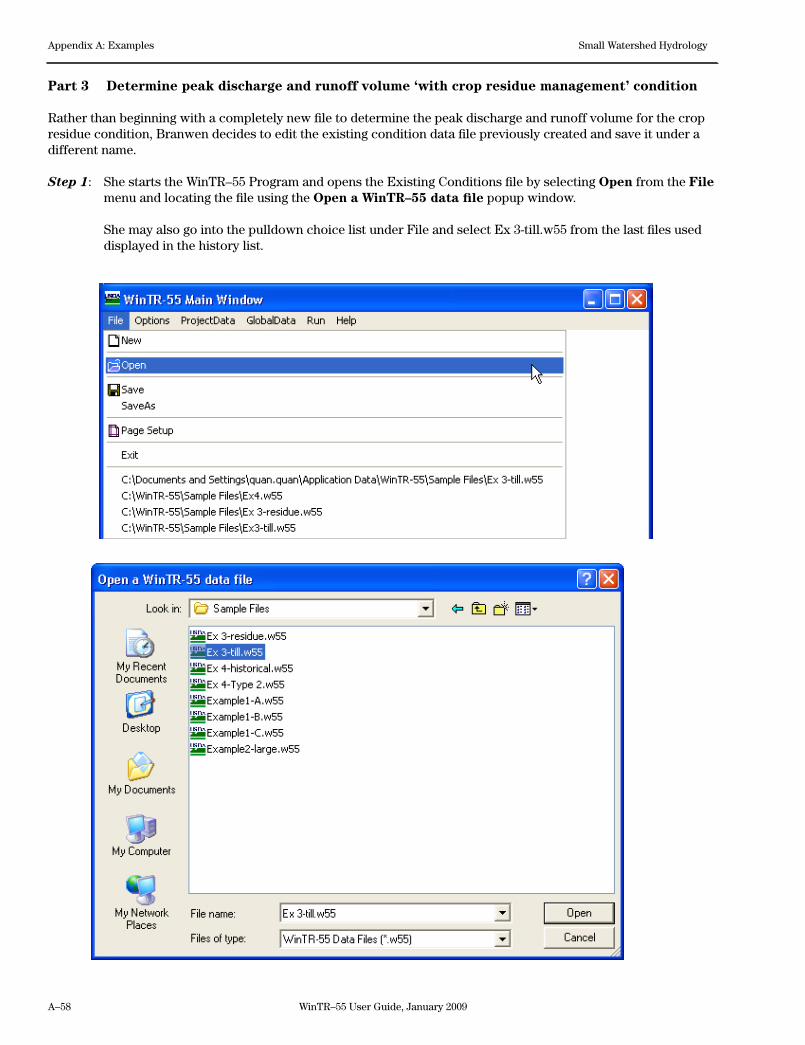
A–58 WinTR–55 User Guide, January 2009
Appendix A: Examples Small Watershed Hydrology
Part 3 Determine peak discharge and runoff volume ‘with crop residue management’ condition
Rather than beginning with a completely new file to determine the peak discharge and runoff volume for the crop residue condition, Branwen decides to edit the existing condition data file previously created and save it under a different name.
Step 1: She starts the WinTR–55 Program and opens the Existing Conditions file by selecting Open from the File menu and locating the file using the Open a WinTR–55 data file popup window.
She may also go into the pulldown choice list under File and select Ex 3-till.w55 from the last files used displayed in the history list.
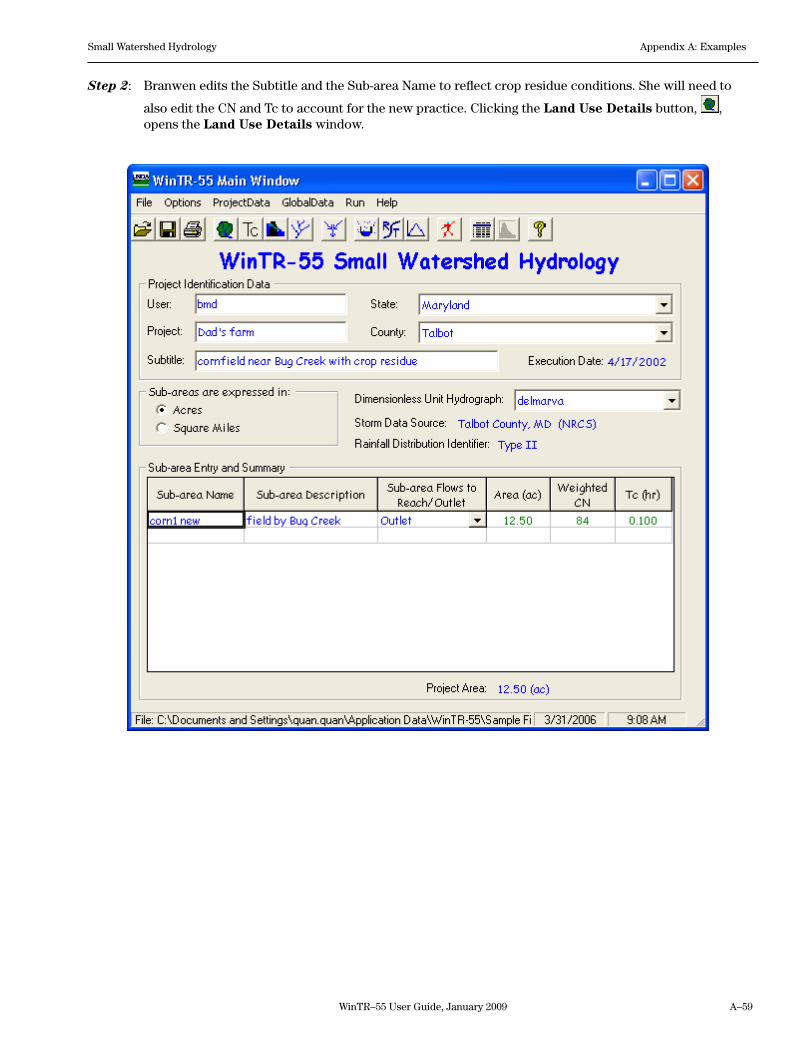
WinTR–55 User Guide, January 2009 A–59
Small Watershed Hydrology Appendix A: Examples
Step 2: Branwen edits the Subtitle and the Sub-area Name to reflect crop residue conditions. She will need to
also edit the CN and Tc to account for the new practice. Clicking the Land Use Details button, , opens the Land Use Details window.
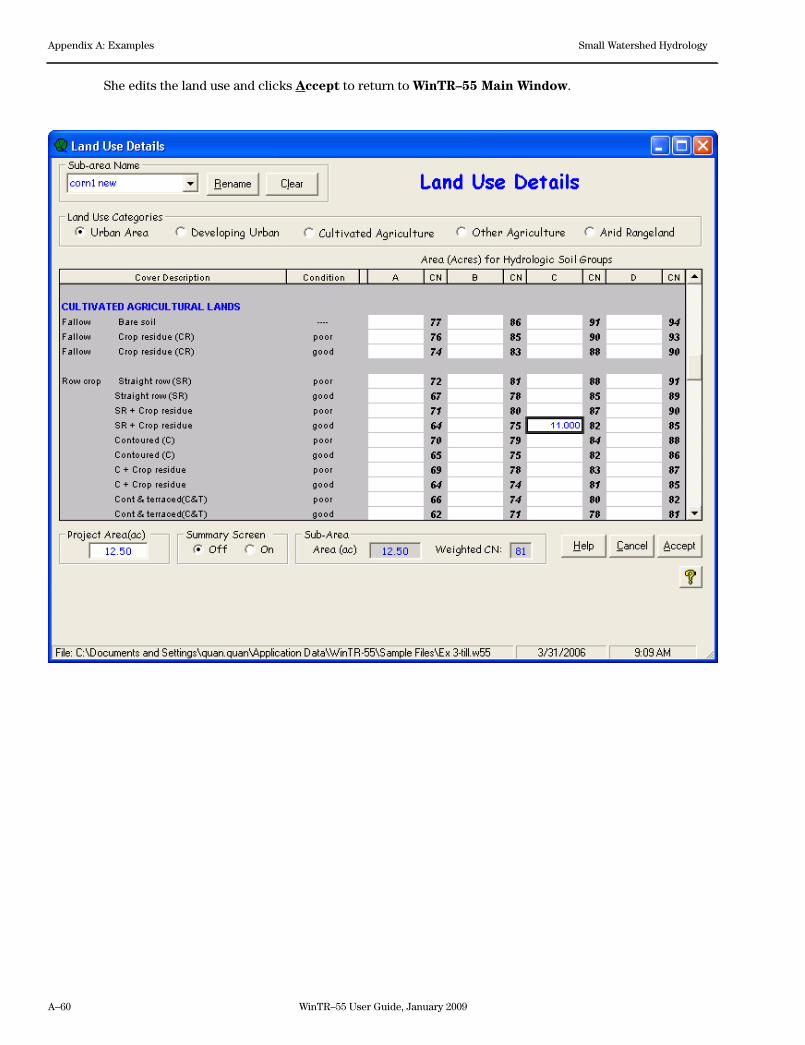
A–60 WinTR–55 User Guide, January 2009
Appendix A: Examples Small Watershed Hydrology
She edits the land use and clicks Accept to return to WinTR–55 Main Window.
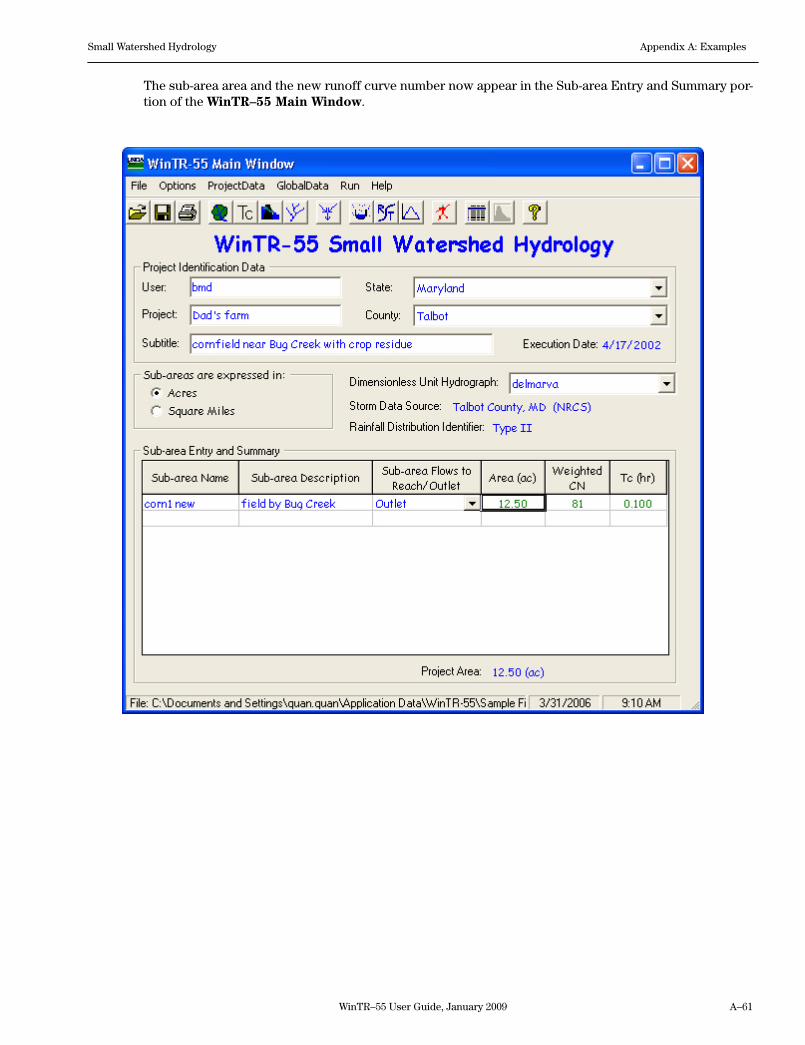
WinTR–55 User Guide, January 2009 A–61
Small Watershed Hydrology Appendix A: Examples
The sub-area area and the new runoff curve number now appear in the Sub-area Entry and Summary por-tion of the WinTR–55 Main Window.
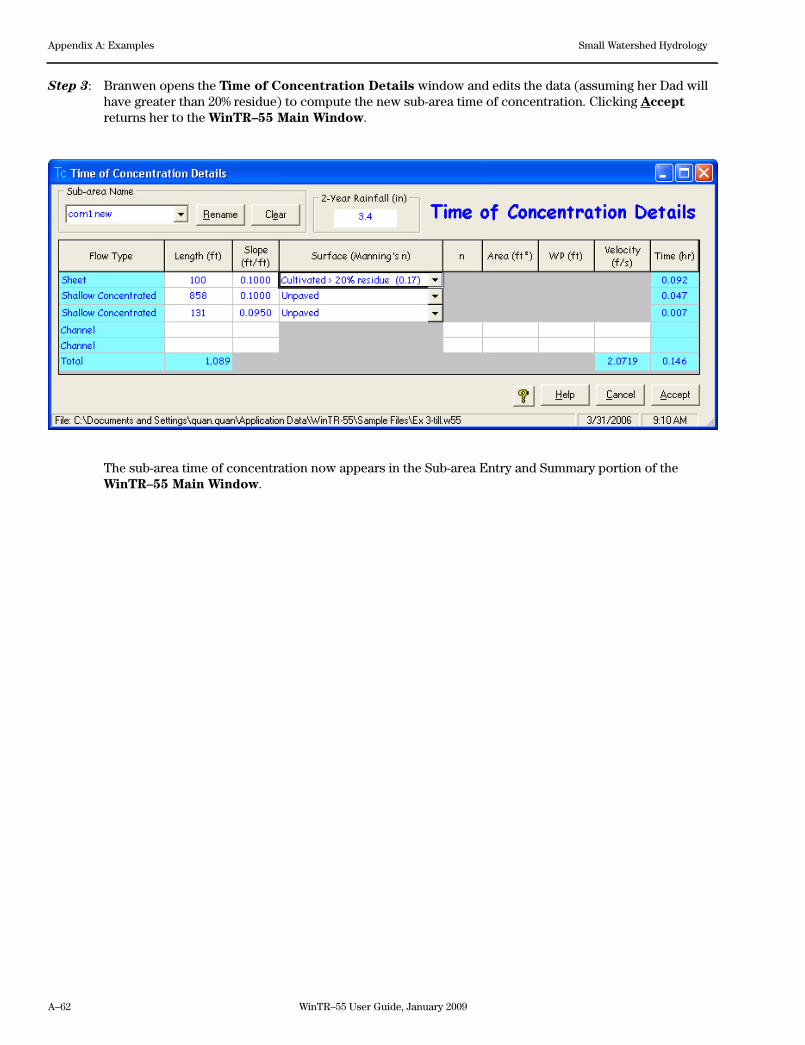
A–62 WinTR–55 User Guide, January 2009
Appendix A: Examples Small Watershed Hydrology
Step 3: Branwen opens the Time of Concentration Details window and edits the data (assuming her Dad will have greater than 20% residue) to compute the new sub-area time of concentration. Clicking Accept returns her to the WinTR–55 Main Window.
The sub-area time of concentration now appears in the Sub-area Entry and Summary portion of the WinTR–55 Main Window.
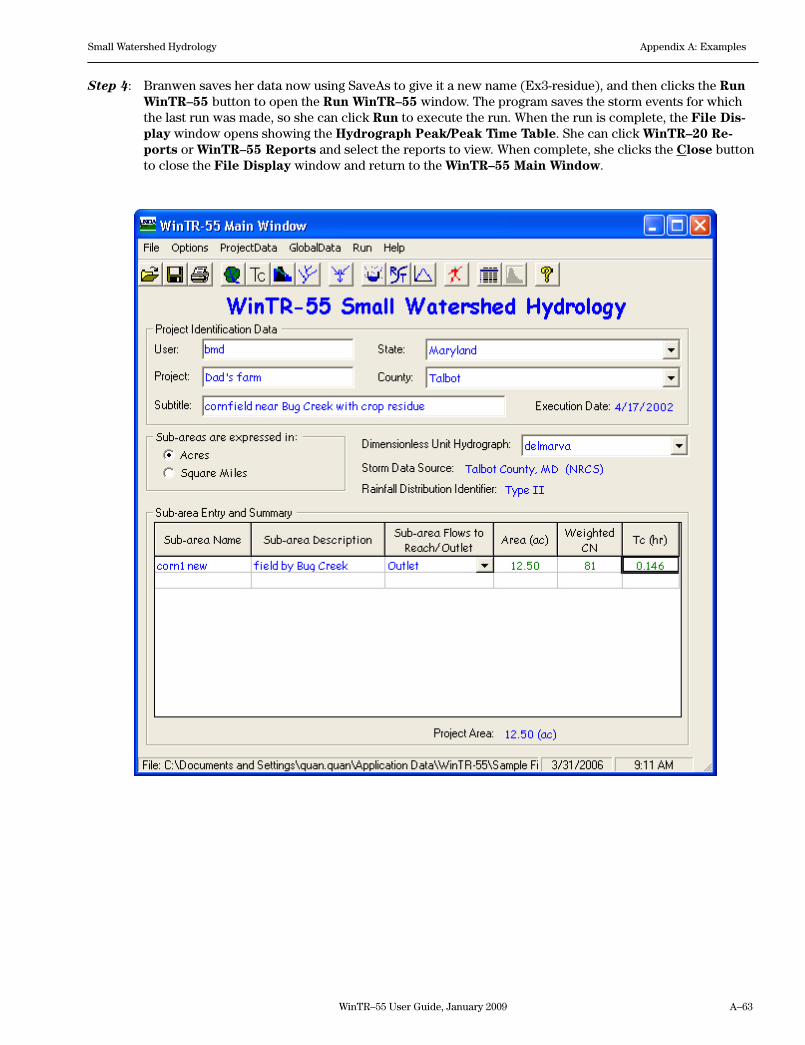
WinTR–55 User Guide, January 2009 A–63
Small Watershed Hydrology Appendix A: Examples
Step 4: Branwen saves her data now using SaveAs to give it a new name (Ex3-residue), and then clicks the Run WinTR–55 button to open the Run WinTR–55 window. The program saves the storm events for which the last run was made, so she can click Run to execute the run. When the run is complete, the File Dis-play window opens showing the Hydrograph Peak/Peak Time Table. She can click WinTR–20 Re-ports or WinTR–55 Reports and select the reports to view. When complete, she clicks the Close button to close the File Display window and return to the WinTR–55 Main Window.
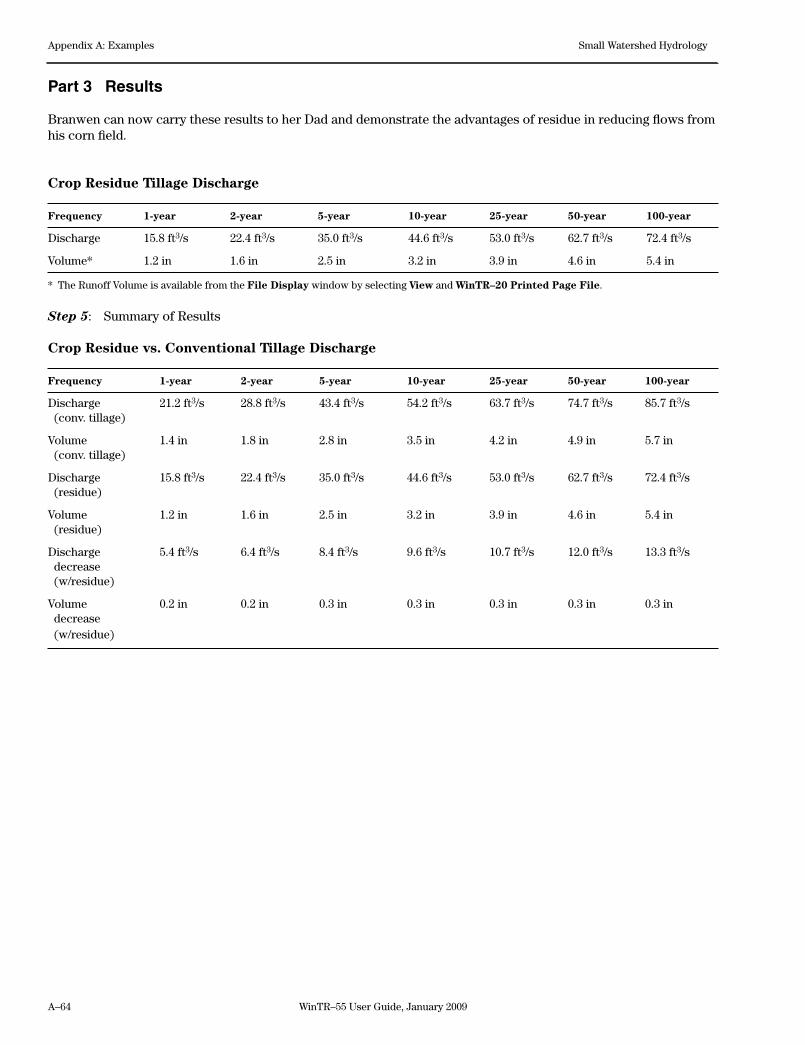
A–64 WinTR–55 User Guide, January 2009
Appendix A: Examples Small Watershed Hydrology
Part 3 Results
Branwen can now carry these results to her Dad and demonstrate the advantages of residue in reducing flows from his corn field.
Crop Residue Tillage Discharge
Frequency 1-year 2-year 5-year 10-year 25-year 50-year 100-year
Discharge 15.8 ft3/s 22.4 ft3/s 35.0 ft3/s 44.6 ft3/s 53.0 ft3/s 62.7 ft3/s 72.4 ft3/s
Volume* 1.2 in 1.6 in 2.5 in 3.2 in 3.9 in 4.6 in 5.4 in
* The Runoff Volume is available from the File Display window by selecting View and WinTR–20 Printed Page File.
Step 5: Summary of Results
Crop Residue vs. Conventional Tillage Discharge
Frequency 1-year 2-year 5-year 10-year 25-year 50-year 100-year
Discharge 21.2 ft3/s 28.8 ft3/s 43.4 ft3/s 54.2 ft3/s 63.7 ft3/s 74.7 ft3/s 85.7 ft3/s (conv. tillage)
Volume 1.4 in 1.8 in 2.8 in 3.5 in 4.2 in 4.9 in 5.7 in (conv. tillage)
Discharge 15.8 ft3/s 22.4 ft3/s 35.0 ft3/s 44.6 ft3/s 53.0 ft3/s 62.7 ft3/s 72.4 ft3/s (residue)
Volume 1.2 in 1.6 in 2.5 in 3.2 in 3.9 in 4.6 in 5.4 in (residue)
Discharge 5.4 ft3/s 6.4 ft3/s 8.4 ft3/s 9.6 ft3/s 10.7 ft3/s 12.0 ft3/s 13.3 ft3/s decrease (w/residue)
Volume 0.2 in 0.2 in 0.3 in 0.3 in 0.3 in 0.3 in 0.3 in decrease (w/residue)
WinTR–55 User Guide, January 2009 A–65
Small Watershed Hydrology Appendix A: Examples
Example 4 Custom Rainfall Distribution
Background
Minor Lake Subdivision in Champaign County, Illinois, has an existing stormwater detention basin designed with the 100-year rainfall amount and the Type II rainfall distribution. A nearby watershed recently experienced a 7-inch, 24-hour storm for which hourly precipitation data are available. A local hydraulic engi-neer estimated the recurrence interval of this event to be 110 years.
The local homeowners want to know how their exist-ing detention basin would perform during such an event. For comparison purposes, the engineer com-pleted a 100-year Type II distribution design analysis first. The historical event was analyzed second.
Watershed and basin data
The existing hydrologic design listed the drainage area as 25 acres of 0.25-acre residential lots on hydrologic soil group B soils – curve number 75. The time of concentration had been computed at 0.45 hours. The 100-year rainfall depth is 6.61 inches.
The existing detention basin has a surface area of 2.0 acres at the spillway crest. The surface area is 2.4 acres at 3 feet above the spillway crest. The inlet crest of the 15-inch diameter pipe is 3.5 feet above the outlet.
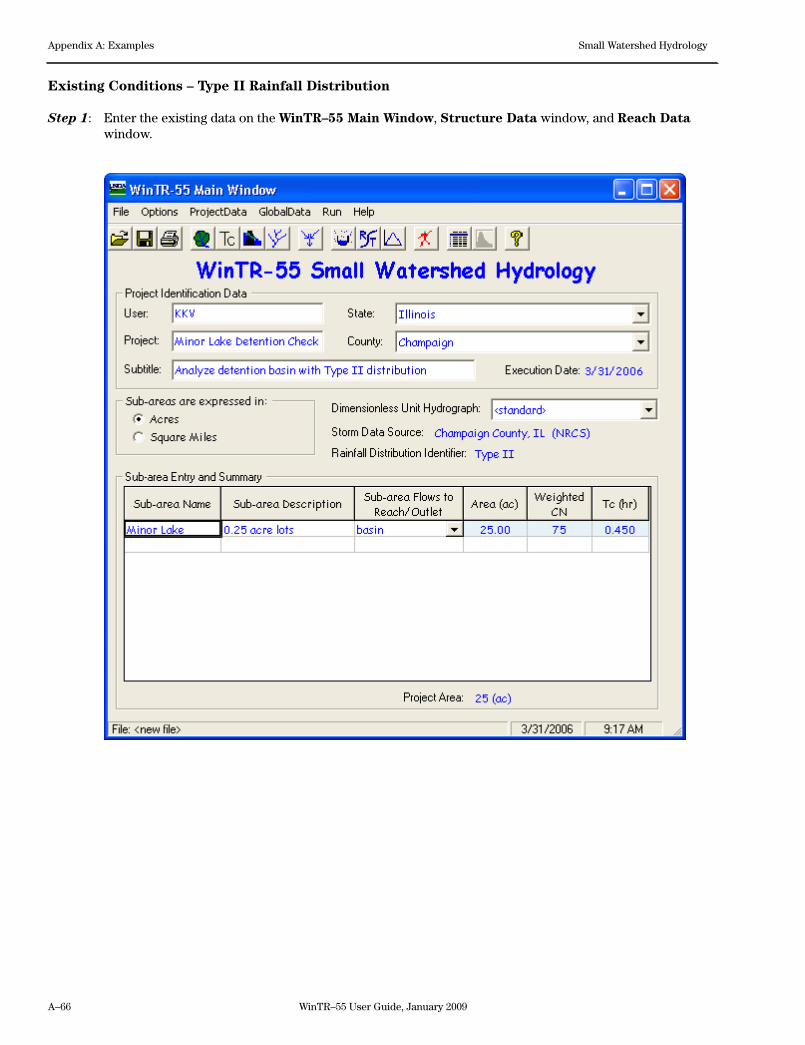
A–66 WinTR–55 User Guide, January 2009
Appendix A: Examples Small Watershed Hydrology
Existing Conditions – Type II Rainfall Distribution
Step 1: Enter the existing data on the WinTR–55 Main Window, Structure Data window, and Reach Data window.
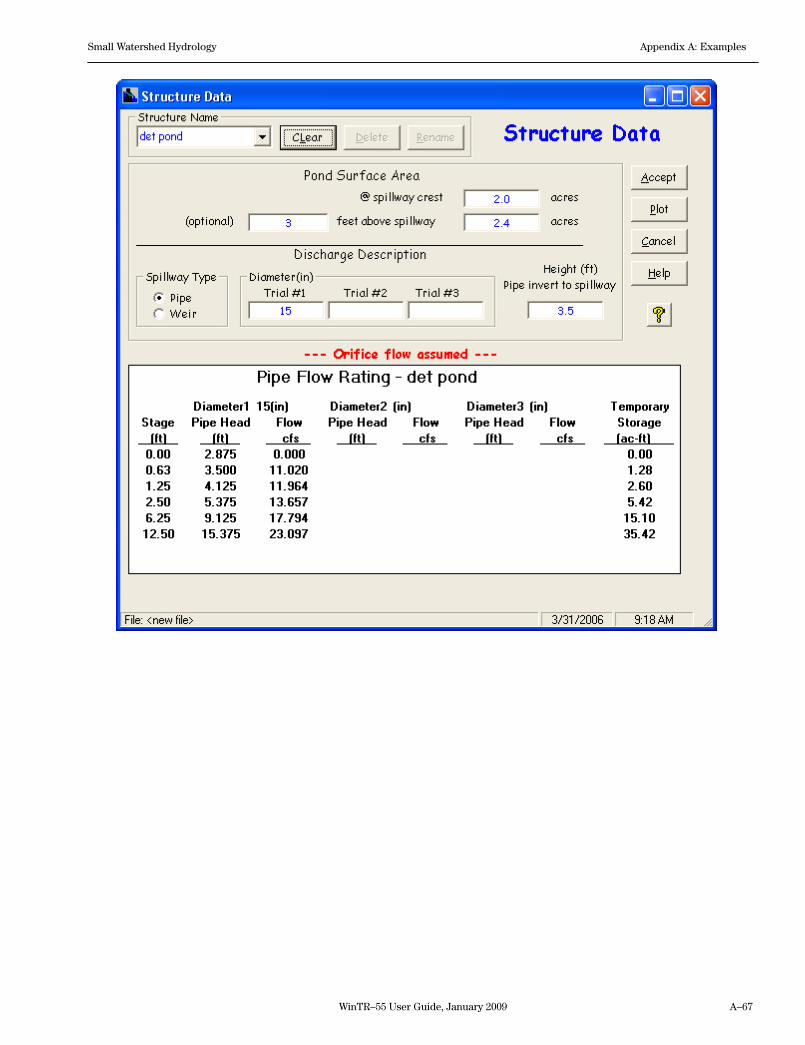
WinTR–55 User Guide, January 2009 A–67
Small Watershed Hydrology Appendix A: Examples
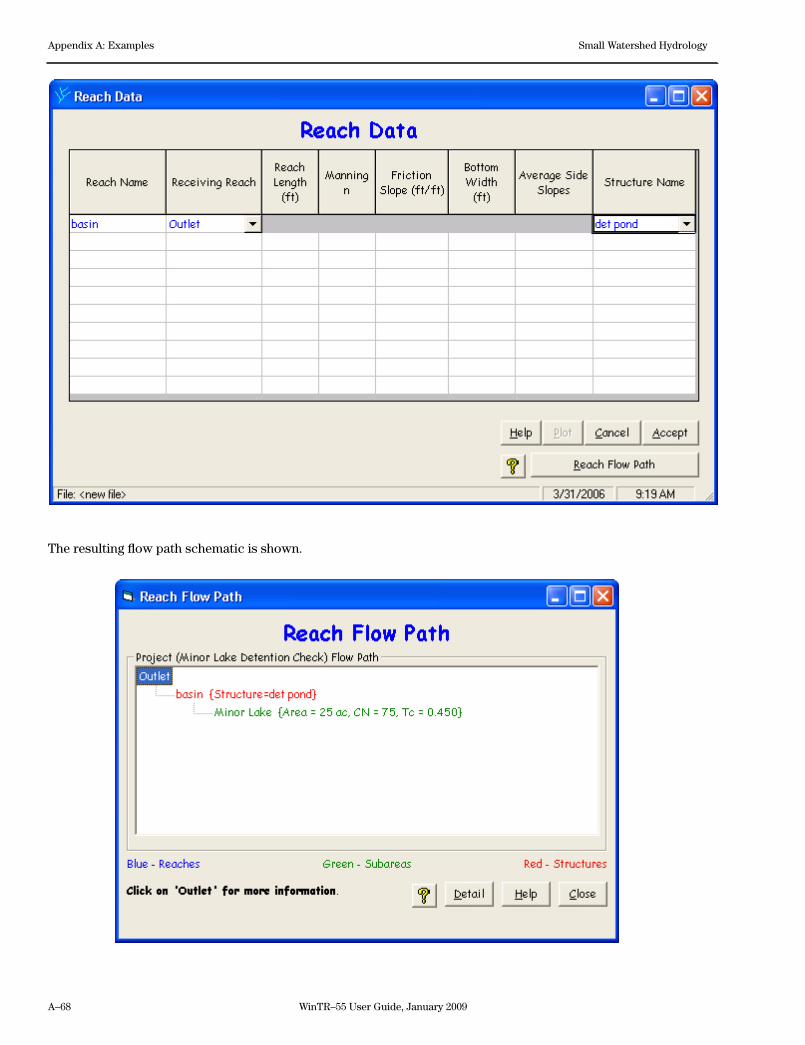
A–68 WinTR–55 User Guide, January 2009
Appendix A: Examples Small Watershed Hydrology
The resulting flow path schematic is shown.
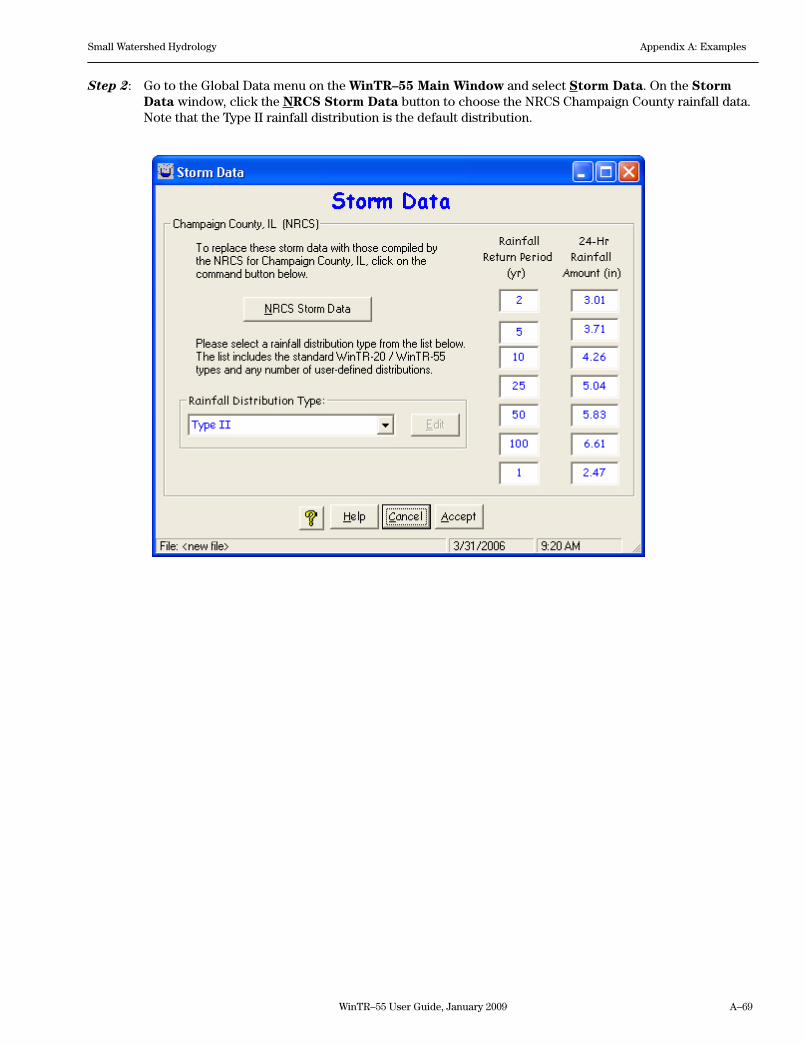
WinTR–55 User Guide, January 2009 A–69
Small Watershed Hydrology Appendix A: Examples
Step 2: Go to the Global Data menu on the WinTR–55 Main Window and select Storm Data. On the Storm Data window, click the NRCS Storm Data button to choose the NRCS Champaign County rainfall data. Note that the Type II rainfall distribution is the default distribution.
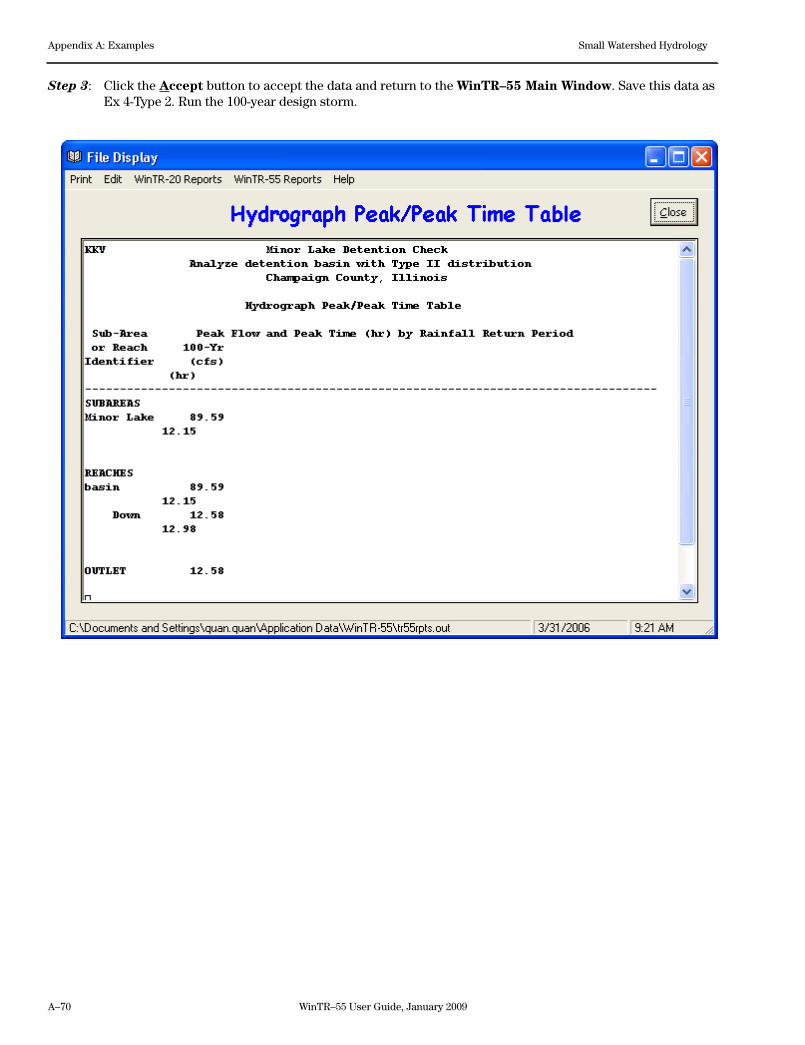
A–70 WinTR–55 User Guide, January 2009
Appendix A: Examples Small Watershed Hydrology
Step 3: Click the Accept button to accept the data and return to the WinTR–55 Main Window. Save this data as Ex 4-Type 2. Run the 100-year design storm.
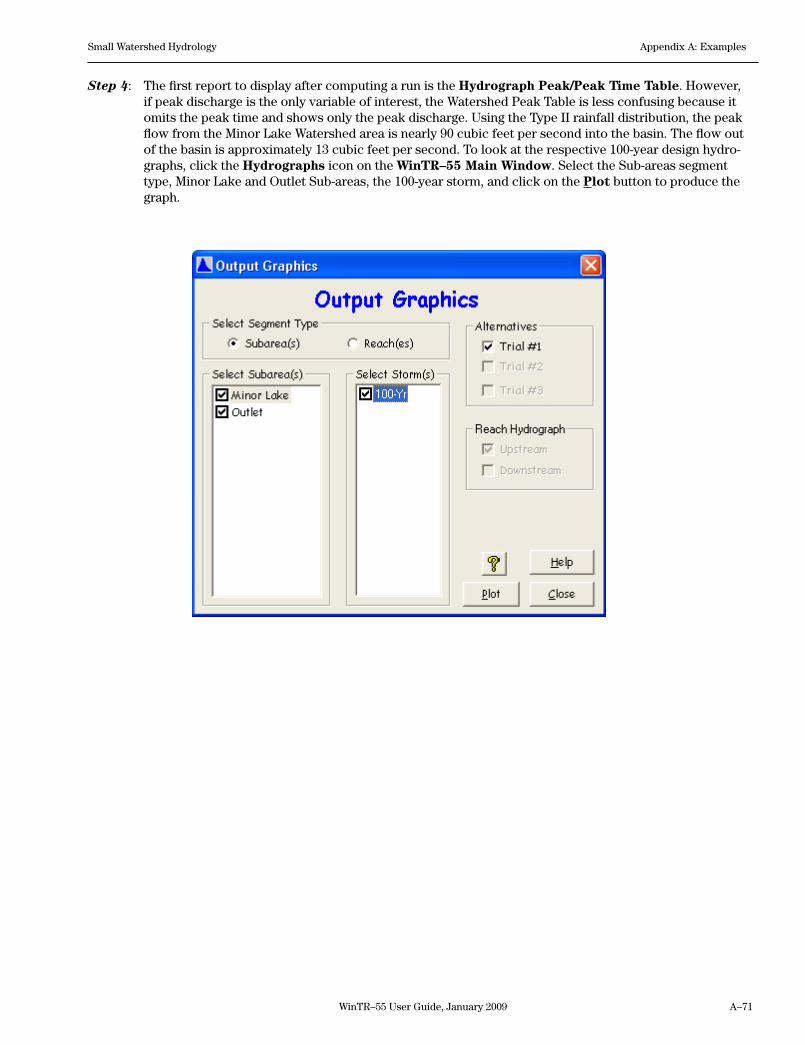
WinTR–55 User Guide, January 2009 A–71
Small Watershed Hydrology Appendix A: Examples
Step 4: The first report to display after computing a run is the Hydrograph Peak/Peak Time Table. However, if peak discharge is the only variable of interest, the Watershed Peak Table is less confusing because it omits the peak time and shows only the peak discharge. Using the Type II rainfall distribution, the peak flow from the Minor Lake Watershed area is nearly 90 cubic feet per second into the basin. The flow out of the basin is approximately 13 cubic feet per second. To look at the respective 100-year design hydro-graphs, click the Hydrographs icon on the WinTR–55 Main Window. Select the Sub-areas segment type, Minor Lake and Outlet Sub-areas, the 100-year storm, and click on the Plot button to produce the graph.
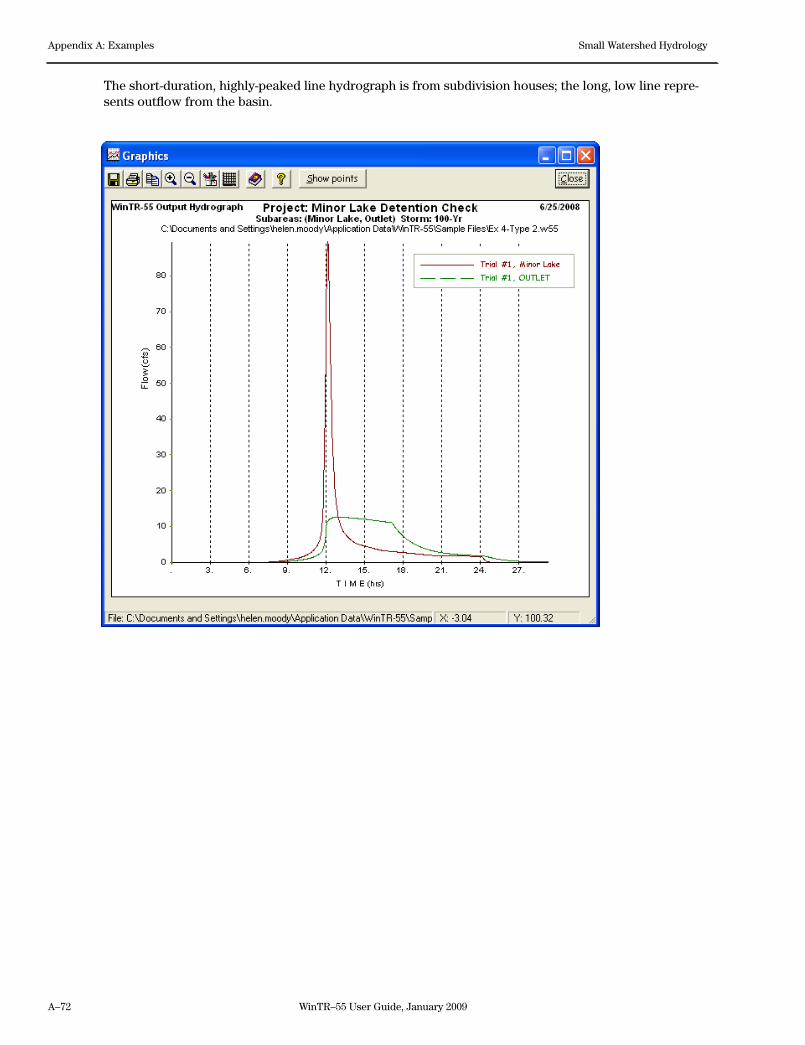
A–72 WinTR–55 User Guide, January 2009
Appendix A: Examples Small Watershed Hydrology
The short-duration, highly-peaked line hydrograph is from subdivision houses; the long, low line repre-sents outflow from the basin.
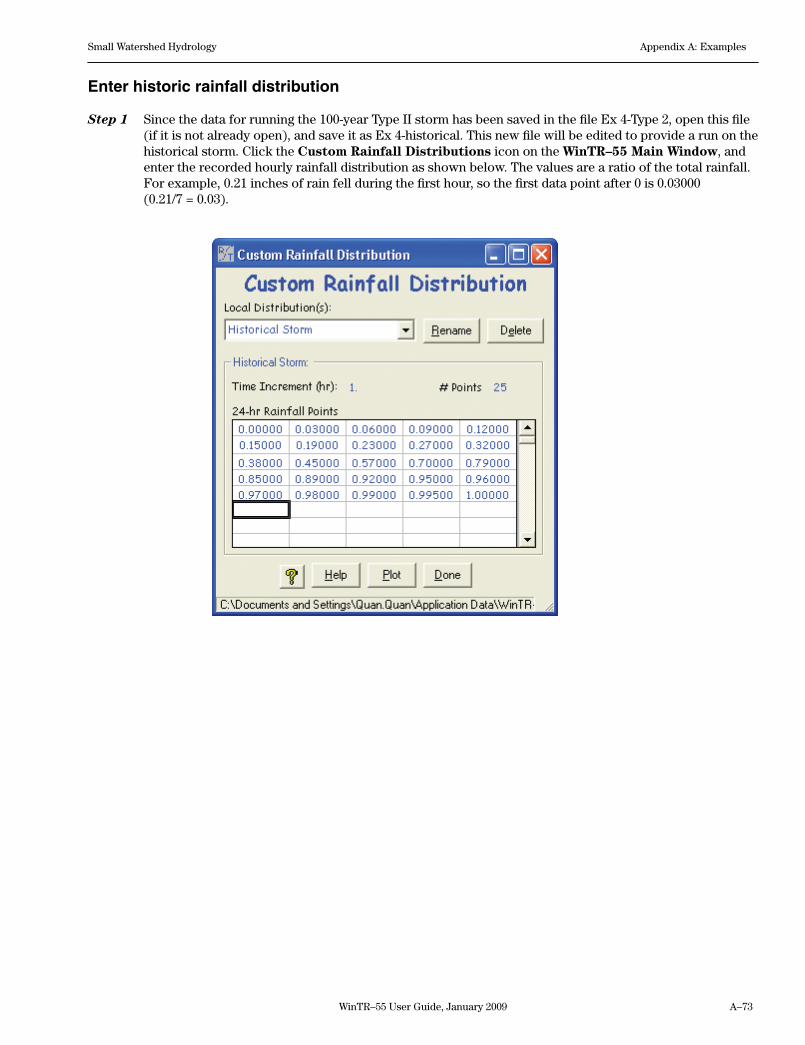
WinTR–55 User Guide, January 2009 A–73
Small Watershed Hydrology Appendix A: Examples
Enter historic rainfall distribution
Step 1 Since the data for running the 100-year Type II storm has been saved in the file Ex 4-Type 2, open this file (if it is not already open), and save it as Ex 4-historical. This new file will be edited to provide a run on the historical storm. Click the Custom Rainfall Distributions icon on the WinTR–55 Main Window, and enter the recorded hourly rainfall distribution as shown below. The values are a ratio of the total rainfall. For example, 0.21 inches of rain fell during the first hour, so the first data point after 0 is 0.03000 (0.21/7=0.03).
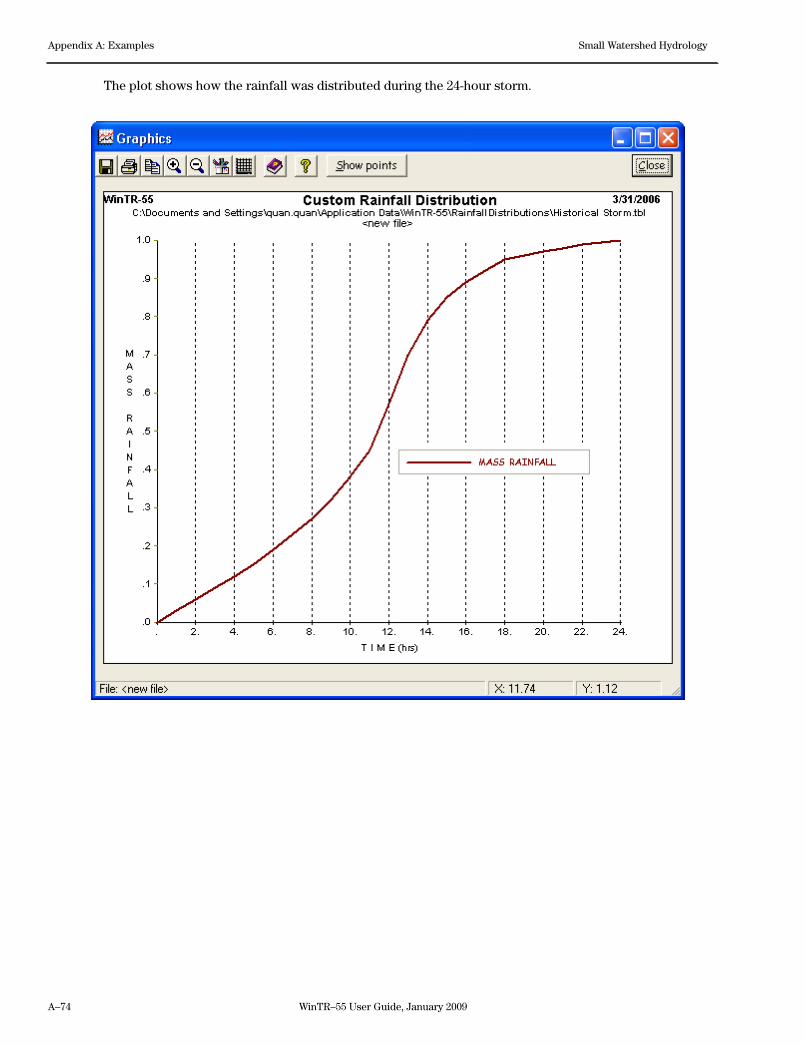
A–74 WinTR–55 User Guide, January 2009
Appendix A: Examples Small Watershed Hydrology
The plot shows how the rainfall was distributed during the 24-hour storm.
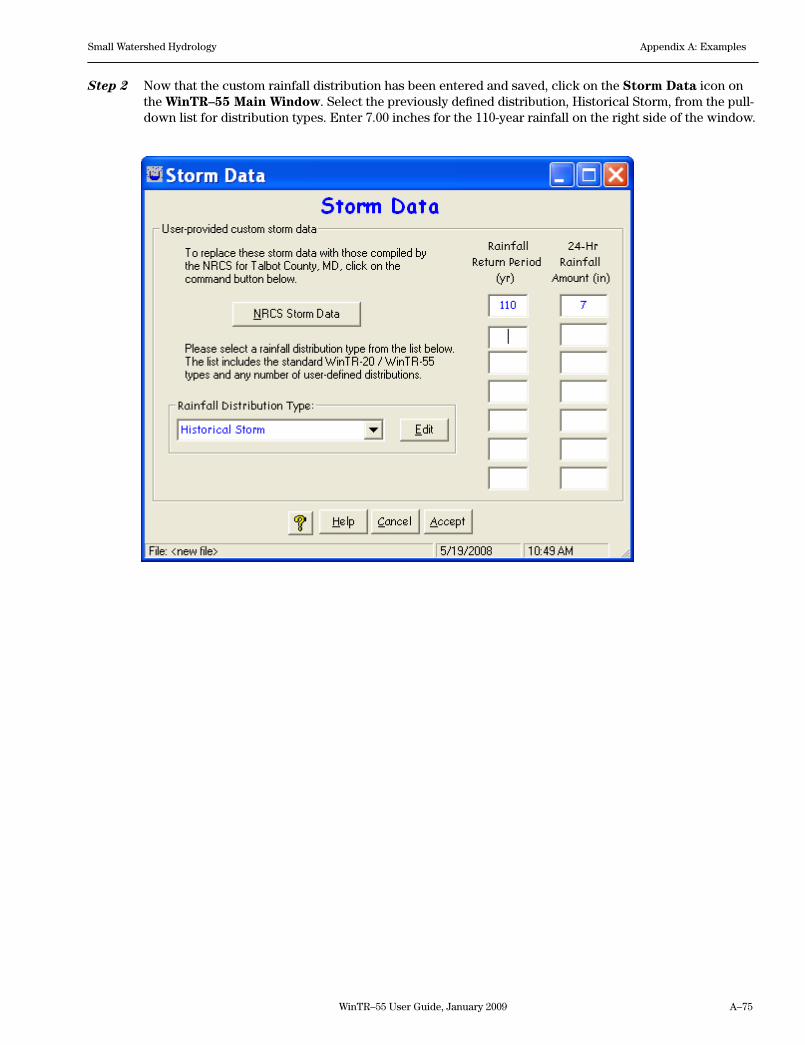
WinTR–55 User Guide, January 2009 A–75
Small Watershed Hydrology Appendix A: Examples
Step 2 Now that the custom rainfall distribution has been entered and saved, click on the Storm Data icon on the WinTR–55 Main Window. Select the previously defined distribution, Historical Storm, from the pull-down list for distribution types. Enter 7.00 inches for the 110-year rainfall on the right side of the window.
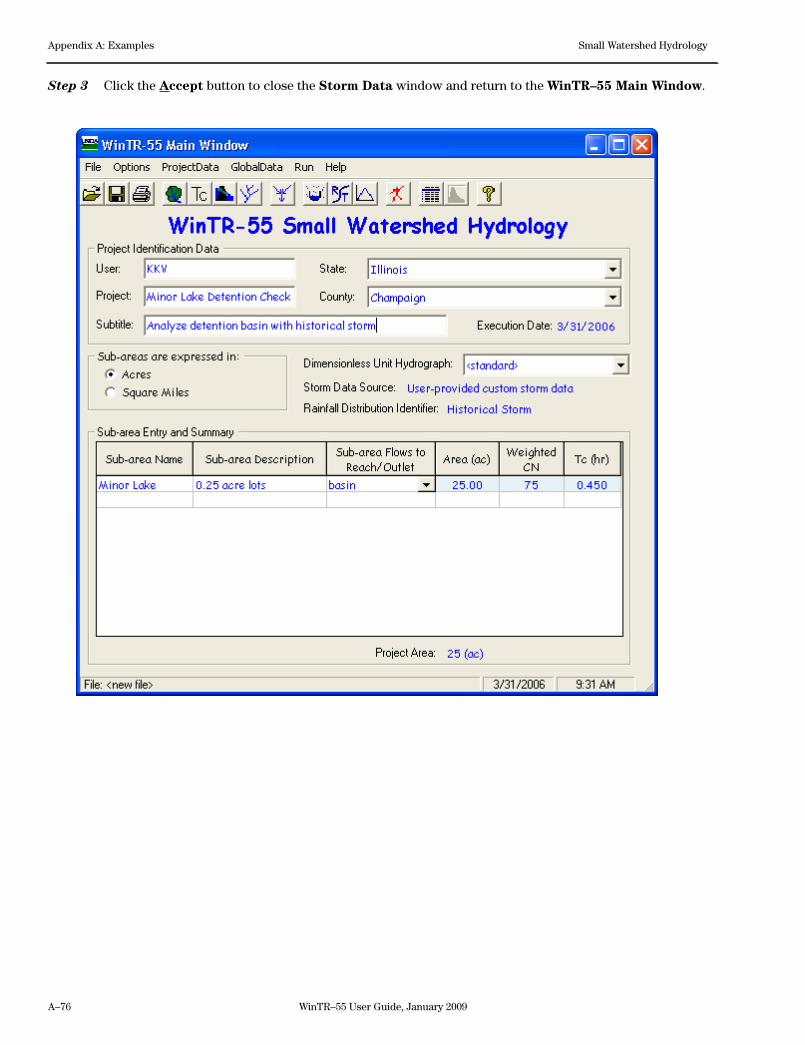
A–76 WinTR–55 User Guide, January 2009
Appendix A: Examples Small Watershed Hydrology
Step 3 Click the Accept button to close the Storm Data window and return to the WinTR–55 Main Window.
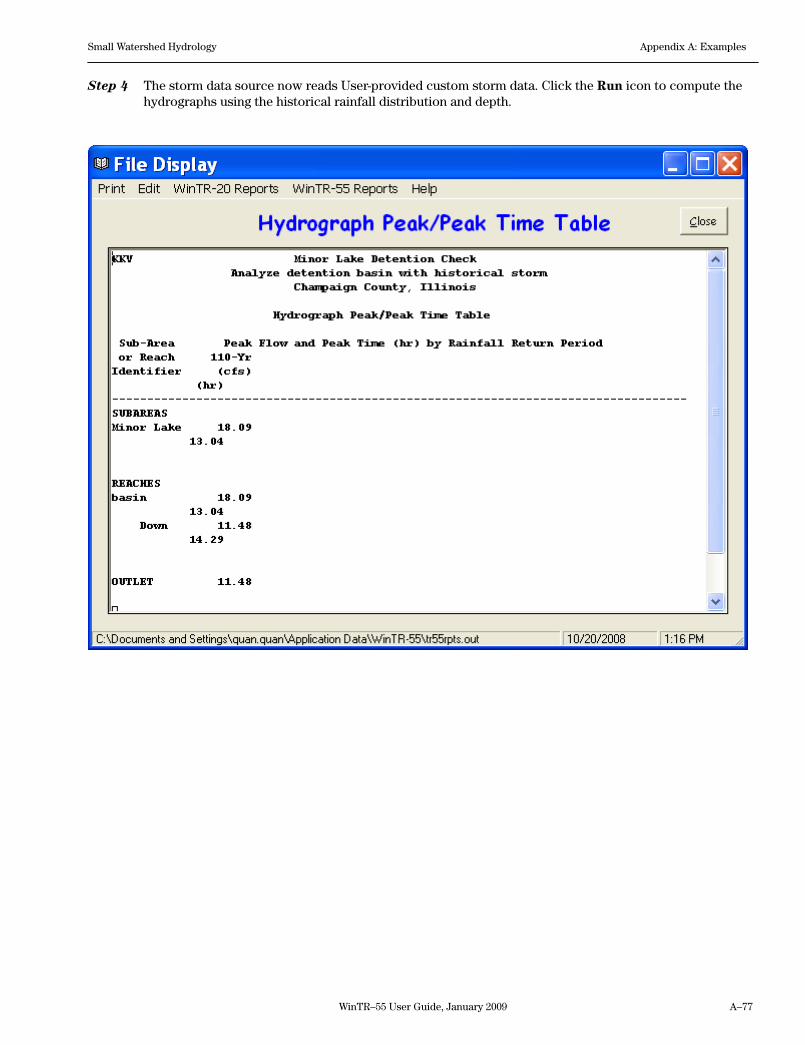
WinTR–55 User Guide, January 2009 A–77
Small Watershed Hydrology Appendix A: Examples
Step 4 The storm data source now reads User-provided custom storm data. Click the Run icon to compute the hydrographs using the historical rainfall distribution and depth.
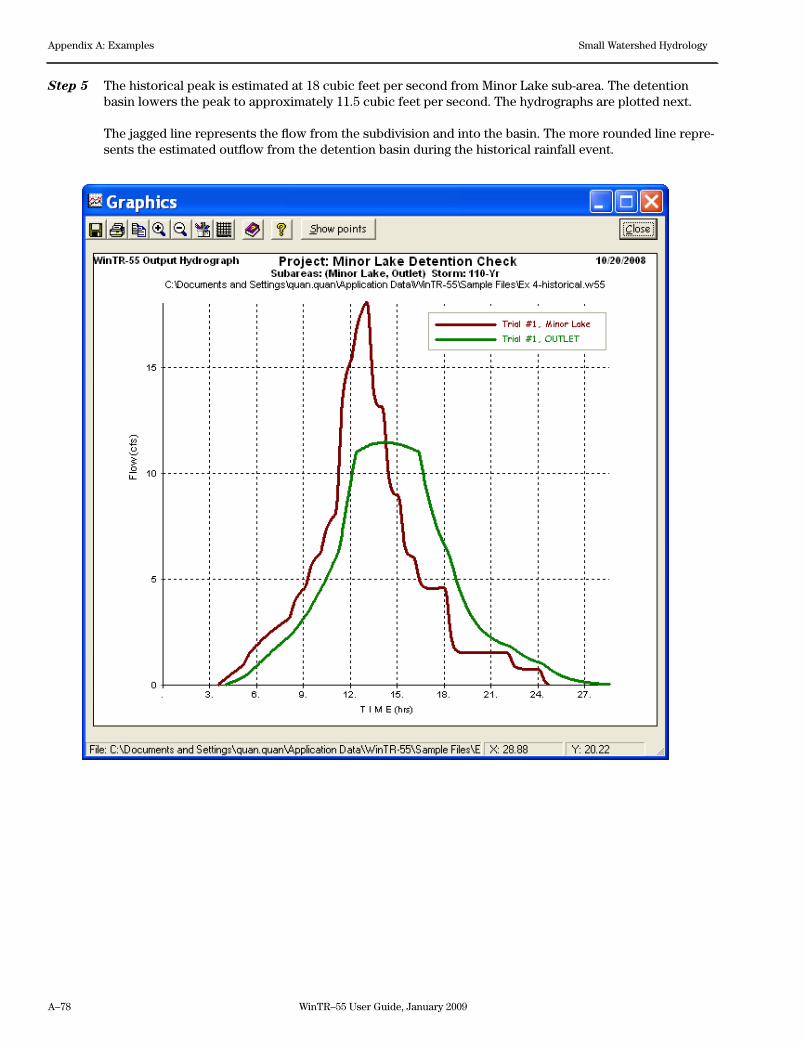
A–78 WinTR–55 User Guide, January 2009
Appendix A: Examples Small Watershed Hydrology
Step 5 The historical peak is estimated at 18 cubic feet per second from Minor Lake sub-area. The detention basin lowers the peak to approximately 11.5 cubic feet per second. The hydrographs are plotted next.
The jagged line represents the flow from the subdivision and into the basin. The more rounded line repre-sents the estimated outflow from the detention basin during the historical rainfall event.
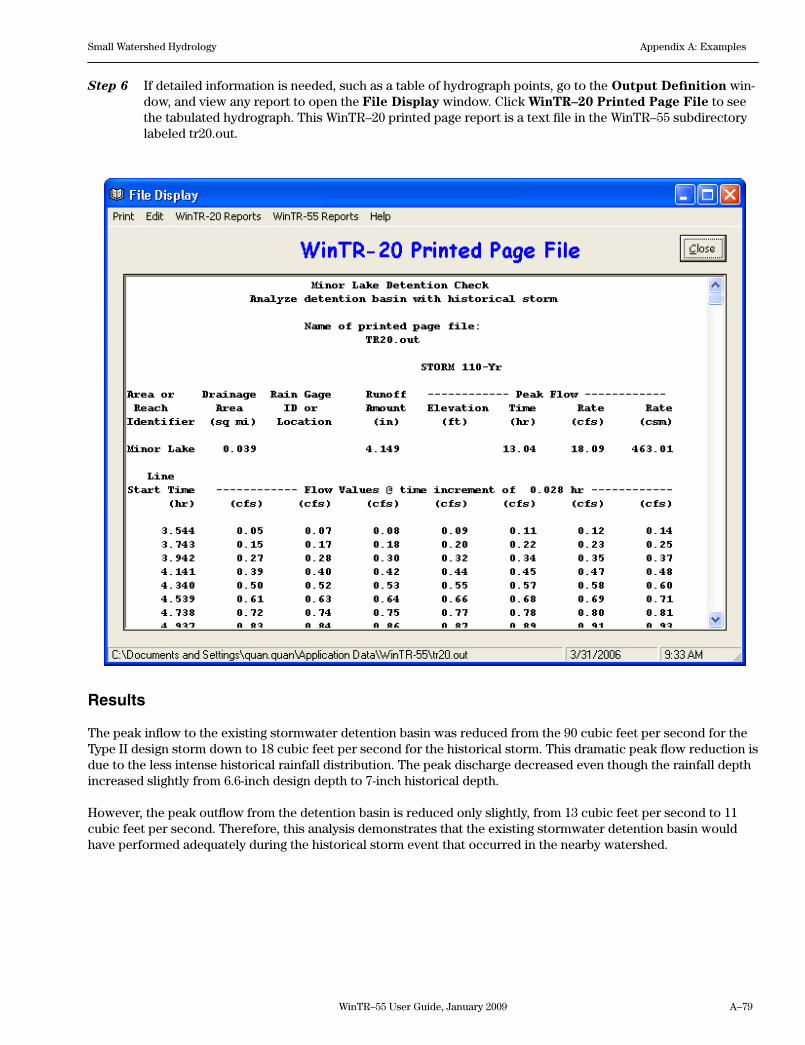
WinTR–55 User Guide, January 2009 A–79
Small Watershed Hydrology Appendix A: Examples
Step 6 If detailed information is needed, such as a table of hydrograph points, go to the Output Definition win-dow, and view any report to open the File Display window. Click WinTR–20 Printed Page File to see the tabulated hydrograph. This WinTR–20 printed page report is a text file in the WinTR–55 subdirectory labeled tr20.out.
Results
The peak inflow to the existing stormwater detention basin was reduced from the 90 cubic feet per second for the Type II design storm down to 18 cubic feet per second for the historical storm. This dramatic peak flow reduction is due to the less intense historical rainfall distribution. The peak discharge decreased even though the rainfall depth increased slightly from 6.6-inch design depth to 7-inch historical depth.
However, the peak outflow from the detention basin is reduced only slightly, from 13 cubic feet per second to 11 cubic feet per second. Therefore, this analysis demonstrates that the existing stormwater detention basin would have performed adequately during the historical storm event that occurred in the nearby watershed.

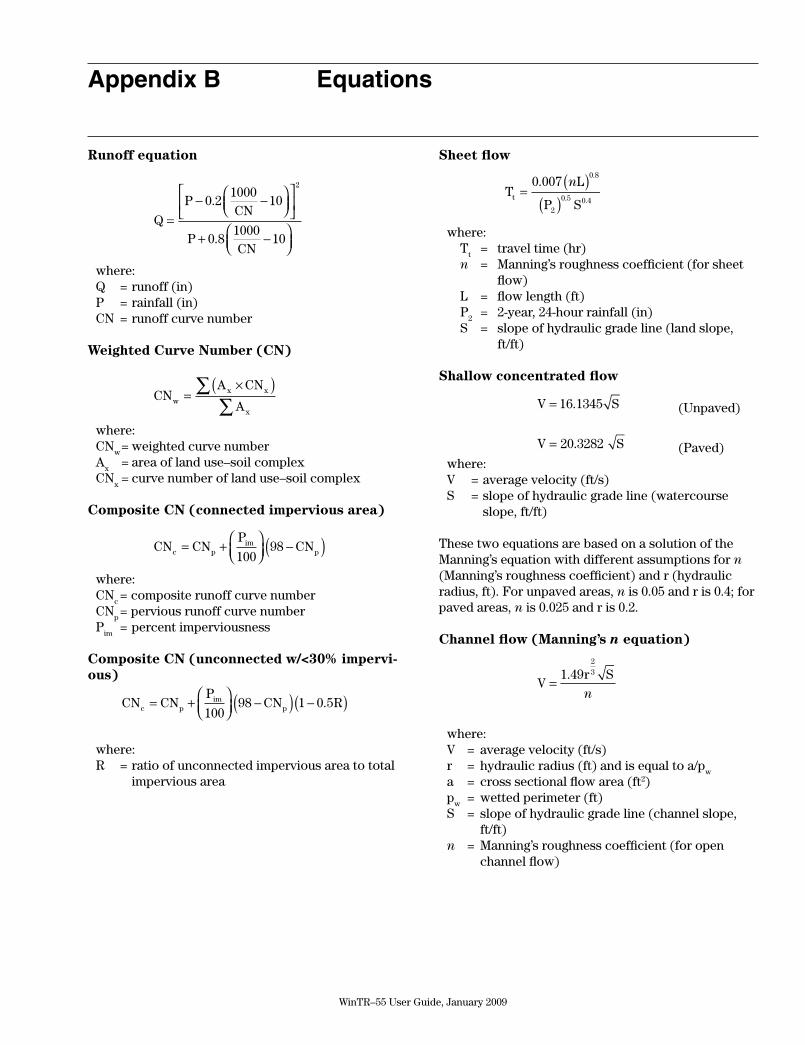
WinTR–55 User Guide, January 2009
Appendix B Equations
Runoff equation
Q
PCN
PCN
=− −
+ −
0 21000
10
0 81000
10
2
.
.
where:Q =runoff(in)P =rainfall(in)CN =runoffcurvenumber
Weighted Curve Number (CN)
CN
A CN
Awx x
x
=×( )∑
∑where:CN
w=weightedcurvenumber
Ax =areaoflanduse–soilcomplex
CNx=curvenumberoflanduse–soilcomplex
Composite CN (connected impervious area)
CN CNP
CNc pim
p= +
−( )100
98
where:CN
c=compositerunoffcurvenumber
CNp=perviousrunoffcurvenumber
Pim
=percentimperviousness
Composite CN (unconnected w/<30% impervi-ous)
CN CNP
CN Rc pim
p= +
−( ) −( )100
98 1 0 5.
where:R =ratioofunconnectedimperviousareatototal
impervious area
Sheet flow
TL
P St =
( )( )
0 0070 8
2
0 5 0 4
..
. .
n
where: T
t = traveltime(hr)
n = Manning’sroughnesscoefficient(forsheetflow)
L = flowlength(ft) P
2 = 2-year,24-hourrainfall(in)
S = slopeofhydraulicgradeline(landslope, ft/ft)
Shallow concentrated flow
V S= 16 1345. (Unpaved)
V S= 20.3282 (Paved)where:V =averagevelocity(ft/s)S =slopeofhydraulicgradeline(watercourse
slope, ft/ft)
These two equations are based on a solution of the Manning’s equation with different assumptions for n (Manning’s roughness coefficient) and r (hydraulic radius, ft). For unpaved areas, n is 0.05 and r is 0.4; for paved areas, n is 0.025 and r is 0.2.
Channel flow (Manning’s n equation)
V
r S=
1 4923.
n
where:V = averagevelocity(ft/s)r = hydraulicradius(ft)andisequaltoa/p
w
a = crosssectionalflowarea(ft2)p
w = wettedperimeter(ft)
S = slopeofhydraulicgradeline(channelslope, ft/ft)
n = Manning’sroughnesscoefficient(foropenchannel flow)
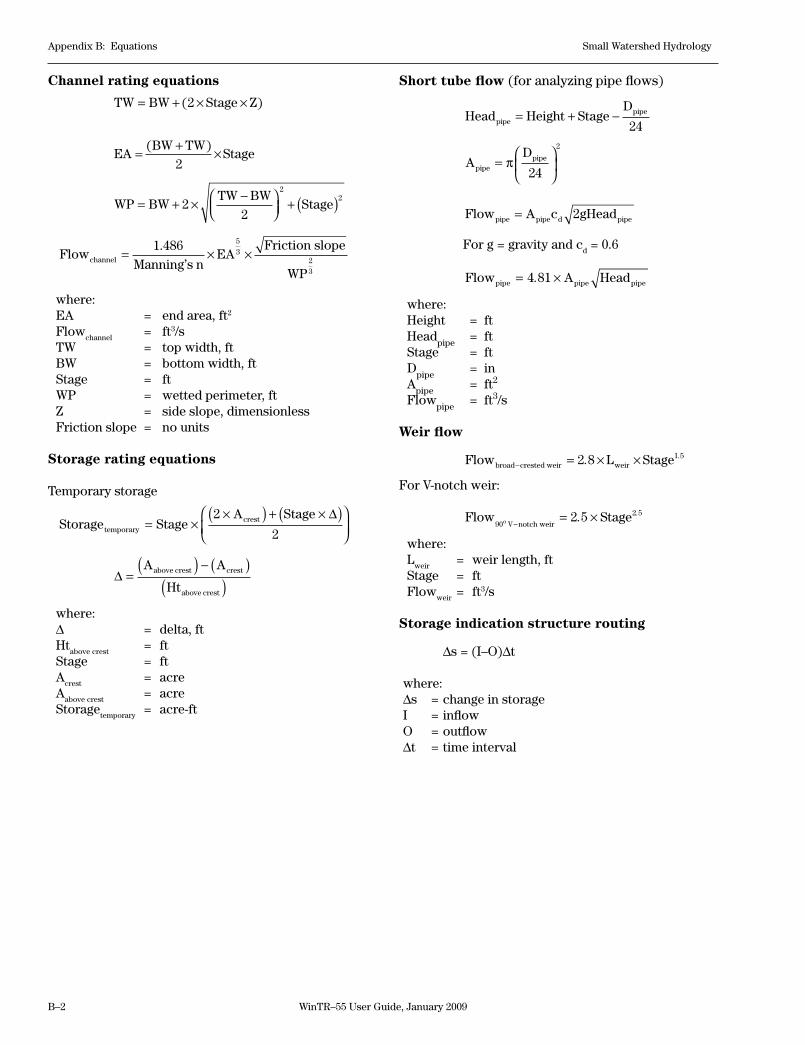
B–2 WinTR–55 User Guide, January 2009
Appendix B: Equations Small Watershed Hydrology
Channel rating equations
TW BW Stage Z= + × ×( )2
EABW TW
Stage= + ×( )2
WP BWTW BW
Stage= + ×−
+ ( )22
22
Flow EA
WPchannel = × ×
1 486 53
23
.
Manning’s n
Friction slope
where: EA = endarea,ft2
Flowchannel
= ft3/sTW = topwidth,ftBW = bottomwidth,ftStage = ftWP = wettedperimeter,ftZ = sideslope,dimensionlessFrictionslope = nounits
Storage rating equations
Temporary storage
Storage StageA Stage
temporarycrest= ×
×( ) + ×( )
2
2
∆
∆ =( ) − ( )
( )A A
Htabove crest crest
above crest where:∆ = delta,ftHt
above crest =
ft
Stage = ftA
crest =acre
Aabove crest
=acreStorage
temporary = acre-ft
Short tube flow (for analyzing pipe flows)
Head Height StageD
pipepipe= + −
24
AD
pipepipe=
π
24
2
Flow A c gHeadpipe pipe d pipe= 2
Forg=gravityandcd=0.6
Flow A Headpipe pipe pipe= ×4 81.
where:Height = ftHead
pipe = ft
Stage = ftD
pipe = in
Apipe
= ft2
Flowpipe
= ft3/s
Weir flow
Flow L Stagebroad crested weir weir− = × ×2 8 1 5. .
For V-notch weir:
Flow Stageo V notch weir90
2 52 5−
= ×. .
where:L
weir = weirlength,ft
Stage = ftFlow
weir= ft3/s
Storage indication structure routing
∆s=(I–O)∆t
where:∆s =changeinstorageI =inflowO =outflow∆t =timeinterval
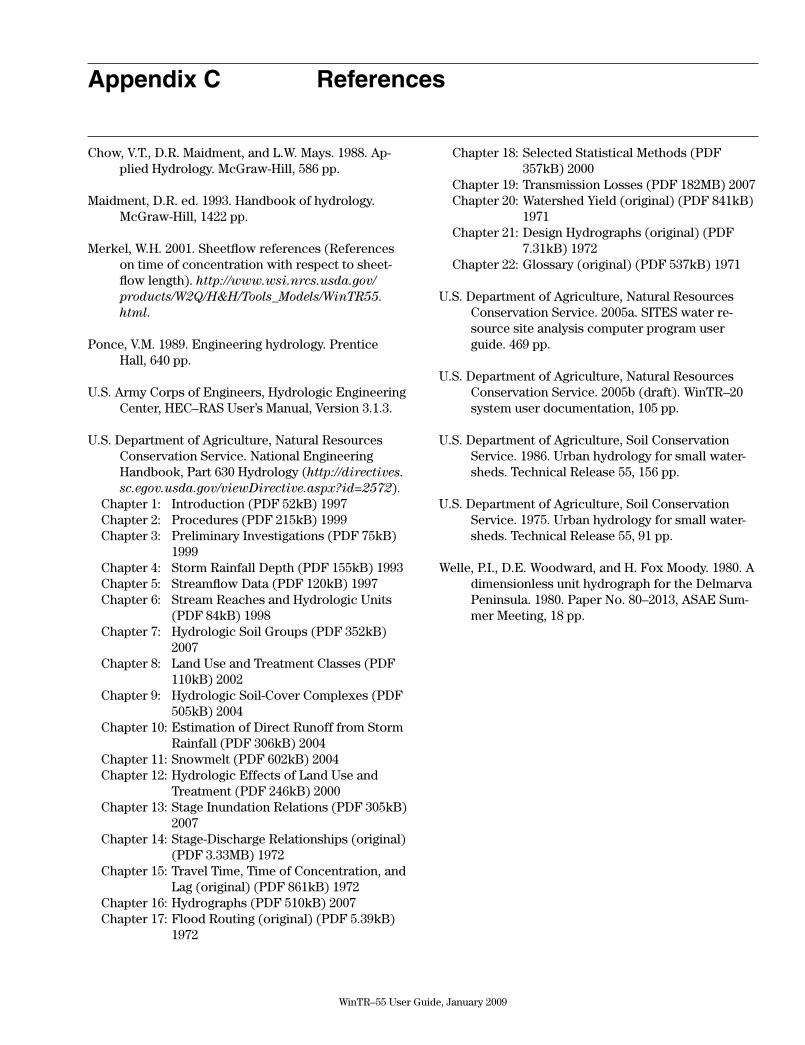
WinTR–55 User Guide, January 2009
Appendix C References
Chow, V.T., D.R. Maidment, and L.W. Mays. 1988. Ap-plied Hydrology. McGraw-Hill, 586 pp.
Maidment, D.R. ed. 1993. Handbook of hydrology. McGraw-Hill, 1422 pp.
Merkel, W.H. 2001. Sheetflow references (References on time of concentration with respect to sheet-flow length). http://www.wsi.nrcs.usda.gov/products/W2Q/H&H/Tools_Models/WinTR55.html.
Ponce, V.M. 1989. Engineering hydrology. Prentice Hall, 640 pp.
U.S. Army Corps of Engineers, Hydrologic Engineering Center, HEC–RAS User’s Manual, Version 3.1.3.
U.S. Department of Agriculture, Natural Resources Conservation Service. National Engineering Handbook, Part 630 Hydrology (http://directives.sc.egov.usda.gov/viewDirective.aspx?id=2572).
Chapter 1: Introduction (PDF 52kB) 1997 Chapter 2: Procedures (PDF 215kB) 1999 Chapter 3: Preliminary Investigations (PDF 75kB)
1999 Chapter 4: Storm Rainfall Depth (PDF 155kB) 1993 Chapter 5: Streamflow Data (PDF 120kB) 1997 Chapter 6: Stream Reaches and Hydrologic Units
(PDF 84kB) 1998 Chapter 7: Hydrologic Soil Groups (PDF 352kB)
2007 Chapter 8: Land Use and Treatment Classes (PDF
110kB) 2002 Chapter 9: Hydrologic Soil-Cover Complexes (PDF
505kB) 2004 Chapter 10: Estimation of Direct Runoff from Storm
Rainfall (PDF 306kB) 2004 Chapter 11: Snowmelt (PDF 602kB) 2004 Chapter 12: Hydrologic Effects of Land Use and
Treatment (PDF 246kB) 2000 Chapter 13: Stage Inundation Relations (PDF 305kB)
2007 Chapter 14: Stage-Discharge Relationships (original)
(PDF 3.33MB) 1972 Chapter 15: Travel Time, Time of Concentration, and
Lag (original) (PDF 861kB) 1972 Chapter 16: Hydrographs (PDF 510kB) 2007 Chapter 17: Flood Routing (original) (PDF 5.39kB)
1972
Chapter 18: Selected Statistical Methods (PDF 357kB) 2000
Chapter 19: Transmission Losses (PDF 182MB) 2007 Chapter 20: Watershed Yield (original) (PDF 841kB)
1971 Chapter 21: Design Hydrographs (original) (PDF
7.31kB) 1972 Chapter 22: Glossary (original) (PDF 537kB) 1971
U.S. Department of Agriculture, Natural Resources Conservation Service. 2005a. SITES water re-source site analysis computer program user guide. 469 pp.
U.S. Department of Agriculture, Natural Resources Conservation Service. 2005b (draft). WinTR–20 system user documentation, 105 pp.
U.S. Department of Agriculture, Soil Conservation Service. 1986. Urban hydrology for small water-sheds. Technical Release 55, 156 pp.
U.S. Department of Agriculture, Soil Conservation Service. 1975. Urban hydrology for small water-sheds. Technical Release 55, 91 pp.
Welle, P.I., D.E. Woodward, and H. Fox Moody. 1980. A dimensionless unit hydrograph for the Delmarva Peninsula. 1980. Paper No. 80–2013, ASAE Sum-mer Meeting, 18 pp.