Embed Size (px)
Citation preview

Atmos. Chem. Phys., 12, 10051–10064, 2012www.atmos-chem-phys.net/12/10051/2012/doi:10.5194/acp-12-10051-2012© Author(s) 2012. CC Attribution 3.0 License.
AtmosphericChemistry
and Physics
Wintertime particulate pollution episodes in anurban valley of the Western US: a case study
L.-W. A. Chen1,2, J. G. Watson1,2, J. C. Chow1,2, M. C. Green1, D. Inouye3, and K. Dick3
1Division of Atmospheric Sciences, Desert Research Institute, 2215 Raggio Parkway, Reno, NV 89512, USA2State Key Laboratory of Loess and Quaternary Geology, Institute of Earth Environment, Chinese Academy of Sciences,Xi’an, China3Washoe County District Health Department Air Quality Management Division, Reno, NV, USA
Correspondence to:L.-W. A. Chen ([email protected])
Received: 18 April 2012 – Published in Atmos. Chem. Phys. Discuss.: 26 June 2012Revised: 24 September 2012 – Accepted: 7 October 2012 – Published: 2 November 2012
Abstract. This study investigates the causes of elevatedPM2.5 episodes and potential exceedences of the US Na-tional Ambient Air Quality Standards (NAAQS) in TruckeeMeadows, Nevada, an urban valley of the Western US, dur-ing winter 2009/2010, an unusually cold and snowy winter.Continuous PM2.5 mass and time-integrated chemical spe-ciation data were acquired from a central valley monitoringsite, along with meteorological measurements from nearbysites. All nine days with PM2.5 > 35 µg m−3 showed 24-h av-erage temperature inversion of 1.5–4.5◦C and snow coverof 8–18 cm. Stagnant atmospheric conditions limited windventilation while highly reflective snow cover reduced day-time surface heating creating persistent inversion. Elevatedammonium nitrate (NH4NO3) and water associated with itare found to be main reasons for the PM2.5 exceedances. Aneffective-variance chemical mass balance (EV-CMB) recep-tor model using locally-derived geological profiles and inor-ganic/organic markers confirmed secondary NH4NO3 (27–37 %), residential wood combustion (RWC; 11–51 %), anddiesel engine exhaust (7–22 %) as the dominant PM2.5 con-tributors. Paved road dust and de-icing materials were minor,but detectable contributors. RWC is a more important sourcethan diesel for organic carbon (OC), but vice versa for el-emental carbon (EC). A majority of secondary NH4NO3 isalso attributed to RWC and diesel engines (including snowremoval equipment) through oxides of nitrogen (NOx) emis-sions from these sources. Findings from this study may applyto similar situations experienced by other urban valleys.
1 Introduction
The Truckee Meadows is a mountain valley in NorthernNevada of the US with the Sierra Nevadas to its west andthe Great Basin to its east. The area of the valley flooris ∼ 25 km2, containing downtowns of the cities of Renoand Sparks with a population of∼ 200 000 (2010 cen-sus). It is distant from major metropolitan areas by at least200 km. Similar urban valleys are common in the WesternCordillera region, including Salt Lake City, Utah, Boise-Nampa, Idaho, Missoula, Montana, and Kelowna, BritishColumbia (Canada). Air quality in such valleys is determinedby the interaction between synoptic winds and local thermalcirculation (Fernando, 2010). Under stable conditions, pol-lutants released from the valley floor tend to be confined bysurrounding mountain ranges leading to elevated pollutionepisodes.
Particulate matter 2.5 (PM2.5, airborne particles with aero-dynamic diameter equal or less than 2.5 µm) is a crite-ria air pollutant regulated by the US Environmental Pro-tection Agency (USEPA) for its adverse effects on publichealth, visibility, and environment (USEPA, 2004). PM2.5episodes often show patterns (e.g., chemical compositionand seasonality) related to region-specific meteorology andsources (Chu, 2004; Tai et al., 2010). Compliance monitoringfor PM2.5 in the Truckee Meadows (Mendoza and Inouye,2011) showed that most of the high values occurred duringwinter, with some excursions during late summer and fallwhen smoke from regional wildfires was a contributor. Ling-Barnes (2010) estimates that most primary PM2.5 emissions
Published by Copernicus Publications on behalf of the European Geosciences Union.

10052 L.-W. A. Chen et al.: Wintertime particulate pollution episodes
in the Truckee Meadows are from area (non-point) sourcesassociated with wintertime residential heating. Other impor-tant sources include motor vehicle engine exhaust and fugi-tive dust.
Although Mendoza and Inouye (2011) have demonstratedattainment of PM2.5 National Ambient Air Quality Stan-dards (NAAQS) of 15 µg m−3 annual arithmetic mean, av-eraged over three years, and 35 µg m−3 for the 98th per-centile of 24-h averages, averaged over three years (Bach-mann, 2007; Chow et al., 2007b), in the Truckee Mead-ows since 2001, several 24-h PM2.5 concentrations exceeding35 µg m−3 were observed from 2008 to 2010. Consideringalso that USEPA (2012) has recently proposed reducing theannual NAAQS to 12–13 µg m−3, these high episodes raiseconcerns of potential NAAQS non-attainment in the future.
This study investigates interactions between meteorologyand emissions that lead to wintertime PM2.5 episodes inthe Truckee Meadows valley. The analysis is based on reg-ulatory monitoring data and additional measurements onarchived samples that facilitate source apportionment using achemical mass balance (CMB) approach. Findings from thisstudy provide information for developing strategies to reducePM2.5 levels in this and similar urban valleys.
2 Ambient monitoring data collection and analysis
The main PM2.5 monitoring site in Reno (RENOC:39.525079° N,−119.807723° W, 1371 m a.m.s.l.) is locatedin a residential/commercial area south of the Truckee River,∼ 2 km west of the I-580 north/south freeway and∼ 1 kmsouth of the I-80 east/west freeway. A Mexican restaurantis located∼ 20 m east of the station. As part of the USEPASpeciation Trends Network (STN), PM2.5 filters have beenacquired at RENOC every 3rd day with speciation sam-plers (Met One SASS+ URG 3000N Carbon Sampler) forchemical characterization (Chow et al., 2010; Flanagan etal., 2006). Additional PM2.5 and PM10 filter samples aretaken with Federal Reference Method (FRM) samplers forgravimetric analysis of mass concentrations. Hourly aver-age PM2.5 and oxides of nitrogen (NOx) are also mea-sured by a beta attenuation monitor (BAM; MetOne E-BAM;Grants Pass, OR) and a chemiluminescent analyzer (42C,Thermo Environmental Instruments, Franklin, MA), respec-tively. The sampling probes are situated∼ 4 m above groundlevel and∼ 1 m above the rooftop of the shelter. For thisstudy, data for the December 2008–January 2009 and De-cember 2009–January 2010 were retrieved from USEPA’sAir Quality System database (AQS;http://www.epa.gov/ttn/airs/airsaqs/index.htm). Concurrent meteorological observa-tions were obtained from stations on the valley floor and athigher elevations, as shown in Fig. 1.
Based on the FRM measurements, there were four 24-hPM2.5 samples exceeding 35 µg m−3 out of 20 measure-ments at the RENOC site during December 2009 and Jan-
0
1
Fig. 1. Topography of the Truckee Meadows valley and loca-tions/elevations of PM2.5 monitoring site (RENOC), valley-floorweather station (Reno Rail Yard,TRail), elevated weather station(Galena,TGalena), Reno-Tahoe International Airport (RNO), andthe Desert Research Institute (DRI).
uary 2010 (i.e., 9, 15, 18 December 2009, and 5 January2010). Daily averaged BAM data reported five additionalPM2.5 exceedances (i.e., 10, 11, 14, 19, and 20 December2009) during the period. The December 2009–January 2010average FRM PM2.5 mass concentration was 17.9 µg m−3,∼ 45 % higher than the December 2008–January 2009 aver-age (12.3 µg m−3). PM2.5 mass from the BAM and the speci-ation samplers showed good agreement with the FRM mass(r2 > 0.95 and average differences within ± 7 %) (Watson etal., 2011).
2.1 Meteorological characteristics of PM2.5 episodes
Temperature inversions often reflect calm winds and low ver-tical dispersion that enhance accumulation of pollutants re-leased from the surface. Valley-floor and elevated meteoro-logical observations (Fig. 1) were used to characterize thestrength of inversions in the Truckee Meadows area. TheReno Rail Yard site (39.5391° N 119.78605° W) is on the val-ley floor at an elevation of 1360 m mean sea level (m.s.l.),∼ 1.3 km northeast of RENOC, while the Galena Re-mote Automated Weather Station (RAWS) site (39.3794◦ N119.8319◦ W) is at an elevation of 1710 m m.s.l., generallyupwind of the Truckee Meadows, and at the top of the atmo-spheric boundary layer.
Good relationships were found between PM2.5 mass at theRENO C site and vertical temperature differences. For win-ter 2009/2010, Fig. 2a shows that there were three periods(i.e., 8–11 December 2009; 14–20 December 2009; and 3–6January 2010) of persistent, multi-day inversions with max-imum inversion strengths (1T = TGalena− TRail) > 5 °C andminimum1T >− 2 °C. During these periods,1T peaked ator just before midday. As surface heating increased in the af-ternoon, the inversion coupled to layers aloft near 16:00 local
Atmos. Chem. Phys., 12, 10051–10064, 2012 www.atmos-chem-phys.net/12/10051/2012/

L.-W. A. Chen et al.: Wintertime particulate pollution episodes 10053
0
1 (a) 2
3 (b) 4
‐15
0
15
30
45
60
75
90
105
120
‐5
0
5
10
15
20
25
30
35
40
12/01/09 12/11/09 12/21/09 12/31/09 01/10/10 01/20/10 01/30/10
PM2.5concen
tration (µg m
‐3)
Tempe
rature Inversion, ΔT (⁰C)
Snow Cover ΔT 1‐hr PM2.5 24‐hr PM2.5
20
10
0
20
10
0Snow
(cm)
‐15
0
15
30
45
60
75
90
105
120
‐5
0
5
10
15
20
25
30
35
40
12/01/08 12/11/08 12/21/08 12/31/08 01/10/09 01/20/09 01/30/09
PM2.5concen
tration (µg m
‐3)
Tempe
rature Inversion, ΔT (⁰C) Snow Cover ΔT 1‐hr PM2.5 24‐hr PM2.5
20
10
0
20
10
0Snow
(cm)
Fig. 2.Snow cover (daily), temperature inversion (1T = TGalena−TRail), and corresponding PM2.5 mass concentrations by beta attenuationmonitor (BAM) during:(a) December 2009–January 2010, and(b) December 2008–January 2009.1T > 0 (i.e., with inversion) and1T < 0are marked by red and blue, respectively.
standard time (LST), but re-instated itself soon after sun-set. The highest PM2.5 concentrations, including all 24-h ex-ceedances, occurred near the middle of each inversion pe-riod. For other times of the winter, inversions were weak andshort-lived, typically lasting no more than several hours. Thewinter also experienced a few snow storms during which noinversions occurred throughout a day.
There were neither extended periods of strong inversionsnor PM2.5 exceedances during winter 2008/2009 (Fig. 2b).Daily average1T is positively correlated with 24-h PM2.5measured by BAM withr2 of 0.785 and 0.420 for winter2009/2010 and winter 2008/2009, respectively. Inversionshave been confirmed by Silcox et al. (2012) to strongly influ-ence PM2.5 concentration in the Salt Lake City valley, thoughin that study inversion (or stability) was measured throughheat deficit, the energy required to dry adiabatically mix alayer.
December 2009 was the sixth coldest and fifth snowiestDecember (39.6 cm snowfall) recorded since 1931 at the
Reno-Tahoe International Airport (RNO, see Fig. 1). Snow-fall was low to moderate for the other three months (1.3–15.0 cm; December 2008, January 2009, and January 2010).Highly reflective and melting snow cover reduces daytimesurface heating, which allows the formation of persistentinversions throughout the day under stable synoptic condi-tions. Forty-eight out of 124 days in the two winter peri-ods recorded snow cover of≥ 2.5 cm at RNO with an av-erage daily1T of 0.1 ± 3.6 °C, which is significantly higher(p = 0.005) than the average daily1T of −1.6 ± 2.9 °C forthe 76 days without snow cover. High1T can occur on dayswithout snow cover, but heating in the afternoon on thosedays is usually strong enough to break the inversion com-pletely, avoiding day-to-day accumulation. This was the casefor most of winter 2008/2009 as shown in Fig. 2b. Snowcover also increased relative humidity (RH), as RH averaged78 % on snow-cover days and 66 % on no-snow-cover days.
Figure 3 compares BAM PM2.5 in both winters asa function of 1T and snow cover. All nine days with
www.atmos-chem-phys.net/12/10051/2012/ Atmos. Chem. Phys., 12, 10051–10064, 2012
10054 L.-W. A. Chen et al.: Wintertime particulate pollution episodes
1
0
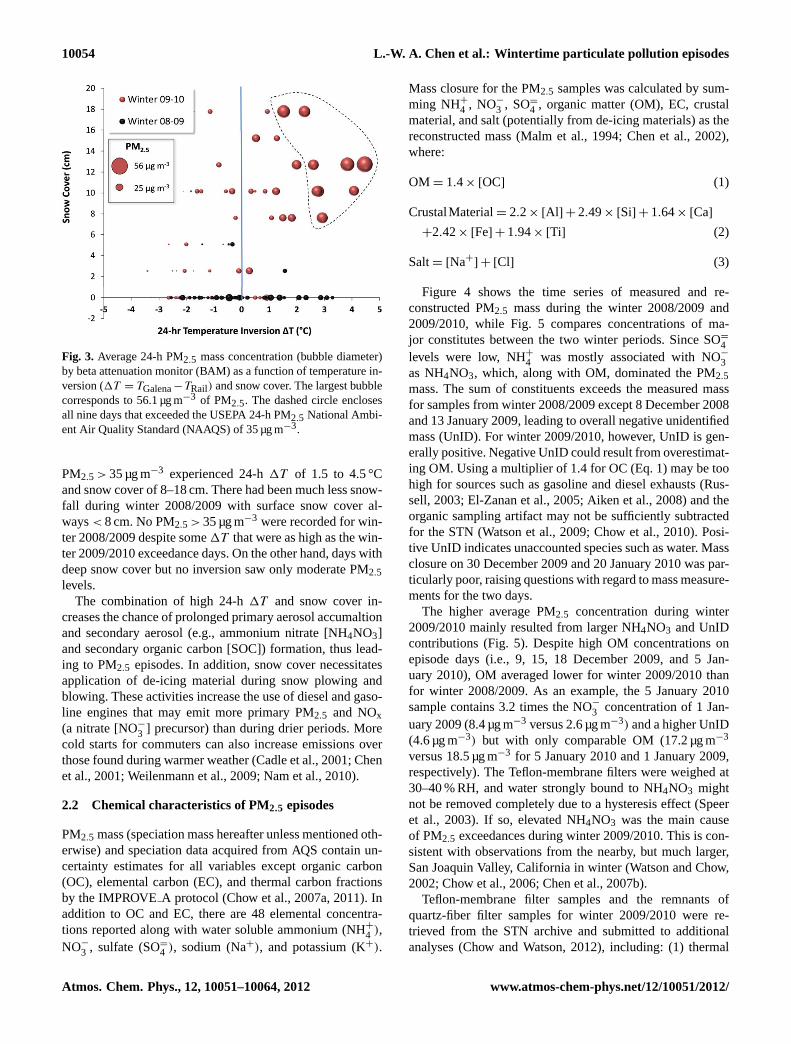
Fig. 3. Average 24-h PM2.5 mass concentration (bubble diameter)by beta attenuation monitor (BAM) as a function of temperature in-version (1T = TGalena−TRail) and snow cover. The largest bubblecorresponds to 56.1 µg m−3 of PM2.5. The dashed circle enclosesall nine days that exceeded the USEPA 24-h PM2.5 National Ambi-ent Air Quality Standard (NAAQS) of 35 µg m−3.
PM2.5 > 35 µg m−3 experienced 24-h1T of 1.5 to 4.5 °Cand snow cover of 8–18 cm. There had been much less snow-fall during winter 2008/2009 with surface snow cover al-ways< 8 cm. No PM2.5 > 35 µg m−3 were recorded for win-ter 2008/2009 despite some1T that were as high as the win-ter 2009/2010 exceedance days. On the other hand, days withdeep snow cover but no inversion saw only moderate PM2.5levels.
The combination of high 24-h1T and snow cover in-creases the chance of prolonged primary aerosol accumaltionand secondary aerosol (e.g., ammonium nitrate [NH4NO3]and secondary organic carbon [SOC]) formation, thus lead-ing to PM2.5 episodes. In addition, snow cover necessitatesapplication of de-icing material during snow plowing andblowing. These activities increase the use of diesel and gaso-line engines that may emit more primary PM2.5 and NOx(a nitrate [NO−
3 ] precursor) than during drier periods. Morecold starts for commuters can also increase emissions overthose found during warmer weather (Cadle et al., 2001; Chenet al., 2001; Weilenmann et al., 2009; Nam et al., 2010).
2.2 Chemical characteristics of PM2.5 episodes
PM2.5 mass (speciation mass hereafter unless mentioned oth-erwise) and speciation data acquired from AQS contain un-certainty estimates for all variables except organic carbon(OC), elemental carbon (EC), and thermal carbon fractionsby the IMPROVEA protocol (Chow et al., 2007a, 2011). Inaddition to OC and EC, there are 48 elemental concentra-tions reported along with water soluble ammonium (NH+
4 ),NO−
3 , sulfate (SO=4 ), sodium (Na+), and potassium (K+).
Mass closure for the PM2.5 samples was calculated by sum-ming NH+
4 , NO−
3 , SO=
4 , organic matter (OM), EC, crustalmaterial, and salt (potentially from de-icing materials) as thereconstructed mass (Malm et al., 1994; Chen et al., 2002),where:
OM = 1.4× [OC] (1)
CrustalMaterial= 2.2× [Al ] + 2.49× [Si] + 1.64× [Ca]
+2.42× [Fe] + 1.94× [Ti] (2)
Salt= [Na+] + [Cl] (3)
Figure 4 shows the time series of measured and re-constructed PM2.5 mass during the winter 2008/2009 and2009/2010, while Fig. 5 compares concentrations of ma-jor constitutes between the two winter periods. Since SO=
4levels were low, NH+4 was mostly associated with NO−3as NH4NO3, which, along with OM, dominated the PM2.5mass. The sum of constituents exceeds the measured massfor samples from winter 2008/2009 except 8 December 2008and 13 January 2009, leading to overall negative unidentifiedmass (UnID). For winter 2009/2010, however, UnID is gen-erally positive. Negative UnID could result from overestimat-ing OM. Using a multiplier of 1.4 for OC (Eq. 1) may be toohigh for sources such as gasoline and diesel exhausts (Rus-sell, 2003; El-Zanan et al., 2005; Aiken et al., 2008) and theorganic sampling artifact may not be sufficiently subtractedfor the STN (Watson et al., 2009; Chow et al., 2010). Posi-tive UnID indicates unaccounted species such as water. Massclosure on 30 December 2009 and 20 January 2010 was par-ticularly poor, raising questions with regard to mass measure-ments for the two days.
The higher average PM2.5 concentration during winter2009/2010 mainly resulted from larger NH4NO3 and UnIDcontributions (Fig. 5). Despite high OM concentrations onepisode days (i.e., 9, 15, 18 December 2009, and 5 Jan-uary 2010), OM averaged lower for winter 2009/2010 thanfor winter 2008/2009. As an example, the 5 January 2010sample contains 3.2 times the NO−
3 concentration of 1 Jan-uary 2009 (8.4 µg m−3 versus 2.6 µg m−3) and a higher UnID(4.6 µg m−3) but with only comparable OM (17.2 µg m−3
versus 18.5 µg m−3 for 5 January 2010 and 1 January 2009,respectively). The Teflon-membrane filters were weighed at30–40 % RH, and water strongly bound to NH4NO3 mightnot be removed completely due to a hysteresis effect (Speeret al., 2003). If so, elevated NH4NO3 was the main causeof PM2.5 exceedances during winter 2009/2010. This is con-sistent with observations from the nearby, but much larger,San Joaquin Valley, California in winter (Watson and Chow,2002; Chow et al., 2006; Chen et al., 2007b).
Teflon-membrane filter samples and the remnants ofquartz-fiber filter samples for winter 2009/2010 were re-trieved from the STN archive and submitted to additionalanalyses (Chow and Watson, 2012), including: (1) thermal
Atmos. Chem. Phys., 12, 10051–10064, 2012 www.atmos-chem-phys.net/12/10051/2012/

L.-W. A. Chen et al.: Wintertime particulate pollution episodes 10055
Fig. 4. PM2.5 mass reconstruction compared to speciation mass (PM2.5C) for winter 2008/2009 and 2009/2010. The red line indicates theUSEPA 24-h PM2.5 National Ambient Air Quality Standard (NAAQS) of 35 µg m−3. The 15 December 2009 sample exceeds the NAAQSby FRM mass but not by speciation mass (34 µg m−3). OM = 1.4 × [OC]; Crustal Material= 2.2 ×[Al] + 2.49 × [Si]+ 1.64 × [Ca]+ 2.42×[Fe] + 1.94 × [Ti]; and Salt= [Na+] + [Cl].
‐5
0
5
10
15
20
25
30
35
40
Mass (08
‐09)
Mass (09
‐10)
OM (0
8‐09)
OM (0
9‐10)
EC (0
8‐09)
EC (0
9‐10)
Sulfate (0
8‐09)
Sulfate (0
9‐10)
Nitrate (08‐09)
Nitrate (09‐10)
Ammon
ium (0
8‐09)
Ammon
ium (0
9‐10)
Crustal (08
‐09)
Crustal (09
‐10)
Salt (08‐09)
Salt (09‐10)
UnID (08‐09)
UnID (09‐10)
PM2.5Sp
ecies C
oncentratio
n (μg m
‐3)
Fig. 5. Concentrations of PM2.5 mass and major constituents (i.e., square: average; bar: median; box: 25th and 75th percentiles; whiskers:10th and 90th percentiles) for winter 2008/2009 and 2009/2010. UnID is the unidentified mass (i.e., measured minus reconstructed PM2.5mass).
desorption-gas chromatography/mass spectrometry (TD-GC/MS; Ho and Yu, 2004; Ho et al., 2008, 2011; Chow et al.,2007d) for non-polar organic compounds, including∼ 120polycyclic aromatic hydrocarbons (PAHs), hopanes, ster-anes, alkanes, and alkenes; (2) water extraction/total organiccarbon (TOC; Yang et al., 2003) analysis for water-solubleorganic carbon (WSOC); (3) ion chromatography-pulsed am-perometric detection (IC-PAD; Engling et al., 2006) for lev-oglucosan; and (4) two-wavelength optical transmissometer(Ahmed et al., 2009; Chen et al., 2010a) for light absorption
(babs) at 370 and 880 nm. Twenty samples were analyzed foreach of the species except for WSOC and levoglucosan on18 December 2009 and 2 January 2010 where there were in-sufficient quartz-fiber filter remnants.
The temporal variations and relative abundances of or-ganic species are presented in the Supplement, alongwith their two-month averages/signal-to-noise ratios (SNR;Fig. S1 and Table S1 of the Supplement).n-Alkanesare the most abundant organic compounds with con-centrations ranging from 6.1 ng m−3 (20 January 2010)
www.atmos-chem-phys.net/12/10051/2012/ Atmos. Chem. Phys., 12, 10051–10064, 2012

10056 L.-W. A. Chen et al.: Wintertime particulate pollution episodes
1
0
Fig. 6. Angstrom Absorption Exponent (AAE) as a function of el-emental carbon (EC) and organic material (OM) concentration. Di-ameter of the spheres is proportional to the OM concentration whereOM = 1.4 × OC. Episode days exceeding the USEPA 24-h PM2.5National Ambient Air Quality Standard (NAAQS) of 35 µg m−3 areidentified.
to 79.1 ng m−3 (9 December 2009), containing abun-dant n-tetracosane (tetcos),n-hentriacontane (htricont),and n-pentacosane (pencos). The most abundant cyclo-/branched alkanes are anteiso-dotriacontane (anteisoc32),iso-tritriactotane (isoc33), and iso-hentriacotane (isoc33).Particle-bound PAHs (p-PAHs) are air toxics that derivefrom many combustion sources. The sum of measuredp-PAH concentrations ranges from 0.82 ng m−3 (2 Jan-uary 2010) to 46.2 ng m−3 (9 December 2009). Abun-dant p-PAH species include cyclopenta[c,d]pyrene (cp-cdpyr), retene, and benzo[b,j,k]fluoranthene (bbjkfl). Retene,a known marker for coniferous wood combustion (Ram-dahl, 1983), is more enriched in the Truckee Meadows(13 ± 5 % of total p-PAHs) than in areas dominated bymobile sources (e.g., 1 ± 1 % in El Paso, Texas; Chenet al., 2012a). Hopanes and steranes originate from oilcombustion or from vehicle lube oil (Zielinska et al.,2008), and are< 5 ng m−3 with the dominant species beingααα 20S 24R/S-ethylcholestane (ster12), 17α[H],21β[H]-30-norhopane (hop17), and 17α[H],21β[H]-hopane (hop19).
Both WSOC and levoglucosan concentrations are high,particularly for the episode days. On 9 December 2009,WSOC reached almost 7 µg m−3 while levoglucosan ex-ceeded 1 µg m−3. Levoglucosan has been considered as a pri-mary marker for biomass burning (Fraser and Lakshmanan,2000), and this supports the importance of residential woodcombustion (RWC) contributions during the episode.
Aerosol babs at 370 and 880 nm correlate well withEC concentrations (r2
= 0.9). The regression slopes are21.3 m2 g−1 for 370 nm and 13.6 m2 g−1 for 880 nm. This is
consistent with EC as the dominant light-absorbing compo-nent. TheAngstrom absorption exponent (AAE) (Chen et al.,2006; Moosmuller et al., 2009):
AAE =ln(babs,370) − ln(babs,880)
ln(370) − ln(880), (4)
ranges from 0.61 to 1.32. Biomass burning aerosol fromsmoldering combustion generally shows AAE (> 1) higherthan that from flaming combustion or motor vehicle exhaustswith AAE < 1 (Kirchstetter et al., 2004; Chakrabarty et al.,2010; Chen et al., 2010a). In this study AAE appears to belowest during the PM2.5 episodes (Fig. 6), consistent withbabs contributions mostly from flaming RWC and/or engineexhausts. The spectral characteristics ofbabs for the episodeand non-episode periods are confirmed by in situ, continu-ous measurements at a nearby site (Gyawali et al., 2012).Smoldering contributions seem to be less important duringthe winter episodes.
3 Chemical mass balance source apportionment
The Effective Variance solution (Watson et al., 1984) to theCMB equations (EV-CMB) uses both source profiles and am-bient concentrations as inputs to calculate source contribu-tion estimates (SCEs) and associated uncertainties (Watsonet al., 1984, 2008; Chow and Watson, 2002; Held et al., 2005;Chen et al., 2010b). EV-CMB was applied to each RENOCspeciated sample.
3.1 Source profiles
Source profiles relevant to sources in the Truckee Meadowsare identified and referenced in supplemental Table S2. Ma-jor source types include: (1) geological materials; (2) motorvehicles (gasoline and diesel); (3) biomass burning (RWCand open burning); (4) cooking; (5) utility combustion; and(6) secondary aerosol, corresponding to the local PM2.5emission inventory (Ling-Barnes, 2010). Two fugitive dustsamples (i.e., paved road dust – RNOPVRD, surface soilsfrom a vacant lot – RNOSOIL) were obtained from repre-sentative locations around the RENOC site along with twotypes of de-icing material (RNOSalt1 and RNOSalt2). Thesesamples were dried, sieved, resuspended, and sampled ontofilters (Chow et al., 1994) for chemical analyses identical tothose for ambient samples, except that WSOC and levoglu-cosan were not quantified and set to zero owing to low OCcontents (1.1–14.9 %, see Table S3).
Engine exhaust profiles considered include those acquiredfrom the National Renewable Energy Laboratory Gas/DieselSplit Study (Fujita et al., 2007a, b) and the Las Vegas Car-bon Source Apportionment Study (LVCSAS, Green et al.,2012b). These profiles are more recent and contain full or-ganic speciation except for alkanes. They have been used inother EV-CMB applications (Chow et al., 2007c; Green et
Atmos. Chem. Phys., 12, 10051–10064, 2012 www.atmos-chem-phys.net/12/10051/2012/

L.-W. A. Chen et al.: Wintertime particulate pollution episodes 10057
al., 2012a). The Gas/Diesel Split profiles were based on dy-namometer tests of 57 gasoline and 32 diesel vehicles whileLVSAS adopted an in-plume monitoring system (Nussbaumet al., 2009; Zhu et al., 2009) at traffic intersections whereair was dominated by a mixture of motor vehicle exhausts.Both studies were conducted in Nevada or neighboring Cali-fornia with vehicles and fuels similar to those of the TruckeeMeadows.
The RWC source profiles resulted from tests during theCentral California PM10/PM2.5 Air Quality Study (CRPAQS;Fitz et al., 2003) and the Lake Tahoe Source Characteriza-tion Study (LTSCS; Kuhns et al., 2004). CRPAQS focusedon fireplace emissions while LTSCS tested both fireplacesand woodstoves. Both studies examined hardwood (i.e., oak,almond, and eucalyptus) and softwood (i.e., pine, tamarack,and juniper) combustion separately, resulting in six compos-ite profiles. Levoglucosan’s abundance ranges from 0.1 to55.5 % among these six profiles. RWC emission composi-tions are highly variable depending on fuel and combustionconditions, as indicated by Chen et al. (2007a, 2010a). Openburning, including wildland fires, is not expected to con-tribute during winter months.
Due to the proximity of the RENOC site to a Mexicanrestaurant, a meat cooking profile (BVCOOK, a compos-ite of charbroiled chicken, chicken over propane, and char-broiled hamburger) as part of CRPAQS was included. Chowet al. (2007c) found meat cooking to be an important con-tributor at the Fresno supersite during winter. The markersfor meat cooking are often associated with polar compoundssuch as cholesterol, palmitic acid, palmitoleic acid, stearicacid, and oleic acid (Fraser et al., 2003; Rinehart et al., 2006).However, the archived ambient samples were not amenableto analyses for these components.
Most of the reported point source profiles do not containorganic markers, but no large stationary emitters are locatedwithin the Truckee Meadows. Long-range transport from dis-tant point sources is also low during winter. Point source pro-files are therefore not included in the EV-CMB modeling.Secondary NO−3 and SO=
4 sources are represented by pureNH4NO3 (AMNIT) and (NH4)2SO4 (AMSUL) profiles, re-spectively. Secondary OC is represented by a profile (SOC)containing exclusively (100 %) OC (Watson, 1979). This isequivalent to using the OC / EC ratio method to estimateSOC.
Table S1 indicates the EV-CMB fitting species. Impor-tant source markers that are commonly detectable in ambientsamples and their corresponding sources include (e.g., Chowet al., 2007c; Watson et al., 2008): (1) Al, Si, Ca, Fe, Mn,K, Ti, and Sr for geological material/minerals; (2) EC andhopanes for diesel exhaust; (3) indeno[1,2,3,cd]pyrene (in-cdpy), benzo[g,h,i]perylene (bghipe), and coronene (corone)for gasoline engine exhaust; (4) K+, retene, and levoglucosanfor biomass burning; (5) pristane, and phytane for cook-ing; (6) Cu, Zn, As, Se, Br, Pb for industrial point sources;(7) Na+, Cl for de-icing material; and (8) S, and NO−
3 for
secondary inorganics. OC is not a specific marker but it is amajor PM2.5 constituent. Temperature-resolved carbon frac-tions were not used as they were mostly determined by theIMPROVE (Chow et al., 1993) protocol in source profiles butby the IMPROVEA (Chow et al., 2007a) protocol in ambientsamples acquired after 2007. The two protocols are known toyield comparable OC and EC measurements but possibly dif-fer for carbon fractions (Chow et al., 2005, 2007a; Chen etal., 2012b).
3.2 Sensitivity tests
EV-CMB sensitivity tests were applied to data from sev-eral samples to evaluate the performance of different sourceprofile combinations in terms of correlation (r2), root meansquare difference (χ2), and percent of mass explained(%MASS) (Watson and Chow, 2012). The initial source pro-file combination was modified in subsequent trials to exam-ine changes in the SCEs and EV-CMB performance mea-sures. Often, only one profile in each source type may beincluded since similar profiles result in collinearity, non-convergence, and/or negative source contributions. An ac-ceptable solution requires %MASS between 0.9 and 1.1,r2 > 0.9, andχ2 < 2. The modified pseudo-inverse normal-ized (MPIN) matrix (Kim and Henry, 1999) would indicatethe most influential species (e.g., MPIN value> 0.5) for eachsource type.
Table S4 illustrates two sensitivity test examples (anepisode day on 5 January 2010 and a median loading day on17 January 2010). Better EV-CMB fits to the data result froma combination of paved road dust (RNOPVRD), road salt(RNOSALT2), mobile source (gasoline and diesel engine ex-haust; GAS and DIESEL, respectively), RWC (fireplace andwoodstove burning hardwoods; CRBURNH and LTWSH),and secondary (AMNIT and AMSUL) source profiles. TheDIESEL profile may represent both on-road and off-roaddiesel engine emissions. Gasoline-engine exhaust contribu-tions appear to be minor compared with those from diesel en-gines. Including softwood RWC profiles in the CMB modelalways lowers the overall model performance.
Including the cooking (BVCOOK) profile improves per-formance measures (e.g., lowerχ2 and higher %MASS).However, the cooking contribution would be comparable toor even greater than the combined contribution from gaso-line and diesel engine exhaust (Table S4). The MPIN matrixindicates that OC is the only species influencing the cook-ing source. Due to the lack of more specific cooking markerssuch as cholesterol and palmitoleic acid, BVCOOK was de-selected. Adding SOC into the mix led to non-convergencefor both samples.
The MPIN matrices for the selected source combina-tion (Table S5) indicates that the most important diesel en-gine exhaust marker is EC, followed by Zn while the gaso-line engine exhaust contribution is marked by coronene.indeno[1,2,3,cd]pyrene and benzo[g,h,i]perylene are more
www.atmos-chem-phys.net/12/10051/2012/ Atmos. Chem. Phys., 12, 10051–10064, 2012

10058 L.-W. A. Chen et al.: Wintertime particulate pollution episodes
associated with the wood stove profile (i.e., LTWSH), alongwith levoglucosan, OC, and 17α(H),21β(H)-hopane. Thisexplains the low gasoline engine exhaust SCEs by EV-CMB. The fireplace emission (i.e., CRBURNH) is markedby retene and K+. Si is the most influential species forpaved road dust profile (i.e., RNOPVRD), followed by Aland Ca. Fe, however, is associated with a de-icing profile(i.e., RNOSalt2) along with Na+ and Cl. Water-soluble ironcyanide compounds are widely used as anticaking agentsin road salt. NO−3 and S are unambiguous markers for sec-ondary NH4NO3 and (NH4)2SO4, respectively.
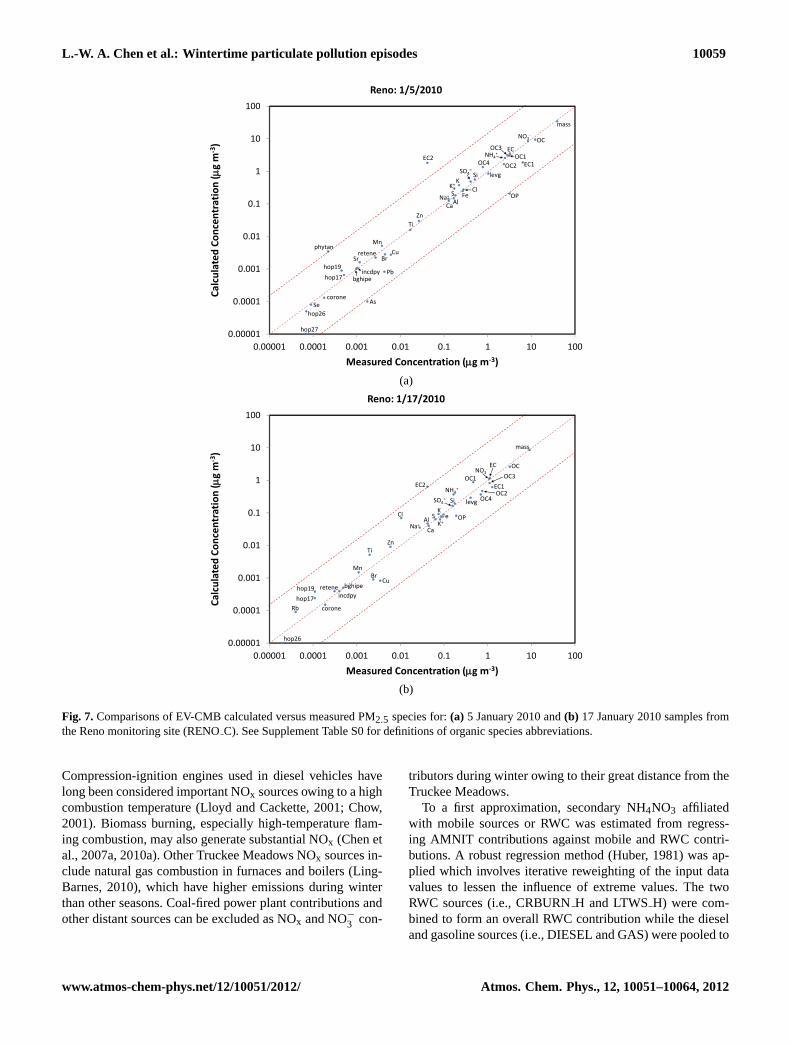
Figure 7 compares measured and calculated PM2.5 speciesconcentrations. For the 5 January 2010 sample, the EV-CMBsolution explains measured species well except for the car-bon fractions (EC1, EC2, and OP, not included in the fittingbut calculated from SCEs), Pb, As, 22R-17α(H),21β(H)-30,31,32-Trishomohopane (hop27), and phytane. In addition,Cl, Ti, Br, Cu, Rb, and all hopanes were not fitted as well forthe 17 January 2010 PM2.5 sample. None of these species,however, are unique source markers. Removing these speciessomewhat alters the SCEs but the changes are within the un-certainty intervals.
3.3 Source contribution estimates
Figure 8 shows the winter 2009/2010 SCEs for PM2.5, OC,and EC. RWC is resolved for all samples, though the par-tition between fireplace and woodstove contributions varies.Woodstove contributions are missing for the 18 December2009 and 2 January 2010 samples because levoglucosan datawere not available on these two days. Diesel contributionsshow up every day except for 26 January 2010 when onlygasoline engine exhaust was detected. This abnormality ishard to explain physically, and it is a reminder of the uncer-tainty inherent in separating diesel and gasoline source con-tributions even with organic markers. De-icing contributionsare also resolved for every sample except 26 January 2010,while paved road dust does not appear on 3–9, 15–18, and30 December 2009. De-icing material contributed more toPM2.5 than paved road dust during December 2009, whilethe opposite was true during January 2010. This is consistentwith more snowfalls in December 2009 since snow coversreduce fugitive dust but increase salting and de-icing activ-ities. Secondary (NH4)2SO4 is resolved for all samples ex-cept for 2 January 2010, although its contribution never ex-ceeds 0.25 µg m−3. EV-CMB-calculated PM2.5 mass concen-trations are generally lower than measured PM2.5. For thetwo days with poor mass closure (30 December 2009 and 20January 2010), model calculated PM2.5 mass are closer tothe reconstructed mass than the gravimetric mass. A strongcorrelation (r2
= 0.89) between the unexplained PM2.5 massand secondary NH4NO3 (AMNIT) contribution supports wa-ter associated with NH4NO3 as a major component of unex-plained mass (Fig. 9).
RWC, diesel engine exhaust, and secondary NH4NO3were the major PM2.5 contributors during NAAQS ex-ceedances. The highest RWC contribution of 26.6 µg m−3 or51 % of PM2.5 mass occurred on 9 December 2009. Mostof the RWC was attributed to fireplace emissions. An in-tense and persistent inversion layer and deep snow cover,coupled with low temperatures during the day (daily mean:−13 °C), enhanced RWC emissions and accumulation. Sec-ondary NH4NO3 accounted for 26.7 % of PM2.5 mass on9 December 2009. Particulate NH4NO3 is also favored bylow temperatures and high RH (Watson et al., 1994; Westet al., 1999; Chow et al., 2008). Diesel engine exhaust ex-plained another 6.5 % of PM2.5 while other sources were mi-nor contributors (0–3 %). For the other episode days (15, 18December 2009, and 5 January 2010), RWC contributionswere lower (11–39 %) while diesel contributions were higher(13–22 %). Higher ambient temperatures, i.e., daily mean:0–1 °C, compared to those of 9 December 2009 may ex-plain the difference. Nevertheless, ambient temperatures onthe three days appear to be low enough for NH4NO3 forma-tion – NH4NO3 fractions ranged from 27 to 37 %. Paved roaddust was an important contributor (5.7 %) only on 5 January2010.
RWC from fireplaces also dominated the ambient OC con-centrations (Fig. 8). On 15 and 18 December 2009, diesel ex-haust was almost as important as RWC as an OC source. Theunexplained OC, up to 44 % of measured OC, may be in partattributed to a positive organic sampling artifact, which hasnot been adequately corrected on the STN samples (Chowet al., 2010). Since OC was quantified on quartz-fiber filtersand mass was measured on Teflon-membrane filters, this ar-tifact should not contribute to the unexplained PM2.5 mass.Certainly the missing OC might also result from SOC and/ordifferences between the selected source profiles and the ac-tual (but unknown) profiles typical of local RWC emissions.The EV-CMB model explains EC better than OC. There is noorganic sampling artifact associated with EC. Diesel engineexhaust is the dominant EC source.
3.4 Origins of secondary ammonium nitrate
Comparing PM2.5 chemical speciation of winter 2009/2010with winter 2008/2009 shows that the higher secondaryNH4NO3 lifted PM2.5 concentrations over the 35 µg m−3
threshold. The formation of NH4NO3 may depend ongaseous ammonia (NH3) or nitric acid (HNO3; derived fromNOx emissions) concentrations and be influenced by ambienttemperature and RH (Watson and Chow, 2002). An ion bal-ance shows a full neutralization of NO−
3 , and SO2−
4 by NH+
4during the PM2.5 episodes and so NOx emissions and oxi-dation likely limit NH4NO3 formation in the valley. A goodcorrelation of 24-h NOx and AMNIT (r2
= 0.82) is found forwinter 2009/2010.
Most wintertime NOx is generated from local sources,particularly mobile and RWC emissions, and so is NO−
3 .
Atmos. Chem. Phys., 12, 10051–10064, 2012 www.atmos-chem-phys.net/12/10051/2012/
L.-W. A. Chen et al.: Wintertime particulate pollution episodes 10059
0
(a)
(b)
1
mass
NO3‐
SO4=
NH4+
Na+K+
OC1OC2
OC3
OC4
OP
OC
EC1EC2
EC
Al
Si
S ClK
Ca
Ti
Mn
Fe
Cu
Zn
AsSe
BrSr
Pb
retene
incdpybghipe
corone
hop17
hop19
hop26
hop27
levg
phytan
0.00001
0.0001
0.001
0.01
0.1
1
10
100
0.00001 0.0001 0.001 0.01 0.1 1 10 100
Calculated
Con
centratio
n (μg m
‐3)
Measured Concentration (μg m‐3)
Reno: 1/5/2010
mass
NO3‐
SO4=
NH4+
Na+ K+
OC1
OC2
OC3
OC4
OP
OC
EC1EC2
EC
Al
Si
SCl K
Ca
Ti
Mn
Fe
Cu
Zn
Br
Rb
reteneincdpybghipe
coronehop17hop19
hop26
levg
0.00001
0.0001
0.001
0.01
0.1
1
10
100
0.00001 0.0001 0.001 0.01 0.1 1 10 100
Calculated
Con
centratio
n (μg m
‐3)
Measured Concentration (μg m‐3)
Reno: 1/17/2010
Fig. 7. Comparisons of EV-CMB calculated versus measured PM2.5 species for:(a) 5 January 2010 and(b) 17 January 2010 samples fromthe Reno monitoring site (RENOC). See Supplement Table S0 for definitions of organic species abbreviations.
Compression-ignition engines used in diesel vehicles havelong been considered important NOx sources owing to a highcombustion temperature (Lloyd and Cackette, 2001; Chow,2001). Biomass burning, especially high-temperature flam-ing combustion, may also generate substantial NOx (Chen etal., 2007a, 2010a). Other Truckee Meadows NOx sources in-clude natural gas combustion in furnaces and boilers (Ling-Barnes, 2010), which have higher emissions during winterthan other seasons. Coal-fired power plant contributions andother distant sources can be excluded as NOx and NO−
3 con-
tributors during winter owing to their great distance from theTruckee Meadows.
To a first approximation, secondary NH4NO3 affiliatedwith mobile sources or RWC was estimated from regress-ing AMNIT contributions against mobile and RWC contri-butions. A robust regression method (Huber, 1981) was ap-plied which involves iterative reweighting of the input datavalues to lessen the influence of extreme values. The twoRWC sources (i.e., CRBURNH and LTWSH) were com-bined to form an overall RWC contribution while the dieseland gasoline sources (i.e., DIESEL and GAS) were pooled to
www.atmos-chem-phys.net/12/10051/2012/ Atmos. Chem. Phys., 12, 10051–10064, 2012

10060 L.-W. A. Chen et al.: Wintertime particulate pollution episodes
1
0
(a)
(b)
(c)
Fig. 8.EV-CMB PM2.5 source apportionment for:(a) mass,(b) OC,and (c) EC. Stacked columns indicate model estimates, which arecompared with measured and reconstructedmass concentrations.Weekends are noted in(a). Snowy days are marked by a blue barunder the column in(a). Snow cover typically accumulates duringor after the snowfall.
y = 0.47x ‐ 0.25R² = 0.89
‐1
0
1
2
3
4
5
6
7
8
0 2 4 6 8 10 12 14 16 18
Une
xplained
PM
2.5Mass b
y EV
‐CMB (μg m
‐3)
Secondary Ammonium Nitrate (AMNIT) Contribution (μg m‐3)
Fig. 9. Relationship between unexplained PM2.5 mass and sec-ondary ammonium nitrate contribution by EV-CMB analysis. Fourdata points were excluded due to either missing levoglucosan mea-surements (18 December 2009 and 2 January 2009) or very poormass closure (30 December 2009 and 20 January 2010).
0
1
-3
0
3
6
9
12
15
1812
/03/
09
12/0
6/09
12/0
9/09
12/1
2/09
12/1
5/09
12/1
8/09
12/2
1/09
12/2
4/09
12/2
7/09
12/3
0/09
01/0
2/10
01/0
5/10
01/0
8/10
01/1
1/10
01/1
4/10
01/1
7/10
01/2
0/10
01/2
3/10
01/2
6/10
01/2
9/10
Seco
ndar
y Am
mon
ium
Nitr
ate
(µg
m-3
)
Sample Date
UnidentifiedMobile-AffiliatedRWC-Affiliated
Fig. 10.Source apportionment of secondary ammonium nitrate byrobust multiple linear regression.
represent the mobile contribution. The regression of AMNITagainst the RWC and mobile contributions together yields agood correlation (r2
= 0.81), better than the regression cor-relations against RWC or mobile contributions alone (r2
=
0.45–0.65). The regression coefficients are 0.34 and 1.20 forRWC and mobile sources, respectively, suggesting that 0.34and 1.2 µg m−3 secondary NH4NO3 is produced per µg m−3
of primary PM2.5 emitted from the RWC and mobile sources,respectively.
Figure 10 shows mobile- and RWC-affiliated secondaryNH4NO3, which explain total NH4NO3 (i.e., AMNIT) lev-els for three of four high PM2.5 days: 9, 15 December 2009,and 5 January 2010. (Note: the RWC contribution on 18 De-cember 2009 is underestimated due to missing levoglucosan
Atmos. Chem. Phys., 12, 10051–10064, 2012 www.atmos-chem-phys.net/12/10051/2012/

L.-W. A. Chen et al.: Wintertime particulate pollution episodes 10061
measurement.) Although the mobile sources did not con-tribute to primary PM2.5 as much as RWC during winter2009/2010, the mobile-source contribution might be respon-sible for∼ 2/3 of secondary NH4NO3.
4 Conclusions
The Truckee Meadows is an urban valley in the arid west ofthe US with light-to-moderate snowfall and frequent subsi-dence in winter. The formation of PM2.5 episodes shows me-teorological and chemical characteristics that are likely com-mon for many urban valleys in the Western Cordillera.
First, the highest PM2.5 concentrations are accompaniedby intense and prolonged (multi-day) temperature inversions,snow on the ground, and low wind speeds. These variablesare inter-related, as snow cover increases the reflectance ofsunlight, thereby decreasing heating at the surface that wouldbreak up the inversion. Most of the surface heating that re-mains is absorbed as latent heat, melting the snow rather thanraising the surface temperature. The prolonged inversion cre-ates a stagnant condition that inhibits ventilation by wind.
Second, OC and EC dominate the PM2.5 mass, but duringepisodes much elevated NH4NO3 and unidentified mass con-centrations drive PM2.5 levels over the 35 µg m−3 threshold.The low temperatures and higher RH associated with snowcover and melting snow encourage a shift in equilibriumfor gaseous HNO3 and NH3 to form particulate NH4NO3,thereby increasing its contribution to PM2.5 mass. Liquid wa-ter associated with NH4NO3 explains most unidentified massin the samples. The water may not completely leave theseparticles until RH decreases below 30 %.
An EV-CMB receptor model suggests that RWC, dieselexhaust, and NH4NO3 were major contributors to PM2.5in the Truckee Meadows during winter 2009/2010. RWCcontributions ranged from 11–51 % of PM2.5 mass on four35 µg m−3 exceedance days (9, 15, 18 December 2009, and 5January 2010). Most of the RWC was attributed to fireplacesburning hardwoods. The wide range of RWC contributionmay reflect different ambient temperatures, as lower temper-atures increase home heating demand. Secondary NH4NO3accounted for 27–37 % of PM2.5 while diesel engine exhaustexplained 7–22 % of PM2.5. Paved road dust and de-icingmaterials were minor, but detectable, contributors. Gasolineengine exhaust was a small contributor, as was secondary(NH4)2SO4 that never exceeded a 0.25 µg m−3 contributionto PM2.5 mass. Contributions from large industrial sources(e.g., coal-fired power plants) were not quantified, thoughall the known large point sources are distant from the Truc-kee Meadows and transport is low during winter stagnations.Neither cooking nor SOC contributions were resolved.
A multiple linear regression of the secondary NH4NO3contribution on the mobile source and wood burning contri-butions suggests that about 2/3 of the NH4NO3 is associatedwith mobile source emissions and 1/3 with RWC emissions,
consistent with most of the NO−3 deriving from engine NOxemissions. Reducing use of diesel-powered equipment andrestricting domestic burning for unfavorable pollution mete-orology forecasts should contribute to the prevention of fu-ture NAAQS exceedances.
Supplementary material related to this article isavailable online at:http://www.atmos-chem-phys.net/12/10051/2012/acp-12-10051-2012-supplement.pdf.
Acknowledgements.This study was supported in part by theWashoe County Air Quality Management Division (WCAQMD).In particular, the authors thank Steve Kohl, Dana Trimble, JeromeRobles, and Steven Gronstal of the Desert Research Institute En-vironmental Analysis Facility for assistance in geological samplecollection and resuspension for chemical speciation and Jo Gerrardfor assembling and editing the manuscript. The conclusions arethose of the authors and do not necessarily reflect the views of thesponsoring agencies.
Edited by: T. Kirchstetter
References
Ahmed, T., Dutkiewicz, V. A., Shareef, A., Tuncel, G., Tuncel, S.,and Husain, L.: Measurement of black carbon (BC) by an opticalmethod and a thermal-optical method: Intercomparison for foursites, Atmos. Environ., 43, 6305–6311, 2009.
Aiken, A. C., DeCarlo, P. F., Kroll, J. H., Worsnop, D. R., Huff-man, J. A., Docherty, K. S., Ulbrich, I. M., Mohr, C., Kimmel,J. R., Sueper, D., Sun, Y., Zhang, Q., Trimborn, A., Northway,M., Ziemann, P. J., Canagaratna, M. R., Onasch, T. B., Alfarra,M. R., Prevot, A. S. H., Dommen, J., Duplissy, J., Metzger,A., Baltensperger, U., and Jimenez, J. L.: O/C and OM/OC ra-tios of primary, secondary, and ambient organic aerosols withhigh-resolution time-of-flight aerosol mass spectrometry, Envi-ron. Sci. Technol., 42, 4478–4485, 2008.
Bachmann, J. D.: Will the circle be unbroken: A history of the USnational ambient air quality standards-2007 Critical Review, J.Air Waste Manage., 57, 652–697, 2007.
Cadle, S. H., Mulawa, P., Groblicki, P., Laroo, C., Ragazzi, R. A.,Nelson, K., Gallagher, G., and Zielinska, B.: In-use light-dutygasoline vehicle particulate matter emissions on three driving cy-cles, Environ. Sci. Technol., 35, 26–32, 2001.
Chakrabarty, R. K., Moosmuller, H., Chen, L.-W. A., Lewis, K.,Arnott, W. P., Mazzoleni, C., Dubey, M. K., Wold, C. E., Hao,W. M., and Kreidenweis, S. M.: Brown carbon in tar balls fromsmoldering biomass combustion, Atmos. Chem. Phys., 10, 6363–6370,doi:10.5194/acp-10-6363-2010, 2010.
Chen, L.-W. A., Doddridge, B. G., Dickerson, R. R., Chow, J. C.,Mueller, P. K., Quinn, J., and Butler, W. A.: Seasonal variationsin elemental carbon aerosol, carbon monoxide, and sulfur diox-ide: Implications for sources, Geophys. Res. Lett., 28, 1711–1714, 2001.
Chen, L.-W. A., Doddridge, B. G., Dickerson, R. R., Chow, J.C., and Henry, R. C.: Origins of fine aerosol mass in the
www.atmos-chem-phys.net/12/10051/2012/ Atmos. Chem. Phys., 12, 10051–10064, 2012

10062 L.-W. A. Chen et al.: Wintertime particulate pollution episodes
Baltimore-Washington corridor: Implications from observation,factor analysis, and ensemble air parcel back trajectories, Atmos.Environ., 36, 4541–4554, 2002.
Chen, L.-W. A., Moosmuller, H., Arnott, W. P., Chow, J. C., Watson,J. G., Susott, R. A., Babbitt, R. E., Wold, C., Lincoln, E., andHao, W. M.: Particle emissions from laboratory combustion ofwildland fuels: In situ optical and mass measurements, Geophys.Res. Lett., 33, 1–4, 2006.
Chen, L.-W. A., Moosmuller, H., Arnott, W. P., Chow, J. C., Wat-son, J. G., Susott, R. A., Babbitt, R. E., Wold, C. E., Lincoln,E. N., and Hao, W. M.: Emissions from laboratory combustionof wildland fuels: Emission factors and source profiles, Environ.Sci. Technol., 41, 4317–4325, 2007a.
Chen, L.-W. A., Watson, J. G., Chow, J. C., and Magliano, K. L.:Quantifying PM2.5 source contributions for the San Joaquin Val-ley with multivariate receptor models, Environ. Sci. Technol., 41,2818–2826, 2007b.
Chen, L.-W. A., Verburg, P., Shackelford, A., Zhu, D., Susfalk,R., Chow, J. C., and Watson, J. G.: Moisture effects on car-bon and nitrogen emission from burning of wildland biomass,Atmos. Chem. Phys., 10, 6617–6625,doi:10.5194/acp-10-6617-2010, 2010a.
Chen, L.-W. A., Watson, J. G., Chow, J. C., DuBois, D. W., and Her-schberger, L.: Chemical mass balance source apportionment forcombined PM2.5 measurements from U.S. non-urban and urbanlong-term networks, Atmos. Environ., 44, 4908–4918, 2010b.
Chen, L.-W. A., Tropp, R. J., Li, W.-W., Zhu, D. Z., Chow, J. C.,Watson, J. G., and Zielinska, B.: Aerosol and air toxics exposurein El Paso, Texas: A pilot study, AAQR, 12, 169–189, 2012a.
Chen, L.-W. A., Chow, J. C., Watson, J. G., and Schichtel, B. A.:Consistency of long-term elemental carbon trends from ther-mal and optical measurements in the IMPROVE network, At-mos. Meas. Tech., 5, 2329–2338,doi:10.5194/amt-5-2329-2012,2012b.
Chow, J. C.: 2001 Critical review discussion – Diesel engines: Envi-ronmental impact and control, J. Air Waste Manage., 51, 1258–1270, 2001.
Chow, J. C. and Watson, J. G.: Review of PM2.5 and PM10 ap-portionment for fossil fuel combustion and other sources by thechemical mass balance receptor model, Energ. Fuel., 16, 222–260, 2002.
Chow, J. C. and Watson, J. G.: Chemical analyses of particle filterdeposits, in: Aerosols Handbook: Measurement, Dosimetry, andHealth Effects, edited by: Ruzer, L. and Harley, N. H., 179–204,2012.
Chow, J. C., Watson, J. G., Pritchett, L. C., Pierson, W. R., Frazier,C. A., and Purcell, R. G.: The DRI Thermal/Optical Reflectancecarbon analysis system: Description, evaluation and applicationsin U.S. air quality studies, Atmos. Environ., 27A, 1185–1201,1993.
Chow, J. C., Watson, J. G., Houck, J. E., Pritchett, L. C., Rogers,C. F., Frazier, C. A., Egami, R. T., and Ball, B. M.: A labora-tory resuspension chamber to measure fugitive dust size distri-butions and chemical compositions, Atmos. Environ., 28, 3463–3481, 1994.
Chow, J. C., Watson, J. G., Chen, L.-W. A., Paredes-Miranda, G.,Chang, M.-C. O., Trimble, D., Fung, K. K., Zhang, H., and ZhenYu, J.: Refining temperature measures in thermal/optical carbonanalysis, Atmos. Chem. Phys., 5, 2961–2972,doi:10.5194/acp-
5-2961-2005, 2005.Chow, J. C., Chen, L.-W. A., Watson, J. G., Lowenthal, D. H.,
Magliano, K. L., Turkiewicz, K., and Lehrman, D. E.: PM2.5chemical composition and spatiotemporal variability during theCalifornia Regional PM10/PM2.5 Air Quality Study (CRPAQS),J. Geophys. Res.-Atmos., 111, 1–17, 2006.
Chow, J. C., Watson, J. G., Chen, L.-W. A., Chang, M. C. O., Robin-son, N. F., Trimble, D. L., and Kohl, S. D.: The IMPROVEAtemperature protocol for thermal/optical carbon analysis: Main-taining consistency with a long-term database, J. Air Waste Man-age., 57, 1014–1023, 2007a.
Chow, J. C., Watson, J. G., Feldman, H. J., Nolan, J., Wallerstein, B.R., Hidy, G. M., Lioy, P. J., McKee, H. C., Mobley, J. D., Bauges,K., and Bachmann, J. D.: 2007 Critical review discussion – Willthe circle be unbroken: A history of the U.S. National AmbientAir Quality Standards, J. Air Waste Manage., 57, 1151–1163,2007b.
Chow, J. C., Watson, J. G., Lowenthal, D. H., Chen, L. W. A.,Zielinska, B., Mazzoleni, L. R., and Magliano, K. L.: Evalua-tion of organic markers for chemical mass balance source appor-tionment at the Fresno Supersite, Atmos. Chem. Phys., 7, 1741–1754,doi:10.5194/acp-7-1741-2007, 2007c.
Chow, J. C., Yu, J. Z., Watson, J. G., Ho, S. S. H., Bohannan, T.L., Hays, M. D., and Fung, K. K.: The application of thermalmethods for determining chemical composition of carbonaceousaerosols: A Review, J. Environ. Sci. Heal. A, 42, 1521–1541,2007d.
Chow, J. C., Watson, J. G., Lowenthal, D. H., Park, K., Doraiswamy,P., Bowers, K., and Bode, R.: Continuous and filter-based mea-surements of PM2.5 nitrate and sulfate at the Fresno Supersite,Environ. Mon. Assess., 144, 179–189, 2008.
Chow, J. C., Watson, J. G., Chen, L.-W. A., Rice, J., and Frank,N. H.: Quantification of PM2.5 organic carbon sampling arti-facts in US networks, Atmos. Chem. Phys., 10, 5223–5239,doi:10.5194/acp-10-5223-2010, 2010.
Chow, J. C., Watson, J. G., Robles, J., Wang, X. L., Chen, L.-W. A.,Trimble, D. L., Kohl, S. D., Tropp, R. J., and Fung, K. K.: Qual-ity assurance and quality control for thermal/optical analysis ofaerosol samples for organic and elemental carbon, Anal. Bioanal.Chem., 401, 3141–3152, 2011.
Chu, S. H.: PM2.5 episodes as observed in the speciation trendsnetwork, Atmos. Environ., 38, 5237–5246, 2004.
El-Zanan, H. S., Lowenthal, D. H., Zielinska, B., Chow, J. C., andKumar, N. K.: Determination of the organic aerosol mass toorganic carbon ratio in IMPROVE samples, Chemosphere, 60,485–496, 2005.
Engling, G., Carrico, C. M., Kreldenweis, S. M., Collett Jr., J. L.,Day, D. E., Malm, W. C., Lincoln, E., Hao, W. M., Iinuma, Y.,and Herrmann, H.: Determination of levoglucosan in biomasscombustion aerosol by high-performance anion-exchange chro-matography with pulsed amperometric detection, Atmos. Envi-ron., 40, S299–S311, 2006.
Fernando, H. J. S.: Fluid dynamics of urban atmospheres in com-plex terrain, Annu. Rev. Fluid Mech., 42, 365–389, 2010.
Fitz, D. R., Chow, J. C., and Zielinska, B.: Development of a gasand particulate matter organic speciation profile database, pre-pared for Draft Final Report June 2003, Prepared fro San JoaquinValleywide Air Pollution Study Agency; California RegionalPM10/PM2.5 Air Quality Study by Desert Research Institute,
Atmos. Chem. Phys., 12, 10051–10064, 2012 www.atmos-chem-phys.net/12/10051/2012/
L.-W. A. Chen et al.: Wintertime particulate pollution episodes 10063
Reno, NV, 2003.Flanagan, J. B., Jayanty, R. K. M., Rickman Jr., E. E., and Peterson,
M. R.: PM2.5 Speciation Trends Network: Evaluation of whole-system uncertainties using data from sites with collocated sam-plers, J. Air Waste Manage., 56, 492–499, 2006.
Fraser, M. P. and Lakshmanan, K.: Using levoglucosan as a molec-ular marker for the long-range transport of biomass combustionaerosols, Environ. Sci. Technol., 34, 4560–4564, 2000.
Fraser, M. P., Yue, Z. W., and Buzcu, B.: Source apportionment offine particulate matter in Houston,TX, using organic molecularmarkers, Atmos. Environ., 37, 2117–2123, 2003.
Fujita, E. M., Campbell, D. E., Arnott, W. P., Chow, J. C., andZielinska, B.: Evaluations of the chemical mass balance methodfor determining contributions of gasoline and diesel exhaust toambient carbonaceous aerosols, J. Air Waste Manage., 57, 721–740, 2007a.
Fujita, E. M., Zielinska, B., Campbell, D. E., Arnott, W. P., Sage-biel, J. C., Mazzoleni, L. R., Chow, J. C., Gabele, P. A., Crews,W., Snow, R., Clark, N. N., Wayne, W. S., and Lawson, D.R.: Variations in speciated emissions from spark-ignition andcompression-ignition motor vehicles in California’s south coastair basin, J. Air Waste Manage., 57, 705–720, 2007b.
Green, M. C., Chen, L.-W. A., DuBois, D. W., and Molenar, J. V.:PM2.5 and visibility in the Lake Tahoe Basin: Chemical charac-terization, trends, and source apportionment, J. Air Waste Man-age., 62, 953–965, 2012a.
Green, M. C., Chow, J. C., Chang, M.-C. O., Chen, L.-W. A., Kuhns,H. D., and Etyemezian, V. R.: Source apportionment of atmo-spheric particulate carbon in Las Vegas, Nevada, USA, Partic-uology, in press, 2012b.
Gyawali, M., Arnott, W. P., Zaveri, R. A., Song, C., Moosmuller,H., Liu, L., Mishchenko, M. I., Chen, L.-W. A., Green, M. C.,Watson, J. G., and Chow, J. C.: Photoacoustic optical propertiesat UV, VIS, and near IR wavelengths for laboratory generatedand winter time ambient urban aerosols, Atmos. Chem. Phys.,12, 2587–2601,doi:10.5194/acp-12-2587-2012, 2012.
Held, T., Ying, Q., Kleeman, M. J., Schauer, J. J., and Fraser, M. P.:A comparison of the UCD/CIT air quality model and the CMBsource-receptor model for primary airborne particulate matter,Atmos. Environ., 39, 2281–2297, 2005.
Ho, S. S. H. and Yu, J. Z.: In-injection port thermal desorption andsubsequent gas chromatography-mass spectrometric analysis ofpolycyclic aromatic hydrocarbons andn-alkanes in atmosphericaerosol samples, J. Chromatogr. A, 1059, 121–129, 2004.
Ho, S. S. H., Yu, J. Z., Chow, J. C., Zielinska, B., Watson, J. G.,Sit, E. H. L., and Schauer, J. J.: Evaluation of an in-injectionport thermal desorption-gas chromatography/mass spectrometrymethod for analysis of non-polar organic compounds in ambientaerosol samples, J. Chromatogr. A, 1200, 217–227, 2008.
Ho, S. S. H., Chow, J. C., Watson, J. G., Ng, L. P. T., Kwok,Y., Ho, K. F., and Cao, J. J.: Precautions for in-injection portthermal desorption-gas chromatography/mass spectrometry (TD-GC/MS) applied to aerosol filter samples, Atmos. Environ., 45,1491–1496, 2011.
Huber, P. J.: Robust Statistics, John Wiley and Sons, Inc., New York,NY, 1981.
Kim, B. M. and Henry, R. C.: Diagnostics for determining influen-tial species in the chemical mass balance receptor model, J. AirWaste Manage., 49, 1449–1455, 1999.
Kirchstetter, T. W., Novakov, T., and Hobbs, P. V.: Evidence that thespectral dependence of light absorption by aerosols is affectedby organic carbon, J. Geophys. Res.-Atmos., 109, D21208,doi:10.1029/2004JD004999, 2004.
Kuhns, H. D., Chang, M.-C. O., Chow, J. C., Etyemezian, V., Chen,L.-W. A., Nussbaum, N. J., Nathagoundenpalayam, S. K., Trim-ble, T. C., Kohl, S. D., MacLaren, M., Abu-Allaban, M., Gillies,J. A., and Gertler, A. W.: DRI Lake Tahoe Source Characteriza-tion Study, prepared for California Air Resources Board, Sacra-mento, CA by Desert Research Institute, Reno, NV, 2004.
Ling-Barnes, Y.: Washoe County, Nevada, 2008 periodic emissionsinventory, prepared by Washoe County Health District Air Qual-ity Divison, Reno, NV, 2010.
Lloyd, A. C. and Cackette, T. A.: Critical review – Diesel engines:Environmental impact and control, J. Air Waste Manage., 51,809–847, 2001.
Malm, W. C., Sisler, J. F., Huffman, D., Eldred, R. A., and Cahill, T.A.: Spatial and seasonal trends in particle concentration and op-tical extinction in the United States, J. Geophys. Res., 99, 1347–1370, 1994.
Mendoza, L. and Inouye, D.: Washoe County, Nevada, air qualitytrends (2001–2010), prepared by Washoe County Health DistrictAir Quality Divison, Reno, NV, 2011.
Moosmuller, H., Chakrabarty, R. K., and Arnott, W. P.: Aerosol lightabsorption and its measurement: A review, J. Quant. Spectrosc.Rad., 110, 844–878, 2009.
Nam, E., Kishan, S., Baldauf, R. W., Fulper, C. R., Sabisch, M., andWarila, J.: Temperature effects on particulate matter emissionsfrom light-duty, gasoline-powered motor vehicles, Environ. Sci.Technol., 44, 4672–4677, 2010.
Nussbaum, N. J., Zhu, D., Kuhns, H. D., Mazzoleni, C., Chang, M.-C. O., Moosmuller, H., and Watson, J. G.: The In-Plume Emis-sions Test-Stand: A novel instrument platform for the real-timecharacterization of combustion emissions, J. Air Waste Manage.,59, 1437–1445, 2009.
Ramdahl, T.: Retene-A molecular marker of wood combustion inambient air, Nature, 306, 580–582, 1983.
Rinehart, L. R., Fujita, E. M., Chow, J. C., Magliano, K. L., andZielinska, B.: Spatial distribution of PM2.5 associated organiccompounds in central California, Atmos. Environ., 40, 290–303,2006.
Russell, L. M.: Aerosol organic-mass-to-organic-carbon ratio mea-surements, Environ. Sci. Technol., 37, 2982–2987, 2003.
Silcox, G. D., Kelly, K. E., Crosman, E. T., Whiteman, C. D., andAllen, B. L.: Wintertime PM2.5 concentrations during persistent,multi-day cold-air pools in a mountain valley, Atmos. Environ.,46, 17–24, 2012.
Speer, R. E., Edney, E. O., and Kleindienst, T. E.: Impact of or-ganic compounds on the concentrations of liquid water in ambi-ent PM2.5, J. Aerosol Sci., 34, 63–77, 2003.
Tai, A. P. K., Mickley, L. J., and Jacob, D. J.: Correlations betweenfine particulate matter (PM2.5) and meteorological variables inthe United States: Implications for the sensitivity of PM2.5 toclimate change, Atmos. Environ., 44, 3976–3984, 2010.
USEPA: Air quality criteria for particulate matter, prepared by U.S.Environmental Protection Agency, Research Triangle Park, NC,2004.
USEPA: 40 CFR Parts 50, 51, 52, 53, and 58-National ambient airquality standards for particulate matter: Proposed rule, Federal
www.atmos-chem-phys.net/12/10051/2012/ Atmos. Chem. Phys., 12, 10051–10064, 2012

10064 L.-W. A. Chen et al.: Wintertime particulate pollution episodes
Register, 77, 38890–39055, 2012.Watson, J. G.: Chemical element balance receptor model methodol-
ogy for assessing the sources of fine and total suspended partic-ulate matter in Portland, Oregon, 1979.
Watson, J. G. and Chow, J. C.: A wintertime PM2.5 episode at theFresno, CA, supersite, Atmos. Environ., 36, 465–475, 2002.
Watson, J. G. and Chow, J. C.: Source apportionment, in: The En-cyclopedia of Environmetrics, edited by: El-Shaarwi, A. H. andPiegorsch, W. W., John Wiley & Sons, in press, 2012.
Watson, J. G., Cooper, J. A., and Huntzicker, J. J.: The effectivevariance weighting for least squares calculations applied to themass balance receptor model, Atmos. Environ., 18, 1347–1355,1984.
Watson, J. G., Chow, J. C., Lurmann, F. W., and Musarra, S.: Am-monium nitrate, nitric acid, and ammonia equilibrium in win-tertime Phoenix, Arizona, J. Air Waste Manage., 44, 405–412,1994.
Watson, J. G., Chen, L.-W. A., Chow, J. C., Lowenthal, D. H., andDoraiswamy, P.: Source apportionment: Findings from the U.S.Supersite Program, J. Air Waste Manage., 58, 265–288, 2008.
Watson, J. G., Chow, J. C., Chen, L.-W. A., and Frank, N. H.: Meth-ods to assess carbonaceous aerosol sampling artifacts for IM-PROVE and other long-term networks, J. Air Waste Manage.,59, 898–911, 2009.
Watson, J. G., Chow, J. C., Chen, L.-W. A., Green, M. C., and Kohl,S. D.: Wintertime PM2.5 source contributions in Reno, NV, pre-pared for Reno, NV, Washoe County Health District, Air QualityDivision by Desert Research Institute, Reno, NV, 2011.
Weilenmann, M., Favez, J. Y., and Alvarez, R.: Cold-start emissionsof modern passenger cars at different low ambient temperaturesand their evolution over vehicle legislation categories, Atmos.Environ., 43, 2419–2429, 2009.
West, J. J., Ansari, A. S., and Pandis, S. N.: Marginal PM2.5: Non-linear aerosol mass response to sulfate reductions in the easternUnited States, J. Air Waste Manage., 49, 1415–1424, 1999.
Yang, H., Li, Q. F., and Yu, J. Z.: Comparison of two methods forthe determination of water-soluble organic carbon in atmosphericparticles, Atmos. Environ., 37, 865–870, 2003.
Zhu, D. Z., Nussbaum, N. J., Kuhns, H. D., Chang, M. C. O., Sode-man, D., Uppapalli, S., Moosmuller, H., Chow, J. C., and Wat-son, J. G.: In-Plume Emission Test Stand 2: Emission factors for10-to 100-kW US military generators, J. Air Waste Manage., 59,1446–1457, 2009.
Zielinska, B., Campbell, D. E., Lawson, D. R., Ireson, R. G.,Weaver, C. S., Hesterberg, T. W., Larson, T., Davey, M., and Liu,L. J. S.: Detailed characterization and profiles of crankcase anddiesel particulate matter exhaust emissions using speciated or-ganics, Environ. Sci. Technol., 42, 5661–5666, 2008.
Atmos. Chem. Phys., 12, 10051–10064, 2012 www.atmos-chem-phys.net/12/10051/2012/