Embed Size (px)
Citation preview
WINTER OUTLOOK REPORT 2013/14 AND SUMMER REVIEW 2013
28 November 2013
2
Content
1. Introduction ..............................................................................................................................................3
2. Executive summary ..................................................................................................................................4
3. Methodology ............................................................................................................................................6
Source of information ..................................................................................................................................6
Data used for the Regional analysis .............................................................................................................6
Renewables in-feed data ..............................................................................................................................7
Aims and methodology ................................................................................................................................7
Definitions ..................................................................................................................................................10
4. Summer review .......................................................................................................................................13
5. Winter Outlook .......................................................................................................................................14
General overview .......................................................................................................................................14
Individual country perspective analysis .....................................................................................................14
Regional assessment ..................................................................................................................................22
6. Country level ..........................................................................................................................................31
Individual country responses to Winter Outlook .......................................................................................31
Individual country responses to Summer Review ......................................................................................96
Appendix 1: Questionnaire for WOR 2013/14 and SR 2013 .......................................................................115
Appendix 2: Load factors used for the renewable in-feed for upward regulation analyses .........................127
Appendix 3: Load factors used for the renewable in-feed for downward regulation analyses ....................130
3
1. Introduction
ENTSO-E adopts and publishes on an annual basis the “Winter Outlook and Summer review”. This
report assesses the adequacy of the power system as well as the potential electricity issues it may be faced
with during the winter period. It also provides an overview of the main events which occurred during the
previous summer period.
The ENTSO-E Winter Outlook and Summer review report is adopted as required by article 8 of the EC
Regulation n. 714/2009. It sets ENTSO-E analysis and views for the coming winter period on the basis of a
consolidated methodology on short term system adequacy reports. This is reflected in the questionnaire
which highlights any potential electricity issues which the TSOs may face during the winter period as well
as the measures which will be in place to respond to them.
The summer review report shows the main events which occurred during the summer period of 2013,
according to TSOs, with reference to security of electricity supply (i.e. weather conditions, power system
conditions, as well as availability of interconnections). The Summer review covers the period from 5 June
2013 (week 23) to 25 September 2013 (week 39). It outlines the main events during the previous summer in
comparison with the forecasts presented in the ENTSO-E Summer Outlook report 2013, published on 30
May 2013.
The winter outlook reports the outlook of the national and regional power balances between forecast
generation and load at reference points on a weekly basis for the upcoming winter period, from 4 December
2013 (week 49) to 20 April 2014 (week 16). More information regarding reference points is provided in
Section 3: Methodology.
The purpose of this report is to present TSOs’ views on any matters concerning security of supply for the
forthcoming winter period. It also sought to identify the risks and the countermeasures proposed by the
TSOs in cooperation with neighbouring countries, whilst also assessing the possibility for neighbouring
countries to contribute to the generation/demand balance if required.
In addition, throughout this period, an assessment of any “downward regulation” issues was performed in
order to provide a level of confidence regarding the effects of intermittent generation such as wind and solar
system operation. For this assessment, two reference points are used, aiming at identifying situations where
excess inflexible generator output exceeds overnight minimum demands and any possible downward
regulation issues in a low load – high RES in-feed situation (typically a sunny weekend day). The assessed
period has been extended to include Easter weekend which is on week 16 in most ENTSO-E member
countries and can be one of the most stressed periods in several areas based on operational experience.
In order to harmonise as far as practicable the assumptions on intermittent energy sources, bearing in mind
the inherent differences between countries, two different approaches are applied: While the individual
country analysis includes the data provided by the TSOs in order to take into account each country
specificities, the Pan European Assessments include a harmonised probabilistic approach using a Pan
European Climate database1 (PECD).
1Data from Technical University of Denmark
4
2. Executive summary
Winter Outlook
The ENTSO-E Winter Outlook reports the outlook of national and regional power balances between
forecast available generation and peak demand on a weekly basis for the upcoming winter period, from 4
December 2013 (week 49) to 20 April 2014 (week 16).
The winter outlook analysis, carried out by ENTSO-E, shows that Europe has sufficient generation for both
normal and severe demand conditions. While various countries may require imports to cover the expected
demand, cross border capacity is expected to be sufficient to accommodate them. In general, greater
margins are expected in the European power system over the coming winter when compared to winter
2012/13, based on the same assumptions.
The main reasons for this are;
Levels of reliably available generation capacity are higher according to the information available to TSOs at
the time of production of this report;
No major unplanned outages are identified;
The amount of mothballed units, including CCGT, is tolerable for this coming winter;
Hydrological conditions in the South-East European region (where the share of hydro generation is
relatively high) seem good;
Expected peak loads show a very slight decrease compared to last winter.
The ENTSO-E Winter Outlook 2013 shows that, on the whole, the balance between generation and demand
is expected to be maintained during the winter period in the case of normal weather conditions. Based on
normal conditions for demand, the majority of countries do not require imports to maintain their balance
between demand and supply.
However, under severe weather conditions such as cold waves and prolonged periods of low temperatures,
demand increases from normal levels. In such a situation, from the data submitted by the TSOs, the analysis
shows that reliability margins are reduced. Indeed, countries such as Croatia, Finland, Hungary, Latvia, and
Sweden would require imports to maintain the demand and supply balance for all or nearly all reference
points during the entire winter period. In Poland particularly, such import needs may exceed available
import capacities, therefore specific operational measures are planned. In such severe conditions, the
margins would also be reduced during certain weeks of the winter period in Belgium, Denmark and the
FYRO Macedonia.
The downward adequacy assessment covers the cases when due to low overnight demands, an excess of
generation can be present in the system, especially when variable renewable generation and inflexible
classical generation are at high output levels. This could also occur on weekend days (characterised by low
load and possibly high PV generation output). Therefore in seasonal outlooks, two different (one overnight
and one daytime) reference points are examined for downward adequacy. Assumptions made for these
downward assessments are based on different transmission conditions and may require specific operational
measures.
In these cases, there could well be an excess of inflexible generation which would need to be exported or
curtailed. When generation exceeds demand in a country due to one of the above reasons, cross border
flows will occur in regions which can import the excess generation. When cross border capacities are fully
used, then curtailment of renewables (or other inflexible generation) will occur due to the lack of
appropriate infrastructure, including storage facilities, which may be used to balance the inflexible
generation.
5
The Winter Outlook report 2013 highlights the fact that during certain weeks over the winter, it may be
necessary to reduce excess generation in various countries as a result of insufficient cross border export
capability. For example, the combination of high renewables in-feed and inflexible generation in Belgium,
the Netherlands, Romania and Spain could lead to high exports to all surrounding countries in the overnight
reference points, and curtailment may become necessary under certain conditions in Ireland and Northern
Ireland due to a limited interconnection capacity. Around the daytime reference point, Latvia may have to
export some of its generated power to neighbouring systems during low-load periods. Based on the
minimum NTCs provided, not all excess energy can be evacuated from these countries, and thus measures
could be required to limit the generation surplus.
Summer Review
The Summer Review 2013 section in this report outlines events which occurred during the last summer
period with reference to the weather conditions and the consequences for the power system in comparison
to forecasts for the summer as published in May 2013 in the Summer Outlook 2013.
The summer of 2013 was slightly warmer than average in Europe. While June was colder than average and
heavy rainfall occurred in most parts of Europe, the temperatures in July and August were higher than
average and the whole period was relatively dry.
The heavy rainfall in June caused severe floods in parts of the Czech Republic, Austria and South and
Eastern Germany. In some regions provisional arrangements were set into operation.
Except from these floods no extreme weather conditions were observed and the load in Europe generally
remained at normal levels and no critical or unexpected situation occurred in the energy system of Europe.
The experience of several European TSOs demonstrates that the relevance of downward adequacy
assessment on weekends or holidays increases, as these are generally characterised by low consumption on
the one hand and a high in-feed of renewable generation on the other.
6
3. Methodology
Source of information
The summer review report is prepared on the basis of the information given by ENTSO-E members through
a questionnaire in order to present the most important events occurred during the summer period in
comparison to the forecasts and risks reported in the last Summer Outlook. The TSOs mainly answer if
their respective power system experienced any important or unusual events or conditions during the
summer period as well as the identified causes and the remedial actions taken.
The winter outlook report is based on the information provided by ENTSO-E members during September
on both a qualitative and quantitative basis in response to a questionnaire which has been significantly
improved in order to increase the level of detail in the analysis performed. It presents TSOs’ views as
regards any national or regional matters of concern regarding security of supply and/or inflexible generation
surpluses for the coming winter and the possibility of neighbouring countries to contribute to the
generation/demand balance of each respective ENTSO-E member in critical situations. The questions
mainly referred to practices as well as qualitative data sent by TSOs in order to present country forecasts on
a common basis.
Data used for the Regional analysis
An extensive regional analysis was also added to the well-known per-country analysis in the methodology
of seasonal outlooks. The aim of this investigation is to assess whether the country based adequacy still
remains fulfilled when the larger, European scale is taken into account. In other words, it assesses whether
the electrical energy will be available at certain points in time to allow the countries with a generation
deficit to import the electric power needed from the surrounding countries.
A synchronous point in time was used for all countries to allow for a meaningful analysis when determining
the feasibility of cross border flows. Before starting the data collection, and using European historical load
data, a study was conducted to identify the most representative synchronous time for covering the global
European peak load in winter. It was concluded that Wednesday, 19:00 CET most closely represents this
situation, and therefore data was requested from TSOs for this time point. With regards to the regional
analysis, the values which were actually used from the data collection spreadsheet can be found below:
‒ The Remaining Capacity for normal and severe conditions;
‒ Simultaneous importing and exporting capacity;
‒ A best estimate of the minimum NTC values towards and from individual neighbouring countries.
In addition, across the period of assessment for the next winter, any European “downward regulation”
issues where excess inflexible generator output exceeds demand are investigated. Similar to the peak
demand analysis, it provides an indication which countries require exports to manage inflexible generation.
Indeed, this involved an analysis of their ability to export this energy to neighbouring regions that are not in
a similar situation. The reason for this analysis pertains to the fact that a number of TSOs expressed that
they are experiencing growing problems for system operation (mainly) due to the increase of intermittent
generation on the system (wind and solar) and the lack of more flexible generation means.
Similar to the generation adequacy analysis, to carry out a regional downward analysis, a synchronous point
in time was used for all countries in order to allow for meaningful analyses when determining cross border
flows. The same European load study mentioned before concluded that minimal demand conditions
generally take place around 05:00 CET on Sunday morning.
In addition to this minimal demand conditions, it was concluded that these issues with inflexible generation
are not only prone to happen during the night, but also during daytime when the energy production of solar
panels nears its maximum. To cope with this effect, an additional synchronous time point was added for
Sunday 11:00 CET, when a combination of potentially high photo-voltaic in-feed and reduced demand
7
levels exist. Quantitative data for this point in time was therefore also requested from all TSOs to allow for
a meaningful regional analysis.
For the regional downward analysis, the values which were actually used from the data collection
spreadsheet can be summarized as:
‒ The expected inflexible generation surplus at Sunday 05:00 and 11:00 CET;
‒ Sum of the inflexible and must-run generation;
‒ Simultaneous importing and exporting capacity;
‒ A best estimate of the minimum NTC values towards and from individual neighbouring countries.
Renewables in-feed data
For the per-country analysis, each TSO was requested to give an estimation of the highest expected
proportion of installed solar, onshore wind and offshore wind capacity to be taken into account for the
downward analysis. Default values of 65% for wind and 95% for solar were presented, allowing for every
country to enter its best estimate. For the generation adequacy analysis the renewables in-feed is handled
through an estimation of the non-usable capacity in normal and severe conditions by each TSO.
For the regional analysis though, it was decided to envision building a consistent pan-European scenario for
wind and solar in-feed. To this end, a Pan-European Climatic Database2
was used containing per-country
load factors for solar, onshore wind and offshore wind per hour for a ten-year period.
To achieve per country representative load factors for the generation adequacy analysis, the 50th and 10
th
percentile respectively for normal and severe conditions of the load factors per country and for solar, wind
onshore and wind offshore separately are calculated considering historical values of the past three years, per
month, and for the appropriate time period.
As such, a renewable in-feed scenario is created which represents a consistent worst-case scenario over the
different countries and for the different primary energy sources. This scenario can then be used to detect
regional adequacy issues that can consequently be further investigated in more detail and with a more
realistic (and therefore less worst-case) renewable infeed scenario if necessary.
The methodology for the downward analysis is very similar to the one above, with the difference that the
90th percentile is used.
It is envisioned for the future outlooks to use the experience gained on this matter and further refine the
applied methodologies.
Aims and methodology
Upward adequacy
The methodology consists of identifying the ability of generation to meet the demand by calculating the so-
called “remaining capacity” under two scenarios: normal and severe weather conditions.
The methodology is schematically depicted on the figure on the following page:
2 Data from Technical University of Denmark
8
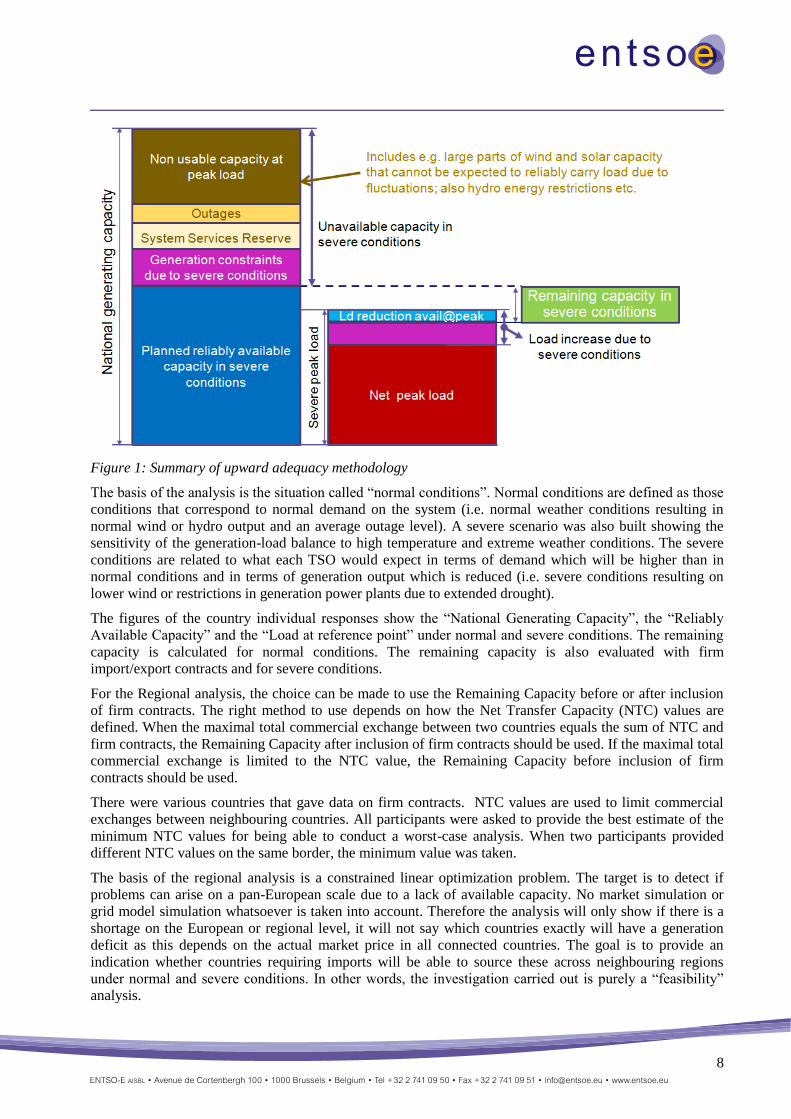
Figure 1: Summary of upward adequacy methodology
The basis of the analysis is the situation called “normal conditions”. Normal conditions are defined as those
conditions that correspond to normal demand on the system (i.e. normal weather conditions resulting in
normal wind or hydro output and an average outage level). A severe scenario was also built showing the
sensitivity of the generation-load balance to high temperature and extreme weather conditions. The severe
conditions are related to what each TSO would expect in terms of demand which will be higher than in
normal conditions and in terms of generation output which is reduced (i.e. severe conditions resulting on
lower wind or restrictions in generation power plants due to extended drought).
The figures of the country individual responses show the “National Generating Capacity”, the “Reliably
Available Capacity” and the “Load at reference point” under normal and severe conditions. The remaining
capacity is calculated for normal conditions. The remaining capacity is also evaluated with firm
import/export contracts and for severe conditions.
For the Regional analysis, the choice can be made to use the Remaining Capacity before or after inclusion
of firm contracts. The right method to use depends on how the Net Transfer Capacity (NTC) values are
defined. When the maximal total commercial exchange between two countries equals the sum of NTC and
firm contracts, the Remaining Capacity after inclusion of firm contracts should be used. If the maximal total
commercial exchange is limited to the NTC value, the Remaining Capacity before inclusion of firm
contracts should be used.
There were various countries that gave data on firm contracts. NTC values are used to limit commercial
exchanges between neighbouring countries. All participants were asked to provide the best estimate of the
minimum NTC values for being able to conduct a worst-case analysis. When two participants provided
different NTC values on the same border, the minimum value was taken.
The basis of the regional analysis is a constrained linear optimization problem. The target is to detect if
problems can arise on a pan-European scale due to a lack of available capacity. No market simulation or
grid model simulation whatsoever is taken into account. Therefore the analysis will only show if there is a
shortage on the European or regional level, it will not say which countries exactly will have a generation
deficit as this depends on the actual market price in all connected countries. The goal is to provide an
indication whether countries requiring imports will be able to source these across neighbouring regions
under normal and severe conditions. In other words, the investigation carried out is purely a “feasibility”
analysis.
9
The first element that is checked is whether in a “copperplate” scenario there is enough power capacity to
cover the demand. Here, all remaining capacity is simply summed, and when the result is greater than zero,
theoretically enough capacity is available in Europe to cover everyone’s needs. No problems are expected
using this approach, neither for normal conditions nor for severe conditions. As this method does not take
into account the limited exchange capacity between countries, it is too optimistic to draw final conclusions
based on it.
As a consequence of this, a second, more precise approach is taken. The problem is modelled as a linear
optimization with the following constraints:
‒ Bilateral exchanges between countries should be lower or equal to the given NTC values;
‒ Total simultaneous imports and exports should be lower or equal to the given limits.
Based on this methodology, it was calculated which groups of countries would have a generation deficit for
a certain week due to saturated cross-border exchanges.
Due to no information about non ENTSO-E systems, like Russia, Belarus, the Ukraine except the Burshtyn
Island (part of the Ukrainian system that operates synchronously with Continental Europe), Morocco and
Turkey, the following values were assumed for these systems for the regional analysis:
‒ The balance (remaining capacity) of these systems was set at 0 MW.
‒ A best estimate of the minimum NTC comes from neighbouring systems belonging to ENTSO-E.
This approach will result in a possibility to “wheel” energy through these bordering countries, without them
adding to or subtracting from the total generation level of the region.
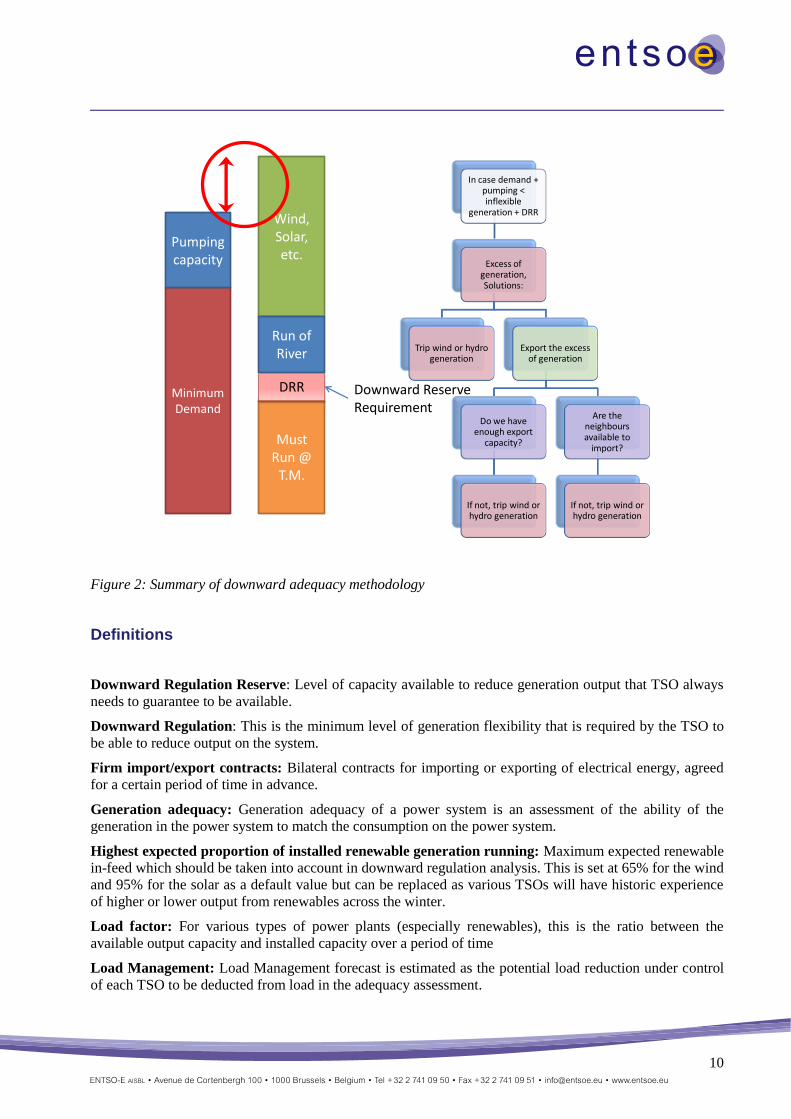
Downward adequacy
Under minimum demand conditions, there is a potential for countries to have an excess of inflexible
generation running. Every TSO is likely to have varying levels of “must-run” generation. This may be CHP
or generators that are required to run to maintain dynamic voltage support etc. In addition there will be
renewable generation such as run of river, solar and wind whose output is inflexible and variable. At times
of high renewable output e.g. wind, the combination can result in generation exceeding demand and the
pumped storage capacity of the country. In that case, the “excess” generation is either exported to a
neighbouring region or curtailed.
The analysis takes the data submitted by TSOs and alters the renewables in-feed to a representative
European scenario as was described in the section above. For countries that have an excess of generation,
the optimisation tries to export to neighbouring regions based on the best estimate of the minimum NTC
values submitted, and via a constrained linear optimisation.
The analysis will highlight periods where groups of countries cannot export all of their excess generation. It
should be again stressed that this analysis is not a market simulation. Rather, it conducts a feasibility
analysis to indicate countries which may be required to curtail excess generation due to limited cross border
export capacity.
10
Figure 2: Summary of downward adequacy methodology
Definitions
Downward Regulation Reserve: Level of capacity available to reduce generation output that TSO always
needs to guarantee to be available.
Downward Regulation: This is the minimum level of generation flexibility that is required by the TSO to
be able to reduce output on the system.
Firm import/export contracts: Bilateral contracts for importing or exporting of electrical energy, agreed
for a certain period of time in advance.
Generation adequacy: Generation adequacy of a power system is an assessment of the ability of the
generation in the power system to match the consumption on the power system.
Highest expected proportion of installed renewable generation running: Maximum expected renewable
in-feed which should be taken into account in downward regulation analysis. This is set at 65% for the wind
and 95% for the solar as a default value but can be replaced as various TSOs will have historic experience
of higher or lower output from renewables across the winter.
Load factor: For various types of power plants (especially renewables), this is the ratio between the
available output capacity and installed capacity over a period of time
Load Management: Load Management forecast is estimated as the potential load reduction under control
of each TSO to be deducted from load in the adequacy assessment.
Minimum Demand
Pumping capacity
Must Run @
T.M.
DRR
Wind, Solar, etc.
Run of River
In case demand + pumping < inflexible
generation + DRR
Excess of generation, Solutions:
Trip wind or hydro generation
Export the excess of generation
Do we have enough export
capacity?
If not, trip wind or hydro generation
Are the neighbours available to
import?
If not, trip wind or hydro generation
Downward Reserve Requirement

11
Load: Load on a power system is the net consumption corresponding to the hourly average active power
absorbed by all installations connected to the transmission grid or to the distribution grid. Load includes
network losses and excludes the pumps of the pumped-storage stations and generation auxiliaries.
Must Run Generation is related to the generators which, for various reasons, must be connected to the
transmission/ distribution grid. Some reasons include: network constraints (overload management, voltage
control), specific policies, minimum number of units needed to provide system services, subsidies,
environmental causes etc.
National Generating Capacity: Sum of the individual net generating capacity of all power stations
connected to either transmission or the distribution grid.
Net Transfer Capacity: Maximum exchange program between two areas compatible with security
standards applicable in both areas and taking into account the technical uncertainties on future network
conditions.
Non-usable capacity at peak load under normal conditions: Resulting from lack of primary sources
(hydro, wind, sun), insufficient fuel availability due to actual contracts, mothballed plants not in operation
during the summer.
Pumping Storage Capacity: Type of hydroelectric power plant that uses low-cost electric power at the off-
peak periods to pump the water into the higher elevation reservoir, and generate electric power at the
periods of high demand.
Reference Points: Reference points are the dates and times data are collected for:
‒ Sundays of Winter on the 5th hour (from 04:00 CET to 05:00 CET) and on the 11
th hour (from 10:00
CET to 11:00 CET)
‒ Wednesday of Winter on the 19th hour (from 18:00 CET to 19:00 CET)
Reliably available capacity: Part of National Generating Capacity actually available to cover the load at a
reference point.
Remaining capacity for normal conditions: Corresponds to the generating capacity available above net
weekly peak load for the normal climatic conditions and is the basis of the TSO’s appreciation of the
generation adequacy for the current week.
Remaining capacity for severe conditions: Corresponds to the generating capacity available above net
weekly peak load for the severe climatic conditions and is the basis of the TSO’s appreciation of the
generation adequacy for the current week.
Run of River: Type of hydroelectric power plant with limited amount of storage or no storage at all.
Severe conditions are related to what each TSO would expect under a 1 in a 10 year scenario.3 For
example the demand will be higher than normal conditions and in certain regions the output from
generating units such as wind may be very low or there may be restrictions in thermal plants that operate at
a reduced output under very low or high temperatures.
Simultaneous exportable capacity: Exportable transmission capacity with other national systems expected
to be available each week and a range of possible outcomes for interconnection power flow.
Simultaneous importable capacity: Importable transmission capacity with other national systems
expected to be available each week and a range of possible outcomes for interconnection power flow.
3 It is difficult to be very specific and hence a description of the scenario being considered should be described by each TSO
and if a TSO is not using a 1 in 10 year scenario e.g. only calculates at a 1 in 20 year demand level then this should be
highlighted.
12
System services reserve under normal conditions: The amount of capacity required by the TSO to
provide operating response/reserves under normal climatic conditions. It corresponds to the level required
one hour before real time (additional short notice breakdowns are already considered in the amount of
outages).
Time of Reference: Times in the outlook reports are expressed in Central European Time (CET=UTC+1).
All the data and analyses provided are in accordance with this approach.
Weekly peak load for normal conditions: Peak load excluding any demands on interconnectors and net of
any demand management/demand side response in normal climatic conditions for the period.
Weekly peak load for severe conditions: Peak load excluding any demands on interconnectors and net of
any demand management/demand side response in severe climatic conditions for the period.
13
4. Summer review
The summer of 2013 was slightly warmer than average in Europe. While June was colder than average and
suffered of heavy rainfalls in most parts of Europe, the temperatures in July and August were higher than
average and the whole period was affected by drought.
The heavy rainfalls in June caused severe floods in parts of the Czech Republic, Austria and South and
Eastern Germany. In some regions provisional arrangements were set into operation.
As except from the flood no extreme weather condition occurred, the load in Europe mainly remained at
normal levels. During the last summer, no critical and unexpected situation occurred in the energy system
of Europe.
Experience of several European TSOs shows that the relevance of downward adequacy assessment on
weekends or holidays increases, as these are characterised by a low consumption on one hand and a high in-
feed of renewable generation on the other.
The Baltic Cable (Sweden/Germany) suffered a cable fault in July. The link was back in operation in late
September. Another cable fault on Konti-Skan (interconnecting Sweden and western Denmark) occurred by
the end of August which reduced the available transmission capacity by 80 % until October.
The summer was a very stressful period for the Estonia - Latvia/Russia interconnection. Congestions
occurred throughout the summer, as Estonia was exporting to south due to energy deficit in Latvia and
Lithuania.
14
5. Winter Outlook
General overview
The coordination team which developed the regional analysis methodology is comprised of very
experienced experts from various TSOs across Europe. The data submitted has been inspected by team
members with a focus on those regions on which they have extensive knowledge and have determined that
the main conclusions from the analysis are valid.
It should be noted that the analysis was based on data submitted by each TSO. A synchronous point in time
was requested for all data in order to allow for a comparison between regions. Hence, a feasibility test to
determine that there is enough generation to meet demand under normal and severe scenarios was enabled.
Based on the data submitted by each TSO, Europe as a whole should have over 100 GW of spare capacity
to meet demand and reserves under normal conditions in the ideal case of unlimited interconnection
capacity. This value corresponds to nearly 19 % of the sum of peak loads. The analysis is forecasting a
minimal surplus of 43 GW under severe conditions (approximately 7 % of peak load) under the same
assumption (1 in 10 years). To put that into perspective, in the Winter Outlook 2012/13 report, ENTSO-E
analysis was forecasting a copperplate surplus of 28 GW under severe conditions.
Taking into account the cross border capacities, the analysis indicated that there is sufficient
interconnection capacity between countries to take full advantage of this excess of generation capacity to
cover the demand in all countries under the studied scenarios.
As for the past Summer and Winter outlook reports, additional data was again requested to allow an
analysis for downward regulation. In addition to the overnight minimum demand periods that were assessed
in previous outlook reports, the daytime minimum demand combined with high photo-voltaic in-feed
scenario was investigated.
Based on the data submitted by each TSO, Europe as a whole should have about 74 GW of downward
regulation margin (about 18 % of load) at the daytime minimum demand and in the ideal case of unlimited
interconnection capacity. When the overnight minimum demand is considered, this downward regulation
margin drops to about 35 GW (approximately 10 % of load).
Taking into account the reported interconnection capacities and using a consistent scenario for the
renewables in-feed, the analysis revealed that under the considered circumstances sufficient means should
be available to export energy out of the countries which expect an excess of inflexible generation.
In the next sections, we will first focus on the generation adequacy analysis, or in other words, the question
whether the available generation can cover demand; both on a national and a pan-European level. Second
the downward regulation margin will be analysed. In this section issues resulting from an excess of
inflexible generation will be investigated, as well as the possibility to export these excesses, or alternatively
the necessity to curtail their outputs.
Individual country perspective analysis
Generation adequacy
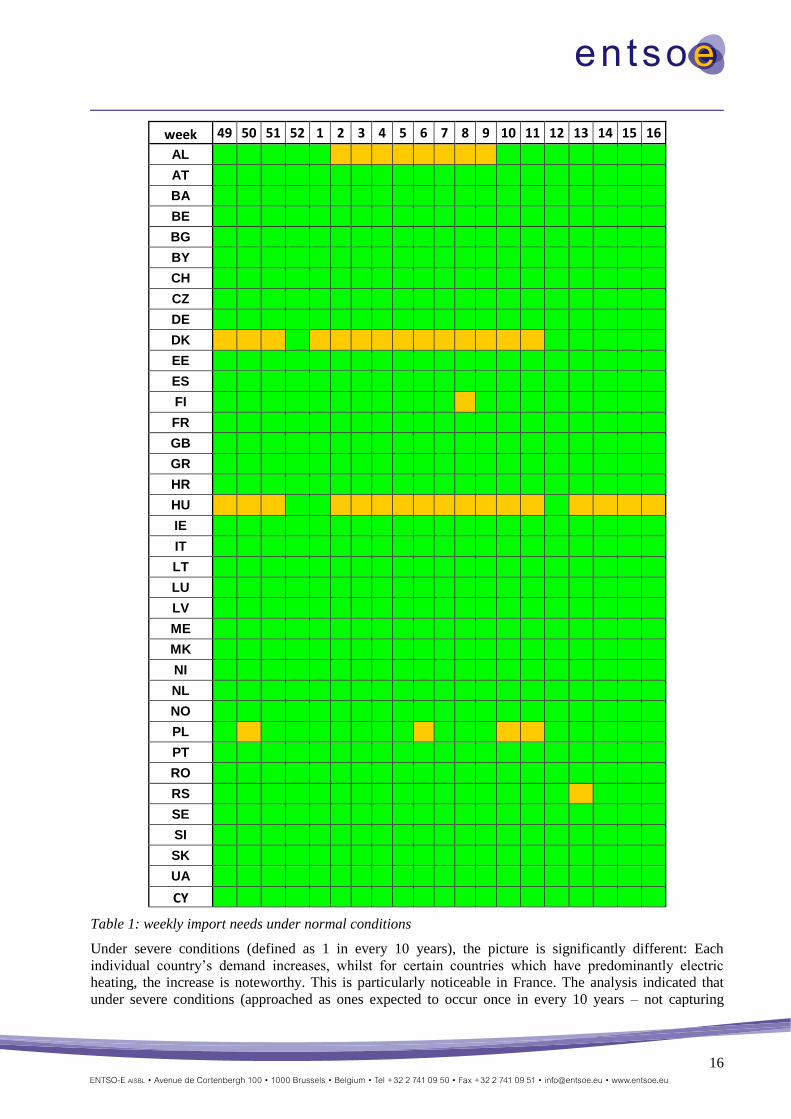
Considering normal conditions, the majority of countries are expected to be able to balance load without
the need of imports, as shown in green in Table 1.
In general, it is expected to have more margins in the European power system over the coming winter
when compared to winter 2012/13, according to the same assumptions. The main reasons for this are
that levels of reliably available generation capacity are higher according to the information available
to TSOs at the time of production of this report: no major unplanned outages are identified; the
amount of mothballed units, including CCGT, is tolerable for this coming winter; hydrological
15
conditions in the South-East European region (where the share of hydro generation is relatively high)
seem good, and expected peak loads show a very slight decrease compared to last winter.
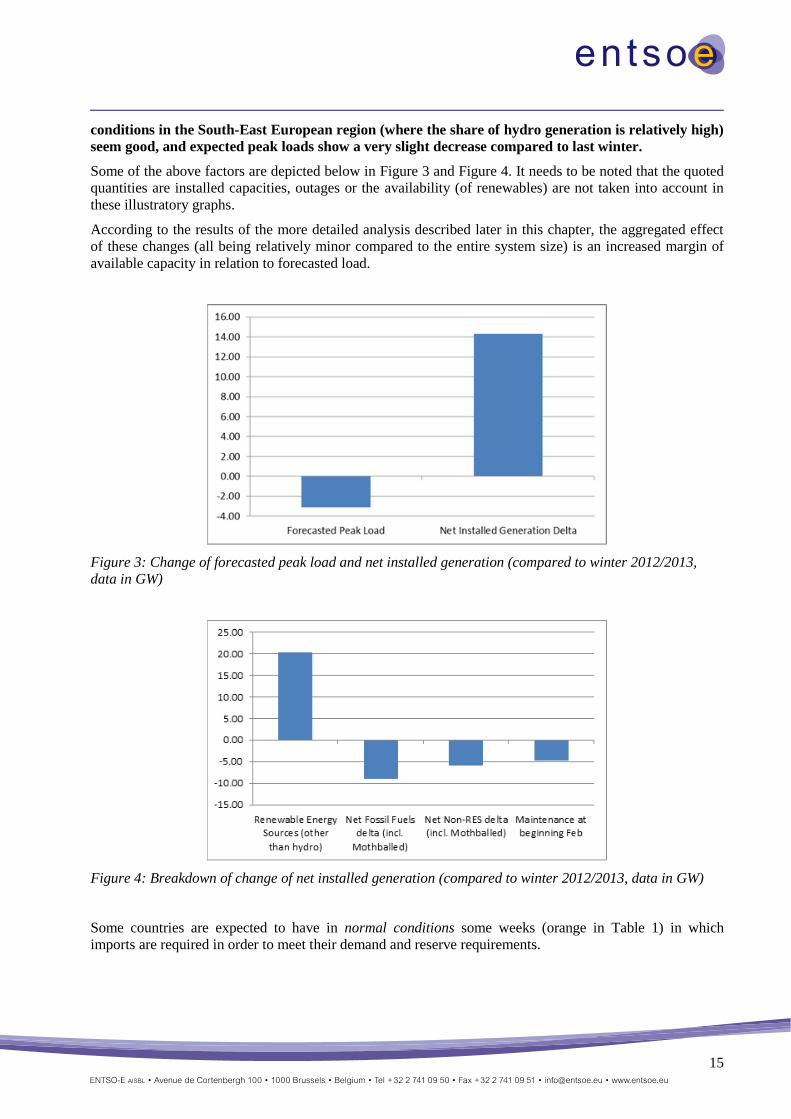
Some of the above factors are depicted below in Figure 3 and Figure 4. It needs to be noted that the quoted
quantities are installed capacities, outages or the availability (of renewables) are not taken into account in
these illustratory graphs.
According to the results of the more detailed analysis described later in this chapter, the aggregated effect
of these changes (all being relatively minor compared to the entire system size) is an increased margin of
available capacity in relation to forecasted load.
Figure 3: Change of forecasted peak load and net installed generation (compared to winter 2012/2013,
data in GW)
Figure 4: Breakdown of change of net installed generation (compared to winter 2012/2013, data in GW)
Some countries are expected to have in normal conditions some weeks (orange in Table 1) in which
imports are required in order to meet their demand and reserve requirements.
16
week 49 50 51 52 1 2 3 4 5 6 7 8 9 10 11 12 13 14 15 16
AL
AT
BA
BE
BG
BY
CH
CZ
DE
DK
EE
ES
FI
FR
GB
GR
HR
HU
IE
IT
LT
LU
LV
ME
MK
NI
NL
NO
PL
PT
RO
RS
SE
SI
SK
UA
CY
Table 1: weekly import needs under normal conditions
Under severe conditions (defined as 1 in every 10 years), the picture is significantly different: Each
individual country’s demand increases, whilst for certain countries which have predominantly electric
heating, the increase is noteworthy. This is particularly noticeable in France. The analysis indicated that
under severe conditions (approached as ones expected to occur once in every 10 years – not capturing
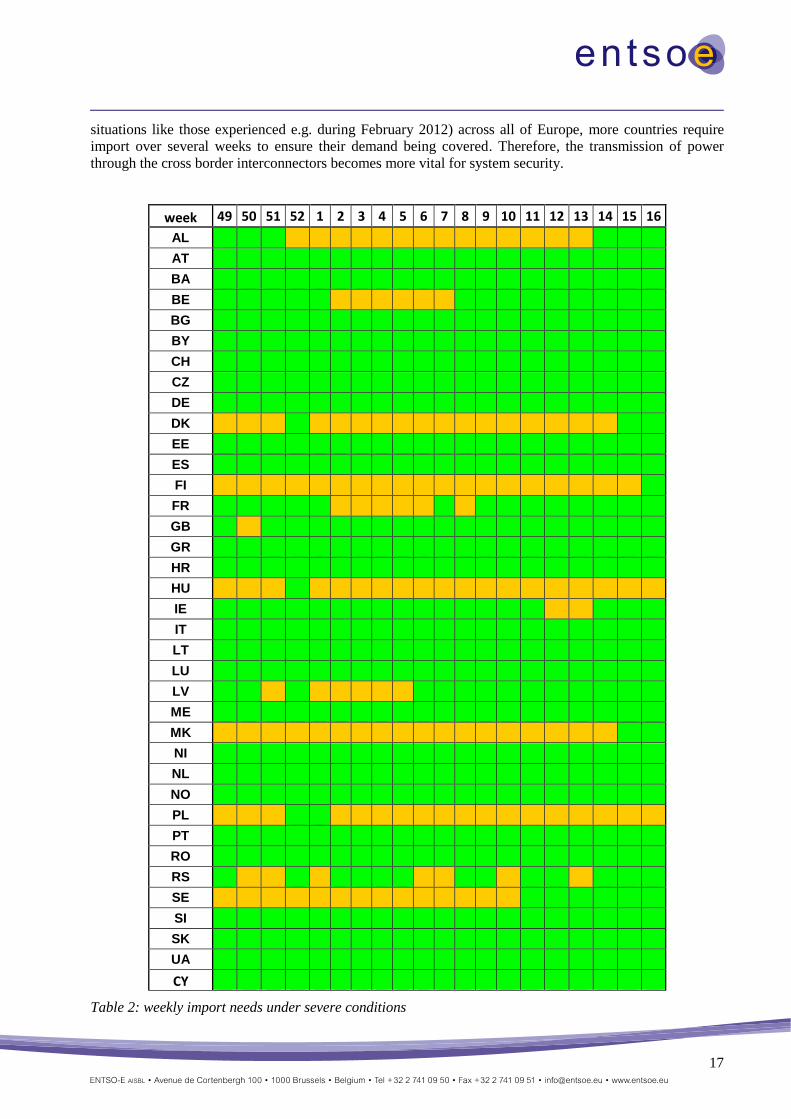
17
situations like those experienced e.g. during February 2012) across all of Europe, more countries require
import over several weeks to ensure their demand being covered. Therefore, the transmission of power
through the cross border interconnectors becomes more vital for system security.
week 49 50 51 52 1 2 3 4 5 6 7 8 9 10 11 12 13 14 15 16
AL
AT
BA
BE
BG
BY
CH
CZ
DE
DK
EE
ES
FI
FR
GB
GR
HR
HU
IE
IT
LT
LU
LV
ME
MK
NI
NL
NO
PL
PT
RO
RS
SE
SI
SK
UA
CY
Table 2: weekly import needs under severe conditions
18
The countries that need to rely on imports at the evening peak load in case of low renewable (wind and
solar) in-feed during (almost) all weeks are Croatia, Denmark, Finland, FYRO Macedonia, Hungary,
Latvia, Poland and Sweden.
Most countries did not communicate an increased risk of generation adequacy issues for the coming winter.
Some countries however provided specific comments on their situation. These comments are summarized
below.
Finland
As in the previous winters, Finland is a deficit area in peak load hours. Required amount of import is
expected to be available from neighbouring areas also in severe weather conditions. However, it should be
noted that there are uncertainties with Russian import due to capacity tariff on the Russian electricity
markets.
Significant changes in the Finnish power system are characterised by decreasing peak load reserve capacity
and an increasing number of mothballed units in the coming winter. Transmission capacity in HVDC links
between Sweden and Finland is reduced compared to nominal capacity due to investigation of the failure in
the Fenno-Skan 1 cable. However, the total transmission capacity will increase 650 MW at the beginning of
February 2014 as a consequence of the commissioning of second HVDC link to Estonia, EstLink 2.
The most critical period is the peak demand period which is typically in Finland from week one to nine. In
the coming winter, week 8 can turn out to be especially critical if temperatures are low and in case of
multiple generation unit failure or fault in remarkable transmission lines.
France
Under normal meteorological conditions, the forecast outlook for the electricity supply-demand balance in
continental France shows no particular risk for the entire winter 2013 - 2014 period.
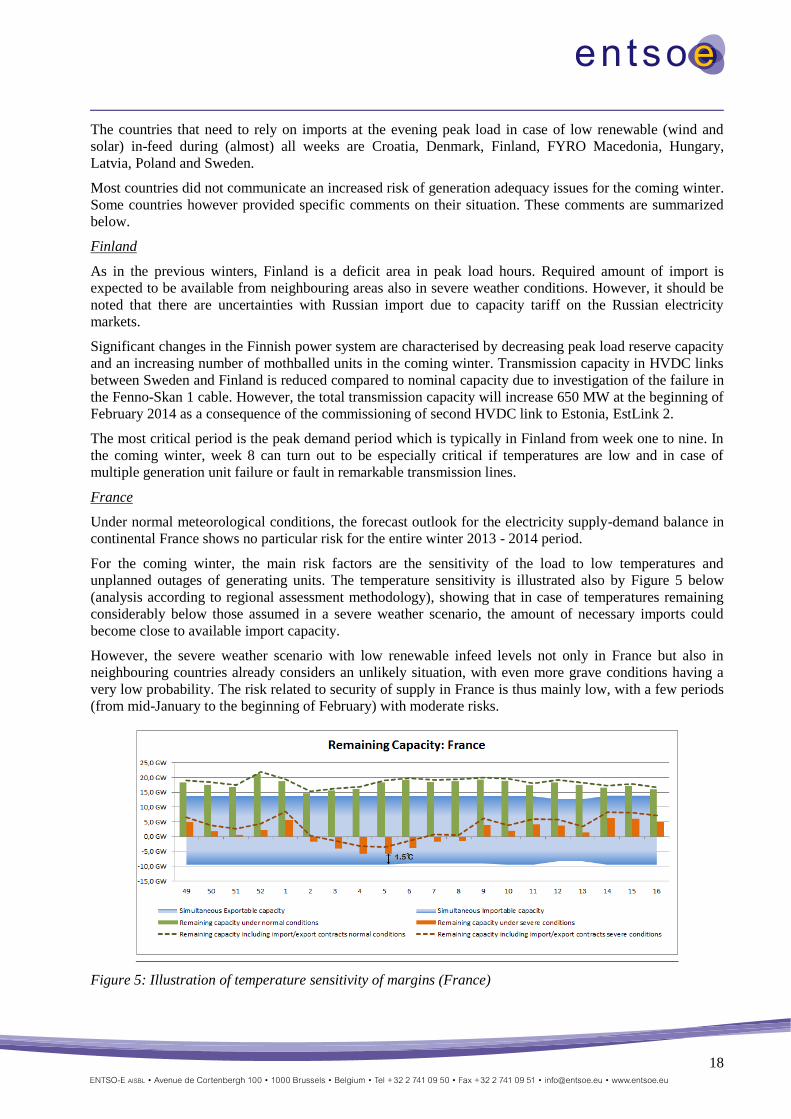
For the coming winter, the main risk factors are the sensitivity of the load to low temperatures and
unplanned outages of generating units. The temperature sensitivity is illustrated also by Figure 5 below
(analysis according to regional assessment methodology), showing that in case of temperatures remaining
considerably below those assumed in a severe weather scenario, the amount of necessary imports could
become close to available import capacity.
However, the severe weather scenario with low renewable infeed levels not only in France but also in
neighbouring countries already considers an unlikely situation, with even more grave conditions having a
very low probability. The risk related to security of supply in France is thus mainly low, with a few periods
(from mid-January to the beginning of February) with moderate risks.
Figure 5: Illustration of temperature sensitivity of margins (France)
19
Germany
After the first step of the nuclear phase-out in Germany in 2011 German TSOs are still facing a situation
characterized by the enduring regional lack of conventional generation, primarily in Southern Germany. At
the same time the commissioning of important conventional power plants in Germany is further delayed.
RES are continued to be installed at a high speed. For southern Germany this attributes largely to
distributed PV generation, however, for the winter period with load maximum in the evening PV generation
does not contribute to the coverage of demand while wind feed-in is not guaranteed.
In the winter period the German TSOs may be faced again with problems to meet (n-1)-security rules,
especially in situations with high wind feed-in in the North and high load in the South of Germany. In these
situations, an excess of transmission capacities of network elements in the important transmission axes
from North to South has to be expected. Being faced with these risks for security of supply the German
TSOs are again preparing a high amount of grid- and market-related measures e.g. redispatch with
increasing amount of power to be shifted between control areas.
To cover the anticipated very high redispatch demand as for the last winter, the German TSOs determined
the need of an additional reserve generation capacity of about 2.5 GW up to 4.5 GW under exceptional
contingencies for the winter 2013/2014.
Latvia
Despite sufficient installed capacity on the hydro power plants, shortage of inflow water is the main
limiting factor for generation availability. The main periods of stress for Latvia power system are possible
if water inflow in Daugava River will be very low as showed in severe conditions and all consumption must
be covered mainly by CHPP. The main Latvian CHPPs are fuelled by gas. Latvian power companies are
importing from Russia and gas prices are one of the most significant indicators which could affect CHPPs
generation availability in Latvia area. In this winter it is expected, that gas import will be according to
CHPPs generation plans and will be sufficient for the CHPPs requirements.
Considering the strong interconnections between Baltic States and 3rd countries and synchronous network
operation between Baltic States and Russian and Belarusian electricity systems as well, Latvian electricity
consumption during winter period could be covered with Russia generations in case of unpredictable
interconnection shortages and generation shortages should take place. Out of security of supply reasons
Latvia power system is keeping a generation reserve for N-1 criteria whole year.
Lithuania
The Lithuanian Power System depends on internal generation and imports from neighbouring countries.
The electricity generation from local thermal, hydro and wind power plants is expected to cover
approximately 36% of demand, while 64% will be covered by imports. During the winter period the
capacity of interconnection are sufficient that demand can be covered by imported electricity. Import
volume from 3rd
(Russia, Belarus) countries highly depends on Estonia-Latvia interconnection capacities.
According to last winter experience the high risk of wind turbines icing must be taken into account. It is
foreseen that additional regulating reserves will be needed to cover wind generation deficit. According to
analysis, three extraordinary weeks are expected: the week 52 and week 1 due to Christmas and New year
celebration and week 11 due to holiday on Tuesday. It is foreseen that additional regulating reserves will be
needed to cover potential consumption imbalances during these three weeks.
Poland
Under severe conditions, for all analysed reference points (except for Christmas and New Year period) PSE
observes a negative balance. To keep the margins at a safe level, the Polish TSO has prepared several
scenarios for operational measures which can cope with situations characterised by power shortage.
In addition, extremely severe balancing conditions in the winter period may take place in case of cold
spells. In such a situation, the risk of unscheduled flows through the Polish system (from the western
towards the southern Polish border) is low, thus the import of energy up to 1000 MW will be possible on
20
the synchronous profile (in normal conditions there is no import capacity available). Additionally there
could be the option to make use of units up to 300 MW capacity, which in the yearly planning are classified
as non-usable capacity.
Downward regulation margin
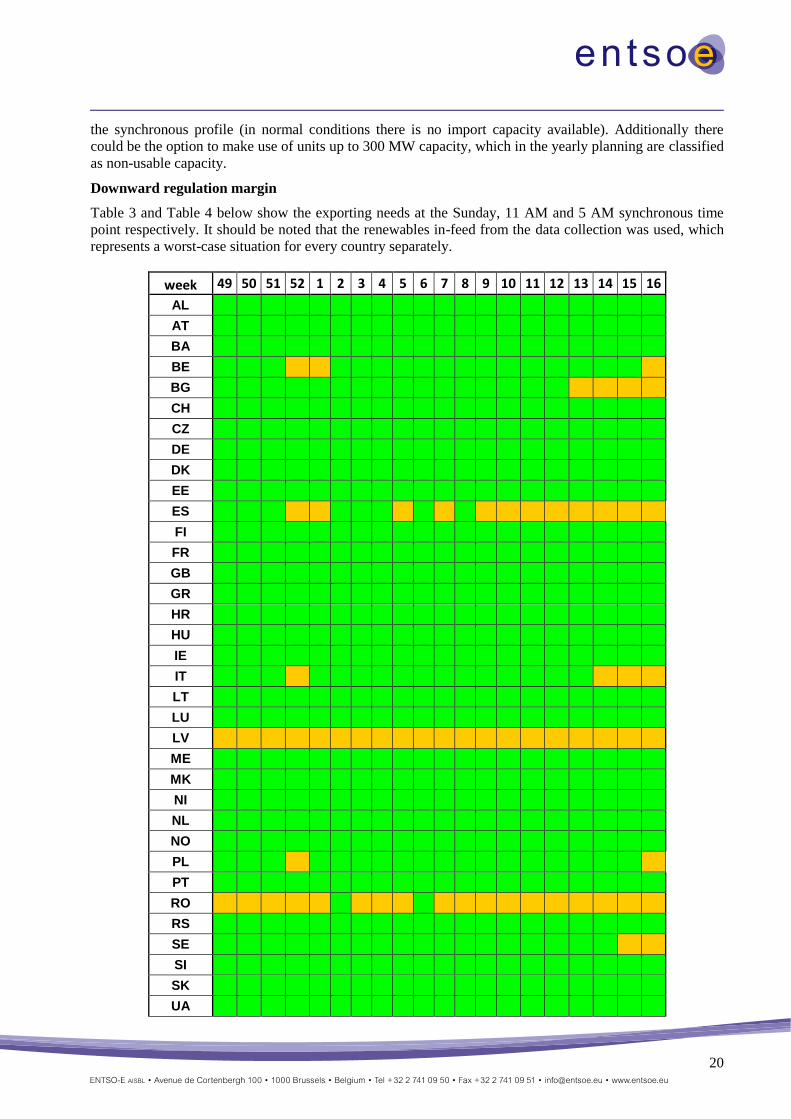
Table 3 and Table 4 below show the exporting needs at the Sunday, 11 AM and 5 AM synchronous time
point respectively. It should be noted that the renewables in-feed from the data collection was used, which
represents a worst-case situation for every country separately.
week 49 50 51 52 1 2 3 4 5 6 7 8 9 10 11 12 13 14 15 16
AL
AT
BA
BE
BG
CH
CZ
DE
DK
EE
ES
FI
FR
GB
GR
HR
HU
IE
IT
LT
LU
LV
ME
MK
NI
NL
NO
PL
PT
RO
RS
SE
SI
SK
UA
21
Table 3: weekly exporting needs at daytime minimum
The countries that need to export or curtail an excess of inflexible generation at the daytime minimum in
case of high renewables (wind and solar) in-feed during (almost) all weeks are Spain, Latvia, Romania and
Cyprus.
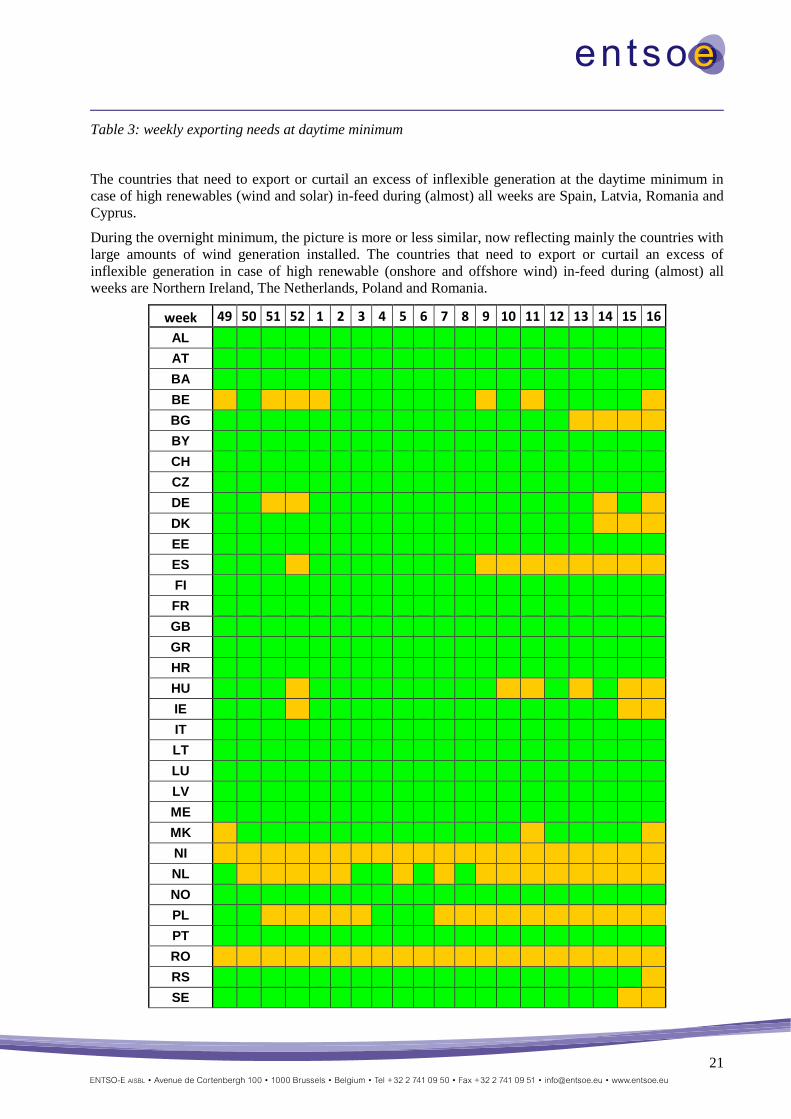
During the overnight minimum, the picture is more or less similar, now reflecting mainly the countries with
large amounts of wind generation installed. The countries that need to export or curtail an excess of
inflexible generation in case of high renewable (onshore and offshore wind) in-feed during (almost) all
weeks are Northern Ireland, The Netherlands, Poland and Romania.
week 49 50 51 52 1 2 3 4 5 6 7 8 9 10 11 12 13 14 15 16
AL
AT
BA
BE
BG
BY
CH
CZ
DE
DK
EE
ES
FI
FR
GB
GR
HR
HU
IE
IT
LT
LU
LV
ME
MK
NI
NL
NO
PL
PT
RO
RS
SE
22
SI
SK
UA
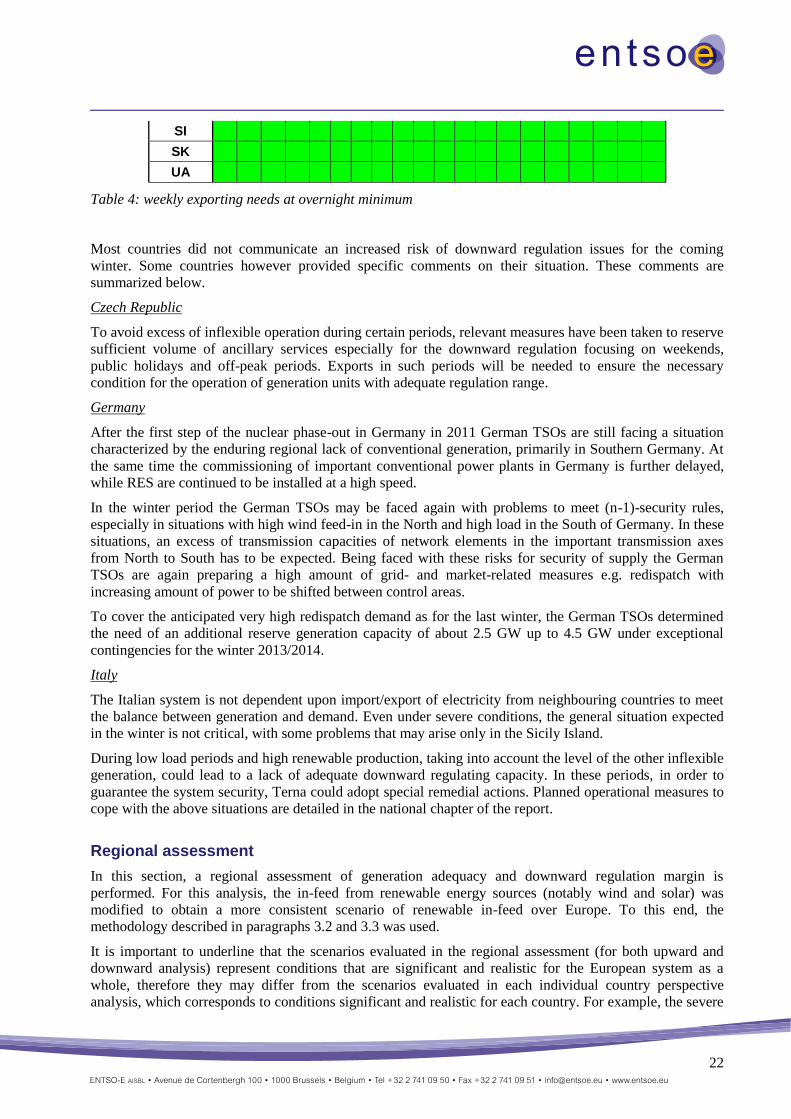
Table 4: weekly exporting needs at overnight minimum
Most countries did not communicate an increased risk of downward regulation issues for the coming
winter. Some countries however provided specific comments on their situation. These comments are
summarized below.
Czech Republic
To avoid excess of inflexible operation during certain periods, relevant measures have been taken to reserve
sufficient volume of ancillary services especially for the downward regulation focusing on weekends,
public holidays and off-peak periods. Exports in such periods will be needed to ensure the necessary
condition for the operation of generation units with adequate regulation range.
Germany
After the first step of the nuclear phase-out in Germany in 2011 German TSOs are still facing a situation
characterized by the enduring regional lack of conventional generation, primarily in Southern Germany. At
the same time the commissioning of important conventional power plants in Germany is further delayed,
while RES are continued to be installed at a high speed.
In the winter period the German TSOs may be faced again with problems to meet (n-1)-security rules,
especially in situations with high wind feed-in in the North and high load in the South of Germany. In these
situations, an excess of transmission capacities of network elements in the important transmission axes
from North to South has to be expected. Being faced with these risks for security of supply the German
TSOs are again preparing a high amount of grid- and market-related measures e.g. redispatch with
increasing amount of power to be shifted between control areas.
To cover the anticipated very high redispatch demand as for the last winter, the German TSOs determined
the need of an additional reserve generation capacity of about 2.5 GW up to 4.5 GW under exceptional
contingencies for the winter 2013/2014.
Italy
The Italian system is not dependent upon import/export of electricity from neighbouring countries to meet
the balance between generation and demand. Even under severe conditions, the general situation expected
in the winter is not critical, with some problems that may arise only in the Sicily Island.
During low load periods and high renewable production, taking into account the level of the other inflexible
generation, could lead to a lack of adequate downward regulating capacity. In these periods, in order to
guarantee the system security, Terna could adopt special remedial actions. Planned operational measures to
cope with the above situations are detailed in the national chapter of the report.
Regional assessment
In this section, a regional assessment of generation adequacy and downward regulation margin is
performed. For this analysis, the in-feed from renewable energy sources (notably wind and solar) was
modified to obtain a more consistent scenario of renewable in-feed over Europe. To this end, the
methodology described in paragraphs 3.2 and 3.3 was used.
It is important to underline that the scenarios evaluated in the regional assessment (for both upward and
downward analysis) represent conditions that are significant and realistic for the European system as a
whole, therefore they may differ from the scenarios evaluated in each individual country perspective
analysis, which corresponds to conditions significant and realistic for each country. For example, the severe
23
conditions of the whole European System do not correspond to the “simple envelope” of each individual
severe condition. The results described in the paragraphs below could consequently differ from the ones
presented in previous paragraph.
Generation adequacy
Based on normal conditions for generation and demand, the majority of countries do not require imports as
shown pictorially in Table 5. Where a country is coloured green, it has excess capacity to meet demand and
reserves. The countries which are coloured in orange can cover their deficit with imports, whereas for the
countries in red the regional analysis revealed that their deficit cannot be covered with imports due to
insufficient reported cross-border exchange capacities or a lack of energy in the surrounding countries.
week 49 50 51 52 1 2 3 4 5 6 7 8 9 10 11 12 13 14 15 16
AL
AT
BA
BE
BG
BY
CH
CZ
DE
DK
EE
ES
FI
FR
GB
GR
HR
HU
IE
IT
LT
LU
LV
ME
MK
NI
NL
NO
PL
PT
RO
RS
SE
24
SI
SK
UA
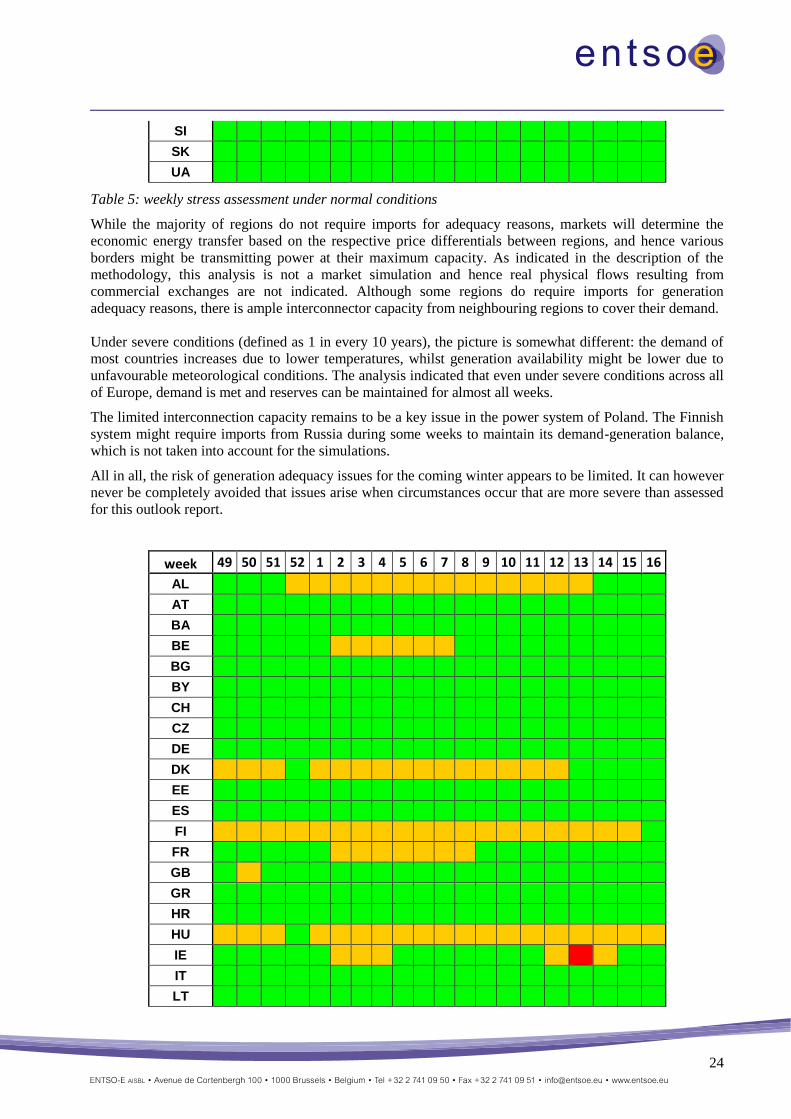
Table 5: weekly stress assessment under normal conditions
While the majority of regions do not require imports for adequacy reasons, markets will determine the
economic energy transfer based on the respective price differentials between regions, and hence various
borders might be transmitting power at their maximum capacity. As indicated in the description of the
methodology, this analysis is not a market simulation and hence real physical flows resulting from
commercial exchanges are not indicated. Although some regions do require imports for generation
adequacy reasons, there is ample interconnector capacity from neighbouring regions to cover their demand.
Under severe conditions (defined as 1 in every 10 years), the picture is somewhat different: the demand of
most countries increases due to lower temperatures, whilst generation availability might be lower due to
unfavourable meteorological conditions. The analysis indicated that even under severe conditions across all
of Europe, demand is met and reserves can be maintained for almost all weeks.
The limited interconnection capacity remains to be a key issue in the power system of Poland. The Finnish
system might require imports from Russia during some weeks to maintain its demand-generation balance,
which is not taken into account for the simulations.
All in all, the risk of generation adequacy issues for the coming winter appears to be limited. It can however
never be completely avoided that issues arise when circumstances occur that are more severe than assessed
for this outlook report.
week 49 50 51 52 1 2 3 4 5 6 7 8 9 10 11 12 13 14 15 16
AL
AT
BA
BE
BG
BY
CH
CZ
DE
DK
EE
ES
FI
FR
GB
GR
HR
HU
IE
IT
LT
25
LU
LV
ME
MK
NI
NL
NO
PL
PT
RO
RS
SE
SI
SK
UA
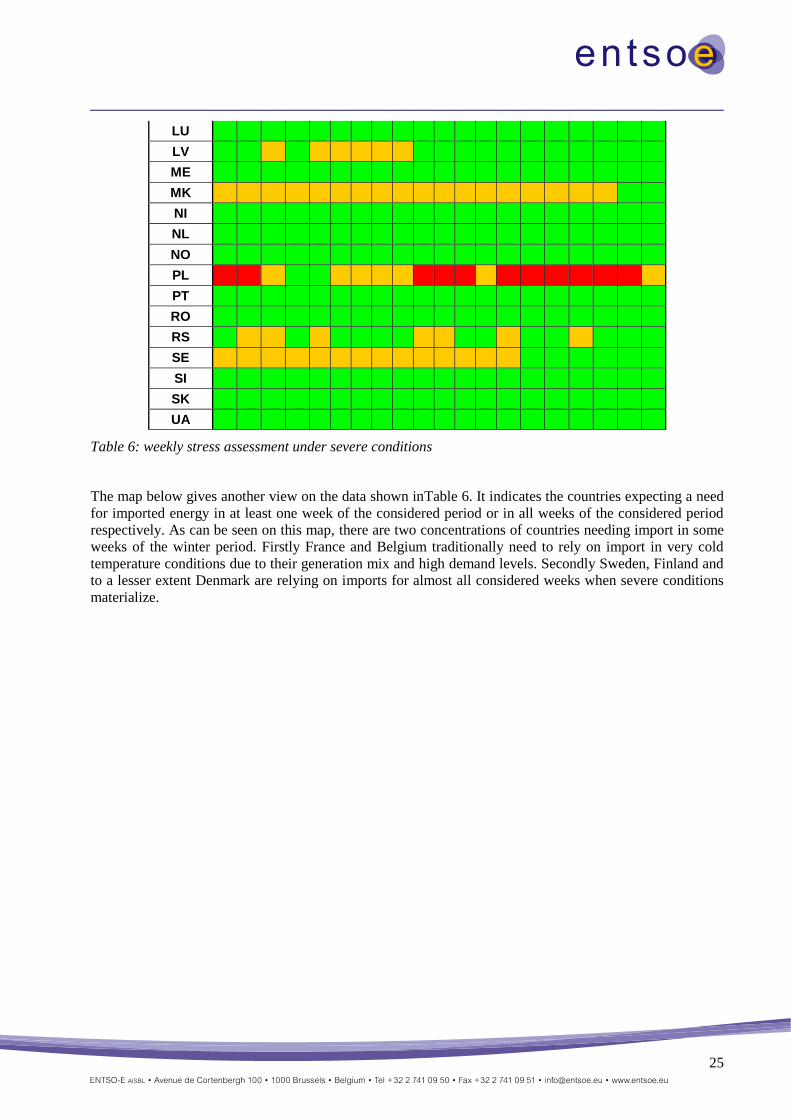
Table 6: weekly stress assessment under severe conditions
The map below gives another view on the data shown inTable 6. It indicates the countries expecting a need
for imported energy in at least one week of the considered period or in all weeks of the considered period
respectively. As can be seen on this map, there are two concentrations of countries needing import in some
weeks of the winter period. Firstly France and Belgium traditionally need to rely on import in very cold
temperature conditions due to their generation mix and high demand levels. Secondly Sweden, Finland and
to a lesser extent Denmark are relying on imports for almost all considered weeks when severe conditions
materialize.

26
Figure 6: Overview (map) of the import needs for severe conditions
27
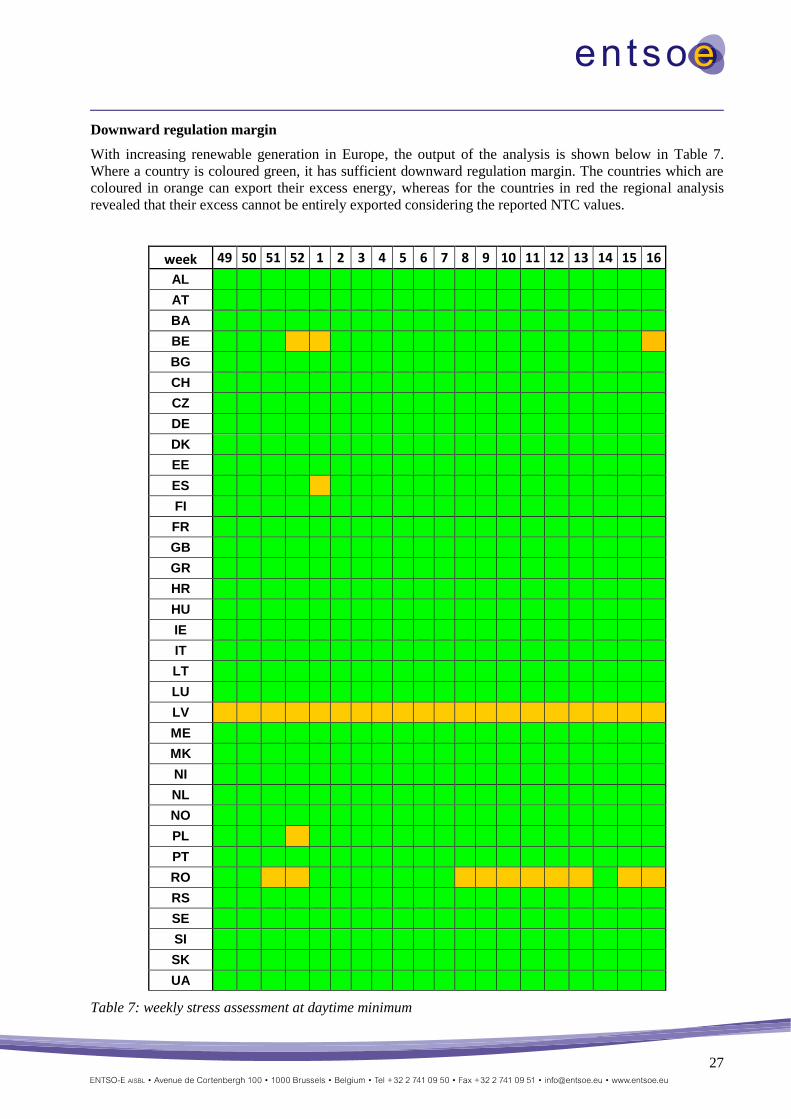
Downward regulation margin
With increasing renewable generation in Europe, the output of the analysis is shown below in Table 7.
Where a country is coloured green, it has sufficient downward regulation margin. The countries which are
coloured in orange can export their excess energy, whereas for the countries in red the regional analysis
revealed that their excess cannot be entirely exported considering the reported NTC values.
week 49 50 51 52 1 2 3 4 5 6 7 8 9 10 11 12 13 14 15 16
AL
AT
BA
BE
BG
CH
CZ
DE
DK
EE
ES
FI
FR
GB
GR
HR
HU
IE
IT
LT
LU
LV
ME
MK
NI
NL
NO
PL
PT
RO
RS
SE
SI
SK
UA
Table 7: weekly stress assessment at daytime minimum
28
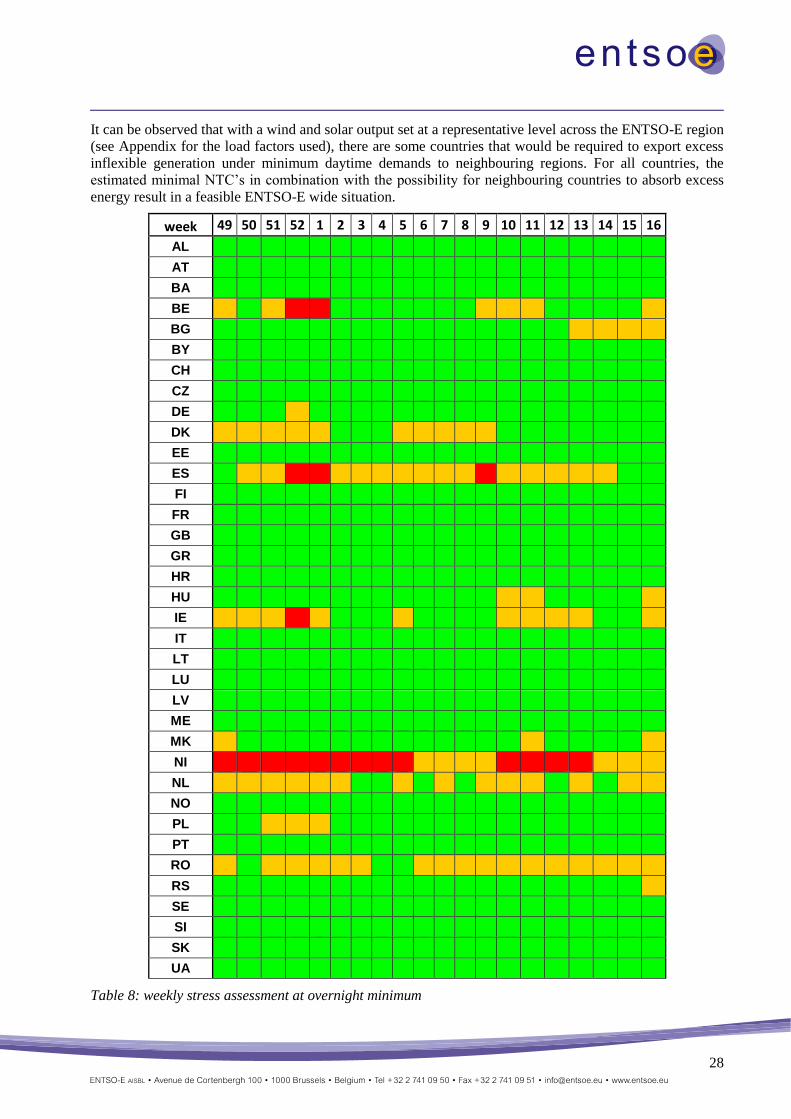
It can be observed that with a wind and solar output set at a representative level across the ENTSO-E region
(see Appendix for the load factors used), there are some countries that would be required to export excess
inflexible generation under minimum daytime demands to neighbouring regions. For all countries, the
estimated minimal NTC’s in combination with the possibility for neighbouring countries to absorb excess
energy result in a feasible ENTSO-E wide situation.
week 49 50 51 52 1 2 3 4 5 6 7 8 9 10 11 12 13 14 15 16
AL
AT
BA
BE
BG
BY
CH
CZ
DE
DK
EE
ES
FI
FR
GB
GR
HR
HU
IE
IT
LT
LU
LV
ME
MK
NI
NL
NO
PL
PT
RO
RS
SE
SI
SK
UA
Table 8: weekly stress assessment at overnight minimum
29
An analysis of the overnight minimum demand scenario yields similar results and conclusions as for the
daytime scenario: sufficient interconnection capacity is available to export excess inflexible generation to
neighbouring countries under the investigated hypotheses in most situations.
For Spain and Belgium, there are a few weeks where exporting capacities are fully used, and care should be
taken to maximize these capacities when the risk of encountering downward adequacy issues is high.
Ireland and particularly Northern Ireland may face some issues in case of high renewable infeed during the
overnight valley periods, partly owing to the limited capacity availability of the Moyle Interconnector due
to a subsea cable fault.
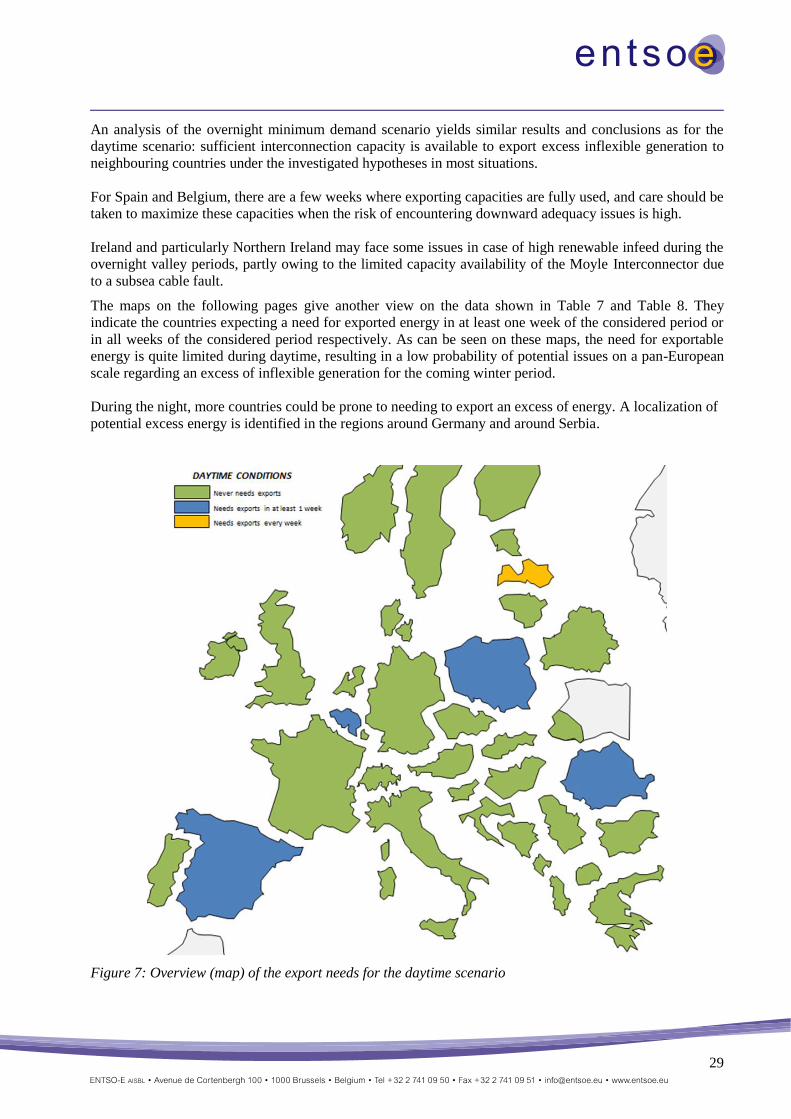
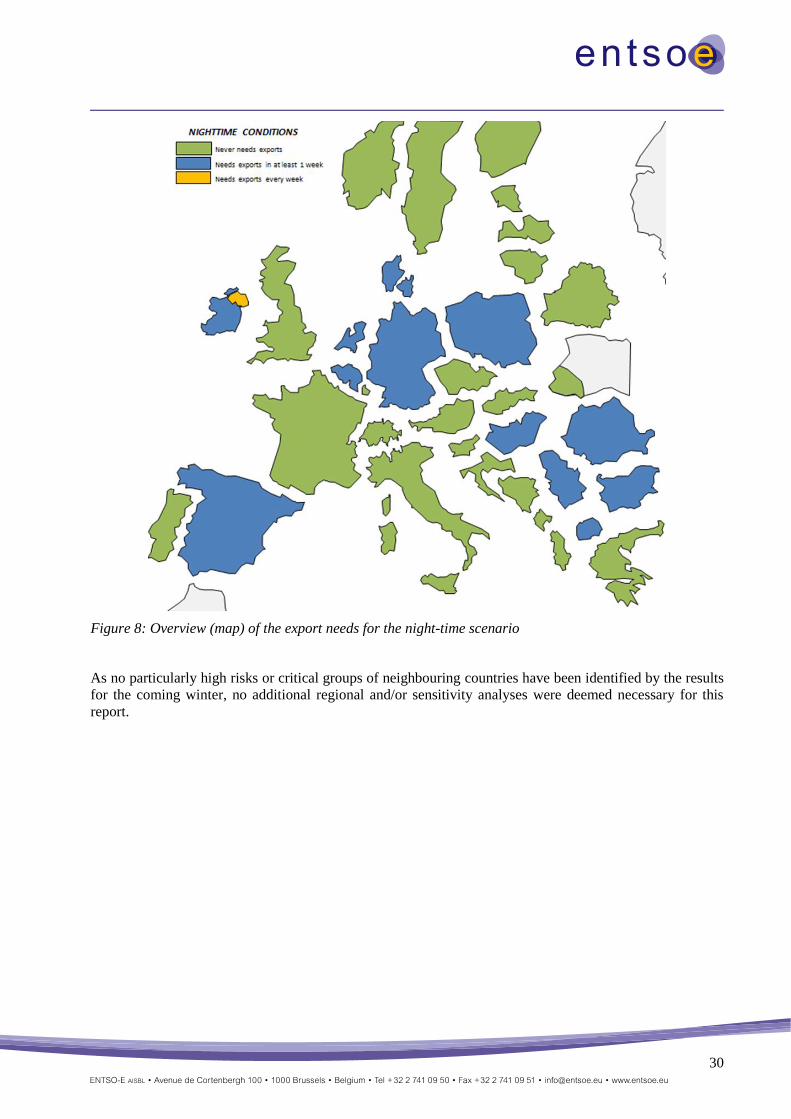
The maps on the following pages give another view on the data shown in Table 7 and Table 8. They
indicate the countries expecting a need for exported energy in at least one week of the considered period or
in all weeks of the considered period respectively. As can be seen on these maps, the need for exportable
energy is quite limited during daytime, resulting in a low probability of potential issues on a pan-European
scale regarding an excess of inflexible generation for the coming winter period.
During the night, more countries could be prone to needing to export an excess of energy. A localization of
potential excess energy is identified in the regions around Germany and around Serbia.
Figure 7: Overview (map) of the export needs for the daytime scenario
30
Figure 8: Overview (map) of the export needs for the night-time scenario
As no particularly high risks or critical groups of neighbouring countries have been identified by the results
for the coming winter, no additional regional and/or sensitivity analyses were deemed necessary for this
report.

31
6. Country level
Individual country responses to Winter Outlook
Albania
Synopsis
Considering the new generation capacity and import contracts, OST does not anticipate significant balance
problems in the Albanian Power System during the upcoming winter period. The most critical period
remains during the second part of December and January.
The level of remaining capacity considered as necessary in order to ensure a secure operation for the next
winter is 120 MW. In Albania there are not yet intermittent energy sources like wind or solar, to be taken
into account in our assessment.
The maintenance of the generating units is performed already. No problems in the transmission network are
expected because the most maintenance works have been accomplished during the summer and fall period
of the year.
Import Contracts till the end of this year are concluded already by market participants, and the others,
covering the first quarter of next year, are under the process.
In case of severe conditions it will be requested to increase the import with at least 100 MW. Under these
conditions all criteria for the system adequacy will be met.
General situation
The firm maintenance program of the generation units for next year, normally is issued in October,
nevertheless, the maintenance schedule of the generating units is set to minimum because the most
maintenance works have been accomplished during the summer period of the year.
In case of deficiency of generation (low hydrology, loss of major units) or unavailability of imports from
neighbouring countries, and if the system reserves could not cover the lack of energy, last measure load
reduction is possible according to national defence scheme. We do not expect any problems related with
shortages of transmission capacity or low generation availability, all maintenance works are already
performed during the summer and fall period of the year.
Most critical periods
The most critical period remains during the second part of December and January, depending from weather
conditions and temperature. Historically, the last week of the year has been the most critical. In case of
emergency, our Operator is authorized to apply load shedding in accordance with terms of Grid Code.
Expected role of interconnections
In relation to maintain adequacy, our power system is usually dependent upon imports of electricity from
neighbouring countries, and it will be dependent upon imports also for the coming year. Physical imports
are expected from the Greece and Montenegrin border and exports on the Kosovo border. Due to high
transfer capacities (two interconnectors 400 kV and two 220 kV), no problems with congestions due to
transit flows or security of supply are expected.
In general the interconnections are sufficient for import/export of electricity.
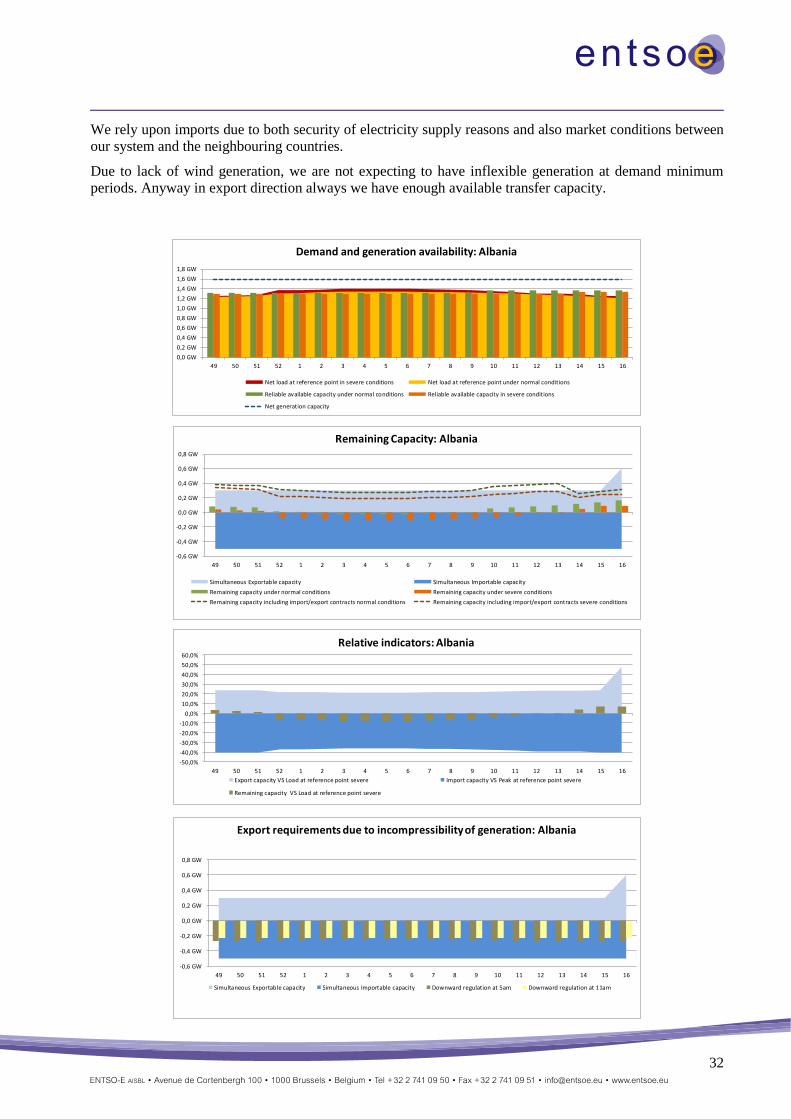
The average simultaneous import capacity for the coming winter is approximately 500 MW, whereas the
average simultaneous export capacity is approximately 300 MW.
Available cross border capacity allows compensation of eventual energy deficit and transit of energy for
successfully functioning of electrical market.
32
We rely upon imports due to both security of electricity supply reasons and also market conditions between
our system and the neighbouring countries.
Due to lack of wind generation, we are not expecting to have inflexible generation at demand minimum
periods. Anyway in export direction always we have enough available transfer capacity.
0,0 GW
0,2 GW
0,4 GW
0,6 GW
0,8 GW
1,0 GW
1,2 GW
1,4 GW
1,6 GW
1,8 GW
49 50 51 52 1 2 3 4 5 6 7 8 9 10 11 12 13 14 15 16
Demand and generation availability: Albania
Net load at reference point in severe conditions Net load at reference point under normal conditions
Reliable available capacity under normal conditions Reliable available capacity in severe conditions
Net generation capacity
-0,6 GW
-0,4 GW
-0,2 GW
0,0 GW
0,2 GW
0,4 GW
0,6 GW
0,8 GW
49 50 51 52 1 2 3 4 5 6 7 8 9 10 11 12 13 14 15 16
Remaining Capacity: Albania
Simultaneous Exportable capacity Simultaneous Importable capacity
Remaining capacity under normal conditions Remaining capacity under severe conditions
Remaining capacity including import/export contracts normal conditions Remaining capacity including import/export contracts severe conditions
-50,0%
-40,0%
-30,0%
-20,0%
-10,0%
0,0%
10,0%
20,0%
30,0%
40,0%
50,0%
60,0%
49 50 51 52 1 2 3 4 5 6 7 8 9 10 11 12 13 14 15 16
Relative indicators: Albania
Export capacity VS Load at reference point severe Import capacity VS Peak at reference point severe
Remaining capacity VS Load at reference point severe
-0,6 GW
-0,4 GW
-0,2 GW
0,0 GW
0,2 GW
0,4 GW
0,6 GW
0,8 GW
49 50 51 52 1 2 3 4 5 6 7 8 9 10 11 12 13 14 15 16
Export requirements due to incompressibility of generation: Albania
Simultaneous Exportable capacity Simultaneous Importable capacity Downward regulation at 5am Downward regulation at 11am
33
Framework and methodology of the assessments
According to the Grid Code, OST's regular operation planning horizons are: year (Annual Operation Study,
AOS), month, week and day. The AOS is based on a model combining stochastic and deterministic
approach, and make use of information provided by grid users. In medium and short term, OST conducts
studies concerning the Generation Adequacy Assessment. The studies include load forecasts and multiple
scenarios on energy management using probabilistic and deterministic methods. The energy management
studies aims at checking the actual energy situation and the level of hydro reserves. These studies are
regularly revised to include mainly variations in the load and/or the availability of the power plants.
Austria
General situation
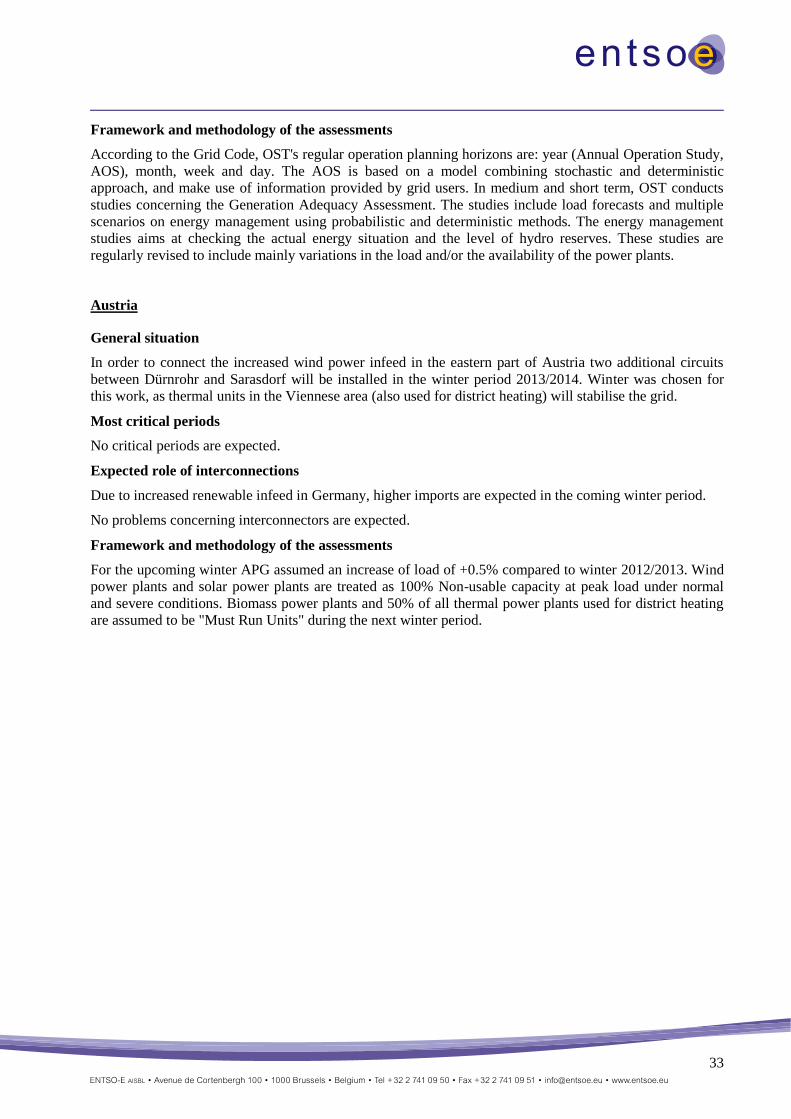
In order to connect the increased wind power infeed in the eastern part of Austria two additional circuits
between Dürnrohr and Sarasdorf will be installed in the winter period 2013/2014. Winter was chosen for
this work, as thermal units in the Viennese area (also used for district heating) will stabilise the grid.
Most critical periods
No critical periods are expected.
Expected role of interconnections
Due to increased renewable infeed in Germany, higher imports are expected in the coming winter period.
No problems concerning interconnectors are expected.
Framework and methodology of the assessments
For the upcoming winter APG assumed an increase of load of +0.5% compared to winter 2012/2013. Wind
power plants and solar power plants are treated as 100% Non-usable capacity at peak load under normal
and severe conditions. Biomass power plants and 50% of all thermal power plants used for district heating
are assumed to be "Must Run Units" during the next winter period.
34
0,0 GW
5,0 GW
10,0 GW
15,0 GW
20,0 GW
25,0 GW
49 50 51 52 1 2 3 4 5 6 7 8 9 10 11 12 13 14 15 16
Demand and generation availability: Austria
Net load at reference point in severe conditions Net load at reference point under normal conditions
Reliable available capacity under normal conditions Reliable available capacity in severe conditions
Net generation capacity
-6,0 GW
-4,0 GW
-2,0 GW
0,0 GW
2,0 GW
4,0 GW
6,0 GW
8,0 GW
10,0 GW
12,0 GW
49 50 51 52 1 2 3 4 5 6 7 8 9 10 11 12 13 14 15 16
Remaining Capacity: Austria
Simultaneous Exportable capacity (Germany excluded) Simultaneous Importable capacity (Germany excluded)
Remaining capacity under normal conditions Remaining capacity under severe conditions
Remaining capacity including import/export contracts normal conditions Remaining capacity including import/export contracts severe conditions
-60,0%
-40,0%
-20,0%
0,0%
20,0%
40,0%
60,0%
80,0%
100,0%
120,0%
49 50 51 52 1 2 3 4 5 6 7 8 9 10 11 12 13 14 15 16
Relative indicators: Austria
Export capacity (Germany excluded) VS Load at reference point severe Import capacity (Germany excluded) VS Peak at reference point severe
Remaining capacity VS Load at reference point severe
-6,0 GW
-5,0 GW
-4,0 GW
-3,0 GW
-2,0 GW
-1,0 GW
0,0 GW
1,0 GW
2,0 GW
3,0 GW
4,0 GW
49 50 51 52 1 2 3 4 5 6 7 8 9 10 11 12 13 14 15 16
Export requirements due to incompressibility of generation: Austria
Simultaneous Exportable capacity (Germany excluded) Simultaneous Importable capacity (Germany excluded)
Downward regulation at 5am Downward regulation at 11am
35
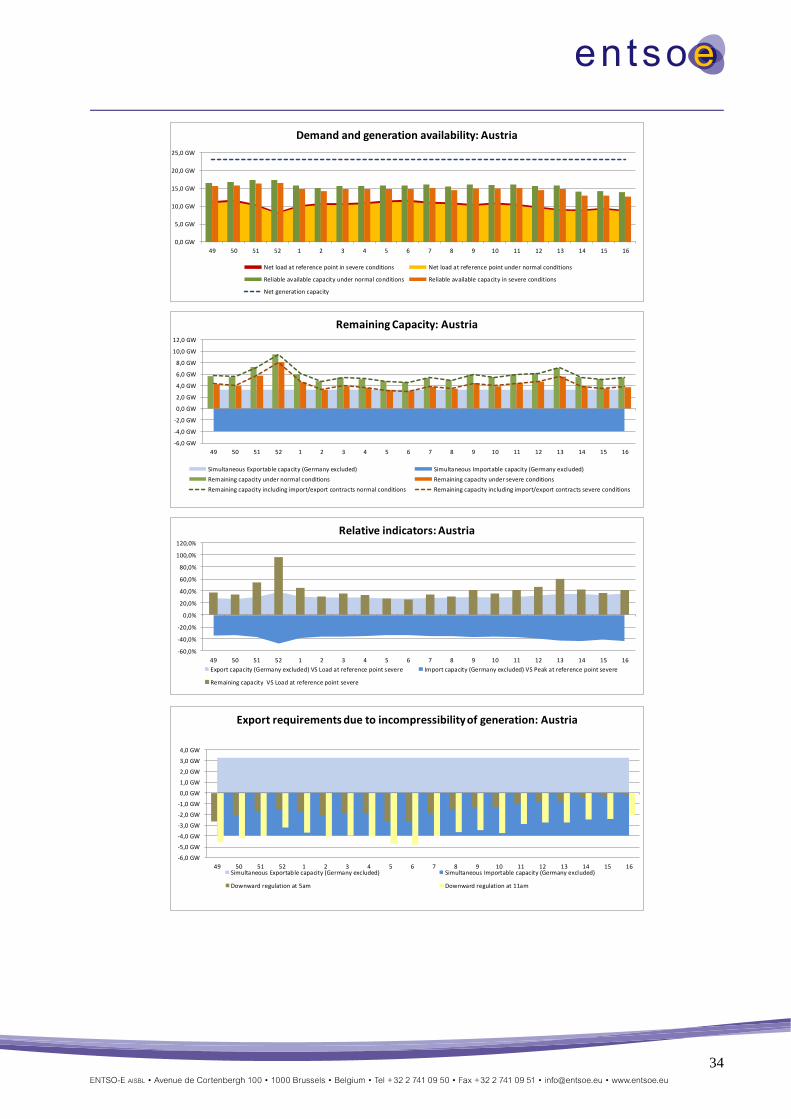
Bosnia and Herzegovina
0,0 GW
0,5 GW
1,0 GW
1,5 GW
2,0 GW
2,5 GW
3,0 GW
3,5 GW
4,0 GW
49 50 51 52 1 2 3 4 5 6 7 8 9 10 11 12 13 14 15 16
Demand and generation availability: Bosnia and Herzegovina
Net load at reference point in severe conditions Net load at reference point under normal conditions
Reliable available capacity under normal conditions Reliable available capacity in severe conditions
Net generation capacity
-2,0 GW
-1,5 GW
-1,0 GW
-0,5 GW
0,0 GW
0,5 GW
1,0 GW
1,5 GW
2,0 GW
49 50 51 52 1 2 3 4 5 6 7 8 9 10 11 12 13 14 15 16
Remaining Capacity: Bosnia and Herzegovina
Simultaneous Exportable capacity Simultaneous Importable capacity
Remaining capacity under normal conditions Remaining capacity under severe conditions
Remaining capacity including import/export contracts normal conditions Remaining capacity including import/export contracts severe conditions
-80,0%
-60,0%
-40,0%
-20,0%
0,0%
20,0%
40,0%
60,0%
80,0%
100,0%
49 50 51 52 1 2 3 4 5 6 7 8 9 10 11 12 13 14 15 16
Relative indicators: Bosnia and Herzegovina
Export capacity VS Load at reference point severe Import capacity VS Peak at reference point severe
Remaining capacity VS Load at reference point severe
-2,0 GW
-1,5 GW
-1,0 GW
-0,5 GW
0,0 GW
0,5 GW
1,0 GW
1,5 GW
2,0 GW
49 50 51 52 1 2 3 4 5 6 7 8 9 10 11 12 13 14 15 16
Export requirements due to incompressibility of generation: Bosnia and Herzegovina
Simultaneous Exportable capacity Simultaneous Importable capacity Downward regulation at 5am Downward regulation at 11am
36
Belgium
Synopsis
The situation regarding generation adequacy for Belgium will be somewhat less stressed for the coming
winter compared to winter 2012-2013. The two nuclear units that were unavailable last winter are fully
operational again, resulting in about 2000 MW of additional available generation. This positive effect is
somewhat mitigated by 800 MW of thermal production that was decommissioned compared to the start of
last winter. Additionally 400 MW of thermal production will be mothballed in January 2014. No major
thermal generation units are being commissioned in the coming winter.
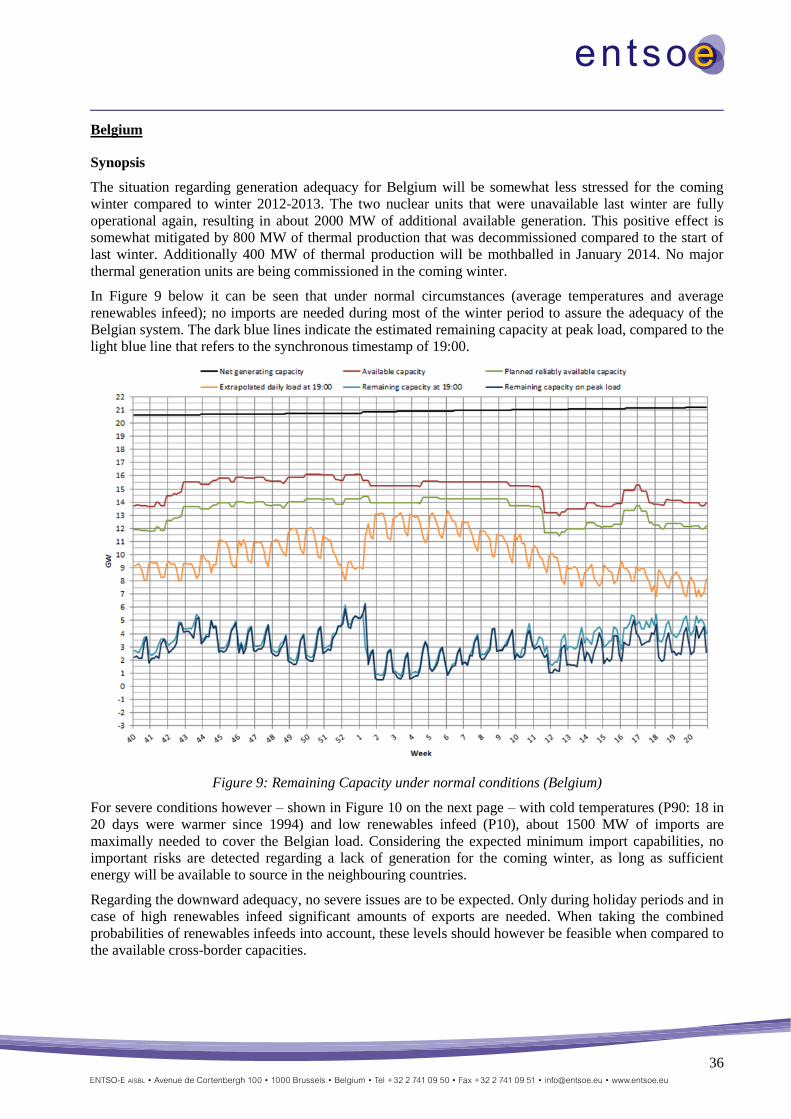
In Figure 9 below it can be seen that under normal circumstances (average temperatures and average
renewables infeed); no imports are needed during most of the winter period to assure the adequacy of the
Belgian system. The dark blue lines indicate the estimated remaining capacity at peak load, compared to the
light blue line that refers to the synchronous timestamp of 19:00.
Figure 9: Remaining Capacity under normal conditions (Belgium)
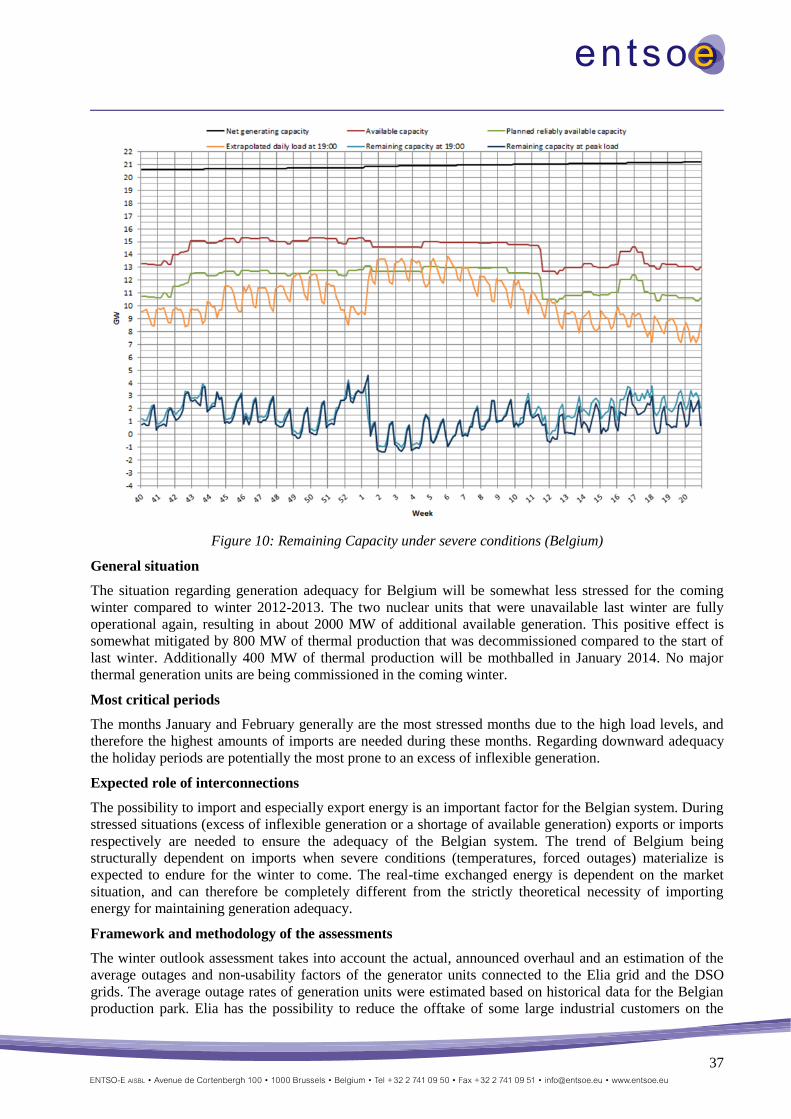
For severe conditions however – shown in Figure 10 on the next page – with cold temperatures (P90: 18 in
20 days were warmer since 1994) and low renewables infeed (P10), about 1500 MW of imports are
maximally needed to cover the Belgian load. Considering the expected minimum import capabilities, no
important risks are detected regarding a lack of generation for the coming winter, as long as sufficient
energy will be available to source in the neighbouring countries.
Regarding the downward adequacy, no severe issues are to be expected. Only during holiday periods and in
case of high renewables infeed significant amounts of exports are needed. When taking the combined
probabilities of renewables infeeds into account, these levels should however be feasible when compared to
the available cross-border capacities.
37
Figure 10: Remaining Capacity under severe conditions (Belgium)
General situation
The situation regarding generation adequacy for Belgium will be somewhat less stressed for the coming
winter compared to winter 2012-2013. The two nuclear units that were unavailable last winter are fully
operational again, resulting in about 2000 MW of additional available generation. This positive effect is
somewhat mitigated by 800 MW of thermal production that was decommissioned compared to the start of
last winter. Additionally 400 MW of thermal production will be mothballed in January 2014. No major
thermal generation units are being commissioned in the coming winter.
Most critical periods
The months January and February generally are the most stressed months due to the high load levels, and
therefore the highest amounts of imports are needed during these months. Regarding downward adequacy
the holiday periods are potentially the most prone to an excess of inflexible generation.
Expected role of interconnections
The possibility to import and especially export energy is an important factor for the Belgian system. During
stressed situations (excess of inflexible generation or a shortage of available generation) exports or imports
respectively are needed to ensure the adequacy of the Belgian system. The trend of Belgium being
structurally dependent on imports when severe conditions (temperatures, forced outages) materialize is
expected to endure for the winter to come. The real-time exchanged energy is dependent on the market
situation, and can therefore be completely different from the strictly theoretical necessity of importing
energy for maintaining generation adequacy.
Framework and methodology of the assessments
The winter outlook assessment takes into account the actual, announced overhaul and an estimation of the
average outages and non-usability factors of the generator units connected to the Elia grid and the DSO
grids. The average outage rates of generation units were estimated based on historical data for the Belgian
production park. Elia has the possibility to reduce the offtake of some large industrial customers on the

38
basis of interruptible load contracts, but as these are part of the tertiary reserves, they are not used as a
preventive measure to ensure system adequacy in the quantitative analysis.
Regarding the forecast load, a structural increase of 0.61 % between 2012 and 2013 is assumed. Between
2013 and 2014 this increase lowers to 0.51 %.
0,0 GW
5,0 GW
10,0 GW
15,0 GW
20,0 GW
25,0 GW
49 50 51 52 1 2 3 4 5 6 7 8 9 10 11 12 13 14 15 16
Demand and generation availability: Belgium
Net load at reference point in severe conditions Net load at reference point under normal conditions
Reliable available capacity under normal conditions Reliable available capacity in severe conditions
Net generation capacity
-4,0 GW
-2,0 GW
0,0 GW
2,0 GW
4,0 GW
6,0 GW
8,0 GW
49 50 51 52 1 2 3 4 5 6 7 8 9 10 11 12 13 14 15 16
Remaining Capacity: Belgium
Simultaneous Exportable capacity Simultaneous Importable capacity
Remaining capacity under normal conditions Remaining capacity under severe conditions
Remaining capacity including import/export contracts normal conditions Remaining capacity including import/export contracts severe conditions
-60,0%
-40,0%
-20,0%
0,0%
20,0%
40,0%
60,0%
49 50 51 52 1 2 3 4 5 6 7 8 9 10 11 12 13 14 15 16
Relative indicators: Belgium
Export capacity VS Load at reference point severe Import capacity VS Peak at reference point severe
Remaining capacity VS Load at reference point severe
-4,0 GW
-3,0 GW
-2,0 GW
-1,0 GW
0,0 GW
1,0 GW
2,0 GW
3,0 GW
4,0 GW
49 50 51 52 1 2 3 4 5 6 7 8 9 10 11 12 13 14 15 16
Export requirements due to incompressibility of generation: Belgium
Simultaneous Exportable capacity Simultaneous Importable capacity Downward regulation at 5am Downward regulation at 11am
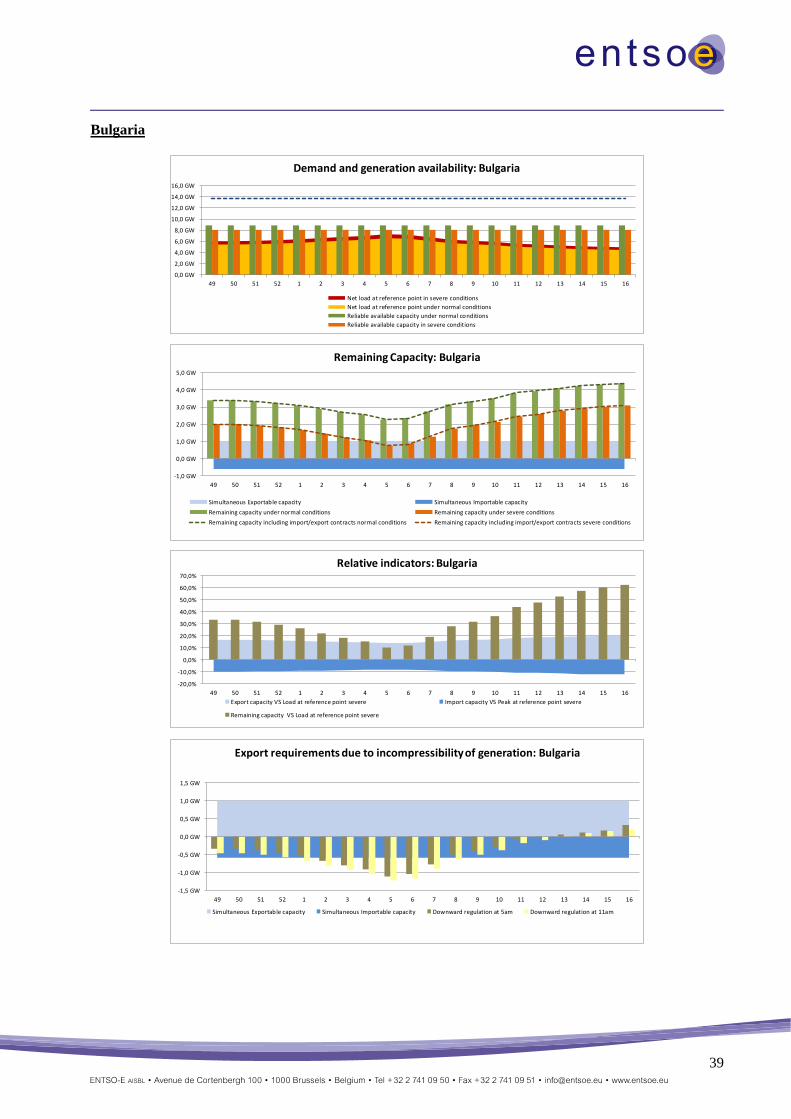
39
Bulgaria
0,0 GW
2,0 GW
4,0 GW
6,0 GW
8,0 GW
10,0 GW
12,0 GW
14,0 GW
16,0 GW
49 50 51 52 1 2 3 4 5 6 7 8 9 10 11 12 13 14 15 16
Demand and generation availability: Bulgaria
Net load at reference point in severe conditions
Net load at reference point under normal conditions
Reliable available capacity under normal conditions
Reliable available capacity in severe conditions
-1,0 GW
0,0 GW
1,0 GW
2,0 GW
3,0 GW
4,0 GW
5,0 GW
49 50 51 52 1 2 3 4 5 6 7 8 9 10 11 12 13 14 15 16
Remaining Capacity: Bulgaria
Simultaneous Exportable capacity Simultaneous Importable capacity
Remaining capacity under normal conditions Remaining capacity under severe conditions
Remaining capacity including import/export contracts normal conditions Remaining capacity including import/export contracts severe conditions
-20,0%
-10,0%
0,0%
10,0%
20,0%
30,0%
40,0%
50,0%
60,0%
70,0%
49 50 51 52 1 2 3 4 5 6 7 8 9 10 11 12 13 14 15 16
Relative indicators: Bulgaria
Export capacity VS Load at reference point severe Import capacity VS Peak at reference point severe
Remaining capacity VS Load at reference point severe
-1,5 GW
-1,0 GW
-0,5 GW
0,0 GW
0,5 GW
1,0 GW
1,5 GW
49 50 51 52 1 2 3 4 5 6 7 8 9 10 11 12 13 14 15 16
Export requirements due to incompressibility of generation: Bulgaria
Simultaneous Exportable capacity Simultaneous Importable capacity Downward regulation at 5am Downward regulation at 11am

40
Croatia
0,0 GW
0,5 GW
1,0 GW
1,5 GW
2,0 GW
2,5 GW
3,0 GW
3,5 GW
4,0 GW
4,5 GW
49 50 51 52 1 2 3 4 5 6 7 8 9 10 11 12 13 14 15 16
Demand and generation availability: Croatia
Net load at reference point in severe conditions Net load at reference point under normal conditions
Reliable available capacity under normal conditions Reliable available capacity in severe conditions
Net generation capacity
-3,0 GW
-2,0 GW
-1,0 GW
0,0 GW
1,0 GW
2,0 GW
3,0 GW
49 50 51 52 1 2 3 4 5 6 7 8 9 10 11 12 13 14 15 16
Remaining Capacity: Croatia
Simultaneous Exportable capacity Simultaneous Importable capacity
Remaining capacity under normal conditions Remaining capacity under severe conditions
Remaining capacity including import/export contracts normal conditions Remaining capacity including import/export contracts severe conditions
-120,0%
-100,0%
-80,0%
-60,0%
-40,0%
-20,0%
0,0%
20,0%
40,0%
60,0%
80,0%
100,0%
49 50 51 52 1 2 3 4 5 6 7 8 9 10 11 12 13 14 15 16
Relative indicators: Croatia
Export capacity VS Load at reference point severe Import capacity VS Peak at reference point severe
Remaining capacity VS Load at reference point severe
-3,0 GW
-2,5 GW
-2,0 GW
-1,5 GW
-1,0 GW
-0,5 GW
0,0 GW
0,5 GW
1,0 GW
1,5 GW
2,0 GW
2,5 GW
49 50 51 52 1 2 3 4 5 6 7 8 9 10 11 12 13 14 15 16
Export requirements due to incompressibility of generation: Croatia
Simultaneous Exportable capacity Simultaneous Importable capacity Downward regulation at 5am Downward regulation at 11am
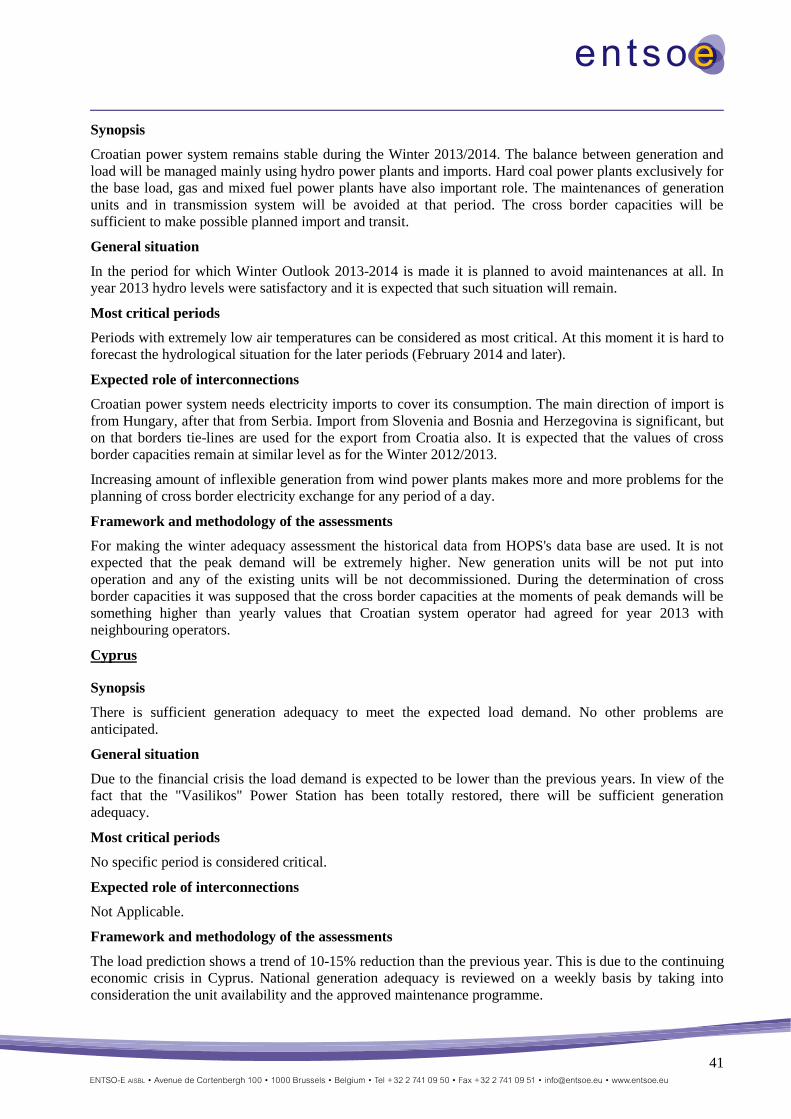
41
Synopsis
Croatian power system remains stable during the Winter 2013/2014. The balance between generation and
load will be managed mainly using hydro power plants and imports. Hard coal power plants exclusively for
the base load, gas and mixed fuel power plants have also important role. The maintenances of generation
units and in transmission system will be avoided at that period. The cross border capacities will be
sufficient to make possible planned import and transit.
General situation
In the period for which Winter Outlook 2013-2014 is made it is planned to avoid maintenances at all. In
year 2013 hydro levels were satisfactory and it is expected that such situation will remain.
Most critical periods
Periods with extremely low air temperatures can be considered as most critical. At this moment it is hard to
forecast the hydrological situation for the later periods (February 2014 and later).
Expected role of interconnections
Croatian power system needs electricity imports to cover its consumption. The main direction of import is
from Hungary, after that from Serbia. Import from Slovenia and Bosnia and Herzegovina is significant, but
on that borders tie-lines are used for the export from Croatia also. It is expected that the values of cross
border capacities remain at similar level as for the Winter 2012/2013.
Increasing amount of inflexible generation from wind power plants makes more and more problems for the
planning of cross border electricity exchange for any period of a day.
Framework and methodology of the assessments
For making the winter adequacy assessment the historical data from HOPS's data base are used. It is not
expected that the peak demand will be extremely higher. New generation units will be not put into
operation and any of the existing units will be not decommissioned. During the determination of cross
border capacities it was supposed that the cross border capacities at the moments of peak demands will be
something higher than yearly values that Croatian system operator had agreed for year 2013 with
neighbouring operators.
Cyprus
Synopsis
There is sufficient generation adequacy to meet the expected load demand. No other problems are
anticipated.
General situation
Due to the financial crisis the load demand is expected to be lower than the previous years. In view of the
fact that the "Vasilikos" Power Station has been totally restored, there will be sufficient generation
adequacy.
Most critical periods
No specific period is considered critical.
Expected role of interconnections
Not Applicable.
Framework and methodology of the assessments
The load prediction shows a trend of 10-15% reduction than the previous year. This is due to the continuing
economic crisis in Cyprus. National generation adequacy is reviewed on a weekly basis by taking into
consideration the unit availability and the approved maintenance programme.
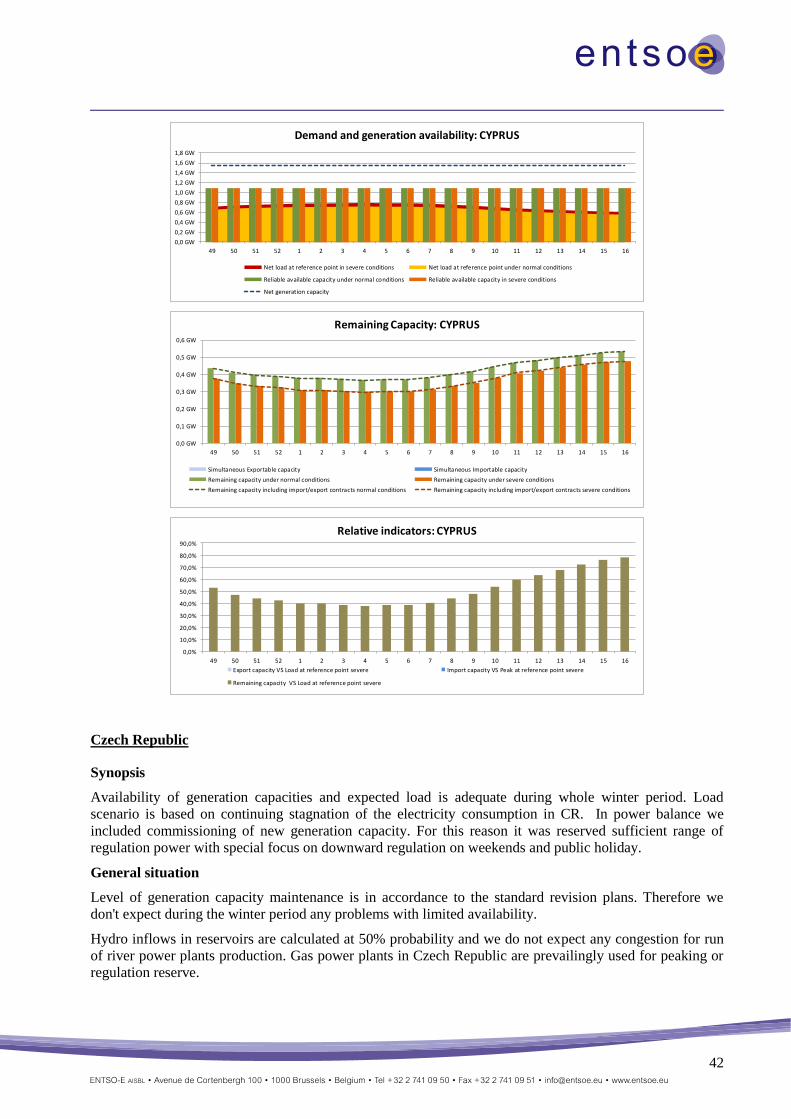
42
Czech Republic
Synopsis
Availability of generation capacities and expected load is adequate during whole winter period. Load
scenario is based on continuing stagnation of the electricity consumption in CR. In power balance we
included commissioning of new generation capacity. For this reason it was reserved sufficient range of
regulation power with special focus on downward regulation on weekends and public holiday.
General situation
Level of generation capacity maintenance is in accordance to the standard revision plans. Therefore we
don't expect during the winter period any problems with limited availability.
Hydro inflows in reservoirs are calculated at 50% probability and we do not expect any congestion for run
of river power plants production. Gas power plants in Czech Republic are prevailingly used for peaking or
regulation reserve.
0,0 GW
0,2 GW
0,4 GW
0,6 GW
0,8 GW
1,0 GW
1,2 GW
1,4 GW
1,6 GW
1,8 GW
49 50 51 52 1 2 3 4 5 6 7 8 9 10 11 12 13 14 15 16
Demand and generation availability: CYPRUS
Net load at reference point in severe conditions Net load at reference point under normal conditions
Reliable available capacity under normal conditions Reliable available capacity in severe conditions
Net generation capacity
0,0 GW
0,1 GW
0,2 GW
0,3 GW
0,4 GW
0,5 GW
0,6 GW
49 50 51 52 1 2 3 4 5 6 7 8 9 10 11 12 13 14 15 16
Remaining Capacity: CYPRUS
Simultaneous Exportable capacity Simultaneous Importable capacity
Remaining capacity under normal conditions Remaining capacity under severe conditions
Remaining capacity including import/export contracts normal conditions Remaining capacity including import/export contracts severe conditions
0,0%
10,0%
20,0%
30,0%
40,0%
50,0%
60,0%
70,0%
80,0%
90,0%
49 50 51 52 1 2 3 4 5 6 7 8 9 10 11 12 13 14 15 16
Relative indicators: CYPRUS
Export capacity VS Load at reference point severe Import capacity VS Peak at reference point severe
Remaining capacity VS Load at reference point severe
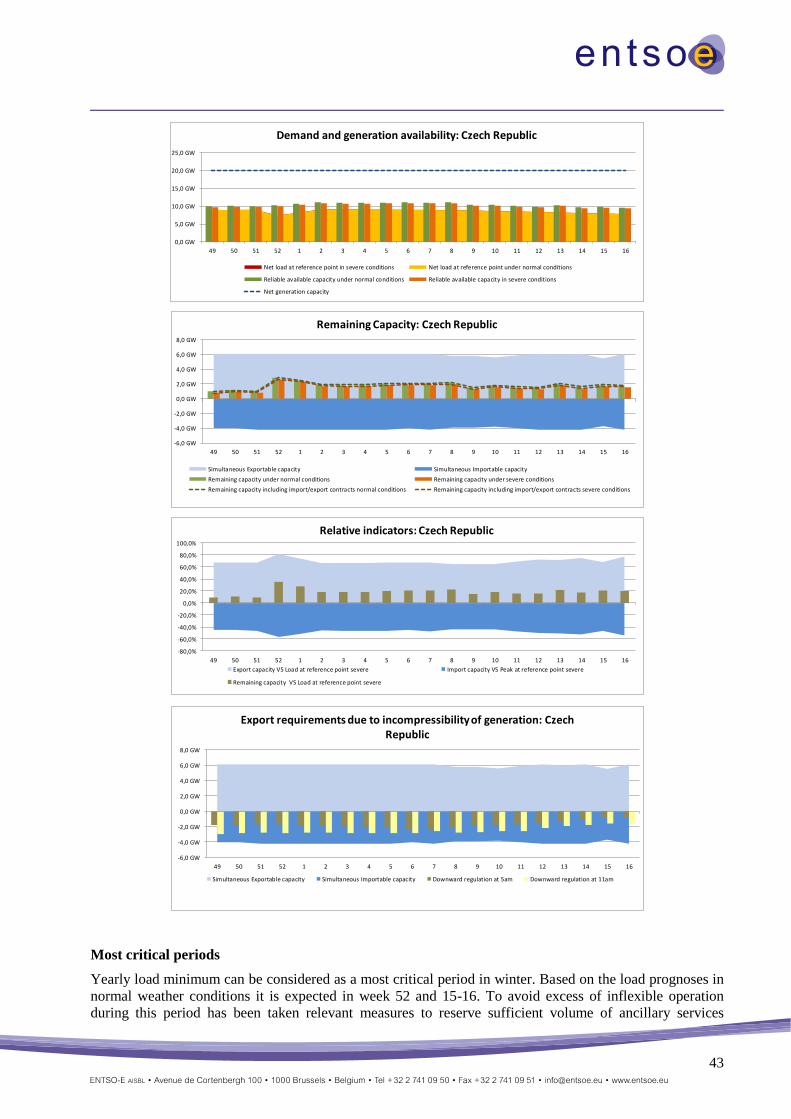
43
Most critical periods
Yearly load minimum can be considered as a most critical period in winter. Based on the load prognoses in
normal weather conditions it is expected in week 52 and 15-16. To avoid excess of inflexible operation
during this period has been taken relevant measures to reserve sufficient volume of ancillary services
0,0 GW
5,0 GW
10,0 GW
15,0 GW
20,0 GW
25,0 GW
49 50 51 52 1 2 3 4 5 6 7 8 9 10 11 12 13 14 15 16
Demand and generation availability: Czech Republic
Net load at reference point in severe conditions Net load at reference point under normal conditions
Reliable available capacity under normal conditions Reliable available capacity in severe conditions
Net generation capacity
-6,0 GW
-4,0 GW
-2,0 GW
0,0 GW
2,0 GW
4,0 GW
6,0 GW
8,0 GW
49 50 51 52 1 2 3 4 5 6 7 8 9 10 11 12 13 14 15 16
Remaining Capacity: Czech Republic
Simultaneous Exportable capacity Simultaneous Importable capacity
Remaining capacity under normal conditions Remaining capacity under severe conditions
Remaining capacity including import/export contracts normal conditions Remaining capacity including import/export contracts severe conditions
-80,0%
-60,0%
-40,0%
-20,0%
0,0%
20,0%
40,0%
60,0%
80,0%
100,0%
49 50 51 52 1 2 3 4 5 6 7 8 9 10 11 12 13 14 15 16
Relative indicators: Czech Republic
Export capacity VS Load at reference point severe Import capacity VS Peak at reference point severe
Remaining capacity VS Load at reference point severe
-6,0 GW
-4,0 GW
-2,0 GW
0,0 GW
2,0 GW
4,0 GW
6,0 GW
8,0 GW
49 50 51 52 1 2 3 4 5 6 7 8 9 10 11 12 13 14 15 16
Export requirements due to incompressibility of generation: Czech Republic
Simultaneous Exportable capacity Simultaneous Importable capacity Downward regulation at 5am Downward regulation at 11am
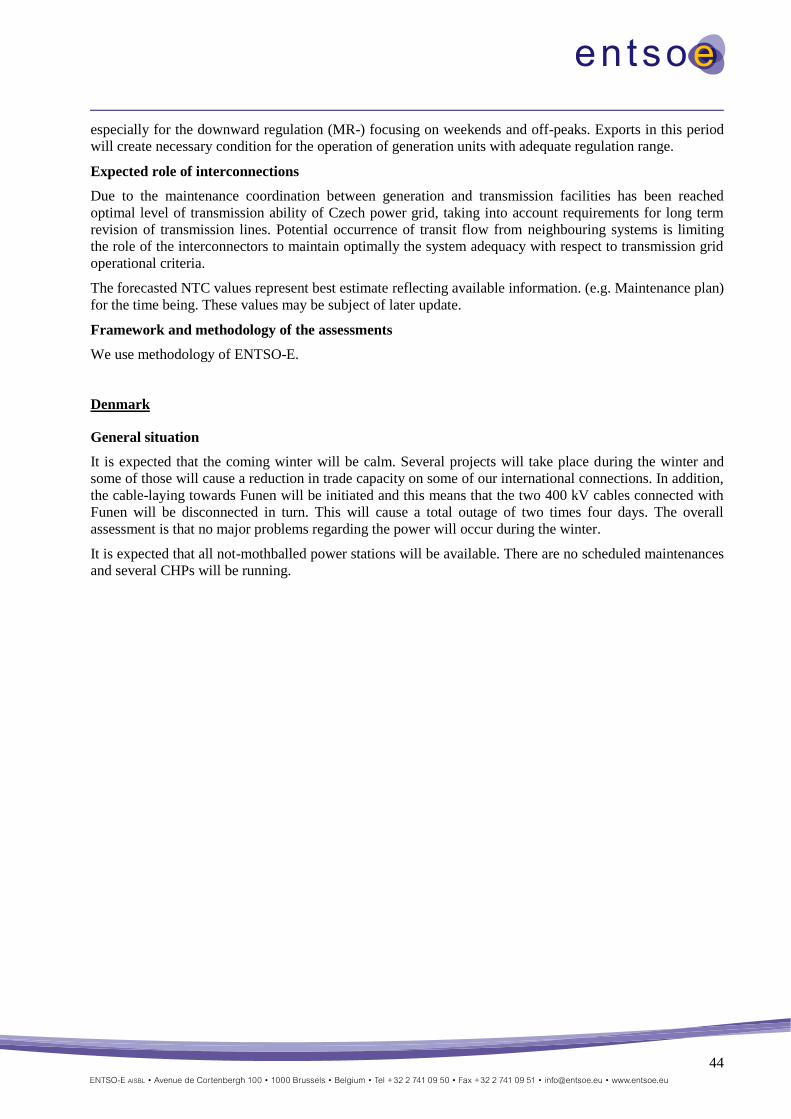
44
especially for the downward regulation (MR-) focusing on weekends and off-peaks. Exports in this period
will create necessary condition for the operation of generation units with adequate regulation range.
Expected role of interconnections
Due to the maintenance coordination between generation and transmission facilities has been reached
optimal level of transmission ability of Czech power grid, taking into account requirements for long term
revision of transmission lines. Potential occurrence of transit flow from neighbouring systems is limiting
the role of the interconnectors to maintain optimally the system adequacy with respect to transmission grid
operational criteria.
The forecasted NTC values represent best estimate reflecting available information. (e.g. Maintenance plan)
for the time being. These values may be subject of later update.
Framework and methodology of the assessments
We use methodology of ENTSO-E.
Denmark
General situation
It is expected that the coming winter will be calm. Several projects will take place during the winter and
some of those will cause a reduction in trade capacity on some of our international connections. In addition,
the cable-laying towards Funen will be initiated and this means that the two 400 kV cables connected with
Funen will be disconnected in turn. This will cause a total outage of two times four days. The overall
assessment is that no major problems regarding the power will occur during the winter.
It is expected that all not-mothballed power stations will be available. There are no scheduled maintenances
and several CHPs will be running.
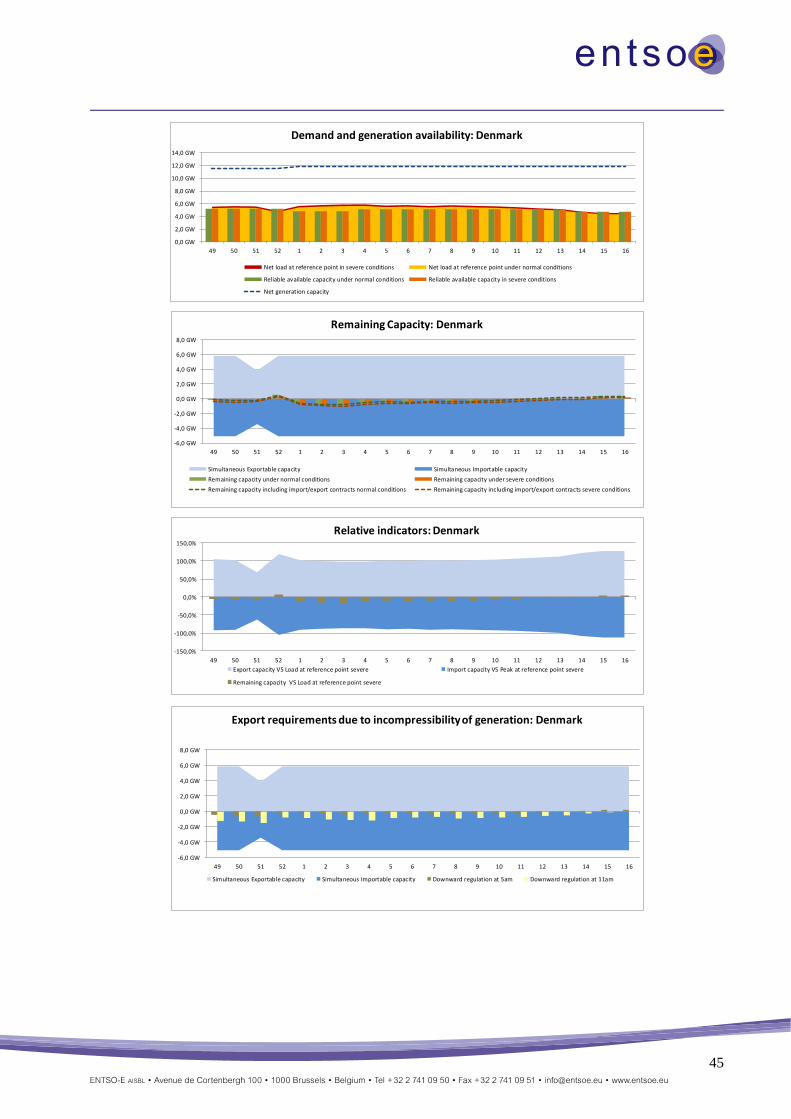
45
0,0 GW
2,0 GW
4,0 GW
6,0 GW
8,0 GW
10,0 GW
12,0 GW
14,0 GW
49 50 51 52 1 2 3 4 5 6 7 8 9 10 11 12 13 14 15 16
Demand and generation availability: Denmark
Net load at reference point in severe conditions Net load at reference point under normal conditions
Reliable available capacity under normal conditions Reliable available capacity in severe conditions
Net generation capacity
-6,0 GW
-4,0 GW
-2,0 GW
0,0 GW
2,0 GW
4,0 GW
6,0 GW
8,0 GW
49 50 51 52 1 2 3 4 5 6 7 8 9 10 11 12 13 14 15 16
Remaining Capacity: Denmark
Simultaneous Exportable capacity Simultaneous Importable capacity
Remaining capacity under normal conditions Remaining capacity under severe conditions
Remaining capacity including import/export contracts normal conditions Remaining capacity including import/export contracts severe conditions
-150,0%
-100,0%
-50,0%
0,0%
50,0%
100,0%
150,0%
49 50 51 52 1 2 3 4 5 6 7 8 9 10 11 12 13 14 15 16
Relative indicators: Denmark
Export capacity VS Load at reference point severe Import capacity VS Peak at reference point severe
Remaining capacity VS Load at reference point severe
-6,0 GW
-4,0 GW
-2,0 GW
0,0 GW
2,0 GW
4,0 GW
6,0 GW
8,0 GW
49 50 51 52 1 2 3 4 5 6 7 8 9 10 11 12 13 14 15 16
Export requirements due to incompressibility of generation: Denmark
Simultaneous Exportable capacity Simultaneous Importable capacity Downward regulation at 5am Downward regulation at 11am
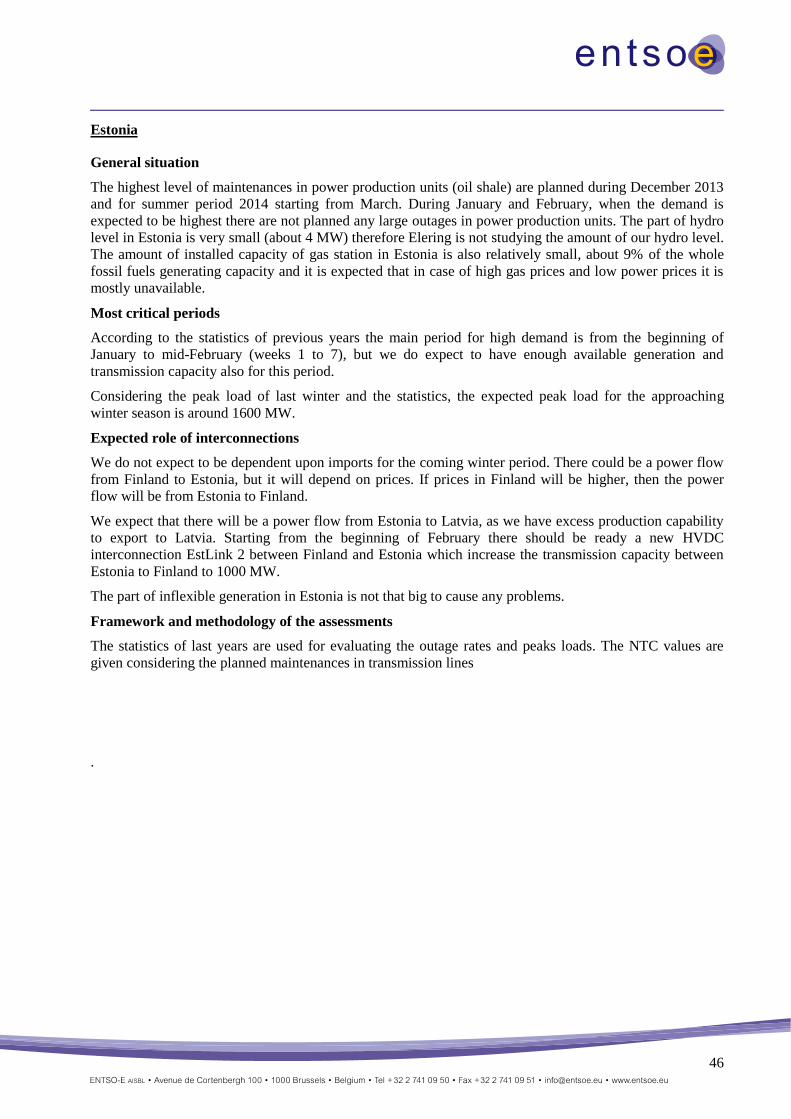
46
Estonia
General situation
The highest level of maintenances in power production units (oil shale) are planned during December 2013
and for summer period 2014 starting from March. During January and February, when the demand is
expected to be highest there are not planned any large outages in power production units. The part of hydro
level in Estonia is very small (about 4 MW) therefore Elering is not studying the amount of our hydro level.
The amount of installed capacity of gas station in Estonia is also relatively small, about 9% of the whole
fossil fuels generating capacity and it is expected that in case of high gas prices and low power prices it is
mostly unavailable.
Most critical periods
According to the statistics of previous years the main period for high demand is from the beginning of
January to mid-February (weeks 1 to 7), but we do expect to have enough available generation and
transmission capacity also for this period.
Considering the peak load of last winter and the statistics, the expected peak load for the approaching
winter season is around 1600 MW.
Expected role of interconnections
We do not expect to be dependent upon imports for the coming winter period. There could be a power flow
from Finland to Estonia, but it will depend on prices. If prices in Finland will be higher, then the power
flow will be from Estonia to Finland.
We expect that there will be a power flow from Estonia to Latvia, as we have excess production capability
to export to Latvia. Starting from the beginning of February there should be ready a new HVDC
interconnection EstLink 2 between Finland and Estonia which increase the transmission capacity between
Estonia to Finland to 1000 MW.
The part of inflexible generation in Estonia is not that big to cause any problems.
Framework and methodology of the assessments
The statistics of last years are used for evaluating the outage rates and peaks loads. The NTC values are
given considering the planned maintenances in transmission lines
.
47
0,0 GW
0,5 GW
1,0 GW
1,5 GW
2,0 GW
2,5 GW
3,0 GW
49 50 51 52 1 2 3 4 5 6 7 8 9 10 11 12 13 14 15 16
Demand and generation availability: Estonia
Net load at reference point in severe conditions Net load at reference point under normal conditions
Reliable available capacity under normal conditions Reliable available capacity in severe conditions
Net generation capacity
-2,0 GW
-1,5 GW
-1,0 GW
-0,5 GW
0,0 GW
0,5 GW
1,0 GW
1,5 GW
2,0 GW
49 50 51 52 1 2 3 4 5 6 7 8 9 10 11 12 13 14 15 16
Remaining Capacity: Estonia
Simultaneous Exportable capacity Simultaneous Importable capacity
Remaining capacity under normal conditions Remaining capacity under severe conditions
Remaining capacity including import/export contracts normal conditions Remaining capacity including import/export contracts severe conditions
-150,0%
-100,0%
-50,0%
0,0%
50,0%
100,0%
150,0%
49 50 51 52 1 2 3 4 5 6 7 8 9 10 11 12 13 14 15 16
Relative indicators: Estonia
Export capacity VS Load at reference point severe Import capacity VS Peak at reference point severe
Remaining capacity VS Load at reference point severe
-2,0 GW
-1,5 GW
-1,0 GW
-0,5 GW
0,0 GW
0,5 GW
1,0 GW
1,5 GW
2,0 GW
49 50 51 52 1 2 3 4 5 6 7 8 9 10 11 12 13 14 15 16
Export requirements due to incompressibility of generation: Estonia
Simultaneous Exportable capacity Simultaneous Importable capacity Downward regulation at 5am Downward regulation at 11am
48
Finland
Synopsis
General
As in the previous winters, Finland is a deficit area in peak demand hours. The deficit is expected to be met
with import from neighbouring areas.
Available capacity
The significant changes in Finnish net generation capacity compared to previous winter's capacity are:
‒ Peak load reserve capacity decreases. Finland maintains nationally peak load reserve which is available
from the beginning of December till the end of February. Peak load reserve capacity for winter 2013 is
determined to be 365 MW which is 235 MW less than in previous winters. This capacity is reserved to
be activated in case balance is not achieved between electricity bids and offers on the day-ahead
market.
‒ The number of mothballed units increases in the coming winter. In a coal-fired power plant Inkoo,
only one unit instead of three will be available in the coming winter and whole plant will be
mothballed from Mid-February.
Non-usable generation capacity is estimated on the basis of TSO's own experience and statistics available.
It includes estimated reductions because of very different reasons; outages, the electrical output of
CHP plants is reduced in cold conditions as more heat is needed, etc. No yearly overhauls are carried out in
the winter months.
For thermal power plants and hydro power, the availability is assumed to be same in both normal and
severe conditions. In nuclear power plant's case, high availability is expected as in previous winters. Wind
power availability percentage in normal conditions, about 20 %, is based on recorded average output during
top 10 demand hours in Sweden and Finland in 2009 - 2011. 6 % availability in severe conditions is based
on Nordic researches.
Transmission capacity in HVDC links between Sweden and Finland is reduced compared to nominal
capacity due to investigation of the failure in the Fenno-Skan 1 cable. The total transmission capacity will
increase 650 MW at the beginning of February 2014 as consequence of the commissioning of second
HVDC link to Estonia, EstLink 2.
Peak load situations
In the coming winter, possible peak load is estimated to be at the same level as in the previous years. Peak
load in normal conditions represents average weekly maximum load from 2008 - 2012. Peak load in severe
conditions represents possible maximum load in once in 10 year winter conditions. Load reduction due the
simultaneously increasing electricity price is assumed to be 500 MW when demand exceeds 15 GW and
300 MW when it exceeds 14.5 GW.
The most critical period is the peak load period which is typically in Finland from week one to nine. In the
coming winter, week 8 can turn out to be especially critical if temperatures are low and in case of multiple
generation unit failure or fault in remarkable transmission lines.
Import is needed to cover the demand in peak hours. The maximum deficit in severe conditions is 2.5 GW
in week 8. The interconnection capacity is sufficient to meet the deficit.
Required amount of import is expected to be available from neighbouring areas also in severe weather
conditions. However, it should be noted that there are uncertainties with Russian import due to capacity
tariff on the Russian electricity markets.
Minimum load situations
Must run generation in Finland is assumed to include nuclear power generation in total and hydro and CHP
generation to some extent.
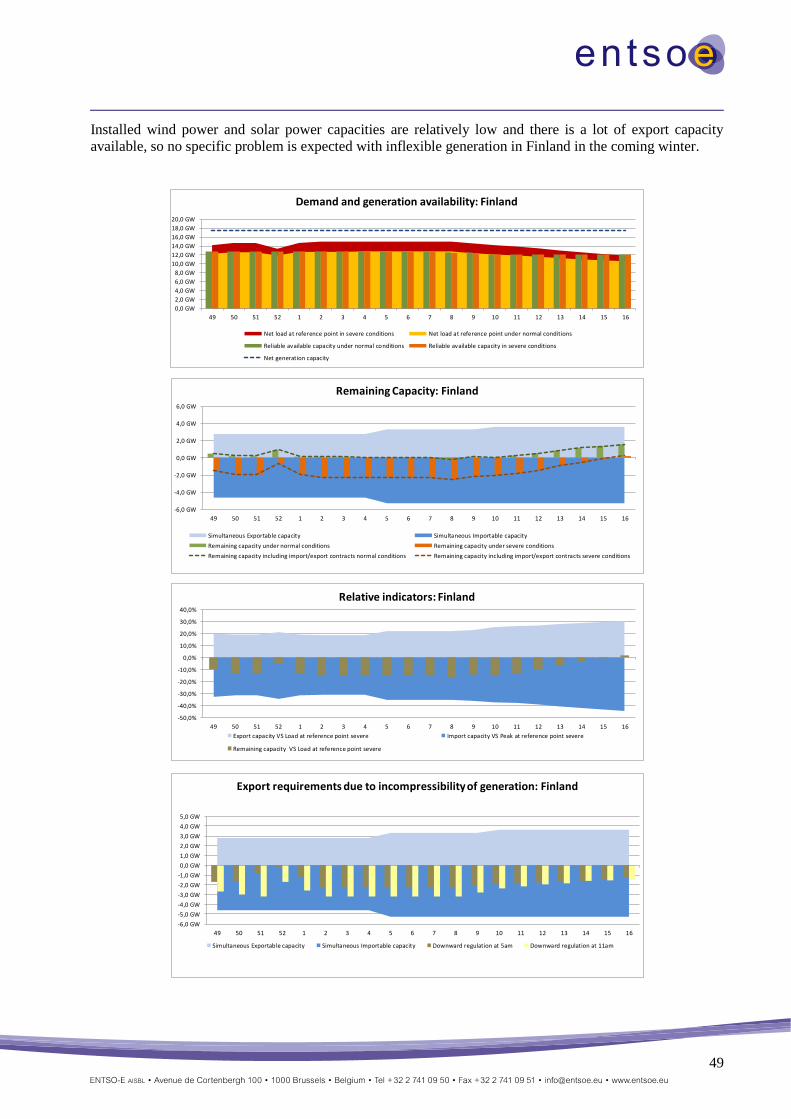
49
Installed wind power and solar power capacities are relatively low and there is a lot of export capacity
available, so no specific problem is expected with inflexible generation in Finland in the coming winter.
0,0 GW
2,0 GW
4,0 GW
6,0 GW
8,0 GW
10,0 GW
12,0 GW
14,0 GW
16,0 GW
18,0 GW
20,0 GW
49 50 51 52 1 2 3 4 5 6 7 8 9 10 11 12 13 14 15 16
Demand and generation availability: Finland
Net load at reference point in severe conditions Net load at reference point under normal conditions
Reliable available capacity under normal conditions Reliable available capacity in severe conditions
Net generation capacity
-6,0 GW
-4,0 GW
-2,0 GW
0,0 GW
2,0 GW
4,0 GW
6,0 GW
49 50 51 52 1 2 3 4 5 6 7 8 9 10 11 12 13 14 15 16
Remaining Capacity: Finland
Simultaneous Exportable capacity Simultaneous Importable capacity
Remaining capacity under normal conditions Remaining capacity under severe conditions
Remaining capacity including import/export contracts normal conditions Remaining capacity including import/export contracts severe conditions
-50,0%
-40,0%
-30,0%
-20,0%
-10,0%
0,0%
10,0%
20,0%
30,0%
40,0%
49 50 51 52 1 2 3 4 5 6 7 8 9 10 11 12 13 14 15 16
Relative indicators: Finland
Export capacity VS Load at reference point severe Import capacity VS Peak at reference point severe
Remaining capacity VS Load at reference point severe
-6,0 GW
-5,0 GW
-4,0 GW
-3,0 GW
-2,0 GW
-1,0 GW
0,0 GW
1,0 GW
2,0 GW
3,0 GW
4,0 GW
5,0 GW
49 50 51 52 1 2 3 4 5 6 7 8 9 10 11 12 13 14 15 16
Export requirements due to incompressibility of generation: Finland
Simultaneous Exportable capacity Simultaneous Importable capacity Downward regulation at 5am Downward regulation at 11am
50
Framework and methodology of the assessments
Finland's data does not include Åland Islands, which have a peak load of about 70 MW. Commissioning
dates of new interconnection lines are according to currently available market information.
France
Synopsis
Under normal meteorological conditions, the forecast outlook for the electricity supply-demand balance in
continental France shows no particular risk for the entire winter 2013 - 2014 period.
For the coming winter, the main risk factors are the sensitivity of the load to low temperatures and
unplanned outages of generating units.
The generation – load balance on the French system should be maintained for the coming winter. The risk
related to security of supply is mainly low, with a few periods (from mid-January to the beginning of
February) with moderate risks.
Demand:
The weekly peak load is calculated for normal and severe conditions.
The net weekly peak load takes into account load restrictions corresponding to the statistical value of load
reduction available for customers with special contracts. It does not account for customers’ offers on the
Balancing Mechanism.
Demand under normal conditions:
1. Demand forecast takes into account consumption trends (especially uranium enrichment in the energy
sector), assuming temperatures are in line with seasonal norms.
2. Maximum demand forecast is estimated around 85 GW (unrestricted)
Demand under severe conditions:
1. A decrease in temperature of 1°C causes demand to rise by approximately 2 300 MW
2. Maximum demand forecast is estimated around 105 GW (unrestricted)
Generation:
Overhauls are consistent with the last schedule given by the Generators to RTE (beginning of September).
A sensitivity analysis can be carried out if needed.
Generation under normal and severe conditions:
1. The installed generating capacity has increased thanks to more gas power stations and more wind power
plants.
2. The overall availability of generating facilities is expected to be higher until the end of December in
comparison with last winter.
3. No reduction of generation in severe conditions.
RTE does not take into account solar generation for winter studies (peak load during winter occurred
around 7p.m).
Wind generation is estimated:
1. thanks to average generation observed during last winters
2. taking into account new wind generation units
Hydro level and inflows are supposed at their historical average value.
51
Outages capacity is calculated for each week considering the unavailability rates of thermal units.
Generation – Demand balance
The generation – load balance on the French system should be maintained for the coming winter. The risk
of an interruption in supply is moderate.
Under severe conditions some imports up to 4 000MW could be needed in mid-January.
General situation
The overall level of generation is higher than last year, about 1800 MW more during the entire study
period, in spite of a lower hydro generation until the end of 2013 and especially the loss of approximately
1400 MW of fossil fuel generating capacity (closure of coal plants : 1000 MW, mothballed : 400 MW).
Most critical periods
One one hand, under normal conditions, the weeks 2 and 3 should be the most constrained even if the
balance of exchange is exporting.
On the other hand, in severe conditions from week 2 to 6, the balance of exchange is importing up to 4000
MW.
Expected role of interconnections
We don't identify any risk of security of supply. As a consequence, the role of interconnector is to optimize
the generation.
We don't identify any risk of managing excess of inflexible generation.
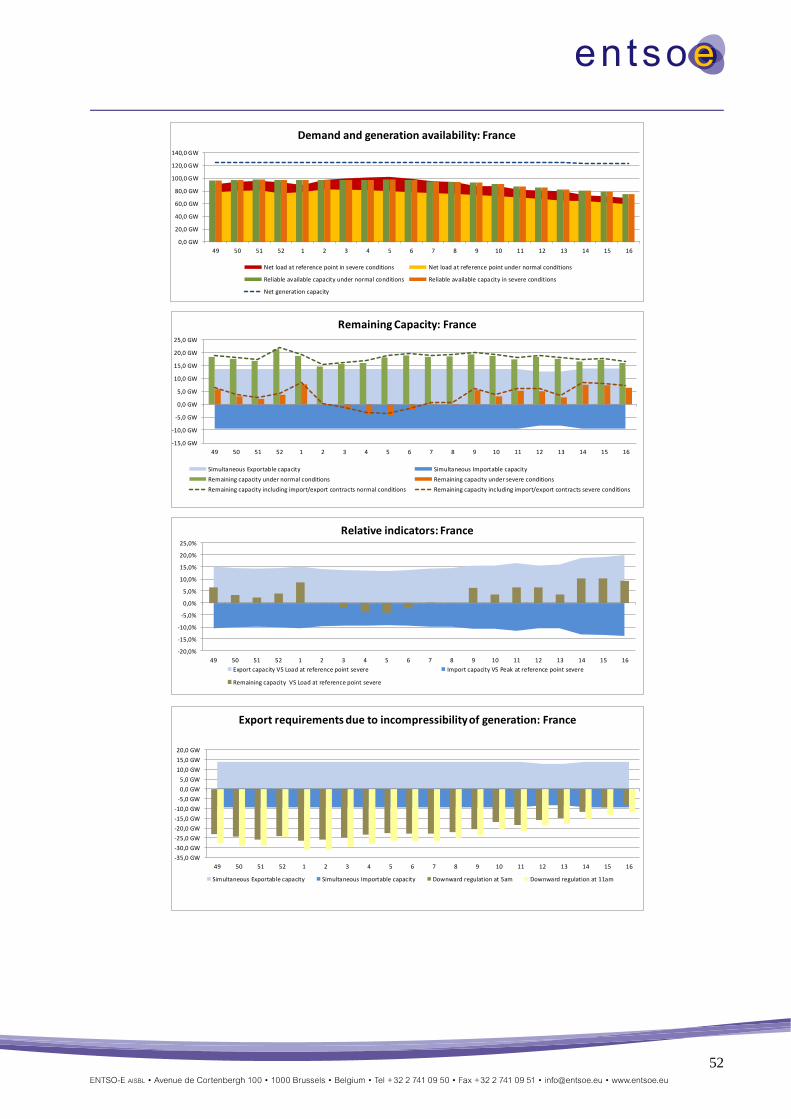
52
0,0 GW
20,0 GW
40,0 GW
60,0 GW
80,0 GW
100,0 GW
120,0 GW
140,0 GW
49 50 51 52 1 2 3 4 5 6 7 8 9 10 11 12 13 14 15 16
Demand and generation availability: France
Net load at reference point in severe conditions Net load at reference point under normal conditions
Reliable available capacity under normal conditions Reliable available capacity in severe conditions
Net generation capacity
-15,0 GW
-10,0 GW
-5,0 GW
0,0 GW
5,0 GW
10,0 GW
15,0 GW
20,0 GW
25,0 GW
49 50 51 52 1 2 3 4 5 6 7 8 9 10 11 12 13 14 15 16
Remaining Capacity: France
Simultaneous Exportable capacity Simultaneous Importable capacity
Remaining capacity under normal conditions Remaining capacity under severe conditions
Remaining capacity including import/export contracts normal conditions Remaining capacity including import/export contracts severe conditions
-20,0%
-15,0%
-10,0%
-5,0%
0,0%
5,0%
10,0%
15,0%
20,0%
25,0%
49 50 51 52 1 2 3 4 5 6 7 8 9 10 11 12 13 14 15 16
Relative indicators: France
Export capacity VS Load at reference point severe Import capacity VS Peak at reference point severe
Remaining capacity VS Load at reference point severe
-35,0 GW
-30,0 GW
-25,0 GW
-20,0 GW
-15,0 GW
-10,0 GW
-5,0 GW
0,0 GW
5,0 GW
10,0 GW
15,0 GW
20,0 GW
49 50 51 52 1 2 3 4 5 6 7 8 9 10 11 12 13 14 15 16
Export requirements due to incompressibility of generation: France
Simultaneous Exportable capacity Simultaneous Importable capacity Downward regulation at 5am Downward regulation at 11am
53
Great Britain
0,0 GW
10,0 GW
20,0 GW
30,0 GW
40,0 GW
50,0 GW
60,0 GW
70,0 GW
80,0 GW
49 50 51 52 1 2 3 4 5 6 7 8 9 10 11 12 13 14 15 16
Demand and generation availability: Great Britain
Net load at reference point in severe conditions
Net load at reference point under normal conditions
Reliable available capacity under normal conditions
Reliable available capacity in severe conditions
-6,0 GW
-4,0 GW
-2,0 GW
0,0 GW
2,0 GW
4,0 GW
6,0 GW
8,0 GW
10,0 GW
49 50 51 52 1 2 3 4 5 6 7 8 9 10 11 12 13 14 15 16
Remaining Capacity: Great Britain
Simultaneous Exportable capacity Simultaneous Importable capacity
Remaining capacity under normal conditions Remaining capacity under severe conditions
Remaining capacity including import/export contracts normal conditions Remaining capacity including import/export contracts severe conditions
-15,0%
-10,0%
-5,0%
0,0%
5,0%
10,0%
15,0%
20,0%
49 50 51 52 1 2 3 4 5 6 7 8 9 10 11 12 13 14 15 16
Relative indicators: Great Britain
Export capacity VS Load at reference point severe Import capacity VS Peak at reference point severe
Remaining capacity VS Load at reference point severe
-30,0 GW
-25,0 GW
-20,0 GW
-15,0 GW
-10,0 GW
-5,0 GW
0,0 GW
5,0 GW
10,0 GW
49 50 51 52 1 2 3 4 5 6 7 8 9 10 11 12 13 14 15 16
Export requirements due to incompressibility of generation: Great Britain
Simultaneous Exportable capacity Simultaneous Importable capacity Downward regulation at 5am Downward regulation at 11am
54
Synopsis
Weather corrected peak demand has been decreasing since 2005. This is thought to be due to the recession,
energy saving measures, a move away from heavy industry to less energy intensive industrial activity,
increasing volumes of small embedded generation and increased customer demand management. However,
generation capacity has also dropped in the last couple of years due to the closure of a number of coal and
oil plants as a result of the Large Combustion Plant Directive and the closure of uneconomic gas fired
power stations, although this has been partially offset by additional wind capacity and construction of new
gas fired power stations.
The overall effect on margins is that they have decreased compared to recent historic levels but they are still
expected to be comfortable based on normal temperatures and expected levels of generation availability.
Under severe weather conditions (1 in 20 cold temperatures), forecast demand including reserve would still
be met as long as there were no interconnector exports. The most critical period is in early December when
margins are expected to be 5% under average cold spell conditions.
General situation
There is a reduced amount of coal and oil plant on the system but an increase in wind generation and gas
fired plant. The net reduction in conventional plant is roughly matched by the fall in demand so overall the
supply demand balance remains adequate. As is typical, there are minimal planned outages over the peak
winter period and no plant will be commissioning. Gas storage levels are expected to be very high, if not
full, by the start of the winter and no problems with gas supplies are expected. Hydro plant is all run of
river in Great Britain so there are no issues with hydro levels.
Most critical periods
The most critical periods for meeting peak demands are early December and early January, either side of
the Christmas holiday period, when demands are expected to be at their peak. The level of available
capacity is expected to remain stable over the winter. There will not be any problems in managing
minimum demand periods as minimum demands are well above the levels of inflexible generation.
Expected role of interconnections
As shown by the graphs, over the mid-winter period, full interconnector exports may not be able to be
accommodated, especially under severe conditions.
Adequate margins are expected, reference graphs.
Framework and methodology of the assessments
1. The weekly peak load for severe conditions used is a 1 in 20 figure.
2. We expect about 2 GW of generation capacity to be sterilised in Scotland due to transmission constraints.
3. The level of pump storage pumping load that is expected to be on the system at the time of the weekly
overnight minimum demand has been used instead of pumping capacity as other factors limit the maximum
pumping that can be achieved.
4. The demand forecasts for Sunday mornings have already been depressed to allow for embedded solar
generation.
5. Must run plant for the weekly overnight minimums and the Sunday morning demands include plant
required to provide the positive reserve requirements.

55
Germany
Synopsis
After the first step of the nuclear phase-out in Germany in 2011 German TSOs are still facing a situation
characterized by the enduring regional lack of conventional generation, primarily in Southern Germany. At
the same time the commissioning of important conventional power plants in Germany is further delayed.
Learning from last winters, a situation with high load, low RES feed-in, high exports to support the
neighbouring countries and an additional gas shortage has to be considered.
Regarding the generation – load balance for Germany usually it is not assumed that there is a non-
availability for generation units that are dependent on fossil fuels due to a lack of primary energy sources.
The experience in Germany in February 2012 has shown that interruptible gas contracts can lead to an at
least partial non-availability of gas power plants and that such an event can occur in combination with high
load and low wind feed-in. Such an event can therefore have an impact on the generation – load balance.
On the other hand, most important gas power plants have now been equipped with new contracts due to
changes in the Energy Economy Law. Hereby gas transport problems should be eliminated. However, the
problem of missing volumes of gas may not necessarily be solved by this measure. Furthermore smaller gas
power plants connected to DSOs are not observable for TSOs in terms of their supply contracts. The
quantitative impact of a future gas shortage on the generation – load balance therefore is not predictable.
Therefore in the quantitative analysis for the coming winter, both in normal and severe conditions, the non-
usable capacity due to gas shortage is assumed as 0. However, in principle a gas shortage could occur and
then lead to a reduction of the remaining power.
RES are continued to be installed at a high speed. For southern Germany this attributes largely to
distributed PV generation. In the end of the year 2013 the installed capacity of PV generation in Germany is
expected to reach about 36.3 GW. That means an increase of about 5.1 GW in this year. The German
government has cut down the financial subsidies for photovoltaic power plants; nevertheless a notable
reduction of the fast increase of installed PV capacity is not expected soon as subsidies are planned to stop
at a level of 52 GW of a total installed capacity of PV. The installed capacity of wind power plants is
expected to increase by about 3.7 GW reaching 34.3 GW. However for the winter period with load
maximum in the evening PV generation does not contribute to the coverage of demand while wind feed-in
is not guaranteed.
In the winter period the German TSOs may be faced again with problems to meet (n-1)-security rules,
especially in situations with high wind feed-in in the North and high load in the South of Germany. In these
situations, an excess of transmission capacities of network elements in the important transmission axes
from North to South has to be expected. Being faced with these risks for security of supply the German
TSOs are again preparing a high amount of grid- and market-related measures e.g. redispatch with
increasing amount of power to be shifted between control areas.
To cover the anticipated very high redispatch demand as for the last winter, the German TSOs determined
the need of an additional reserve generation capacity of about 2.5 GW up to 4.5 GW under exceptional
contingencies for the winter 2013/2014. In order to contract these required reserves a new German
regulation allows preventing the switch-off of system-relevant units, which are instead transferred into a
TSO-controlled reserve. Currently and for the upcoming winter 1.2 GW of German generation capacity
have entered this status. They are still included in the data table. Additionally 0.8 GW of reserves have been
contracted in Austria for the coming winters. Further 0.5 GW is currently put out to tender.
A further benefit for generation adequacy is provided by the new regulations for contractual load
reductions. There is currently no experience for their contribution in winter times but as indicated in the
data table reductions of up to 0.8 GW are possible.
56
General situation
Regarding the generation–load balance for Germany usually it is not assumed that there is a non-
availability for generation units that are dependent on fossil fuels due to a lack of primary energy sources.
The experience in Germany in February 2012 has shown that interruptible gas contracts can lead to an at
least partial non-availability of gas power plants and that such an event can occur in combination with high
load and low wind feed-in. Such an event can therefore have an impact on the generation – load balance.
On the other hand, most important gas power plants have now been equipped with new contracts due to
changes in the Energy Economy Law. Hereby gas transport problems should be eliminated. However, the
problem of missing volumes of gas may not necessarily be solved by this measure. Furthermore smaller gas
power plants connected to DSOs are not observable for TSOs in terms of their supply contracts. The
quantitative impact of a future gas shortage on the generation – load balance therefore is not predictable.
Therefore in the quantitative analysis for the coming winter, both in normal and severe conditions, the non-
usable capacity due to gas shortage is assumed as 0. However, in principle a gas shortage could occur and
then lead to a reduction of the remaining power.
Most critical periods
From the experience of past winters the period around Christmas could be critical due massive oversupply
of the German control area. This could result in strong negative prices for electricity and could contribute to
a high upward frequency deviation. In such a case the German demand for negative control reserve might
not be covered by the procured reserves and emergency reserve would have to be used.
Another critical situation would be posed by an unexpected strong cold-spell with little wind feed-in and a
possible gas shortage, which could lead to an undersupplied control area.
Expected role of interconnections
Interconnectors are generally expected to be important for the ability to import or export.
The interconnectors are expected to play an important role for the export of excess generation during
demand minimum periods. According to the quantitative analysis of the downward regulation capabilities,
only very few events of this type are expected. It has to be noted that in such cases it is also possible for
German TSOs due to specific laws and regulations to reduce the RES feed-in in order to mitigate any
negative effects on the network.
Framework and methodology of the assessments
Compared to previous outlook reports the data basis for German adequacy evaluations has further been
developed. Hence these values are not directly comparable to previous data.
Nonetheless there is still lacking data so that further improvements of the data base are necessary. In
combination with the used estimations, necessary e. g. for outages, this means that possible sources of
errors are present in the current data.
NTC values have been calculated depending on the expected wind feed-in, or in case no auction is operated,
from empirical values.
The common network analysis of the German TSOs for the winter has continued as in the year before
providing important background information also for the system adequacy assessment especially with
respect to the dimensioning of extra reserves.
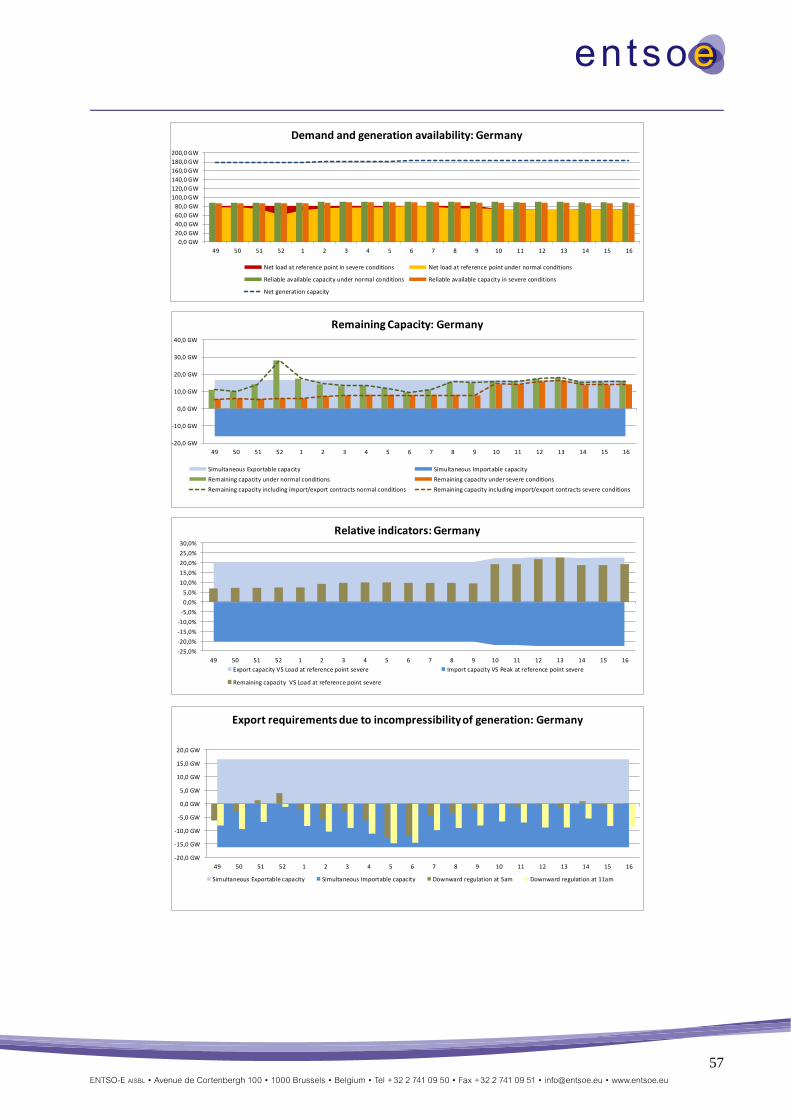
57
0,0 GW
20,0 GW
40,0 GW
60,0 GW
80,0 GW
100,0 GW
120,0 GW
140,0 GW
160,0 GW
180,0 GW
200,0 GW
49 50 51 52 1 2 3 4 5 6 7 8 9 10 11 12 13 14 15 16
Demand and generation availability: Germany
Net load at reference point in severe conditions Net load at reference point under normal conditions
Reliable available capacity under normal conditions Reliable available capacity in severe conditions
Net generation capacity
-20,0 GW
-10,0 GW
0,0 GW
10,0 GW
20,0 GW
30,0 GW
40,0 GW
49 50 51 52 1 2 3 4 5 6 7 8 9 10 11 12 13 14 15 16
Remaining Capacity: Germany
Simultaneous Exportable capacity Simultaneous Importable capacity
Remaining capacity under normal conditions Remaining capacity under severe conditions
Remaining capacity including import/export contracts normal conditions Remaining capacity including import/export contracts severe conditions
-25,0%
-20,0%
-15,0%
-10,0%
-5,0%
0,0%
5,0%
10,0%
15,0%
20,0%
25,0%
30,0%
49 50 51 52 1 2 3 4 5 6 7 8 9 10 11 12 13 14 15 16
Relative indicators: Germany
Export capacity VS Load at reference point severe Import capacity VS Peak at reference point severe
Remaining capacity VS Load at reference point severe
-20,0 GW
-15,0 GW
-10,0 GW
-5,0 GW
0,0 GW
5,0 GW
10,0 GW
15,0 GW
20,0 GW
49 50 51 52 1 2 3 4 5 6 7 8 9 10 11 12 13 14 15 16
Export requirements due to incompressibility of generation: Germany
Simultaneous Exportable capacity Simultaneous Importable capacity Downward regulation at 5am Downward regulation at 11am
58
Greece
General situation
The Greek system is expected to be in balance in the upcoming winter period (2013-2014). The level of
indigenous national generation the good hydraulic storage of hydropower stations ensure the adequacy and
security of the Greek interconnected System, which is not threatened under normal and severe weather
conditions and there is no planning for high level of maintenance during this winter.
Most critical periods
The most critical period during winter is the second half of December and January. Moderate imports are
needed to meet our operating criteria under normal conditions.
Expected role of interconnections
Some exports are expected in case the increasing the production by Renewable energy sources.
Mainly we use the MEAS (Mutual Emergency Assistant Service) agreement in order to help the Italy in the
period of the increasing production by Renewable energy sources.
Framework and methodology of the assessments
In long term, a System Load Forecast study covering both energy and yearly peak load is carried out every
year. The results are included in the Ten-Year Network Development Plan issued by IPTO and published
upon approval of the Regulatory Authority for Energy. In this frame, monthly peaks are also calculated. In
medium and short term, IPTO conducts studies concerning the Generation Adequacy Assessment. The
studies include load forecasts and multiple scenarios on energy management using deterministic methods.
The energy management studies aims at checking the actual energy situation and the level of hydro
reserves. These studies are regularly revised to include mainly variations in the load and/or the availability
of the thermal units.

59
0,0 GW
2,0 GW
4,0 GW
6,0 GW
8,0 GW
10,0 GW
12,0 GW
14,0 GW
16,0 GW
18,0 GW
20,0 GW
49 50 51 52 1 2 3 4 5 6 7 8 9 10 11 12 13 14 15 16
Demand and generation availability: Greece
Net load at reference point in severe conditions
Net load at reference point under normal conditions
Reliable available capacity under normal conditions
Reliable available capacity in severe conditions
-3,0 GW
-2,0 GW
-1,0 GW
0,0 GW
1,0 GW
2,0 GW
3,0 GW
4,0 GW
5,0 GW
49 50 51 52 1 2 3 4 5 6 7 8 9 10 11 12 13 14 15 16
Remaining Capacity: Greece
Simultaneous Exportable capacitySimultaneous Importable capacityRemaining capacity under normal conditionsRemaining capacity under severe conditions
-40,0%
-30,0%
-20,0%
-10,0%
0,0%
10,0%
20,0%
30,0%
40,0%
50,0%
60,0%
49 50 51 52 1 2 3 4 5 6 7 8 9 10 11 12 13 14 15 16
Relative indicators: Greece
Export capacity VS Load at reference point severe Import capacity VS Peak at reference point severe
Remaining capacity VS Load at reference point severe
-2,5 GW
-2,0 GW
-1,5 GW
-1,0 GW
-0,5 GW
0,0 GW
0,5 GW
1,0 GW
1,5 GW
2,0 GW
49 50 51 52 1 2 3 4 5 6 7 8 9 10 11 12 13 14 15 16
Export requirements due to incompressibility of generation: Greece
Simultaneous Exportable capacity Simultaneous Importable capacity Downward regulation at 5am Downward regulation at 11am
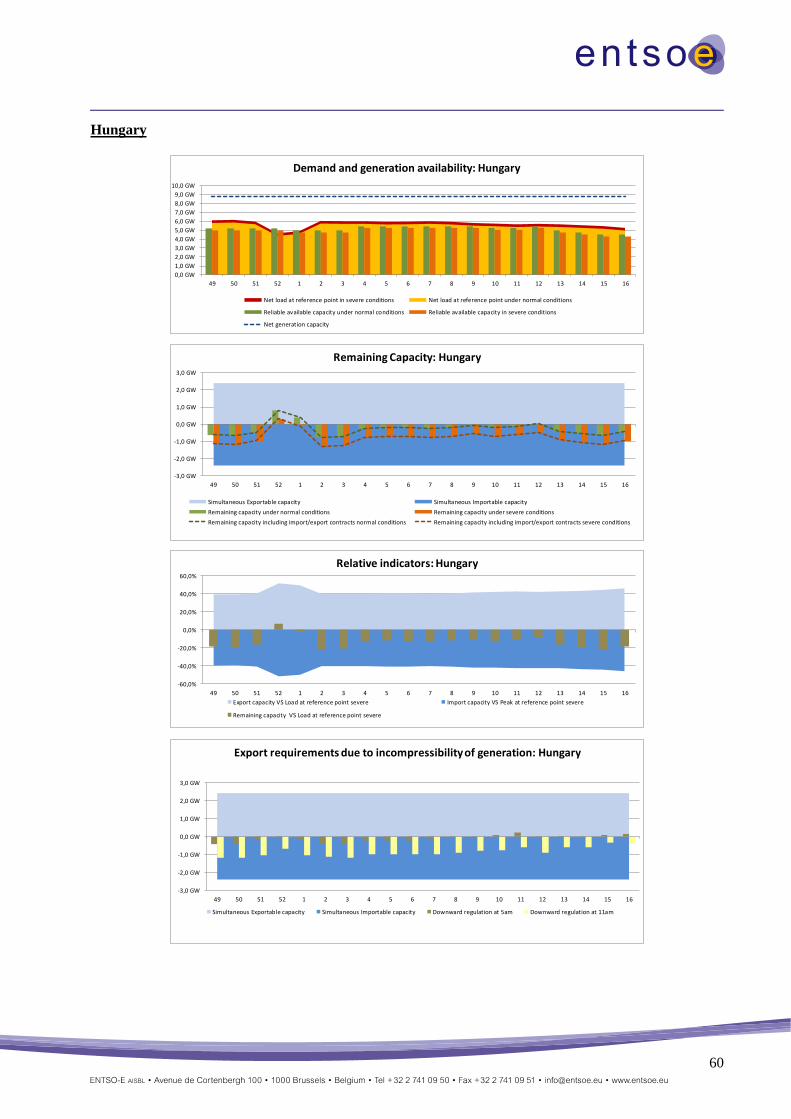
60
Hungary
0,0 GW
1,0 GW
2,0 GW
3,0 GW
4,0 GW
5,0 GW
6,0 GW
7,0 GW
8,0 GW
9,0 GW
10,0 GW
49 50 51 52 1 2 3 4 5 6 7 8 9 10 11 12 13 14 15 16
Demand and generation availability: Hungary
Net load at reference point in severe conditions Net load at reference point under normal conditions
Reliable available capacity under normal conditions Reliable available capacity in severe conditions
Net generation capacity
-3,0 GW
-2,0 GW
-1,0 GW
0,0 GW
1,0 GW
2,0 GW
3,0 GW
49 50 51 52 1 2 3 4 5 6 7 8 9 10 11 12 13 14 15 16
Remaining Capacity: Hungary
Simultaneous Exportable capacity Simultaneous Importable capacity
Remaining capacity under normal conditions Remaining capacity under severe conditions
Remaining capacity including import/export contracts normal conditions Remaining capacity including import/export contracts severe conditions
-60,0%
-40,0%
-20,0%
0,0%
20,0%
40,0%
60,0%
49 50 51 52 1 2 3 4 5 6 7 8 9 10 11 12 13 14 15 16
Relative indicators: Hungary
Export capacity VS Load at reference point severe Import capacity VS Peak at reference point severe
Remaining capacity VS Load at reference point severe
-3,0 GW
-2,0 GW
-1,0 GW
0,0 GW
1,0 GW
2,0 GW
3,0 GW
49 50 51 52 1 2 3 4 5 6 7 8 9 10 11 12 13 14 15 16
Export requirements due to incompressibility of generation: Hungary
Simultaneous Exportable capacity Simultaneous Importable capacity Downward regulation at 5am Downward regulation at 11am
61
Synopsis
In spite of the growing uncertainty on both generation and demand side, as a result of liberalisation on the
one hand, and promotion of intermitted generation on the other, the Hungarian power system is expected to
be on the safe side during the next winter period.
However, there are a few risks that must be carefully managed by the TSO. These risks are:
‒ Availability of fuel, first of all that of natural gas. During long-lasting cold winter periods, demand for
natural gas becomes very high at households and at power plants at the same time. Therefore, a well-
functioning gas market, as well as satisfactory replacement fuel reserves at generators is essential to
keep the lights on. A high capacity gas storage was built so that the security of the gas supply could be
increased.
‒ Overall cross-border capacity is satisfactory; however, allocation of cross-border capacity rights on the
respective border sections may be an issue.
‒ The required level of remaining capacity can only be guaranteed by a certain amount of import, mainly
under severe conditions. Cross-border exchange is a matter of economy for market players. Their
decision-making can be influenced by contractual conditions, e.g. on reserves.
The reference adequacy margin at weekly peak is 0.5 GW, the capacity of the largest generation unit in the
power system.
General situation
The level of maintenance is relatively high during the winter being between 200 and 1000 MW, which is 5-
10% of the Hungarian installed capacity. The Most critical periods are the weeks of April.
Most critical periods
The most critical periods are caused by the severe weather conditions in December and January, since the
units are temperature dependent.
The critical weeks are expected to be until mid-January, in March and April, since the level of maintenance
is higher than in the previous months.
Expected role of interconnections
Access is possible via yearly, monthly, daily and even intraday capacity tenders, auctions. The only
limitation is due to high transit flows through the interconnections.
Iceland
General situation
Scheduled maintenance usually takes place during the summer period.
Most critical periods
The transmission system is expected to be most stressed from late January until mid-March, due to
bottlenecks and local consumption in certain areas. The generation capacity, however, is not expected to be
a problem.
Expected role of interconnections
Not applicable.
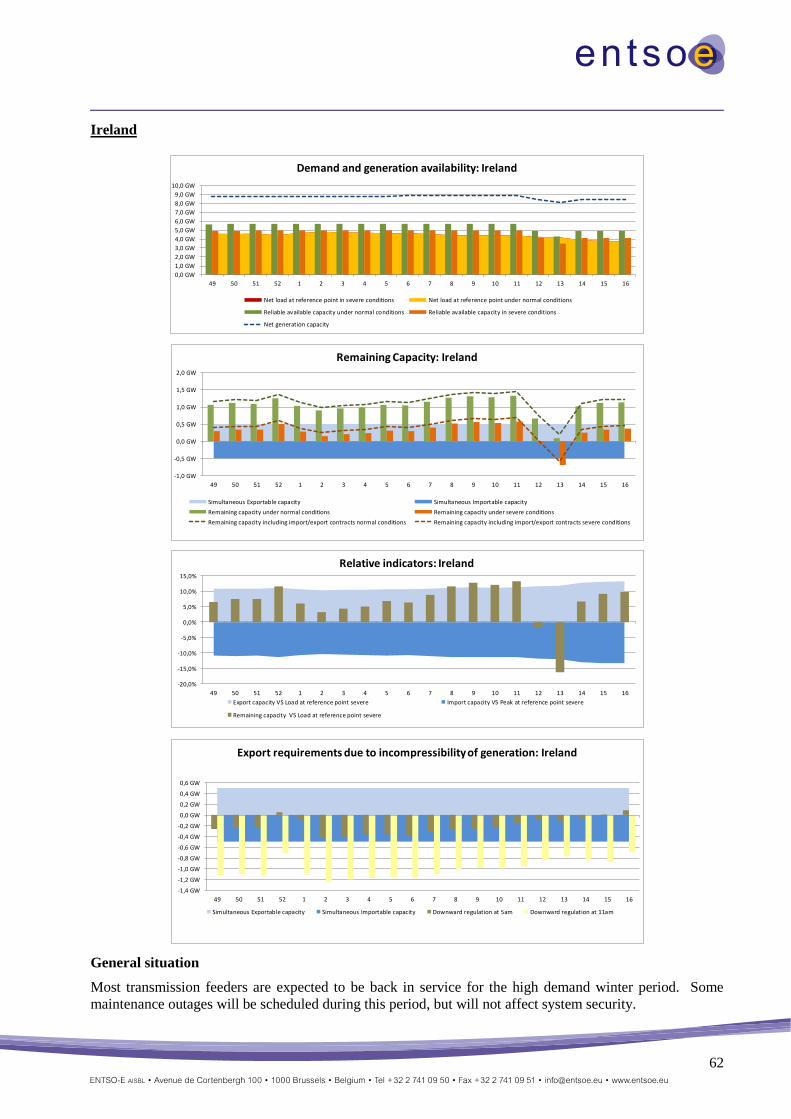
62
Ireland
General situation
Most transmission feeders are expected to be back in service for the high demand winter period. Some
maintenance outages will be scheduled during this period, but will not affect system security.
0,0 GW
1,0 GW
2,0 GW
3,0 GW
4,0 GW
5,0 GW
6,0 GW
7,0 GW
8,0 GW
9,0 GW
10,0 GW
49 50 51 52 1 2 3 4 5 6 7 8 9 10 11 12 13 14 15 16
Demand and generation availability: Ireland
Net load at reference point in severe conditions Net load at reference point under normal conditions
Reliable available capacity under normal conditions Reliable available capacity in severe conditions
Net generation capacity
-1,0 GW
-0,5 GW
0,0 GW
0,5 GW
1,0 GW
1,5 GW
2,0 GW
49 50 51 52 1 2 3 4 5 6 7 8 9 10 11 12 13 14 15 16
Remaining Capacity: Ireland
Simultaneous Exportable capacity Simultaneous Importable capacity
Remaining capacity under normal conditions Remaining capacity under severe conditions
Remaining capacity including import/export contracts normal conditions Remaining capacity including import/export contracts severe conditions
-20,0%
-15,0%
-10,0%
-5,0%
0,0%
5,0%
10,0%
15,0%
49 50 51 52 1 2 3 4 5 6 7 8 9 10 11 12 13 14 15 16
Relative indicators: Ireland
Export capacity VS Load at reference point severe Import capacity VS Peak at reference point severe
Remaining capacity VS Load at reference point severe
-1,4 GW
-1,2 GW
-1,0 GW
-0,8 GW
-0,6 GW
-0,4 GW
-0,2 GW
0,0 GW
0,2 GW
0,4 GW
0,6 GW
49 50 51 52 1 2 3 4 5 6 7 8 9 10 11 12 13 14 15 16
Export requirements due to incompressibility of generation: Ireland
Simultaneous Exportable capacity Simultaneous Importable capacity Downward regulation at 5am Downward regulation at 11am
63
Most critical periods
The cold months of December, January and February will have high demand which is why there are no
major outages planned for this period. There are several outages in week 13 of 2014 which is the last week
of Daylight Savings Time.
Expected role of interconnections
The East-West Interconnector (EWIC) should be fully available during the winter period. This should
provide Ireland with the capability to export or import 500MW of power. Due to current electricity prices in
both Ireland and Great Britain, it is likely that that the flow on the interconnector will be primarily imports
from Great Britain into Ireland.
EWIC can export to the UK in times of minimum demand.
Framework and methodology of the assessments
The generator capacities, generator margins and provisionally scheduled outages of generator units are
stored in a Margins system. This system will export results for capacity margins and schedule outages
which have been included in this report. The forced outage probabilities used are generated each year based
upon the generators availability over the past three years. Generator must run status is based on current
operation policies and constraints.
Italy
General situation
In normal condition, no problem regarding system adequacy is expected in the Italian system (the
decommissioning or mothballing of a large number of old mainly oil-fired power plants, partly already in
place or firmly planned but partly unknown in timing and amount): the reliable available capacity is
expected to be widely higher than the peak load in the whole period. Also under severe conditions the
general situation expected in the winter is not critical, with some problems that may arise only in the Sicily
Island.
The main issues which could affect the generation capacity and the related countermeasures are the
following:
‒ lack of adequate downward regulating capacity: high renewables production (wind and solar) during
low load periods, taking into account the level of the other inflexible generation, could lead to a lack of
adequate downward regulating capacity. In order to cope with this risk, Terna prepares preliminary
analysis and, in case of need, adopt the appropriate countermeasures.
‒ shortage of gas supply: in order to monitor the availability of gas supply for the CCGT power plants, a
special Working Group held by the Italian Government in collaboration with Italian gas and electricity
TSOs, has been established since 2006. During the year 2013, the "Preventive action and emergency
plan" for Italian Gas system was issued, produced in accordance with the EU Regulation Security of
Gas Supply 994/10.
‒ grid constraints: the limitations applied to the generation plants, due to grid constraints are minimized
through the planning of the outages of the relevant grid elements during appropriate periods.
Most critical periods
The worst weeks for downward regulation are expected to be the ones during very low load periods.
Expected role of interconnections
The Italian system is not dependent upon import/export of electricity from neighbouring countries to meet
the balance between generation and demand.
During high renewable/low load periods, in order to guarantee the system security, Terna could adopt
special remedial actions.
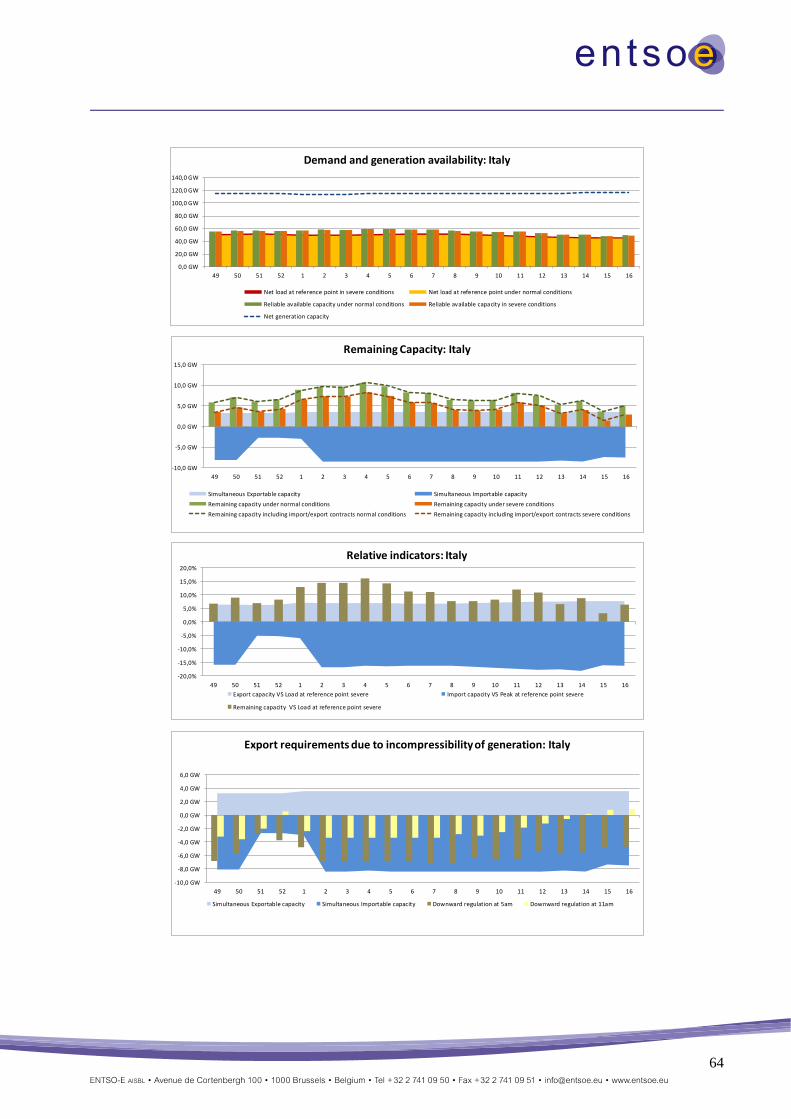
64
0,0 GW
20,0 GW
40,0 GW
60,0 GW
80,0 GW
100,0 GW
120,0 GW
140,0 GW
49 50 51 52 1 2 3 4 5 6 7 8 9 10 11 12 13 14 15 16
Demand and generation availability: Italy
Net load at reference point in severe conditions Net load at reference point under normal conditions
Reliable available capacity under normal conditions Reliable available capacity in severe conditions
Net generation capacity
-10,0 GW
-5,0 GW
0,0 GW
5,0 GW
10,0 GW
15,0 GW
49 50 51 52 1 2 3 4 5 6 7 8 9 10 11 12 13 14 15 16
Remaining Capacity: Italy
Simultaneous Exportable capacity Simultaneous Importable capacity
Remaining capacity under normal conditions Remaining capacity under severe conditions
Remaining capacity including import/export contracts normal conditions Remaining capacity including import/export contracts severe conditions
-20,0%
-15,0%
-10,0%
-5,0%
0,0%
5,0%
10,0%
15,0%
20,0%
49 50 51 52 1 2 3 4 5 6 7 8 9 10 11 12 13 14 15 16
Relative indicators: Italy
Export capacity VS Load at reference point severe Import capacity VS Peak at reference point severe
Remaining capacity VS Load at reference point severe
-10,0 GW
-8,0 GW
-6,0 GW
-4,0 GW
-2,0 GW
0,0 GW
2,0 GW
4,0 GW
6,0 GW
49 50 51 52 1 2 3 4 5 6 7 8 9 10 11 12 13 14 15 16
Export requirements due to incompressibility of generation: Italy
Simultaneous Exportable capacity Simultaneous Importable capacity Downward regulation at 5am Downward regulation at 11am

65
Latvia
0,0 GW
0,5 GW
1,0 GW
1,5 GW
2,0 GW
2,5 GW
3,0 GW
3,5 GW
49 50 51 52 1 2 3 4 5 6 7 8 9 10 11 12 13 14 15 16
Demand and generation availability: Latvia
Net load at reference point in severe conditions Net load at reference point under normal conditions
Reliable available capacity under normal conditions Reliable available capacity in severe conditions
Net generation capacity
-2,0 GW
-1,5 GW
-1,0 GW
-0,5 GW
0,0 GW
0,5 GW
1,0 GW
1,5 GW
2,0 GW
2,5 GW
49 50 51 52 1 2 3 4 5 6 7 8 9 10 11 12 13 14 15 16
Remaining Capacity: Latvia
Simultaneous Exportable capacity Simultaneous Importable capacity
Remaining capacity under normal conditions Remaining capacity under severe conditions
Remaining capacity including import/export contracts normal conditions Remaining capacity including import/export contracts severe conditions
-150,0%
-100,0%
-50,0%
0,0%
50,0%
100,0%
150,0%
200,0%
49 50 51 52 1 2 3 4 5 6 7 8 9 10 11 12 13 14 15 16
Relative indicators: Latvia
Export capacity VS Load at reference point severe Import capacity VS Peak at reference point severe
Remaining capacity VS Load at reference point severe
-2,0 GW
-1,5 GW
-1,0 GW
-0,5 GW
0,0 GW
0,5 GW
1,0 GW
1,5 GW
2,0 GW
2,5 GW
49 50 51 52 1 2 3 4 5 6 7 8 9 10 11 12 13 14 15 16
Export requirements due to incompressibility of generation: Latvia
Simultaneous Exportable capacity Simultaneous Importable capacity Downward regulation at 5am Downward regulation at 11am
66
General situation
Despite sufficient installed capacity on the hydro power plants, shortage of inflow water is the main
limiting factor for generation availability. The main periods of stress for Latvia power system are possible
if water inflow in Daugava River will be very low as showed in severe conditions and all consumption must
be covered mainly by CHPP. The main Latvian CHPPs are fuelled by gas. The fossil fuel for CHPPs
Latvian power companies is imported from Russia and gas prices are one of the most significant indicators
which could affect CHPPs generation availability in Latvia area. In this winter it is expected, that gas
import will be according to CHPPs generation plans and will be sufficient for the CHPPs requirements.
CHPPs are the main power plants for Riga district-heating and they should be in operation.
Latvian TSO is responsible for the security and reliability of power supply in Latvia area and according to
the availability of excess generation capacity in neighbouring power systems and adequate transmission
capacity manages the balance of Latvia power system. In the winter for normal conditions, Latvia power
system is self-sufficient whole winter period. The critical periods for TSO are all weeks when remaining
capacity could be below zero and then Latvia is planning to be dependent from energy import from
neighbouring countries. In severe conditions remaining capacity is also below zero from week 1 till week 6
and only from week 9 water inflow in Daugava River can start increase and Latvia power system will be
the biggest exporter in Baltic States. From week 13 till week 16 hydro power plants are running at full
power. In severe conditions from week 1 till week 6 Latvian TSO is ready for the power import from
Russia and Estonia. Generally Latvian power system is the electricity importer in winter periods as well as
in the summer periods but if we are looking annually then Latvian power system is quite close to balance
because in spring period (March/April) Latvian HPPs exporting huge amount of electricity to neighbouring
power systems. Latvia can import the remaining part of the basic state electricity supply from Estonia,
Lithuania and Russia, and there is also an opportunity of electricity supply from the Scandinavian States.
Security and reliability of power supply in winter period will be dependent on whole Baltic States
generation availability, import and export amounts from 3rd countries and cross-border transfer capacities
between Baltic States, Russia and Nordic States. TSO is expecting that these different energy sources
guarantee uninterrupted and reliable electricity supply in Latvia during whole winter period.
The basic schedules for planned maintenance of power plants which are connected directly to the
transmission system are already known for the coming winter period and further. From week 11 one 442
MW unit of Rigas CHPP2 is going on maintenance but huge hydro production covers demand instead of it.
During winter under normal conditions and under severe conditions mainly all CHP plants will be in
operation and usable will be HPPs (considering water inflow of Daugava river) to cover peak load in
Latvian electricity system. Some reconstructions on hydro generators have been planned during whole
winter period but it's not limiting the production of hydro power in March and April. No additional news
from producers about plans for new power plants constructed in this year and during winter period,
therefore installed net power capacity will remain approximately 2.86 GW. In normal conditions about 15
% of installed capacity of wind can cover the peak load but in severe conditions no wind at all. Power
systems service reserve is approx. 100 MW, which is estimated approx. as 6 % of peak load plus 10 % of
installed capacity of wind.
Most critical periods
Latvian TSO is expecting no critical periods during whole winter for normal conditions but in severe
conditions some extra imports we can expect from week 1 till week 6. Due to strong interconnections with
Lithuania, Estonia and Russia we are expecting electricity import in any emergency situation.
Expected role of interconnections
The interconnection capacity in the winter period usually is higher than during the summer period in normal
load and severe load conditions, but Latvian TSO is ready for any restrictions regarding cross-border
transfer capacity between Latvia and Estonia. In December, January, February are not planned any
interconnections repair works in the Latvia area, therefore the necessary capacity from neighbouring
countries could be imported. In March and April some repair works on interconnections in Latvia will be
started and interconnection capacity to/from Lithuania, Estonia will be decreased. In March and April
67
Latvian TSO foresees 800-1580 MW of hydro to cover the balance and huge amount of electricity export to
neighbouring countries. All maintenance works will go by schedule (monthly schedule) and the draft
schedule is agreed, but going to the next year any changes in maintenance schedule could be possible. The
NTC values for the next winter outlook are best estimated, but according to interconnection outages and
maintenances could change, and will be public in Latvian TSO home page. Considering the Lithuanian
electricity deficit whole year and big amount of electricity from 3rd countries, TSO is expecting high loop
flows and transit flows via Latvian transmission network and therefore the congestion possibilities on cross-
border Latvia-Estonia in normal and severe conditions could appeared. Whole capacity between LV and
RU which won't be sold through Nord Pool Spot will be applied for cross-border EE-LV. It means the
cross-border capacity between EE-LV in these cases will be increased. Interconnection lines transfer
capacities in winter are dependent on weather conditions, Latvian generation volumes, and import amount
of neighbouring countries and maintenances of interconnection lines.
Considering the strong interconnections between Baltic States and 3rd countries and synchronous network
operation between Baltic States and Russian and Belarusian electricity systems as well, Latvian electricity
consumption during winter period could be covered with generation of Russia in case of unpredictable
interconnection shortages and generation shortages should take place. Out of security of supply reasons
Latvia power system is keeping a generation reserve for N-1 criteria whole year.
Lithuania
Synopsis
In the Lithuanian power system, the required adequacy margin can be guaranteed by local generation units.
The forecast net generating capacity during the upcoming winter will be 4059 MW. The maintenance of
generation units is enough low and will not cause any risk.
The system balance is expected to be deficit due to price differences with neighbouring countries. The
import of electricity from neighbouring countries will be relied upon cross-borders with Belarus, Latvia and
the Kaliningrad area. The electricity generation from local thermal, hydro and wind power plants is
expected to cover approximately 36% of demand while 64% will be covered by imports. Available cross-
border capacities for upcoming winter are enough to cover whole consumption under normal conditions and
no specific risks are foreseen.
Generation
According to preliminary plan for the upcoming winter the generation portfolio will consist of 17% of gas
fired PP, 42% - mix fuel PP, 28% - renewable PP and 13% - hydro PP. If any limitations of gas supply
occur, the Lithuania has the possibility to switch 740 MW generation capacity to oil fuel, and respectively
guarantees to cover approximately 42% of forecasting maximum peak load. The two units of 570 MW net
generating capacity of Lithuanian power plant are mothballed. There is a technical possibility to have these
two units available in two months.
We expect to produce more electricity from renewable power plants than in previous winter due to new
installations of wind, solar and biomass power plants. By wind, 17% of generation portfolio will be
covered. The wind power is able to cover about 15 % of Lithuanian demand peak load when the highest
utilization of installed wind capacity is reached. Nevertheless the instability of wind generation and
possibility of icing are taken into account while assessing required system services and adequacy level.
Demand
Peak load is expected in the second half of January. The maximum load for normal conditions is expected
to be 1828 MW and for severe conditions is expected to be 1938 MW. The demand load is expected to be
similar as previous winter.
68
General situation
For the coming winter season the maintenance schedule is not intensive. According to the maintenance
schedule the largest generation inaccessibility due to maintenance will be on week 16 when one generating
unit of Lithuanian power plant and one CHP power plant will be on maintenance. However, no major risk is
foreseen during this period.
The Lithuanian Power System also depends on hydrological circumstances. In drought case the low level of
water in rivers reduces the generation of electricity in hydro power plants. According statistical data of
previous years the lowest level of water of hydro power plants is in the second half of December and in first
half of January. The limited operation of HPP makes influence on Lithuanian’s power balance and
balancing reserves. The high level of water is expected to be at the end of winter, during the flooding.
Most critical periods
According to the last winter experience the most critical periods are when the weather is humid, windy and
the temperature is a little less than 0ᵒC. These circumstances are associated with a high risk of wind
turbines icing. It is foreseen that additional regulating reserves will be needed to cover wind generation
deficit.
According to analysis, it is expected three extraordinary weeks: the week 52 and week 1 due to Christmas
and New year celebration and week 11 due to holiday on Tuesday. It is foreseen that additional regulating
reserves will be needed to cover potential consumption imbalances during these three weeks.
Expected role of interconnections
Available generation capacity in Lithuania PS is sufficient to cover system demand, therefore from system
adequacy point of view interconnections capacity does not play an important role. However
interconnector’s capacities play an important role to ensure import of electricity because available
generation is usually not competitive in the wholesale market. During winter period over 80 % of demand
can be covered by imported electricity. All import volume from 3rd
countries (Russia, Belarus) defined
based on power flow calculation and allocated at Lithuania-Belarus interconnection. Import volume from
3rd
countries highly depends on Estonia-Latvia interconnection capacities. Due to maintenance activities on
the Estonia-Latvia interconnection lines, highest restriction of the import from 3rd
countries is foreseen
during weeks 49-50 and 15-16.
Whereas Lithuania PS is an importing country with fairly low amount of installed renewables, role of
interconnectors to manage an excess of inflexible generation are very low.
Framework and methodology of the assessments
The framework under normal conditions is set on the statistical data of previous year.
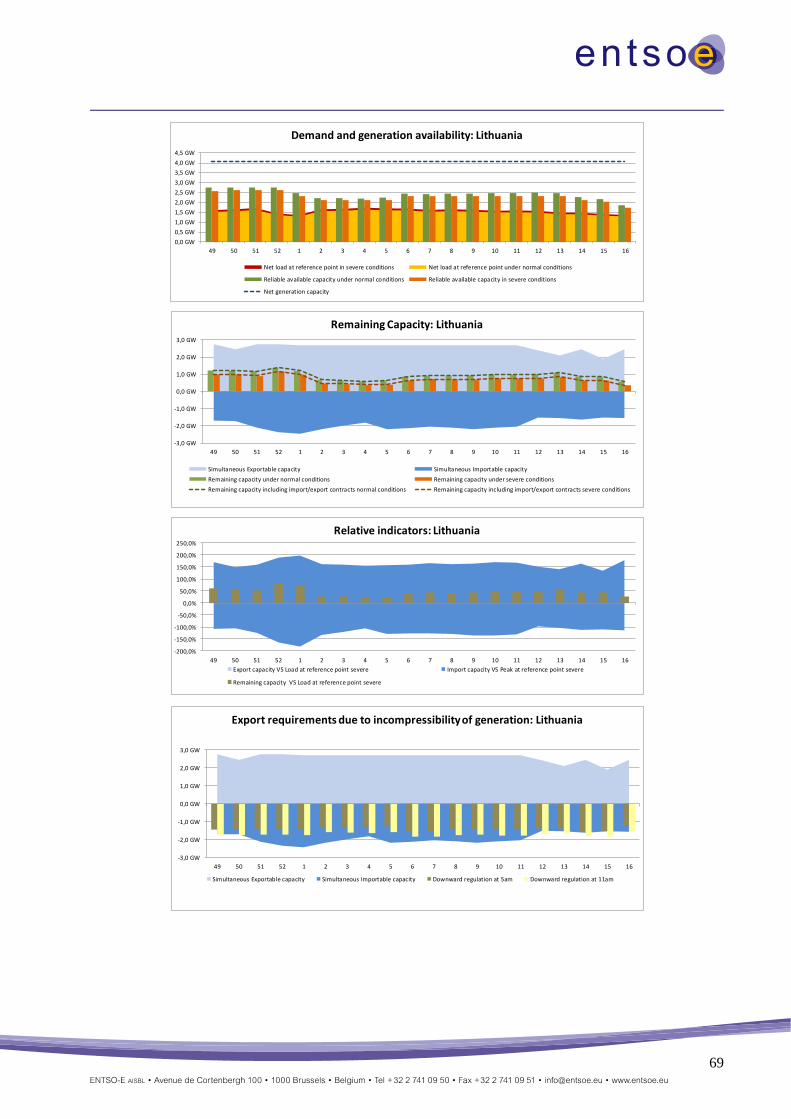
69
0,0 GW
0,5 GW
1,0 GW
1,5 GW
2,0 GW
2,5 GW
3,0 GW
3,5 GW
4,0 GW
4,5 GW
49 50 51 52 1 2 3 4 5 6 7 8 9 10 11 12 13 14 15 16
Demand and generation availability: Lithuania
Net load at reference point in severe conditions Net load at reference point under normal conditions
Reliable available capacity under normal conditions Reliable available capacity in severe conditions
Net generation capacity
-3,0 GW
-2,0 GW
-1,0 GW
0,0 GW
1,0 GW
2,0 GW
3,0 GW
49 50 51 52 1 2 3 4 5 6 7 8 9 10 11 12 13 14 15 16
Remaining Capacity: Lithuania
Simultaneous Exportable capacity Simultaneous Importable capacity
Remaining capacity under normal conditions Remaining capacity under severe conditions
Remaining capacity including import/export contracts normal conditions Remaining capacity including import/export contracts severe conditions
-200,0%
-150,0%
-100,0%
-50,0%
0,0%
50,0%
100,0%
150,0%
200,0%
250,0%
49 50 51 52 1 2 3 4 5 6 7 8 9 10 11 12 13 14 15 16
Relative indicators: Lithuania
Export capacity VS Load at reference point severe Import capacity VS Peak at reference point severe
Remaining capacity VS Load at reference point severe
-3,0 GW
-2,0 GW
-1,0 GW
0,0 GW
1,0 GW
2,0 GW
3,0 GW
49 50 51 52 1 2 3 4 5 6 7 8 9 10 11 12 13 14 15 16
Export requirements due to incompressibility of generation: Lithuania
Simultaneous Exportable capacity Simultaneous Importable capacity Downward regulation at 5am Downward regulation at 11am

70
Luxembourg
0,0 GW
0,2 GW
0,4 GW
0,6 GW
0,8 GW
1,0 GW
1,2 GW
1,4 GW
1,6 GW
1,8 GW
2,0 GW
49 50 51 52 1 2 3 4 5 6 7 8 9 10 11 12 13 14 15 16
Demand and generation availability: Luxembourg
Net load at reference point in severe conditions
Net load at reference point under normal conditions
Reliable available capacity under normal conditions
Reliable available capacity in severe conditions
-3,0 GW
-2,0 GW
-1,0 GW
0,0 GW
1,0 GW
2,0 GW
3,0 GW
49 50 51 52 1 2 3 4 5 6 7 8 9 10 11 12 13 14 15 16
Remaining Capacity: Luxembourg
Simultaneous Exportable capacity Simultaneous Importable capacity
Remaining capacity under normal conditions Remaining capacity under severe conditions
Remaining capacity including import/export contracts normal conditions Remaining capacity including import/export contracts severe conditions
-300,0%
-200,0%
-100,0%
0,0%
100,0%
200,0%
300,0%
49 50 51 52 1 2 3 4 5 6 7 8 9 10 11 12 13 14 15 16
Relative indicators: Luxembourg
Export capacity VS Load at reference point severe Import capacity VS Peak at reference point severe
Remaining capacity VS Load at reference point severe
-3,0 GW
-2,0 GW
-1,0 GW
0,0 GW
1,0 GW
2,0 GW
3,0 GW
49 50 51 52 1 2 3 4 5 6 7 8 9 10 11 12 13 14 15 16
Export requirements due to incompressibility of generation: Luxembourg
Simultaneous Exportable capacity Simultaneous Importable capacity Downward regulation at 5am Downward regulation at 11am
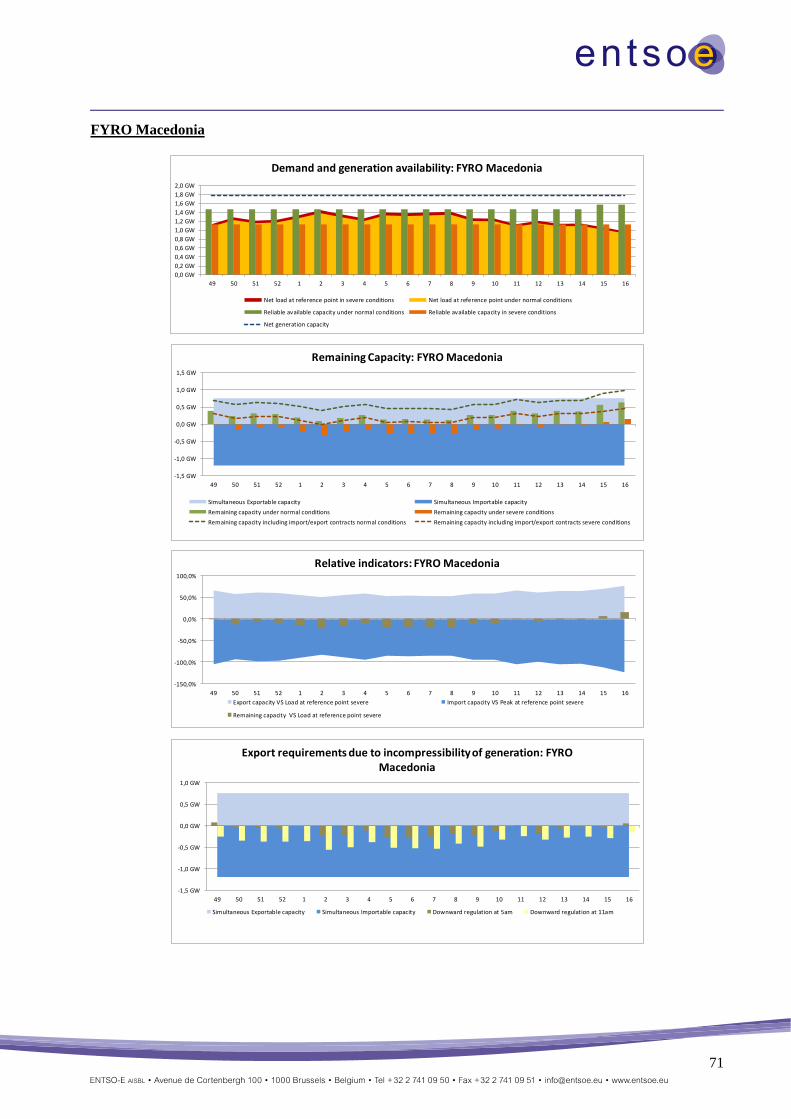
71
FYRO Macedonia
0,0 GW
0,2 GW
0,4 GW
0,6 GW
0,8 GW
1,0 GW
1,2 GW
1,4 GW
1,6 GW
1,8 GW
2,0 GW
49 50 51 52 1 2 3 4 5 6 7 8 9 10 11 12 13 14 15 16
Demand and generation availability: FYRO Macedonia
Net load at reference point in severe conditions Net load at reference point under normal conditions
Reliable available capacity under normal conditions Reliable available capacity in severe conditions
Net generation capacity
-1,5 GW
-1,0 GW
-0,5 GW
0,0 GW
0,5 GW
1,0 GW
1,5 GW
49 50 51 52 1 2 3 4 5 6 7 8 9 10 11 12 13 14 15 16
Remaining Capacity: FYRO Macedonia
Simultaneous Exportable capacity Simultaneous Importable capacity
Remaining capacity under normal conditions Remaining capacity under severe conditions
Remaining capacity including import/export contracts normal conditions Remaining capacity including import/export contracts severe conditions
-150,0%
-100,0%
-50,0%
0,0%
50,0%
100,0%
49 50 51 52 1 2 3 4 5 6 7 8 9 10 11 12 13 14 15 16
Relative indicators: FYRO Macedonia
Export capacity VS Load at reference point severe Import capacity VS Peak at reference point severe
Remaining capacity VS Load at reference point severe
-1,5 GW
-1,0 GW
-0,5 GW
0,0 GW
0,5 GW
1,0 GW
49 50 51 52 1 2 3 4 5 6 7 8 9 10 11 12 13 14 15 16
Export requirements due to incompressibility of generation: FYRO Macedonia
Simultaneous Exportable capacity Simultaneous Importable capacity Downward regulation at 5am Downward regulation at 11am
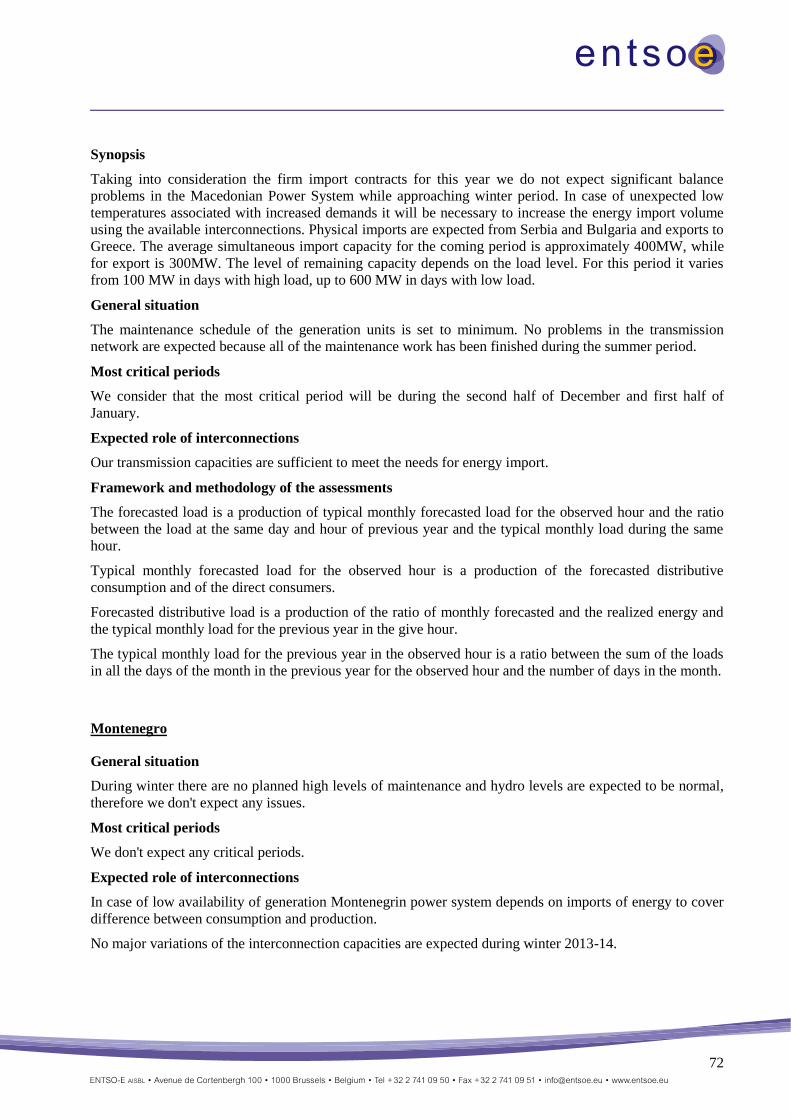
72
Synopsis
Taking into consideration the firm import contracts for this year we do not expect significant balance
problems in the Macedonian Power System while approaching winter period. In case of unexpected low
temperatures associated with increased demands it will be necessary to increase the energy import volume
using the available interconnections. Physical imports are expected from Serbia and Bulgaria and exports to
Greece. The average simultaneous import capacity for the coming period is approximately 400MW, while
for export is 300MW. The level of remaining capacity depends on the load level. For this period it varies
from 100 MW in days with high load, up to 600 MW in days with low load.
General situation
The maintenance schedule of the generation units is set to minimum. No problems in the transmission
network are expected because all of the maintenance work has been finished during the summer period.
Most critical periods
We consider that the most critical period will be during the second half of December and first half of
January.
Expected role of interconnections
Our transmission capacities are sufficient to meet the needs for energy import.
Framework and methodology of the assessments
The forecasted load is a production of typical monthly forecasted load for the observed hour and the ratio
between the load at the same day and hour of previous year and the typical monthly load during the same
hour.
Typical monthly forecasted load for the observed hour is a production of the forecasted distributive
consumption and of the direct consumers.
Forecasted distributive load is a production of the ratio of monthly forecasted and the realized energy and
the typical monthly load for the previous year in the give hour.
The typical monthly load for the previous year in the observed hour is a ratio between the sum of the loads
in all the days of the month in the previous year for the observed hour and the number of days in the month.
Montenegro
General situation
During winter there are no planned high levels of maintenance and hydro levels are expected to be normal,
therefore we don't expect any issues.
Most critical periods
We don't expect any critical periods.
Expected role of interconnections
In case of low availability of generation Montenegrin power system depends on imports of energy to cover
difference between consumption and production.
No major variations of the interconnection capacities are expected during winter 2013-14.
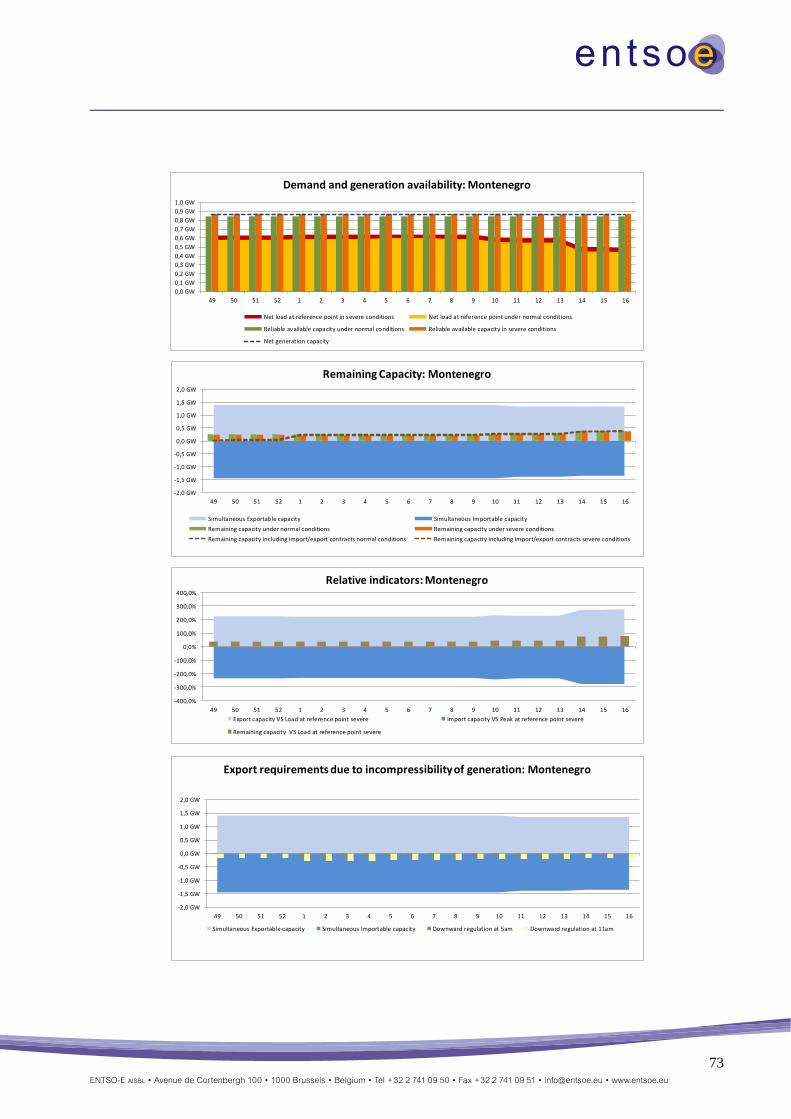
73
0,0 GW
0,1 GW
0,2 GW
0,3 GW
0,4 GW
0,5 GW
0,6 GW
0,7 GW
0,8 GW
0,9 GW
1,0 GW
49 50 51 52 1 2 3 4 5 6 7 8 9 10 11 12 13 14 15 16
Demand and generation availability: Montenegro
Net load at reference point in severe conditions Net load at reference point under normal conditions
Reliable available capacity under normal conditions Reliable available capacity in severe conditions
Net generation capacity
-2,0 GW
-1,5 GW
-1,0 GW
-0,5 GW
0,0 GW
0,5 GW
1,0 GW
1,5 GW
2,0 GW
49 50 51 52 1 2 3 4 5 6 7 8 9 10 11 12 13 14 15 16
Remaining Capacity: Montenegro
Simultaneous Exportable capacity Simultaneous Importable capacity
Remaining capacity under normal conditions Remaining capacity under severe conditions
Remaining capacity including import/export contracts normal conditions Remaining capacity including import/export contracts severe conditions
-400,0%
-300,0%
-200,0%
-100,0%
0,0%
100,0%
200,0%
300,0%
400,0%
49 50 51 52 1 2 3 4 5 6 7 8 9 10 11 12 13 14 15 16
Relative indicators: Montenegro
Export capacity VS Load at reference point severe Import capacity VS Peak at reference point severe
Remaining capacity VS Load at reference point severe
-2,0 GW
-1,5 GW
-1,0 GW
-0,5 GW
0,0 GW
0,5 GW
1,0 GW
1,5 GW
2,0 GW
49 50 51 52 1 2 3 4 5 6 7 8 9 10 11 12 13 14 15 16
Export requirements due to incompressibility of generation: Montenegro
Simultaneous Exportable capacity Simultaneous Importable capacity Downward regulation at 5am Downward regulation at 11am

74
The Netherlands
Synopsis
TenneT TSO B.V. performs studies on a national level in accordance with our National Grid Code for
establishing the Total Transmission Capacity available on our border. So far there has not been a special
scenario for the winter period or the winter adequacy forecast. To our opinion the supply-demand balance
will be realised on the basis of the price-driven demand principle and it's not a task of the TSO to intervene
in a good functioning market.
The specific TSO's task is balancing the system and supply emergency power when necessary.
Nevertheless, there is no indication of lack of power based on weather conditions in the following winter
period, as the Netherlands has not been suffering long period of harsh winters.
Due to the fact that the Netherlands has sufficient Gas supplies of its own, any crisis in Gas is not to be
expected to have an effect on the Dutch electricity supply.
TenneT TSO B.V. provides on behalf the Ministry of Economic Affairs the report on Monitoring of
Security of Supply 15 years ahead (Monitoring Leveringszekerheid). Visit our website for the latest report
on Monitoring 2012-2028: www.tennet.eu
General situation
In case of large wind generation in Germany, a cold winter, higher demands and relatively higher prices in
France or an unexpected higher demand in Belgium, this could cause extra flows through the Dutch grid
from the northern part towards the southern part in the Northwest European area, which could possibly
result in an import and export reduction of interconnector capacity.
Most critical periods
In most years the peak load happened in the winter period in the late afternoon hours (17 – 18 hrs) in
December or January, the historical peak load still remains within the calculated peak load under severe or
normal conditions and under the total amount of installed capacity within the Netherlands.
Expected role of interconnections
National generation capacity is sufficient for peak demands and we do not rely on the import or export
capacity for that. During the coming winter period no changes to import or export capacity are expected.
There is no role expected of interconnectors for managing an excess of inflexible generation within the
Netherlands.
Framework and methodology of the assessment
TenneT NL does not perform a special scenario for winter adequacy forecast. To our opinion the supply-
demand balance will be realised on the basis of the price-driven demand principle and it's not a task of the
TSO to intervene in a good functioning market.
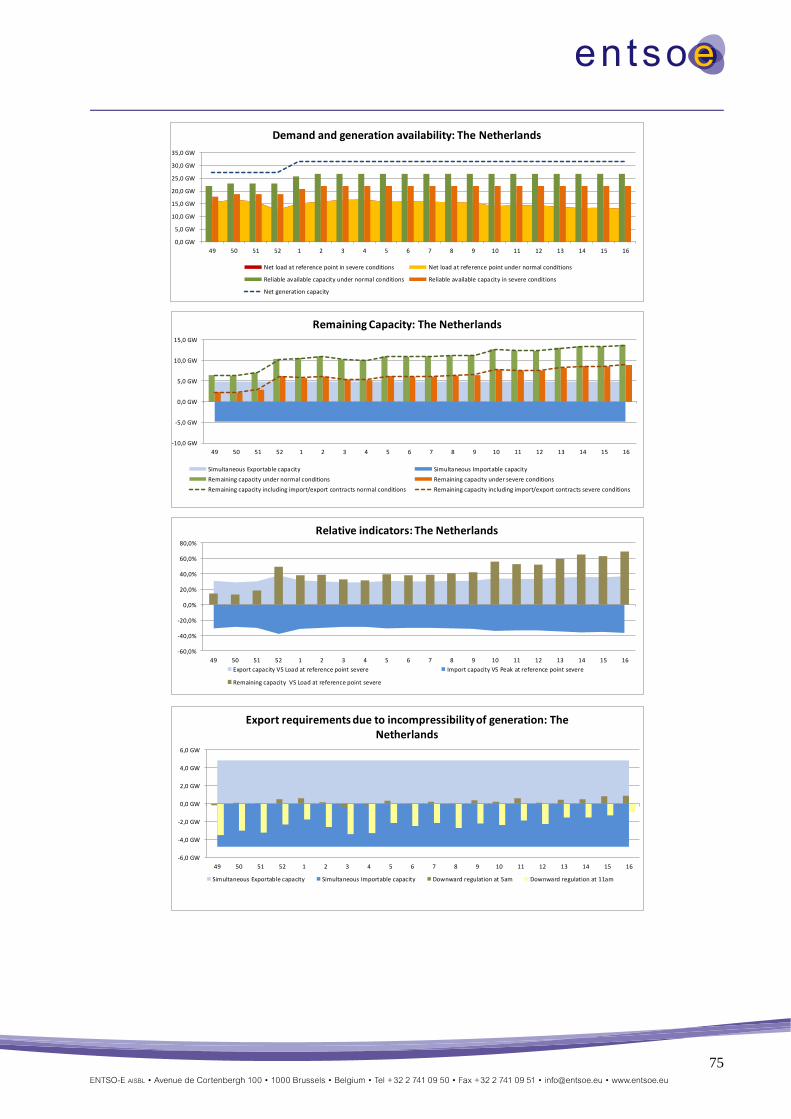
75
0,0 GW
5,0 GW
10,0 GW
15,0 GW
20,0 GW
25,0 GW
30,0 GW
35,0 GW
49 50 51 52 1 2 3 4 5 6 7 8 9 10 11 12 13 14 15 16
Demand and generation availability: The Netherlands
Net load at reference point in severe conditions Net load at reference point under normal conditions
Reliable available capacity under normal conditions Reliable available capacity in severe conditions
Net generation capacity
-10,0 GW
-5,0 GW
0,0 GW
5,0 GW
10,0 GW
15,0 GW
49 50 51 52 1 2 3 4 5 6 7 8 9 10 11 12 13 14 15 16
Remaining Capacity: The Netherlands
Simultaneous Exportable capacity Simultaneous Importable capacity
Remaining capacity under normal conditions Remaining capacity under severe conditions
Remaining capacity including import/export contracts normal conditions Remaining capacity including import/export contracts severe conditions
-60,0%
-40,0%
-20,0%
0,0%
20,0%
40,0%
60,0%
80,0%
49 50 51 52 1 2 3 4 5 6 7 8 9 10 11 12 13 14 15 16
Relative indicators: The Netherlands
Export capacity VS Load at reference point severe Import capacity VS Peak at reference point severe
Remaining capacity VS Load at reference point severe
-6,0 GW
-4,0 GW
-2,0 GW
0,0 GW
2,0 GW
4,0 GW
6,0 GW
49 50 51 52 1 2 3 4 5 6 7 8 9 10 11 12 13 14 15 16
Export requirements due to incompressibility of generation: The Netherlands
Simultaneous Exportable capacity Simultaneous Importable capacity Downward regulation at 5am Downward regulation at 11am
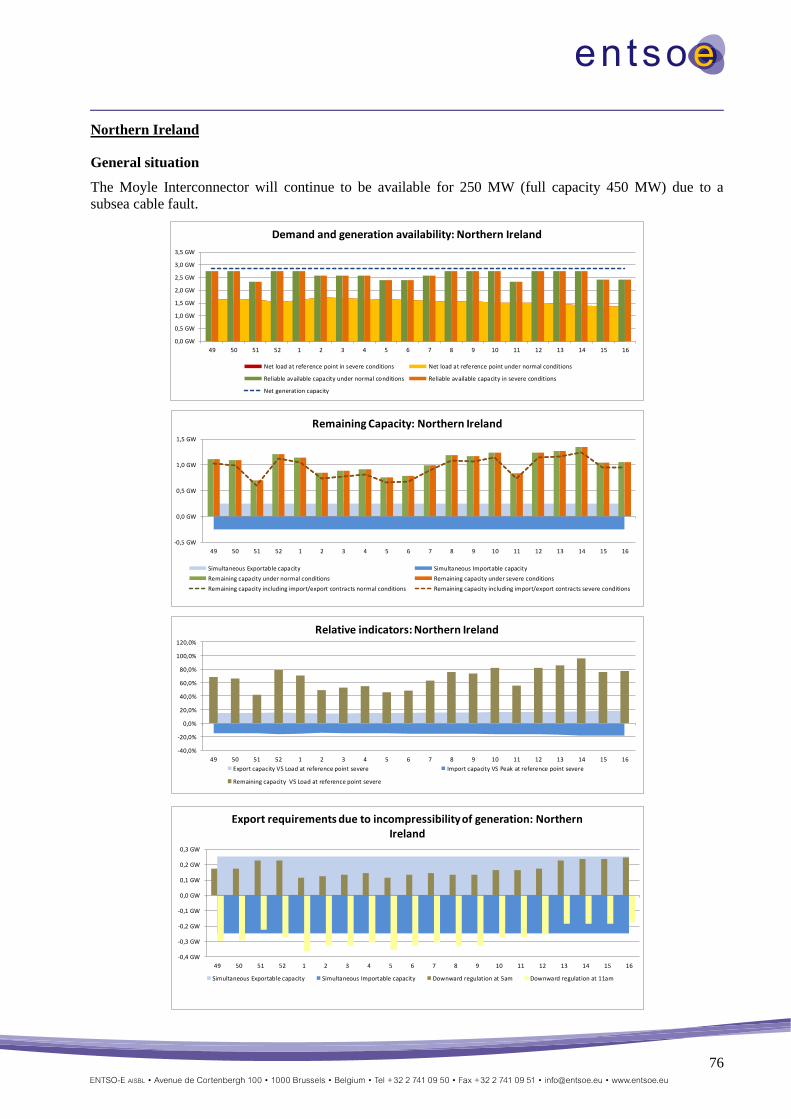
76
Northern Ireland
General situation
The Moyle Interconnector will continue to be available for 250 MW (full capacity 450 MW) due to a
subsea cable fault.
0,0 GW
0,5 GW
1,0 GW
1,5 GW
2,0 GW
2,5 GW
3,0 GW
3,5 GW
49 50 51 52 1 2 3 4 5 6 7 8 9 10 11 12 13 14 15 16
Demand and generation availability: Northern Ireland
Net load at reference point in severe conditions Net load at reference point under normal conditions
Reliable available capacity under normal conditions Reliable available capacity in severe conditions
Net generation capacity
-0,5 GW
0,0 GW
0,5 GW
1,0 GW
1,5 GW
49 50 51 52 1 2 3 4 5 6 7 8 9 10 11 12 13 14 15 16
Remaining Capacity: Northern Ireland
Simultaneous Exportable capacity Simultaneous Importable capacity
Remaining capacity under normal conditions Remaining capacity under severe conditions
Remaining capacity including import/export contracts normal conditions Remaining capacity including import/export contracts severe conditions
-40,0%
-20,0%
0,0%
20,0%
40,0%
60,0%
80,0%
100,0%
120,0%
49 50 51 52 1 2 3 4 5 6 7 8 9 10 11 12 13 14 15 16
Relative indicators: Northern Ireland
Export capacity VS Load at reference point severe Import capacity VS Peak at reference point severe
Remaining capacity VS Load at reference point severe
-0,4 GW
-0,3 GW
-0,2 GW
-0,1 GW
0,0 GW
0,1 GW
0,2 GW
0,3 GW
49 50 51 52 1 2 3 4 5 6 7 8 9 10 11 12 13 14 15 16
Export requirements due to incompressibility of generation: Northern Ireland
Simultaneous Exportable capacity Simultaneous Importable capacity Downward regulation at 5am Downward regulation at 11am
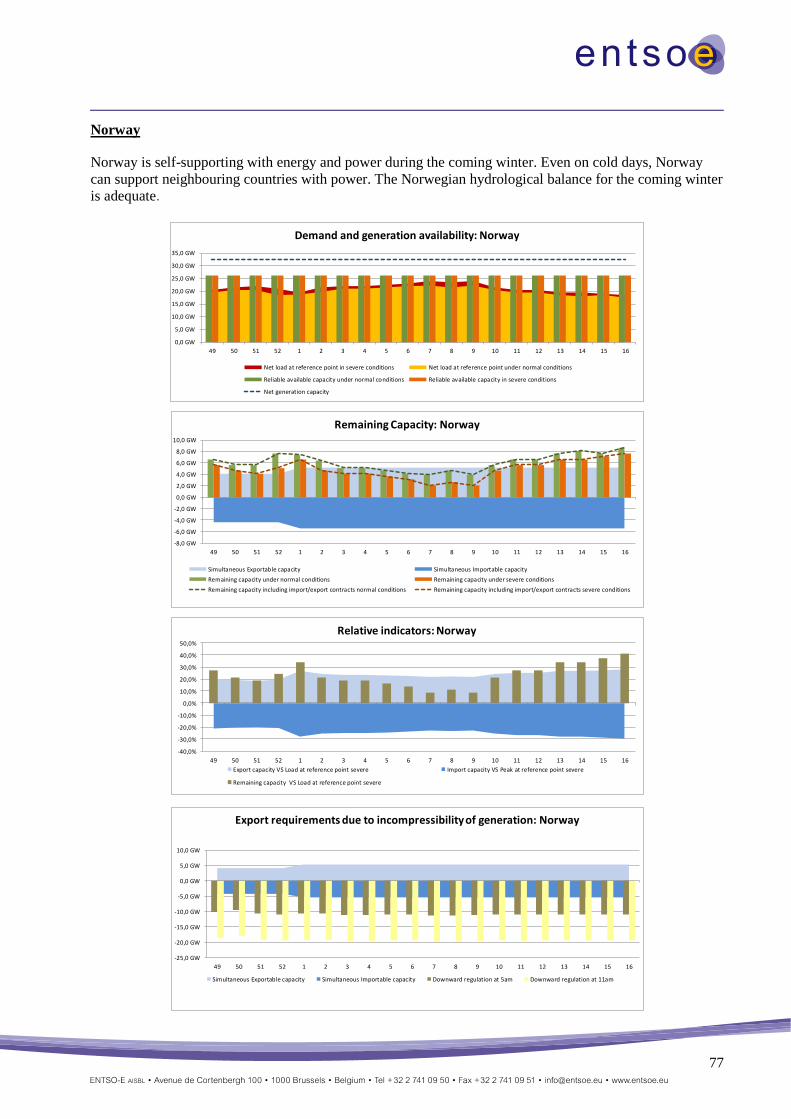
77
Norway
Norway is self-supporting with energy and power during the coming winter. Even on cold days, Norway
can support neighbouring countries with power. The Norwegian hydrological balance for the coming winter
is adequate.
0,0 GW
5,0 GW
10,0 GW
15,0 GW
20,0 GW
25,0 GW
30,0 GW
35,0 GW
49 50 51 52 1 2 3 4 5 6 7 8 9 10 11 12 13 14 15 16
Demand and generation availability: Norway
Net load at reference point in severe conditions Net load at reference point under normal conditions
Reliable available capacity under normal conditions Reliable available capacity in severe conditions
Net generation capacity
-8,0 GW
-6,0 GW
-4,0 GW
-2,0 GW
0,0 GW
2,0 GW
4,0 GW
6,0 GW
8,0 GW
10,0 GW
49 50 51 52 1 2 3 4 5 6 7 8 9 10 11 12 13 14 15 16
Remaining Capacity: Norway
Simultaneous Exportable capacity Simultaneous Importable capacity
Remaining capacity under normal conditions Remaining capacity under severe conditions
Remaining capacity including import/export contracts normal conditions Remaining capacity including import/export contracts severe conditions
-40,0%
-30,0%
-20,0%
-10,0%
0,0%
10,0%
20,0%
30,0%
40,0%
50,0%
49 50 51 52 1 2 3 4 5 6 7 8 9 10 11 12 13 14 15 16
Relative indicators: Norway
Export capacity VS Load at reference point severe Import capacity VS Peak at reference point severe
Remaining capacity VS Load at reference point severe
-25,0 GW
-20,0 GW
-15,0 GW
-10,0 GW
-5,0 GW
0,0 GW
5,0 GW
10,0 GW
49 50 51 52 1 2 3 4 5 6 7 8 9 10 11 12 13 14 15 16
Export requirements due to incompressibility of generation: Norway
Simultaneous Exportable capacity Simultaneous Importable capacity Downward regulation at 5am Downward regulation at 11am
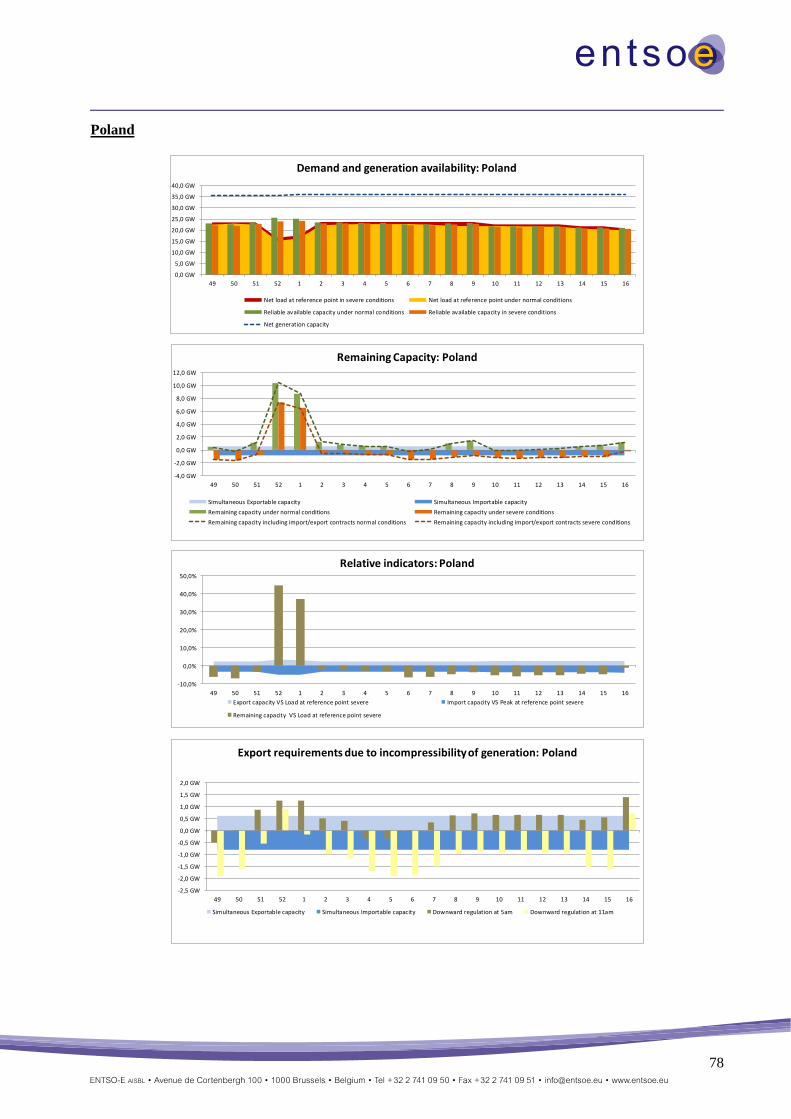
78
Poland
0,0 GW
5,0 GW
10,0 GW
15,0 GW
20,0 GW
25,0 GW
30,0 GW
35,0 GW
40,0 GW
49 50 51 52 1 2 3 4 5 6 7 8 9 10 11 12 13 14 15 16
Demand and generation availability: Poland
Net load at reference point in severe conditions Net load at reference point under normal conditions
Reliable available capacity under normal conditions Reliable available capacity in severe conditions
Net generation capacity
-4,0 GW
-2,0 GW
0,0 GW
2,0 GW
4,0 GW
6,0 GW
8,0 GW
10,0 GW
12,0 GW
49 50 51 52 1 2 3 4 5 6 7 8 9 10 11 12 13 14 15 16
Remaining Capacity: Poland
Simultaneous Exportable capacity Simultaneous Importable capacity
Remaining capacity under normal conditions Remaining capacity under severe conditions
Remaining capacity including import/export contracts normal conditions Remaining capacity including import/export contracts severe conditions
-10,0%
0,0%
10,0%
20,0%
30,0%
40,0%
50,0%
49 50 51 52 1 2 3 4 5 6 7 8 9 10 11 12 13 14 15 16
Relative indicators: Poland
Export capacity VS Load at reference point severe Import capacity VS Peak at reference point severe
Remaining capacity VS Load at reference point severe
-2,5 GW
-2,0 GW
-1,5 GW
-1,0 GW
-0,5 GW
0,0 GW
0,5 GW
1,0 GW
1,5 GW
2,0 GW
49 50 51 52 1 2 3 4 5 6 7 8 9 10 11 12 13 14 15 16
Export requirements due to incompressibility of generation: Poland
Simultaneous Exportable capacity Simultaneous Importable capacity Downward regulation at 5am Downward regulation at 11am
79
Power balance at 19:00 CET
In Poland forecast plans (yearly coordination plans) are done for the whole year on a monthly basis, till
30th November every year. Prepared data concerns average values from working days at peak time (during
main winter months, means December, January and February peak time is taking place at 17:00 and load is
higher than at 19:00 by at about 1-2,5%). On 26th every month PSE publishes monthly coordination plans,
which include the precise information on peak time for all days of the next month. Further specification is
done within the operational planning (weekly and daily).
Because of Outlook reports require weekly data, PSE has prepared special assessment for Winter Outlook,
where weekly data of NGC, maintenances, load and “best estimate of NTC” are available. It is important to
underline that, there is still yearly planning horizon. This assessment as well as coordination plans are
coherent and based on information from producers (NGC, overhauls, non-usable capacity), and Polish TSO
own analysis (load, outages, reserves, non-usable capacity, NTC). In normal conditions PSE classifies 89%
of wind NGC as non-usable capacity, for severe conditions it is 100%.
In normal conditions PSE does not expect any problems with balance the system this winter. Single day’s
unbalances which PSE expects, will be maintained under monthly and daily planning.
Under severe conditions, for all analysed reference points (except for Christmas and New Year period) PSE
observes a negative balance. Such forecast takes into consideration both high demand and low generation
availability, which usually take place simultaneously in the Polish under long lasting severe conditions (low
temperature, hydrological constrains after dry Autumn / during dry Winter), To keep the balance at the safe
level, Polish TSO can use operational procedures, to cope with power shortage.
In addition, extremely severe balancing conditions in the winter period may take place in case of cold
spells. In such a situation, the risk of unscheduled flows through the Polish system (from the western
towards the southern Polish border) is low, thus the import of energy up to 1000 MW will be possible on
the synchronous profile (in normal conditions there is no import capacity available). Additionally there
could be the option to make use of units up to 300 MW capacity, which in the yearly planning are classified
as non-usable capacity.
Power balance at minimum demand conditions
PSE does not prepare forecast for downward regulation capabilities in yearly and monthly horizon (only
during daily planning), so provided data is a kind of estimation only. PSE can confirm that there are some
stress days during the year (especially during Christmas, Easter and holidays in May), when low demand
and simultaneously high wind condition could cause the balance problem in Polish power system. Wind
generation factor used in national downward analysis amounts 85% of NGC.
Owing to the big increase of wind NGC in Poland (by 40% Oct.2012 to Oct.2013) and quite pessimistic
factor for wind generation, the national downward analysis at 5 a.m. CET show possible problem with
balance the system almost for all reference points. All of them will be manage during operational planning,
when precise forecast of wind generation will be known, PSE has operational procedures to keep system at
safe level (including wind farms switching off as a last resort).
PSE does not expect problems with balance at 11:00 a.m. in Sundays. Solar generation is not a problem due
to fact that NGC of solar is negligible in Polish balance.
Operational conditions
Referring to network conditions, for years PSE S.A. has been affected by unscheduled transit flows through
the system from the west to the south. The flows limits capacity, which could be offer to the market on the
borders and causes network problems in operation, like overloading of tie lines and internal elements, not
fulfilment N-1 criteria on the borders. To keep system safe in such situations PSE will take the following
actions:
‒ Activate DC loop flow (HVDC rescheduling) PL→DE→DK→SE→PL.
‒ Activate internal redispatching
80
‒ Activate cross-border redispatching.
‒ Activate multilateral redispatching.
In case of emergency situation, the agreements concluded between PSE S.A. and neighbouring TSOs for
emergency energy delivery can be used.
Interconnection capacities
PSE provides aggregated NTC data for the whole 220/400 kV synchronous PL - DE/CZ/SK profile on the
base of the Polish Grid Code that accounts for physical power flows in the interconnected systems of
Continental Europe, i.e. unplanned flows through Polish system from the west to the south. Additional
Polish connections in use are: DC cable to Sweden, 220kV line to Ukraine, on which import only is
possible (Ukrainian units are connected synchronously to the Polish system).
As the “best estimate of NTC” for Winter Outlook PSE provides seasonal forecast of NTC, which takes
into consideration unplanned transit flows through PSE control area. Additionally December’s forecast
include network constrains caused by planned switching off of the cross-border and / or internal lines (or
other elements). Such constrains for 2014 will be agreed till end of November. Both factors limit the
transmission capacity in Polish system in the yearly planning horizon.
For the whole analysed winter period (in fact during the whole year) yearly forecast of NTC in import
direction on PL – DE/CZ/CK profile amounts to zero. This is caused by low level of TTC, which is
calculated on the basis of N-1 criterion, simultaneously with high level of TRM, resulting from transit flows
through Poland. In other words all capacity possibly to be offered to the market players is already
consumed by these transit flows.
Portugal
Synopsis
From the perspective of REN, in the next winter, generation/demand balance is expected to be met without
problems.
Demand should have a small increase from last year values but, from the supply side, even if there is a
noticeable decrease in generating capacity, the situation is more comfortable as, in the end of September,
hydro storage is at 53% of its full capacity. Beside grid constraints, generation constraints in the Portuguese
system are essentially related with the unavailability of the primary source in water and wind power plants,
as fuel supply is not an issue.
General situation
No potential threats or critical periods were identified.
Most critical periods
Although no critical situations were identified, we highlight the weeks 1 to 8 where, in severe scenario both
from demand and supply side, the margins could be lower than usual.
Expected role of interconnections
From the adequacy point, the Portuguese system does not rely on import capacity, however, in certain
market conditions, some significant power flow in the interconnections can be expected.
Eventual issues with inflexible generation are expected to be managed without resorting to export capacity.
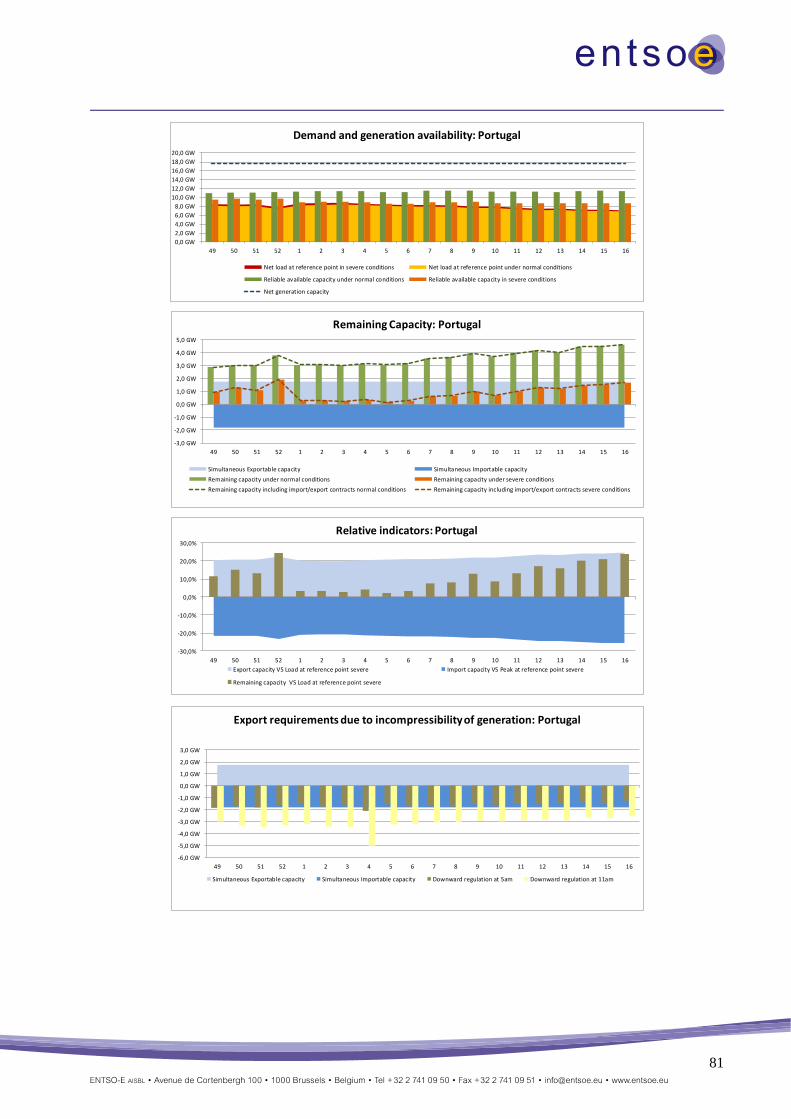
81
0,0 GW
2,0 GW
4,0 GW
6,0 GW
8,0 GW
10,0 GW
12,0 GW
14,0 GW
16,0 GW
18,0 GW
20,0 GW
49 50 51 52 1 2 3 4 5 6 7 8 9 10 11 12 13 14 15 16
Demand and generation availability: Portugal
Net load at reference point in severe conditions Net load at reference point under normal conditions
Reliable available capacity under normal conditions Reliable available capacity in severe conditions
Net generation capacity
-3,0 GW
-2,0 GW
-1,0 GW
0,0 GW
1,0 GW
2,0 GW
3,0 GW
4,0 GW
5,0 GW
49 50 51 52 1 2 3 4 5 6 7 8 9 10 11 12 13 14 15 16
Remaining Capacity: Portugal
Simultaneous Exportable capacity Simultaneous Importable capacity
Remaining capacity under normal conditions Remaining capacity under severe conditions
Remaining capacity including import/export contracts normal conditions Remaining capacity including import/export contracts severe conditions
-30,0%
-20,0%
-10,0%
0,0%
10,0%
20,0%
30,0%
49 50 51 52 1 2 3 4 5 6 7 8 9 10 11 12 13 14 15 16
Relative indicators: Portugal
Export capacity VS Load at reference point severe Import capacity VS Peak at reference point severe
Remaining capacity VS Load at reference point severe
-6,0 GW
-5,0 GW
-4,0 GW
-3,0 GW
-2,0 GW
-1,0 GW
0,0 GW
1,0 GW
2,0 GW
3,0 GW
49 50 51 52 1 2 3 4 5 6 7 8 9 10 11 12 13 14 15 16
Export requirements due to incompressibility of generation: Portugal
Simultaneous Exportable capacity Simultaneous Importable capacity Downward regulation at 5am Downward regulation at 11am
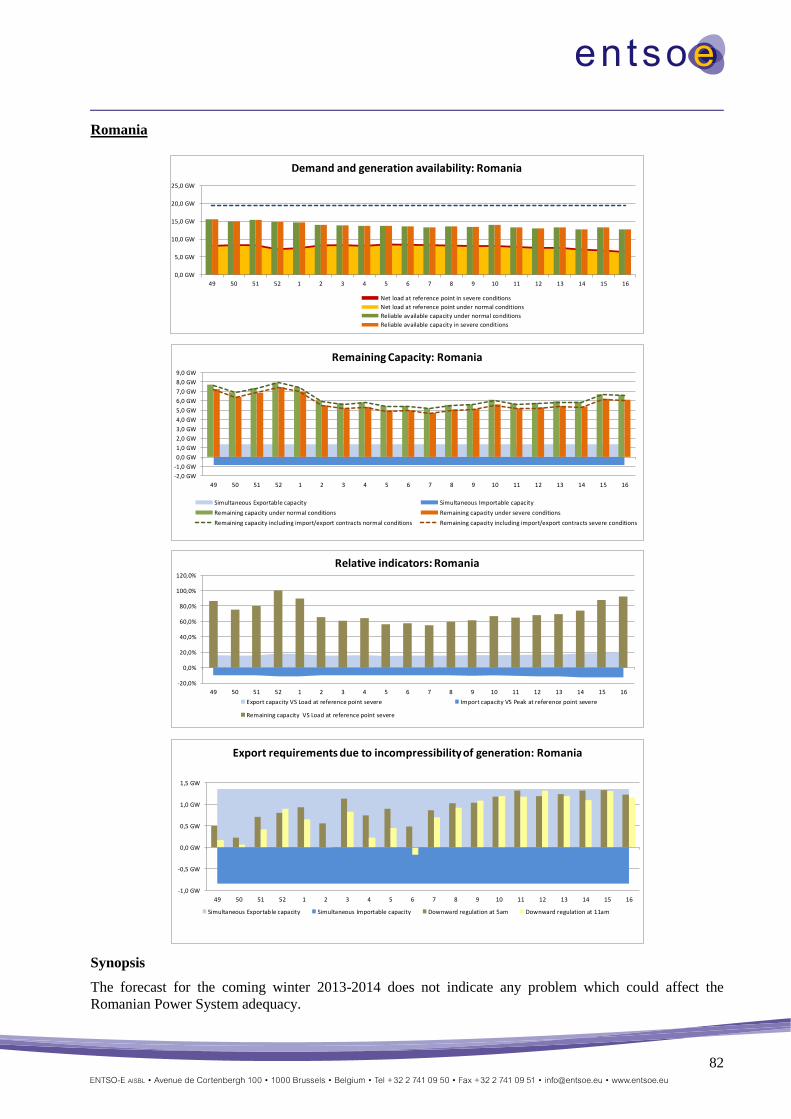
82
Romania
Synopsis
The forecast for the coming winter 2013-2014 does not indicate any problem which could affect the
Romanian Power System adequacy.
0,0 GW
5,0 GW
10,0 GW
15,0 GW
20,0 GW
25,0 GW
49 50 51 52 1 2 3 4 5 6 7 8 9 10 11 12 13 14 15 16
Demand and generation availability: Romania
Net load at reference point in severe conditions
Net load at reference point under normal conditions
Reliable available capacity under normal conditions
Reliable available capacity in severe conditions
-2,0 GW
-1,0 GW
0,0 GW
1,0 GW
2,0 GW
3,0 GW
4,0 GW
5,0 GW
6,0 GW
7,0 GW
8,0 GW
9,0 GW
49 50 51 52 1 2 3 4 5 6 7 8 9 10 11 12 13 14 15 16
Remaining Capacity: Romania
Simultaneous Exportable capacity Simultaneous Importable capacity
Remaining capacity under normal conditions Remaining capacity under severe conditions
Remaining capacity including import/export contracts normal conditions Remaining capacity including import/export contracts severe conditions
-20,0%
0,0%
20,0%
40,0%
60,0%
80,0%
100,0%
120,0%
49 50 51 52 1 2 3 4 5 6 7 8 9 10 11 12 13 14 15 16
Relative indicators: Romania
Export capacity VS Load at reference point severe Import capacity VS Peak at reference point severe
Remaining capacity VS Load at reference point severe
-1,0 GW
-0,5 GW
0,0 GW
0,5 GW
1,0 GW
1,5 GW
49 50 51 52 1 2 3 4 5 6 7 8 9 10 11 12 13 14 15 16
Export requirements due to incompressibility of generation: Romania
Simultaneous Exportable capacity Simultaneous Importable capacity Downward regulation at 5am Downward regulation at 11am
83
The remaining capacity can cover any unit tripping which exceed the expected value for outages in either
case for a normal or a severe winter.
A consumption value higher than the estimation for a severe winter can be managed by the remaining
capacity as well.
General situation
The maintenance units program was performed mainly during the summer period. However we do not
expect critical time intervals.
Most critical periods
During the winter 2013-2014, we do not expect critical time intervals.
Expected role of interconnections
For the coming winter the expected and the main role of the interconnectors between Romania and its
neighbours is to facilitate the performing of the commercial exchange power. Usually the role of
interconnections is to support the exports for commercial purposes. However, for certain hour intervals
during the day imports may occur due to the market conditions.
In case of generation adequacy problems there are bilateral agreements with certain neighbours in order to
provide emergency exchange power.
As usual, the interconnection capacities will be used only in the range of the NTC values offered to the
market. In the past, for a high renewables generation an increased level of export was observed. On the
other hand, there are market rules and procedures in order to avoid unplanned exports when it could be an
excess of inflexible generation at minimum demand hour.
Framework and methodology of the assessments
At national level there is a Winter Program to ensure the Power System reliability and stability during the
winter season, which is approved by the Romanian Government. The main purpose of the Winter Program
is to evaluate the consumption for the time interval between October 2013 and March 2014 in order to
cover its forecast in terms of quality and safety feeding in the context of the safe and stable operation of the
Romanian Power System. It was taking into account a 2.4 % consumption growth for the winter 2013-2014
regard to previous one. This program foresees the necessary fuel stocks to be got during July-September
2013 for the proper operation of the thermal power plants during the winter season, taking into account
even the necessary ancillary services. Also this program foresees that the maintenance programs for the
thermal power plants and hydro power plants to be carried out during the summer season. The
Transelectrica’ s responsibilities as Romanian TSO in terms of the Winter Program is to approve the
carrying out of the maintenance plans for the generation units, in reliable operation conditions for the
Power System. Also according with national regulatory frame Transelectrica is the administrator for
balancing market, ancillary services market and cross-border capacities market.
Transelectrica does not foresee any risk for the coming winter taking into account the realization of the
Winter Program. The actual amount of the ancillary services copes with the intermittent generation of the
wind farms installed in Romanian Power System.
Serbia
General situation
During this winter it is not planned high level of maintenance and hydro levels are normal, therefore we
don't expect any issues.
Most critical periods
We don't expect any critical periods.
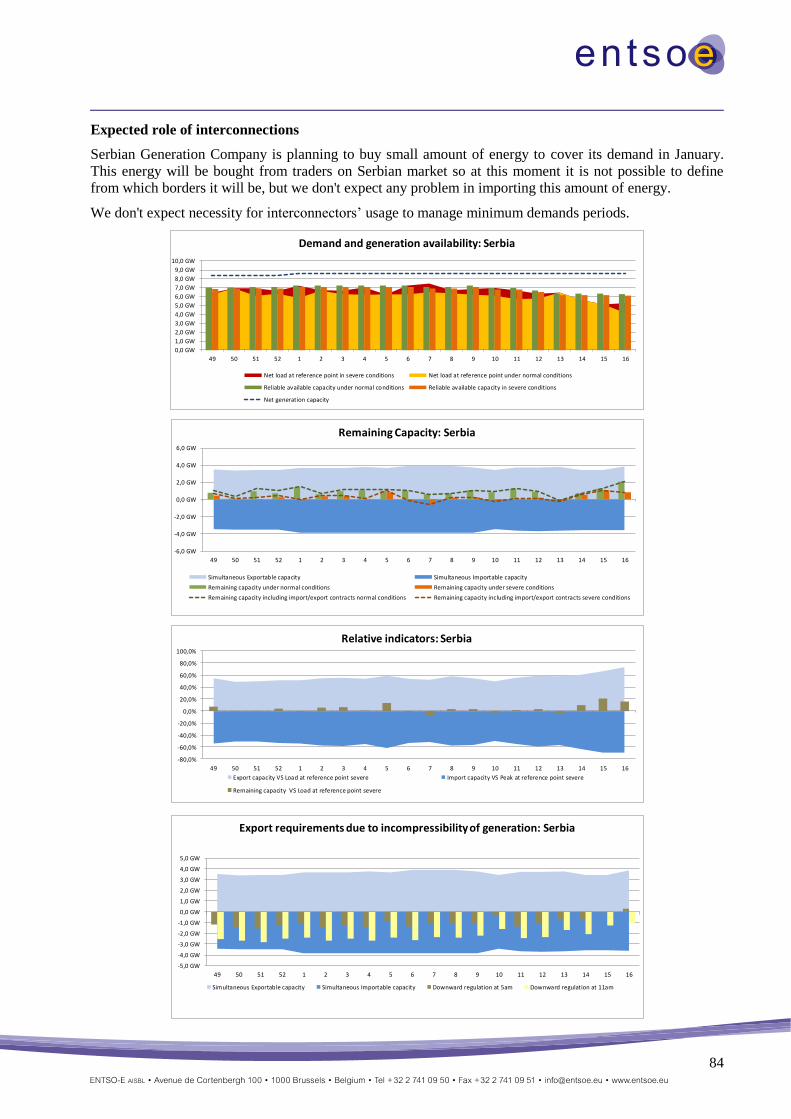
84
Expected role of interconnections
Serbian Generation Company is planning to buy small amount of energy to cover its demand in January.
This energy will be bought from traders on Serbian market so at this moment it is not possible to define
from which borders it will be, but we don't expect any problem in importing this amount of energy.
We don't expect necessity for interconnectors’ usage to manage minimum demands periods.
0,0 GW
1,0 GW
2,0 GW
3,0 GW
4,0 GW
5,0 GW
6,0 GW
7,0 GW
8,0 GW
9,0 GW
10,0 GW
49 50 51 52 1 2 3 4 5 6 7 8 9 10 11 12 13 14 15 16
Demand and generation availability: Serbia
Net load at reference point in severe conditions Net load at reference point under normal conditions
Reliable available capacity under normal conditions Reliable available capacity in severe conditions
Net generation capacity
-6,0 GW
-4,0 GW
-2,0 GW
0,0 GW
2,0 GW
4,0 GW
6,0 GW
49 50 51 52 1 2 3 4 5 6 7 8 9 10 11 12 13 14 15 16
Remaining Capacity: Serbia
Simultaneous Exportable capacity Simultaneous Importable capacity
Remaining capacity under normal conditions Remaining capacity under severe conditions
Remaining capacity including import/export contracts normal conditions Remaining capacity including import/export contracts severe conditions
-80,0%
-60,0%
-40,0%
-20,0%
0,0%
20,0%
40,0%
60,0%
80,0%
100,0%
49 50 51 52 1 2 3 4 5 6 7 8 9 10 11 12 13 14 15 16
Relative indicators: Serbia
Export capacity VS Load at reference point severe Import capacity VS Peak at reference point severe
Remaining capacity VS Load at reference point severe
-5,0 GW
-4,0 GW
-3,0 GW
-2,0 GW
-1,0 GW
0,0 GW
1,0 GW
2,0 GW
3,0 GW
4,0 GW
5,0 GW
49 50 51 52 1 2 3 4 5 6 7 8 9 10 11 12 13 14 15 16
Export requirements due to incompressibility of generation: Serbia
Simultaneous Exportable capacity Simultaneous Importable capacity Downward regulation at 5am Downward regulation at 11am
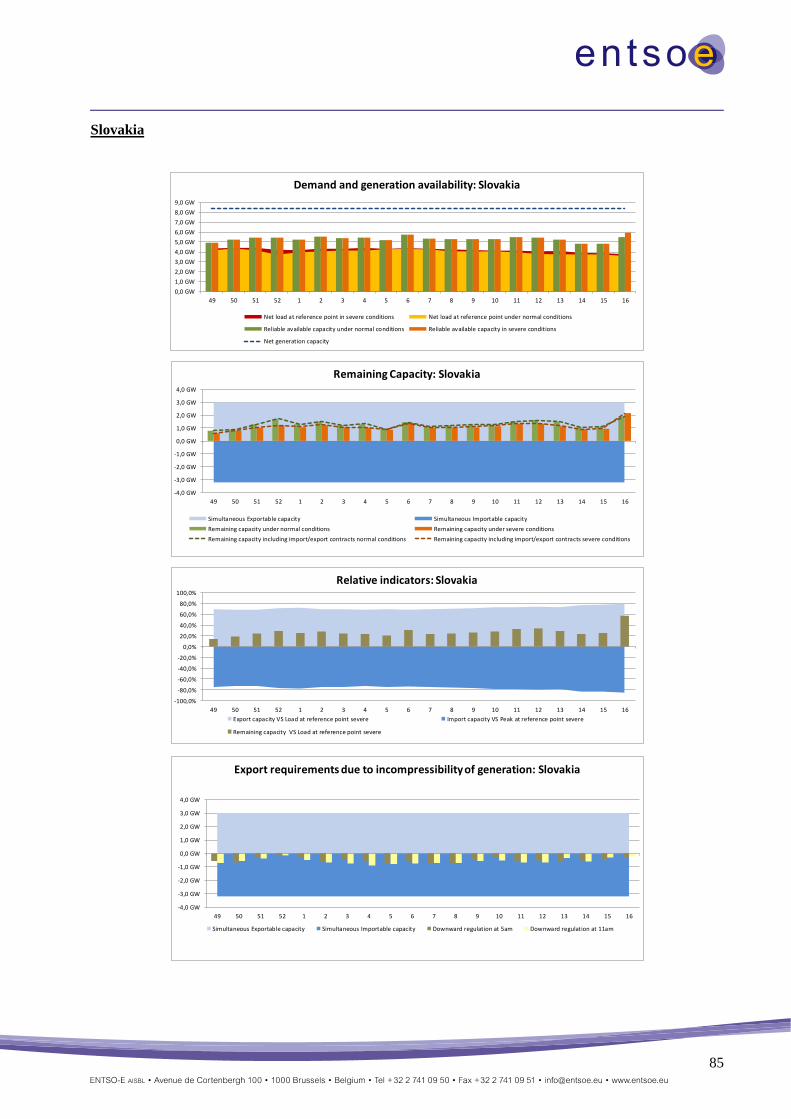
85
Slovakia
0,0 GW
1,0 GW
2,0 GW
3,0 GW
4,0 GW
5,0 GW
6,0 GW
7,0 GW
8,0 GW
9,0 GW
49 50 51 52 1 2 3 4 5 6 7 8 9 10 11 12 13 14 15 16
Demand and generation availability: Slovakia
Net load at reference point in severe conditions Net load at reference point under normal conditions
Reliable available capacity under normal conditions Reliable available capacity in severe conditions
Net generation capacity
-4,0 GW
-3,0 GW
-2,0 GW
-1,0 GW
0,0 GW
1,0 GW
2,0 GW
3,0 GW
4,0 GW
49 50 51 52 1 2 3 4 5 6 7 8 9 10 11 12 13 14 15 16
Remaining Capacity: Slovakia
Simultaneous Exportable capacity Simultaneous Importable capacity
Remaining capacity under normal conditions Remaining capacity under severe conditions
Remaining capacity including import/export contracts normal conditions Remaining capacity including import/export contracts severe conditions
-100,0%
-80,0%
-60,0%
-40,0%
-20,0%
0,0%
20,0%
40,0%
60,0%
80,0%
100,0%
49 50 51 52 1 2 3 4 5 6 7 8 9 10 11 12 13 14 15 16
Relative indicators: Slovakia
Export capacity VS Load at reference point severe Import capacity VS Peak at reference point severe
Remaining capacity VS Load at reference point severe
-4,0 GW
-3,0 GW
-2,0 GW
-1,0 GW
0,0 GW
1,0 GW
2,0 GW
3,0 GW
4,0 GW
49 50 51 52 1 2 3 4 5 6 7 8 9 10 11 12 13 14 15 16
Export requirements due to incompressibility of generation: Slovakia
Simultaneous Exportable capacity Simultaneous Importable capacity Downward regulation at 5am Downward regulation at 11am
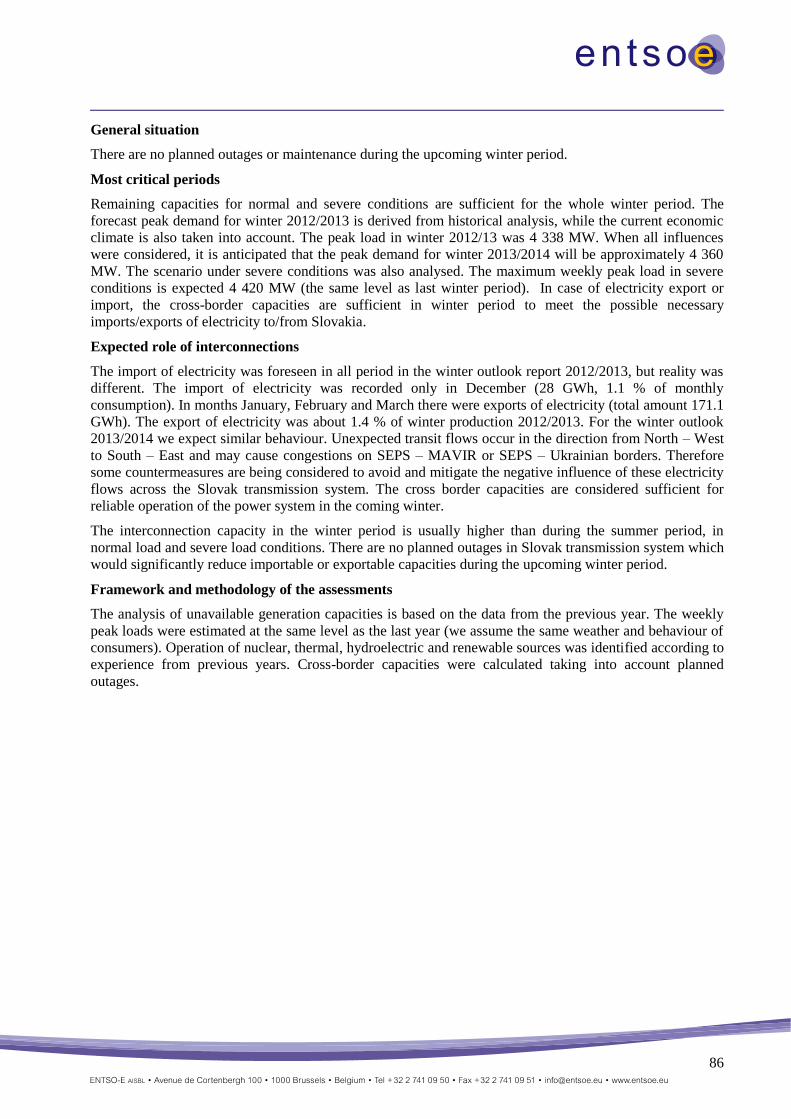
86
General situation
There are no planned outages or maintenance during the upcoming winter period.
Most critical periods
Remaining capacities for normal and severe conditions are sufficient for the whole winter period. The
forecast peak demand for winter 2012/2013 is derived from historical analysis, while the current economic
climate is also taken into account. The peak load in winter 2012/13 was 4 338 MW. When all influences
were considered, it is anticipated that the peak demand for winter 2013/2014 will be approximately 4 360
MW. The scenario under severe conditions was also analysed. The maximum weekly peak load in severe
conditions is expected 4 420 MW (the same level as last winter period). In case of electricity export or
import, the cross-border capacities are sufficient in winter period to meet the possible necessary
imports/exports of electricity to/from Slovakia.
Expected role of interconnections
The import of electricity was foreseen in all period in the winter outlook report 2012/2013, but reality was
different. The import of electricity was recorded only in December (28 GWh, 1.1 % of monthly
consumption). In months January, February and March there were exports of electricity (total amount 171.1
GWh). The export of electricity was about 1.4 % of winter production 2012/2013. For the winter outlook
2013/2014 we expect similar behaviour. Unexpected transit flows occur in the direction from North – West
to South – East and may cause congestions on SEPS – MAVIR or SEPS – Ukrainian borders. Therefore
some countermeasures are being considered to avoid and mitigate the negative influence of these electricity
flows across the Slovak transmission system. The cross border capacities are considered sufficient for
reliable operation of the power system in the coming winter.
The interconnection capacity in the winter period is usually higher than during the summer period, in
normal load and severe load conditions. There are no planned outages in Slovak transmission system which
would significantly reduce importable or exportable capacities during the upcoming winter period.
Framework and methodology of the assessments
The analysis of unavailable generation capacities is based on the data from the previous year. The weekly
peak loads were estimated at the same level as the last year (we assume the same weather and behaviour of
consumers). Operation of nuclear, thermal, hydroelectric and renewable sources was identified according to
experience from previous years. Cross-border capacities were calculated taking into account planned
outages.
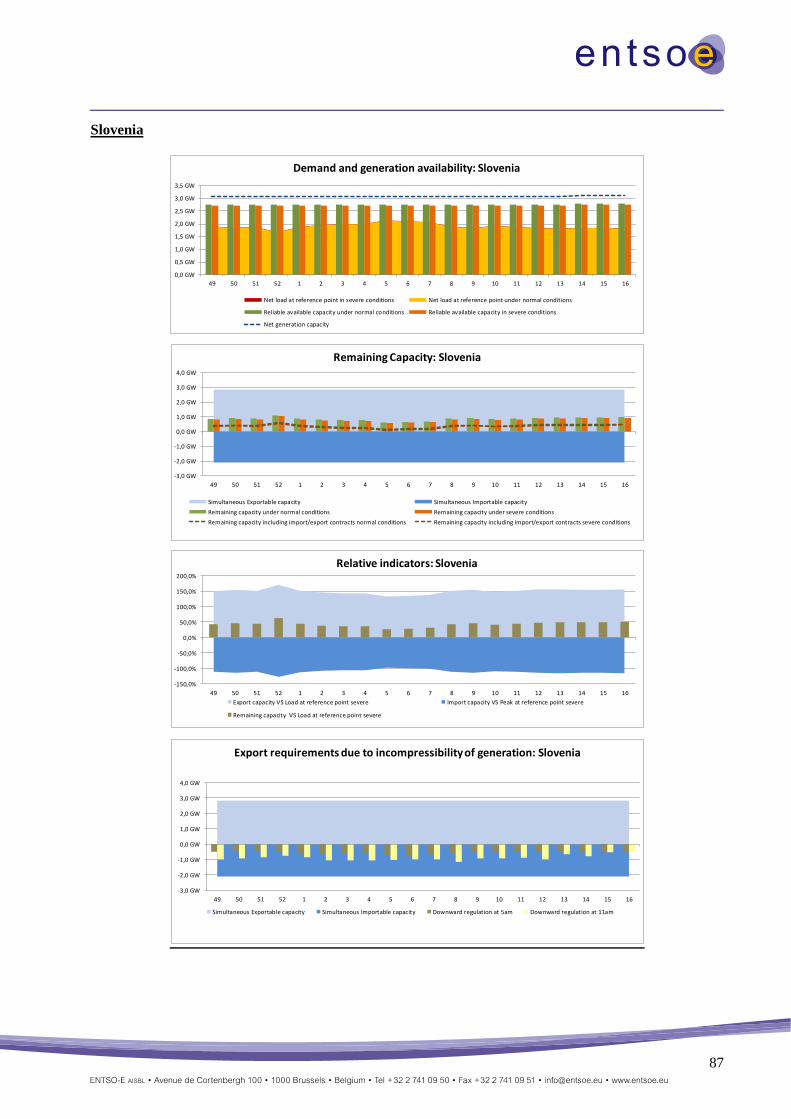
87
Slovenia
0,0 GW
0,5 GW
1,0 GW
1,5 GW
2,0 GW
2,5 GW
3,0 GW
3,5 GW
49 50 51 52 1 2 3 4 5 6 7 8 9 10 11 12 13 14 15 16
Demand and generation availability: Slovenia
Net load at reference point in severe conditions Net load at reference point under normal conditions
Reliable available capacity under normal conditions Reliable available capacity in severe conditions
Net generation capacity
-3,0 GW
-2,0 GW
-1,0 GW
0,0 GW
1,0 GW
2,0 GW
3,0 GW
4,0 GW
49 50 51 52 1 2 3 4 5 6 7 8 9 10 11 12 13 14 15 16
Remaining Capacity: Slovenia
Simultaneous Exportable capacity Simultaneous Importable capacity
Remaining capacity under normal conditions Remaining capacity under severe conditions
Remaining capacity including import/export contracts normal conditions Remaining capacity including import/export contracts severe conditions
-150,0%
-100,0%
-50,0%
0,0%
50,0%
100,0%
150,0%
200,0%
49 50 51 52 1 2 3 4 5 6 7 8 9 10 11 12 13 14 15 16
Relative indicators: Slovenia
Export capacity VS Load at reference point severe Import capacity VS Peak at reference point severe
Remaining capacity VS Load at reference point severe
-3,0 GW
-2,0 GW
-1,0 GW
0,0 GW
1,0 GW
2,0 GW
3,0 GW
4,0 GW
49 50 51 52 1 2 3 4 5 6 7 8 9 10 11 12 13 14 15 16
Export requirements due to incompressibility of generation: Slovenia
Simultaneous Exportable capacity Simultaneous Importable capacity Downward regulation at 5am Downward regulation at 11am

88
Spain
0,0 GW
20,0 GW
40,0 GW
60,0 GW
80,0 GW
100,0 GW
120,0 GW
49 50 51 52 1 2 3 4 5 6 7 8 9 10 11 12 13 14 15 16
Demand and generation availability: Spain
Net load at reference point in severe conditions Net load at reference point under normal conditions
Reliable available capacity under normal conditions Reliable available capacity in severe conditions
Net generation capacity
-10,0 GW
-5,0 GW
0,0 GW
5,0 GW
10,0 GW
15,0 GW
20,0 GW
25,0 GW
49 50 51 52 1 2 3 4 5 6 7 8 9 10 11 12 13 14 15 16
Remaining Capacity: Spain
Simultaneous Exportable capacity Simultaneous Importable capacity
Remaining capacity under normal conditions Remaining capacity under severe conditions
Remaining capacity including import/export contracts normal conditions Remaining capacity including import/export contracts severe conditions
-20,0%
-10,0%
0,0%
10,0%
20,0%
30,0%
40,0%
50,0%
49 50 51 52 1 2 3 4 5 6 7 8 9 10 11 12 13 14 15 16
Relative indicators: Spain
Export capacity VS Load at reference point severe Import capacity VS Peak at reference point severe
Remaining capacity VS Load at reference point severe
-5,0 GW
-4,0 GW
-3,0 GW
-2,0 GW
-1,0 GW
0,0 GW
1,0 GW
2,0 GW
3,0 GW
4,0 GW
5,0 GW
49 50 51 52 1 2 3 4 5 6 7 8 9 10 11 12 13 14 15 16
Export requirements due to incompressibility of generation: Spain
Simultaneous Exportable capacity Simultaneous Importable capacity Downward regulation at 5am Downward regulation at 11am

89
Synopsis
From the generation adequacy perspective, there’s no risk in the Spanish peninsular system for the
upcoming winter. Good generation/demand adequacy can be expected regardless imports from
neighbouring countries, and demand peak values are not expected to increase for upcoming winter.
The demand values have been still decreasing during 2013, after the significant drop that took place during
the last years, due to the economic and financial crisis. It is expected that the demand will start recovering
during the last months of 2013. However, the demand peak values are not expected to increase.
The hydro reserves are over their average level, due to the high infeeds that took place last spring. Given
the characteristics of the Spanish hydro system, with a great inter-annual and monthly variability regarding
hydro flows, a conservative estimation of available hydro power is advisable. The 90% percentile is
considered an accurate estimation.
The wind power covers a big amount of Spanish generation, being the installed wind power capacity about
20% of total generating capacity. For the assessing of the wind power generation under extreme conditions
during winter, historical data were used. Wind generation assessed is around 7% of available capacity.
Wind generation has been above this rate during winter periods with a frequency of 95%.
Solar PV energy is not taken into account when calculating generation capacity for winter peak demand,
given that winter peak demand values take place after the sunset. Only a residual value for thermal solar
generation is assessed (6 % of installed capacity).
The generating capacity of several power stations could be reduced due to network capacity constraints.
However, these constraints have been significantly reduced with installation of operational inter-tripping
equipment.
In the case of simultaneous extreme peak demand, very low wind generation (less than 8% of wind installed
capacity), very drought conditions and a very high thermal forced outage rate, the values of remaining
capacity would be still over 8700 MW.
At minimum demand periods, with high amounts of renewable production, power surplus with spilling of
RES can take place. The Spanish TSO has a specific control centre for renewable sources (CECRE), which
is permanently monitoring the renewable production. Downward regulation reserves may be composed by
renewable power plants; first thermal production is reduced upon security criteria compliance. If additional
reduction is needed, RES Control Centre (CECRE) sends a new setpoint and supervises renewable
production to maintain a balanced situation. The export capacity of interconnectors is a key factor in order
to avoid curtailment of renewable energy, mainly wind power. However, given the short exporting capacity
from the Iberian Peninsula to north Europe, it’s necessary to point out the importance of demand
management and energy storage – mainly hydro pump storage plants – in order to properly manage the
excess of inflexible power at minimum demand periods. Nowadays the installed capacity of hydro pump
storage plants in Spain is around 5000 MW.
General situation
From the generation adequacy perspective, there’s no detected risk situation in the Spanish peninsular
system for the upcoming winter. Good generation/demand adequacy can be expected regardless imports
from neighbouring countries. If average conditions are considered, remaining capacity will be over 15800
MW. In the case of simultaneous extreme peak demand, very low wind generation (less than 8% of wind
installed capacity), very drought conditions and a high thermal forced outage rate, assessed remaining
capacity is still over 8700 MW.
The most important risk factors for the next winter in the Spanish system are hydro and wind conditions,
sensitivity of load to temperature in extreme weather conditions and gas availability to combined cycle
thermal plants during situations of low RES.
90
Most critical periods
Given that there’s not risk situation concerning generation adequacy, the period with lowest remaining
capacity is the first half of December. Concerning minimum demand periods with high probability of RES
spilling, March and April are the most critical months.
Expected role of interconnections
Good generation/demand adequacy can be expected for peak demand hours regardless imports from
neighbouring countries.
The export capacity of interconnectors is a key factor in order to avoid curtailment of renewable energy,
mainly wind power. However, given the short exporting capacity from the Iberian Peninsula to north
Europe, it’s necessary to point out the importance of demand management and energy storage –mainly
hydro pump storage plants- in order to properly manage the excess of inflexible power at minimum demand
periods. Nowadays the installed capacity of hydro pump storage plants in Spain is around 5000 MW.
Framework and methodology of the assessments
Besides the adequacy analysis explained above concerning peak demand values, an estimation of the energy
balance for the next 12 months is performed monthly by Spanish TSO.
Medium term system adequacy forecast is carried out using a hydrothermal coordination model with
stochastic dynamic programming that minimizes variable operation costs. The analysis is based on a
probabilistic tool where hydro stochastic behaviour and non-planned thermal outages are considered. In
addition, regional studies are performed looking for congestions.
The medium term forecast considers several hydro conditions, available thermal capacity and wind
production scenarios.
All scenarios are built under the following assumptions:
‒ Overhaul planning notified by generators for the upcoming winter.
‒ Guaranteed fuel (gas) supply to combined cycle and gas thermal plants.
‒ Low wind conditions: wind generation considered is around 7% of available capacity. Wind generation
has been above this rate with a probability of 95%.
Extremely severe conditions for the system are simulated as:
‒ Extreme demand due to severe weather conditions, typically very low temperatures
‒ Severe drought conditions. Significant non-usable hydro capacity due to lack of water in the reservoirs.
‒ No import capacity is considered in the study in severe conditions. So, it is not taken into account in
the load - generation balance.
Sweden
Synopsis
For the upcoming winter, 2013/2014, Svenska Kraftnät predicts that Sweden as a whole will have the
possibility to meet the domestic electricity demand with domestic production both during a normal winter
and a severe winter (a winter that happens statistically one in ten years). The domestic winter adequacy
forecast is however a bit more optimistic than the Winter Outlook forecast. In the Winter Outlook forecast
Sweden will need to import approximately 2 GW during peak load in severe conditions.
Peak load demand is expected to be a little higher the coming winter than the winter before. The increase is
explained by a slightly stronger economy, mainly affecting the industrial electricity demand. The largest
industrial consumers in Sweden are the pulp and paper mills. The peak load in Sweden is statistically
occurring in between 17:00 and 18:00 CET, but the load at 19:00 is usually practically equal (99.6 % in
average when looking at 2011), so the scenarios in the Winter Outlook forecast does very well represent the
most strained hours for the Swedish power balance.

91
General situation
Like last year, the most critical factor in predicting the Swedish domestic power balance is the availability
of the Swedish nuclear power. Due to a comprehensive security upgrade in one of the Swedish NPP’s 0.64
GW (or 7 % of total Swedish NPP capacity) will be unavailable all winter. Svenska Kraftnät has estimated
that the availability of Swedish nuclear power needs to be at least 80 % for Sweden to be self-supporting
during peak load.
Due to a dry summer the hydro power reservoir levels in Sweden are, at present in early autumn,
approximately 10 percentage points below average. This is not alarmingly low.
The transmission capacity from northern to southern Sweden is of great importance to the Swedish power
balance as almost all hydro production is located up north but most of the demand is located in the south.
For that reason Svenska Kraftnät avoids all maintenance work which reduces the north to south transfer
capacity during the winter period as not to increase the risk of power shortages. A reduced availability of
nuclear also reduces the transmission capacity in the Swedish grid, why it is of great importance to Svenska
Kraftnät that the nuclear plants are up and running.
To secure the momentary generation adequacy Svenska Kraftnät contracts a peak load reserve for every
winter period (16th of November to 15th of March) consisting of production reserves and load reduction
reserves. The peak load reserve can be activated on the Nordic electricity market, Nord Pool Spot (NPS),
when there is a risk for curtailment. This happens very rarely, last time was 2009 and according to NPS
there has been little risk of curtailment since then. The peak load reserve is mainly activated by Svenska
Kraftnät during operation for balancing purposes. This winter the peak load reserve consists of 0.958 GW
production capacity and 0.531 GW load reduction. The peak load reserve consists exclusively of reserve
bids that most likely would not be available to the electricity market without the economic compensation
they are paid to be available as peak load reserves.
Most critical periods
Maintenance work on grid elements or production units that might jeopardize generation adequacy or
transfer capacity is avoided as far as possible during the winter period. The electricity demand in Sweden is
strongly dependent on outside temperatures. Peak load occurs at periods with very cold weather and these
periods might happen at any time between December and March, therefore it is difficult to point out in
advance which weeks are expected to be most critical.
Expected role of interconnections
Although Svenska Kraftnät predicts Sweden to be independent of import during normal winter conditions
(for the peak load hour), the interconnectors plays an important role. Looking at previous winter periods
with very high demand Sweden has repeatedly been importing power from Norway and Denmark, and
exporting power to Finland. The interconnectors help to keep electricity prices on decent levels and are also
very important for balancing purposes (to enable exchanging balancing power between the Nordic
countries).
Sweden does not have any problems with excess of inflexible generation at winter time.
Framework and methodology of the assessments
Weekly peak load figures come from the domestic adequacy report. These numbers are updated once a year
with a model based on the total electricity consumption the last 52 weeks. Weekly minimum demand is
based on statistics. Planned maintenance is based on market messages to Nord Pool Spot. Outage rates are
based on experience and previous studies.
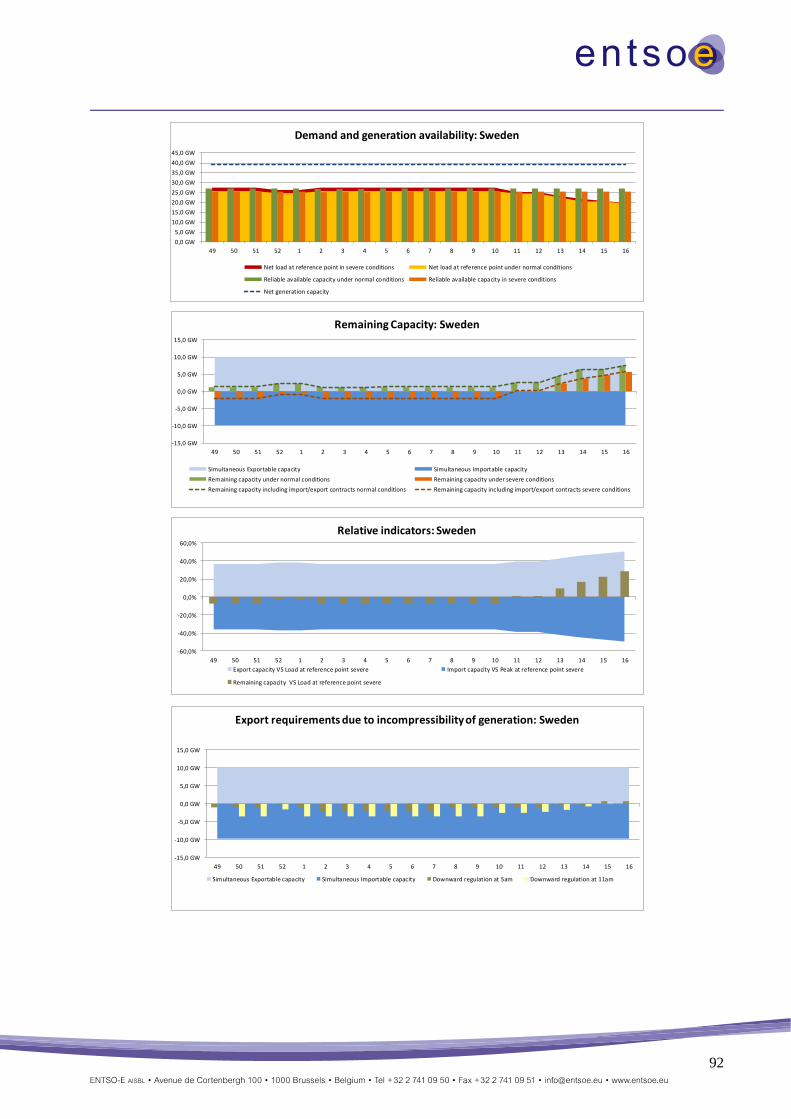
92
0,0 GW
5,0 GW
10,0 GW
15,0 GW
20,0 GW
25,0 GW
30,0 GW
35,0 GW
40,0 GW
45,0 GW
49 50 51 52 1 2 3 4 5 6 7 8 9 10 11 12 13 14 15 16
Demand and generation availability: Sweden
Net load at reference point in severe conditions Net load at reference point under normal conditions
Reliable available capacity under normal conditions Reliable available capacity in severe conditions
Net generation capacity
-15,0 GW
-10,0 GW
-5,0 GW
0,0 GW
5,0 GW
10,0 GW
15,0 GW
49 50 51 52 1 2 3 4 5 6 7 8 9 10 11 12 13 14 15 16
Remaining Capacity: Sweden
Simultaneous Exportable capacity Simultaneous Importable capacity
Remaining capacity under normal conditions Remaining capacity under severe conditions
Remaining capacity including import/export contracts normal conditions Remaining capacity including import/export contracts severe conditions
-60,0%
-40,0%
-20,0%
0,0%
20,0%
40,0%
60,0%
49 50 51 52 1 2 3 4 5 6 7 8 9 10 11 12 13 14 15 16
Relative indicators: Sweden
Export capacity VS Load at reference point severe Import capacity VS Peak at reference point severe
Remaining capacity VS Load at reference point severe
-15,0 GW
-10,0 GW
-5,0 GW
0,0 GW
5,0 GW
10,0 GW
15,0 GW
49 50 51 52 1 2 3 4 5 6 7 8 9 10 11 12 13 14 15 16
Export requirements due to incompressibility of generation: Sweden
Simultaneous Exportable capacity Simultaneous Importable capacity Downward regulation at 5am Downward regulation at 11am
93
Switzerland
Synopsis
With the current adequacy method, no specific problem is to be expected.
General situation
No problems are expected.
Expected role of interconnections
As shown by the figures, this is not relevant.
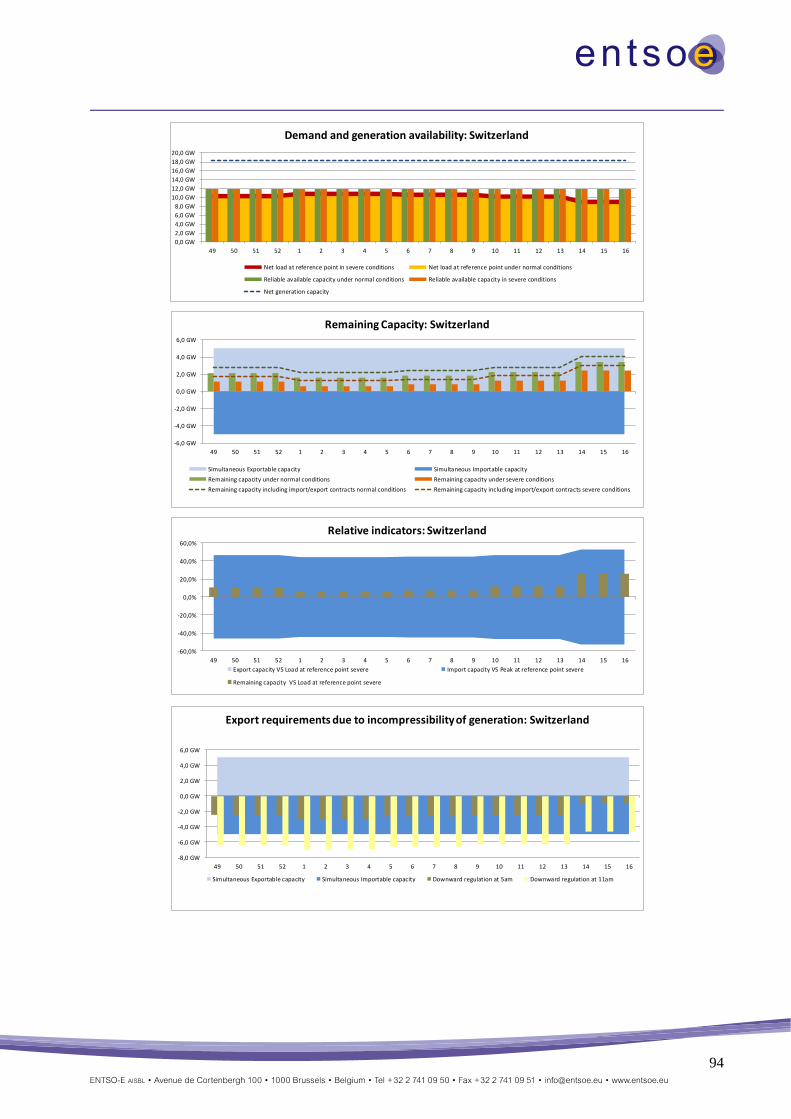
94
0,0 GW
2,0 GW
4,0 GW
6,0 GW
8,0 GW
10,0 GW
12,0 GW
14,0 GW
16,0 GW
18,0 GW
20,0 GW
49 50 51 52 1 2 3 4 5 6 7 8 9 10 11 12 13 14 15 16
Demand and generation availability: Switzerland
Net load at reference point in severe conditions Net load at reference point under normal conditions
Reliable available capacity under normal conditions Reliable available capacity in severe conditions
Net generation capacity
-6,0 GW
-4,0 GW
-2,0 GW
0,0 GW
2,0 GW
4,0 GW
6,0 GW
49 50 51 52 1 2 3 4 5 6 7 8 9 10 11 12 13 14 15 16
Remaining Capacity: Switzerland
Simultaneous Exportable capacity Simultaneous Importable capacity
Remaining capacity under normal conditions Remaining capacity under severe conditions
Remaining capacity including import/export contracts normal conditions Remaining capacity including import/export contracts severe conditions
-60,0%
-40,0%
-20,0%
0,0%
20,0%
40,0%
60,0%
49 50 51 52 1 2 3 4 5 6 7 8 9 10 11 12 13 14 15 16
Relative indicators: Switzerland
Export capacity VS Load at reference point severe Import capacity VS Peak at reference point severe
Remaining capacity VS Load at reference point severe
-8,0 GW
-6,0 GW
-4,0 GW
-2,0 GW
0,0 GW
2,0 GW
4,0 GW
6,0 GW
49 50 51 52 1 2 3 4 5 6 7 8 9 10 11 12 13 14 15 16
Export requirements due to incompressibility of generation: Switzerland
Simultaneous Exportable capacity Simultaneous Importable capacity Downward regulation at 5am Downward regulation at 11am
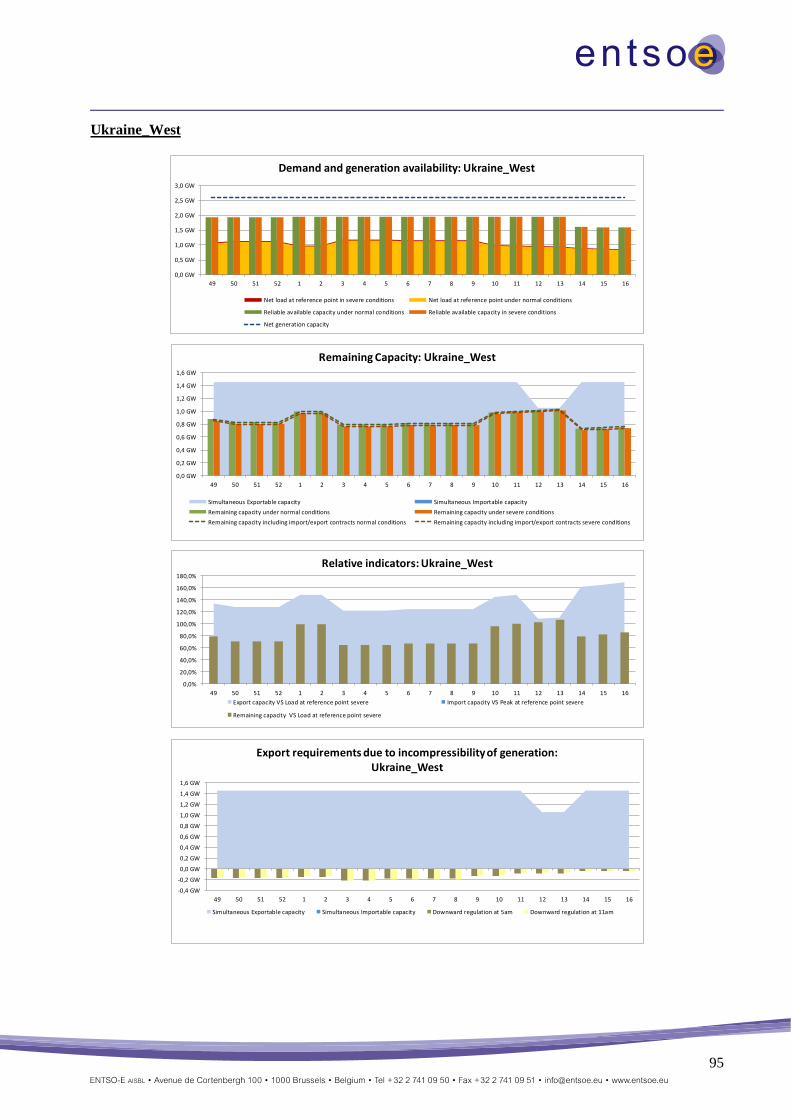
95
Ukraine_West
0,0 GW
0,5 GW
1,0 GW
1,5 GW
2,0 GW
2,5 GW
3,0 GW
49 50 51 52 1 2 3 4 5 6 7 8 9 10 11 12 13 14 15 16
Demand and generation availability: Ukraine_West
Net load at reference point in severe conditions Net load at reference point under normal conditions
Reliable available capacity under normal conditions Reliable available capacity in severe conditions
Net generation capacity
0,0 GW
0,2 GW
0,4 GW
0,6 GW
0,8 GW
1,0 GW
1,2 GW
1,4 GW
1,6 GW
49 50 51 52 1 2 3 4 5 6 7 8 9 10 11 12 13 14 15 16
Remaining Capacity: Ukraine_West
Simultaneous Exportable capacity Simultaneous Importable capacity
Remaining capacity under normal conditions Remaining capacity under severe conditions
Remaining capacity including import/export contracts normal conditions Remaining capacity including import/export contracts severe conditions
0,0%
20,0%
40,0%
60,0%
80,0%
100,0%
120,0%
140,0%
160,0%
180,0%
49 50 51 52 1 2 3 4 5 6 7 8 9 10 11 12 13 14 15 16
Relative indicators: Ukraine_West
Export capacity VS Load at reference point severe Import capacity VS Peak at reference point severe
Remaining capacity VS Load at reference point severe
-0,4 GW
-0,2 GW
0,0 GW
0,2 GW
0,4 GW
0,6 GW
0,8 GW
1,0 GW
1,2 GW
1,4 GW
1,6 GW
49 50 51 52 1 2 3 4 5 6 7 8 9 10 11 12 13 14 15 16
Export requirements due to incompressibility of generation: Ukraine_West
Simultaneous Exportable capacity Simultaneous Importable capacity Downward regulation at 5am Downward regulation at 11am
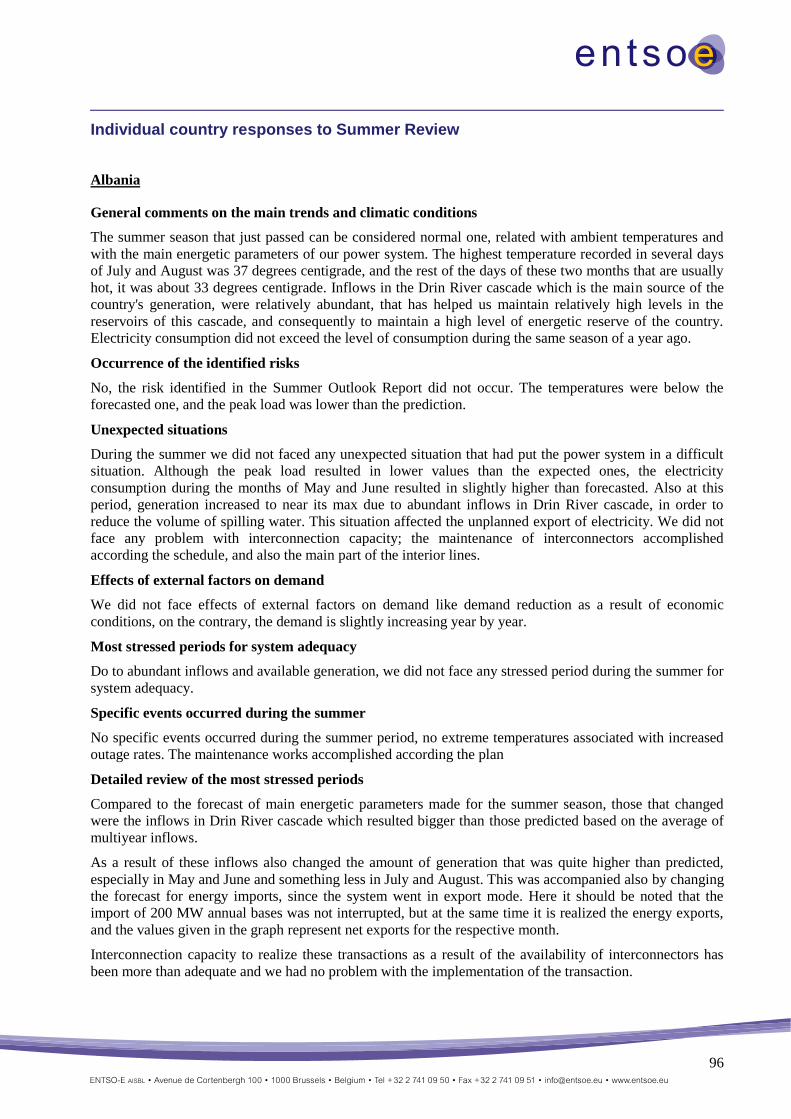
96
Individual country responses to Summer Review
Albania
General comments on the main trends and climatic conditions
The summer season that just passed can be considered normal one, related with ambient temperatures and
with the main energetic parameters of our power system. The highest temperature recorded in several days
of July and August was 37 degrees centigrade, and the rest of the days of these two months that are usually
hot, it was about 33 degrees centigrade. Inflows in the Drin River cascade which is the main source of the
country's generation, were relatively abundant, that has helped us maintain relatively high levels in the
reservoirs of this cascade, and consequently to maintain a high level of energetic reserve of the country.
Electricity consumption did not exceed the level of consumption during the same season of a year ago.
Occurrence of the identified risks
No, the risk identified in the Summer Outlook Report did not occur. The temperatures were below the
forecasted one, and the peak load was lower than the prediction.
Unexpected situations
During the summer we did not faced any unexpected situation that had put the power system in a difficult
situation. Although the peak load resulted in lower values than the expected ones, the electricity
consumption during the months of May and June resulted in slightly higher than forecasted. Also at this
period, generation increased to near its max due to abundant inflows in Drin River cascade, in order to
reduce the volume of spilling water. This situation affected the unplanned export of electricity. We did not
face any problem with interconnection capacity; the maintenance of interconnectors accomplished
according the schedule, and also the main part of the interior lines.
Effects of external factors on demand
We did not face effects of external factors on demand like demand reduction as a result of economic
conditions, on the contrary, the demand is slightly increasing year by year.
Most stressed periods for system adequacy
Do to abundant inflows and available generation, we did not face any stressed period during the summer for
system adequacy.
Specific events occurred during the summer
No specific events occurred during the summer period, no extreme temperatures associated with increased
outage rates. The maintenance works accomplished according the plan
Detailed review of the most stressed periods
Compared to the forecast of main energetic parameters made for the summer season, those that changed
were the inflows in Drin River cascade which resulted bigger than those predicted based on the average of
multiyear inflows.
As a result of these inflows also changed the amount of generation that was quite higher than predicted,
especially in May and June and something less in July and August. This was accompanied also by changing
the forecast for energy imports, since the system went in export mode. Here it should be noted that the
import of 200 MW annual bases was not interrupted, but at the same time it is realized the energy exports,
and the values given in the graph represent net exports for the respective month.
Interconnection capacity to realize these transactions as a result of the availability of interconnectors has
been more than adequate and we had no problem with the implementation of the transaction.
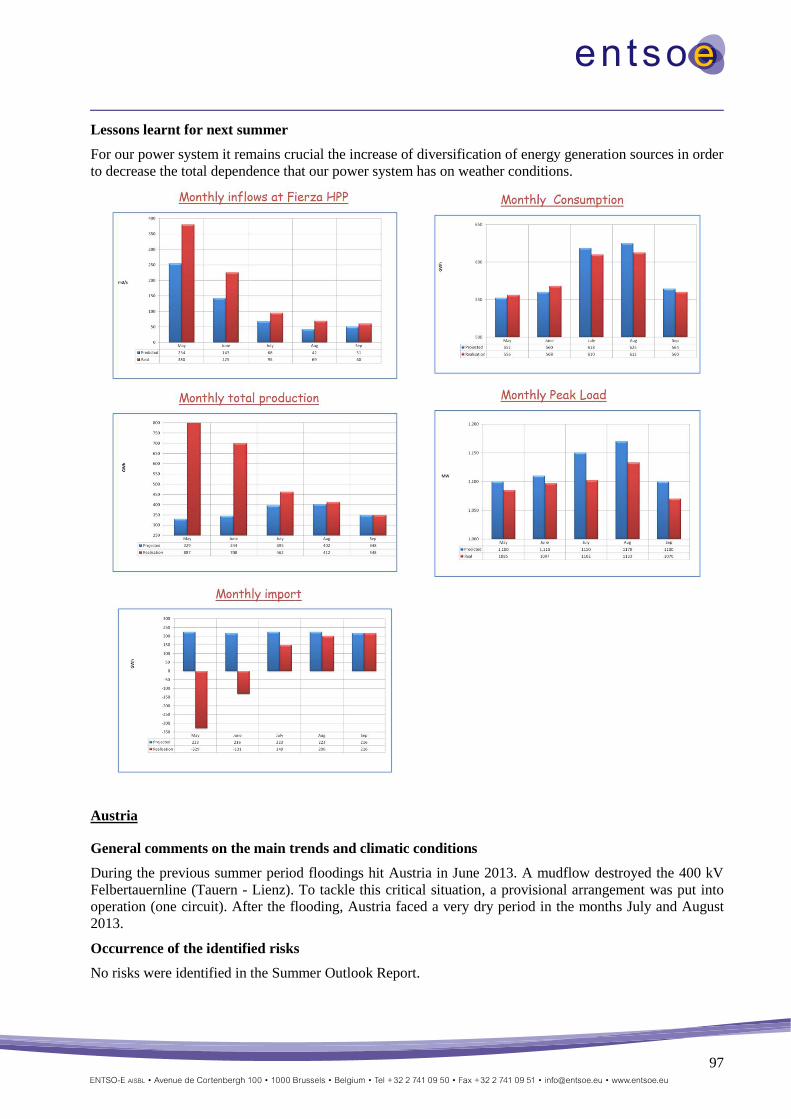
97
Lessons learnt for next summer
For our power system it remains crucial the increase of diversification of energy generation sources in order
to decrease the total dependence that our power system has on weather conditions.
Austria
General comments on the main trends and climatic conditions
During the previous summer period floodings hit Austria in June 2013. A mudflow destroyed the 400 kV
Felbertauernline (Tauern - Lienz). To tackle this critical situation, a provisional arrangement was put into
operation (one circuit). After the flooding, Austria faced a very dry period in the months July and August
2013.
Occurrence of the identified risks
No risks were identified in the Summer Outlook Report.
98
Unexpected situations
During the flooding period in June 2013, run of river production dropped down sharply. Due to low prices
almost no thermal production unit fed in. During this period and in the following dry period high imports
occurred.
During the summer period the line along the Danube river (Kronsdorf - St. Peter) were switched
successfully from 220 kV to 400 kV. In order to stabilise the grid, energy production of one thermal unit in
the east of Austria was needed.
Most stressed periods for system adequacy
No periods of stress occurred during the summer period.
Specific events occurred during the summer
In June 2013 floodings hit Austria in June 2013. A mudflow destroyed the 400 kV Felbertauernline (Tauern
- Lienz). To tackle this critical situation, a provisional arrangement was put into operation (one circuit).
After the flooding, Austria faced a very dry period in the months July and August 2013.
Bosnia and Herzegovina
General comments on the main trends and climatic conditions
During the summer period of 2013 there were no significant unusual events in the power system of Bosnia
and Herzegovina. The minimum load of 895 MW was registered on June 30 at 6:00, while maximum load
was registered on August 7 at 22:00 and it was 1760 MW. Monthly power balances were positive during
this period.
Belgium
General comments on the main trends and climatic conditions
Generally a quite warm summer was experienced, however without extreme conditions as for example an
extended period of drought.
Occurrence of the identified risks
Not entirely, due to the fact that following the return in service of all nuclear units and to avoid issues with
an excess of generation, maintenance on another larger nuclear unit was scheduled during the most stressed
vacation period, lessening the amount of inflexible generation, and consequently avoiding the largest issues
for downward adequacy.
Unexpected situations
None.
Effects of external factors on demand
It is estimated that up to date the effect of external factors (as the market price) on the demand is still quite
limited. However, distributed generation starts acting more and more on market and imbalance prices.
Most stressed periods for system adequacy
Issues regarding downward adequacy were mostly experienced on weekend days and nights. Enough
measures were however available to resolve the issues and to incentivize the market to resolve system
imbalances.
Specific events occurred during the summer
None.
99
Bulgaria
General comments on the main trends and climatic conditions
The electricity demand for the summer period June – August 2013 decreased by 0.9 % compared with the
same period of 2012 (comparison based on normal temperature-adjusted monthly consumptions).
Temperature conditions were near normal and only one heat wave was observed during July. The hottest
working day was 30 July (Tuesday) with temperatures: Tmin = 19.7 ˚C, Tave=26.4 ˚C, Tmax=33.9 ˚C. For
this day the peak load was 4652 MW (observed at 02:00 p.m.) and the daily consumption: 96402 MWh.
We experienced balancing problems during clear skies days because of the high PV generation (some days
with more than 700 MW). For this reason we had to cut this generation by 30 % for specific days and even
reduce the output from nuclear and thermal units usually operating in base load. The good thing was that
during hot days the high PV generation coincided with the high air-conditioning demand.
Failure rates of units were as expected and maintenance schedules were strictly fulfilled. Water levels in the
big reservoirs were slightly above target levels because of substantial rainfall during the period. Hydro
plants operated normally in the peak zone of the daily load curve.
There were no critical outages in the transmission network. During the whole period Bulgaria exported
electricity to neighbouring countries. There were no unplanned outages of all interconnection lines.
Croatia
General comments on the main trends and climatic conditions
Average summer air temperatures in Croatia were above the multi-annual average. Precipitation amounts in
whole Croatia were mainly below the average.
Occurrence of the identified risks
Periods with extremely high temperatures represented the risk for the system, but there was not any
significant interruption of supply or lack of generation.
Unexpected situations
There was not any such situation to be mentioned.
Effects of external factors on demand
Economy oriented to tourism, climate changes and greater use of air conditioning devices influence the
load. In summer 2013 maximum load was slightly lower than load in February 2013 which represents some
oddity for Croatian power system.
Specific events occurred during the summer
Extremely hot weather occurred at the end of July and beginning of August. The supply at that period was
normal due to imports and domestic generation realised according to the plans.
Detailed review of the most stressed periods
The most stressed period was from 5th till 11th August 2013. As a consequence of very hot weather, at that
period the load in Croatian power system reached the highest values. Since the domestic generation was
insufficient, the balance was achieved by increased import as it can be seen from Figure 11 and Figure 12.
Despite of challenging situation, Croatian consumers were normally supplied and transmission system
endured the transit flows also.

100
Figure 11: Load in the Croatian power system (5 - 11 August 2013)
Figure 12: Generation and import in the Croatian power system (5 - 11 August 2013)
Cyprus
General comments on the main trends and climatic conditions
Due to the effects of the financial crisis and also the mild weather conditions, the load demand was lower
than the expected level and there were no problems on the electrical system to meet the load demand.
Occurrence of the identified risks
No.
Unexpected situations
No.
Effects of external factors on demand
Due to the effects of the financial crisis and also the mild weather conditions that prevailed, the Peak
Demand observed was around 10% less than the predicted peak demand.
Most stressed periods for system adequacy
No stressed periods were observed.
Specific events occurred during the summer
Not Applicable.
101
Detailed review of the most stressed periods
No stressed periods were observed.
Czech Republic
General comments on the main trends and climatic conditions
The main factors influencing summer conditions were floods in the beginning of July and extremely high
temperatures in July and August.
Occurrence of the identified risks
No significant risks were identified in the Summer Outlook report.
Unexpected situations
Unexpected situations were represented by floods in the beginning of July and extremely high temperatures
in July and August, but they had no significant effect on the power system.
Effects of external factors on demand
Besides already mentioned floods there were not any other significant external factors with effects on
demand in CZ.
Specific events occurred during the summer
Specific events during the last summer period were floods in the beginning of July and extremely high
temperatures in July and August.
Detailed review of the most stressed periods
Floods in the beginning of July and extremely high temperatures in July and August were not expected.
However they did not have any significant effect on the power system.
Denmark
General comments on the main trends and climatic conditions
It was a normal summer without any major problems. During the summer, there have been some thunder
and lightning and this caused some disconnections of a few 150 kV and 132 kV lines. The disconnections
have not affected the supply to the consumers.
There have been a few scheduled disconnections due to maintenance and construction work. At Zealand, a
new 132 kV station has been put into operation and the handover of the 132 kV grids in Copenhagen have
been initiated. In addition, a new synchronous machine has been put into operation at the 400 kV station
Bjæverskov. The cable-laying of 150 kV equipment in Jutland has been initiated and the Kassø-Tjele
project is still running as scheduled and will require some outage. Furthermore, the yearly maintenance of
the 400 kV, 150 kV and 132 kV equipment has been carried out. However, there has not been tremendous
activity within this area. The effect balance during the summer has been fine. However, there has been a
single day where the effect balance was strained. This triggered significantly higher prices for three to four
hours. The reason for this price increase was a combination of a scheduled maintenance, which caused
limitations to the international tie lines, a breakdown and scheduled maintenances of power plants.
There have been no major problems keeping the voltage down. There have been major periods with
relatively large flows on our international connections and this has meant that the voltage has been fine
during the summer. During a few nights in July, it has been difficult to keep the voltage down though.
Some limitations have occurred on our international connections. This was partly caused by some
maintenance and project work carried out by Energinet.dk and partly comprehensive project work carried
102
out by all our neighbouring TSOs. This has caused a reduction in the trade capacity during some of the
summer months.
Estonia
General comments on the main trends and climatic conditions
The temperatures in June and August were higher than averagely, July temperatures were slightly lower
than average. The summer was quite dry. The forecasted peak loads were not exceeded and there was
enough production to cover the demand throughout the whole summer. As expected the summer was a very
stressed period for Estonia - Latvia/Russia interconnection, there occurred congestions throughout the
summer, as Estonia was exporting to south due to energy deficit in Latvia and Lithuania.
Occurrence of the identified risks
There occurred congestion on the Latvia –Estonia/Russia interconnection during large part of the summer.
The reason for congestion was that there is electricity deficit in Latvia and Lithuania, also in most of the
time, there was transit flow from Russia to Lithuania. In addition to that, during summer period, due to hot
weather conditions, the transmission capacity in Latvia-Estonia/Russia interconnection lines was reduced as
there is dependence between line capacities and air temperature. Estonian and Latvian TSO made counter
trades in order to avoid over loadings in cross border.
Finland
General comments on the main trends and climatic conditions
In summer 2013, temperatures were above average in Finland, especially in northern and eastern parts of
the country. Summer was quite dry, water reservoirs in North Finland were below average still in early
autumn.
Total consumption was little less compared to previous summers. The lowest load was 5000 MW and it was
recorded in week 25 during Midsummer Festival.
There was quite high import from Sweden, and import from Russia was at a low level as in previous
summer. Import capacity of Fenno-Skan interconnectors from Sweden was occasionally reduced to 800
MW and export capacity to 400 MW in June and July due to maintenance works in the Swedish grid.
Unexpected situations
At the week 37 Olkiluoto 2 nuclear power unit tripped and there were production problems also in Loviisa
1 nuclear unit resulting that only 45 % of Finnish nuclear power generation capacity was available at that
time. In addition, two big condensing power units were in maintenance. The Finnish power balance was
maintained by increase in other domestic generation and import.
Effects of external factors on demand
There were no remarkable changes in demand.
Detailed review of the most stressed periods
There were no major deviations from expectations. All incidents were managed with normal system
operation procedures.
Lessons learnt for next summer
In future, high output of inflexible generation combined with low load can cause adequacy problems.
Critical times would be especially Midsummer Festival days in June and holiday period in July.
103
France
General comments on the main trends and climatic conditions
The summer climatic conditions were in the average (0.4 °C over the normal conditions). The temperatures
were nevertheless contrasted between the different months: June was cold; July was hot, with a heat wave
in the 2 last week of July and August in the average. The precipitations were in the average.
Because of the low consumption in France and the low level of wind generation in Germany, the monthly
balance of RTE was in high export during all summer. The hydraulic generation units were more solicited
during the summer 2013 because of a good hydraulic reserve level after the high precipitations in the fall.
Occurrence of the identified risks
As identified in the Summer Outlook Report, no difficult situation occurred during the summer concerning
the balancing (no big heat wave and no lack of precipitation).
Unexpected situations
No unexpected situation arose during the summer.
Effects of external factors on demand
The high temperature of July had a positive effect on the consumption (+2% in average) in spite of the drop
of the industrial consumption.
On the contrary, with temperatures close to the normal conditions, the average consumption of August was
very low (historic level of low consumption).
Excluding the energy sector, the downward trend in industrial demand is offset by demand in the residential
and SME sector. Internal demand adjusted for climatic contingencies continued to follow a stable trend.
Most stressed periods for system adequacy
The most stressed period in terms of short term generation/demand balance was the third week of June with
a high generation and a low consumption. This situation lead to a lack of margin to reduce generation, but
there was no consequence on the security of supply.
Specific events occurred during the summer
In the end of July, the heat damaged many combined current and voltage transformers that caused the loss
of several lines and/or substations with a lot of cut offs.
Detailed review of the most stressed periods
No stressed period.
We noted:
‒ The nuclear generating fleet enjoyed higher levels of availability than those seen in 2012. There were
also high levels of hydro-electric generation for the season. Fossil fuel-based thermal generation has
risen slightly since May 2013, largely owing to the decline in wind generation.
‒ Excellent levels of sunshine saw the photovoltaic fleet achieve its best ever monthly results.
Conversely, wind conditions were particularly unfavourable in July and August for wind generation.
‒ France was a net exporter of electricity to all neighbouring countries. France's export balance remained
positive at all times during the months of July and August, and did not drop below 2000 MW at any
point during the month of August.
Lessons learnt for next summer
RTE will replace during the next years all the current and voltage transformers that could be damaged
during heat wave.
104
Concerning the forecast of the security of supply for next summers, RTE will also work on a better forecast
of stressed period for the margin available to reduce generation.
Great Britain
General comments on the main trends and climatic conditions
The following is taken from the summary of summer 2013, from the Met Office:
Mean temperatures over the UK were marginally below the long-term average during June but 1.9 °C
above during July. For much of July, high pressure was established across the UK bringing prolonged warm
and dry conditions across most of the country, the UK's most notable heat wave since July 2006. It is the
third warmest July in the UK since 1910. Rainfall was below average for both June (63%) and July (82%).
Sunshine was near normal in June, but July was a very sunny month with over 150% widely in western
areas and many days of unbroken sunshine. For the majority of the summer the wind output remained
below 50% of capacity.
Occurrence of the identified risks
The summer went as planned with no significant notable events. The risks of localised Margin issues due to
constraints were adequately managed without event and foot room was able to be provided on the minimum
demands.
Unexpected situations
There were a number of bipole trips on the French Interconnector (18 Aug, 28 Sept and 30 Sept)
Effects of external factors on demand
We have noticed that the underlying level of demand has decreased on the summer peak of the day by
around 400MW. We cannot identify the direct factors but are thought to be related to the increase in
embedded PV and wind generation as well as energy efficiency initiatives following economic conditions.
Most stressed periods for system adequacy
No notable periods.
Specific events occurred during the summer
We had high temperatures in July, about 2°C higher than average which lead to higher demands but these
were adequately met and hydro levels were unaffected even with the below average rainfall levels.
Detailed review of the most stressed periods
No notable periods of system stress.
Germany
General comments on the main trends and climatic conditions
After an already rainy and cold spring, at the beginning of June heavy rainfalls caused severe floods in
Southern and Eastern Germany. Thereby at some rivers new record water-levels were reached (also
endangering a substation). In the further course the summer 2013 was rather dry and warm but without long
periods of extreme heat. Therefore no problems with the cooling water supply of power plants occurred.
Occurrence of the identified risks
The shutdown of the nuclear power plants in 2011 still causes a shortage of available active and especially
reactive power. Particularly the tripping of nuclear power plants in Southern Germany had been considered
as critical in the Summer Outlook. The failure of the nuclear power plant Isar 2 on 28th June therefore
105
caused as expected problems with maintaining voltage levels within thresholds. Topological measures
were, however, sufficient to keep the situation under control.
Due to the commissioning of reactive power compensation units altogether the number of incidents with
voltage threshold violations was significantly lower than in the summer 2012.
Unexpected situations
No such situations occurred.
Effects of external factors on demand
No.
Most stressed periods for system adequacy
Not applicable.
Specific events occurred during the summer
Not applicable.
Detailed review of the most stressed periods
During the last summer the installed capacity of PV plants has further increased to a value of about 34 GW.
The German government has decided to stop subsidies for new PV plants when an installed capacity of 52
GW has been reached.
In July the produced amount of energy from PV plants reached a new maximum with 5129 GWh according
to estimations of the BDEW. On the 17th
June PV feed-in also reached a maximum value of 23 055 MW
for the first time. Furthermore in June the market value for energy from PV reached a historic minimum of
2.842 cents per kWh.
Since July, due to new regulations, the German TSOs are able to contract load reduction products. On
average 0.7 GW could be procured. Up to now no load reductions were actually activated.
Restructuring measures in the substation Großkrotzenburg led since May to a significant increase of grid
congestions (because of limitations of the East-West transport capacity) in this area, especially on the
double-circuit line Mecklar–Borken. Therefore a significant number of redispatch measures, including
Multilateral Remedial Actions, were necessary to prevent (n-1) violations. The restructuring works in
Grosskrotzenburg are scheduled until October 2016.
In order to increase the limited East-West transport capacity in this area shortly, 12 pylons of the line
Mecklar–Borken shall be heightened to increase the transport capacity until summer/autumn 2014.
Furthermore, Germany and Poland operated a pilot phase of virtual Phase Shifter (vPST) last winter and
spring, specifically between 8 January 2013 and 30 April 2013. The basis for the vPST mechanism was the
“Agreement on vPST on the profile Germany–Poland”, concluded between 50Hertz and PSE on 18
December 2012. vPST is a special cross-border redispatch regime to ensure secure interconnected system
operation and to provide limited commercial transfer capacities on the Polish import profile strengthening
cross border power trade. vPST complements the measures of the existing System Operation Agreement
between 50Hertz and PSE. In total, vPST measures were activated on 14 days during 132 hours. The
measures amounted to about 60 GWh of redispatching between the TSOs involved. The maximum volume
of hourly redispatching was experienced on 25 March and reached 1 600 MW. On this very day even such a
massive redispatch (at maximum available level, including also usage of generators from third TSOs
control areas) was not enough to keep flow on 50Hertz/PSE interface in a secure limits so several TSOs
were in alert state (not n-1 secure) for several hours. This case shows that operational countermeasures are
already exhausted from time to time and other solutions (in market design and system development areas)
are necessary to ensure security of the interconnected system on the Continent.
106
Lessons learnt for next summer
As usual, possible sources for cooling water problems and the development of renewables feed-in have to
be analysed carefully.
It would be appreciated if the format, contents and considered time interval would remain stable for more
than one report. The request for data has to come earlier during the year (beginning of July) to allow for
sufficient time for data collection in parallel to other reporting obligations of German TSOs during the
summer holiday period.
Greece
General comments on the main trends and climatic conditions
During last summer there were normal climatic conditions without something extreme and the temperature
ranged to normal level for the season.
Occurrence of the identified risks
There was nothing important.
Unexpected situations
The only problem arisen during the summer was the interconnection with Italy, due to the DC link between
IPTO and TERNA was out of operation for July and for August its availability was 200 MW instead 500
MW.
Effects of external factors on demand
The demand was lower comparing with previous years as we expected. The main reason was the very cool
summer resulted in little use of air conditioners and the economic state of the country. The percentage
reduction was 13% and 3% for July and August, respectively.
Most stressed periods for system adequacy
There was no stressed period referring the system adequacy.
Specific events occurred during the summer
The most important event was the exit of DC -link with Italy.
Detailed review of the most stressed periods
No stressed period.
Hungary
General comments on the main trends and climatic conditions
Summer of 2013 was calm for the Hungarian power system. There was no extremely high demand; the total
demand was slightly higher than in the last year. Outages of generators were rather low. The grid was
reliable and controllable.
Occurrence of the identified risks
We did not experience any significant event. Generator outages were under 500 MW in the whole summer
period.
Unexpected situations
There weren't any unexpected situations.
107
Effects of external factors on demand
‒ climate change
‒ holidays
Specific events occurred during the summer
The imports from neighbouring states were higher than in the last year.
Detailed review of the most stressed periods
There weren't any weeks, when the actual demand was more than 500 MW higher than the expected
demand.
There weren't any significant outages. They were between 100 and 500 MW.
A storm on the 14th March destroyed the interconnector between Hungary and Ukraine. The interconnector
was switched off for about 4 months.
In this period we could use the 2600 MW import capacity.
Iceland
General comments on the main trends and climatic conditions
The installed generation capacity provided acceptable system adequacy during the summer period 2013.
No unusual or significant system events occurred during the summer 2013. Prevailing bottlenecks in the
transmission system limit transmission of power between areas, but without causing shortage of power. The
most stressed period is late winter/early spring.
The Icelandic TSO is working out plans for removing the bottlenecks by adding new connections between
areas.
Effects of external factors on demand
The public demand is on the rise. It fell two years in a row (2009 and 2010) after the economic collapse in
2008. Now, the annual growth of public demand is approx. 1.7% pr. year.
Specific events occurred during the summer
No specific events registered.
Detailed review of the most stressed periods
No specially stressed periods expected or occurred during June - September.
Ireland
General comments on the main trends and climatic conditions
The summer was warmer than anticipated and average temperatures were up on recent years. Precipitation
was below average throughout the country.
Occurrence of the identified risks
Week 37 was identified as a high-risk week as approximately 900MW, or 10.4% of our installed capacity,
was due to be on scheduled outage. Despite this, there were no generation adequacy or security of supply
issues in this week.
Unexpected situations
The generation and transmission capacity for the period was adequate for the predicted demand levels.
108
Italy
General comments on the main trends and climatic conditions
The adequacy evaluations for 2013 summer period have not evidenced particular risk for capacity adequacy
and load covering as well as with the national supply system’s.
The summer season, except for September, recorded values of the average temperatures essentially steady
with respect to the same period of previous year. In addition, the hydro monthly energy capability factor,
especially in June, marked higher values than the corresponding ones recorded throughout 2012.
Over this period, the total volume of demand decreased by 3.7% with respect to the same period of 2012. In
particular the month of June and August, despite average values of temperature being essentially steady
with respect to the same period of previous year, showed a sensible decreasing of monthly electricity
demand on the national power grid (- 6.2% and – 5.7% respectively). Particularly, over the summer, the
peak of consumption has been reached on 10 July with 53 942 MW (- 0.32% compared to 54 113 MW on
10 July 2012). The balance of the physical exchanges showed an increase of 5.1%.
Renewable source recorded, over this period, a sensible increase of production (+ 22.3%). In addition
favourable solar conditions increase sensibly the production of this renewable source (+ 29.8%). Nothing
to remark for generation plants availability with respect to the generation overhauls (both
planned/unplanned) consistent with forecast figures.
Other new lines, substation and electrical devices have been put in service with reinforcement of the
transmission network with benefits on reducing local congestions.
Italian northern interconnection has been characterized, for the most of the time, by import conditions from
the four neighbouring systems bordering at the northern interconnection. In several occasions, in virtue of
the high generation from renewable sources, the Italian interconnection has recorded export towards the
neighbouring systems. In terms of physical flows, the interconnection recorded a variable performance of
import/export balance of energy. The HVDC cable interconnecting Italy with Greece has been basically
characterized by prevalent import conditions towards the Italian system.
At the end of September the works for the reinforcement of the Italian-French interconnection were
completed. The works consisted in the revamping of an already existing 380 kV corridor.
Latvia
General comments on the main trends and climatic conditions
During the summer the expected 442 MW generation block for Rigas CHP 2 was commissioned and the
installed capacity has been increased to 881 MW. As we expected Latvian power system has a big amount
of installed capacity of gas generation to cover a load in emergency and severe conditions but the gas power
plants are not so competitive to work in normal conditions therefore almost whole summer Latvian power
system was importing electricity from Estonia. The CHPs mostly were working to cover the heat demand
and during the summer the production was low. During the summer the average production of hydro and
wind for peak load was 200 MW. The expected increase of wind power was not realized and the installed
capacity didn't change. The system service reserve was adequate and the amount didn't change during the
summer. The increase of load was not as high as expected and only few times the load exceed forecasted in
normal conditions.
Unexpected situations
Due to the electricity deficit in Latvia and Lithuania the electrical flows were from north to south and the
congestions on the boarder EE-LV in Baltic States occurred. The EE-LV boarder is the weakest point for
electricity flows in Baltic States.
109
Specific events occurred during the summer
330 kV grid - 6 single phase disconnections (unknown reasons), 1 disconnection due to the tree felling in
the wire and 1 disconnection due to the lightning strike.
Lithuania
General comments on the main trends and climatic conditions
In summer 2013 the total consumption increased by 3.09%. The increase by 1.52% was due to maintenance
of internal generation unit in one of the largest industrial company in Lithuania. The 1.57% of increased
consumption was due to climate conditions. The average temperature in this summer was 1.1 ᵒC higher
than it was in summer 2012. The minimum load was reached in the end of June as was expected in Summer
Outlook 2013. The minimum load was 777 MW and it was lower than expected under the normal
conditions (790 MW forecast). The average summer balance portfolio consisted of 38% of local generation
and 62% of imports from neighbouring countries. The largest part of imported electricity was from Russia.
Occurrence of the identified risks
The week 33, as expected in Summer Outlook 2013 report, was not typical. The consumption during
extraordinary days was 10% lower in comparison to normal days. However no major risks occurred since
there were enough regulating reserves to cover system imbalances.
Unexpected situations
The interconnection capacities were lower than it was expected in Summer Outlook 2013, therefore
possibility to import electricity from neighbouring systems was restricted and market participants tended to
cover part of their consumption portfolio in the balancing market. In order to cover deficit imbalance
during peak demand periods, higher volumes of regulating reserves and system services were utilized. Total
volume of upward regulating reserves has increased by 143% in comparison to summer 2012. In summer
2013 there were three periods (week 32, 36 and 38) when fast operating reserves were near to exhaust
therefore cold reserve was activated to cover system imbalances. Despite the fact that the level of necessary
ancillary services increased the adequacy of ancillary services had been maintained, though no emergency
situation had happened during these periods.
Effects of external factors on demand
The main reason influencing the variable load demand is climate changes. The second reason is the outages
of generation units in industrial companies. When internal generation stops, then usually the lack of
generation is covered by consumption from the network.
Most stressed periods for system adequacy
There were no stressed periods for system adequacy during the last summer period.
Specific events occurred during the summer
No additional events have occurred during last summer period.
Lessons learnt for next summer
The relevant point for the next summer forecasts has to be set when forecasting interconnection capacities.
Limited interconnection capacities can highly increase required level of ancillary services.

110
FYRO Macedonia
General comments on the main trends and climatic conditions
During the summer period this year in Macedonian Power System no unexpected or unplanned events
occurred with significant (regional) character. All intended maintenance and overhauls works were
completed in accordance with the plans. The realised load was lower than forecasted by about 200 MW.
This is mainly due to moderate temperatures during June and July that meant smaller use of air
conditioners. Due to the high level of water reservoirs in these months, the load was mainly covered by
hydro capacity. Interconnection was available during the whole period and we did not face any difficulty
with regards to NTC quantity, cross-border allocation or relationship with market participants.
Montenegro
General comments on the main trends and climatic conditions
The main factor can be high demand and bad hydrological conditions.
Occurrence of the identified risks
We didn't expect any risks.
Effects of external factors on demand
Due to high influence of aluminium and steel industry on Montenegrin power demand, some mistakes in
demand prediction can be expected.
Most stressed periods for system adequacy
Montenegrin TSO’s best expectations are that generation – load balance problems, under normal conditions
are not expected.
Specific events occurred during the summer
Due to the fact that aluminium factory had no supplier we had load balance problems till 17 June 2013.
Accumulated imbalance is compensated through compensation program.
The Netherlands
General comments on the main trends and climatic conditions
Last summer was relatively a normal summer, although there was a long period of warmer weather, but this
has not lead to any difficulties within the TenneT grid. Although the expected peak was around 16 250
MW, the actual peak was somewhat lower around 15 200 MW (13-14 hrs) on the 5th of September when
max. temperature reached 30 degrees. The lowest load during this period was reached on June 16th (7 700
MW).
Occurrence of the identified risks
No large risks where identified.
Effects of external factors on demand
Not identifiable in the transmission grid in the Netherlands.
Unexpected situations
No unexpected situations arise during the summer period.
111
Specific events occurred during the summer
As of 2013 the protocol for the lack of cooling water was stopped in close cooperation with our Ministry of
Economic Affairs and the Ministry of infrastructure and environment This protocol didn't have any added
value for the TSO's nor the market due to a change in the environmental legislation. The output temperature
of cooling water is now regulated per Production Unit and therefor a general protocol on Cooling water
those not any contribution anymore. High temperatures were reached during summer, but the market
behaved as expected and a protocol was not needed.
Detailed review of the most stressed periods
There was a failure on the power line between Møre and Nyhamna, and this affect the gas exports to
England. The gas price in England became high.
Norway
General comments on the main trends and climatic conditions
The summer has been dry and warm. The inflow has also been lower than normal.
Unexpected situations
Only some small situations.
Specific events occurred during the summer
There was a period with low capacity between Norway and Sweden in the South of Norway.
Detailed review of the most stressed periods
There was a failure on the power line between Møre and Nyhamna, and this affect the gas exports to
England. The gas price in England became high.
Poland
General comments on the main trends and climatic conditions
Operational conditions last summer were good in general, no special occurrences registered. As usual
Polish power system was affected by unplanned transit flows through the system from the west to the south.
The most stressed situation took place on Monday 9th September, when unscheduled flows overloaded not
only PL-DE profile, but also PL-CZ profile. N-1 criteria on these borders were not fulfilled, both, PSE and
CEPS TSOs switched yellow light in RAAS system. PSE in cooperation with CEPS and 50Hertz undertook
extraordinary measures to unload both profiles.
On the following days: 16th, 22nd June as well as 6th, 7th July and 11th August PSE was a party of MRA
(Multilateral Redispatching) in direction TenneT GER → 50 Hertz → PSE. TenneT GER was the
requesting party, the level of power – up to 600MW depending on day / hour.
New historical, morning peak load was registered during this summer June 21st – at about 20130 MW (net
value) at 13:15.
Portugal
General comments on the main trends and climatic conditions
In this summer the electricity consumption grew strongly: 3.3% YoY in July and 1.7% YoY in August.
This demand growth was primarily due to the high temperatures that occurred over the season, however,
correcting for temperature effect and labour days, we may still find a 0.2% growth rate.

112
The maximum load observed during the season, 7614 MW, stood around 200 MW above from last year
level and just 570 MW from this year winter peak.
Occurrence of the identified risks
The secure margins identified in the report were generally confirmed, despite the occurrence of heat waves
on weeks 27-28 and 33-34, that made load exceed the forecasted values even for severe condition. As run-
of-river inflows were exceptionally high for this time of the year (due to some destocking performed in
Spanish reservoirs), and wind generation availability was about 14% above the average, the margins never
were at risk.
Unexpected situations
There were no unexpected situations with impact to the normal system's operation during this summer.
Romania
General comments on the main trends and climatic conditions
Half of July and August were dry time intervals and maximum temperature was 37-38 ˚C. In spite of these
weather conditions, there was no risk for Romanian Power Adequacy.
Unexpected situations
During the summer of 2013, the Romanian Power System did not encounter significant or unusual events.
Serbia
General comments on the main trends and climatic conditions
Serbian power system passed through summer without any problems.
Occurrence of the identified risks
We didn't expect any risks.
Unexpected situations
No.
Slovakia
General comments on the main trends and climatic conditions
The summer of 2013 was slightly colder than in the previous year. Average temperature during summer
months was 18.8°C (previous summer it was 19.5 °C). In the first months of summer period there was
normal weather (June, July), in August it was a bit warmer (0.6°C higher than in 2012). September 2013
was colder (14.0 °C) in comparison with September 2012 (16.9 °C), which was the highest difference of
average monthly temperatures.
The weather has got main influence on the consumption in particular months. There was slight increase of
consumption (1.59 %) and increase of production (4.37 %) of electricity from June to September, in
comparison to the same period of summer 2012. Concerning production, increase was on nuclear (7.9 %),
solar (10.0 %) and hydro (22.0 %) power plants, contrariwise decrease was observed on thermal (-22.9 %)
and industrial (-3.2 %) power plants. The summer peak load was recorded on Thursday, 26th September
2013 at 19:00, 3 664 MW, the predicted value of the summer peak was 3 640 MW in the 39th week. The
minimum of peak loads usually occur in the second half of July and the first half of August. However
113
summer 2013 was different. In the mentioned period the peak loads were much higher than in 2012,
probably due to hot weather period and expanding of air-conditioners.
The import of electricity was foreseen in all period of summer 2013. In reality the import of electricity was
recorded in July, August and September (the total amount of import was about 131 GWh). Import of
electricity decreased about 44.9 % in comparison to summer 2012. In June, July and September 2012 the
total amount of import was 292 GWh. Import of electricity shared about 1.5% of summer consumption
2013. The export of electricity was only in month June (143.2 GWh) and it is about 1.6 % of summer
production 2013. These imports were not caused by the current lack of generation in Slovakia but by the
electricity trades on the electricity markets, more precisely the electricity price on the market was more
favourable compared to the price of the electricity generated in Slovakia.
The reconfigurations (changes) of transmission system basic connection in selected substations (400 kV
Lemešany and 400 kV Varín) were performed six times in the period between the 3rd
and the 26th of August
2013.
Slovenia
General comments on the main trends and climatic conditions
In the summer period, the consumption at the transmission level was 3.6% lower than predicted and 2.2%
lower than in 2012. The physical imports were lower than exports for the whole summer period, thus the
Slovenian EPS was net exporter.
Spain
General comments on the main trends and climatic conditions
In general, the temperatures were similar to the average values during summer (slightly lower during June,
slightly higher during July and similar to the average values during August). Water inflows were not high –
as usual during summer-, but were slightly higher than average. Wind production was similar to the average
values during summer (19% of installed capacity on average).
Occurrence of the identified risks
Not significant operational risks had been foreseen. System operation and system adequacy functioned
without any larger problems during summer.
Unexpected situations
Nothing remarkable.
Effects of external factors on demand
The demand values have been lower than last year due mainly to the economic and financial crisis. Besides,
the temperature had a negative effect on demand during June and August (-4% and -2% respectively), and a
positive effect on July (1%).
Most stressed periods for system adequacy
There has not been significant stress level for the system adequacy.
Specific events occurred during the summer
Nothing remarkable.
Detailed review of the most stressed periods
Actual demand (energy) was slightly lower than expected for the months of summer. Nevertheless, the
demand monthly forecasts had a suitable accuracy (the error was lower than 3 %).
114
The summer peak demand was lower than the estimation for extreme conditions, and it was reached on July
2013 (37500 MW), due to the high temperatures on that period. However, this summer peak demand was
much lower than the historical summer peak demand (41318 MW, reached during summer 2010).
Sweden
General comments on the main trends and climatic conditions
The summer in Sweden has been slightly warmer than usual. Except for a pretty rainy June, the summer has
been quite dry in most parts of Sweden. As usual during summers there have been several disturbances due
to lightning strikes, but none of them has had any system wide consequences. On average there have been
thunderstorms somewhere in the country every other day during the summer.
Occurrence of the identified risks
One of the largest risks was managing the large amount of outages because of maintenance work on grid
elements and production units. Svenska Kraftnät has handled this by limiting the trading capacity according
to existing agreements. Some voltage problems have been reported, mainly during low demand periods
(nights and weekends). These problems have been handled in close cooperation with the DSO’s and by
disconnecting low loaded power lines where operational security so allowed.
Unexpected situations
Nothing unexpected occurred during the summer that jeopardized the security of supply.
On 17 July the Baltic Cable (interconnecting Sweden and Germany) suffered a cable fault. The link was
back in operation in late September.
On 28 August there was a cable fault on Konti-Skan (interconnecting Sweden and western Denmark) and
the transmission capacity was reduced by 80 % until October.
Most stressed periods for system adequacy
Because of low demand during summer there was no problem with generation adequacy. Most stressed
periods for the system during summer are nights and weekends when low load on long transmission lines
causes high voltages.
Switzerland
General comments on the main trends and climatic conditions
The Swiss system did not experience any significant/unusual events or conditions during the summer
period, like major losses of supply, loss of interconnection availability/capacity, emergency situations.
Occurrence of the identified risks
No.
Unexpected situations
No.
115
Appendix 1: Questionnaire for WOR 2013/14 and SR 2013
FOREWORD
The “Winter Outlook 2013-2014 and Summer Review 2013 Report” will be published on ENTSO-E web-
site and communicated to the Electricity Cross-Border Committee of the European Commission4.
If any information (figures or comments) are to be kept confidential for use within ENTSO-E only, please
identify them clearly and they won’t be made available to other parties.
The proposed plan for the report is significantly different from previous reports. The spreadsheet for data
collection has been changed to increase transparency and bring it more into line with the terminology as
used in the long term adequacy reporting. Average generator outages rates for normal and severe
conditions are requested to check consistency across regions and to provide a more robust analysis.
It is also intended to carry out a flow based analysis using submitted NTC values to give a level of
confidence that countries that require imports to meet winter peak demands are able to source these across
neighbouring regions under both normal and severe conditions. Hence the requirement for TSOs to give an
indication of their best estimate of NTC values between countries is essential for this analysis. It is
recognised that these NTC values may be different than previous submitted values by a TSO.
Across the analysis period it is also proposed to also highlight any European “downward regulation” issues
where excess inflexible generators output exceeds overnight minimum demands. Similar to the peak
demand analysis, the submitted NTC values will be used to give a level of confidence that countries that
require exports to manage inflexible generation are able to export these to neighbouring regions who are not
in a similar situation. The reason for this analysis is that a number of TSO’s have expressed concern that
this is a growing problem for system operation.
The format of the final report “Winter Outlook 2013-2014 and Summer Review 2013 Report” will be:
Main Report (about 15 pages)
Executive Summary
Introduction and methodology
Summer Review 2013
Winter Outlook 2013-14 (including comments per Regions)
Flow based NTC analysis across EU (including comments on areas of concern) for winter peak
demands
Lessons learnt
Appendix (about 3 pages per country and when available per Region) on a country by country
basis with graphs illustrating the generation-load balance and comments provided by each country.
The information provided should reflect the actual state of the analysis made by the TSO and should be
based on the available materials.
For your reference, previous seasonal outlook reports are available at:
https://www.entsoe.eu/resources/publications/system-development/outlook-reports/
4 "The EC Cross Border Committee acts in accordance with Regulation (EC) No 1228/2008 of the European Parliament and
of the Council of 26 June 2003 on conditions for access to the network for cross-border exchanges in electricity (Article 13),
replaced by Regulation EC n. 714/09 . It consists of Member States' representatives.
116
Guidelines for data collection are indicated in this document. There is also a “Guidelines for System
Adequacy forecast data collection” that is available on the ENTSO-E extranet site which gives definitions
and explanations of terminology.
INPUT FROM EACH COUNTRY
The input expected from each country comprises 3 main parts included in the same excel workbook:
o One or two paragraphs emphasizing the TSO’s appreciation of the generation – load balance for
the coming winter. It should also highlight any issues of excess inflexible generation at times of
minimum demand; this synopsis will be included in the main report. No common form is suggested
in order to fit with each country’s specific case.
o A table with quantitative elements with a common format; this table will not be published but
sent only to those TSOs taking part in the exercise; the data will be used for building graphs
attached in appendix to the report and illustrating the winter outlook for the country. In addition,
the NTC data in this table will be analysed against all other regions to determine adequacy across
the EU with a focus on those regions that require imports under normal or severe conditions.
Finally, it is envisaged that graphs of downward regulation will be presented as a high level
European Overview.
o A synopsis and comments on the generation-load adequacy for the coming winter that will be
included in the Appendix of the report. In order to facilitate the production and use of these
comments, common guidelines are provided hereafter.
QUANTITATIVE ELEMENTS
Please fill in the Excel spreadsheet available on extranet.
The data is requested for synchronous time each Wednesday (19:00 CET) in order to allow meaningful
analysis when determining cross border flows. It is recognised that this may not be the peak demand in
every region in the winter but 19:00 is chosen to allow a consistent analysis.
If weekly data is not available for any TSO then the data for the third Wednesday of July should be the
minimum that is available to countries of the Regional Groups “Continental Europe” (as provided in the
framework of the system adequacy forecast). It is therefore requested that a TSO that is unable to provide
weekly data provide the data for the third Wednesday of July with updates in order to take into account the
increased knowledge of the situation since the last SO&AF (outages, status of hydro reserves, etc.).
An additional requirement is in PART E of the Excel spreadsheet to provide minimum demand data,
downward reserve requirement, level of inflexible plant, pumped storage demand in order to allow an
European overview of the need for countries to export across borders at times of high levels of inflexible
generation such as wind or solar. Two separate assessments are performed, each one targeting downward
adequacy reference points. First point is synchronous time of each Sunday 05:00 CET, the expected
minimum demand for the considered period. At overnight minimum demand periods, there is a possibility
of high wind infeed, so the problems with downward regulation can occur in certain number of European
TSOs. The second reference point for which the assessment will be performed is synchronous time of each
Sunday 11:00 CET. At this time point high amounts of solar generation is expected. The difference in load
between this two time points may be less than the solar infeed, thus downward adequacy is relevant in both
cases.
117
GUIDELINES FOR COMMENTS
All comments are be included in the excel spreadsheet. Each TSO is requested to provide the following
information:
Contribution to the main report
A few lines on the main results of the assessment including:
‒ General situation highlighting specifics such as high levels of maintenance in certain weeks, low hydro
levels, low gas storage, sensitivity to commissioning generation etc.
‒ Most critical periods for the TSO and in particular which weeks are considered as most critical.
‒ Expected role of interconnectors in relation to maintaining adequacy and the ability to import or
export.
‒ Expected role of interconnectors to managing an excess of inflexible generation at minimum demand
periods
Synopsis
This qualitative assessment should stress the main critical periods and the main factors of risk. It would be
useful to indicate, if any, which level of remaining capacity they consider as necessary when making this
forecast in order to ensure a secure operation for the winter (i.e. what is the reference adequacy margin) and
the role of renewables. In addition, the qualitative assessment should consider the role of interconnectors in
allowing excess inflexible generation (such as wind) to be accommodated on the power system.
Short explanation of the framework and the method used for making the winter adequacy assessment
The framework used is to determine adequacy under normal and severe conditions for each TSO. This is
based on data that is submitted by each TSO. The analysis then checks if the countries that rely on imports,
have enough transmission capacity to import energy from neighbouring countries. To do this analysis, each
TSO is requested to give its best estimate of the NTC that it anticipates will be available.
The analysis is based on a spreadsheet that takes remaining capacity (under normal and severe conditions)
from all the TSO submitted spreadsheets with all the submitted NTC values. If there are 2 countries that
submit different NTC values on the same border, then the analysis will be completed taking the
minimum submitted value. Based on the outcome of the analysis, additional questions may be asked from
the relevant TSOs if particular country boundaries are considered critical.
In addition for the specific Winter Outlook Report, the analysis will consider the minimum demand periods
with potential maximum inflexible generation to determine that countries that are required to export excess
generation can do so.

118
GUIDELINES FOR COMPLETING THE SPREADSHEET
The analysis is country based and not control area nor bid area based. It is recognised that this does cause
issues for completing the spreadsheet and the guidelines below have attempted to resolve these issues.
If this Generation – Demand balance is considered at risk for the system i.e. too low, then please provide an
explanation of the main risk factors (e.g. availability of generation, load sensitivity to temperature, low
hydro levels, low wind etc.) and how this risk is to be managed by the TSO. This part will only be included
in the appendix if the TSO wants it to be included.
According to the degree of available data please fill in the spreadsheets:
‒ for each week of the considered period, namely Wednesday of each week at 19:00 CET;
‒ for each week of the considered period, namely Sunday of each week at 05:00 and 11:00 CET;
‒ for each month of the considered period namely the third Wednesday of each month at 19:00 CET;
‒ for each month of the considered period namely the Sunday before the third Wednesday of each month
at 05:00 and 11:00 CET;
‒ for typical weeks or days (at least the third Wednesday of July) at 19:00 CET;
‒ for typical weeks or days (at least the Sunday before the third Wednesday of July) at 05:00 and 11:00
CET.
PART A: INDIGINEOUS NATIONAL GENERATION (Lines 1 to 7):
The total generation capacity notified to the TSO as being installed for each week for the same period. The
requested data on fuel types has been modified to better reflect the long term adequacy reports and in order
to increase transparency in reporting.
The available generation capacity should be calculated according to a methodology directly derived from
the one used for the former ETSO system adequacy forecast report and within the former UCTE for
generation adequacy assessment.
It is noted that certain countries may have generators that are located in neighbouring countries and
consider them as part of their capacity due to firm contracts or grid topology. Where this exists,
please highlight so as for regional analysis it is important not to double account generation.
The following specific data is requested:
‒ Net generating capacity (lines 1 to 5): installed capacity by fuel type. The fuel types are similar as
found in the long term adequacy reporting in order to increase consistency between long term and short
term adequacy reporting.
‒ Net generating capacity (line 6): corresponds to the generating capacity as calculated from data input
in lines 1 to 5.
‒ Please note that a change from previous year’s submissions is that a “Normal Average Outage Rate”
and a “Severe Average Outage Rate” is requested in order to increase transparency and allow
comparisons across regions. This percentage outage rate can be used to automatically calculate the
Outages in lines 10 and 19 (formulae are included in the spreadsheet: for example if the outage rate is
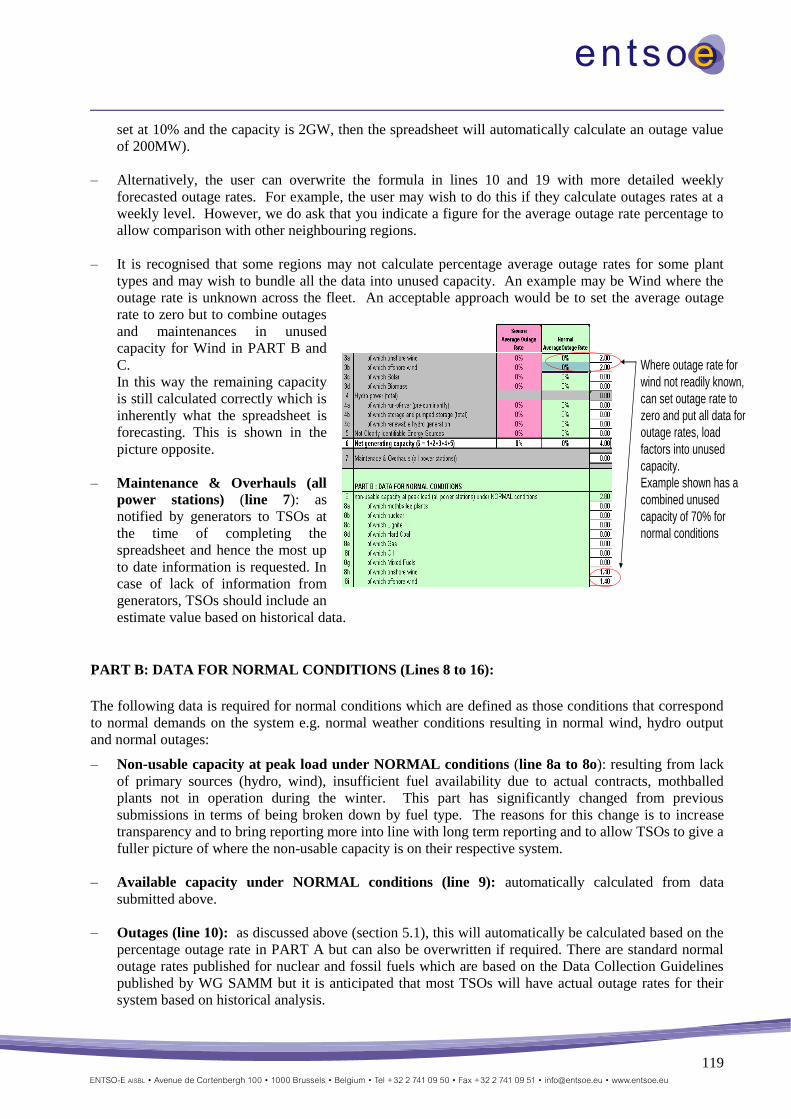
119
Where outage rate for
wind not readily known,
can set outage rate to
zero and put all data for
outage rates, load
factors into unused
capacity.
Example shown has a
combined unused
capacity of 70% for
normal conditions
set at 10% and the capacity is 2GW, then the spreadsheet will automatically calculate an outage value
of 200MW).
‒ Alternatively, the user can overwrite the formula in lines 10 and 19 with more detailed weekly
forecasted outage rates. For example, the user may wish to do this if they calculate outages rates at a
weekly level. However, we do ask that you indicate a figure for the average outage rate percentage to
allow comparison with other neighbouring regions.
‒ It is recognised that some regions may not calculate percentage average outage rates for some plant
types and may wish to bundle all the data into unused capacity. An example may be Wind where the
outage rate is unknown across the fleet. An acceptable approach would be to set the average outage
rate to zero but to combine outages
and maintenances in unused
capacity for Wind in PART B and
C.
In this way the remaining capacity
is still calculated correctly which is
inherently what the spreadsheet is
forecasting. This is shown in the
picture opposite.
‒ Maintenance & Overhauls (all
power stations) (line 7): as
notified by generators to TSOs at
the time of completing the
spreadsheet and hence the most up
to date information is requested. In
case of lack of information from
generators, TSOs should include an
estimate value based on historical data.
PART B: DATA FOR NORMAL CONDITIONS (Lines 8 to 16):
The following data is required for normal conditions which are defined as those conditions that correspond
to normal demands on the system e.g. normal weather conditions resulting in normal wind, hydro output
and normal outages:
‒ Non-usable capacity at peak load under NORMAL conditions (line 8a to 8o): resulting from lack
of primary sources (hydro, wind), insufficient fuel availability due to actual contracts, mothballed
plants not in operation during the winter. This part has significantly changed from previous
submissions in terms of being broken down by fuel type. The reasons for this change is to increase
transparency and to bring reporting more into line with long term reporting and to allow TSOs to give a
fuller picture of where the non-usable capacity is on their respective system.
‒ Available capacity under NORMAL conditions (line 9): automatically calculated from data
submitted above.
‒ Outages (line 10): as discussed above (section 5.1), this will automatically be calculated based on the
percentage outage rate in PART A but can also be overwritten if required. There are standard normal
outage rates published for nuclear and fossil fuels which are based on the Data Collection Guidelines
published by WG SAMM but it is anticipated that most TSOs will have actual outage rates for their
system based on historical analysis.
120
‒ System services reserves under NORMAL conditions (line 11): the amount of capacity required by
the TSO to provide operating response/reserves. It corresponds to the level required one hour before
real time (additional short notice breakdowns are already considered in the amount of outages). In
some market structures, market participants may provide reserve however for the avoidance of doubt,
the figure requested is the total amount of reserves that the country requires at 1 hour ahead.
‒ Planned reliably available capacity under NORMAL conditions (line 12): is automatically
calculated from the data given above.
‒ Weekly peak load for NORMAL conditions (line 13): peak load excluding any demands on
interconnectors and net of any demand management/demand price response in normal weather
conditions for the period from 4 December to 16 April. Possible load reductions in normal conditions
should be mentioned (line 14). It results in the Net weekly peak load for NORMAL conditions (line
15).
‒ Remaining capacity for NORMAL conditions (line 16) corresponds to the generating capacity
available above net demand and is the basis of the TSO’s appreciation of the generation adequacy for
the current week. It is used for the flow based NTC analysis with data from PART D.
PART C: DATA FOR SEVERE CONDITIONS (Lines 17 to 25):
The data format for Severe conditions is the same format as PART B DATA FOR NORMAL
CONDITIONS.
Severe conditions are related to what each TSO would expect under a 1 in 10 year scenario. For example
the demand will be higher than normal conditions and in certain regions the output from certain generating
units such as wind may be very low or there may be higher-than-normal outage rates expected under
extreme ambient temperatures.
In terms of average outage rate, regions may experience a higher outage rate than under normal conditions
due to the lower temperatures and it is intended that this is captured by a severe outage rate that is input in
PART A and/or the non-usable capacity in PART C.
It is difficult to be very specific and hence a description of the scenario being considered should be
described by each TSO and if a TSO is not using a 1 in 10 year scenario e.g. only calculates at a 1 in 20
year demand level then this should be highlighted.
Where users do not submit data for severe conditions, a percentage reduction may be applied to the normal
conditions (figure as yet to be determined).
FIRM IMPORT AND EXPORT CONTRACTS (Lines 26 and 27)
For countries where firm import/export contracts are notified to the TSO, their influence on the remaining
capacity should be mentioned. Information on the possibility of export reduction or import increases will
give a more complete view of the situation. It is important that a country that has a firm import contract
from a neighbouring country ensure that the neighbouring country has also included the contract as an
export contract.
It is also important that if a firm import contract is assumed from a country then the NTC value is
reduced to reflect that some of the capacity is being used.
PART D: ADDITIONAL INFORMATION FOR INTERCONNECTORS (Lines 31 and 32).
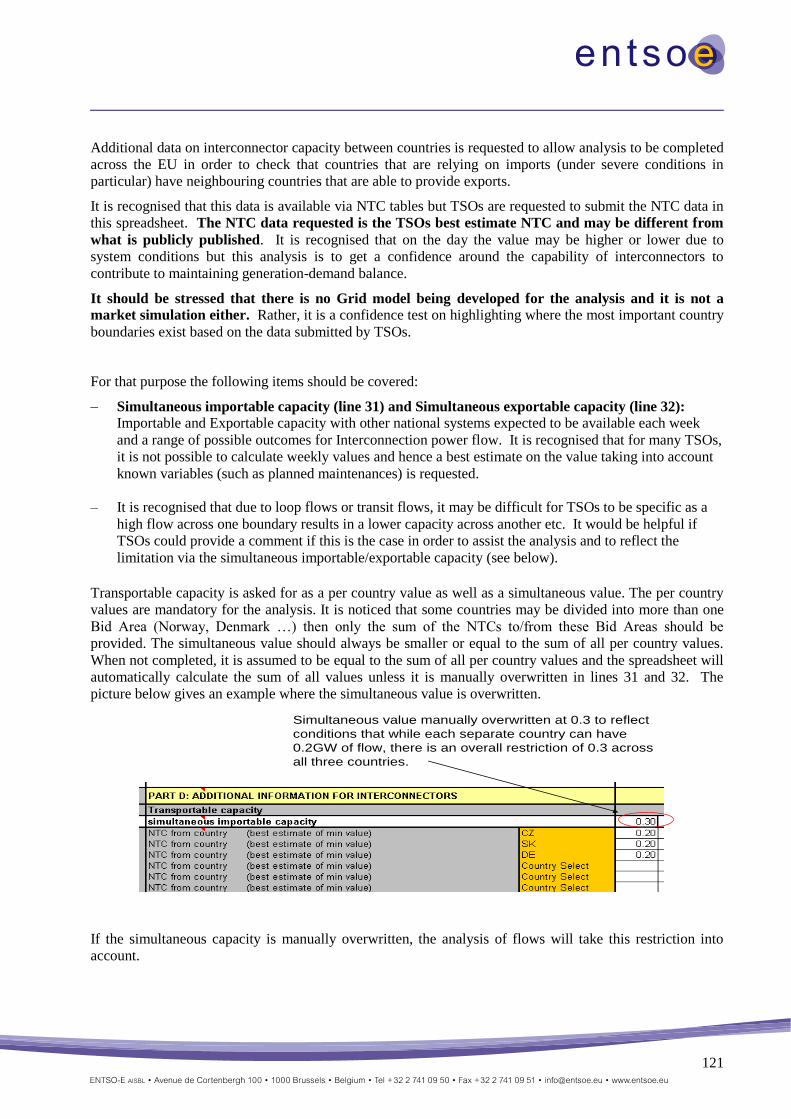
121
Additional data on interconnector capacity between countries is requested to allow analysis to be completed
across the EU in order to check that countries that are relying on imports (under severe conditions in
particular) have neighbouring countries that are able to provide exports.
It is recognised that this data is available via NTC tables but TSOs are requested to submit the NTC data in
this spreadsheet. The NTC data requested is the TSOs best estimate NTC and may be different from
what is publicly published. It is recognised that on the day the value may be higher or lower due to
system conditions but this analysis is to get a confidence around the capability of interconnectors to
contribute to maintaining generation-demand balance.
It should be stressed that there is no Grid model being developed for the analysis and it is not a
market simulation either. Rather, it is a confidence test on highlighting where the most important country
boundaries exist based on the data submitted by TSOs.
For that purpose the following items should be covered:
‒ Simultaneous importable capacity (line 31) and Simultaneous exportable capacity (line 32): Importable and Exportable capacity with other national systems expected to be available each week
and a range of possible outcomes for Interconnection power flow. It is recognised that for many TSOs,
it is not possible to calculate weekly values and hence a best estimate on the value taking into account
known variables (such as planned maintenances) is requested.
‒ It is recognised that due to loop flows or transit flows, it may be difficult for TSOs to be specific as a
high flow across one boundary results in a lower capacity across another etc. It would be helpful if
TSOs could provide a comment if this is the case in order to assist the analysis and to reflect the
limitation via the simultaneous importable/exportable capacity (see below).
Transportable capacity is asked for as a per country value as well as a simultaneous value. The per country
values are mandatory for the analysis. It is noticed that some countries may be divided into more than one
Bid Area (Norway, Denmark …) then only the sum of the NTCs to/from these Bid Areas should be
provided. The simultaneous value should always be smaller or equal to the sum of all per country values.
When not completed, it is assumed to be equal to the sum of all per country values and the spreadsheet will
automatically calculate the sum of all values unless it is manually overwritten in lines 31 and 32. The
picture below gives an example where the simultaneous value is overwritten.
If the simultaneous capacity is manually overwritten, the analysis of flows will take this restriction into
account.
Simultaneous value manually overwritten at 0.3 to reflect
conditions that while each separate country can have
0.2GW of flow, there is an overall restriction of 0.3 across
all three countries.
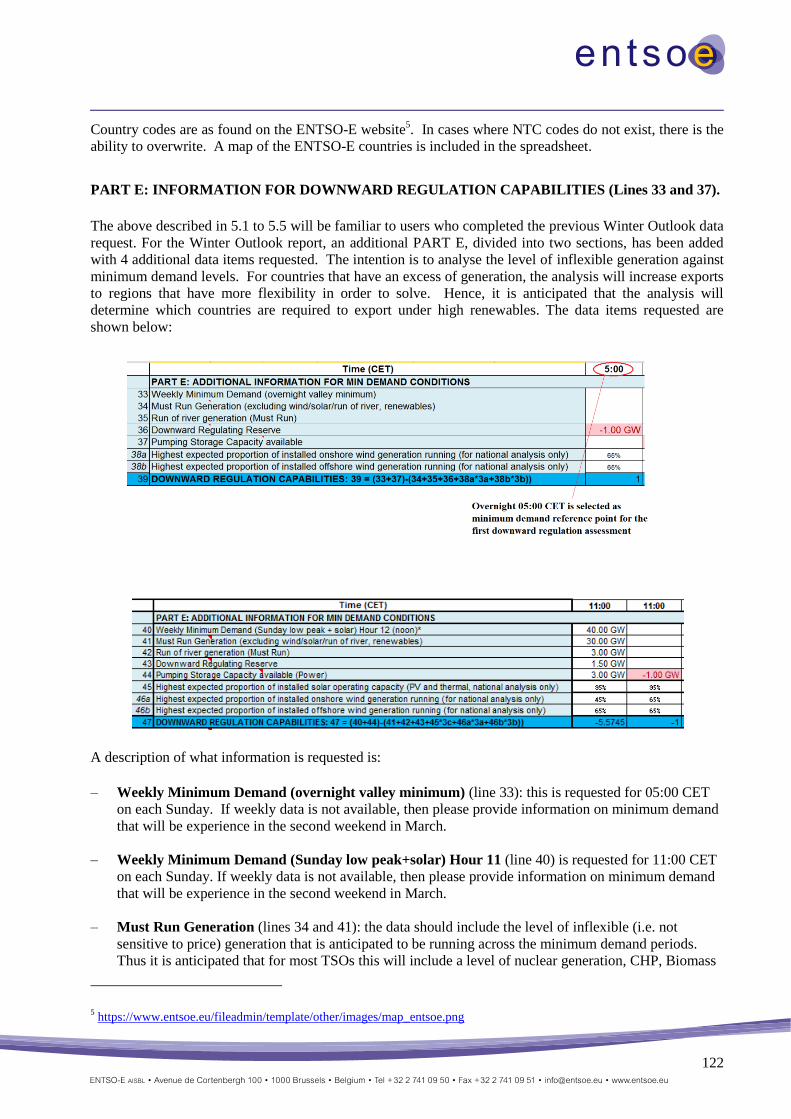
122
Country codes are as found on the ENTSO-E website5. In cases where NTC codes do not exist, there is the
ability to overwrite. A map of the ENTSO-E countries is included in the spreadsheet.
PART E: INFORMATION FOR DOWNWARD REGULATION CAPABILITIES (Lines 33 and 37).
The above described in 5.1 to 5.5 will be familiar to users who completed the previous Winter Outlook data
request. For the Winter Outlook report, an additional PART E, divided into two sections, has been added
with 4 additional data items requested. The intention is to analyse the level of inflexible generation against
minimum demand levels. For countries that have an excess of generation, the analysis will increase exports
to regions that have more flexibility in order to solve. Hence, it is anticipated that the analysis will
determine which countries are required to export under high renewables. The data items requested are
shown below:
A description of what information is requested is:
‒ Weekly Minimum Demand (overnight valley minimum) (line 33): this is requested for 05:00 CET
on each Sunday. If weekly data is not available, then please provide information on minimum demand
that will be experience in the second weekend in March.
‒ Weekly Minimum Demand (Sunday low peak+solar) Hour 11 (line 40) is requested for 11:00 CET
on each Sunday. If weekly data is not available, then please provide information on minimum demand
that will be experience in the second weekend in March.
‒ Must Run Generation (lines 34 and 41): the data should include the level of inflexible (i.e. not
sensitive to price) generation that is anticipated to be running across the minimum demand periods.
Thus it is anticipated that for most TSOs this will include a level of nuclear generation, CHP, Biomass
5 https://www.entsoe.eu/fileadmin/template/other/images/map_entsoe.png
123
and Coal and Gas generation that is always on the system to maintain overall system security and
voltage regulation. The user is specifically asked not to include wind/solar as the analysis that is carried
out will use generation data in PART A/B/C to calculate potential output from these generation
sources.
‒ Run of River (lines 35 and 42): the data should include the level of inflexible run of river generation
that is anticipated to be running across the minimum demand periods.
‒ Downward Regulation (lines 36 and 43): this is the minimum level of generation flexibility that is
required by the TSO to be able to reduce output on the system.
‒ Pumping Storage Capacity (lines 37 and 44): this is the level of pumped storage capacity.
‒ Highest expected proportion of installed onshore wind generation running (for national analysis only)
(lines 38a and 46a): this data is set to 65% and can be modified according to the national specificities.
It will be used for national assessment only.
‒ Highest expected proportion of installed offshore wind generation running (for national analysis only)
(lines 38b and 46b): this data is set to 65% and can be modified according to the national specificities.
It will be used for national assessment only.
‒ Highest expected proportion of installed solar operating capacity (PV and thermal, national analysis
only) (line 45): this data is set to 95% and can be modified according to the national specificities. It
will be used for national assessment only.
The intention of the analysis is to look at high wind, run of river, solar renewable scenario (details of which
to be determined). The levels of exports that a country may require when added to the “must run
generation” will be compared against the demand, pumped storage capability and downward regulation for
each country. If a country requires exports to maintain balance, the analysis will use submitted NTC values
to determine if there is a solution. This is described graphically below:
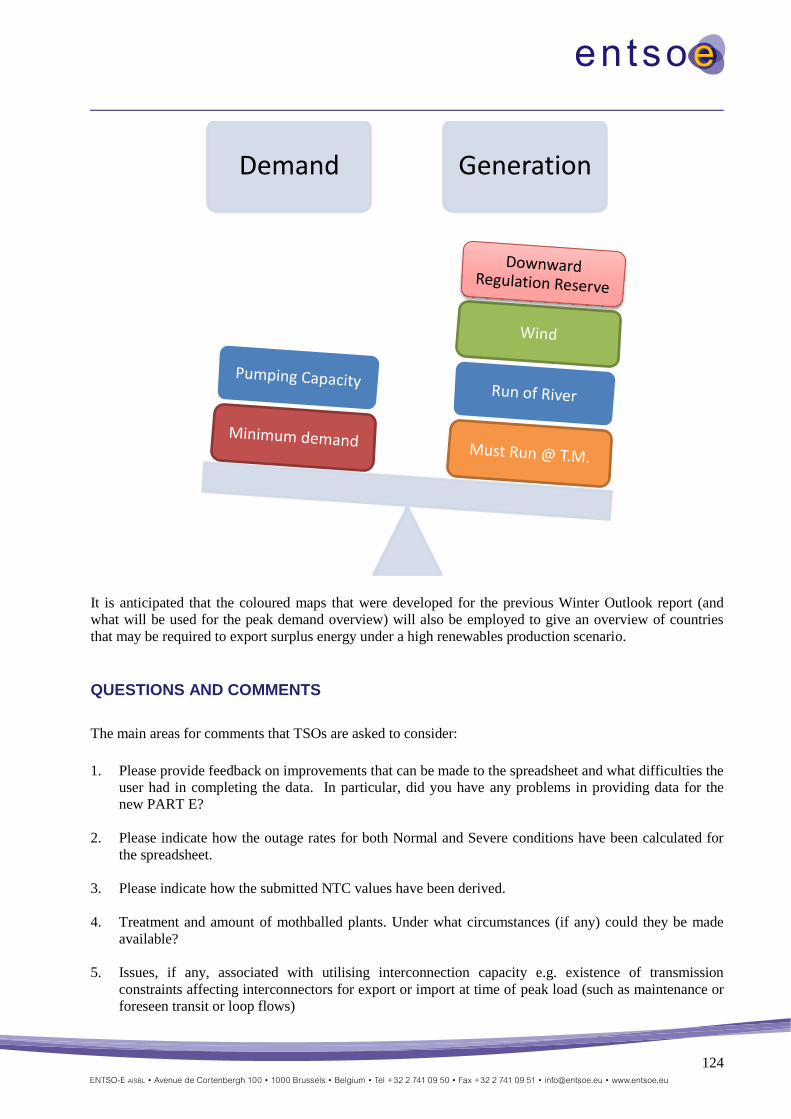
124
It is anticipated that the coloured maps that were developed for the previous Winter Outlook report (and
what will be used for the peak demand overview) will also be employed to give an overview of countries
that may be required to export surplus energy under a high renewables production scenario.
QUESTIONS AND COMMENTS
The main areas for comments that TSOs are asked to consider:
1. Please provide feedback on improvements that can be made to the spreadsheet and what difficulties the
user had in completing the data. In particular, did you have any problems in providing data for the
new PART E?
2. Please indicate how the outage rates for both Normal and Severe conditions have been calculated for
the spreadsheet.
3. Please indicate how the submitted NTC values have been derived.
4. Treatment and amount of mothballed plants. Under what circumstances (if any) could they be made
available?
5. Issues, if any, associated with utilising interconnection capacity e.g. existence of transmission
constraints affecting interconnectors for export or import at time of peak load (such as maintenance or
foreseen transit or loop flows)
Demand Generation
125
6. Are there any energy constraint issues particularly for hydro based systems?
7. Any other fuel supply issues which could affect availability e.g. gas supply issues?
8. Do you expect any event that may affect the adequacy during the winter? If yes, what actions do you
plan to activate?
9. Do you foresee any issue with inflexible plant across minimum demand periods e.g. high level of wind
and must run generation?
10. Any other issues of relevance that are not covered above?
Summer Review 2013 Introduction and Questionnaire
Following the publication of the winter outlook report, ENTSO-E will be publishing a Summer Review
Report.
The objective of the report is to present what happened during this summer as regards weather conditions
and other factors and their consequences on the power system (temperatures, hydro and wind conditions),
availability of generating units, market conditions, use/availability of interconnections and imported energy,
and to compare what happened in reality with the risks identified in the Summer outlook.
The report will be based on narrative that will be collected in the excel for the data collection; however,
quantitative data to illustrate how the summer out-turned against what was forecast would be appreciated
(e.g. actual peak load and difference compared with forecast in normal and extreme conditions, major
disturbances and their effect on generation or transmission capability etc.). For a synchronized view of the
European system any information on the critical periods would be appreciated.
Please indicate if any of your answers should be regarded as confidential and/or commercially
sensitive so that this information can be aggregated or withheld from publication.
If you are unable to provide quantitative data, then it would be very helpful if you could still provide
some commentary in answer to the questions. It is understood that not all TSOs will have access to
all the requested information.
The Summer Outlook Report (published in May 2013) is available to view at:
https://www.entsoe.eu/resources/publications/system-development/outlook-reports/
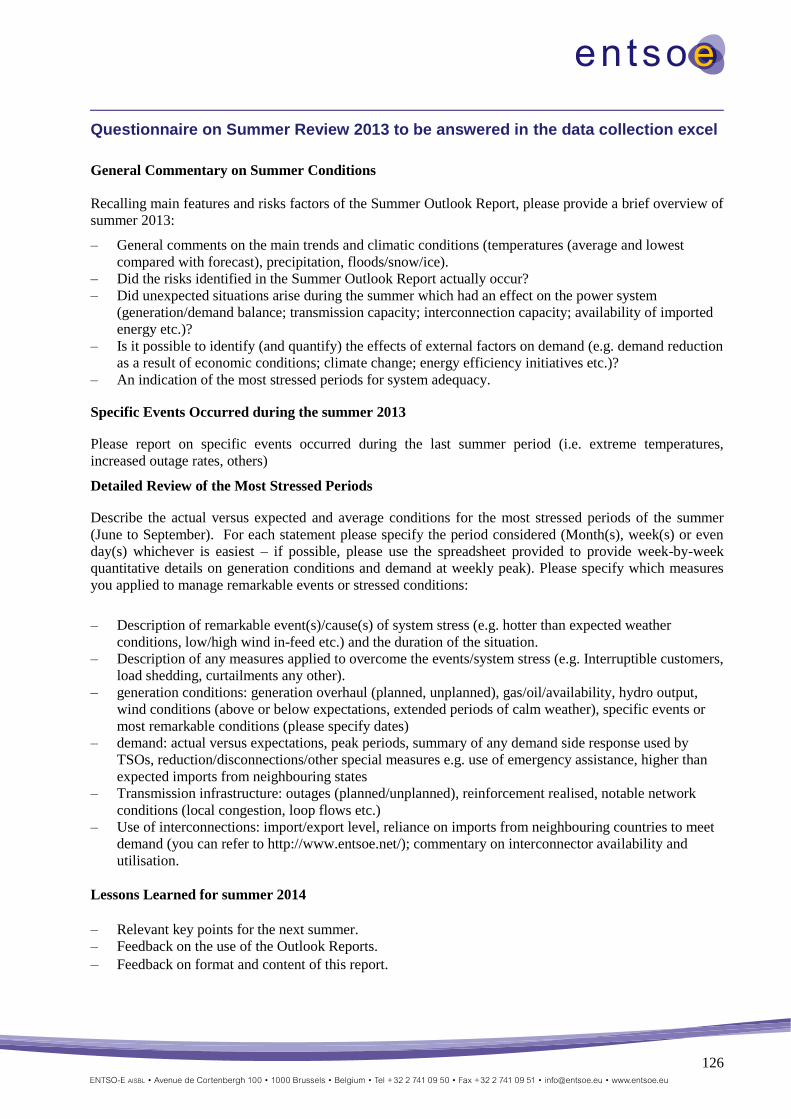
126
Questionnaire on Summer Review 2013 to be answered in the data collection excel
General Commentary on Summer Conditions
Recalling main features and risks factors of the Summer Outlook Report, please provide a brief overview of
summer 2013:
‒ General comments on the main trends and climatic conditions (temperatures (average and lowest
compared with forecast), precipitation, floods/snow/ice).
‒ Did the risks identified in the Summer Outlook Report actually occur?
‒ Did unexpected situations arise during the summer which had an effect on the power system
(generation/demand balance; transmission capacity; interconnection capacity; availability of imported
energy etc.)?
‒ Is it possible to identify (and quantify) the effects of external factors on demand (e.g. demand reduction
as a result of economic conditions; climate change; energy efficiency initiatives etc.)?
‒ An indication of the most stressed periods for system adequacy.
Specific Events Occurred during the summer 2013
Please report on specific events occurred during the last summer period (i.e. extreme temperatures,
increased outage rates, others)
Detailed Review of the Most Stressed Periods
Describe the actual versus expected and average conditions for the most stressed periods of the summer
(June to September). For each statement please specify the period considered (Month(s), week(s) or even
day(s) whichever is easiest – if possible, please use the spreadsheet provided to provide week-by-week
quantitative details on generation conditions and demand at weekly peak). Please specify which measures
you applied to manage remarkable events or stressed conditions:
‒ Description of remarkable event(s)/cause(s) of system stress (e.g. hotter than expected weather
conditions, low/high wind in-feed etc.) and the duration of the situation.
‒ Description of any measures applied to overcome the events/system stress (e.g. Interruptible customers,
load shedding, curtailments any other).
‒ generation conditions: generation overhaul (planned, unplanned), gas/oil/availability, hydro output,
wind conditions (above or below expectations, extended periods of calm weather), specific events or
most remarkable conditions (please specify dates)
‒ demand: actual versus expectations, peak periods, summary of any demand side response used by
TSOs, reduction/disconnections/other special measures e.g. use of emergency assistance, higher than
expected imports from neighbouring states
‒ Transmission infrastructure: outages (planned/unplanned), reinforcement realised, notable network
conditions (local congestion, loop flows etc.)
‒ Use of interconnections: import/export level, reliance on imports from neighbouring countries to meet
demand (you can refer to http://www.entsoe.net/); commentary on interconnector availability and
utilisation.
Lessons Learned for summer 2014
‒ Relevant key points for the next summer.
‒ Feedback on the use of the Outlook Reports.
‒ Feedback on format and content of this report.
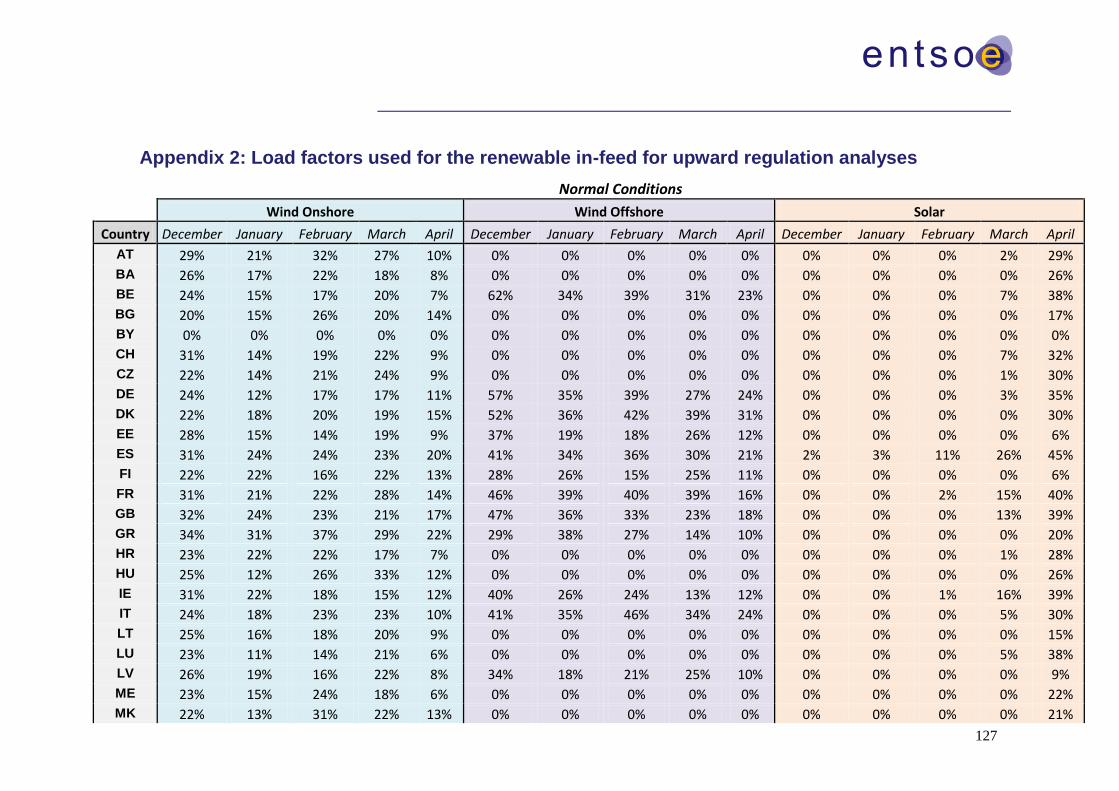
127
Appendix 2: Load factors used for the renewable in-feed for upward regulation analyses
Normal Conditions
Wind Onshore Wind Offshore Solar
Country December January February March April December January February March April December January February March April
AT 29% 21% 32% 27% 10% 0% 0% 0% 0% 0% 0% 0% 0% 2% 29%
BA 26% 17% 22% 18% 8% 0% 0% 0% 0% 0% 0% 0% 0% 0% 26%
BE 24% 15% 17% 20% 7% 62% 34% 39% 31% 23% 0% 0% 0% 7% 38%
BG 20% 15% 26% 20% 14% 0% 0% 0% 0% 0% 0% 0% 0% 0% 17%
BY 0% 0% 0% 0% 0% 0% 0% 0% 0% 0% 0% 0% 0% 0% 0%
CH 31% 14% 19% 22% 9% 0% 0% 0% 0% 0% 0% 0% 0% 7% 32%
CZ 22% 14% 21% 24% 9% 0% 0% 0% 0% 0% 0% 0% 0% 1% 30%
DE 24% 12% 17% 17% 11% 57% 35% 39% 27% 24% 0% 0% 0% 3% 35%
DK 22% 18% 20% 19% 15% 52% 36% 42% 39% 31% 0% 0% 0% 0% 30%
EE 28% 15% 14% 19% 9% 37% 19% 18% 26% 12% 0% 0% 0% 0% 6%
ES 31% 24% 24% 23% 20% 41% 34% 36% 30% 21% 2% 3% 11% 26% 45%
FI 22% 22% 16% 22% 13% 28% 26% 15% 25% 11% 0% 0% 0% 0% 6%
FR 31% 21% 22% 28% 14% 46% 39% 40% 39% 16% 0% 0% 2% 15% 40%
GB 32% 24% 23% 21% 17% 47% 36% 33% 23% 18% 0% 0% 0% 13% 39%
GR 34% 31% 37% 29% 22% 29% 38% 27% 14% 10% 0% 0% 0% 0% 20%
HR 23% 22% 22% 17% 7% 0% 0% 0% 0% 0% 0% 0% 0% 1% 28%
HU 25% 12% 26% 33% 12% 0% 0% 0% 0% 0% 0% 0% 0% 0% 26%
IE 31% 22% 18% 15% 12% 40% 26% 24% 13% 12% 0% 0% 1% 16% 39%
IT 24% 18% 23% 23% 10% 41% 35% 46% 34% 24% 0% 0% 0% 5% 30%
LT 25% 16% 18% 20% 9% 0% 0% 0% 0% 0% 0% 0% 0% 0% 15%
LU 23% 11% 14% 21% 6% 0% 0% 0% 0% 0% 0% 0% 0% 5% 38%
LV 26% 19% 16% 22% 8% 34% 18% 21% 25% 10% 0% 0% 0% 0% 9%
ME 23% 15% 24% 18% 6% 0% 0% 0% 0% 0% 0% 0% 0% 0% 22%
MK 22% 13% 31% 22% 13% 0% 0% 0% 0% 0% 0% 0% 0% 0% 21%
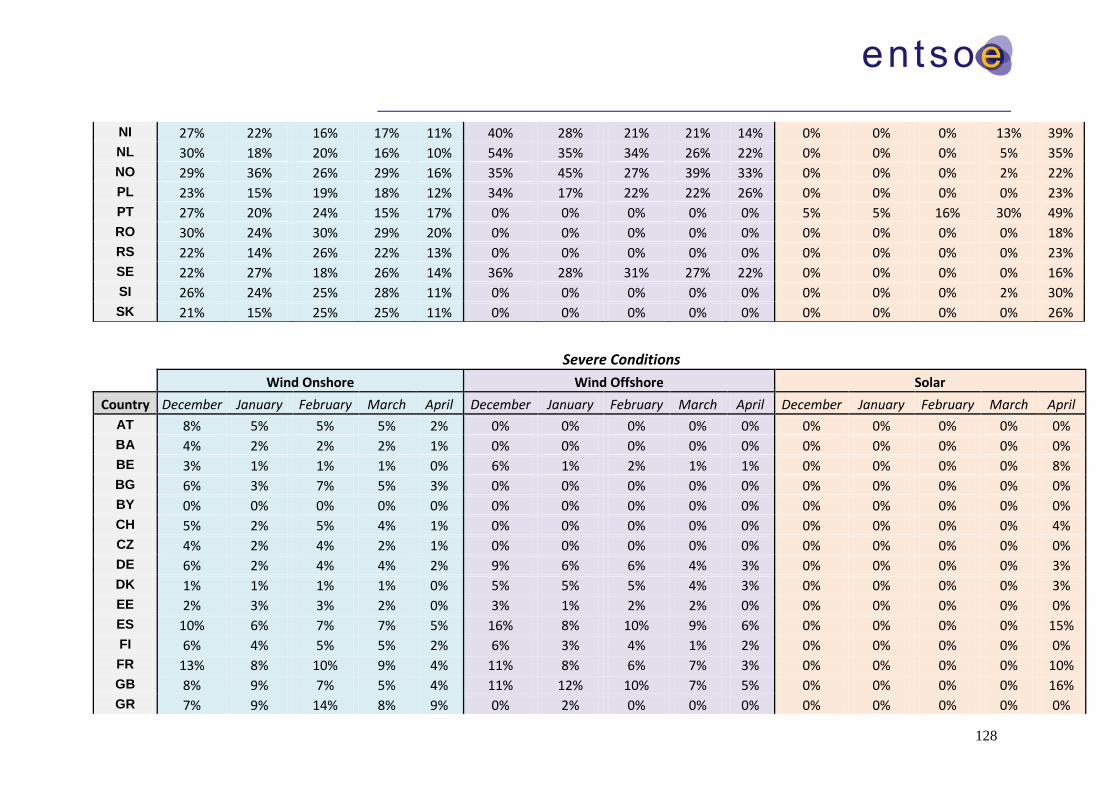
128
NI 27% 22% 16% 17% 11% 40% 28% 21% 21% 14% 0% 0% 0% 13% 39%
NL 30% 18% 20% 16% 10% 54% 35% 34% 26% 22% 0% 0% 0% 5% 35%
NO 29% 36% 26% 29% 16% 35% 45% 27% 39% 33% 0% 0% 0% 2% 22%
PL 23% 15% 19% 18% 12% 34% 17% 22% 22% 26% 0% 0% 0% 0% 23%
PT 27% 20% 24% 15% 17% 0% 0% 0% 0% 0% 5% 5% 16% 30% 49%
RO 30% 24% 30% 29% 20% 0% 0% 0% 0% 0% 0% 0% 0% 0% 18%
RS 22% 14% 26% 22% 13% 0% 0% 0% 0% 0% 0% 0% 0% 0% 23%
SE 22% 27% 18% 26% 14% 36% 28% 31% 27% 22% 0% 0% 0% 0% 16%
SI 26% 24% 25% 28% 11% 0% 0% 0% 0% 0% 0% 0% 0% 2% 30%
SK 21% 15% 25% 25% 11% 0% 0% 0% 0% 0% 0% 0% 0% 0% 26%
Severe Conditions
Wind Onshore Wind Offshore Solar
Country December January February March April December January February March April December January February March April
AT 8% 5% 5% 5% 2% 0% 0% 0% 0% 0% 0% 0% 0% 0% 0%
BA 4% 2% 2% 2% 1% 0% 0% 0% 0% 0% 0% 0% 0% 0% 0%
BE 3% 1% 1% 1% 0% 6% 1% 2% 1% 1% 0% 0% 0% 0% 8%
BG 6% 3% 7% 5% 3% 0% 0% 0% 0% 0% 0% 0% 0% 0% 0%
BY 0% 0% 0% 0% 0% 0% 0% 0% 0% 0% 0% 0% 0% 0% 0%
CH 5% 2% 5% 4% 1% 0% 0% 0% 0% 0% 0% 0% 0% 0% 4%
CZ 4% 2% 4% 2% 1% 0% 0% 0% 0% 0% 0% 0% 0% 0% 0%
DE 6% 2% 4% 4% 2% 9% 6% 6% 4% 3% 0% 0% 0% 0% 3%
DK 1% 1% 1% 1% 0% 5% 5% 5% 4% 3% 0% 0% 0% 0% 3%
EE 2% 3% 3% 2% 0% 3% 1% 2% 2% 0% 0% 0% 0% 0% 0%
ES 10% 6% 7% 7% 5% 16% 8% 10% 9% 6% 0% 0% 0% 0% 15%
FI 6% 4% 5% 5% 2% 6% 3% 4% 1% 2% 0% 0% 0% 0% 0%
FR 13% 8% 10% 9% 4% 11% 8% 6% 7% 3% 0% 0% 0% 0% 10%
GB 8% 9% 7% 5% 4% 11% 12% 10% 7% 5% 0% 0% 0% 0% 16%
GR 7% 9% 14% 8% 9% 0% 2% 0% 0% 0% 0% 0% 0% 0% 0%

129
HR 3% 3% 3% 3% 1% 0% 0% 0% 0% 0% 0% 0% 0% 0% 0%
HU 3% 2% 4% 3% 3% 0% 0% 0% 0% 0% 0% 0% 0% 0% 0%
IE 4% 2% 2% 2% 2% 7% 3% 2% 1% 1% 0% 0% 0% 0% 13%
IT 6% 6% 6% 5% 2% 10% 3% 5% 8% 4% 0% 0% 0% 0% 1%
LT 2% 3% 2% 2% 0% 0% 0% 0% 0% 0% 0% 0% 0% 0% 0%
LU 0% 0% 0% 0% 0% 0% 0% 0% 0% 0% 0% 0% 0% 0% 7%
LV 2% 1% 2% 1% 0% 1% 1% 1% 0% 0% 0% 0% 0% 0% 0%
ME 1% 2% 1% 2% 1% 0% 0% 0% 0% 0% 0% 0% 0% 0% 0%
MK 3% 2% 6% 5% 2% 0% 0% 0% 0% 0% 0% 0% 0% 0% 0%
NI 2% 1% 1% 0% 1% 5% 2% 4% 0% 1% 0% 0% 0% 0% 16%
NL 3% 3% 1% 1% 0% 7% 5% 3% 4% 2% 0% 0% 0% 0% 7%
NO 12% 13% 12% 10% 3% 4% 6% 4% 10% 5% 0% 0% 0% 0% 2%
PL 4% 3% 3% 3% 3% 1% 0% 0% 1% 0% 0% 0% 0% 0% 0%
PT 3% 3% 3% 3% 4% 0% 0% 0% 0% 0% 0% 0% 0% 0% 21%
RO 7% 5% 9% 8% 4% 0% 0% 0% 0% 0% 0% 0% 0% 0% 0%
RS 3% 3% 4% 3% 2% 0% 0% 0% 0% 0% 0% 0% 0% 0% 0%
SE 9% 7% 7% 7% 4% 10% 8% 7% 9% 6% 0% 0% 0% 0% 0%
SI 4% 4% 3% 2% 1% 0% 0% 0% 0% 0% 0% 0% 0% 0% 0%
SK 4% 3% 5% 4% 1% 0% 0% 0% 0% 0% 0% 0% 0% 0% 0%
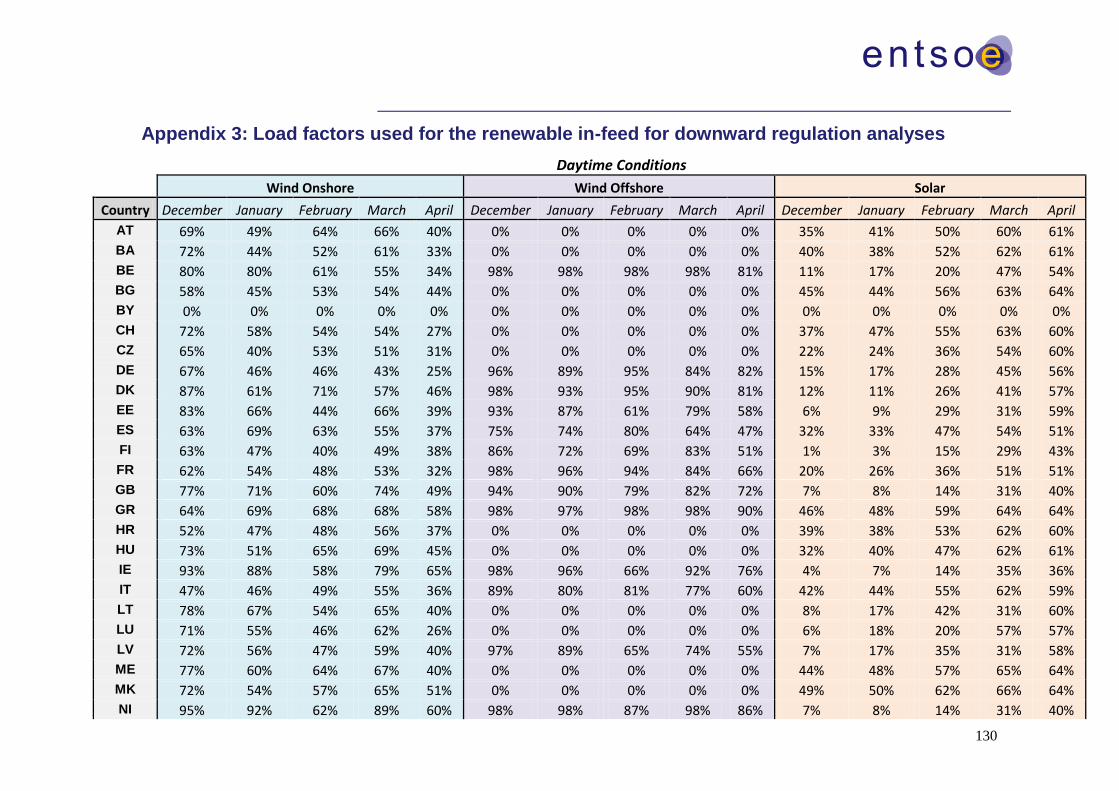
130
Appendix 3: Load factors used for the renewable in-feed for downward regulation analyses
Daytime Conditions
Wind Onshore Wind Offshore Solar
Country December January February March April December January February March April December January February March April
AT 69% 49% 64% 66% 40% 0% 0% 0% 0% 0% 35% 41% 50% 60% 61%
BA 72% 44% 52% 61% 33% 0% 0% 0% 0% 0% 40% 38% 52% 62% 61%
BE 80% 80% 61% 55% 34% 98% 98% 98% 98% 81% 11% 17% 20% 47% 54%
BG 58% 45% 53% 54% 44% 0% 0% 0% 0% 0% 45% 44% 56% 63% 64%
BY 0% 0% 0% 0% 0% 0% 0% 0% 0% 0% 0% 0% 0% 0% 0%
CH 72% 58% 54% 54% 27% 0% 0% 0% 0% 0% 37% 47% 55% 63% 60%
CZ 65% 40% 53% 51% 31% 0% 0% 0% 0% 0% 22% 24% 36% 54% 60%
DE 67% 46% 46% 43% 25% 96% 89% 95% 84% 82% 15% 17% 28% 45% 56%
DK 87% 61% 71% 57% 46% 98% 93% 95% 90% 81% 12% 11% 26% 41% 57%
EE 83% 66% 44% 66% 39% 93% 87% 61% 79% 58% 6% 9% 29% 31% 59%
ES 63% 69% 63% 55% 37% 75% 74% 80% 64% 47% 32% 33% 47% 54% 51%
FI 63% 47% 40% 49% 38% 86% 72% 69% 83% 51% 1% 3% 15% 29% 43%
FR 62% 54% 48% 53% 32% 98% 96% 94% 84% 66% 20% 26% 36% 51% 51%
GB 77% 71% 60% 74% 49% 94% 90% 79% 82% 72% 7% 8% 14% 31% 40%
GR 64% 69% 68% 68% 58% 98% 97% 98% 98% 90% 46% 48% 59% 64% 64%
HR 52% 47% 48% 56% 37% 0% 0% 0% 0% 0% 39% 38% 53% 62% 60%
HU 73% 51% 65% 69% 45% 0% 0% 0% 0% 0% 32% 40% 47% 62% 61%
IE 93% 88% 58% 79% 65% 98% 96% 66% 92% 76% 4% 7% 14% 35% 36%
IT 47% 46% 49% 55% 36% 89% 80% 81% 77% 60% 42% 44% 55% 62% 59%
LT 78% 67% 54% 65% 40% 0% 0% 0% 0% 0% 8% 17% 42% 31% 60%
LU 71% 55% 46% 62% 26% 0% 0% 0% 0% 0% 6% 18% 20% 57% 57%
LV 72% 56% 47% 59% 40% 97% 89% 65% 74% 55% 7% 17% 35% 31% 58%
ME 77% 60% 64% 67% 40% 0% 0% 0% 0% 0% 44% 48% 57% 65% 64%
MK 72% 54% 57% 65% 51% 0% 0% 0% 0% 0% 49% 50% 62% 66% 64%
NI 95% 92% 62% 89% 60% 98% 98% 87% 98% 86% 7% 8% 14% 31% 40%
131
NL 78% 64% 60% 57% 31% 96% 94% 88% 88% 78% 14% 13% 18% 46% 55%
NO 58% 62% 52% 56% 44% 88% 94% 83% 83% 79% 4% 8% 24% 35% 41%
PL 63% 59% 55% 54% 29% 98% 92% 94% 76% 70% 15% 22% 30% 44% 60%
PT 78% 86% 73% 68% 54% 0% 0% 0% 0% 0% 29% 29% 45% 54% 47%
RO 58% 43% 60% 50% 43% 0% 0% 0% 0% 0% 36% 41% 47% 61% 63%
RS 65% 52% 61% 56% 39% 0% 0% 0% 0% 0% 38% 43% 50% 62% 62%
SE 51% 54% 35% 51% 34% 87% 76% 61% 64% 46% 4% 7% 18% 37% 44%
SI 70% 60% 55% 68% 46% 0% 0% 0% 0% 0% 43% 43% 56% 63% 62%
SK 62% 51% 68% 71% 46% 0% 0% 0% 0% 0% 30% 39% 45% 60% 62%
Night-time Conditions
Wind Onshore Wind Offshore
Country December January February March April December January February March April
AT 70% 56% 68% 72% 46% 0% 0% 0% 0% 0%
BA 78% 47% 50% 64% 40% 0% 0% 0% 0% 0%
BE 85% 72% 57% 56% 43% 98% 98% 97% 98% 90%
BG 58% 46% 60% 56% 43% 0% 0% 0% 0% 0%
BY 0% 0% 0% 0% 0% 0% 0% 0% 0% 0%
CH 77% 50% 56% 58% 40% 0% 0% 0% 0% 0%
CZ 62% 51% 55% 51% 38% 0% 0% 0% 0% 0%
DE 65% 47% 54% 43% 32% 97% 93% 94% 85% 87%
DK 78% 63% 68% 54% 48% 97% 95% 94% 87% 85%
EE 87% 68% 43% 70% 40% 97% 83% 65% 78% 63%
ES 66% 66% 66% 57% 44% 70% 73% 81% 67% 45%
FI 58% 54% 40% 57% 36% 89% 69% 66% 89% 60%
FR 67% 55% 52% 55% 38% 98% 97% 87% 87% 73%
GB 80% 79% 58% 70% 51% 93% 89% 78% 84% 79%
GR 63% 69% 68% 68% 61% 98% 98% 98% 98% 94%
HR 51% 45% 51% 54% 41% 0% 0% 0% 0% 0%
132
HU 70% 54% 59% 69% 63% 0% 0% 0% 0% 0%
IE 89% 82% 54% 84% 61% 96% 96% 81% 91% 79%
IT 49% 53% 57% 59% 47% 94% 83% 84% 86% 59%
LT 81% 68% 57% 65% 53% 0% 0% 0% 0% 0%
LU 67% 48% 57% 56% 38% 0% 0% 0% 0% 0%
LV 73% 60% 40% 60% 43% 97% 91% 67% 83% 62%
ME 75% 56% 69% 70% 45% 0% 0% 0% 0% 0%
MK 67% 47% 66% 61% 50% 0% 0% 0% 0% 0%
NI 93% 93% 65% 95% 55% 98% 98% 95% 98% 84%
NL 83% 63% 61% 55% 39% 97% 92% 85% 92% 84%
NO 58% 60% 51% 56% 43% 92% 92% 84% 85% 81%
PL 61% 63% 60% 54% 42% 98% 95% 94% 69% 73%
PT 84% 82% 76% 69% 59% 0% 0% 0% 0% 0%
RO 60% 45% 61% 53% 56% 0% 0% 0% 0% 0%
RS 60% 50% 62% 62% 46% 0% 0% 0% 0% 0%
SE 56% 53% 38% 53% 35% 76% 79% 62% 66% 49%
SI 65% 62% 63% 64% 48% 0% 0% 0% 0% 0%
SK 64% 50% 68% 69% 60% 0% 0% 0% 0% 0%