Embed Size (px)
Citation preview

ENTSOG WINTER SUPPLY OUTLOOK
2021/2022

Winter Supply Outlook 2021/22
SO0032-21
October 2021
Page 2 of 49
Contents
Executive summary .................................................................................................................. 4
1. Introduction ...................................................................................................................... 6
2. Assumptions ...................................................................................................................... 7
2.1. Seasonal Demand .................................................................................................................... 7
2.2. Peak demand ........................................................................................................................... 8
2.3. Supply .................................................................................................................................... 11
2.4. Consideration of Non-EU countries ....................................................................................... 14
3. UGS inventory ................................................................................................................. 14
3.1. Injection during summer ....................................................................................................... 14
3.2. Initial storage level on 1 October 2021 ................................................................................. 17
4. Assessment of Reference Winter and Cold Winter seasons ............................................ 18
4.1. Supply and demand adequacy .............................................................................................. 18
4.2. Evolution of gas storages inventory level .............................................................................. 19
4.3. Conclusion ............................................................................................................................. 22
5. High demand situations .................................................................................................. 23
5.1. Assumptions .......................................................................................................................... 23
5.2. Supply mix ............................................................................................................................. 23
5.3. Conclusion ............................................................................................................................. 25
5.4. Peak Day in Reference Winter and Cold Winter ................................................................... 27
5.5. 2-Week Cold spell in Reference Winter and Cold Winter ..................................................... 28
6. Supply route disruptions ................................................................................................. 29
6.1. Ukraine transit disruption ..................................................................................................... 31
6.2. Belarus transit disruption ...................................................................................................... 33
6.3. Baltics States and Finland Disruption .................................................................................... 35
6.4. Algerian Pipes Disruption ...................................................................................................... 37
7. Conclusions ..................................................................................................................... 39

Winter Supply Outlook 2021/22
SO0032-21
October 2021
Page 3 of 49
8. Legal Notice ..................................................................................................................... 41
Annex A - Underground Storages assumptions ...................................................................... 42
Annex B - Data for Winter Supply Outlook 2021/22 ............................................................... 43
Annex C – Modelling approach ............................................................................................... 46
Annex D – Results of Remaining Flexibility ............................................................................. 48
Winter Supply Outlook 2021/22
SO0032-21
October 2021
Page 4 of 49
Executive summary
As part of its obligation under Art. 8(3)(f) of Regulation (EC) 715/2009, ENTSOG has
undertaken an assessment of the European gas network for the upcoming Winter (October
2021 to March 2022). The analysis investigates the possible evolution of supplies and UGS
inventory along the season as well as the ability of the gas infrastructure to meet the demand,
especially to face high demand situations. ENTSOG has used a sensitivity analysis to check if
the European gas system is able to handle the Winter under different demand conditions:
Reference Winter and Cold Winter1.
The main findings of the Winter Supply Outlook are:
> The European indigenous production continues to decrease year-on-year,
> On 1 October 2021, the EU storage level (75%) is one of the lowest in any ENTSOG Winter
Supply Outlook (831 TWh), with different situations among countries, for two main
reasons:
▪ Record high use of storage flexibility during winter 2020/2021, resulting in a low level of storage (336 TWh) at the beginning of the injection season,
▪ Low injection during Summer while observing unusual high gas prices,
> The European gas infrastructure offers sufficient flexibility to ensure security of gas
supply in Europe, provided gas is imported by the market on similar volumes as in recent
years,
> It can be noted that the EU gas infrastructure has been fully operational and functioning
during the Summer season and this status is expected to be maintained for the Winter
season 2021/22.
> However, in case of a cold Winter, the gas market would need to increase gas imports
from pipelines and/or LNG from 5% to 10% higher than the maximum volumes observed
in the recent years,
> It is important to emphasize that an early and significant withdrawal from storages will
result in low storage levels at the end of the Winter season. This will have negative
impact on the flexibility of the gas system – and can increase the exposure to demand
curtailment in the later part of the Winter season.
> South-Eastern Europe has significantly reduced its exposure to demand curtailment
following the commissioning of new infrastructure.
> However, countries within the risk groups of Ukraine and Baltic States/Finland can be
exposed to demand curtailment in case of extreme temperatures combined with import
route disruptions from Ukraine or Russia.
1 The Reference Winter and the Cold Winter are defined on the document.

Winter Supply Outlook 2021/22
SO0032-21
October 2021
Page 5 of 49
> The European gas system is also capable of supplying Energy Community Contracting
Parties and other EU neighbouring countries with significant volumes of gas,
> ENTSOG will monitor the evolution of the storage levels and import volumes throughout
the Winter and report on the situation on regular basis.
Important: ENTSOG Winter Supply Outlook 2021/2022 is an assessment of the readiness the gas infrastructure to manage the upcoming winter season under different scenarios, but the assessment is not a forecast of the expected gas supply situation. The actual utilisation of the gas infrastructure, including the development of the gas storage levels, will be determined by the decisions of the market participants.

Winter Supply Outlook 2021/22
SO0032-21
October 2021
Page 6 of 49
1. Introduction
This edition builds on previous Winter Supply Outlooks as well as on the supply assumptions
of the Security of Supply Simulation Report 2017 and demand data updated for the purpose
of 2021 edition. It aims to assess the ability of the European gas network to provide enough
flexibility to meet different demand situations and specially to face high demand situations.
Likewise, it aims to verify the consistency is ensured between “Cold Winter” and the SoS
simulation report assumptions.
Safety measures implemented in Europe and other continents, as a response of an extremely
rapid spread of the COVID-19 disease, are affecting global and local economy. TSOs were
encouraged to include this context in their estimations regarding the demand forecast and
capacity assumptions (including possible maintenance) provided for simulations.
Two different visions: winter period and high demand situations
As for previous reports, Winter Supply Outlook 2021/22 captures two different aspects of the
season. The first one is an outlook of demand and supply and the resulting evolution of the
UGS inventory along a Reference Winter and a Cold Winter. The second one is the analysis of
specific high demand situations (1-day Design Case and 2-Week Cold Spell), under the
framework of both reference and cold winters.
Given the exceptional situation of the storage level on 1 October 2021, ENTSOG additionally
performed a sensitivity analysis of the storage level at the end the winter season to assess the
interaction between imports and storage levels in case of a lower storage level than usually
observed.
Observations of the supply situations in the past show that the underground gas storages are
the most important flexibility assets in order to cope with the high demand variations during
the winter season. Therefore, this report pays special attention to the storages. The winter
months require storage withdrawal to cover both short high demand periods and the overall
winter demand. The actual level of withdrawal by shippers varies from one country to the
other and with climatic, price and regulatory parameters.
Currently, the European aggregated inventory level of underground gas storages levels on 1st
October is 831TWh.
Winter Supply Outlook relation to SoS simulation report:
Consistency with SoS simulation report: The results obtained in the Union-wide Security of
Supply Simulation Report 2017 are verified in the Winter Supply Outlook simulations
considering an updated projection of the “Cold Winter” demand. Supplies assumed in that

Winter Supply Outlook 2021/22
SO0032-21
October 2021
Page 7 of 49
report are based on TYNDP 2020 Scenario Report2 values with a methodology in line with the
Union-wide SoS simulation and explained further in this report. The transmission capacities
are updated by TSOs for the upcoming winter.
Assessment of supply disruptions: in line with the previous editions of the Winter Supply
Outlook, this report assesses the impact of the main supply disruption scenarios defined in
the SoS EU Regulation 2017/1938. The WSO assesses the impact of supply disruptions
occurring during a Peak Day or a 2-Week Cold Spell. The assessment of long supply disruptions
on the EU gas system is available in the EU-wide SoS simulation report on ENTSOG website3.
2. Assumptions
The simulations consider the existing European gas infrastructure as of 11th May 2021 (when
data collection started) and actual gas storage working gas volumes at the end of September
2021.
The modelling tool (Plexos) for the Winter Supply Outlook is the same as the one used in the
TYNDP and the Summer Supply Outlook. It considers the existing gas infrastructure and the
technical capacities updated by TSO with every WSO exercise.
The Winter Supply Outlook 2021/22 is developed based on assumptions specific to the
upcoming winter season as detailed in the annexes and short-term trends. In any case actual
withdrawal and supply mix will result from shippers’ decisions.
2.1. Seasonal Demand
A Reference Winter represents average climatic conditions with a 1-in-2 year probability of
occurrence. The demand data has been provided by TSOs on a monthly level. An average daily
demand has been considered for each month.
The demand for the Cold Winter is based on demand assumptions considered in SoS
simulations report4 and represents a historical high demand winter (see Annex B for country
detail). Cold Winter demand values have been updated in view of the publication of the
updated Union-wide SoS Simulation Report 2021.
2 https://www.entsos-tyndp2020-scenarios.eu/ 3 https://www.entsog.eu/security-of-supply-simulation 4 The methodology and assumptions performed to obtain the Cold Winter Demand in the three cases (whole winter, 2 weeks
and Peak Day) are explained in SoS simulations report, point 3.1. (Pages 8-9).
https://www.entsog.eu/public/uploads/files/publications/sos/ENTSOG%20Union%20wide%20SoS%20simulation%20report
_INV0262-171121.pdf
Winter Supply Outlook 2021/22
SO0032-21
October 2021
Page 8 of 49
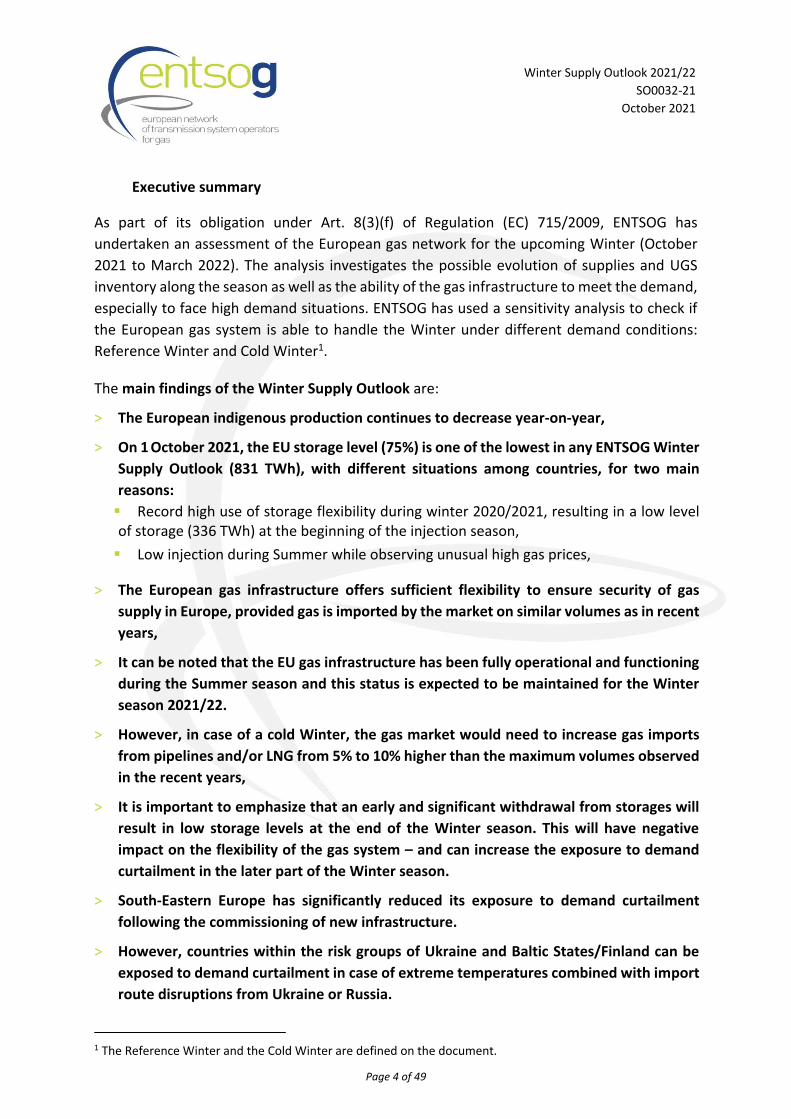
For comparison purpose, Figure 1 shows the European aggregated demand for the Reference
Winter and Cold Winter compared to the historical demand over the last 10 winters.
Figure 1. - European seasonal demand in the last 10 winters compared with the two visions.
The Reference Winter demand is slightly lower than the one observed during the last winter
(-2.1%) which was considered as cold. The Cold Winter demand is higher than the last ten
winters, and shows an overall demand of 13.5% higher than the total demand of winter
2020/21.
Furthermore, Reference and Cold Winter are higher compared with average demand of last
10 winters, 2.7% and 19% respectively.
2.2. Peak demand
Two high demand situations are considered: Peak Day demand and 2-Week Cold Spell
occurring in February. They are defined in the table below:
Period Occurrence of the demand provided by each TSO
1-in-20 Peak Day National design standard for gas demand, occurring on 15 February
1-in-20 2-Week Cold Spell High demand during a 14-day period in February (Cold Spell), occurring between
15 -28 February.
The Peak Day and 2-weeks demand are used to check if the withdraw capacity in the UGS is
enough to cope with a Peak Day or Cold Spell events at the end of February when the storages
are not at their maximum level (therefore, they are not at their maximum withdraw capacity).
Winter Supply Outlook 2021/22
SO0032-21
October 2021
Page 9 of 49
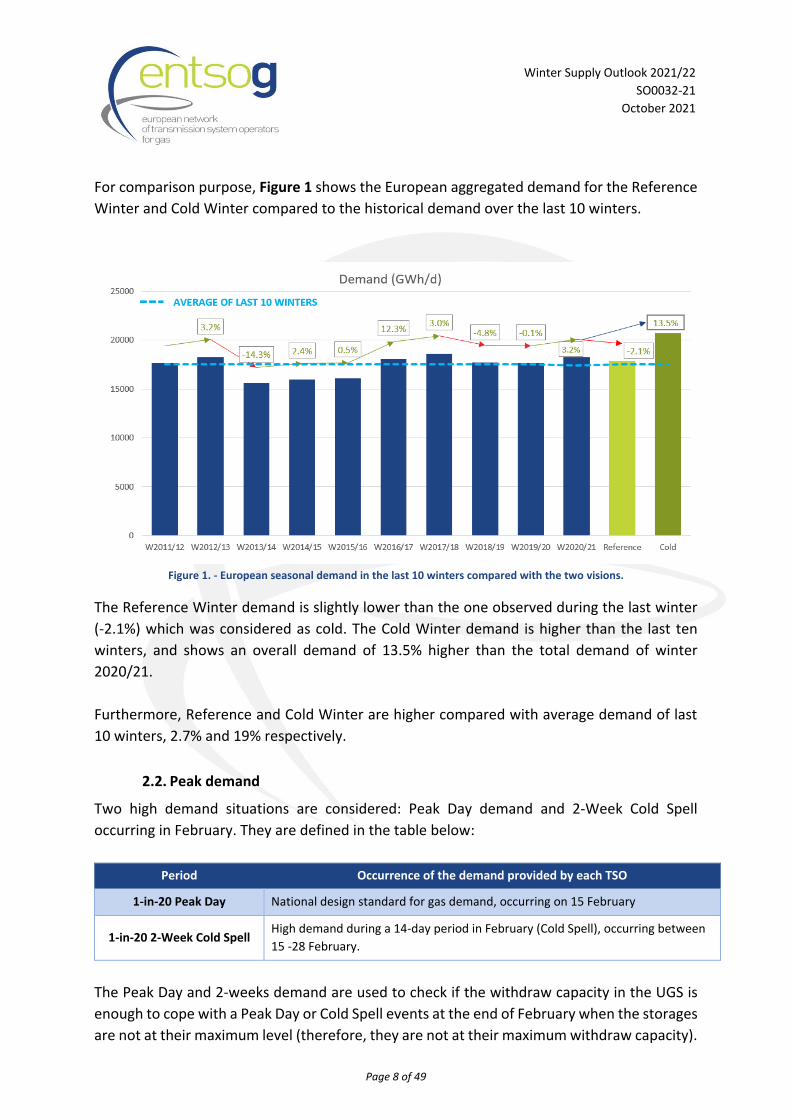
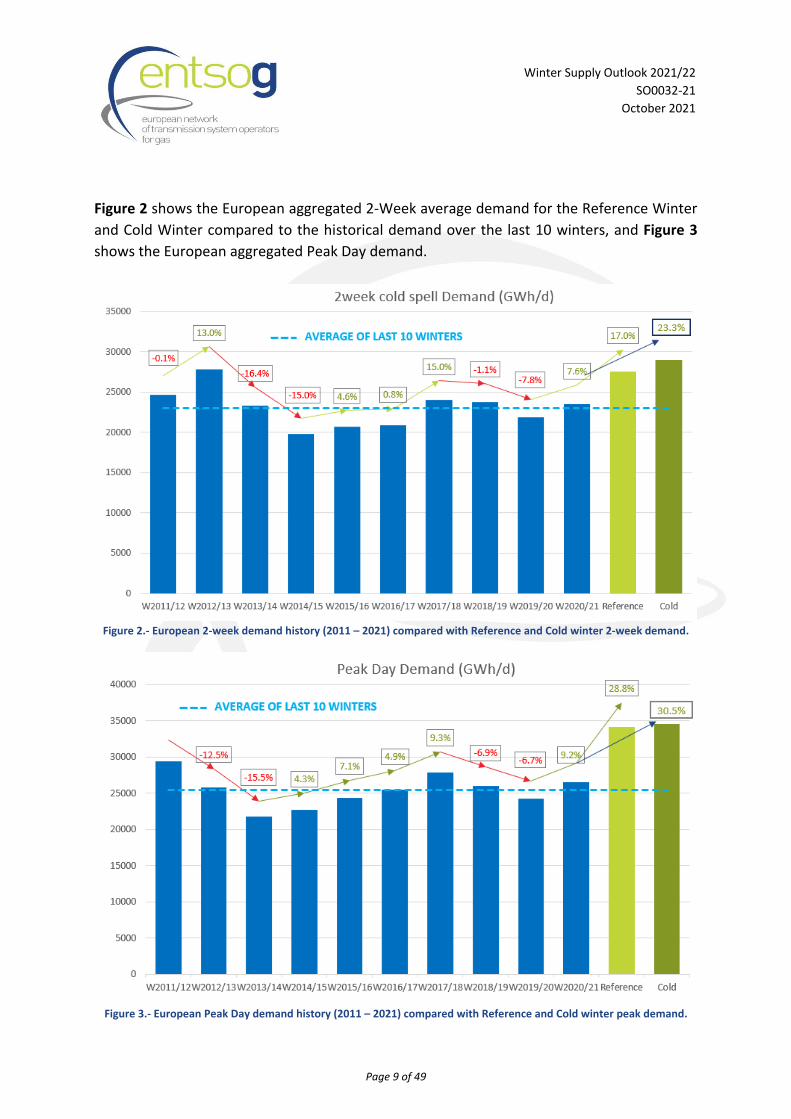
Figure 2 shows the European aggregated 2-Week average demand for the Reference Winter
and Cold Winter compared to the historical demand over the last 10 winters, and Figure 3
shows the European aggregated Peak Day demand.
Figure 2.- European 2-week demand history (2011 – 2021) compared with Reference and Cold winter 2-week demand.
Figure 3.- European Peak Day demand history (2011 – 2021) compared with Reference and Cold winter peak demand.

Winter Supply Outlook 2021/22
SO0032-21
October 2021
Page 10 of 49
The 2-Week Cold Spell demand for Reference Winter is significantly higher than the one
observed during the last winter (+17%) or the average of the last ten winters (+19.6%), but
comparable to the 2-week demand of 2012/2013. In case of a 2-Week Cold Spell5 in Cold
Winter the demand could be 23.3% higher than in winter 2020/21.
Due to its probability of occurrence (1-in-20 years), the Peak Day demand for Reference
Winter is higher than the one observed during the last winter (45.0%) and higher than the
average of the last ten winters (+28.8%). In case of a Peak Day in a Cold winter the demand
could be 30.5% than in winter 2020/21.
5 2-Week Cold Spell for Cold Winter: A period of 2 weeks of exceptionally high demand, occurring with a statistical probability
of once in 20 years.
Peak Day for Cold Winter: One day of exceptionally high demand, occurring with statistical probability of once in 20 years.

Winter Supply Outlook 2021/22
SO0032-21
October 2021
Page 11 of 49
2.3. Supply
A new source of gas is available for Europe since last winter with Trans Adriatic Pipeline
commissioned in November 2020 which connects Azerbaijan with Greece and Italy.
The maximum supply potentials of the different sources providing gas to the EU are based on
a 10-year history for Winter Season and on eight-year available history for 2-Week Cold Spell
and 1-day Design Case (Peak Day).
Supply limitations are set for different time scales or profiles (winter season, month, 2 weeks
and day) so that the maximum flow of each source cannot exceed reasonable levels based on
historical observations6. The detailed data is provided in the annexes. For each of the winter
demand profile and high demand situation, specific gas supply maximum availability has been
defined in Table 1:
National
Production UGS7 LNG Algeria, Norway, Libya, Russia
Winter
Season
TSO forecast
for winter.
Limited for each
country (or zone)
by the stored
volumes and the
deliverability
associated with
the inventory
level.
Limited for the whole winter period to the highest winter average supply
observed during the last 10 winters and at monthly level to the
maximum 30 days rolling average of the last 10 winters.
2-Week
Cold Spell TSO forecast
for high
demand
situations.
Week 1
Limited to the maximum 14 days rolling
average of the last 5 winters.
Limited to the observed
February flow in the model
plus additional LNG that can
be taken from the tanks to be
shared with week 2.
Week 2
Limited to the maximum 14
days rolling average of the last
5 winters plus additional LNG
that can be taken from the
tanks to be shared with week 1.
1-day
Design
Case
Limited to the maximum daily
supply of the last five winters
plus additional LNG that can
be taken from the tanks.
Limited to the maximum daily supply of
the last five winters.
Table 1.- Gas supply maximum availability definitions.
6 The methodology and an example of the supply assumptions calculations can be found in SoS simulations report, point 3.4.
(page13).https://www.entsog.eu/public/uploads/files/publications/sos/ENTSOG%20Union%20wide%20SoS%20simulation
%20report_INV0262-171121.pdf 7 UGS inventory on withdrawal deliverability has been considered using deliverability curves provided by GSE (see Annex A).
Winter Supply Outlook 2021/22
SO0032-21
October 2021
Page 12 of 49
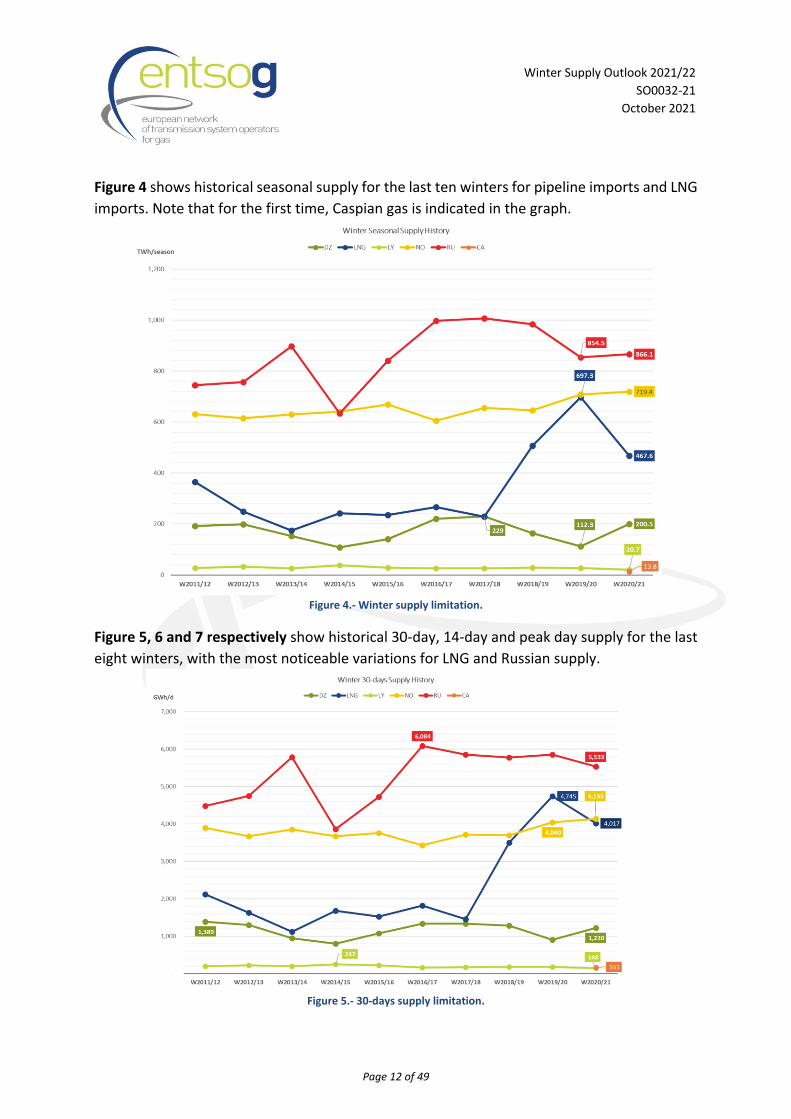
Figure 4 shows historical seasonal supply for the last ten winters for pipeline imports and LNG
imports. Note that for the first time, Caspian gas is indicated in the graph.
Figure 4.- Winter supply limitation.
Figure 5, 6 and 7 respectively show historical 30-day, 14-day and peak day supply for the last
eight winters, with the most noticeable variations for LNG and Russian supply.
Figure 5.- 30-days supply limitation.

Winter Supply Outlook 2021/22
SO0032-21
October 2021
Page 13 of 49
Figure 6.- 14 days supply limitation.
Figure 7.- Daily supply limitation.
Winter Supply Outlook 2021/22
SO0032-21
October 2021
Page 14 of 49
2.4. Consideration of Non-EU countries
When assessing the supply adequacy at European level, ENTSOG takes into account the
interactions with the countries neighbouring the EU: the United-Kingdom, Switzerland, North
Macedonia, Serbia, Bosnia Herzegovina, Ukraine, Turkey, Moldova and Kaliningrad (Russia).
The analysis considers Non-EU countries, including the Energy Community contracting parties,
taking into account the geography and the actual supply situation:
• The United-Kingdom, Switzerland, Bosnia and Herzegovina, North Macedonia, Serbia
are included in the modelling perimeter.
• Exports to Ukraine are based on the observed exports of the last five years8.
• Exports to Moldova have been set to zero following an investigation of the previous
flows.
• Exports to the Kaliningrad region of Russia are not considered.
• No exports towards Turkey were considered since Turk-Stream pipeline was
commissioned.
• Albania, Montenegro and Kosovo are not connected to the gas grid.
3. UGS inventory
3.1. Injection during summer
According to AGSI+, the gas storage data platform operated by GIE, the highest storage
withdrawals of the whole winter (2020-2021) reached 10.8 TWh on the 15th of January 2021.
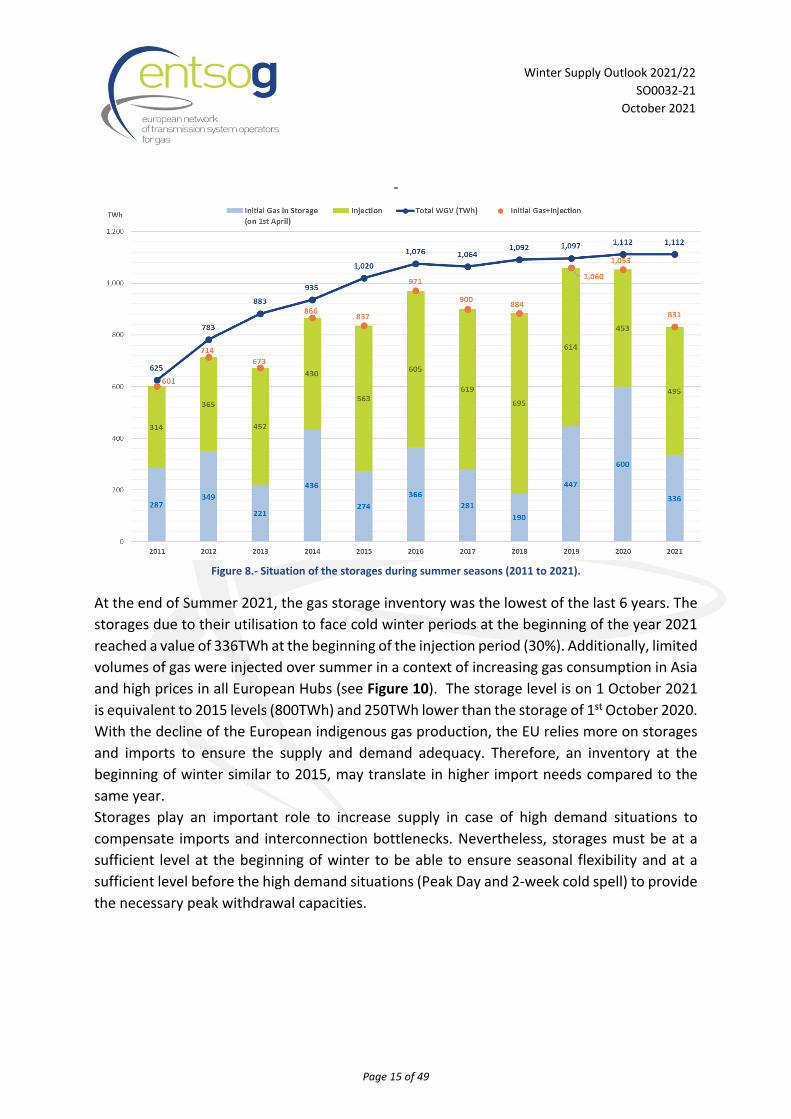
On 1 April, beginning of the injection period, the EU gas storage inventory was 336TWh, much
lower than the previous winter but more than in April 2018 value (190TWh) which however
was the lowest value at the beginning of the injection period since 2011. Figure 8 shows the
total WGV, the initial gas in the storages on 1st April and the gas injected during the summer
season between 2011 and 2021.
8 The value of the flow is indicated in the Annex B.
Winter Supply Outlook 2021/22
SO0032-21
October 2021
Page 15 of 49
-
Figure 8.- Situation of the storages during summer seasons (2011 to 2021).
At the end of Summer 2021, the gas storage inventory was the lowest of the last 6 years. The
storages due to their utilisation to face cold winter periods at the beginning of the year 2021
reached a value of 336TWh at the beginning of the injection period (30%). Additionally, limited
volumes of gas were injected over summer in a context of increasing gas consumption in Asia
and high prices in all European Hubs (see Figure 10). The storage level is on 1 October 2021
is equivalent to 2015 levels (800TWh) and 250TWh lower than the storage of 1st October 2020.
With the decline of the European indigenous gas production, the EU relies more on storages
and imports to ensure the supply and demand adequacy. Therefore, an inventory at the
beginning of winter similar to 2015, may translate in higher import needs compared to the
same year.
Storages play an important role to increase supply in case of high demand situations to
compensate imports and interconnection bottlenecks. Nevertheless, storages must be at a
sufficient level at the beginning of winter to be able to ensure seasonal flexibility and at a
sufficient level before the high demand situations (Peak Day and 2-week cold spell) to provide
the necessary peak withdrawal capacities.

Winter Supply Outlook 2021/22
SO0032-21
October 2021
Page 16 of 49
Figure 9 compare the stock level evolution of the last nine summers highlighting the initial
level on 1st April 2020.
Figure 9. Evolutions of UGS stock level. Summers 2011-2021 (TWh) (Source: AGSI+).
Figure 10. Day-ahead average gas price on European hubs (overall evolution since 2012 to September 2021 ).

Winter Supply Outlook 2021/22
SO0032-21
October 2021
Page 17 of 49
3.2. Initial storage level on 1 October 2021
The Winter Supply Outlook considers the actual storage inventory level per country as of 1
October 20219 (see Figure 11). As shown in the next map the storage inventory levels differ
from country to country.
Figure 11. - Actual storage inventory level on 1st October (for some countries, the initial level includes strategic stocks).
In terms of absolute volumes in gas storages, the largest ones are located in Italy, Germany,
France and the Netherlands. On 1 October 2021, the initial total UGS inventory is around 831
TWh compared to 1053 TWh in 2020. The actual levels for each country show substantial
differences from one country to the other.
In comparison to the previous years, Germany, the Netherlands, and Austria have a low
storage level. Summer Supply Outlook 2021 simulations have shown that the gas
infrastructure was able to reach 90% to 100% during the injection period. However, those
three countries, which represent a cumulated storage capacity of 470 TWh, i.e. 42% of
European storage, have seen limited injection over summer whilst The EU gas infrastructure
has been fully operational and functioning.
These levels could however increase in October since the injection season generally continues
in some countries until 1st November.
9 The gas in storage on 1st October 2021 for each country is based on the AGSI platform captured on 1st October 2021 complemented by other information sources for storages not reported on AGSI. The %Full has been calculated taking into
account the Working Gas Volume from GSE Storage MAP database (the last update was July 2021), updated with AGSI values
for WGV have been taken into account for those storages with remarkable difference.

Winter Supply Outlook 2021/22
SO0032-21
October 2021
Page 18 of 49
4. Assessment of Reference Winter and Cold Winter seasons
4.1. Supply and demand adequacy
considering the UGS inventory level at the beginning of the season, as well as the supply
availability, the gas system can ensure supply and demand adequacy in all countries for either
a Reference Winter or a Cold Winter.
Figure 12 shows the supply and demand balance at European level for the Reference Winter
and the Cold Winter demands.
Figure 12. Supply and demand adequacy - Reference Winter and Cold Winter.

Winter Supply Outlook 2021/22
SO0032-21
October 2021
Page 19 of 49
These charts illustrate the evolution of supply and demand10 for Reference and Cold Winter
seasons. As observed in recent history, LNG, Russian supply and storages can provide most of
the flexibility. It should be noted that the import levels shown in figure 12 represents one of
the possible supply mixes, with LNG ensuring the import flexibility in this example.
Since 2020, the Caspian imports can cover a part of the demand.
Note: the supply assumptions are based on the supply observed in the last ten winters and
should not be considered as a forecast. The actual supply mix will depend on market behaviour
and other external factors.
4.2. Evolution of gas storages inventory level
Can the gas system reach a 30% storage level on 1 April 2022?
The import potentials of the different supply sources allow the European storages to play their
role as an additional source of flexibility and reach an inventory target level of 30% (55%11 in
the case of Spain) at the end of the winter in all the EU countries for in a Reference Winter. In
such scenario, the withdrawal capacities of the gas storages combined with the supply
flexibility of imports is sufficient to cover the demand. In some countries, gas volumes can
even be further injected until 1st November.
However, in case of a Cold Winter, while imports are able to bring additional flexibility
compared to the reference winter simulation, they cannot fully compensate the storage
flexibility. Therefore, the EU aggregated inventory level at the end of the Cold Winter can’t
reach the 30% target inventory levels and, as additional gas has to be withdrawn from the
storages to ensure the supply and demand adequacy, the inventory level ends at 28% on 1
April 2022. The level of imports consider in this simulation are in line with the assumed
potential for each source, but is higher than the import levels observed in recent history (see
Figure 15).
What could be the consequence of a lower storage level on 1 April?
In case of a higher use of the storages during the early winter season resulting in a low storage
level at the end of the season (15% on 1 April), the withdrawal capacities of the storages could
be reduced to less than 55% of their nominal capacity after 15 February. Therefore, the
flexibility available from the storages in case of a peak day or a 2-week cold spell could be
reduced at the end of the winter season.
10 Demand data also considers exports and injection during October and November. 11 Spanish TSO has confirmed that storages in Spain should not be used below 55% for Reference Winter and
Cold Winter simulations. It can be used for particularly stressful situations as in the case of Algerian Disruption.

Winter Supply Outlook 2021/22
SO0032-21
October 2021
Page 20 of 49
Figure 13 shows the evolution of the European aggregated UGS inventory level resulting from
the assumptions defined in the previous chapters for the Reference Winter and the Cold
Winter. The storage withdrawal capacities on 15 February are indicated for each scenario.
Figure 13. - Winter evolution of the aggregated UGS stock level.
Table 2. - Monthly EU inventory level evolution for Reference Winter and Cold Winter with a 30% inventory target
% WGV 1/10/2021 1/11/2021 1/12/2021 1/01/2022 1/02/2022 1/03/2022 1/04/2022
Cold Winter 75% 74% 72% 58% 42% 31% 28%
Reference Winter 75% 73% 68% 58% 43% 34% 30%

Winter Supply Outlook 2021/22
SO0032-21
October 2021
Page 21 of 49
Impact of storage levels on the storage withdrawal capacities
The capacity of the gas system to deliver gas during a peak day or a cold event depends on
the storage level as illustrated by Figure 14 (data for each storage is available in annex A table
4). Therefore, using more flexibility from the storages over winter will reduce the need for
imports but can reduce the flexibility of the gas system in case of a cold spell late in the winter,
when storage levels are low.
Figure 14. EU average withdrawal capacity for storages depending on their filling level
Interaction Imports / Storage use
During the winter season, the supply and demand adequacy is ensured by imported gas and
gas withdrawn from the storages, the actual use of imports and storage are eventually
determined by the decisions made by the market participants.
In Figure 15, a sensitivity analysis of the final storage level at the end of the winter shows that:
• In the Reference Winter (1-in-2 years) scenario, the level of imports needed to reach
30% of the storage level at the end of the season would require a level of imports
comparable to previous winters.
• In the Cold Winter scenario, the assumed import potentials are too limited to reach a
30% storage level and additional gas needs to be withdrawn from the storages to
ensure the supply and demand adequacy. In this scenario, the average EU storage
level reached on 1 April 2022 is 27%. Furthermore, reaching 27% inventory level
requires higher imports than observed in recent history (+11% compared to winter
2020/2021).
• In a Cold Winter scenario, a storage level of 15% at the end of the winter would reduce
the need for imports to reach levels close to recent history. However, it would also reduce the
withdrawal capacities of the storages and thus, the supply flexibility of the gas system.
Winter Supply Outlook 2021/22
SO0032-21
October 2021
Page 22 of 49
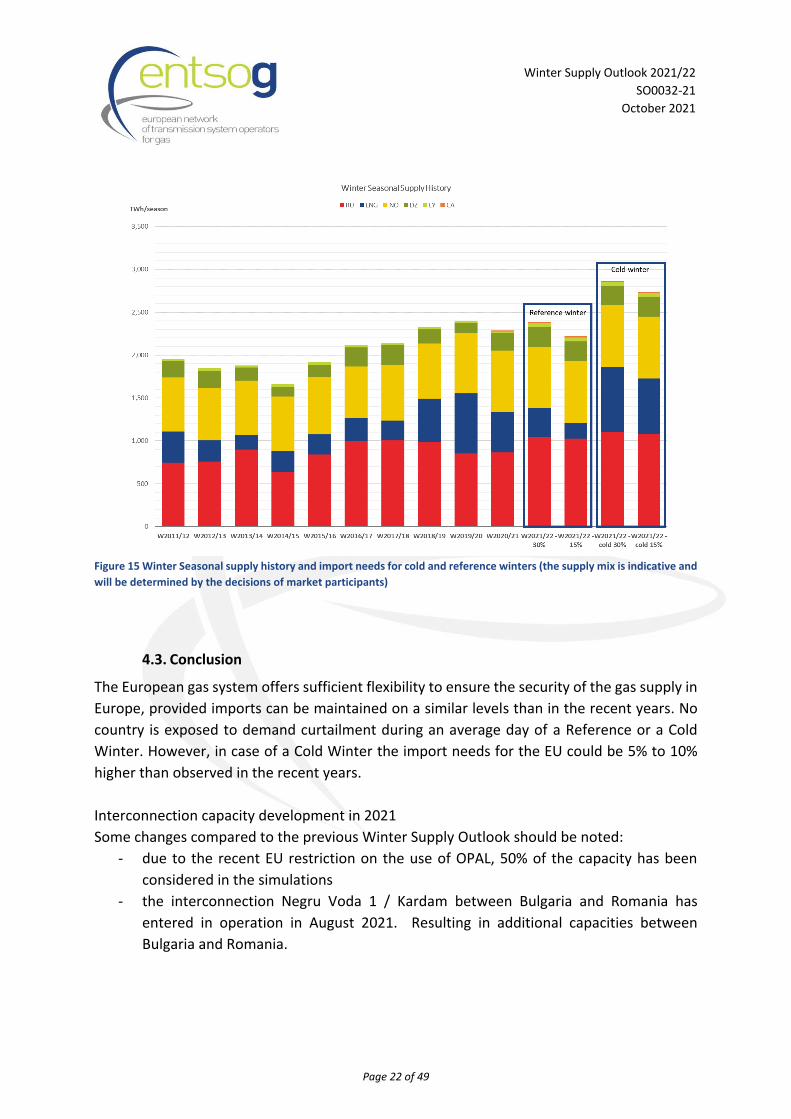
Figure 15 Winter Seasonal supply history and import needs for cold and reference winters (the supply mix is indicative and
will be determined by the decisions of market participants)
4.3. Conclusion
The European gas system offers sufficient flexibility to ensure the security of the gas supply in
Europe, provided imports can be maintained on a similar levels than in the recent years. No
country is exposed to demand curtailment during an average day of a Reference or a Cold
Winter. However, in case of a Cold Winter the import needs for the EU could be 5% to 10%
higher than observed in the recent years.
Interconnection capacity development in 2021
Some changes compared to the previous Winter Supply Outlook should be noted:
- due to the recent EU restriction on the use of OPAL, 50% of the capacity has been
considered in the simulations
- the interconnection Negru Voda 1 / Kardam between Bulgaria and Romania has
entered in operation in August 2021. Resulting in additional capacities between
Bulgaria and Romania.

Winter Supply Outlook 2021/22
SO0032-21
October 2021
Page 23 of 49
5. High demand situations
5.1. Assumptions
In addition to the assessment of the gas system to cope with the winter demand seasonality,
Winter Supply Outlook 2021/2022 assesses the ability of the gas system to cope with high
demand situations such as a 1-in-20 years Peak Day and a 1-in-20 years 2-week Cold Spell. The
Peak Day is assessed on 15 February and the 2-week Cold Spell between 15 and 28 February
for both Refence Winter and Cold Winter scenarios. The initial storages levels are extracted
from the winter simulations for 14th February (end of day), for both Peak Day and 2-Week Cold
Spell as shown as example in Figure 16for Cold Winter situation. The corresponding storage
withdrawal capacities are then considered for the assessment (see Annex A).
Figure 16.- 2-Week and Peak Day simulations.
5.2. Supply mix
In high demand situations, all supply sources are used to higher levels. This additional supply
comes from the sources with a high flexibility potential and is observed especially from the
gas storages, but also from LNG and Russian imports.
Figure 17. - Comparison of supply mixes in February vs high demand situations (LNG includes tanks withdrawal).

Winter Supply Outlook 2021/22
SO0032-21
October 2021
Page 24 of 49
During a 2-Week Cold Spell, an evolution between the 1st and the 2nd week can be observed
due to the flexibility available from the LNG tanks and different withdrawal capacities from
gas storage. The values in the graph are the average of these 2 weeks. Withdrawal capacities
from gas storages depends on their level (see figure 17). In case of a Peak Day, LNG and storage
flexibilities are essential to cover the demand.

Winter Supply Outlook 2021/22
SO0032-21
October 2021
Page 25 of 49
5.3. Conclusion
Indicators
For each high demand situation and each zone, modelling results consist in the calculation
of:
> Curtailment Rate: The potential level of demand curtailment representing the share of the
gas demand that cannot be satisfied (calculated as a daily volume). The level of demand
curtailment is assessed considering a cooperative behavior between European countries
in order to mitigate its relative impact. This means that all countries try to reduce the
curtailment rate of other countries by sharing it.
> Remaining Flexibility: this indicator measures resilience at balancing zone level during climatic stresses (see Annex C for detailed calculation process).
Note: to give a comparable picture of the situation and avoid any distortion in the cooperative behaviour of ENTSOG’s model, all indicators consider the demand as it is defined in the assumptions. However, in practice, a reduction of demand is observed in case of risk of inadequacy between supply and demand, generally as a consequence of increasing prices. This demand response to high prices is not considered in the results and should be given due attention when interpreting the risk exposure to demand curtailment in the different countries. This is why an exposure to few percentiles of demand curtailment observed in a country is generally considered as a limited risk in this assessment.
Summary
Reference Winter Cold Winter
> 1-in-20 Peak Day Demand Curtailment
No exposure No exposure
Remaining Flexibility below 20%
DK 10%
UK 10%
DK 10%, IE 16%, UK 14%
1-in-20 2-week Cold Spell Demand Curtailment
No exposure No exposure
Remaining Flexibility below 20%
None None
Table 3. – Exposure to demand curtailment and remaining flexibility for Reference and Cold Winter.

Winter Supply Outlook 2021/22
SO0032-21
October 2021
Page 26 of 49
Conclusions for the Reference Winter scenario:
> Peak Day: No demand curtailment, some countries have limited Remaining Flexibility
(Denmark and United Kingdom) below 20%.
> 2-Week Cold Spell: No demand curtailment, all countries having more than 20% Remaining
Flexibility.
Conclusions for the Cold Winter scenario:
> Peak Day: No demand curtailment, some countries have limited Remaining Flexibility
(Denmark, Ireland and United Kingdom) below 20%.
> 2-Week Cold Spell: No demand curtailment, all countries having more than 20% Remaining
Flexibility.
Further information regarding the evolution of the Remaining Flexibility since Winter Supply
Outlook 2020/2021:
> In Peak Day, Reference Winter:
> Denmark shows slight decrease of Remaining Flexibility compared to previous exercise due
to less flows from Germany and storage. Croatia is having 90% Remaining Flexibility, thanks
to Krk Terminal operational in 2020. France improved its Remaining Flexibility for H-gas
due to a lower demand but the indicator decreased in the L-gas region. UK with less than
10% of remaining flexibility has a lower value compared to previous edition due to reduced
available capacities from its storages. Finland improved its Remaining Flexibility due to a
decreasing demand.
> In Peak Day, Cold Winter: UK improved its remaining flexibility compared to reference winter with lower demand value in Cold Winter. The Cold Winter demand submitted by the UK considers the 2023 time horizon which anticipates a lower demand than expected for 2021/2022
Winter Supply Outlook 2021/22
SO0032-21
October 2021
Page 27 of 49
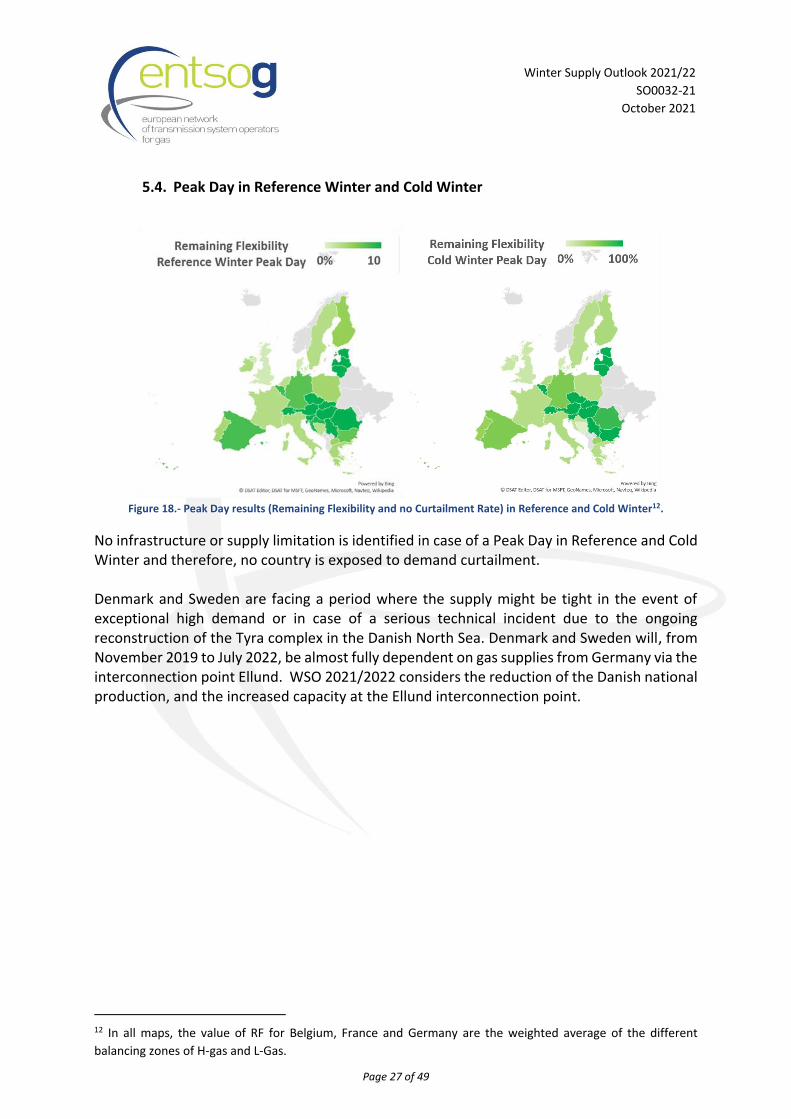
5.4. Peak Day in Reference Winter and Cold Winter
Figure 18.- Peak Day results (Remaining Flexibility and no Curtailment Rate) in Reference and Cold Winter12.
No infrastructure or supply limitation is identified in case of a Peak Day in Reference and Cold Winter and therefore, no country is exposed to demand curtailment. Denmark and Sweden are facing a period where the supply might be tight in the event of exceptional high demand or in case of a serious technical incident due to the ongoing reconstruction of the Tyra complex in the Danish North Sea. Denmark and Sweden will, from November 2019 to July 2022, be almost fully dependent on gas supplies from Germany via the interconnection point Ellund. WSO 2021/2022 considers the reduction of the Danish national production, and the increased capacity at the Ellund interconnection point.
12 In all maps, the value of RF for Belgium, France and Germany are the weighted average of the different
balancing zones of H-gas and L-Gas.

Winter Supply Outlook 2021/22
SO0032-21
October 2021
Page 28 of 49
5.5. 2-Week Cold spell in Reference Winter and Cold Winter
Figure 19. 2-Week Cold Spell results (Remaining Flexibility and Curtailment Rate) in Reference and Cold Winters 13.
No infrastructure or supply limitation is identified in case of a Peak Day in Reference and Cold Winter and therefore, no country is exposed to demand curtailment.
13 The results shown are average of the 2-Week Cold Spell.

Winter Supply Outlook 2021/22
SO0032-21
October 2021
Page 29 of 49
6. Supply route disruptions
This section investigates the potential impact of a supply route disruption during high demand
situations and during a Cold Winter. Results presented in this report show the additional effect
of the supply route disruptions. In case a country would be exposed to demand curtailment
under high demand situations – but without supply route disruption, only the additional
impact is analysed and highlighted in the maps.
This vision is included in ENTSOG’s Winter Supply Outlooks since Winter Supply Outlook
2013/14. However, since 2017, the disruptions scenarios considered in the Winter Supply
Outlooks are aligned with the Security of Supply Simulations Report where 17 supply and
infrastructure disruption scenarios are assessed. For this WSO, the purpose is to provide an
update of the situation for the upcoming winter for those disruption scenarios showing some
risk of demand curtailment. Cold Winter demand data are those provided by TSOs for SOS
2021.
Winter Supply Outlook assessment focuses on disruption scenarios during Peak Day and 2-
Week Cold Spells. All other disruption scenarios, including the 2-month disruptions, are
considered in Union-wide Security of Supply Simulation Report14 and are updated every 4
years according to the regulatory requirements.
The disruption scenarios and the risk groups considered in this report are aligned with the
Annex I of the Regulation (EU) 2017/1938 of the European Parliament and of the Council of
25 October 2017 concerning measures to safeguard the security of gas supply and repealing
Regulation (EU) No 994/2010. Further information on the impact of supply route disruptions
on the gas system can be found in the Union-wide Security of Supply Simulation Report
published by ENTSOG in 2017. The new edition of the report will be published in November
2021.
Scope of the assessment
Supply route disruption:
▪ Ukraine
▪ Belarus
▪ Baltics states and Finland supply
▪ Algerian pipeline imports.
Demand cases
14 https://www.entsog.eu/security-of-supply-simulation#union-wide-simulation-of-supply-and-infrastructure-
disruption-scenarios

Winter Supply Outlook 2021/22
SO0032-21
October 2021
Page 30 of 49
▪ 1-in-20 Peak Day during a Cold Winter
▪ 1-in-20 2-week Cold Spell during a Cold Winter
The approach for the allocation of demand curtailment is applied according to the Security of
Supply report: all member States within a risk group as defined in Annex I of Regulation
2017/1938 cooperate by avoiding a demand curtailment to the extent possible and, be it the
case, by sharing the curtailment equally in such a way that they try to reach the same
Curtailment Rate. For SOS 2021, risk groups will be updated to take in consideration the
infrastructure projects commissioned in 2022.
Winter Supply Outlook 2021/22
SO0032-21
October 2021
Page 31 of 49
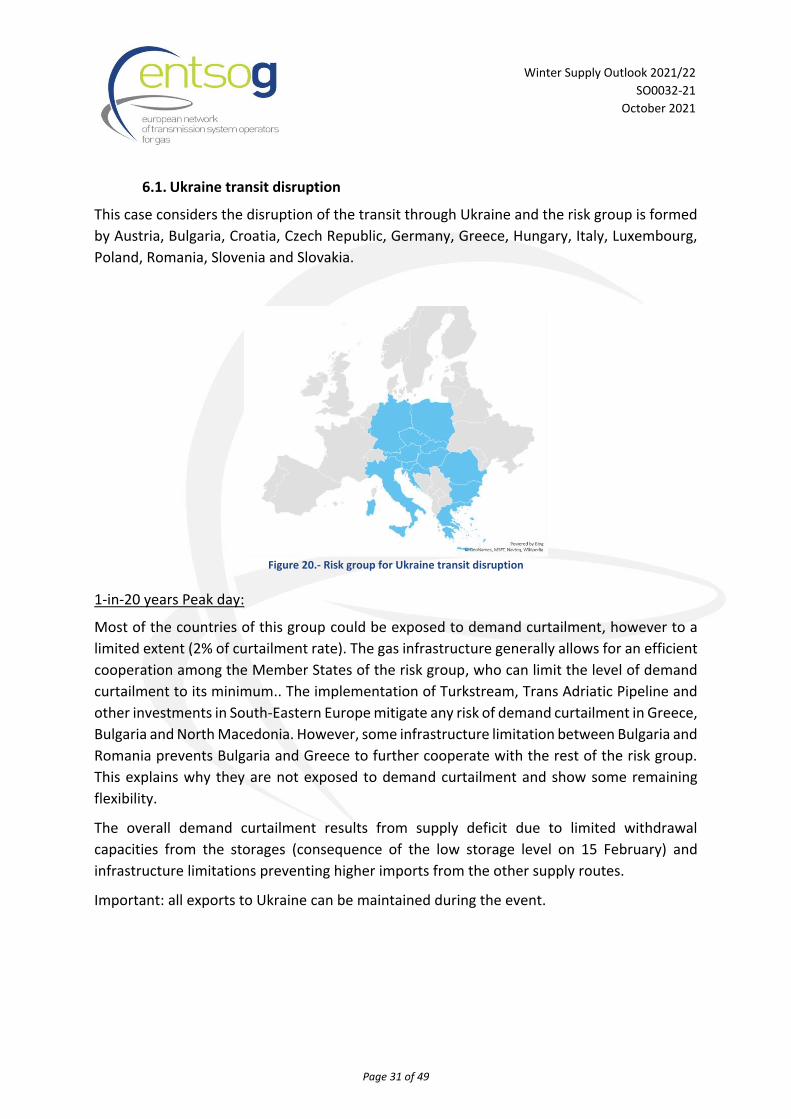
6.1. Ukraine transit disruption
This case considers the disruption of the transit through Ukraine and the risk group is formed
by Austria, Bulgaria, Croatia, Czech Republic, Germany, Greece, Hungary, Italy, Luxembourg,
Poland, Romania, Slovenia and Slovakia.
Figure 20.- Risk group for Ukraine transit disruption
1-in-20 years Peak day:
Most of the countries of this group could be exposed to demand curtailment, however to a
limited extent (2% of curtailment rate). The gas infrastructure generally allows for an efficient
cooperation among the Member States of the risk group, who can limit the level of demand
curtailment to its minimum.. The implementation of Turkstream, Trans Adriatic Pipeline and
other investments in South-Eastern Europe mitigate any risk of demand curtailment in Greece,
Bulgaria and North Macedonia. However, some infrastructure limitation between Bulgaria and
Romania prevents Bulgaria and Greece to further cooperate with the rest of the risk group.
This explains why they are not exposed to demand curtailment and show some remaining
flexibility.
The overall demand curtailment results from supply deficit due to limited withdrawal
capacities from the storages (consequence of the low storage level on 15 February) and
infrastructure limitations preventing higher imports from the other supply routes.
Important: all exports to Ukraine can be maintained during the event.

Winter Supply Outlook 2021/22
SO0032-21
October 2021
Page 32 of 49
Figure 21. Peak Day results (Remaining Flexibility and Curtailment Rate) for Ukraine transit disruption.
1-in-20 years 2-Week Cold Spell:
As for the Peak Day, the situation in this risk group has improved compared to last year with
the implementation of TurkStream, Trans Adriatic Pipeline and other investments in the
region. The simulation results show that in case of 2-Week Cold Spell combined with a
disruption of Ukrainian supply route, the gas infrastructure allows for an efficient cooperation
among the countries, and no Member State is exposed to demand curtailment. However, the
whole region shows a limited remaining flexibility.
Figure 22. 2-Week Cold Spell results (Remaining Flexibility and Curtailment Rate) for Ukraine transit disruption

Winter Supply Outlook 2021/22
SO0032-21
October 2021
Page 33 of 49
6.2. Belarus transit disruption
This case considers the disruption of the transit through Belarus and the risk group is formed
by Czech Republic, Belgium, Estonia, Germany, Latvia, Lithuania, Luxembourg, Netherlands,
Poland, Slovakia
Figure 23. Risk group for Belarus disruption.
1-in-20 years Peak day:
The results show that in the case of a Peak Day combined with a Belarus supply route
disruption, the gas infrastructure allows for an efficient cooperation among the countries and
no Member State is exposed to demand curtailment. However, Poland, Latvia, Lithuania and
Estonia show a decreasing Remaining Flexibility.
Figure 24. Peak Day results (Remaining Flexibility and Curtailment Rate) for Belarus disruption.
Winter Supply Outlook 2021/22
SO0032-21
October 2021
Page 34 of 49
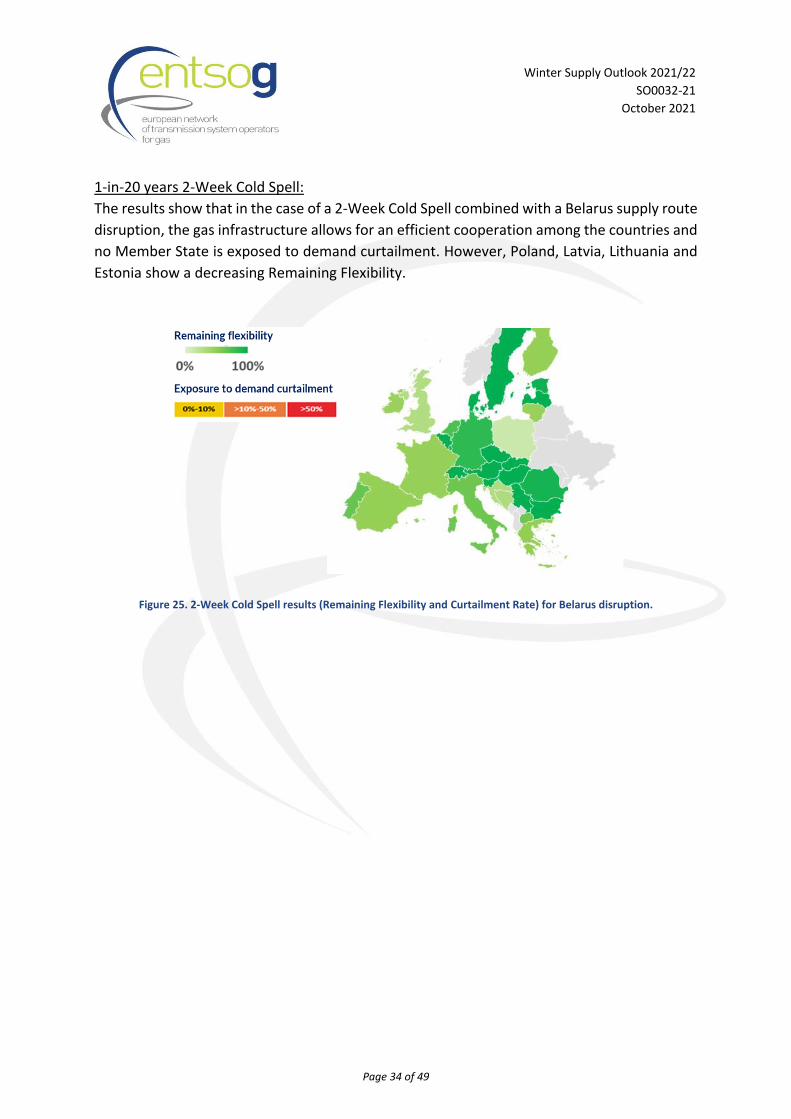
1-in-20 years 2-Week Cold Spell:
The results show that in the case of a 2-Week Cold Spell combined with a Belarus supply route
disruption, the gas infrastructure allows for an efficient cooperation among the countries and
no Member State is exposed to demand curtailment. However, Poland, Latvia, Lithuania and
Estonia show a decreasing Remaining Flexibility.
Figure 25. 2-Week Cold Spell results (Remaining Flexibility and Curtailment Rate) for Belarus disruption.

Winter Supply Outlook 2021/22
SO0032-21
October 2021
Page 35 of 49
6.3. Baltics States and Finland Disruption
This case considers the disruption of the imports to the Baltic states and Finland and the risk
group is formed by Estonia, Finland, Latvia, Lithuania.
Figure 26.- Risk group for Baltic states and Finland disruption.
1-in-20 years Peak day:
The results show that in case of a Peak Day combined with a disruption of the imports to Baltic
states and Finland, all countries are exposed to significant levels of demand curtailment:
Finland (77%), Estonia (17%), Latvia (17%) and Lithuania (17%). Some infrastructure limitations
between the risk group and the rest of the EU prevents any cooperation with the other
Member States. However, within the risk group the Baltic States can efficiently cooperate and
share the same level of demand curtailment, but the connection between Estonia and Finland
is limited and does not allow for further cooperation with Finland.
Figure 27. Peak Day results (Remaining Flexibility and Curtailment Rate) for Baltic states and Finland disruption.

Winter Supply Outlook 2021/22
SO0032-21
October 2021
Page 36 of 49
Note: Demand curtailment in Finland is presented excluding the country-specific possibility to
use other back-up fuels for gas. The implementation of the Balticconnector project allows gas
to flow from the Baltic States to support Finland. However, Balticconnector has not reached
its full design capacity yet.
1-in-20 2-Week Cold Spell:
The results show that, in case of a 2-Week Cold Spell combined with a disruption of the
imports to Baltic states and Finland, Finland (74%), Estonia (8%), Latvia (8%) and Lithuania
(8%) are facing demand curtailment. Some infrastructure limitations between the risk group
and the rest of the EU prevents any cooperation with the other Member States. However,
within the risk group the Baltic States can efficiently cooperate and share the same level of
demand curtailment, but the connection between Estonia and Finland is limited and does not
allow for further cooperation with Finland.
Figure 28. 2-Week Cold Spell results (Remaining Flexibility and Curtailment Rate) for Baltic states and Finland disruption.

Winter Supply Outlook 2021/22
SO0032-21
October 2021
Page 37 of 49
6.4. Algerian Pipes Disruption
This case considers the disruptions of the imports from Algeria via pipelines and the risk group
is formed by Austria, Croatia, France, Greece, Italy, Malta, Portugal, Slovenia and Spain.
Figure 29. Risk group for Algerian pipes disruption.
1-in-20 years Peak Day:
The results show that in the case of a Peak Day combined with Algerian pipeline imports
disruption, the gas infrastructure, including LNG terminal capacities in Spain and Italy and
Trans Adriatic Pipeline, allows for an efficient cooperation among the countries and no
country is exposed to demand curtailment.
Figure 30. Peak Day results (Remaining Flexibility and Curtailment Rate) for Algerian disruption.

Winter Supply Outlook 2021/22
SO0032-21
October 2021
Page 38 of 49
1-in-20 years 2-Week Cold Spell:
The results show that in the case of a 2-Week Cold Spell combined with Algerian disruption,
the gas infrastructure allows for an efficient cooperation among the countries and no
countries are facing demand curtailment.
Figure 31. 2-Week Cold Spell results (Remaining Flexibility) for Algerian disruption.

Winter Supply Outlook 2021/22
SO0032-21
October 2021
Page 39 of 49
7. Conclusions
According to the ENTSOG modelling and supply assumptions, this Winter Supply Outlook
confirms the ability of the European gas infrastructures to face a Cold Winter 2021/2022 with
sufficient flexibility in most parts of Europe. This assessment is valid throughout the season
and under high demand situations.
Winter Supply Outlook 2021/2022 assessment highlights:
The main findings of the Winter Supply Outlook are:
> The European indigenous production continues to decrease year-on-year,
> On 1 October 2021, the EU storage level (75%) is one of the lowest in any ENTSOG Winter
Supply Outlook (831 TWh), with different situations among countries, for two main
reasons:
▪ Record high use of storage flexibility during winter 2020/2021, resulting in a low level of storage (336 TWh) at the beginning of the injection season,
▪ Low injection during Summer while observing unusual high gas prices,
> The European gas infrastructure offers sufficient flexibility to ensure security of gas
supply in Europe, provided gas is imported by the market on similar volumes as in recent
years,
> It can be noted that the EU gas infrastructure has been fully operational and functioning
during the Summer season and this status is expected to be maintained for the Winter
season 2021/22.
> However, in case of a cold Winter, the gas market would need to increase gas imports
from pipelines and/or LNG from 5% to 10% higher than the maximum volumes observed
in the recent years,
> It is important to emphasize that an early and significant withdrawal from storages will
result in low storage levels at the end of the Winter season. This will have negative
impact on the flexibility of the gas system – and can increase the exposure to demand
curtailment in the later part of the Winter season.
> South-Eastern Europe has significantly reduced its exposure to demand curtailment
following the commissioning of new infrastructure.
> However, countries within the risk groups of Ukraine and Baltic States/Finland can be
exposed to demand curtailment in case of extreme temperatures combined with import
route disruptions from Ukraine or Russia.
> The European gas system is also capable of supplying Energy Community Contracting
Parties and other EU neighbouring countries with significant volumes of gas,

Winter Supply Outlook 2021/22
SO0032-21
October 2021
Page 40 of 49
> ENTSOG will monitor the evolution of the storage levels and import volumes throughout
the Winter and report on the situation on regular basis.
Important: ENTSOG Winter Supply Outlook 2021/2022 is an assessment of the readiness the gas infrastructure to manage the upcoming winter season under different scenarios, but the assessment is not a forecast of the expected gas supply situation. The actual utilisation of the gas infrastructure, including the development of the gas storage levels, will be determined by the decisions of the market participants.

Winter Supply Outlook 2021/22
SO0032-21
October 2021
Page 41 of 49
8. Legal Notice
The current analysis is developed specifically for this Winter Supply Outlook. It results from
TSOs experience, ENTSOG modelling and supply assumptions and should not be considered as
a forecast. The actual supply mix and storage level on 31st March 2022 will depend on market
behaviour and global factors.
ENTSOG has prepared this Winter Supply Outlook in good faith and has endeavoured to
prepare this document in a manner which is, as far as reasonably possible, objective, using
information collected and compiled by ENTSOG from its members and from stakeholders
together with its own assumptions on the usage of the gas transmission system. While
ENTSOG has not sought to mislead any person as to the contents of this document, readers
should rely on their own information (and not on the information contained in this document)
when determining their respective commercial positions. ENTSOG accepts no liability for any
loss or damage incurred as a result of relying upon or using the information contained in this
document.

Winter Supply Outlook 2021/22
SO0032-21
October 2021
Page 42 of 49
Annex A - Underground Storages assumptions
UGS deliverability curve In order to capture the influence of UGS inventory level on the withdrawal capacity, ENTSOG has used the deliverability curves made available by GSE. These curves represent a weighted average of the facilities (salt caverns, aquifers or depleted fields) of each area.
* UGS Dolni Bojanovice located in Czech Republic but only connected the Slovak market
Table 4. - UGS deliverability curves.
100% 90% 80% 70% 60% 50% 40% 30% 20% 10% 1% 0%
AT 100% 99% 98% 97% 96% 95% 88% 80% 71% 63% 57% 0%
BEh 100% 100% 100% 100% 100% 100% 100% 20% 20% 10% 10% 0%
BGn 100% 100% 100% 100% 100% 100% 95% 85% 75% 66% 57% 0%
HR 100% 100% 100% 100% 100% 96% 80% 65% 48% 32% 14% 0%
CY 0% 0% 0% 0% 0% 0% 0% 0% 0% 0% 0% 0%
CZ 100% 100% 100% 100% 100% 97% 80% 70% 50% 40% 20% 0%
CZd* 100% 100% 99% 98% 98% 98% 84% 70% 56% 41% 27% 0%
DK 100% 100% 100% 100% 100% 100% 100% 100% 85% 33% 25% 0%
EE 0% 0% 0% 0% 0% 0% 0% 0% 0% 0% 0% 0%
FI 0% 0% 0% 0% 0% 0% 0% 0% 0% 0% 0% 0%
Fra 100% 95% 90% 85% 80% 75% 66% 57% 48% 39% 30% 0%
FRn 100% 96% 91% 87% 83% 78% 72% 65% 58% 49% 38% 0%
FRnL 100% 100% 100% 100% 100% 100% 100% 100% 100% 93% 85% 0%
FRs 100% 97% 94% 91% 88% 85% 79% 73% 66% 56% 27% 0%
FRt 100% 100% 100% 100% 100% 100% 91% 74% 57% 39% 22% 0%
DE 100% 100% 100% 99% 99% 99% 86% 74% 60% 46% 31% 0%
GR 0% 0% 0% 0% 0% 0% 0% 0% 0% 0% 0% 0%
HU 100% 100% 100% 100% 100% 97% 95% 84% 72% 52% 40% 0%
IE 0% 0% 0% 0% 0% 0% 0% 0% 0% 0% 0% 0%
IT 100% 100% 99% 98% 98% 98% 84% 70% 56% 41% 27% 0%
LV 100% 100% 100% 90% 80% 70% 50% 40% 25% 20% 20% 0%
LT 0% 0% 0% 0% 0% 0% 0% 0% 0% 0% 0% 0%
NL 100% 98% 96% 95% 93% 91% 81% 70% 59% 48% 37% 0%
PL 100% 100% 99% 98% 97% 90% 84% 72% 65% 51% 29% 0%
PT 100% 100% 100% 100% 85% 85% 85% 85% 85% 85% 85% 0%
RO 100% 100% 99% 98% 98% 98% 84% 70% 56% 41% 27% 0%
RS 100% 100% 99% 98% 98% 98% 84% 70% 56% 41% 27% 0%
SK 100% 99% 97% 96% 93% 88% 82% 74% 65% 55% 44% 0%
SI 0% 0% 0% 0% 0% 0% 0% 0% 0% 0% 0% 0%
ES 100% 80% 72% 67% 63% 60% 55% 50% 45% 40% 40% 0%
SE 100% 100% 99% 98% 98% 98% 84% 70% 56% 41% 27% 0%
UK 100% 100% 99% 98% 98% 98% 84% 70% 56% 41% 27% 0%
CountryWithdraw availability when working gas volume is at xx% level

Winter Supply Outlook 2021/22
SO0032-21
October 2021
Page 43 of 49
Annex B - Data for Winter Supply Outlook 2021/22
Indigenous Production
Table 5. – Supply assumptions indigenous production
Supply assumptions (maximum per period)
* LNG sensitivity for Cold Winter (in line with SOS report only for High Demand)
Table 6.– Supply assumptions imports.
LNG Tank flexibility The LNG tank flexibility represents the difference between the actual fill level of the LNG
tanks and the minimum operative tank level; it can be send-out as extra LNG during the 2-
Week Cold Spell and 1-Day Peak. These figures represent a weighted average of the LNG
terminals of each area. ENTSOG has used the LNG tank flexibility as made available by the
LSOs via GLE.
Table 7.-LNG tank flexibility
GWh/d OCT NOV DEC JAN FEB MAR 2-Week1 2-Week2 DC
National Production 2,333.4 2,473.1 2,508.1 2,536.6 2,601.3 2,432.5 3,619.4 3,619.4 3,619.4
DZ LY NO RU LNG LNG* AZ
1,261 208 3,953 5,530 4,174 4,174 76
1,389 247 4,135 6,084 4,745 4,745 161
Week 1 1,348 225 4,164 6,140 *** *** 162
Week2 1,348 225 4,164 6,140 4,898 4,898 162
1,388 303 4,631 6,277 5,554 6,357 186
GWh/d
Winter PeriodMax per 30 days
Max on Whole Winter
2-week Cold
SpellHigh Demand
1-day Design Case
BE 35%
ES 68%
FRn 76%
FRs 60%
GR 57%
IT 63%
IT 33%
LT 3%
NL 35%
PL 74%
PT 43%
UK 64%
LNG Tank Flexibility

Winter Supply Outlook 2021/22
SO0032-21
October 2021
Page 44 of 49
Reference Winter Demand
Table 8.– Demand forecasts in Reference Winter
Gas zones: Germany (GASPOOL and NCG are now considered in one market zone in H-Gas, DE and L-Gas, DEL), French (FRnL:
GRTgaz Nord L-gas), Belgium (BEh: H-gas zone, BEl L-gas zone) UKn (Northern Ireland), Bulgaria (BGn)
Country OCT NOV DEC JAN FEB MAR 2-Week1 2-Week2 DC
AT 262 336 376 426 361 317 427 427 521
BA 5 8 9 11 9 9 12 12 14
BEh 509 601 636 642 622 568 1,026 1,026 1,141
BEl 110 145 171 172 172 150 272 272 329
BGn 85 116 122 137 137 133 148 148 176
CH 97 146 171 185 171 139 220 220 230
CZ 269 345 436 440 478 352 592 592 727
DE 2,152 2,745 2,999 3,568 2,871 2,312 3,595 3,595 4,813
DEL 519 681 750 905 715 563 913 913 1,198
DK 51 79 97 98 92 79 140 140 215
EE 13 16 18 18 18 16 35 35 45
ES 971 1,148 1,129 1,251 1,270 1,086 1,490 1,490 1,650
FI 71 77 84 123 116 91 150 150 180
FR 1,133 1,496 1,799 2,073 1,750 1,557 3,150 3,150 3,834
FRnL 105 138 169 193 173 142 350 350 426
GR 145 196 201 260 227 194 267 267 297
HR 84 109 112 116 103 102 123 123 145
HU 280 385 530 590 480 383 620 620 650
IE 148 153 194 191 225 193 236 236 261
IT 1,751 2,416 2,935 3,253 3,121 2,381 3,801 3,801 4,893
LT 60 68 70 78 78 66 123 123 141
LU 22 31 32 38 37 31 49 49 60
LV 33 42 47 58 54 43 92 92 117
MK 8 16 16 16 16 16 17 17 19
NL 998 1,276 1,395 1,570 1,457 1,280 3,186 3,186 3,863
PL 571 700 788 847 861 740 962 962 1,069
PT 206 209 206 221 211 211 231 231 295
RO 270 355 475 585 490 380 610 610 657
RS 62 62 62 62 62 62 95 95 104
SE 21 25 30 37 33 28 56 56 77
SI 27 41 41 46 44 41 44 44 53
SK 136 177 219 235 207 171 285 285 343
UK 1,907 2,583 2,894 3,095 3,062 2,692 4,154 4,154 5,486
UKn 43 49 49 58 52 52 69 69 96
TOTAL 13,121 16,970 19,262 21,599 19,772 16,582 27,539 27,539 34,123

Winter Supply Outlook 2021/22
SO0032-21
October 2021
Page 45 of 49
Cold Winter Demand
Table 9.- Demand forecasts in SOS Cold Winter15.
Gas zones: Germany (GASPOOL and NCG are now considered in one market zone in H-Gas, DE and L-Gas, DEL), French (FRnL:
GRTgaz Nord L-gas), Belgium (BEh: H-gas zone, BEl L-gas zone) UKn (Northern Ireland), Bulgaria (BGn)
Exports to Ukraine
Table 10.-Exports to Ukraine.
15 The Cold Demand for Germany has been updated due to the decrease of Las demand and the increase of Hgas
demand.
Country OCT NOV DEC JAN FEB MAR 2-Week1 2-Week2 DC
AT 302 335 440 414 412 339 414 414 588
BA 5 7 10 13 8 6 14 14 18
BEh 681 781 982 985 974 782 1,136 1,136 1,202
BEl 162 178 217 217 217 182 227 227 239
BGn 88 120 126 141 140 137 156 156 183
CH 91 154 185 159 203 160 220 220 230
CZ 259 303 479 421 432 315 592 592 727
DE 2,042 2,575 3,099 3,531 3,136 2,645 4,045 4,045 4,813
DEL 490 635 778 896 788 654 1,178 1,178 1,198
DK 73 106 116 131 128 110 140 140 215
EE 16 22 39 37 31 36 57 57 70
ES 1,031 1,257 1,281 1,292 1,269 1,135 1,502 1,502 1,863
FI 95 114 148 152 140 125 180 180 200
FR 1,197 1,845 2,495 2,243 2,088 1,711 3,154 3,154 3,828
FRnL 143 206 265 223 187 150 323 323 394
GR 153 185 212 221 175 190 265 265 312
HR 81 104 129 130 159 90 205 205 223
HU 362 468 600 646 659 451 700 700 760
IE 144 164 190 199 198 186 242 242 298
IT 2,155 2,735 3,636 3,607 3,389 2,899 3,801 3,801 4,893
LT 76 83 95 100 106 85 128 128 151
LU 47 46 57 54 53 47 49 49 60
LV 59 79 79 92 117 102 92 92 117
MK 10 16 17 17 16 16 17 17 19
NL 921 1,460 1,902 1,896 1,857 1,485 3,165 3,165 3,832
PL 612 742 830 889 902 782 1,009 1,009 1,121
PT 206 209 206 221 211 211 245 245 277
RO 351 536 526 559 635 483 716 716 773
RS 62 62 62 62 62 62 95 95 104
SE 24 41 42 59 49 38 65 65 77
SI 34 41 43 50 47 40 61 61 68
SK 156 205 269 281 253 229 441 441 496
UAe 335 335 335 335 335 335 416 416 416
UK 2,450 3,165 3,969 4,325 4,107 3,551 4,403 4,403 5,144
UKn 61 66 68 74 72 68 74 74 96
TOTAL 14,975 19,377 23,927 24,670 23,556 19,839 29,528 29,528 35,004
Country OCT NOV DEC JAN FEB MAR 2-Week1 2-Week2 DC
UAe 335 335 335 335 335 335 416 416 416

Winter Supply Outlook 2021/22
SO0032-21
October 2021
Page 46 of 49
Annex C – Modelling approach
The simulations consider the existing European gas infrastructure as of 1st October 2021.
ENTSOG is using Plexos modelling tool since spring 2021. The gas
topology at European level and the Entsog model is modelling the
European gas infrastructure with the most relevant accuracy.
This enables the national assessment of relevant risks affecting
the security of gas supply to benefit from the Union wide
simulation of supply and infrastructure disruption scenarios and
further extend the local assessment with a higher granularity.
Illustration 1: Entsog model overview

Winter Supply Outlook 2021/22
SO0032-21
October 2021
Page 47 of 49
In all cases, the cooperative modelling is done on the basis of an optimal crisis management.
That is, in case a country faces a demand curtailment, all the other countries will cooperate in
order to share the same ratio of demand curtailment.
Underground gas storages:
Dynamic modelling is applied for the underground gas storages (UGS), taking into account the influence of UGS inventory on withdrawal deliverability by using withdrawal deliverability curves. These deliverability curves16 have been revised in cooperation with GSE.
LNG supply:
The send-outs from the terminals are modelled to represent the sum of both the off-loaded volumes of arriving cargos and gas from tanks. As for the previous Winter Outlook, the 2-Week Cold Spell is split in 2 periods to allow a differentiation of the LNG terminals behaviour between the first and the second week.
• First week, the model will determine the LNG send-outs using the level of LNG supply reached in LNG terminals for February as a result from the whole winter simulation, plus additional LNG that can be taken from the tanks.
• Second week allows importers to access a relevant number of cargos, so that the LNG supply reaching the terminals can reach the February maximum supply potential. In addition, the LNG send-outs can use the remaining LNG stored in the tanks.
LNG terminals tank flexibility
LNG stocked in the tanks fluctuates within a normal operating range of LNG in the tanks
following normal operation. Besides, there is a minimum amount of LNG that must be kept in
the tanks for a safe operation.
However, in case of high demand events such as cold spells or peak demand days, this
minimum amount can be lowered, and part of the tanks are therefore used as a buffer volume,
waiting for more LNG carriers to unload.
ENTSOG models this tank flexibility based on figures provided by the LSOs via GLE (Annex B).
16 See Annex A

Winter Supply Outlook 2021/22
SO0032-21
October 2021
Page 48 of 49
Remaining Flexibility indicator
This indicator measures the resilience at balancing zone (zone) level to cope with climatic
stress and route disruption. It aims at capturing the extra supply flexibility a country can access
through its infrastructure.
This indicator is calculated as the increase (100%) of demand an area can accommodate before
an infrastructure or supply limitation is reached somewhere in the European gas system. The
value is expressed as 100% minus the percentage of disruption of the additional demand. The
higher the value, the better the resilience is.
A zero value would indicate that the country is not able to fulfil any additional demand and
experience disrupted demand. A 100% value would indicate that it is possible to supply a
demand multiplied by a factor two.
The value of the indicator is set as the possible increase in demand of the Zone before an
infrastructure or supply limitation is reached somewhere in the European gas system.
Therefore, the approach enables the consideration of possible infrastructure or supply
constraints beyond the entry into the Zone.
The Remaining Flexibility of the Zone Z is calculated as follows (steps 2 and 3 are repeated
independently for each Zone):
1. Modelling of the European gas system under a given climatic case
2. Increase of the demand of the Zone Z by 100%
3. Modelling of the European gas system in this new case
Annex D – Results of Remaining Flexibility
The results for Remaining Flexibility are available online as an annex of this report. The data
available is specifically:
• RF in Reference Winter. No disruption.
• RF in Cold Winter. No disruption.
• RF in Cold Winter. Disruptions (Algeria, Ukraine, Belarus and BalticFinland).

Winter Supply Outlook 2021/22
SO0032-21
October 2021
ENTSOG AISBL; Av. de Cortenbergh 100, 1000-Brussels; Tel: +32 2 894 5100; Fax: +32 2 894 5101; [email protected]
www.entsog.eu, VAT No. BE0822 653 040
Abbreviations
CR Curtailment Rate
DC Design Case
LSO LNG System Operator
RF Remaining Flexibility
SO Supply Outlook
TSO Transmission System Operator
UAe Exports to Ukraine
UGS Underground Storage
WGV Working Gas Volume
WSO Winter Supply Outlook
> Supplies
AZ Azerbaijan
DZ Algeria
LY Libya
NO Norway
NP National Production
RU Russia
TR Turkey
> Countries
AT Austria
BE Belgium
BG Bulgaria
CY Cyprus
CZ Czechia
DE Germany
DK Denmark
EE Estonia
ES Spain
FI Finland
FR France
GR Greece
HR Croatia
HU Hungary
IE Ireland
IT Italy
LT Lithuania
LU Luxembourg
LV Latvia
MK North Macedonia
MT Malta
NL The Netherlands
PL Poland
PT Portugal
RO Romania
RS Serbia
SE Sweden
SI Slovenia
SK Slovakia
UK United Kingdom
UKn Northern Ireland
> Low calorific gas zones:
DEL Germany L-gas
BEl Belgium L-gas
FR French Nord L-gas

Publisher ENTSOG AISBL Avenue de Cortenbergh 100 1000 Brussels, Belgium
Co-Authors Kacper Zeromski, Paula Di Mattia and Jacques Reberol
Cover picture Courtesy of FGSZ
ENTSOG aisbl Avenue de Cortenbergh 100 | 1000 Brussels, Belgium
Tel. +32 2 894 51 00
[email protected] | www.entsog.eu